An Untargeted Metabolomic Comparison of Milk Composition from Sheep Kept Under Different Grazing Systems


Abstract
1. Introduction
2. Materials and Methods
2.1. Chemicals and Reagents
2.2. Animals and Pasture
2.3. Samples Collection
2.4. Milk Composition Analysis
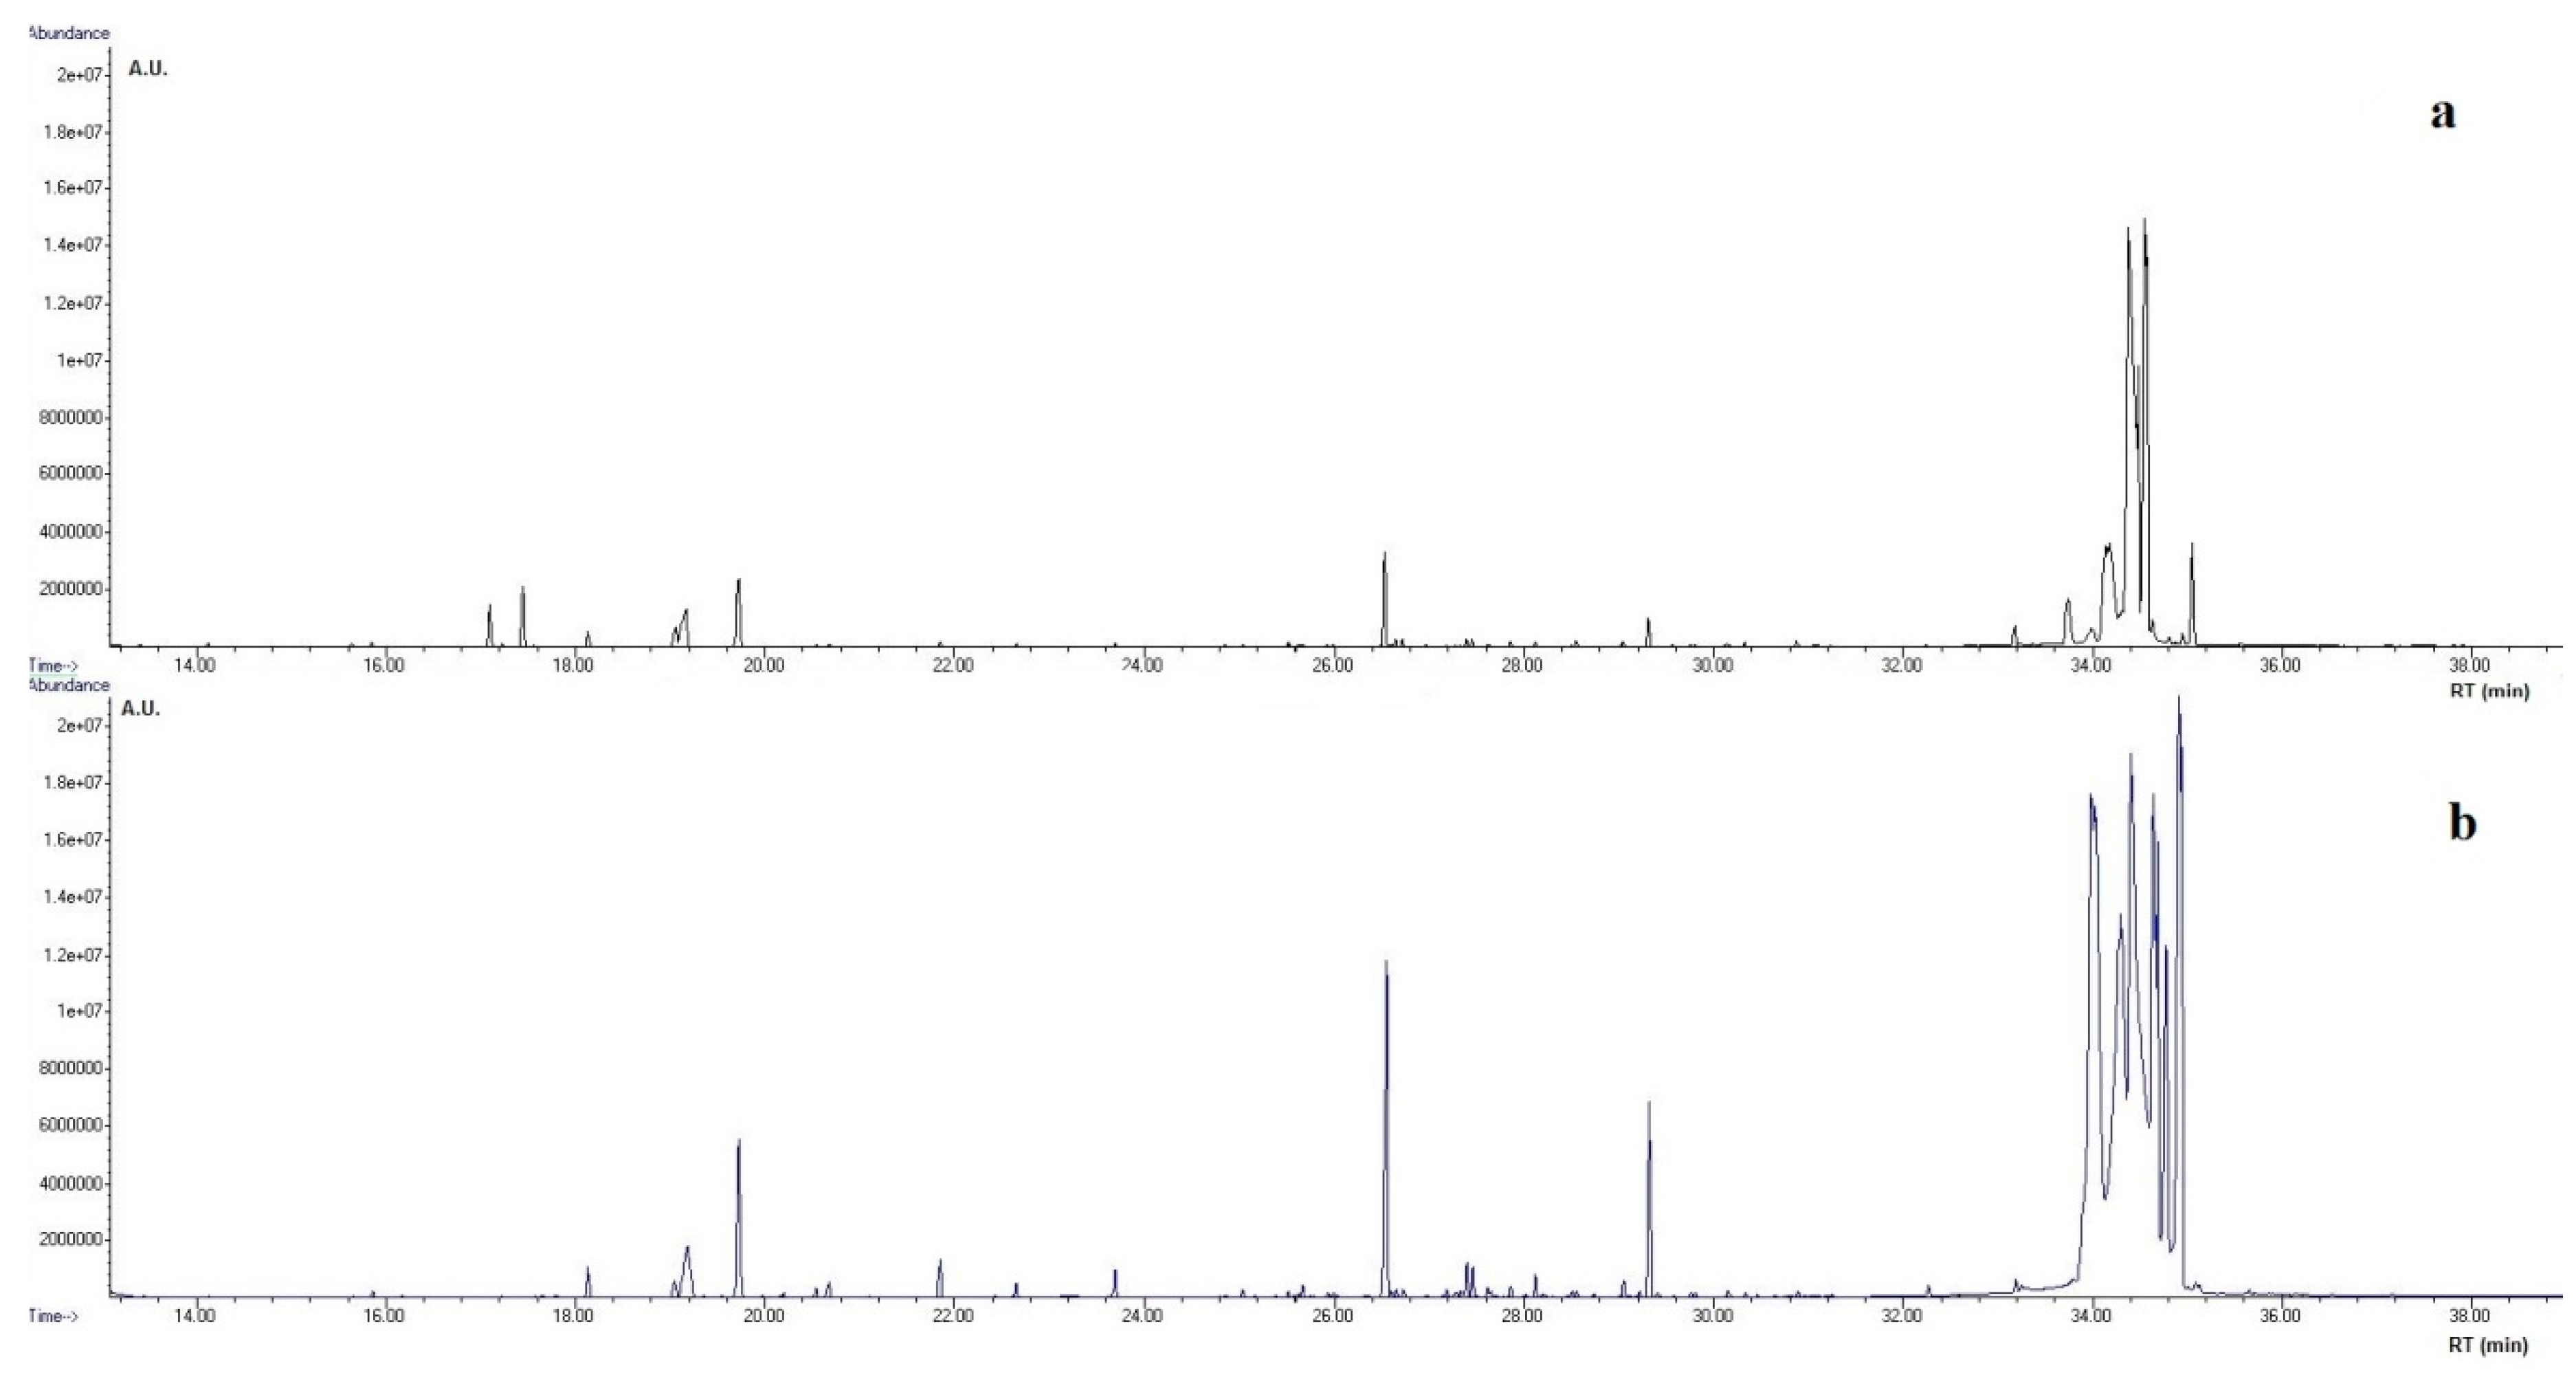
2.5. GC-MS Analysis
2.6. Statistical Data Analysis
3. Results
3.1. Main Traits
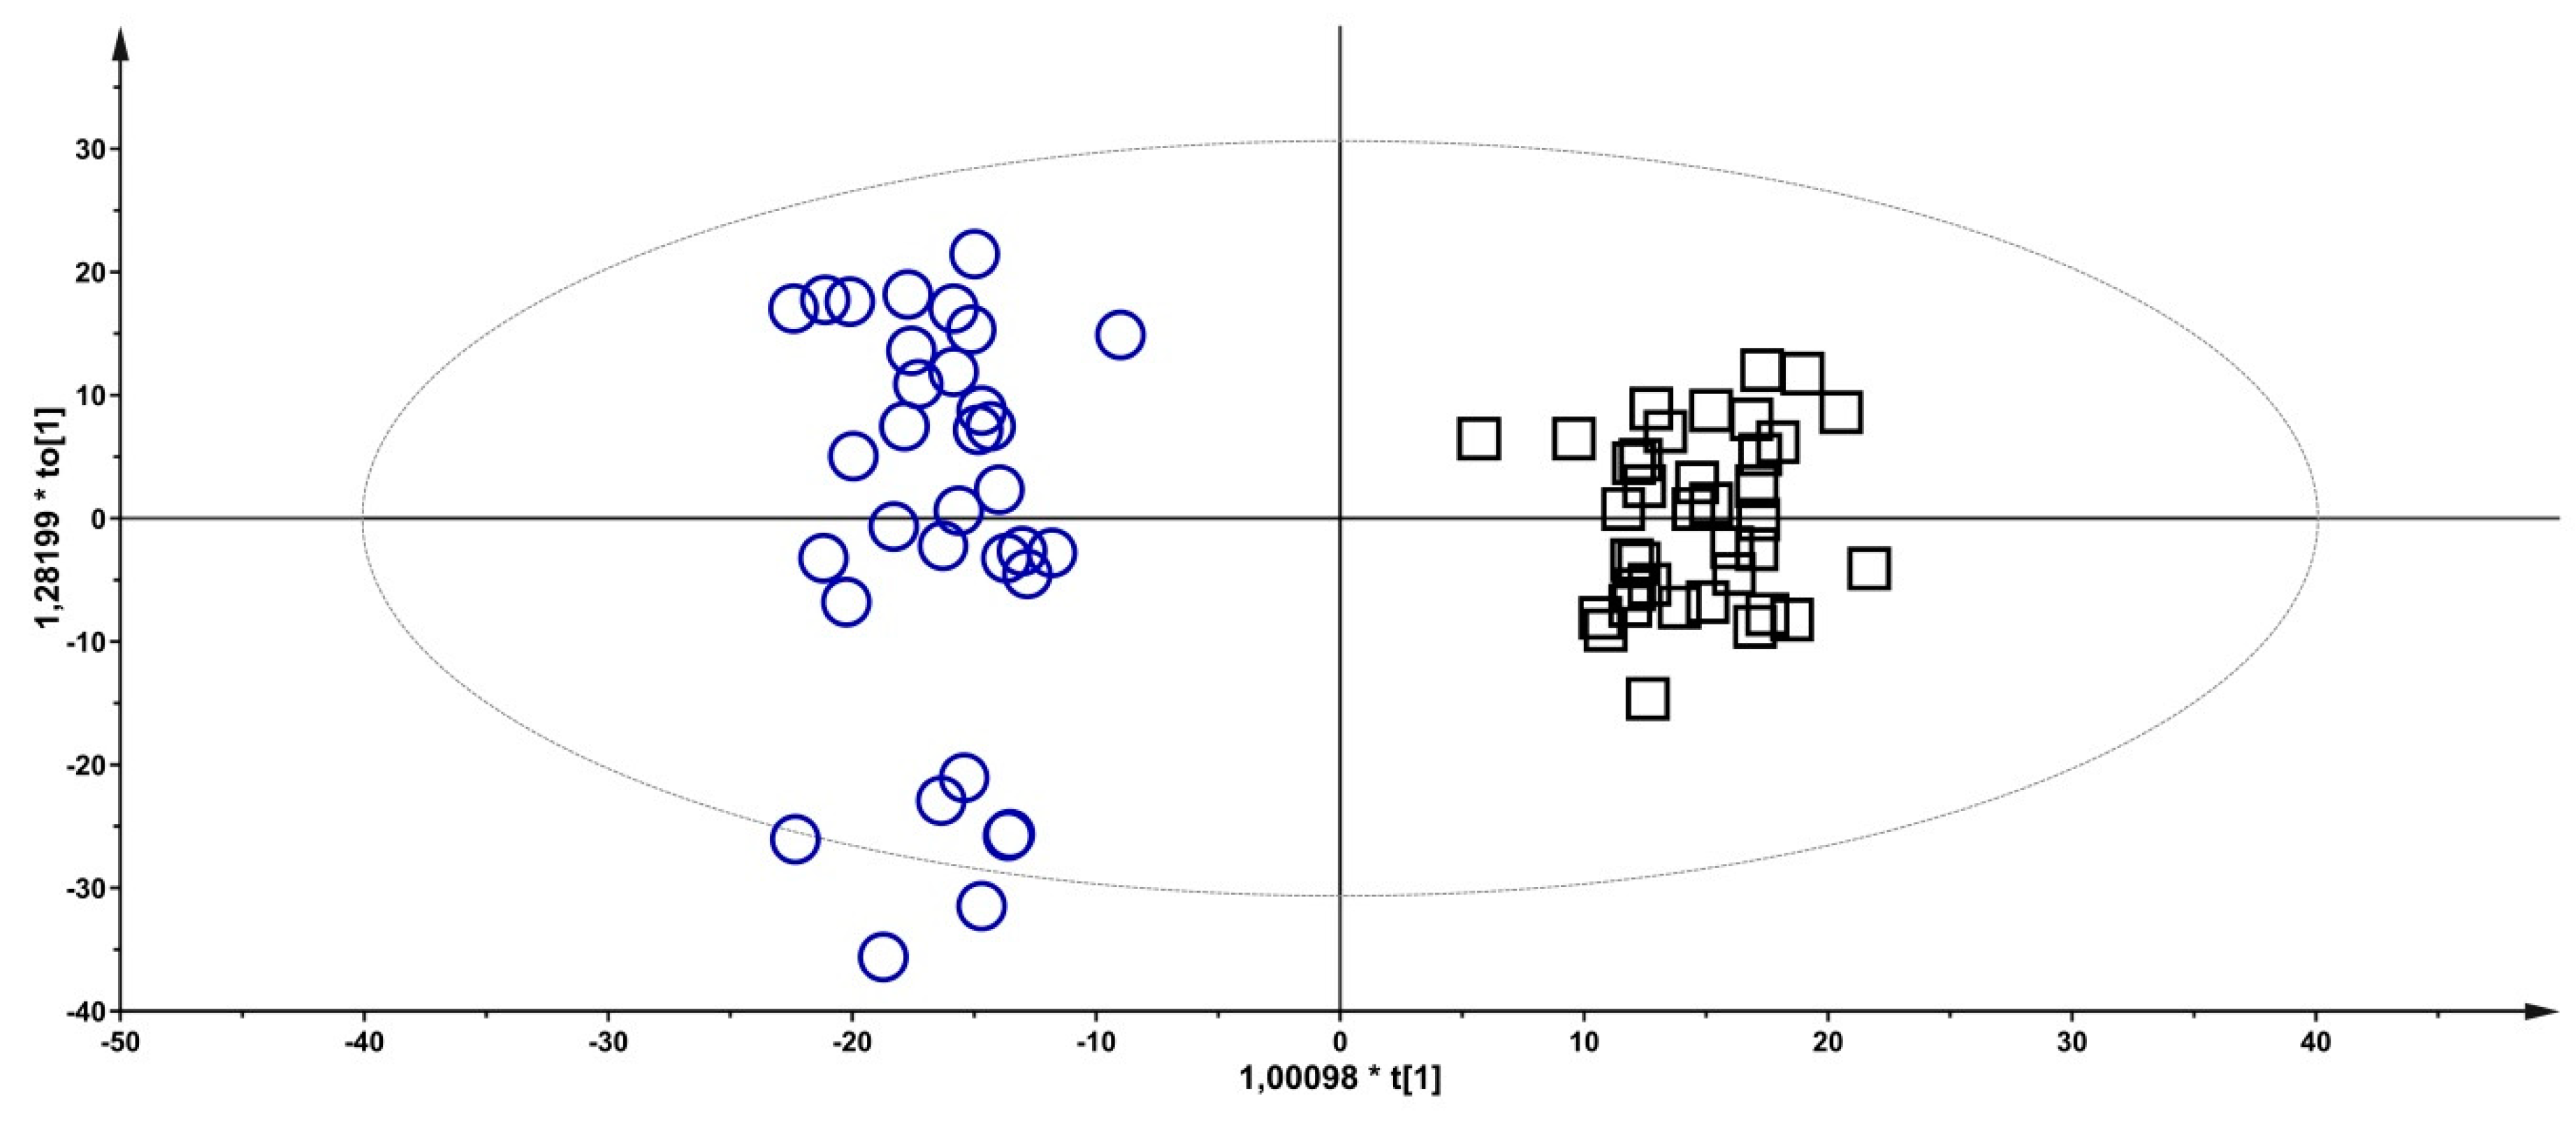
3.2. Metabolomics
4. Discussion
5. Conclusions
Supplementary Materials
Author Contributions
Funding
Acknowledgments
Conflicts of Interest
References
- Scintu, M.F.; Piredda, G. Typicity and biodiversity of goat and sheep milk products. Small Rumin. Res. 2007, 68, 221–231. [Google Scholar] [CrossRef]
- Molle, G.; Decandia, M.; Cabiddu, A.; Landau, S.Y.; Cannas, A. An update on the nutrition of dairy sheep grazing Mediterranean pastures. Small Rumin. Res. 2008, 77, 93–112. [Google Scholar] [CrossRef]
- Morand-Fehr, P.; Fedele, V.; Decandia, M.; Le Frileux, Y. Influence of farming and feeding systems on composition and quality of goat and sheep milk. Small Rumin. Res. 2007, 68, 20–34. [Google Scholar] [CrossRef]
- Cannas, A.; Pes, A.; Mancuso, R.; Vodret, B.; Nudda, A. Effect of dietary energy and protein concentration on the concentration of milk urea nitrogen in dairy ewes. J. Dairy Sci. 1998, 81, 499–508. [Google Scholar] [CrossRef]
- Cabiddu, A.; Decandia, M.; Addis, M.; Piredda, G.; Pirisi, A.; Molle, G. Managing mediterranean pastures in order to enhance the level of beneficial fatty acids in sheep milk. Small Rumin. Res. 2005, 59, 169–180. [Google Scholar] [CrossRef]
- Zervas, G.; Tsiplakou, E. The effect of feeding systems on the characteristics of products from small ruminants. Small Rumin. Res. 2011, 101, 140–149. [Google Scholar] [CrossRef]
- Caprioli, G.; Kamgang Nzekoue, F.; Fiorini, D.; Scocco, P.; Trabalza-Marinucci, M.; Acuti, G.; Tardella, F.M.; Sagratini, G.; Catorci, A. The effects of feeding supplementation on the nutritional quality of milk and cheese from sheep grazing on dry pasture. Int. J. Food Sci. Nutr. 2019, 71, 50–62. [Google Scholar] [CrossRef]
- Balthazar, C.F.; Pimentel, T.C.; Ferrão, L.L.; Almada, C.N.; Santillo, A.; Albenzio, M.; Mollakhalili, N.; Mortazavian, A.M.; Nascimento, J.S.; Silva, M.C.; et al. Sheep milk: Physicochemical characteristics and relevance for functional food development. Compr. Rev. Food Sci. Food Saf. 2017, 16, 247–262. [Google Scholar] [CrossRef]
- Scano, P.; Ibba, I.; Casula, M.; Contu, M.; Caboni, P. Effects of seasons on ovine milk composition. J. Dairy Res. Tech. 2019, 2, 004. [Google Scholar] [CrossRef]
- Park, Y.W.; Juárez, M.; Ramos, M.; Haenlein, G.F.W. Physico-chemical characteristics of goat and sheep milk. Small Rumin. Res. 2007, 68, 88–113. [Google Scholar] [CrossRef]
- Raynal-Ljutovac, K.; Lagriffoul, G.; Paccard, P.; Guillet, I.; Chilliard, Y. Composition of goat and sheep milk products: An update. Small Rumin. Res. 2008, 79, 57–72. [Google Scholar] [CrossRef]
- Caboni, P.; Manis, C.; Ibba, I.; Contu, M.; Coroneo, V.; Scano, P. Compositional profile of ovine milk with a high somatic cell count: A metabolomics approach. Int. Dairy J. 2017, 69, 33–39. [Google Scholar] [CrossRef]
- Caboni, P.; Maxia, D.; Scano, P.; Addis, M.; Dedola, A.; Pes, M.; Murgia, A.; Casula, M.; Profumo, A.; Pirisi, A. A gas chromatography-mass spectrometry untargeted metabolomics approach to discriminate Fiore Sardo cheese produced from raw or thermized ovine milk. J. Dairy Sci. 2019, 102, 5005–5018. [Google Scholar] [CrossRef] [PubMed]
- Caboni, P.; Murgia, A.; Porcu, A.; Manis, C.; Ibba, I.; Contu, M.; Scano, P. A metabolomics comparison between sheep’s and goat’s milk. Food Res. 2019, 119, 869–875. [Google Scholar] [CrossRef] [PubMed]
- Kim, S.; Kim, J.; Yun, E.J.; Kim, K.H. Food metabolomics: From farm to human. Curr. Opin. Biotech. 2016, 37, 16–23. [Google Scholar] [CrossRef]
- Goldansaz, S.A.; Guo, A.C.; Sajed, T.; Steele, M.A.; Plastow, G.S.; Wishart, D.S. Livestock metabolomics and the livestock metabolome: A systematic review. PLoS ONE 2017, 12, e0177675. [Google Scholar] [CrossRef]
- Melzer, N.; Wittenburg, D.; Hartwig, S.; Jakubowski, S.; Kesting, U.; Willmitzer, L.; Lisec, J.; Reinsch, N.; Repsilber, D. Investigating associations between milk metabolite profiles and milk traits of Holstein cows. J. Dairy Sci. 2013, 96, 1521–1534. [Google Scholar] [CrossRef]
- Melzer, N.; Wittenburg, D.; Repsilber, D. Integrating milk metabolite profile information for the prediction of traditional milk traits based on SNP information for Holstein cows. PLoS ONE 2013, 8, e70256. [Google Scholar] [CrossRef]
- Boudonck, K.J.; Mitchell, M.W.; Wulff, J.; Ryals, J.A. Characterization of the biochemical variability of bovine milk using metabolomics. Metabolomics 2009, 5, 375–386. [Google Scholar] [CrossRef]
- van Gastelen, S.; Antunes-Fernandes, E.C.; Hettinga, K.A.; Dijkstra, J. The relationship between milk metabolome and methane emission of Holstein Friesian dairy cows: Metabolic interpretation and prediction potential. J. Dairy Sci. 2018, 101, 2110–2126. [Google Scholar] [CrossRef]
- Klein, M.S.; Almstetter, M.F.; Nürnberger, N.; Sigl, G.; Gronwald, W.; Wiedemann, S.; Dettmer, K.; Oefner, P.J. Correlations between milk and plasma levels of amino and carboxylic acids in dairy cows. J. Proteome Res. 2013, 12, 5223–5232. [Google Scholar] [CrossRef] [PubMed]
- Caredda, M.; Addis, M.; Ibba, I.; Leardi, R.; Scintu, M.F.; Piredda, G.; Sanna, G. Prediction of fatty acid content in sheep milk by Mid-Infrared spectrometry with a selection of wavelengths by Genetic Algorithms. LWT Food Sci. Technol. 2016, 65, 503–510. [Google Scholar] [CrossRef]
- Folch, J.; Lees, M.; Sloane Stanley, G.H. A simple method for the isolation and purification of total lipids from animal tissues. J. Biol. Chem. 1957, 226, 497–509. [Google Scholar] [PubMed]
- Tautenhahn, R.; Patti, G.J.; Rinehart, D.; Siuzdak, G. XCMS Online: A web-based platform to process untargeted metabolomic data. Anal. Chem. 2012, 84, 5035–5039. [Google Scholar] [CrossRef]
- Cozzolino, D.; Power, A.; Chapman, J. Interpreting and reporting principal component analysis in food science analysis and beyond. Food Anal. Methods 2019, 12, 2469–2473. [Google Scholar] [CrossRef]
- Scano, P.; Murgia, A.; Pirisi, F.M.; Caboni, P. A gas chromatography-mass spectrometry-based metabolomic approach for the characterization of goat milk compared with cow milk. J. Dairy Sci. 2014, 97, 6057–6066. [Google Scholar] [CrossRef]
- Correddu, F.; Cellesi, M.; Serdino, J.; Manca, M.G.; Contu, M.; Dimauro, C.; Ibba, I.; Macciotta, N.P.P. Genetic parameters of milk fatty acid profile in sheep: Comparison between gas chromatographic measurements and Fourier-transform IR spectroscopy predictions. Animal 2019, 13, 469–476. [Google Scholar] [CrossRef]
- Lock, A.L.; Preseault, C.L.; Rico, J.E.; DeLand, K.E.; Allen, M.S. Feeding a C16:0-enriched fat supplement increased the yield of milk fat and improved conversion of feed to milk. J. Dairy Sci. 2013, 96, 6650–6659. [Google Scholar] [CrossRef]
- Pegolo, S.; Cecchinato, A.; Casellas, J.; Conte, G.; Mele, M.; Schiavon, S.; Bittante, G. Genetic and environmental relationships of detailed milk fatty acids profile determined by gas chromatography in Brown Swiss cows. J. Dairy Sci. 2016, 99, 1315–1330. [Google Scholar] [CrossRef]
- Júnior, O.S.; Pedrao, M.R.; Dias, L.F.; Paula, L.N.; Coro, F.A.G.; De Souza, N.E. Fatty acid content of bovine milkfat from raw milk to yoghurt. Am. J. Appl. Sci. 2012, 9, 1300–1306. [Google Scholar]
- Melendez, P.; Donovan, A.; Hernandez, J. Milk Urea Nitrogen and Infertility in Florida Holstein Cows1. J. Dairy Sci. 2000, 83, 459–463. [Google Scholar] [CrossRef]
- Nudda, A.; Battacone, G.; Bencini, R.; Pulina, G. Nutrition and milk quality. In Dairy Sheep Nutrition; CABI Publishing: Wallingford, UK, 2004; pp. 129–149. ISBN 0-85199-681-7. [Google Scholar]
- Pulina, G.; Nudda, A.; Battacone, G.; Cannas, A. Effects of nutrition on the contents of fat, protein, somatic cells, aromatic compounds, and undesirable substances in sheep milk. Anim. Feed Sci. Technol. 2006, 131, 255–291. [Google Scholar] [CrossRef]
- Ametaj, B.N.; Zebeli, Q.; Saleem, F.; Psychogios, N.; Lewis, M.J.; Dunn, S.M.; Xia, J.; Wishart, D.S. Metabolomics reveals unhealthy alterations in rumen metabolism with increased proportion of cereal grain in the diet of dairy cows. Metabolomics 2010, 6, 583–594. [Google Scholar] [CrossRef]
- Saleem, F.; Ametaj, B.N.; Bouatra, S.; Mandal, R.; Zebeli, Q.; Dunn, S.M.; Wishart, D.S. A metabolomics approach to uncover the effects of grain diets on rumen health in dairy cows. J. Dairy Sci. 2012, 95, 6606–6623. [Google Scholar] [CrossRef]
- O’Callaghan, T.F.; Vázquez-Fresno, R.; Serra-Cayuela, A.; Dong, E.; Mandal, R.; Hennessy, D.; McAuliffe, S.; Dillon, P.; Wishart, D.S.; Stanton, C.; et al. Pasture feeding changes the bovine rumen and milk metabolome. Metabolites 2018, 8, 27. [Google Scholar] [CrossRef]
- Schlimme, E.; Martin, D.; Meisel, H. Nucleosides and nucleotides: Natural bioactive substances in milk and colostrum. Br. J Nutr. 2000, 84 (Suppl. 1), 59–68. [Google Scholar] [CrossRef]
- Woollard, D.C.; Macfadzean, C.; Indyk, H.E.; McMahon, A.; Christiansen, S. Determination of myo-inositol in infant formulae and milk powders using capillary gas chromatography with flame ionisation detection. Int. Dairy J. 1996, 37, 74–81. [Google Scholar] [CrossRef]
- Ramachandran, S.; Fontanille, P.; Pandey, A.; Larroche, C. Gluconic acid: Properties, applications and microbial production. Food Technol. Biotech. 2006, 44, 185–195. [Google Scholar]
- Wiese, B.I.; Górka, P.; Mutsvangwa, T.; Okine, E.; Penner, G.B. Interrelationship between butyrate and glucose supply on butyrate and glucose oxidation by ruminal epithelial preparations. J. Dairy Sci. 2013, 96, 5914–5918. [Google Scholar] [CrossRef]
- Besle, J.M.; Viala, D.; Martin, B.; Pradel, P.; Meunier, B.; Berdagué, J.L.; Fraisse, D.; Lamaison, J.L.; Coulon, J.B. Ultraviolet-absorbing compounds in milk are related to forage polyphenols. J. Dairy Sci. 2010, 93, 2846–2856. [Google Scholar] [CrossRef]
- Carpio, A.; Bonilla-Valverde, D.; Arce, C.; Rodríguez-Estévez, V.; Sánchez-Rodríguez, M.; Arce, L.; Valcárcel, M. Evaluation of hippuric acid content in goat milk as a marker of feeding regimen. J. Dairy Sci. 2013, 96, 5426–5434. [Google Scholar] [CrossRef] [PubMed]
- Shennan, D.B.; Peaker, M. Transport of milk constituents by the mammary gland. Physiol. Rev. 2000, 80, 925–951. [Google Scholar] [CrossRef] [PubMed]
- Toffanin, V.; Penasa, M.; McParland, S.; Berry, D.P.; Cassandro, M.; De Marchi, M. Genetic parameters for milk mineral content and acidity predicted by mid-infrared spectroscopy in Holstein-Friesan cows. Animal 2015, 9, 775–780. [Google Scholar] [CrossRef] [PubMed]
- Klop, G.; Ellis, J.L.; Blok, M.C.; Brandsma, G.G.; Bannink, A.; Dijkstra, J. Variation in phosphorus content of milk from dairy cattle as affected by differences in milk composition. J. Agric. Sci. 2014, 152, 860–869. [Google Scholar] [CrossRef]
- Eeckhout, W.; De Paepe, M. Total phosphorus, phytate-phosphorus and phytase activity in plant feedstuffs. Anim. Feed Sci. Tech. 1994, 47, 19–29. [Google Scholar] [CrossRef]
- Yanke, L.J.; Bae, H.D.; Selinger, L.B.; Cheng, K.J. Phytase activity of anaerobic ruminal bacteria. Microbiology 1998, 144, 1565–1573. [Google Scholar] [CrossRef]
- Park, W.Y.; Matsui, T.; Yano, H. Post-ruminal phytate degradation in sheep. Anim. Feed Sci. Tech. 2002, 101, 55–60. [Google Scholar] [CrossRef]
- Kincaid, R.L.; Garikipati, D.K.; Nennich, T.D.; Harrison, J.H. Effect of grain source and exogenous phytase on phosphorus digestibility in dairy cows. J. Dairy Sci. 2005, 88, 2893–2902. [Google Scholar] [CrossRef]


| Schedule | Grazing system 1 (GS1) | Grazing system 2 (GS2) |
|---|---|---|
| Day-grazing | Natural pasture 1 10–12 h/d | Natural pasture 1 4–6 h/d Selected pasture 2 1–2 h/d |
| Milking | Barley and corn grains (50/50) 500 g/head/d DMI 3 = 437.5 g/head/d | Barley and corn grains (50/50) 200 g/head/d DMI = 175 g/head/d |
| Night | Forage ad libitum |
| GS1 (n = 37) | GS2 (n = 33) | ||||
|---|---|---|---|---|---|
| Component | mean | SD a | mean | SD | Pb |
| Fat (g/100 mL) | 5.9 | 1.0 | 4.8 | 1.2 | *** |
| Proteins (g/100 mL) | 5.6 | 0.6 | 5.8 | 0.4 | |
| Caseins (g/100 mL) | 4.3 | 0.5 | 4.4 | 0.4 | |
| Lactose (g/100 mL) | 4.8 | 0.4 | 4.9 | 0.3 | |
| SCC c (103 cell/ mL) | 1421 | 1337 | |||
| SCC (GM) d | 119 | 175 | |||
| Urea (mg/100 mL) | 24 | 5 | 41 | 8 | *** |
| Freezing point (milliHorvet) | −581 | 8 | −582 | 7 | |
| pH | 6.9 | 0.1 | 6.8 | 0.1 | |
| Chlorides (mg/100 mL) | 141 | 46 | 129 | 32 | |
| Total solids (g/100 mL) | 16.4 | 1.5 | 15.5 | 1.2 | ** |
| SNF e (g/100 mL) | 10.8 | 0.5 | 11.0 | 0.5 | |
| Fatty acids (FA) (g/100 mL) | |||||
| Saturated FA | 3.5 | 0.6 | 2.9 | 0.7 | *** |
| Unsaturated FA | 1.8 | 0.3 | 1.4 | 0.4 | *** |
| Monounsaturated FA | 1.4 | 0.3 | 1.1 | 0.3 | *** |
| Polyunsaturated FA | 0.44 | 0.07 | 0.36 | 0.09 | *** |
| n-6 FA | 0.12 | 0.04 | 0.09 | 0.04 | *** |
| n-3 FA | 0.12 | 0.03 | 0.13 | 0.02 | |
| C4:0 | 0.22 | 0.04 | 0.18 | 0.05 | *** |
| C6:0 | 0.15 | 0.03 | 0.15 | 0.03 | |
| C8:0 | 0.12 | 0.03 | 0.12 | 0.03 | |
| C10:0 | 0.32 | 0.09 | 0.35 | 0.10 | |
| C12:0 | 0.16 | 0.05 | 0.17 | 0.04 | |
| C14:0 | 0.5 | 0.1 | 0.4 | 0.1 | *** |
| C16:0 | 1.3 | 0.3 | 1.0 | 0.3 | *** |
| C18:0 | 0.6 | 0.2 | 0.4 | 0.2 | *** |
| C18:1 | 0.8 | 0.3 | 0.5 | 0.2 | *** |
| C18:2 | 0.13 | 0.04 | 0.11 | 0.03 | *** |
| C18:1 trans-11 (g/100g of fat) | 3.0 | 0.7 | 3.7 | 0.5 | *** |
| C18:3 n-3 (g/100g of fat) | 1.7 | 0.3 | 1.7 | 0.2 | |
| C18:2 cis-9, trans-11 (g/100g of fat) | 1.6 | 0.3 | 2.0 | 0.2 | *** |
| GS1 | GS2 | ||
|---|---|---|---|
| Metabolite | VIP b | Metabolite | VIP |
| Maltose | 1.86 | Unk#1 c | 1.50 |
| Myo-inositol | 1.83 | Unk#2 | 1.49 |
| Malic acid | 1.48 | Phosphate | 1.28 |
| Hippuric acid | 1.38 | ||
| Scyllo-inositol | 1.27 | ||
| Succinic acid | 1.25 | ||
| Uridine | 1.24 | ||
| Glutaric acid | 1.18 | ||
| Inosine | 1.10 | ||
| Gluconic acid | 1.09 | ||
| Component | R2Y | Q2Y | R2 − Q2 |
|---|---|---|---|
| C18:2 cis-9, trans-11 | 0.95 | 0.64 | 0.31 |
| C18:1 | 0.93 | 0.64 | 0.29 |
| C18:1 trans-11 | 0.92 | 0.56 | 0.36 |
| Monounsaturated FA | 0.91 | 0.59 | 0.32 |
| n-6 FA a | 0.85 | 0.54 | 0.31 |
| Polyunsaturated FA | 0.85 | 0.54 | 0.31 |
| C18:0 | 0.84 | 0.54 | 0.30 |
| Unsaturated FA | 0.84 | 0.56 | 0.28 |
| SCC (log) | 0.84 | 0.66 | 0.18 |
| Lactose | 0.83 | 0.61 | 0.22 |
| Chlorides | 0.81 | 0.59 | 0.22 |
| pH | 0.77 | 0.55 | 0.22 |
| Urea | 0.59 | 0.54 | 0.05 |
| C18:2 | 0.35 | 0.24 | 0.11 |
| C4:0 | 0.35 | 0.25 | 0.10 |
| Fat | 0.34 | 0.25 | 0.09 |
| C16:0 | 0.33 | 0.25 | 0.08 |
| Saturated FA | 0.32 | 0.20 | 0.12 |
| C18:3 n-3 | 0.30 | 0.14 | 0.16 |
| C14:0 | 0.27 | 0.16 | 0.11 |
| Total solids | 0.23 | 0.12 | 0.11 |
| Freezing point | n b | ||
| SNF c | n | ||
| n-3 FA | n | ||
| C10:0 | n | ||
| C12:0 | n | ||
| Proteins | n | ||
| Caseins | n | ||
| C8:0 | n | ||
| C6:0 | n |
© 2020 by the authors. Licensee MDPI, Basel, Switzerland. This article is an open access article distributed under the terms and conditions of the Creative Commons Attribution (CC BY) license (http://creativecommons.org/licenses/by/4.0/).
Share and Cite
Scano, P.; Carta, P.; Ibba, I.; Manis, C.; Caboni, P. An Untargeted Metabolomic Comparison of Milk Composition from Sheep Kept Under Different Grazing Systems. Dairy 2020, 1, 30-41. https://doi.org/10.3390/dairy1010004
Scano P, Carta P, Ibba I, Manis C, Caboni P. An Untargeted Metabolomic Comparison of Milk Composition from Sheep Kept Under Different Grazing Systems. Dairy. 2020; 1(1):30-41. https://doi.org/10.3390/dairy1010004
Chicago/Turabian StyleScano, Paola, Patrizia Carta, Ignazio Ibba, Cristina Manis, and Pierluigi Caboni. 2020. "An Untargeted Metabolomic Comparison of Milk Composition from Sheep Kept Under Different Grazing Systems" Dairy 1, no. 1: 30-41. https://doi.org/10.3390/dairy1010004
APA StyleScano, P., Carta, P., Ibba, I., Manis, C., & Caboni, P. (2020). An Untargeted Metabolomic Comparison of Milk Composition from Sheep Kept Under Different Grazing Systems. Dairy, 1(1), 30-41. https://doi.org/10.3390/dairy1010004