This section is divided into two parts: the first part focuses on the electrochemical characterization of the single-compound analysis (p-benzoquinone, ascorbic acid, gallic acid, oxalic acid, phenol and salicylic acid) using cyclic voltammetry to determine its oxidation behavior, peak characteristics, and concentration-dependent charge response. The second part addresses the electrochemical response in multi-compounds analysis mode. To simulate more complex matrices and assess potential peak overlaps or interferences, mixtures containing three to six compounds were analyzed under the same experimental conditions.
3.1. Single Compound Analysis
In this section, each compound in the list of the selected six species for this study (ascorbic acid, salicylic acid, p-benzoquinone, phenol, gallic acid, and oxalic acid) was separately studied by cyclic voltammetry. This allows us to characterize their redox behavior by measuring the current response induced by the application of linear varying potentials. For each measurement cycle, systematic identification of the peak characteristics was performed using advanced peak current methods. These peaks provide essential information on the redox behavior (oxidation and/or reduction peak position, peak current, peak area, start and end base, etc.). This approach aims to compare the capability of the electrochemical method to quantify oxidizable organic matter against a standard chemical reference method.
First,
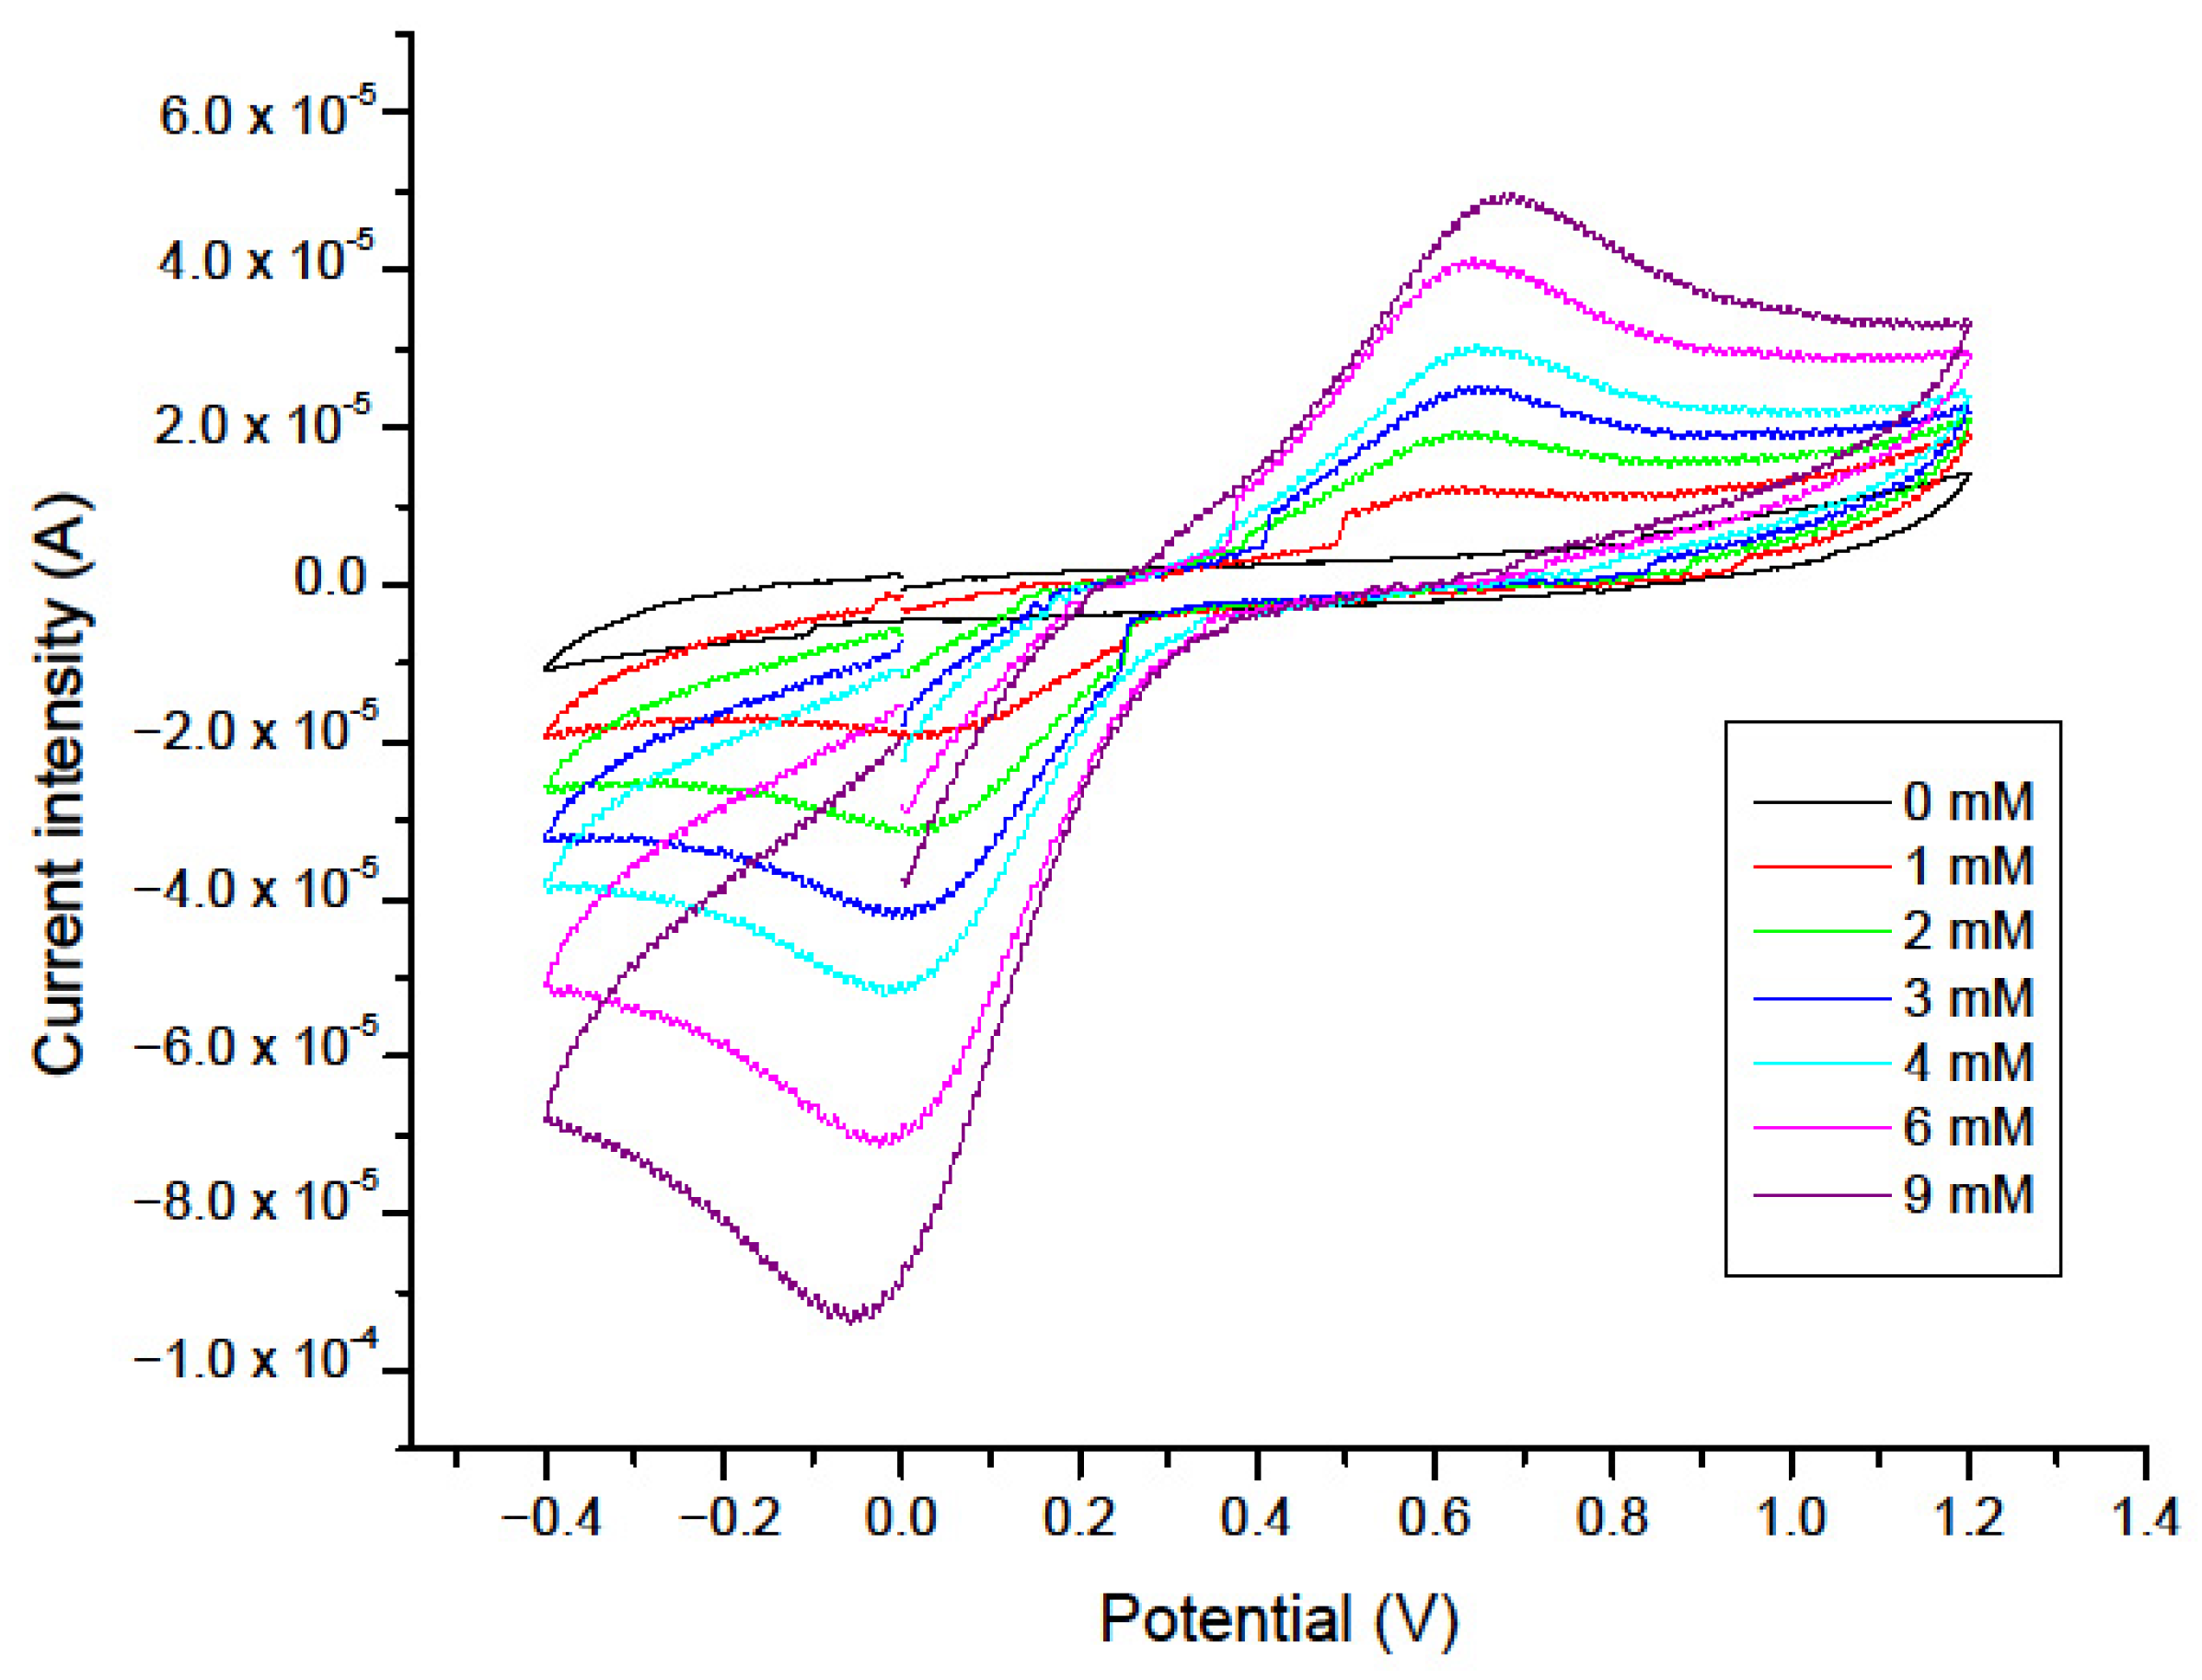
p-benzoquinone was studied by cyclic voltammetry at a scan rate of 0.1 V.s
−1 over a potential range of − 0.4 V to + 1.2 V vs. Ag/AgCl. This compound was selected for electrochemical analysis because of its significant electrochemical behavior (well-defined redox-behavior) [
24] and its relevance as a contaminant of environmental concern [
25,
26]. The obtained cyclic voltammograms are presented in
Figure 1. The electrochemical behavior of benzoquinone was systematically investigated using cyclic voltammetry over a concentration range of 1 mM to 9 mM in order to evaluate the reversibility of its redox process. The recorded voltammograms exhibit a well-defined anodic peak for the oxidation process, with a peak current intensity (I
p, ox) that increases linearly with
p-BQ concentration, from 5.52 × 10
−6 A at 1 mM to 3.27 × 10
−5 A at 9 mM (
Figure S2). Importantly, the anodic peak position (E
p, ox) also shows a clear increase with increasing concentration, ranging from 0,58 V to 0.66 V, accompanied by a small positive shift (approx. + 80 mV).
For the cathodic scan, the reduction peak current intensity (I
p, red) similarly increases in magnitude, from −9.71 × 10
−6 A to −5.50 × 10
−5 A, with the peak position (E
p, red) slightly shifting towards more negative values (approx. −90 mV), from 0.065V to −0.025V, as the concentration increases. This consistent trend indicates that the peak potential for reduction is also concentration-dependent, exhibiting a small shift typical for a quasi-reversible system [
27].
The relatively moderate separation between the anodic and cathodic peak potentials, combined with the linear dependency of peak currents on the concentration, confirms that the benzoquinone redox couple exhibits a quasi-reversible behavior under the experimental conditions employed, such a response is characteristic of semi-fast electron transfer process, where electron exchange at the transfer process, where electrode-solution interface occurs with minimal but measurable kinetic limitations. In other words, the transition between
p-BQ and hydroquinone (HQ) is chemically stable. Once
p-BQ is reduced at the electrode surface, the resulting product (HQ) remains available long enough to be re-oxidized when the potential sweeps back, showing the observed reversible behavior. These results are in accordance with prior studies, where it is well-described that the redox process of benzoquinone is independent of the scan rate by studying (I
p/υ
1/2), which confirms the quasi-reversibility behavior of benzoquinone [
27,
28].
On the other hand, this section aims to evaluate the electrochemical behavior of
p-benzoquinone by correlating the electrochemical charge measured by cyclic voltammetry and the theoretical permanganate index (expressed in mg O
2/L). For instance, PI
theo values were calculated based on the added
p-BQ concentration as described in the experimental section.
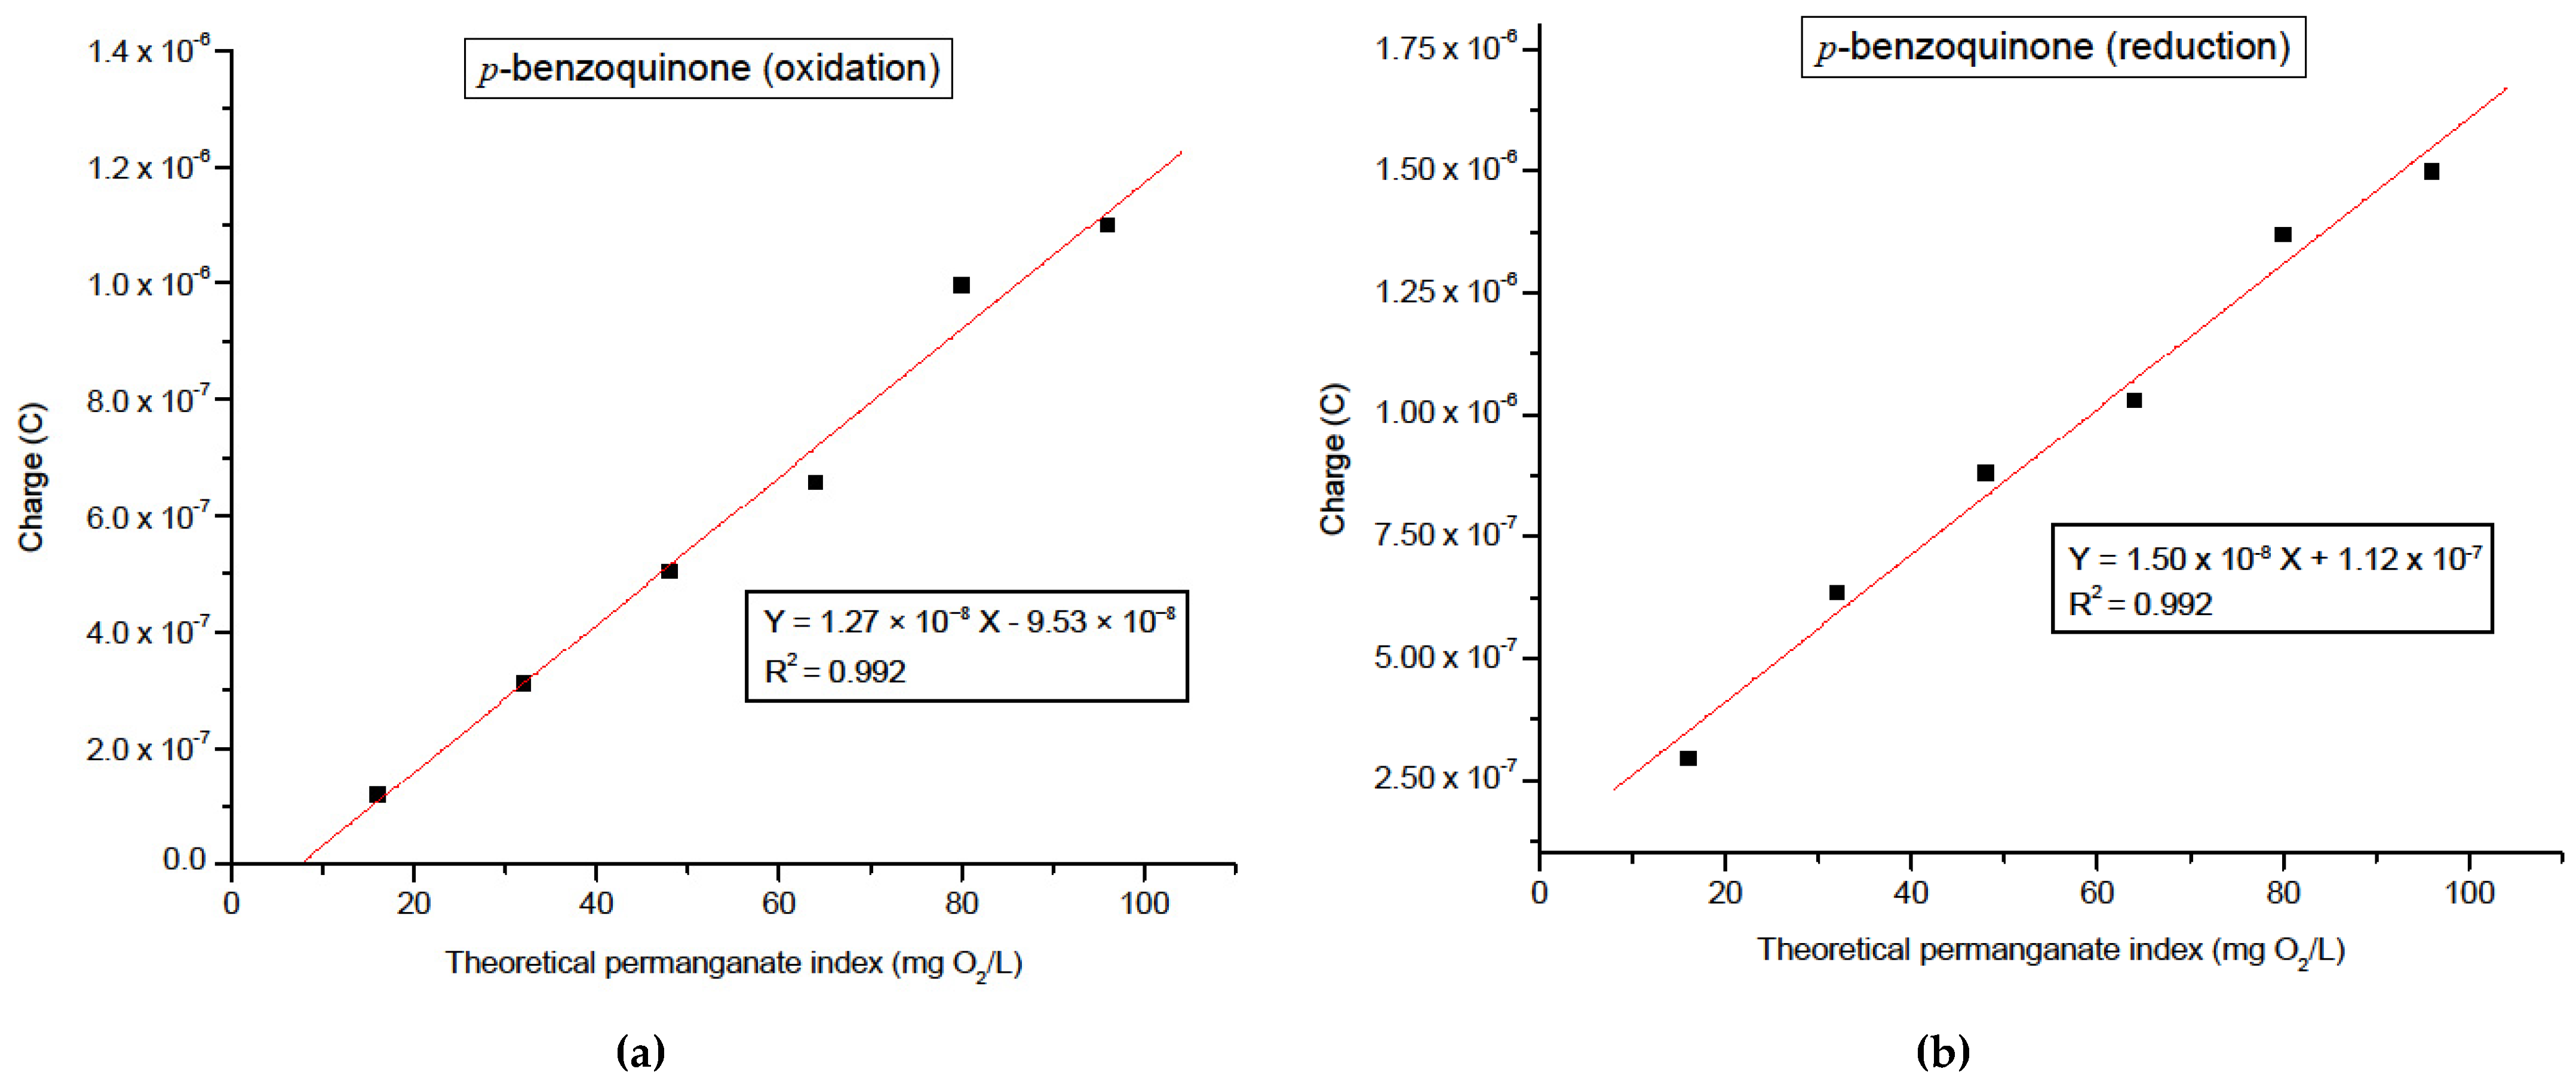
Figure 2a,b illustrates the graphs showing the variation in the electrochemical charge versus the theoretical permanganate index for both oxidation and reduction processes. These graphs exhibit a clear linear relation between Q and PI
theo. The high coefficient of determination (R
2 = 0.992), for both processes, demonstrates a strong correlation between the electrochemical measurements and the corresponding theoretical permanganate index. Herein, a non-zero intercept was maintained to ensure statistical integrity of the selected model. While theoretically, a zero-concentration of analyte should yield a zero charge, the experimental data for
p-BQ showed a strong linear correlation. Forcing the regression through the origin resulted in a significant decrease in correlation. This experimental offset is attributed to the background capacitive current and the double-layer charging of the carbon-based electrode in an acidic supporting electrolyte. Consequently, the use of a non-zero intercept accounts for this background signal, providing a more robust calibration for the determination of
p-BQ across the studied range. LOD and LOQ were calculated based on the standard deviation (σ) of this background signal (check calculation method in
Section 2.4 and
Table S1), ensuring that reported values represent faradic oxidation/reduction significantly above/below the capacitance noise threshold. The LOD and LOQ of
p-BQ were, respectively, found to be 0.23 mM (corresponding to 3.68 mg O
2/L) and 0.77 mM (corresponding to 12.32 mg O
2/L) using the oxidation peaks.
This result demonstrates that the proposed electrochemical approach can effectively monitor the concentration of oxidizable compounds in aqueous samples containing p-BQ or similar electrochemically reversible species, validating the approach for both oxidation and reduction processes.
In this section, ascorbic acid was also examined separately to assess its electrochemical behavior and to correlate its electrochemical measurements to the classical chemical method responses [
26]. Ascorbic acid is a well-characterized reducing agent, commonly present in aqueous environmental and biological systems [
29]. Its inclusion in this study serves to further validate the applicability and performance of the voltammetric method.
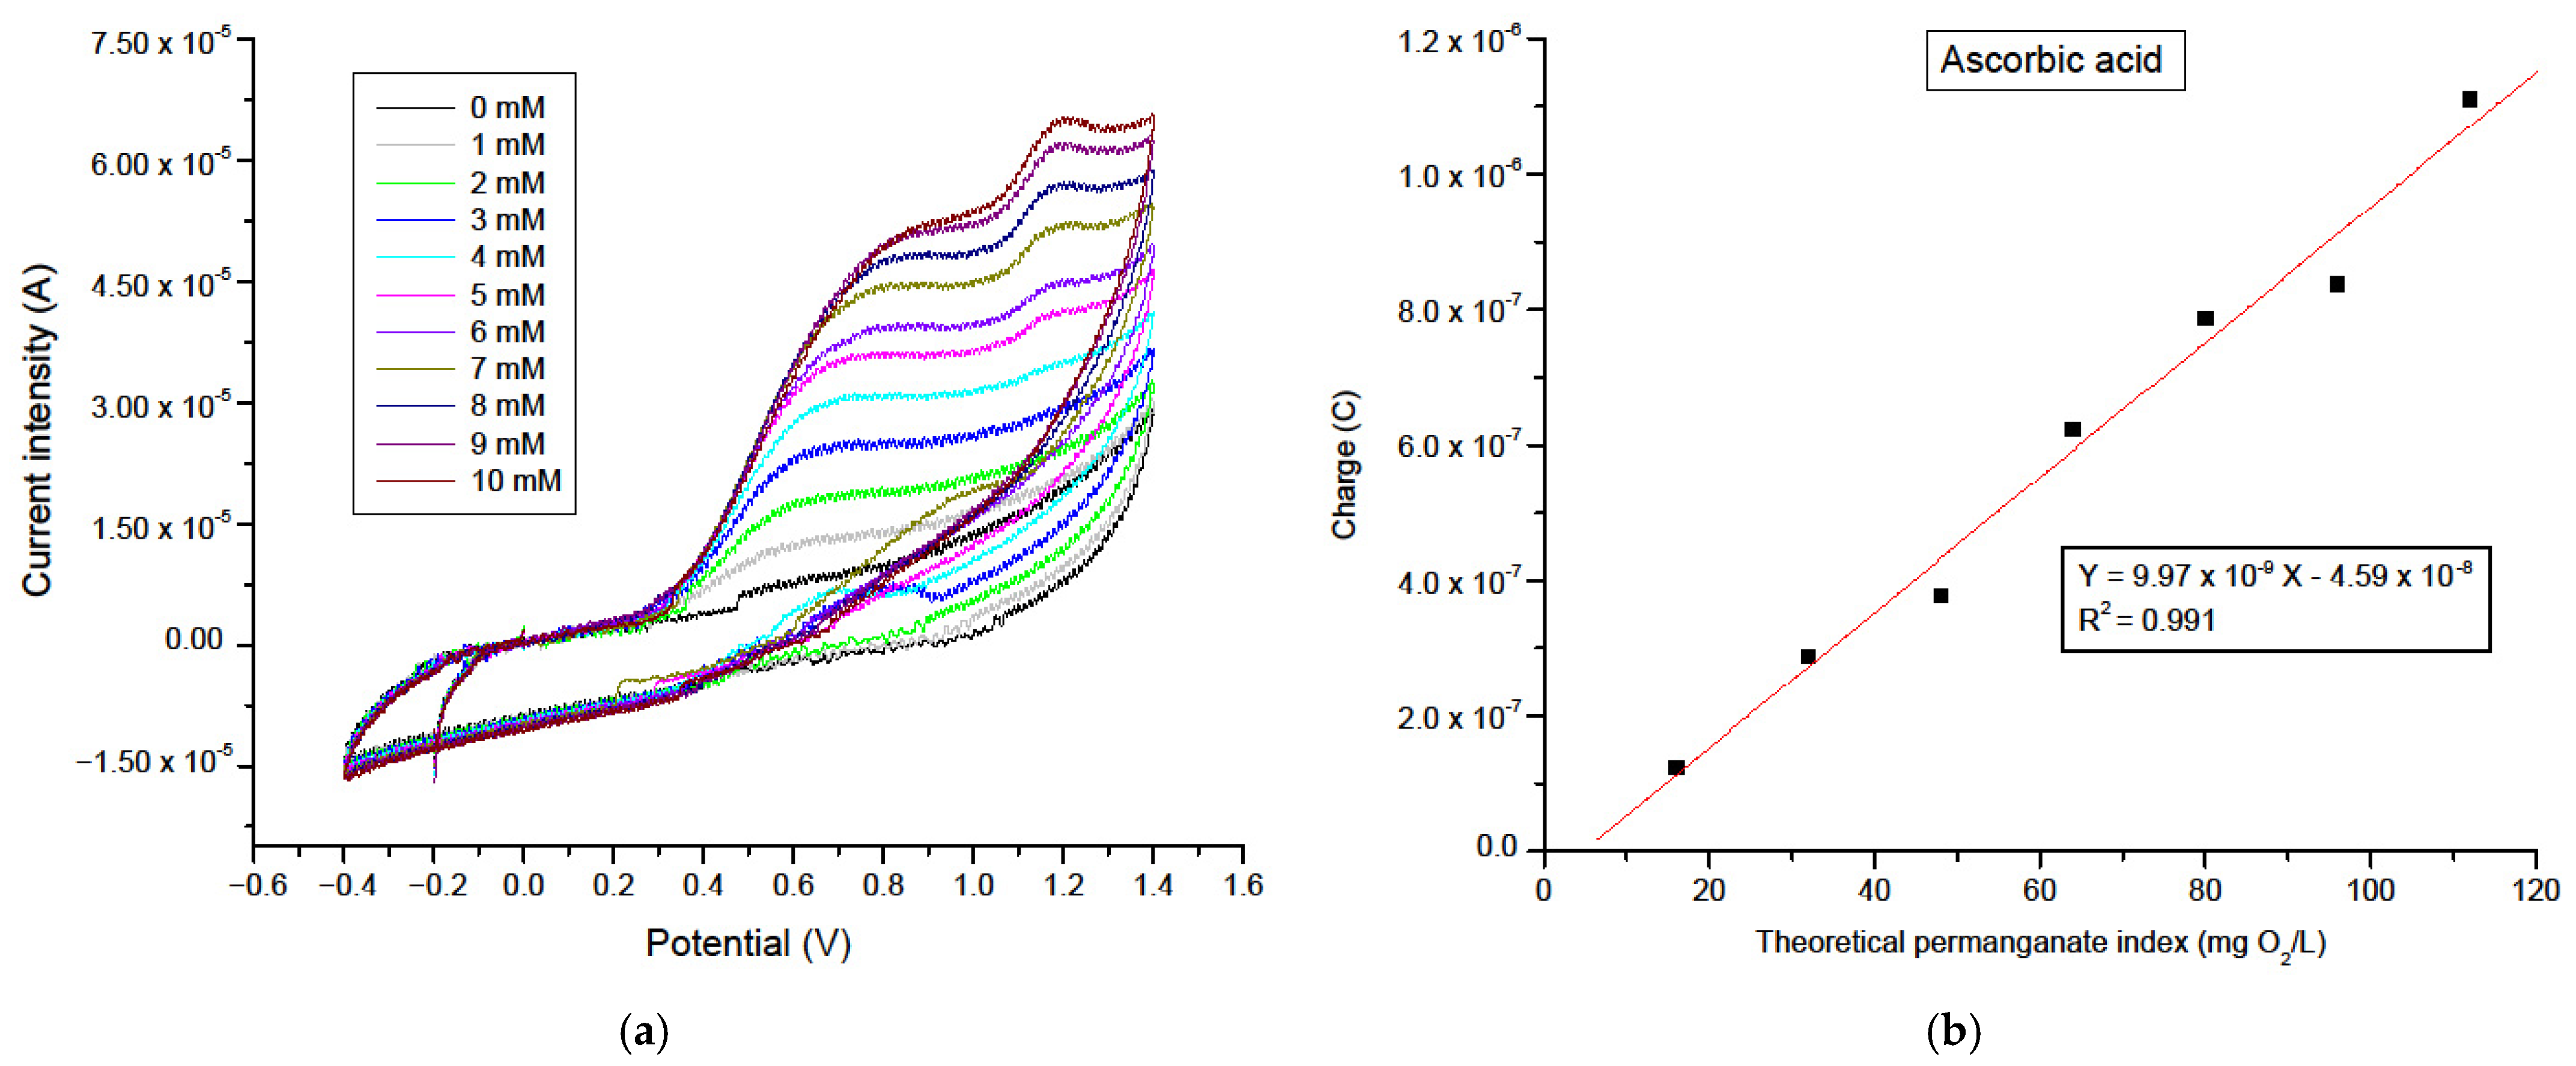
Cyclic voltametric measurements were performed within a potential window ranging from −0.4 V to +1.4 V vs. Ag/AgCl, at a scan rate of 0.1 V.s
−1. A series of concentrations from 1 mM to 10 mM was analyzed. The obtained voltammograms exhibit a progressive increase in anodic peak current intensity (I
pa) with increasing concentration (
Figure S3), along with a shift in the oxidation peak potential (E
pa) from +0.55 V to +0.78 V. This shift toward more positive potentials at higher concentrations is indicative of kinetic changes at the electrode interface, potentially associated with increased surface interactions or diffusional limitations (
Figure 3a). The electrochemical behavior of ascorbic acid clearly indicates an irreversible oxidation mechanism with moderately fast electron transfer, as evidenced by the absence of a cathodic peak and the unidirectional nature of the redox process. Conversely to
p-BQ, the original molecules are consumed after the electron transfer with no remaining products to react during the reverse scan. These findings about the irreversibility profile of ascorbic acid are consistent with already published studies, where the effect of scan rates on the oxidation peak confirms that the electroanalysis of ascorbic acid is under diffusion control [
30,
31].
Furthermore, a clear linear correlation was established between the measured anodic charge (in coulombs) and the theoretical permanganate index (mg O
2/L), as illustrated in
Figure 3b. This strong correlation (R
2 = 0.991) confirms that the electrochemical response of ascorbic acid accurately reflects its contribution to the overall oxidizable organic load. Ascorbic acid has shown the lowest sensitivity of 2.6 µA/µM (determined from the slope of the line in
Figure S3). The LOD and LOQ of ascorbic acid were, respectively, found to be 0.43 mM (corresponding to 6.88 mg O
2/L) and 1.43 mM (corresponding to 22.88 mg O
2/L). These findings demonstrate that the applied voltammetric method is valid and reliable for the quantitative estimation of oxidizable organic matter contributed by reducing agents such as ascorbic acid, and that it represents a promising alternative to conventional chemical methods such as the permanganate index.
To continue the investigation of single compounds analysis, gallic acid was selected due to its well-established antioxidant capacity and its tri-hydroxylated phenolic structure, which renders it highly susceptible to oxidation [
32]. Gallic acid is widely recognized as a model compound in antioxidant research and is frequently employed as a standard in electrochemical studies of polyphenolic systems, owing to its simple, well-characterized redox behavior.
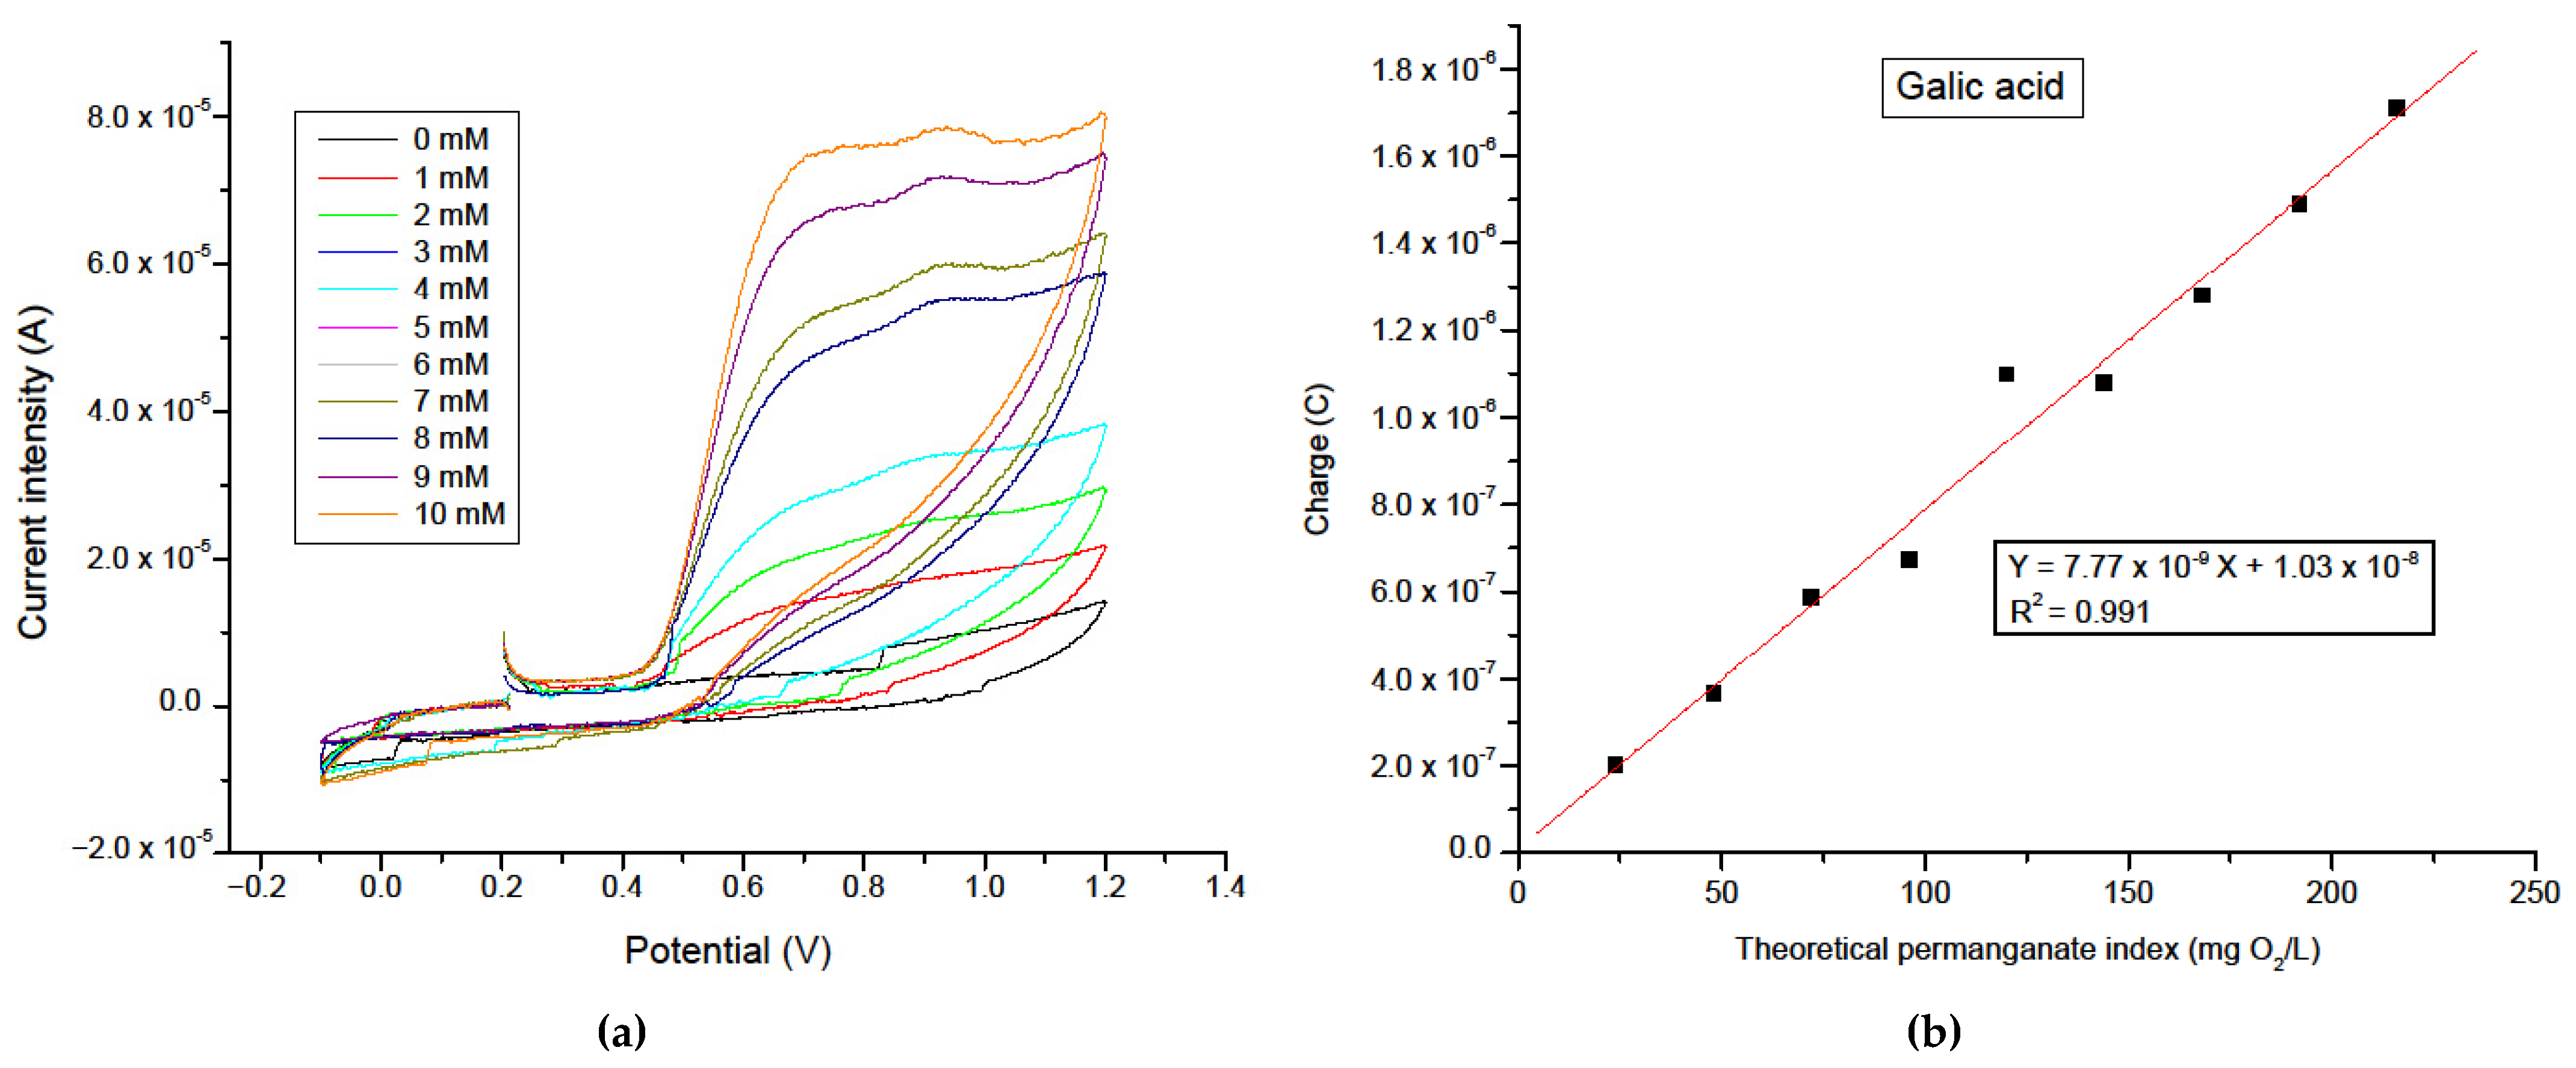
Cyclic voltammetry experiments were performed using the same graphite working electrode (after polishing). The electrochemical scans were carried out within a potential window ranging from −0.1 V to +1.2 V vs. Ag/AgCl at a scan rate of 0.1 V.s
−1. Gallic acid solutions were tested at concentrations from 1 mM to 10 mM. The resulting voltammograms exhibit a single, well-defined anodic peak, whose position displays a slight positive shift with increasing concentration (
Figure 4a). At 1 mM, the anodic peak was located at approximately +0.66 V, while at 10 mM, it shifts marginally to +0.67 V. Nevertheless, this shift is extremely small (approx. 10 mV) and can mostly attributed to well-known electrochemical artifacts (minor fluctuations in potential of the reference electrode Ag/AgCl, iR-drop, or capacitive charge of electrical double layer) rather than to a genuine concentration-dependent modification of the oxidation potential. The absence of a cathodic peak and the small anodic shift indicate that the redox process is irreversible. This irreversible behavior is similarly comparable to that of ascorbic acid, with no remaining products to react during the reverse scan. This observation aligns with the established literature, where reported results imply that the anodic reaction is diffusion-controlled under mild conditions [
33,
34]. A clear increase in peak current intensity was observed with the increasing concentration (
Figure S4), suggesting a linear and diffusion-controlled redox process. The proportional correlation between signal intensity and analyte concentration confirms the quantitative nature of the system under the applied condition.
To further assess the validity of the proposed methodology, the anodic charge (determined by peak integration multiplied by the scan rate) was compared to the theoretical permanganate index, which estimates the compound’s oxidative capacity based on stoichiometric considerations. A strong linear correlation was also obtained between the experimental charge values and the theoretical permanganate index, with a coefficient of correlation R
2 = 0.991 (
Figure 4b). This correlation underscores the reliability of cyclic voltammetry as a quantitative approach for evaluating the redox activity of organic compounds, alternatively for chemical reference oxidation. The LOD and LOQ of gallic acid were, respectively, found to be 0.23 mM (corresponding to 5.52 mg O
2/L) and 0.78 mM (corresponding to 18.72 mg O
2/L).
Moreover, oxalic acid was selected as a model compound for its well-documented electrochemical behavior and its relevance as a reducing agent in both biological and environmental redox systems [
35]. Its simple structure, water solubility, and established reactivity toward strong oxidants render it particularly suitable for method validation and comparative electrochemical studies.
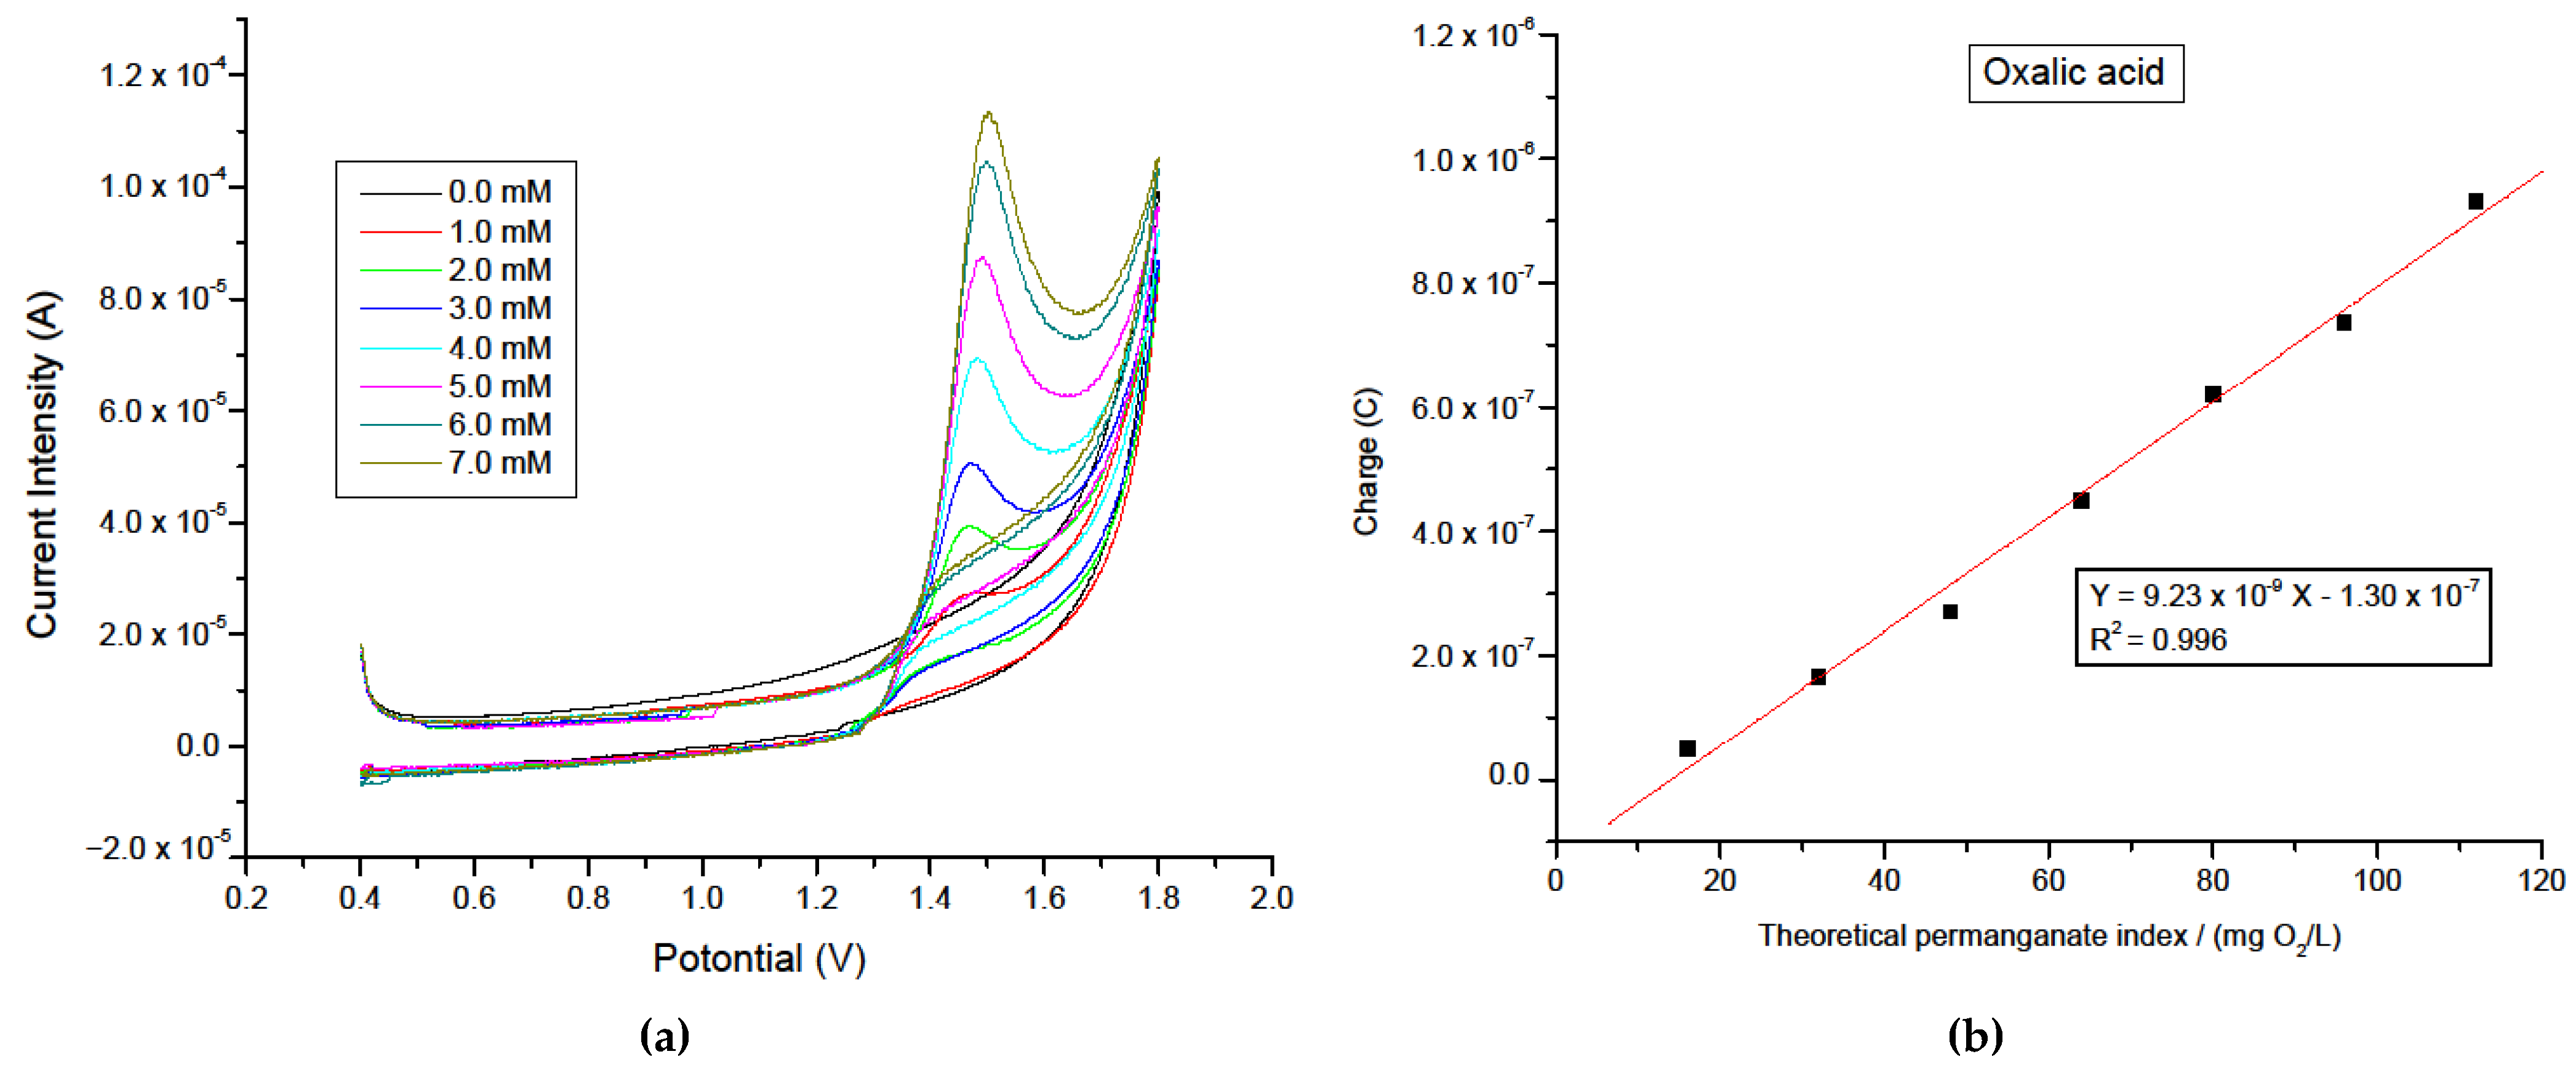
Cyclic voltammetry was carried out using a graphite electrode in the potential range of +0.4 V to +1.8 V vs. Ag/AgCl, at a scan rate of 0.1 V.s
−1. The concentration of oxalic acid was varied between 1 mM and 7 mM. These experimental parameters were optimized to ensure peak definition, minimize capacitive currents, and maintain consistent electrochemical response across the tested range. Voltammograms exhibit a well-defined anodic oxidation peak, the peak potential (E
pa) of which gradually increased from +1.44 V at 1 mM to +1.49 V at 7 mM (
Figure 5a), suggesting a concentration-dependent shift likely due to increased electrode polarization and mass transport limitations at higher concentration. Concurrently, the peak current intensity (I
pa) exhibits a marked increase, ranging from 4.99 × 10
−6 A at 1 mM to 6.91 × 10
−5 A at 7 mM (
Figure S5), consistent with a diffusion-controlled oxidation process. The voltametric profiles and the absence of a concentration cathodic peak in the reverse scan, and the dependence of the scan rate indicate an irreversible electrochemical mechanism. These observations are aligned with already published articles where it was reported that oxalic acid shows an irreversible electrooxidation process [
35].
Quantitative analysis of the anodic charge, obtained by integrating the area under the oxidation peak multiplied by the scan rate, reveals a strong linear correlation with the theoretical permanganate index assigned to the oxalic acid. The corresponding plot illustrates this correlation displayed a well-defined linear relationship (
Figure 5b), characterized by a high regression coefficient (R
2 = 0.996). The LOD and LOQ of oxalic acid were, respectively, found of 0.10 mM (corresponding to 1.60 mg O
2/L) and 0.34 mM (corresponding to 5.44 mg O
2/L). This strong agreement between the experimental and the theoretical values confirms the robustness of the electrochemical approach and validates its use as a quantitative tool for assessing the redox behavior of individual oxidizable compounds.
Furthermore, phenol was selected due to its simple aromatic structure bearing a hydroxyl group. This makes it a relevant representative for assessing oxidative behavior under voltammetric conditions [
36]. Cyclic voltammetry was also employed to examine its electrochemical properties under consistent experimental parameters applied across all tested analytes.
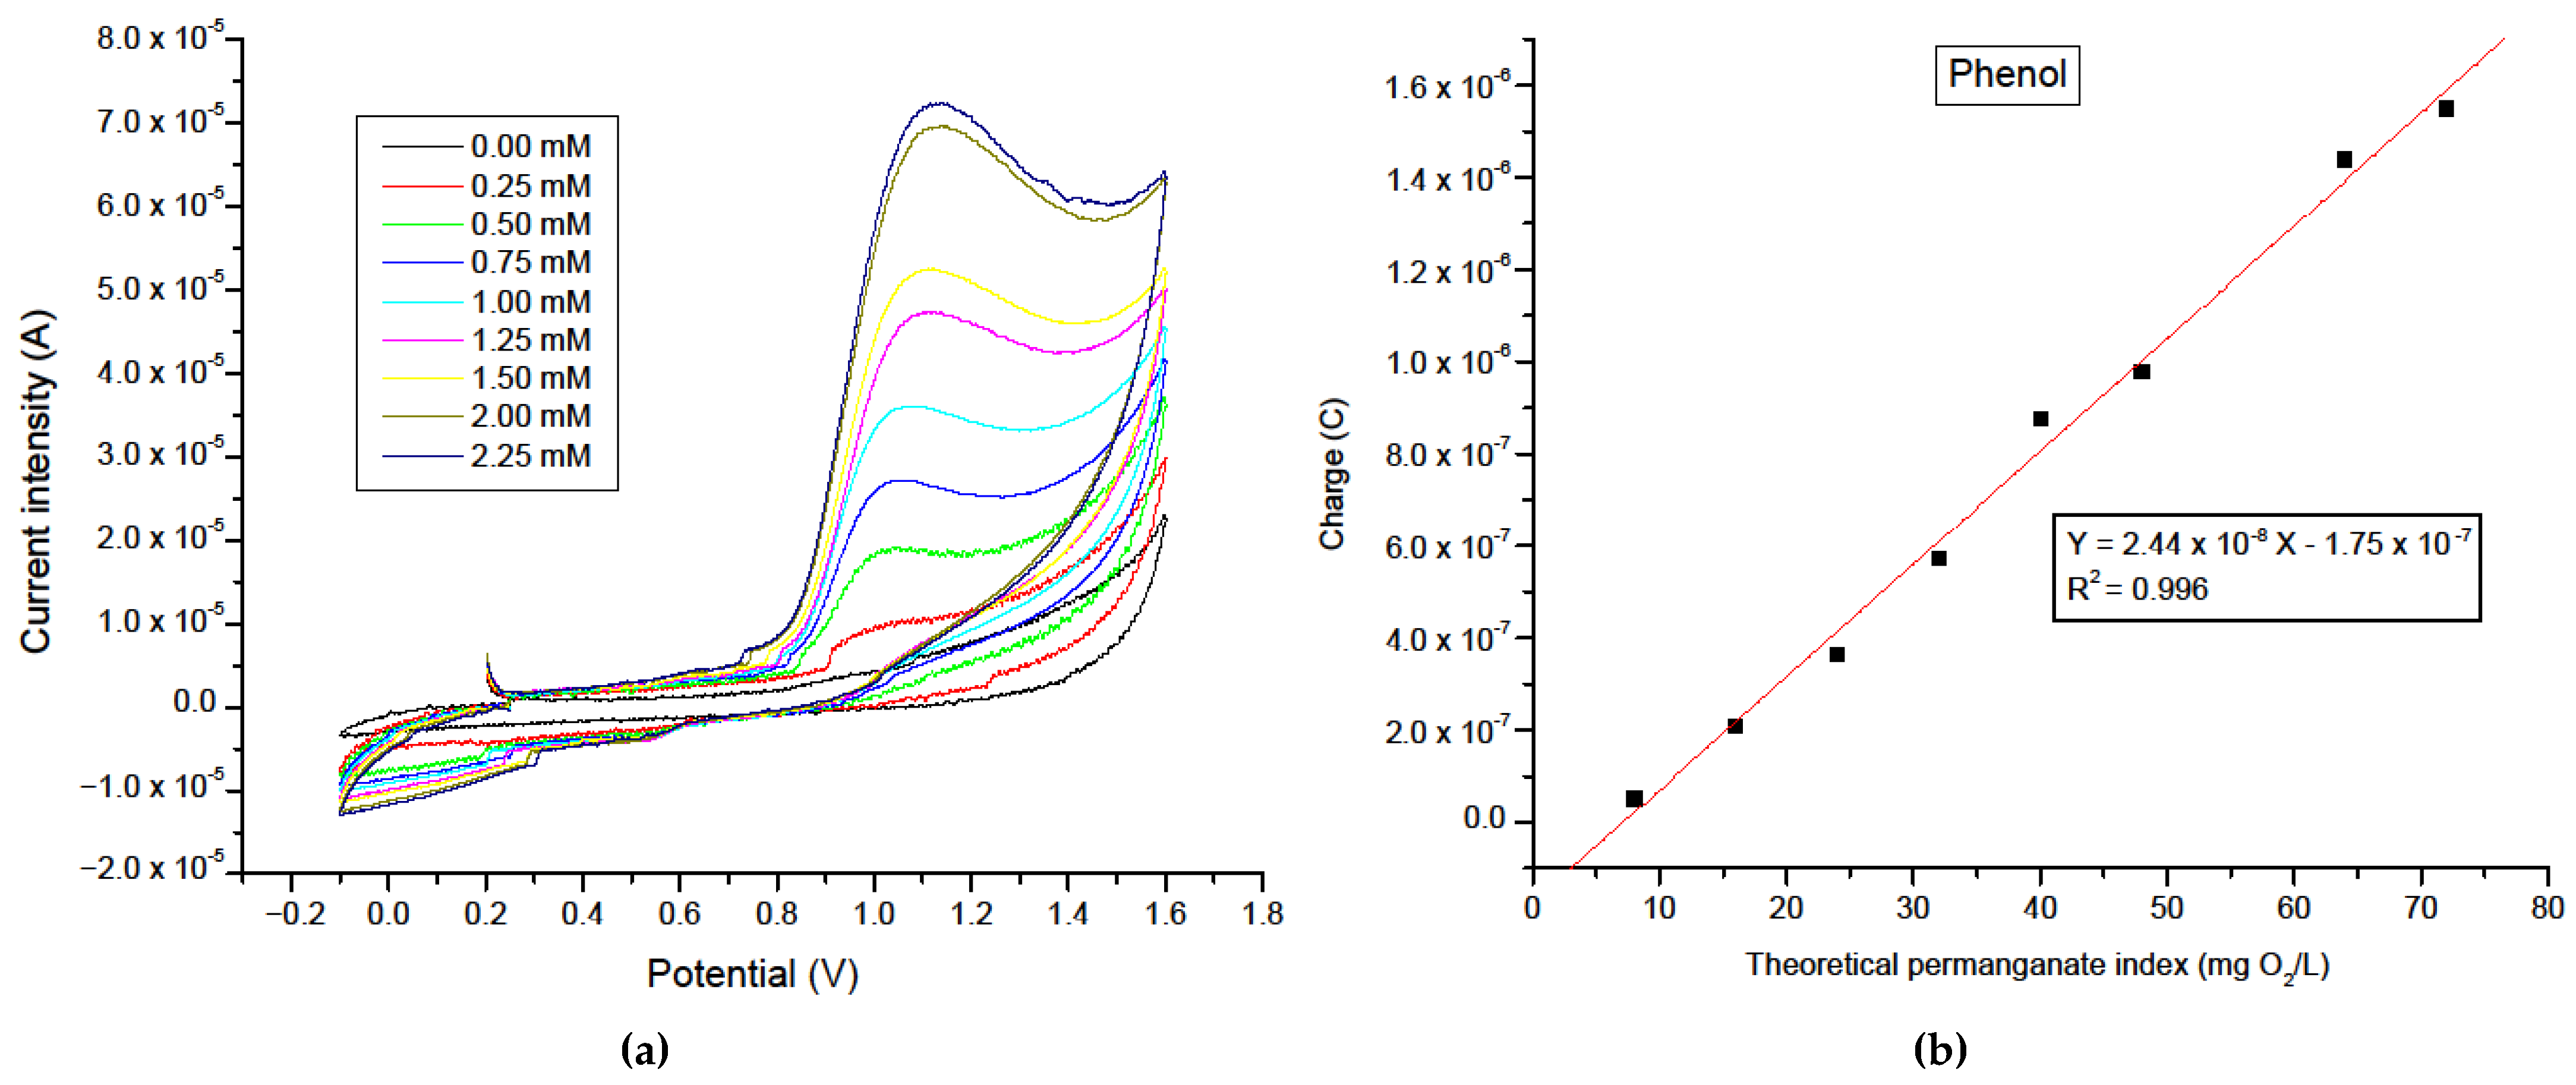
The measurements were carried out at a scan rate of 0.1 V.s
−1 over a potential window ranging from −0.1 V to +1.6 V versus Ag/AgCl. The concentration of phenol was varied from 0.25 mM to 2.25 mM (
Figure 6a). This concentration range was deliberately chosen based on preliminary observations indicating that higher concentrations led to rapid saturation of the oxidative current, compromising linearity. Thus, lower concentrations were selected to better explore the current–concentration relationship. For instance, phenolic compounds are known to generate quinone products, which polymerize on the electrode surface and lead to electrode fouling. This results in electrode passivation, reducing the performance of the electrochemical process, which may also reach complete blocking of the electrode’s active site. To anticipate polymerization and electrode fouling, the graphite carbon-based electrode was mechanically polished prior to each measurement to prevent electrode passivation and regenerate a fresh active site, followed by rinsing with distilled water to remove residual deposits [
37,
38]. The resulting voltammograms exhibit a single, well-defined anodic peak whose potential shifted slightly with increasing concentration. At 0.25 mM, the anodic peak appears at approximately +0.97 V, progressively shifting to +1.07 V at 2.25 mM. This positive shift in peak potential with concentration is characteristic of an irreversible electron transfer process, likely influenced by adsorptive or coupling reactions occurring at the electrode surface. The anodic peak current increased notably with phenol concentration. Specifically, the peak current intensity rises from 2.88 × 10
−6 A at 0.25 mM to 2.27 × 10
−5 A at 2.25 mM, indicating good sensitivity of the system to phenol concentration (
Figure S6). It is noteworthy to highlight that phenol exhibits a high sensitivity of 20.2 µA/µM. This suggests that phenolic compounds have a higher affinity for carbon surface, likely due to π−π interactions between the aromatic ring and the graphite structure. The LOD and LOQ of phenol were, respectively, calculated as 0.06 mM (corresponding to 1.92 mg O
2/L) and 0.19 mM (corresponding to 6.08 mg O
2/L).
The electrochemical behavior of phenol was confirmed to be irreversible, as evidenced by the absence of a corresponding cathodic peak in the reverse scan and the observed shift in anodic potential. This irreversibility suggests a fast electron transfer that is not followed by a reversible redox couple, consistent with known oxidative mechanisms of phenol involving follow-up chemical reactions such as polymerization or dimerization on the electrode surface [
39,
40]. This behavior is typically reported in the literature, suggesting that the absence of a corresponding reduction peak confirms the irreversibility of the electrochemical oxidation process [
41].
Finally, a correlation analysis between the experimentally obtained anodic charge and the theoretical permanganate oxidation index was performed. The analysis reveals a strong linear relationship, with a regression coefficient of R
2 = 0.996 (
Figure 6b). This high degree of correlation validates the electrochemical approach as a reliable and sensitive indirect method for assessing the oxidizing capacity of organic compounds. Overall, the findings confirm the robustness and the relevance of this methodology for comparative redox evaluation across different species.
Moreover, salicylic acid was selected as the last model compound due to its phenolic structure and its relevance in both environmental and biomedical contexts, which justify a deeper investigation of its electrochemical behavior [
42,
43]. This compound is also known for its well-documented anodic reactivity, making it a suitable candidate for voltametric analysis under the chosen experimental conditions.
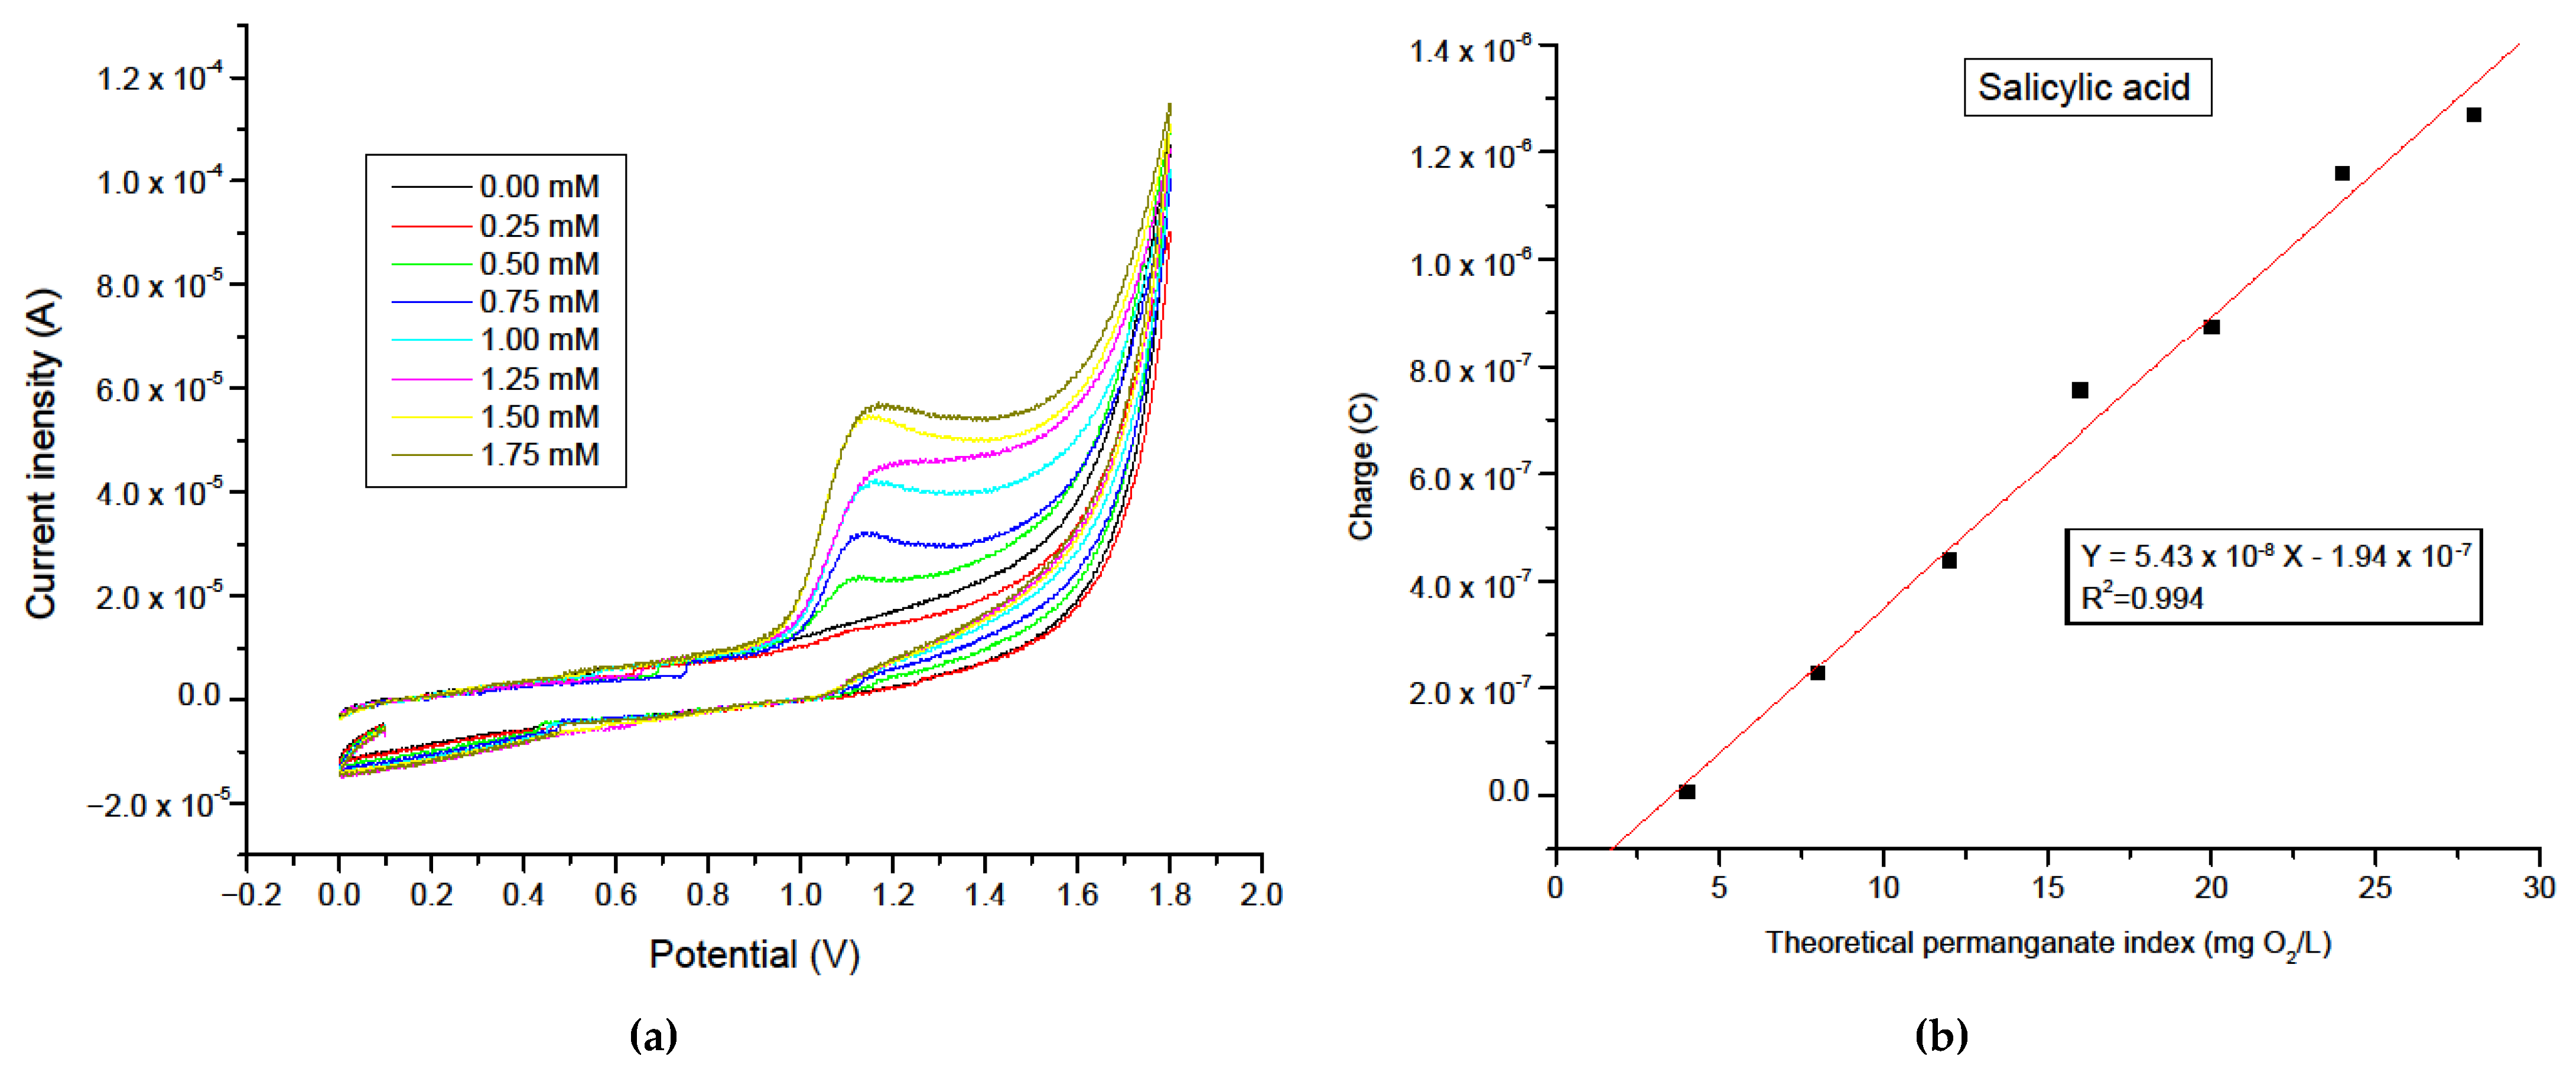
The investigation was conducted using cyclic voltammetry, with a scan rate of 0.1 V.s
−1 and a potential window ranging from 0 to +1.8 V versus Ag/AgCl. This range was chosen to encompass the complete anodic oxidation process without compromising signal stability or introducing secondary oxidation reactions at higher potentials. The examined concentration range extends from 0.25 mM to 2.25 mM. However, above 1.75 mM, a saturation phenomenon in the electrochemical response was observed, likely due to mass transport limitations or surface crowding effects at the electrode interface. This limitation was previously reported in the literature; the anodic oxidation of salicylic acid on a carbon electrode shows carbon saturation at high concentration, consistent with surface coverage limitations [
44,
45]. Consequently, higher concentrations were excluded from quantitative analysis to maintain signal linearity. The resulting voltammograms displayed a single anodic peak, with a slight potential shift depending on the concentration. At 0.25 mM, the oxidation peak was observed at approximately +1.11 V, gradually shifting to +1.14 V at 1.75 mM (
Figure 7a). This small positive shift in peak potential is indicative of an irreversible process, suggesting the oxidation reaction is not accompanied by a corresponding reduction within the scanned potential range. The peak current intensity increases proportionally with concentration, ranging from 8.93 × 10
−7 A at 0.25 mM to 3.69 × 10
−5 A at 1.75 mM (
Figure S7). Salicylic acid showed the highest sensitivity of 26.2 µA/µM (determined from the slope S of its calibration curve). The LOD and LOQ of salicylic acid were, respectively, found to be 0.04 mM (corresponding to 0.64 mg O
2/L) and 0.14 mM (corresponding to 2.24 mg O
2/L). These results highlight the electrode’s capability of detecting phenolic contamination at trace levels. This behavior is characteristic of a fast, diffusion-controlled electron transfer process. The absence of a cathodic peak during the reverse scan further supports the irreversible nature of the electrochemical system, as already reported in the literature [
46]. Due to this behavior (fast electron transfer), peak search integration for electrochemical charge quantification was challenging, particularly at low concentrations. To address this limitation, baseline correction was applied manually to enable more accurate integration of the anodic peaks.
Finally, a good linear correlation coefficient (R
2 = 0.994) was established between the electrochemical charge and the theoretical permanganate index (
Figure 7b), validating the reliability of this electrochemical approach. This correlation confirms again that the anodic oxidation of salicylic acid can be effectively used as a proxy for its oxidizable potential, demonstrating the robustness and applicability of the developed method for quantitative analysis.
3.2. Multiple Compounds Analysis
After validating the concept of the proposed detection strategy for the analysis of organic oxidizing matters by electrochemistry on a single basis compound, a multi-compound analysis was investigated to check for the validity of the concept in a more complex matrix. It is well-known that the simultaneous detection of multiple species is always challenging and encounters an interfering problem [
47,
48]. These conditions simulate a complex environmental sample where many phenomena are expected to occur, such as peaks overlap or merging, especially if the investigated compounds have close or similar redox potentials [
49], shifts in peak potentials, electrode surface competition and diffusional interference [
50]. For these reasons, the six compounds were primary divided into two groups and studied by cyclic voltammetry prior to studying a mixture composed of the six compounds together.
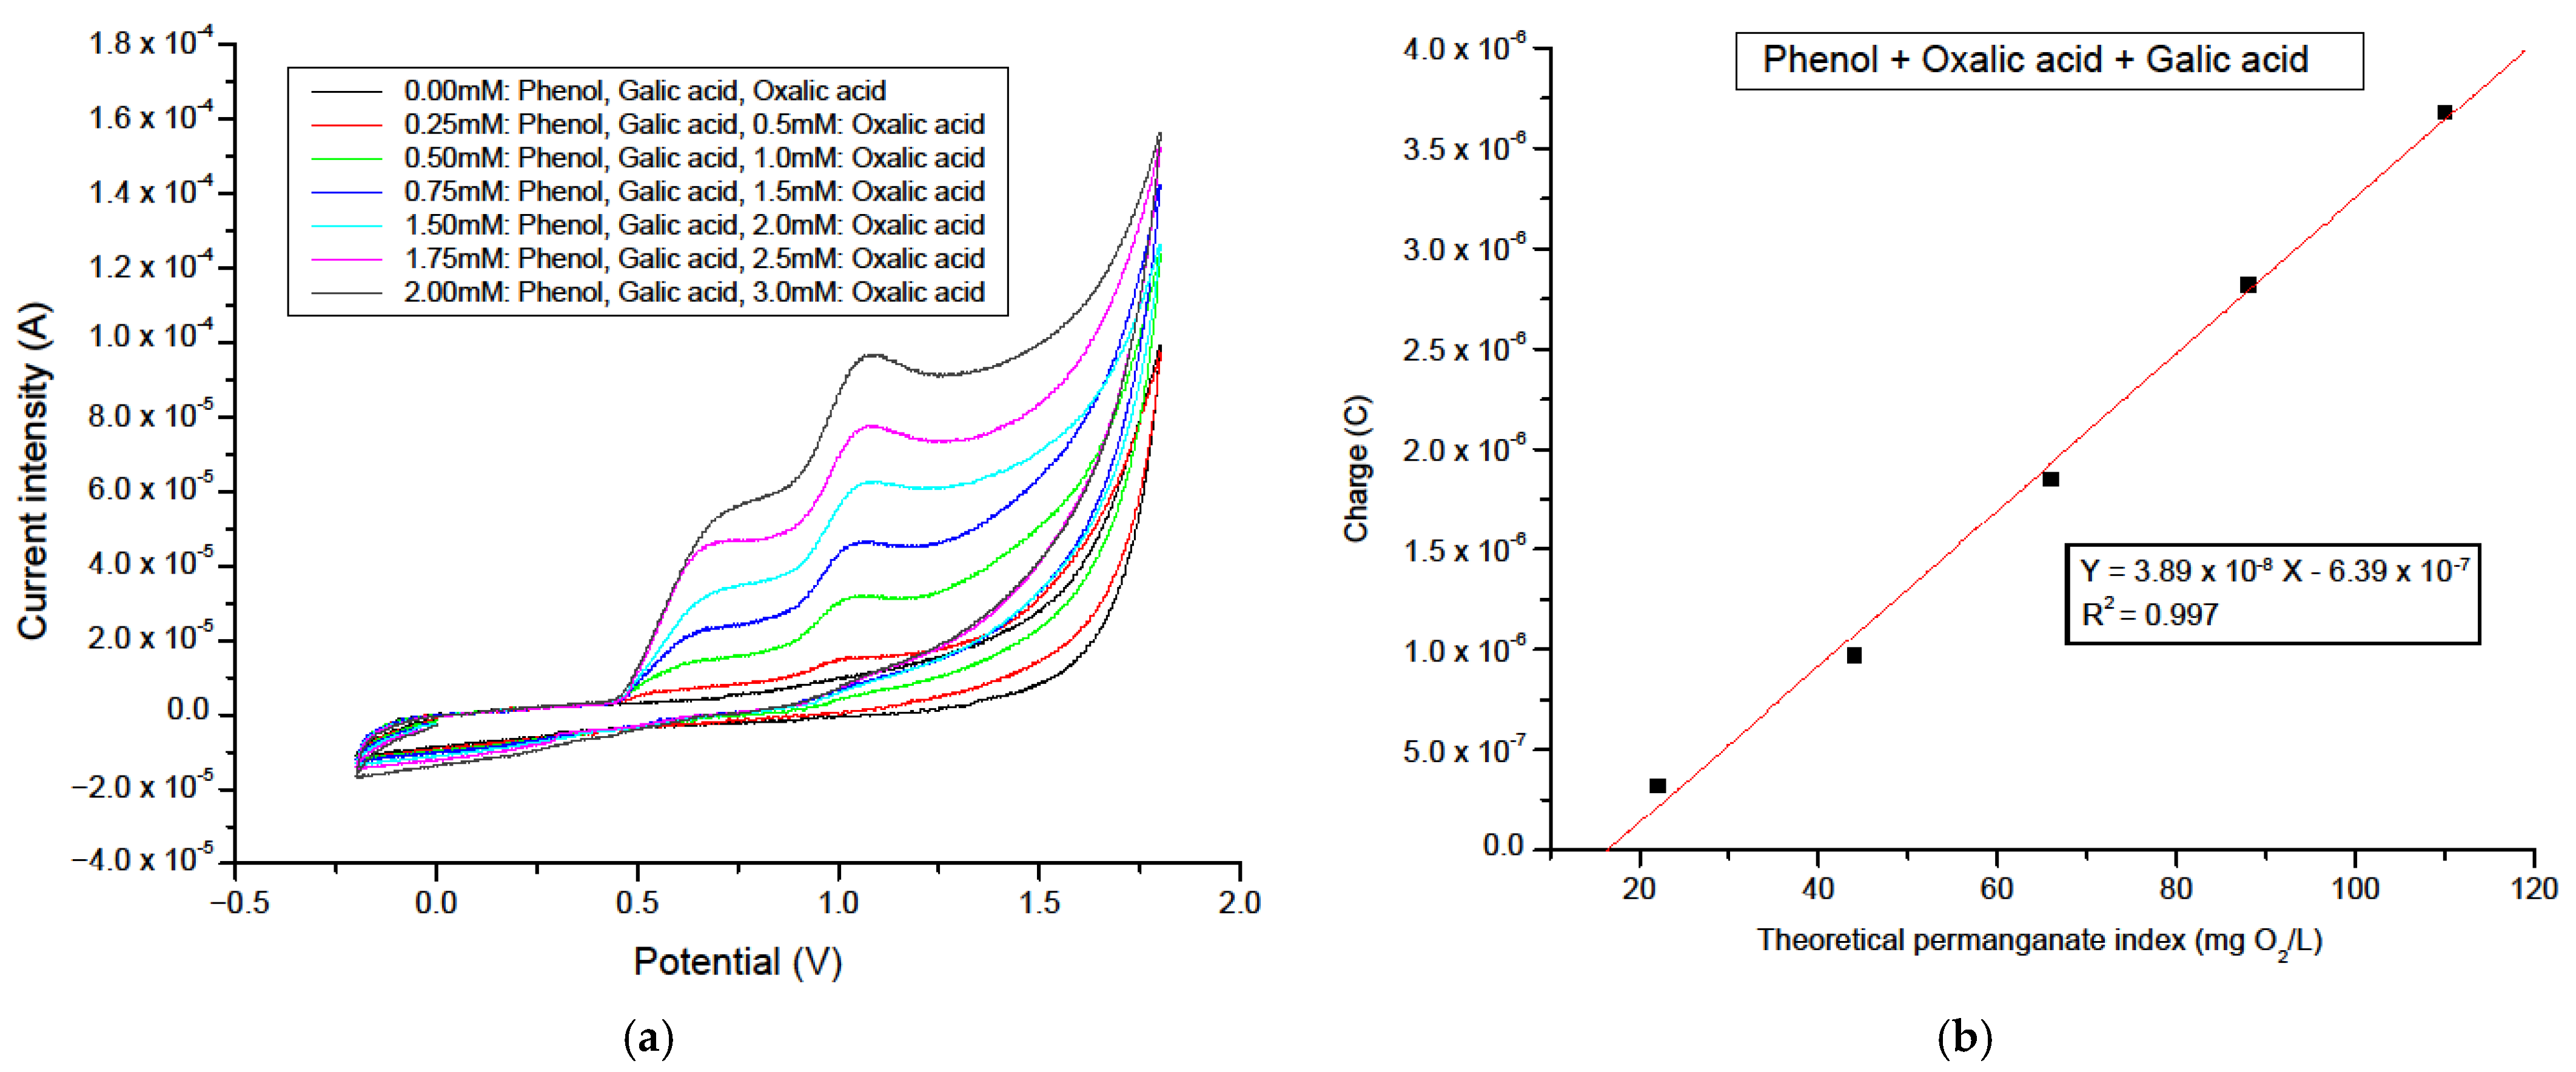
First, gallic acid, phenol, and oxalic acid were added together as a mixture in the electrochemical cell and investigated using the graphite carbon-based electrode. This mixture was chosen based on the initial oxidation potential for each compound as obtained in the results below (single compound analysis), which were, respectively, +0.42 V, +0.88 V, and +1.33 V. This allows us to understand the electrochemical behavior of the oxidizing species that have different starting oxidizing potentials. The voltammograms were recorded within a potential window ranging from −0.4 V to +1.8 V vs. Ag/AgCl, at a scan rate of 0.1 V.s
−1 (
Figure 8a). The initial run was performed following the addition of a mixture of 0.25 mM of phenol, 0.25 mM of gallic acid and 0.5 mM of oxalic acid. For subsequent scans, the concentration of each compound was increased according to these initial molar ratios (a 1:1:2 molar ratio for each step). As shown, the electrochemical signal (current intensity) increases with the concentration of the mixture (
Figure S8). The calculated sensitivity targeting the mixture (1) detection was of 12.2 µA.µM
−1, corresponding to a current density of 0.388 µA. mM
−1.cm
−2. No separated peaks were identified; instead, a single anodic curve was observed featuring two peaks appearing at +0.65 V and +1.0 V. To better understand this behavior, the corresponding charge for each measurement was measured after using the method of baseline correction. This methodology is a critical step in voltammetry, as an inappropriate baseline can introduce non-faradaic contribution (capacitive current, background drift, etc.) that biases the integrated peak area [
51]. To minimize this effect, we applied a manual baseline correction using a polynomial fitting approach, defined locally at the minimum between peaks or along a linear background segment, depending on the experimental configuration, thereby ensuring an enhanced and precise methodology for the peak’s integration. For each scan, the total electrochemical charge (Q
t) represents the sum of the individual charge contributions from each compound in the mixture (three compounds), expressed as follows:
Herein, the total measured charge Qt = Qphenol + Qoxalic acid + Qgallic acid
The obtained charges are plotted versus the calculated theoretical permanganate index (found from the sum of concentrations of each compound added in the mixture). As illustrated,
Figure 8b shows a linear relationship with a high correlation coefficient (R
2 = 0.997). These results demonstrate a strong correlation between the electrochemical anodic charge of the oxidizing compounds in a multi-compound mode analysis and their corresponding theoretical permanganate index, thereby validating the effectiveness of the detection strategy in a more complex matrix.
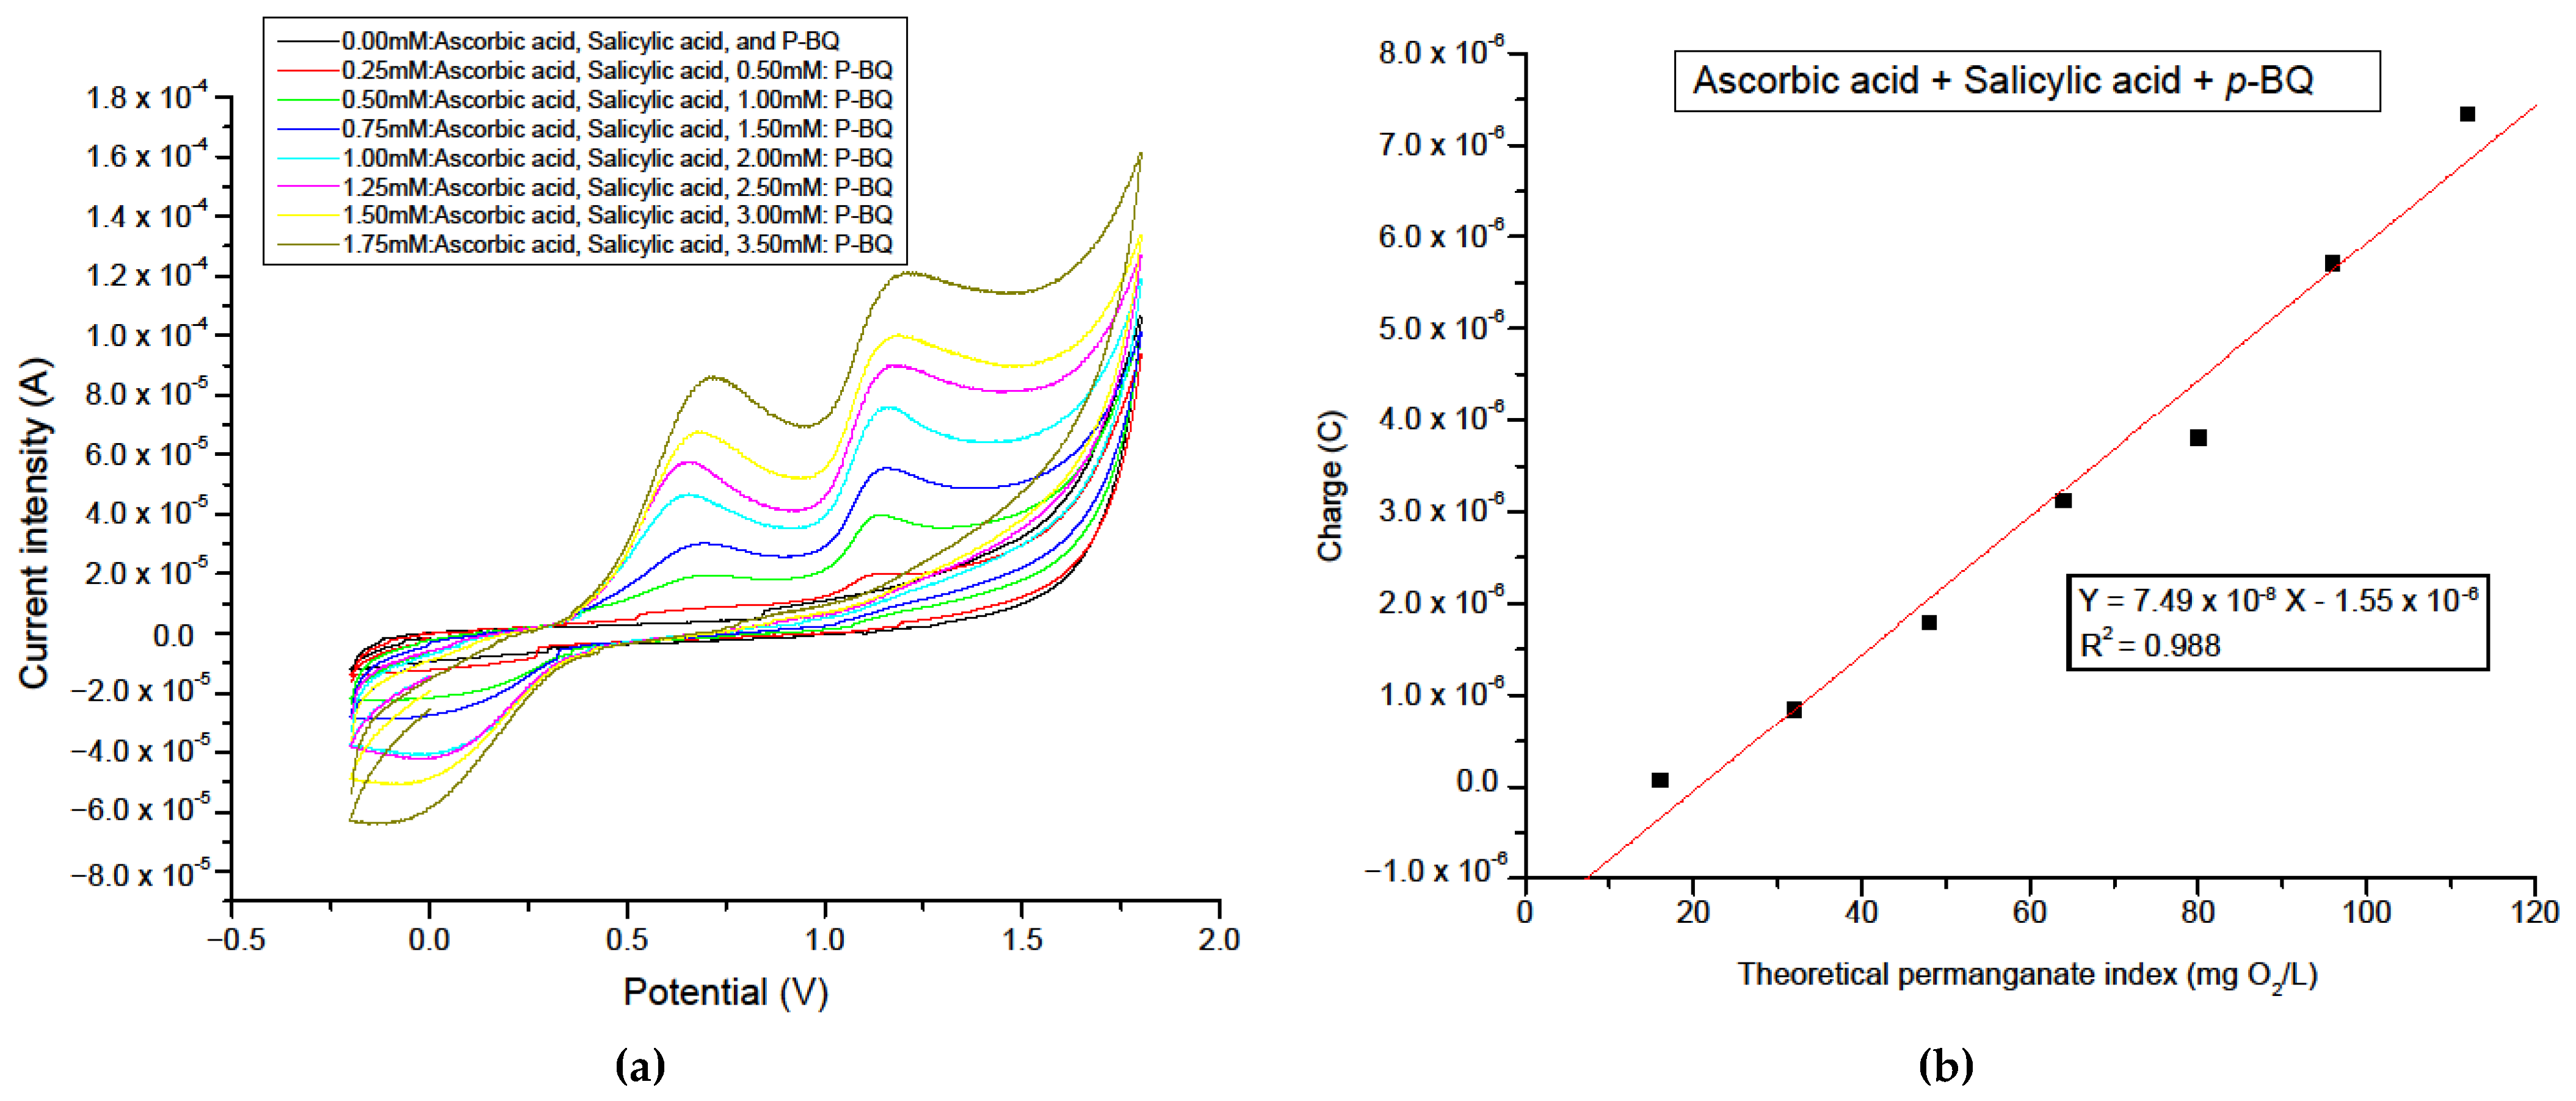
After, a second mixture containing ascorbic acid, salicylic acid and
p-benzoquinone was prepared and investigated. This mixture was particularly more complex since it contains a quasi-reversible compound (
p-BQ), which makes the curve integration more challenging. For instance, the initial oxidation potential for each compound was, respectively, of +0.30 V, +1.0V and +0.4V, which cover a wide potential range. The voltammograms were also registered within a potential window ranging from −0.4 V to +1.8 V vs. Ag/AgCl, at a scan rate of 0.1 V.s
−1.
Figure 9a shows the electrochemical signal response (current intensity) versus the potential (voltammograms). The initial run was registered using a mixture of 0.25 mM of ascorbic acid, 0.25 mM of salicylic acid and 0.5 mM of
p-BQ. In the following runs, the concentration of each compound was increased according to these initial molar ratios (a 1:1:2 molar ratio for each step). As illustrated, the current increases with the concentration of the mixture concentration increasing (
Figure S9). The calculated sensitivity targeting the mixture (2) detection was of 14.3 µA.µM
−1, corresponding to a current density of 0.455 µA. mM
−1.cm
−2. Contrarily to the first mixture, where only one single anodic curve was observed, a single anodic curve was observed featuring two peaks appearing at +0.65 V and +1.14 V in addition to a single cathodic curve appearing at approx. 0 V, for the second mixture. The latter can be attributed to the presence of
p-BQ in the mixture that shows a reversible behavior, including this cathodic peak. Moreover,
Figure 9b shows the variation in the charge associated with the anodic current and the calculated theoretical permanganate index. For each scan, the total electrochemical charge (Q
t) represents the sum of the individual charge contributions from each compound in the mixture (three compounds). Herein, the total measured anodic charge Q
t = Q
ascorbic acid + Q
salicylic acid + Q
benzoquinone. As shown, a linear relationship can be deduced, which demonstrates a good correlation between the electrochemical anodic charge of the oxidizing compounds in a multi-compound mode analysis and their corresponding theoretical permanganate index.
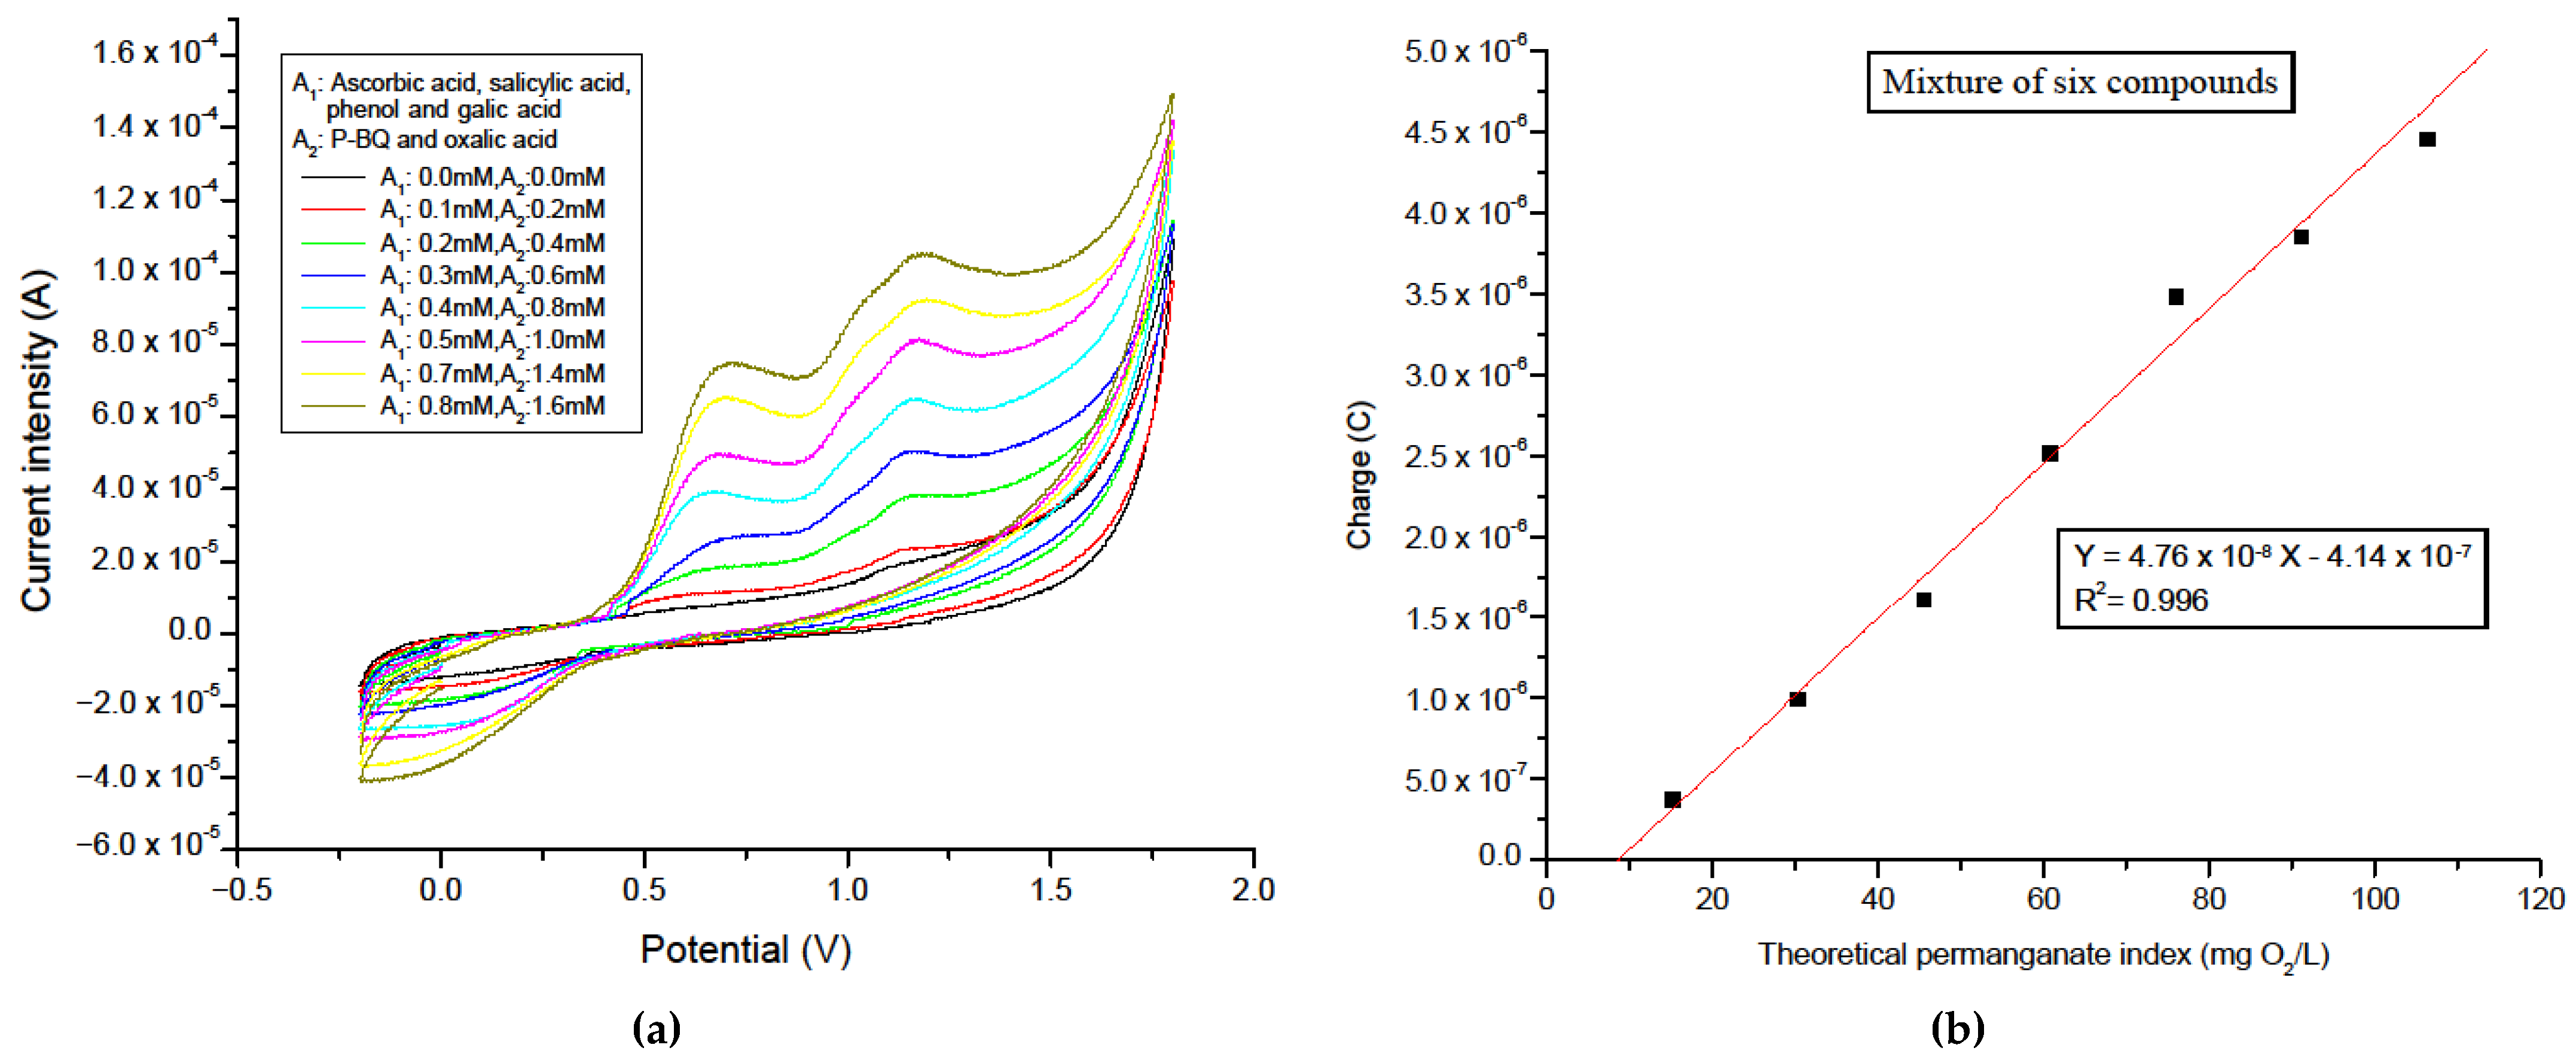
Finally, to assess the electrochemical response in a real complex matrix, all the compounds investigated in this study (gallic acid, phenol, oxalic acid, ascorbic acid, salicylic acid and
p-benzoquinone) were mixed together and analyzed by cyclic voltammetry. The same experimental conditions were applied (a potential window ranging from −0.4 V to +1.8 V vs. Ag/AgCl, and a scan rate of 0.1 V.s
−1), sodium sulfate was added as a supporting electrode at a concentration of 0.1 M, and the pH was adjusted to 2. The initial scan was recorded following the addition of a mixture containing 0.1 mM of each compound in group A1 (phenol, gallic acid, ascorbic acid and salicylic acid) and 0.2 mM of each compound in group A2 (oxalic acid and
p-BQ). Subsequent scans were performed by increasing concentrations according to the initial molar ratios (1:2). The resulting voltammograms are presented in
Figure 10a. As illustrated, the current intensity increases with the increasing mixture concentration (
Figure S10). The calculated sensitivity targeting the mixture (3) detection was of 10.4 µA.µM
−1, corresponding to a current density of 0.331 µA.mM
−1.cm
−2 (
Table S3). This typical behavior confirms that a conventional electrochemical response of cyclic voltammetry is observed, even in the presence of a mixture of compounds. Additionally, a graph showing the variation in the electrochemical anodic charge versus the calculated theoretical permanganate index (found from the sum of the concentration of each compound added to the mixture) was plotted (
Figure 10b). To remember, the corresponding charge was measured after a baseline correction for each measurement. This data processing is a critical step to guarantee an enhanced and precise methodology for the peak’s integration, where the solvent oxidation wall is remarkably visible at the extreme positive potential limit of scans (E ≥ 1.2V vs. Ag/AgCl at the graphite electrode material). For each scan, the total electrochemical charge (Q
t) represents the sum of the individual charge contributions from each compound in the mixture (six compounds). Herein, the total measured anodic charge:
As shown (
Figure 10b), a linear relationship with a very good correlation coefficient (R
2 = 0.996) was obtained for the function Q vs. PI
theo. This demonstrates again the existing of the correlation between the anodic electrochemical charge and the theoretical PI, even in a complex matrix. For instance, in a multicomponent matrix where several analytes exhibit partially or completely overlapping oxidation potentials, the integrated charge primarily reflects the cumulative contribution of all oxidizable species rather than compound-specific information [
47,
52,
53]. The excellent agreement with the permanganate index confirms that the methodology effectively captures the total oxidizable load of the system, which is particularly relevant for applications related to organic pollution assessment. Thus, the water quality determination through the conventional permanganate index method could be replaced by the electrochemical methodology, where the organic part of the water pollution can be effectively analyzed by electrochemistry.
These findings align with the principles of multiparametric analysis in cyclic voltammetry, where multiple electrochemical responses can be deconvoluted or correlated with physicochemical properties. In this case, the anodic charge serves as a quantitative electrochemical parameter reflective of the oxidizable content in the sample. Although only one electrochemical parameter (Q) was explored here, the framework opens the possibility for applying full multiparametric or chemometric analysis to environmental or complex matrices in future studies.




 ,
,