Article

Features of Synthesis, Crystal Structure, Thermal and Electrical Properties, XPS/NEXAFS Study of Pyrochlore-Type Bi2Cr0.5Co0.5Nb2O9+Δ

by
Nadezhda A. Zhuk
1,*,
Nikolay A. Sekushin
2,
Maria G. Krzhizhanovskaya
3,
Vladislav V. Kharton
4,
Danil V. Sivkov
5 and
Sergey V. Nekipelov
5
1
Institute of Natural Sciences, Syktyvkar State University, Oktyabrsky Prospect, 55, Syktyvkar 167001, Russia
2
Institute of Chemistry, Komi Science Center UB RAS, Pervomaiskaya st. 48, Syktyvkar 167982, Russia
3
Institute of Earth Sciences, Saint Petersburg State University, University Emb. 7/9, Saint Petersburg 199034, Russia
4
Institute of Solid State Physics RAS, Chernogolovka 142432, Russia
5
Institute of Physics and Mathematics, Komi Science Center UB RAS, Oplesnina st. 4, Syktyvkar 167982, Russia
*
Author to whom correspondence should be addressed.
Chemistry 2025, 7(6), 185; https://doi.org/10.3390/chemistry7060185
Submission received: 18 September 2025 / Revised: 19 November 2025 / Accepted: 20 November 2025 / Published: 24 November 2025

Abstract

The phase-pure cubic pyrochlore of the Bi2Cr0.5Co0.5Nb2O9+Δ composition can be successfully synthesized by a modified sol–gel method (Pecini method-PM) and a traditional solid-phase method (SPM). A feature of the solid-phase synthesis method is the formation of bismuth(VI) chromates as intermediate synthesis products, which is confirmed by X-ray spectroscopy data (NEXAFS). During the sol–gel synthesis method, bismuth chromates are not formed due to the formation of the Bi28O32(SO4)10 salt, which is thermally stable up to 880 °C, preventing the interaction of bismuth(III) and chromium(III) oxides. The temperature of the final pyrochlore calcination during sol–gel synthesis is reduced by 100 °C (950 °C) compared to the solid-phase method. The crystal structure of pyrochlore (sp. gr. Fd-3m, PM, a = 10.49360(5) Å, Z = 4) was refined by the Rietveld method based on X-ray powder diffraction (XRD) data. NEXAFS Cr2p and Co2p spectra of ceramics synthesized at 1050 °C correspond to the charge states of Cr(III), Co(II) and Co(III) ions. The thermal expansion coefficient of the cell was calculated from high-temperature X-ray diffraction measurements in the range of 20–1200 °C. The thermal expansion coefficient (TEC) monotonically increases from 3.92 × 10⁻⁶ °C−1 (20 °C) to 9.89 × 10⁻⁶ °C−1 (1020 °C). Above 1110 °C, TEC decreases due to thermal dissociation of Bi2Cr0.5Co0.5Nb2O9+Δ with the formation of CoNb2O6, Bi2O3. The mixed pyrochlore (PM) exhibits a moderately high permittivity of ∼97, and low dielectric losses of ∼2 × 10⁻³ at 1 MHz and ∼30 °C. The activation energy of conductivity of the high-temperature region is 0.89 eV. The electrical properties of pyrochlore were synthesized by the ceramic (SPM) and Pechini methods (PM) were analyzed. The electrical properties of the samples up to 400 °C were modeled using equivalent electrical circuits

1. Introduction

Synthetic pyrochlores based on bismuth niobate attract close attention of scientists due to the manifestation of practically useful physicochemical properties, such as photocatalytic and dielectric properties [1,2,3,4,5]. Due to low values of dielectric loss, high permittivity, adjustable temperature coefficient of capacitance, low sintering temperature, and chemical compatibility with low-melting conductors, materials based on bismuth-containing pyrochlores can be used in the manufacturing of multilayer ceramic capacitors and tunable microwave dielectric components. The crystal structure of oxide pyrochlore, described by the formula A2B2O6O’, consists of cationic sublattices A2O’ of the anticristobalite type and a framework sublattice B2O6 formed by linked vertices of octahedra [6,7]. Eight-coordinated positions A are occupied by cations with valences +3/+2, and positions B in the octahedron are occupied by multiply charged cations with valences +4/+5. The flexibility of the crystal structure of pyrochlores to cation substitutions in the bismuth/niobium sublattices and oxygen vacancies in the A2O’ sublattice makes it possible to combine various combinations of metal ions and control the functional properties of ceramics [8,9,10,11,12,13,14,15]. A feature of the pyrochlores under consideration is the partial vacancy of the bismuth sublattice and the distribution of dopants-ions of transition 3d-elements (Co, Cu, Zn, Mn) in both cation sublattices of bismuth and niobium, causing relaxation processes in ceramics [16,17]. New studies of bismuth niobate-based pyrochlores doped with transition 3d-ions (Cr, Mn, Fe, Co, Ni, Cu, Zn) [18,19,20] have shown the possibility of synthesizing multi-element pyrochlores containing from two to six types of paramagnetic elements. For pyrochlores, the stages of phase formation during the solid-phase synthesis method have been established, the structural parameters have been given, and the microstructure of the compounds has been studied, while the properties of the compounds, the influence of atoms on each other, and on the properties of pyrochlore, as a whole, have not been sufficiently studied. In particular, the study of the phase formation of mixed pyrochlore Bi2Cr1/6Mn1/6Fe1/6Co1/6Ni1/6Cu1/6Nb2O9+Δ showed [19] that the synthesis of phase-pure pyrochlore occurs at a temperature of at least 1050 °C, the high-temperature pyrochlore synthesis occurs through the interaction of bismuth orthoniobate with dopant oxides, and the formation of intermediate synthesis products, in the composition of which Cr(VI) ions are found. In the article [21], the oxidation states of cobalt and chromium ions in the pyrochlore composition were analyzed using X-ray spectroscopy data and the reason for the change in the color of the ceramics during the solid-phase synthesis method was established. In the present work, the features of the synthesis of Bi2Cr0.5Co0.5Nb2O9+Δ by the Pechini method were described, the electrical properties of the samples synthesized by the solid-phase and sol–gel synthesis methods were investigated, and the crystal structure of the compound and its thermal stability were clarified.

2. Experimental Section

For the solid-phase synthesis of the Bi2Cr0.5Co0.5Nb2O9+Δ sample and the synthesis by the Pechini method, stoichiometric amounts of bismuth (III), niobium (V), chromium (III), and cobalt (II, III) oxides of analytical grade were used. In the solid-phase synthesis method, first, a mixture containing stoichiometric amounts of oxides was thoroughly ground to homogenize. The resulting powder was ground in an agate mortar for 1 hour, then pressed into disks to ensure better contact between the powder grains. The disk-shaped samples were successively (with increasing heat treatment temperature) calcined in air in corundum crucibles four times at 650, 850, 950, and 1050°C. Between calcinations, the samples were homogenized again to prevent uneven distribution of the substance. A final synthesis temperature of 1050°C was required to obtain a single-phase sample. Thus, the synthesized sample was calcined in four stages at four temperatures: 650, 850, 950 and 1050 °C. Such multiple heat treatment allowed us to obtain single-phase samples with reproducible physical properties.
During solid-phase synthesis in the temperature range of 750–1000 °C, the main impurity phase was orthorhombic BiNbO4. Final calcination at 1050 °C prevents the formation of a secondary phase, and the sample was synthesized in the pyrochlore structural type. A concentrated, chemically pure grade of sulfuric acid solution, citric acid and ethylene glycol of chemically pure grade were used as additional reagents in the Pechini method. The weighed portions of bismuth(III), cobalt(II, III), and chromium(III) oxides were successfully dissolved in a sulfuric acid solution upon heating. The weighed portion of niobium(V) oxide was dissolved in a concentrated sulfuric acid solution by boiling for several hours. The resulting solutions were combined and citric acid (HCit) and ethylene glycol (EG) were added to the reaction mixture in the molar ratio HCit: [Bi3++Co2+/3++Cr3++Nb5+] = 1 and HCit: EG = 5.27. The transparent dark green solution was evaporated first to a viscous solution and then to obtain a dry graphite-colored mass. Pyrolysis of the reaction mixture was carried out at 350 °C for 3 h. The resulting X-ray amorphous powder was again thoroughly ground and pressed into disk-shaped pellets for high-temperature calcination; the final synthesis temperature was 1050°C. At each calcination stage, the reaction mixture was again homogenized and pressed disks were prepared for contacting the ceramic grains. The phase purity of the prepared sample was confirmed using a Shimadzu 6000 X-ray diffractometer (Shimadzu, Tokyo, Japan) using Cu radiation in the 2-theta range of 10–80° at a scanning speed of 2.0 °/min. The thermal behavior of Bi2Cr0.5Co0.5Nb2O9+Δ at high temperature was investigated by the powder high-temperature X-ray diffraction (HTXRD) using a Rigaku Ultima IV diffractometer (RIGAKU Corporation, Tokyo, Japan) (Co radiation, air atmosphere, 40 kV/30 mA, Bragg–Brentano geometry, PSD D-Tex Ultra) with a thermo-attachment in the range 25–1200 °C with the T steps of 30 °C. A platinum-rhodium (Pt-Rh) thermocouple was used. Fine-powdered samples were deposited on a platinum sample holder (20 × 12 × 1.5 mm) from a heptane suspension. The temperature was controlled by a thermocouple located close to the Pt holder; the uncertainty of temperature measurement does not exceed 10 °C. The correctness of 2θ at room temperature was checked before every measurement using silicon as an external standard; the change in zero shift was never more than ± 0.02° 2θ in the whole temperature range. The unit-cell parameters were calculated at every temperature step by Pawley approach with the program package Topas 5.0 [22]. The calculation of the thermal-expansion coefficient was performed using the TTT [23] program packages. The XRD pattern of Bi2Cr0.5Co0.5Nb2O9+Δ for the structure refinement was obtained at 23 °C in the range of 5–130° 2θ and the exposure at about 8 hours. During the refinement the neutral scattering factors were used for all atoms. The background was modeled by the Chebyshev polynomial approximation; the peak shape was described by Thompson-Cox-Hastings pseudo-Voigt. The surface morphology of the preparation and local quantitative elemental analysis were studied using scanning electron microscopy and energy-dispersive X-ray spectroscopy (electron scanning microscope Tescan VEGA 3LMN, energy dispersion spectrometer INCA Energy 450, Tescan, Brno, Czech Republic). The X-ray photoelectron spectroscopy (XPS) was used to study the charge state of the ions using a Thermo Scientific ESCALAB 250Xi X-ray spectrometer (Thermo Fisher Scientific, UK) with AlKα radiation (1486.6 eV). An ion-electron charge compensation system was used. Peak calibration was based on the C1s line at 284.6 eV. The NEXAFS spectroscopy studies were carried out at the NanoPES station of the KISI synchrotron source at the Kurchatov Institute (Russia, Moscow). NEXAFS spectra were obtained by total electron yield (TEY) recording with an energy resolution of 0.5 eV and 0.7 eV in the region of the Cr2p and Co2p absorption edges, respectively. To study the electrical properties, silver electrodes were applied to the ends of the disk (thickness h = 1.6 mm, diameter D = 14.1 mm) on both sides by burning silver paste at 650 °C for an hour. Measurements were performed using a Z-100 impedance meter 1000P (Minsk, Belarus) (window 1–106 Hz) in a wide frequency range of 25 Hz to 1 MHz and a temperature range of 24 to 450 °C. The temperature of the sample in the measuring cell was controlled by a chromel-alumel thermocouple (temperature measurement accuracy ± 1 °C).

3. Results and Discussion

3.1. Synthesis by the Solid-Phase Reaction Method and the Pechini Method

As studies have shown [19], the solid-phase synthesis of multi-element pyrochlores based on bismuth niobate is a multi-stage process, which is associated with the low reactivity of niobium (V) oxides and 3d-elements [24]. In addition, the features of the solid-phase synthesis method are the duration of calcination and the multi-stage heat treatment process with intermediate re-mixing of the reaction mixture, which are necessary to accelerate the reaction and obtain a homogeneous synthesis product [19,24]. A feature of the step-by-step solid-phase synthesis of Bi2Cr0.5Co0.5Nb2O9+Δ (SPM) is a reversible change in the color of the sample, in the temperature range of 500–750 °C, from green to red-brown [21]. As shown by the X-ray phase analysis (Figure 1), the sample calcined at 650 °C was not single-phase and contained intermediate products of the interaction of bismuth (III) oxide with chromium (III) and niobium (V) oxides—bismuth chromate Bi6Cr2O15 (sp. group Ccc2, ICPDS No. 01-070-5699), bismuth niobates Bi5Nb3O15 (sp. group P4/mmm, ICPDS No. 00-051-1752) and BiNbO4 (sp. group Pnna, ICPDS No. 82-0348), monoclinic β-Nb2O5 (sp. group P2/m) and pyrochlore (sp. group Fd-3m) [25,26,27,28,29].
According to NEXAFS spectroscopy data, the red-brown color of the sample is given by bismuth chromate containing Cr(VI) cations in the form of CrO42− tetrahedra and having its own intense red-orange color due to electron transitions with charge transfer [30].
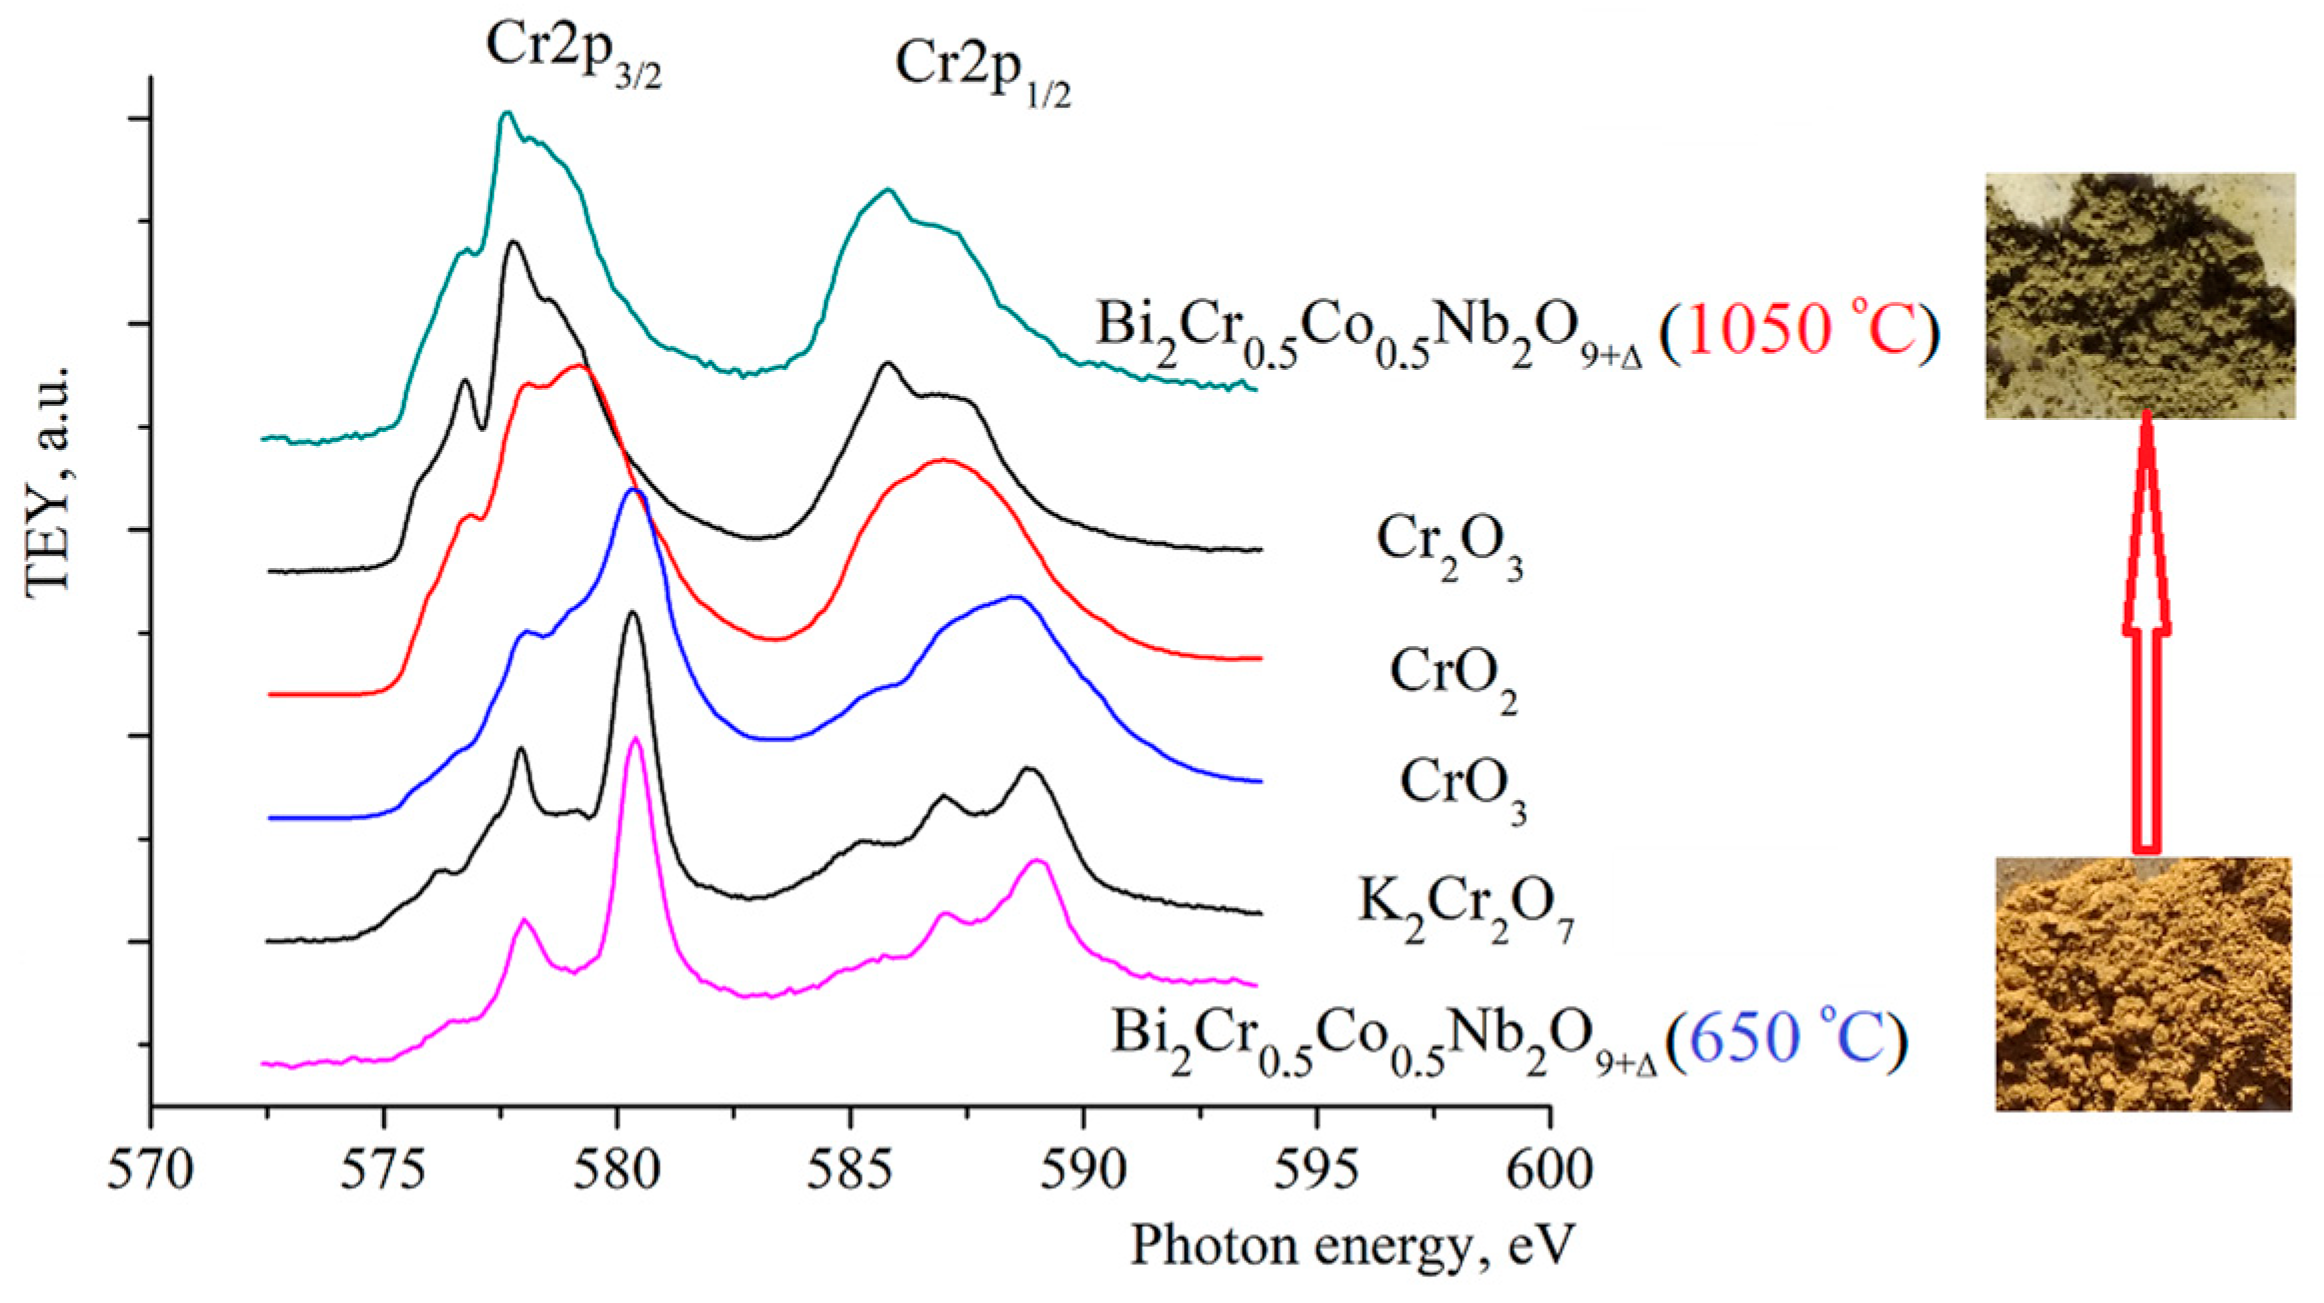
As Figure 2 shows, the Cr2p3/2 and Cr2p1/2 spectra of the sample calcined at 650 °C contain absorption bands at 578, 580.5, and 589 eV [21]. Comparison of the sample spectrum with the spectra of Cr2O3 oxide and potassium dichromate K2Cr2O7 shows that the low-energy bands in the spectrum coincide with the spectrum of K2Cr2O7 in terms of the energy position of the peaks and indicates that chromium ions are in the Cr(VI) charge state in the form of CrO42− ions, similar to K2Cr2O7, which is consistent with the results of X-ray phase analysis. With increasing temperature, the charge state of chromium ions in Bi2Cr0.5Co0.5Nb2O9+Δ ceramics changed from Cr(VI) to Cr(III), since the NEXAFS spectrum contains Cr2p3/2 and Cr2p1/2 bands at 576–580 and 586–589 eV with features characteristic of Cr2O3 containing Cr(III) cations in an ocahedral environment. According to the X-ray phase analysis data (Figure 1), the reduction of chromium(VI) ions was associated with the thermal dissociation of bismuth chromate Bi6Cr2O15, calcined at a temperature of 750 °C. In this regard, the sample again acquired a green color, characteristic of Cr(III) compounds, as evidenced by the NEXAFS data. The formation of bismuth chromate (VI) during the synthesis of ceramics is a rather interesting fact, since it has been established that chromium oxide does not oxidize in an oxygen environment without the influence of bismuth (III) oxide. In addition, the reaction of bismuth(III) and chromium(III) oxides was observed only with a significant predominance of bismuth(III) oxide. Our latest studies of the interaction of these oxides have shown that the chemical reaction occurs even without absorption of atmospheric oxygen.
The unit cell parameter of the synthesized Bi2Cr0.5Co0.5Nb2O9+Δ sample is 10.4838(8) Å. Since the radii of Ta(V) and Nb(V) ions ((R(Nb(V)/Ta(V))c.n.= 6 = 0.064 nm) are equal, the lattice constants for pyrochlores based on bismuth niobate and tantalate can be comparable. Indeed, the unit cell parameter Bi2CrTa2O9+Δ (a = 10.45523(3) Å) [31] is comparable with chromium-containing niobium pyrochlore. The unit cell parameter for cobalt-containing pyrochlores based on bismuth tantalate Bi1.49Co0.8Ta1.6O7.0 a = 10.54051(3) Å and for Bi1.6Co0.8Ta1.6O7±Δ a = 10.5526 (2) Å significantly exceeds the parameter of chromium-cobalt-containing pyrochlore (10.4838(8) Å), which is associated with a significant difference in the radii of chromium (III) and cobalt (II) ions (R(Cr(III) = 0.615 Å, R(Co(II))c.n.= 6 = 0.745 Å) [32,33].
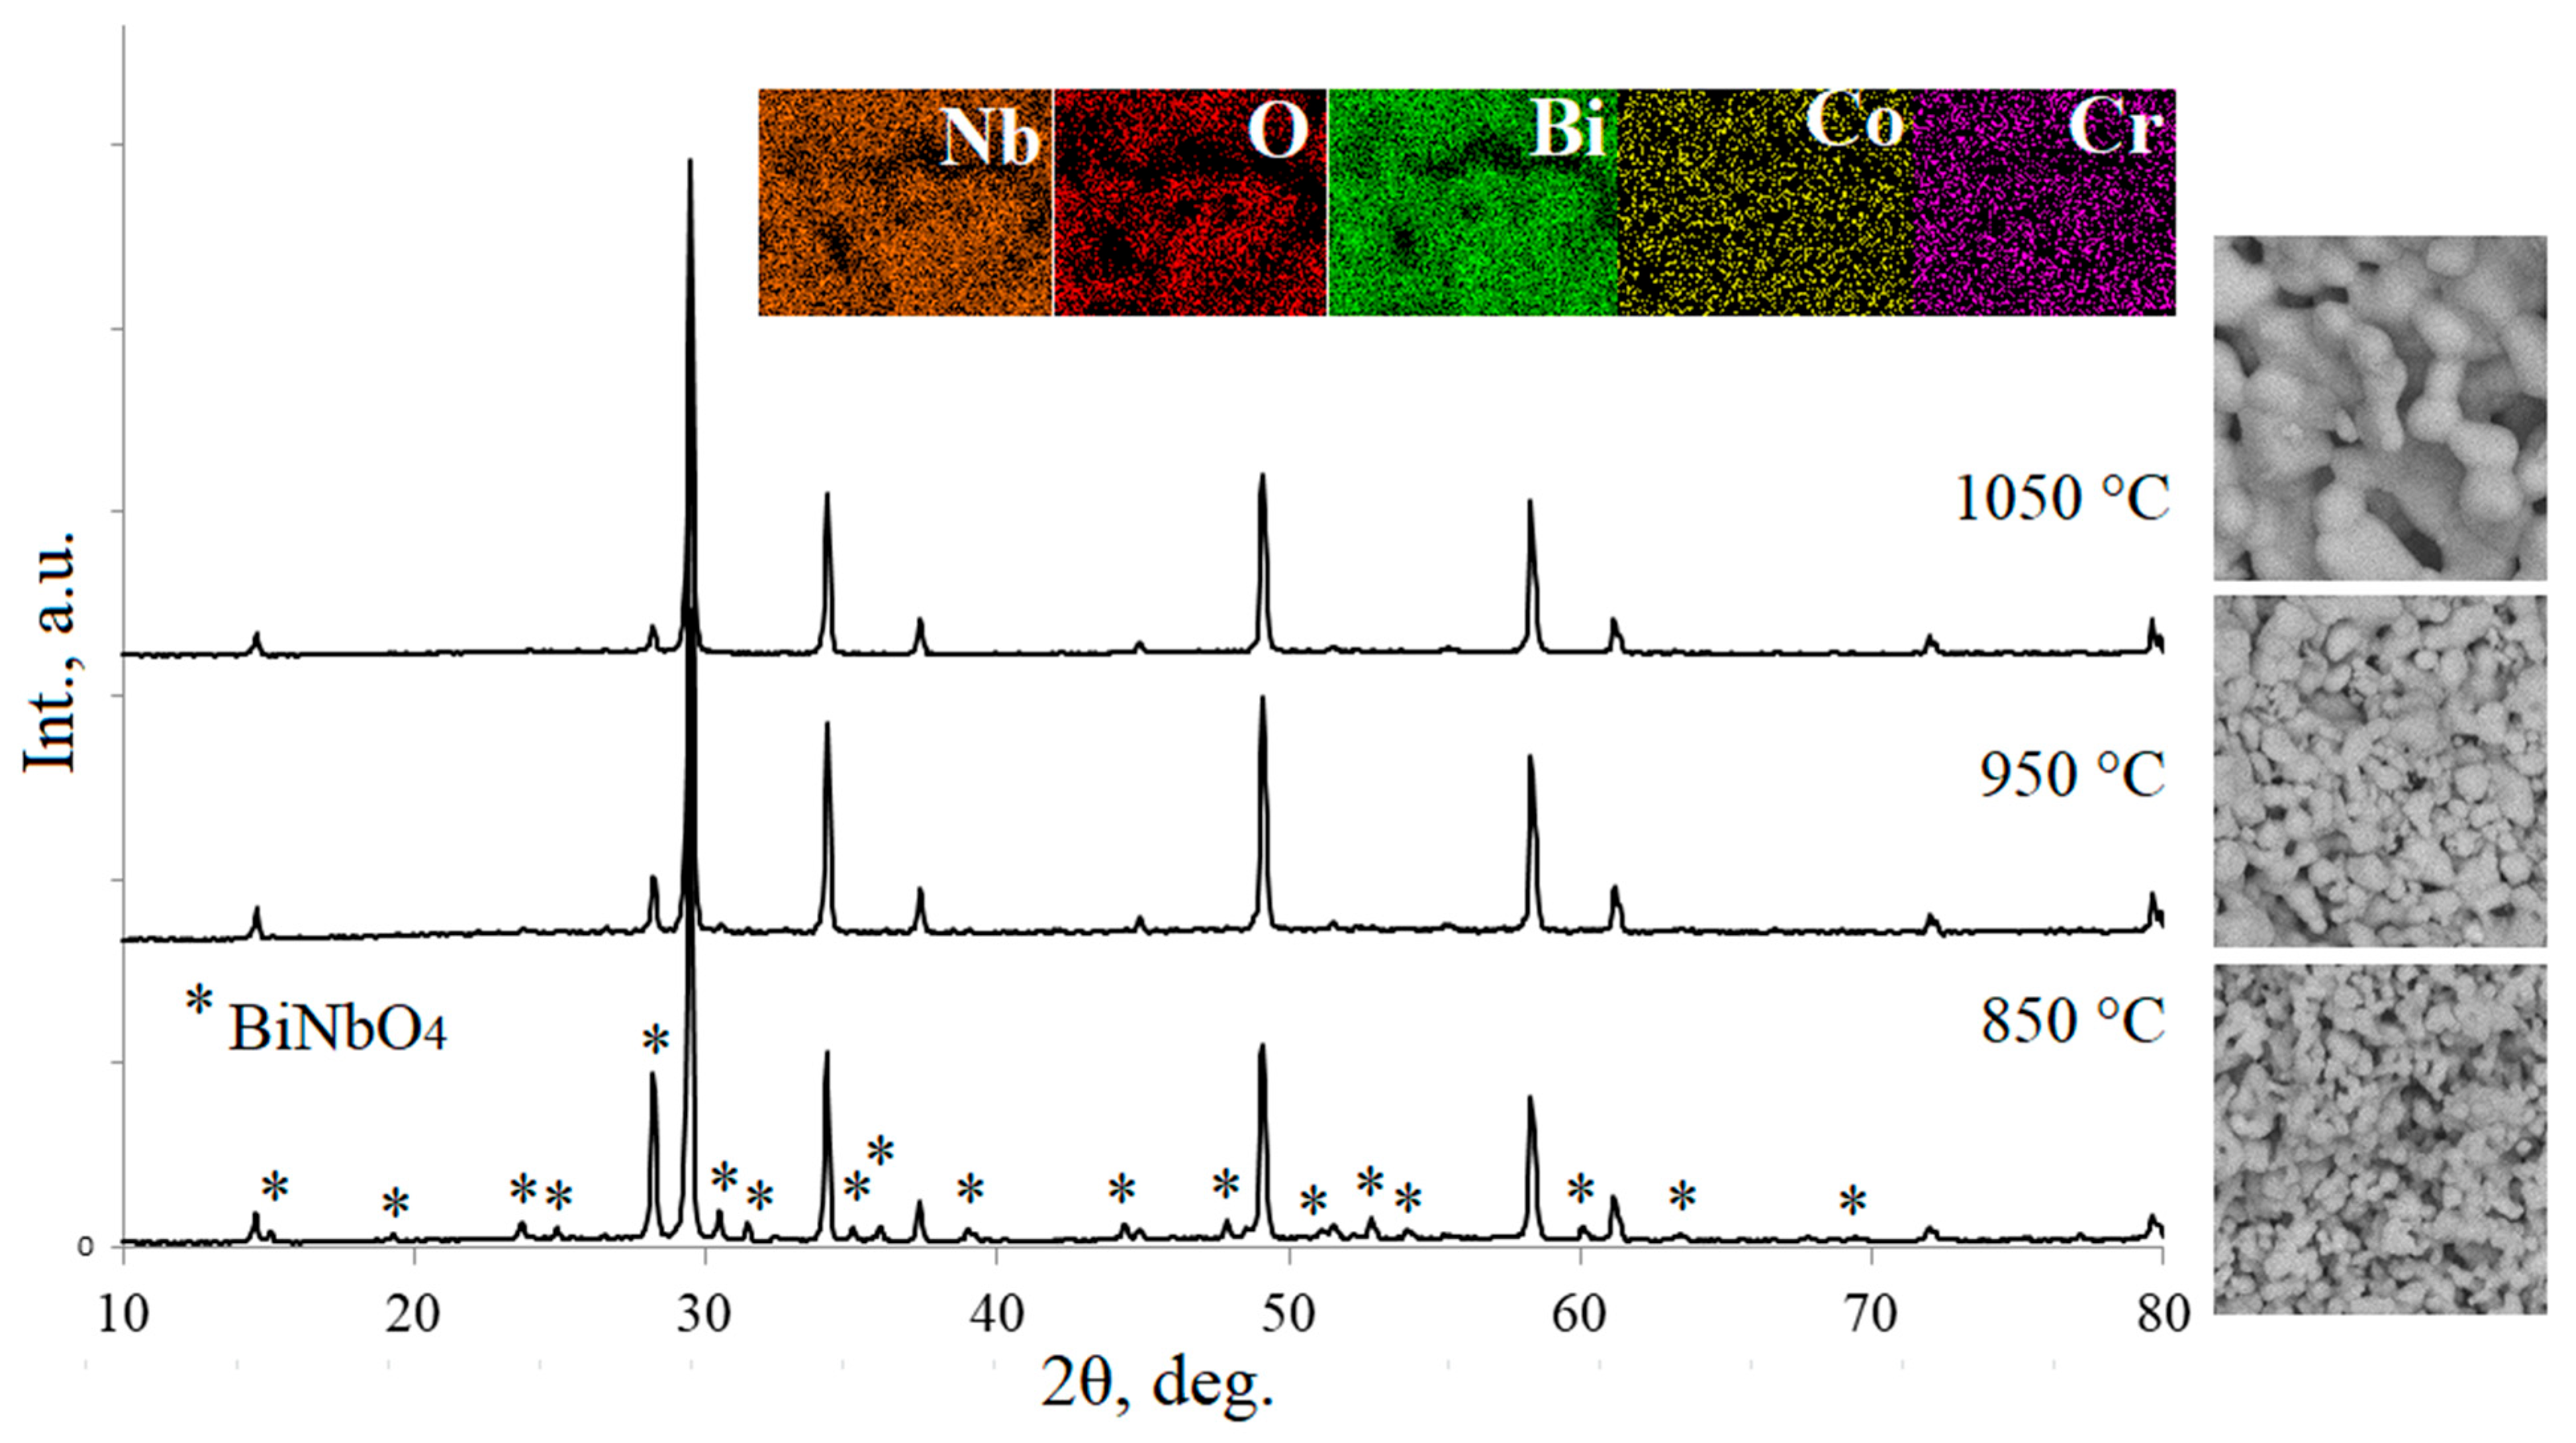
In order to overcome the disadvantages of the solid-phase synthesis method, we synthesized the sample using the sol–gel method (Pechini method). The advantage of synthesis by the Pechini method is a decrease in the final calcination temperature and the production of a nanocrystalline oxide with a nominally specified chemical composition. A transparent dark green solution was obtained after dissolving all oxide precursors and adding citric acid and ethylene glycol. The resulting solution was evaporated to an anhydrous graphite-colored mass, then pyrolyzed at 350 °C for 3 h. The resulting amorphous gray powder was ground to a homogeneous state in an agate mortar, the resulting precursor mixture was pressed into disk-shaped compacts and calcined in four stages at a temperature of 650, 750, 850, 950, 1050 °C to obtain a single-phase sample. The phase composition of the samples calcined in the range of 650–1050 °C for 15 hours was controlled by X-ray phase analysis. As shown in Figure 3, the sample calcined at 850 °C was not single-phase and contains an orthorhombic modification phase of bismuth orthoniobate BiNbO4 (sp. gr. Pnna) [34] as an impurity in an amount of 15.7 mol %. As shown by the XRD results, a calcination temperature of 950 °C was sufficient for the synthesis of a single-phase sample, and calcination at 1050 °C led to the formation of well-crystallized pyrochlore, as evidenced by the narrow peaks in the X-ray diffraction pattern. The average crystallite size determined by X-ray diffraction using the Scherrer formula varied from 39 (850 °C) to 48 nm (1050 °C) depending on the sintering temperature, while larger grains in the range of 0.2–2.0 μm (850 °C), 1–4 μm (950 °C) and 2–10 μm (1050 °C) (Figure 3) were determined using a scanning electron microscope (SEM). With an increase in the synthesis temperature, the ceramic grains coalesce into coarse agglomerates and the porosity of the ceramics decreased.
The unit cell parameter of the pyrochlore phase in samples calcined at 850–1050 °C slightly decreased from 10.4900(7) to 10.4872(6) Å, which is associated with obtaining well-crystallized and stoichiometric samples. The unit cell parameter of the Bi2Cr0.5Co0.5Nb2O9+Δ sample synthesized by the solid-phase method was almost comparable and was 10.4838(8) Å. The unit cell parameter of the synthesized pyrochlore significantly exceeded the unit cell constant for chromium-containing pyrochlore Bi2CrNb2O9+y (a = 10.459(2) Å) [35], which is explained by the larger radius of Co(II) ions compared to Cr(III) ions (R(Cr(III)) = 0.615 Å, R(Co(II))c.n. 6 = 0.745 Å) [33]. Since the radii of Ta(V) and Nb(V) ions ((R(Nb(V)/Ta(V))c.n.= 6 = 0.064 nm) [36] were equal, the lattice constants for bismuth niobate and tantalate-based pyrochlores can be comparable. Indeed, the unit cell parameter of Bi2CrTa2O9+Δ (a=10.45523(3) Å) [31] is comparable to that of chromium-containing niobium pyrochlore. Meanwhile, the unit cell parameter of the synthesized pyrochlore Bi2Cr0.5Co0.5Nb2O9+Δ was close to the unit cell parameter of the Bi2Cr0.5Mg0.5Nb2O9+Δ solid solution (a = 10.47702 Å), studied in [37], which was due to the proximity of the ionic radii (R(Mg(II) = 0.72 Å, R(Co(II))c.n.= 6 = 0.745 Å) [36]. The unit cell parameter for cobalt-containing pyrochlores based on bismuth tantalate Bi1.49Co0.8Ta1.6O7.0 a = 10.54051(3) Å and for Bi1.6Co0.8Ta1.6O7±Δ a = 10.5526 (2) Å significantly exceeds the parameter of chromium-cobalt-containing pyrochlore, which was associated with a significant difference in the radii of chromium (III) and cobalt (II) ions (R(Cr(III) = 0.615 Å, R(Co(II))c.n.= 6 = 0.745 Å) [36]. The element maps for the sample synthesized at 1050 °C show (Figure 3) a uniform distribution of the elements that make up the complex oxide over the surface of the sample. Local elemental analysis of the chemical composition of the samples synthesized at 850–1050 °C, carried out by the EDS method, showed that the experimental composition corresponded to the nominally specified one. At the same time, the molar ratios of the element atoms in the samples synthesized at different temperatures varied insignificantly. According to the EDS analysis, the sample synthesized at 850 °C corresponds to the composition Bi2.00Co0.50Cr0.55Nb1.94O9+Δ, at 950 °C–Bi2.00Co0.54Cr0.57Nb1.95O9+Δ, and at 1050 °C, it was close to the specified composition–Bi2.00Co0.54Cr0.56Nb1.98O9+Δ. Thus, the synthesis by the Pechini method allowed us to obtain phase-pure pyrochlores containing atoms of 3d-elements at a processing temperature 100 °C lower than in the case of the solid-phase synthesis method (950 °C), while a porous pyrochlore of a given composition is formed.
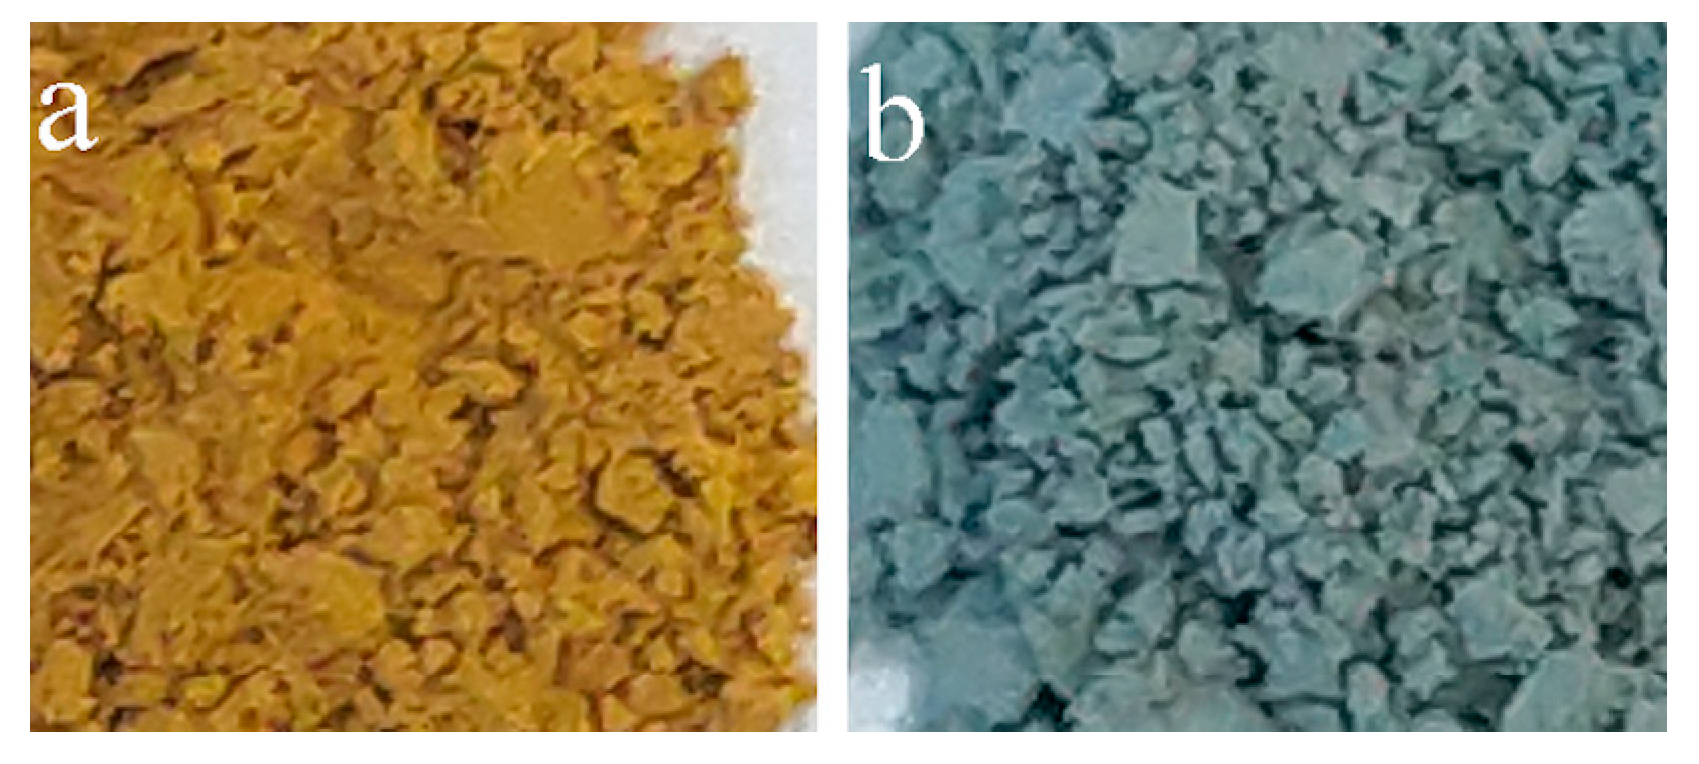
It is interesting to note that the color of the samples calcined at 650 °C and obtained during the synthesis by the ceramic method and the Pechini method differed significantly (Figure 4). As NEXAFS studies have shown, the orange color of the sample synthesized by the solid-phase method is imparted by the intermediate synthesis product-bismuth chromate containing Cr(VI) cations. Meanwhile, during the sol–gel synthesis method, orange bismuth(VI) chromate was not formed. After analyzing the phase composition of the sample at 650 °C, it was found that bismuth cations are concentrated in the composition of the Bi28O32(SO4)10 salt, which is thermally stable up to 880 °C, preventing the chemical interaction of bismuth(III) and chromium(III) oxides at low temperatures, around 500–700 °C. In summary, the charge state of the cobalt and chromium ions undergoes repeated changes during the synthesis process. However, in the high-temperature phase (1050 °C), their charge state stabilizes: Co2+ and Cr3+. It should also be noted that bismuth orthoniobate α-BiNbO4 plays an important role in the of intermediates, since its doping with transition element atoms leads to the formation of the pyrochlore phase. For the synthesis of complex oxide pyrochlores based on bismuth niobate by the Pechini method, the corresponding metal oxides can be used as precursors, selecting a sulfuric acid solution as a solvent. The citrate method made it possible to reduce the synthesis temperature of a single-phase sample of Bi2Cr0.5Co0.5Nb2O9+Δ by 100 °C, characterized by a highly porous granular microstructure formed by nanosized crystallites.
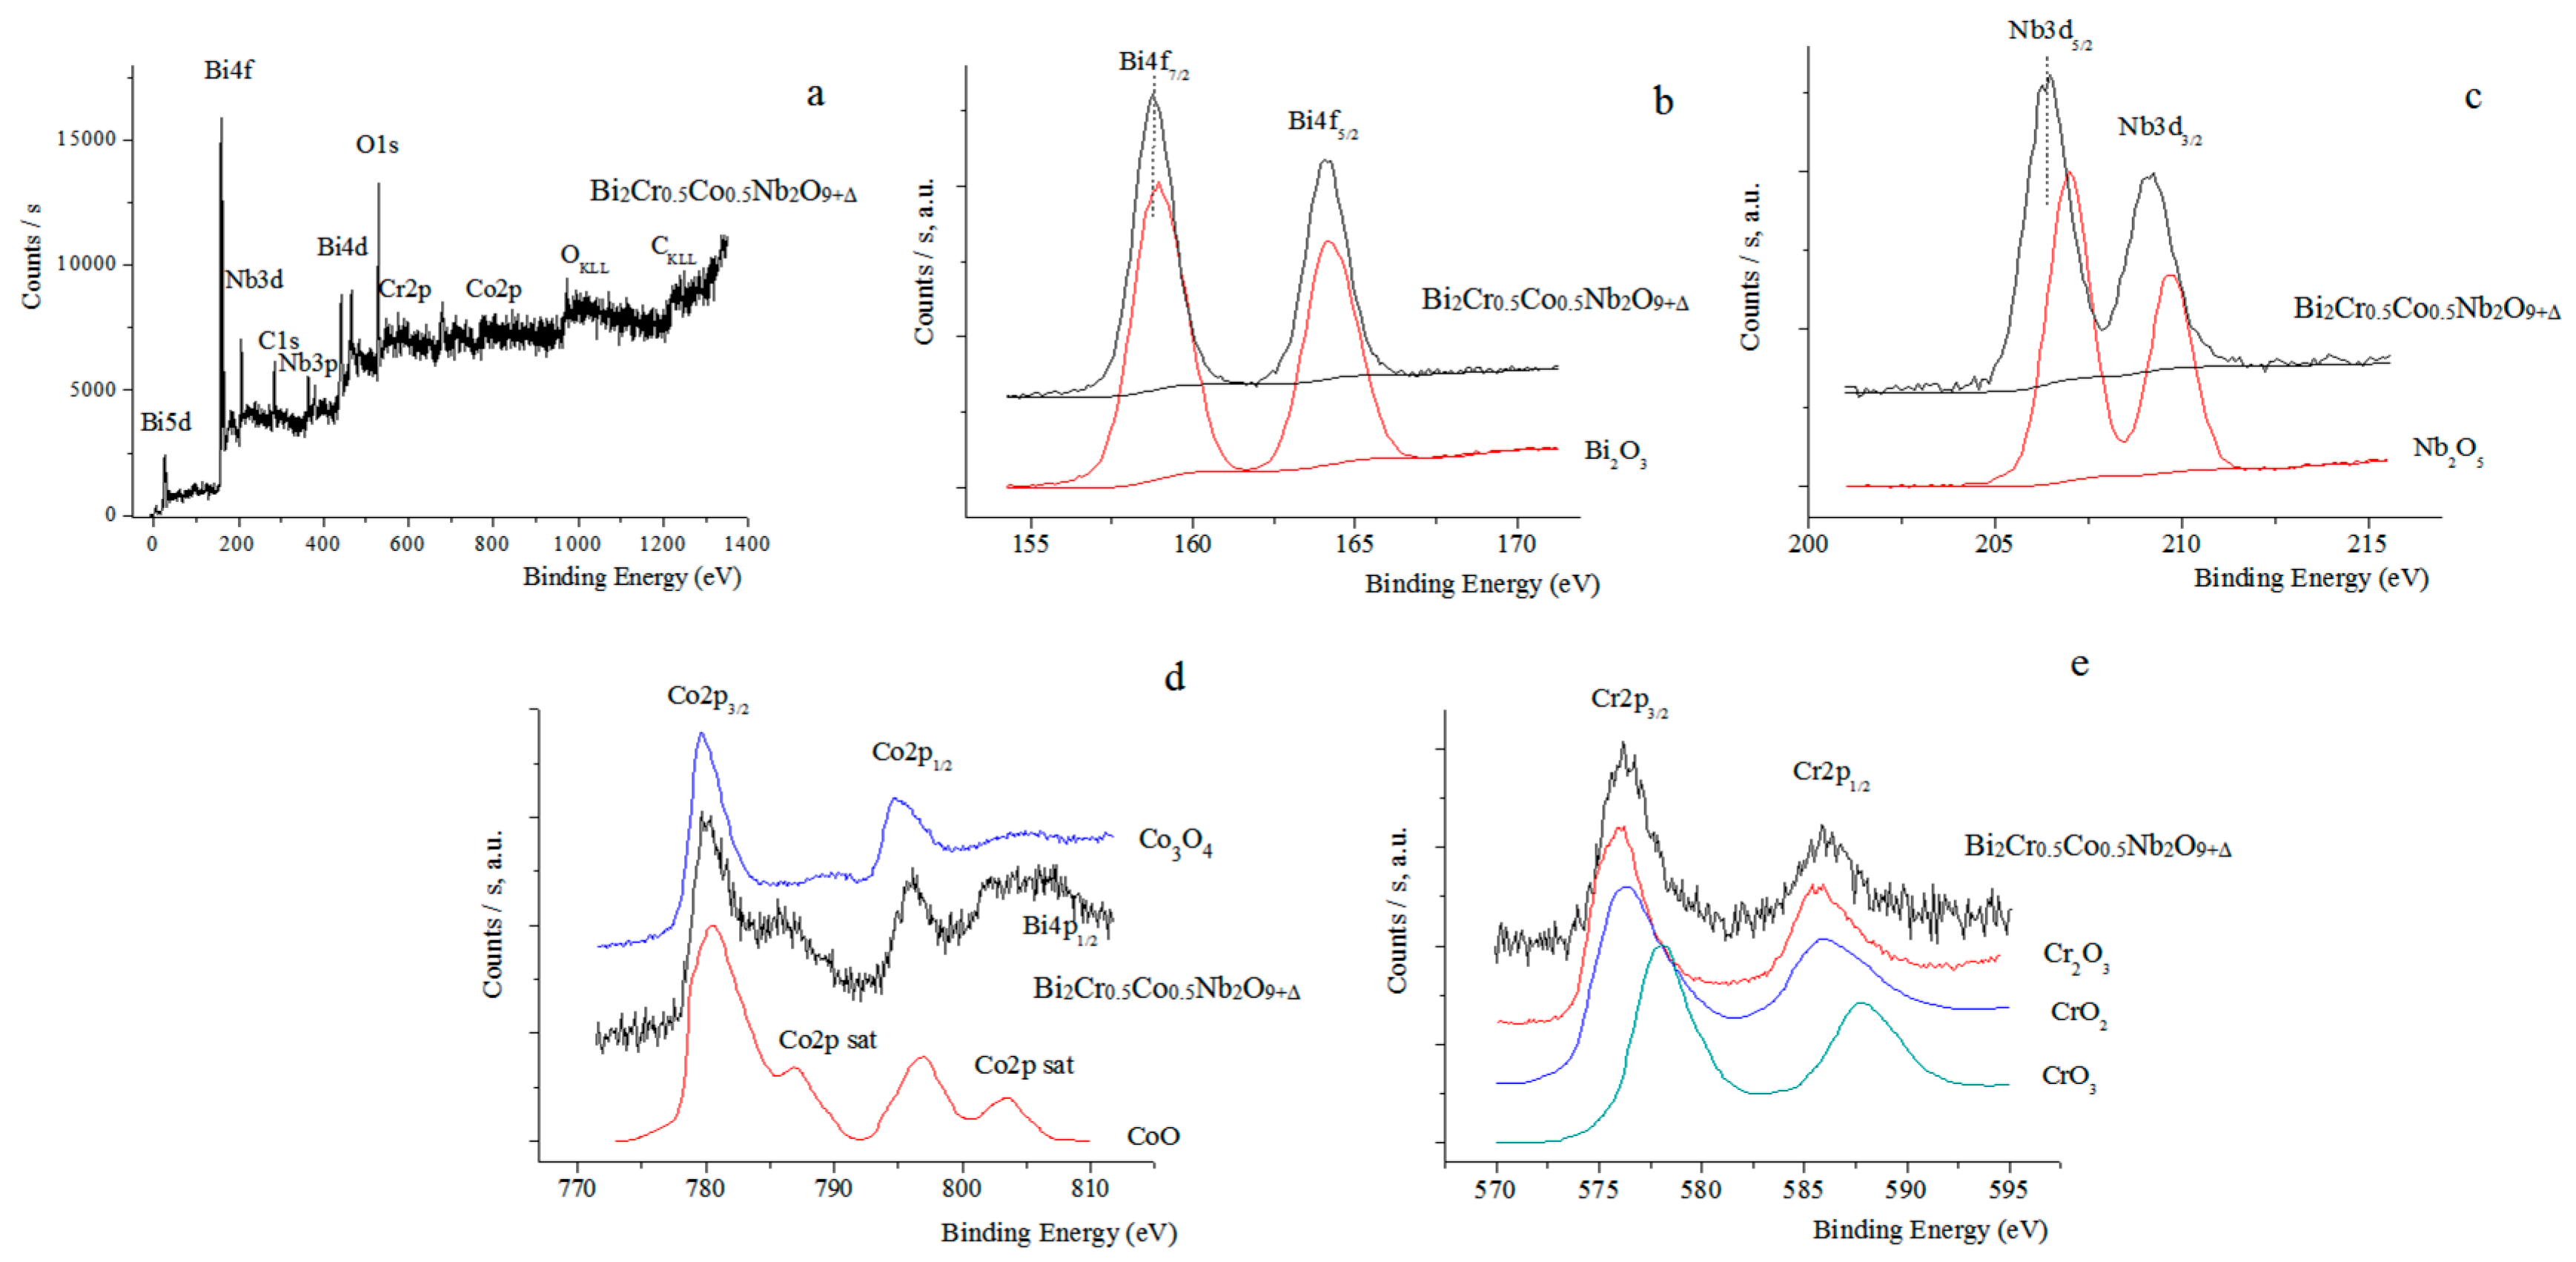
The charge state of cations in the synthesized pyrochlore Bi2Cr0.5Co0.5Nb2O9+Δ was also studied by the XPS method (Figure 5). The energy position of the XPS spectral details is presented in Table 1. For comparison, the spectra of the initial oxides–precursors are shown in each figure. Figure 5a shows the XPS spectra in a wide energy range, and Figure 5b–e show the spectral dependences in the region of the Bi5d, Nb3d, Co2p, and Cr2p ionization thresholds. When comparing the spectra of bismuth(III) and niobium(V) cations in pyrochlore and in the oxides Bi2O3 and Nb2O5 (Figure 5b,c), we came to the conclusion that the bismuth and niobium cations do not have variable oxidation states. The energy position of the peaks in the Bi4f and Nb3d spectra shifted to the region of lower energies compared to the binding energy in the trivalent oxide Bi2O3 and pentavalent niobium oxide Nb2O5. The shift in the characteristic bands in the Bi4f and Nb3d spectra by ΔE = 0.2 and 0.55 eV is typical of a decrease in the effective positive charge of the bismuth and niobium cations to +(3-δ) and +(5-δ), respectively. A decrease in the effective charge of the bismuth and niobium cations can be associated with the distribution of a portion of the low-charge cations of the transition elements in the niobium and bismuth positions. The largest shift in the Nb3d spectrum compared to the Bi4f spectrum indicated that the cations of the transition elements were predominantly distributed in the Nb(V) position.
The energy range of the Co2p spectrum, near 805 eV, contains the peak responsible for the binding energy of the Bi4p1/2 level (Figure 5d), which complicates the perception of the cobalt spectra. Meanwhile, when comparing the pyrochlore spectrum with the spectra of Co3O4 obtained by us and CoO known from the literature [38], it can be noted that the energy position of the main peaks in the pyrochlore spectrum practically coincides with the CoO spectrum. In both spectra, satellite peaks at 786 and 803 eV were clearly defined, characteristic of doubly charged Co(II) cations. In this case, it can be assumed that the cobalt cations in pyrochlore predominantly have an oxidation state of +2, which does not contradict NEXAFS studies. The Cr2p spectra of mixed pyrochlore and chromium oxides are shown in Figure 5e. The shift in the pyrochlore spectrum relative to the Cr2p spectrum of Cr2O3 oxide to the high-energy region and insufficient selectivity of the broadband pyrochlore spectrum give reason to believe that the chromium cations in pyrochlore have an average charge state different from +3. In this case, it can be mistakenly assumed that the Cr2p spectrum of pyrochlore is a superposition of subspectra from chromium cations in the charge state +3, +4, +6. Meanwhile, as NEXAFS spectra showed, chromium cations predominantly have the charge state +3.

3.2. Crystal Structure

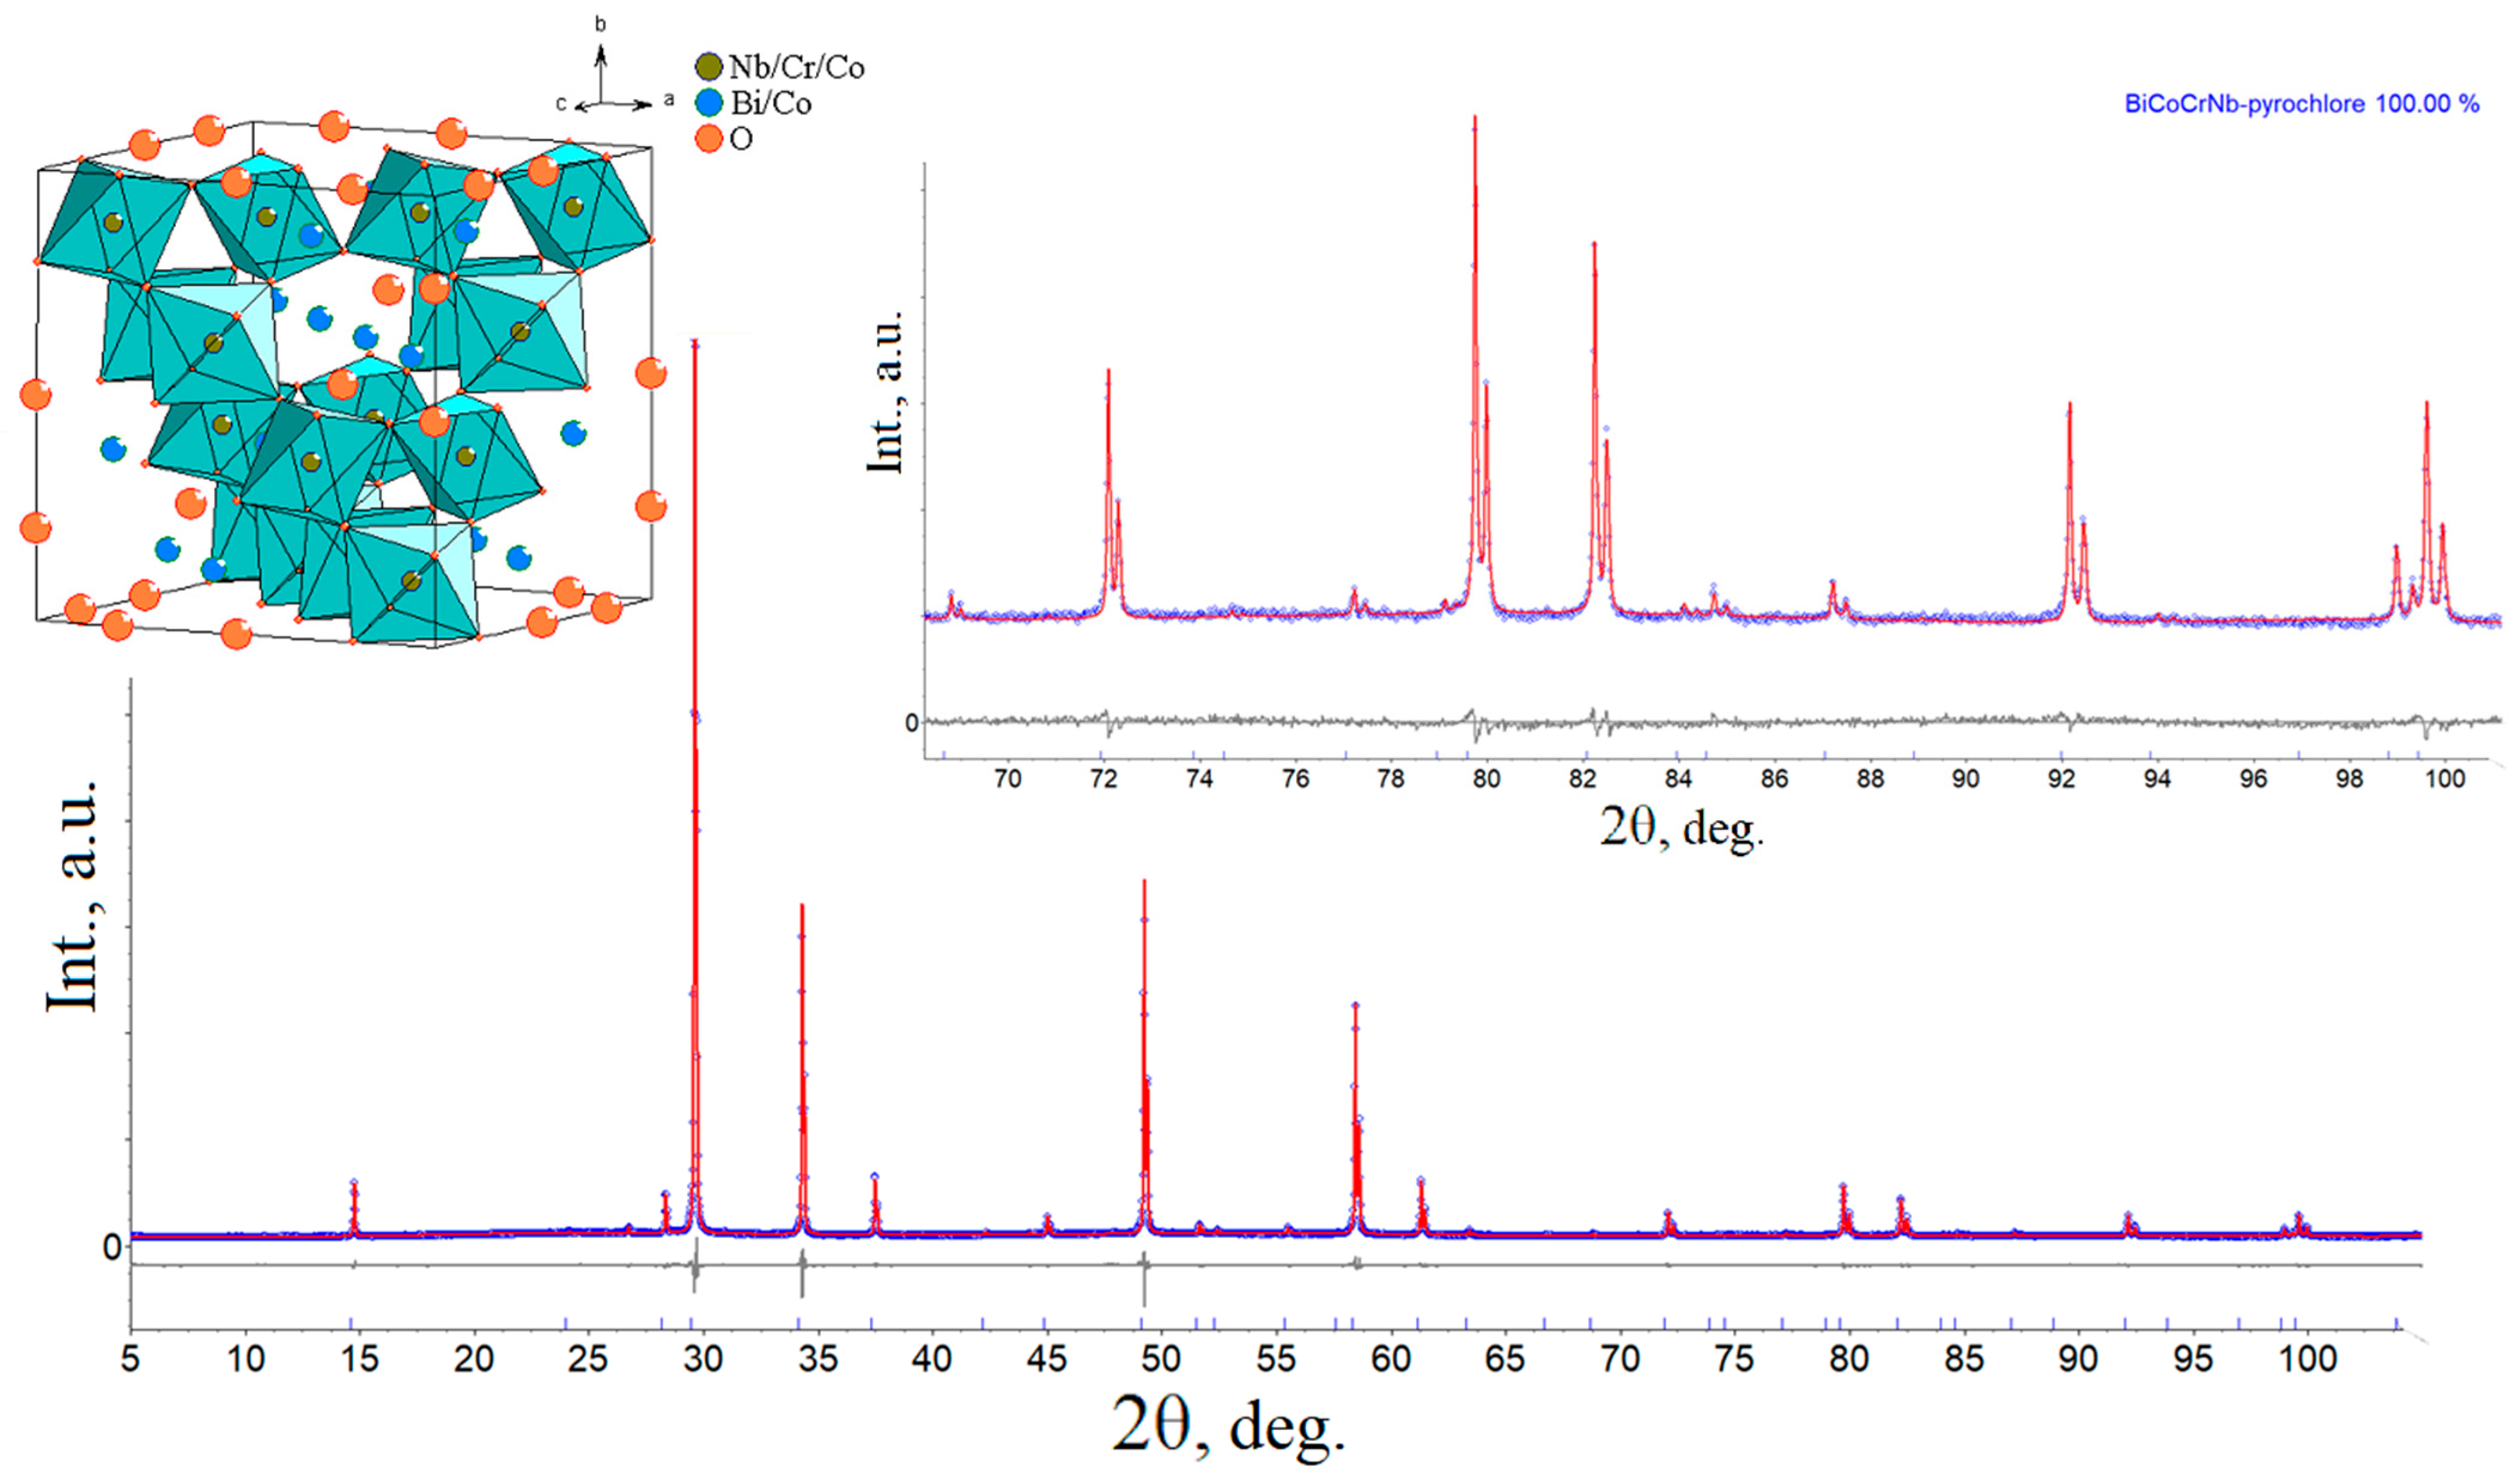
The crystal structure of Bi2Cr0.5Co0.5Nb2O9+Δ (PM) was refined using the powder data obtained at 23 °C using the Topas 5.0 software package. The Thompson-Cox-Hastings pseudo-Voigt function was used to describe the peak profile. Neutral scattering factors were used for all atoms. The ideal pyrochlore structure (sp. group Fd-3m) was adopted as the initial model of the crystal structure, and the occupancy was determined in accordance with the stoichiometry of the composition. In the ideal pyrochlore structure A2B2O6O’, two cationic 16c (A), 16d (B) and oxygen 48f (O), 8a (O’) positions are determined. In most cases, the 16c and 8a positions are disordered due to the displacement of the A and O’ atoms from their ideal positions (A from 16c to 96h or 96g; O’ from 8a to 32e or 96g) [10,11]. For the best description of the X-ray diffraction profile, a model of disordered pyrochlore was considered, in the structure of which the bismuth atoms are shifted to the 96g position, and the oxygen atoms are distributed over 48f and 8a with incomplete occupancy. The octahedral positions were completely occupied and shared between the ions of 3d elements and niobium(V).
The stoichiometric formula determined as a result of the structure refinement corresponded to a composition with a deficient sublattice of bismuth and oxygen cations–A1.57B2O6.71 (or, in the first approximation, Bi1.57Cr/Co0.33Nb1.32O6.71). The vacancy of the bismuth sublattice was 21.6%. The only thing was that the obtained stoichiometric composition did not coincide with the nominal composition included in the batch, this can be noticed by comparing the amounts of bismuth and niobium ions. A simple recalculation of the composition, which was based on the stoichiometry of the original composition (n(Bi) = n(Nb) = 4n(Cr) = 4n(Co), n(X) was the number of X atoms in the nominal composition of pyrochlore) and on the fact that the bismuth sublattice was 21.6% vacant in relation to the niobium sublattice, and the niobium sublattice is completely filled with niobium(V) and cobalt(II) cations, chromium(III). As a result of the calculation, the composition [Bi1.427Co0.1410][Co0.2158 Cr0.35684Nb1.427]O6.71 was obtained, in which 39.5% of the total number of cobalt ions (or 19.75 at.% of the number of 3d elements) was distributed into the bismuth sublattice, which agrees with the initial stoichiometry of the composition. The cobalt cations in the bismuth sublattice were at 12.6%. The final results of refining the pyrochlore structure for the composition (BiCo)2(Nb,Co,Cr)2O7 that were obtained by the Rietveld method in the space group Fd-3m2 (227) are presented in Table 2 and Table 3. The experimental, calculated, and difference X-ray diffraction patterns for Bi2Cr0.5Co0.5Nb2O9+Δ are shown in Figure 6.
Atomic parameters (Table 2) and selected bond lengths of Bi2Cr0.5Co0.5Nb2O9+Δ are given in Table 4, respectively.
The crystal structure of pyrochlore is formed by two cationic sublattices, one of which consists of B2O6 octahedra connected by their vertices, and the other of anion-centered [O2A4] tetrahedra. According to X-ray structural modeling, the niobium atoms form a regular octahedron NbO6, in which all Nb–O bonds (Table 4) have an average length of ~1.99 Å. The coordination polyhedron of bismuth atoms is a distorted eight-vertex polyhedron BiO8, in which two pairs of bonds are noticeably longer than the other two pairs.
The reason for the asymmetry of the bismuth atom polyhedron may be the stereo-active 6s2 pair [39]. Individual interatomic distances in the BiO8 polyhedron vary from 2.30 to 2.98 Å (Table 4). It is interesting to note that chromium pyrochlore Bi2CrTa2O9+Δ (a = 10.45523(3) Å) had similar geometric parameters Ta–O bond length ~1.98 Å, individual interatomic distances in the BiO8 polyhedron vary from 2.29 to 2.97 Å. In cobalt-containing pyrochlore, Bi1.49Co0.8Ta1.6O7.0 (a = 10.54050(3) Å) tantalum/cobalt atoms form a regular TaO6 octahedron with the ~2.004 Å length of Ta-O bond. Individual interatomic distances in the BiO8 polyhedron vary from 2.35 to 2.91 Å, of which the distances to the octahedral frame atoms are longer and vary from 2.76 to 2.91 Å. As can be seen from the comparison, despite the noticeable differences in the unit cell parameters, the geometric parameters do not change significantly.

3.3. Thermal Expansion

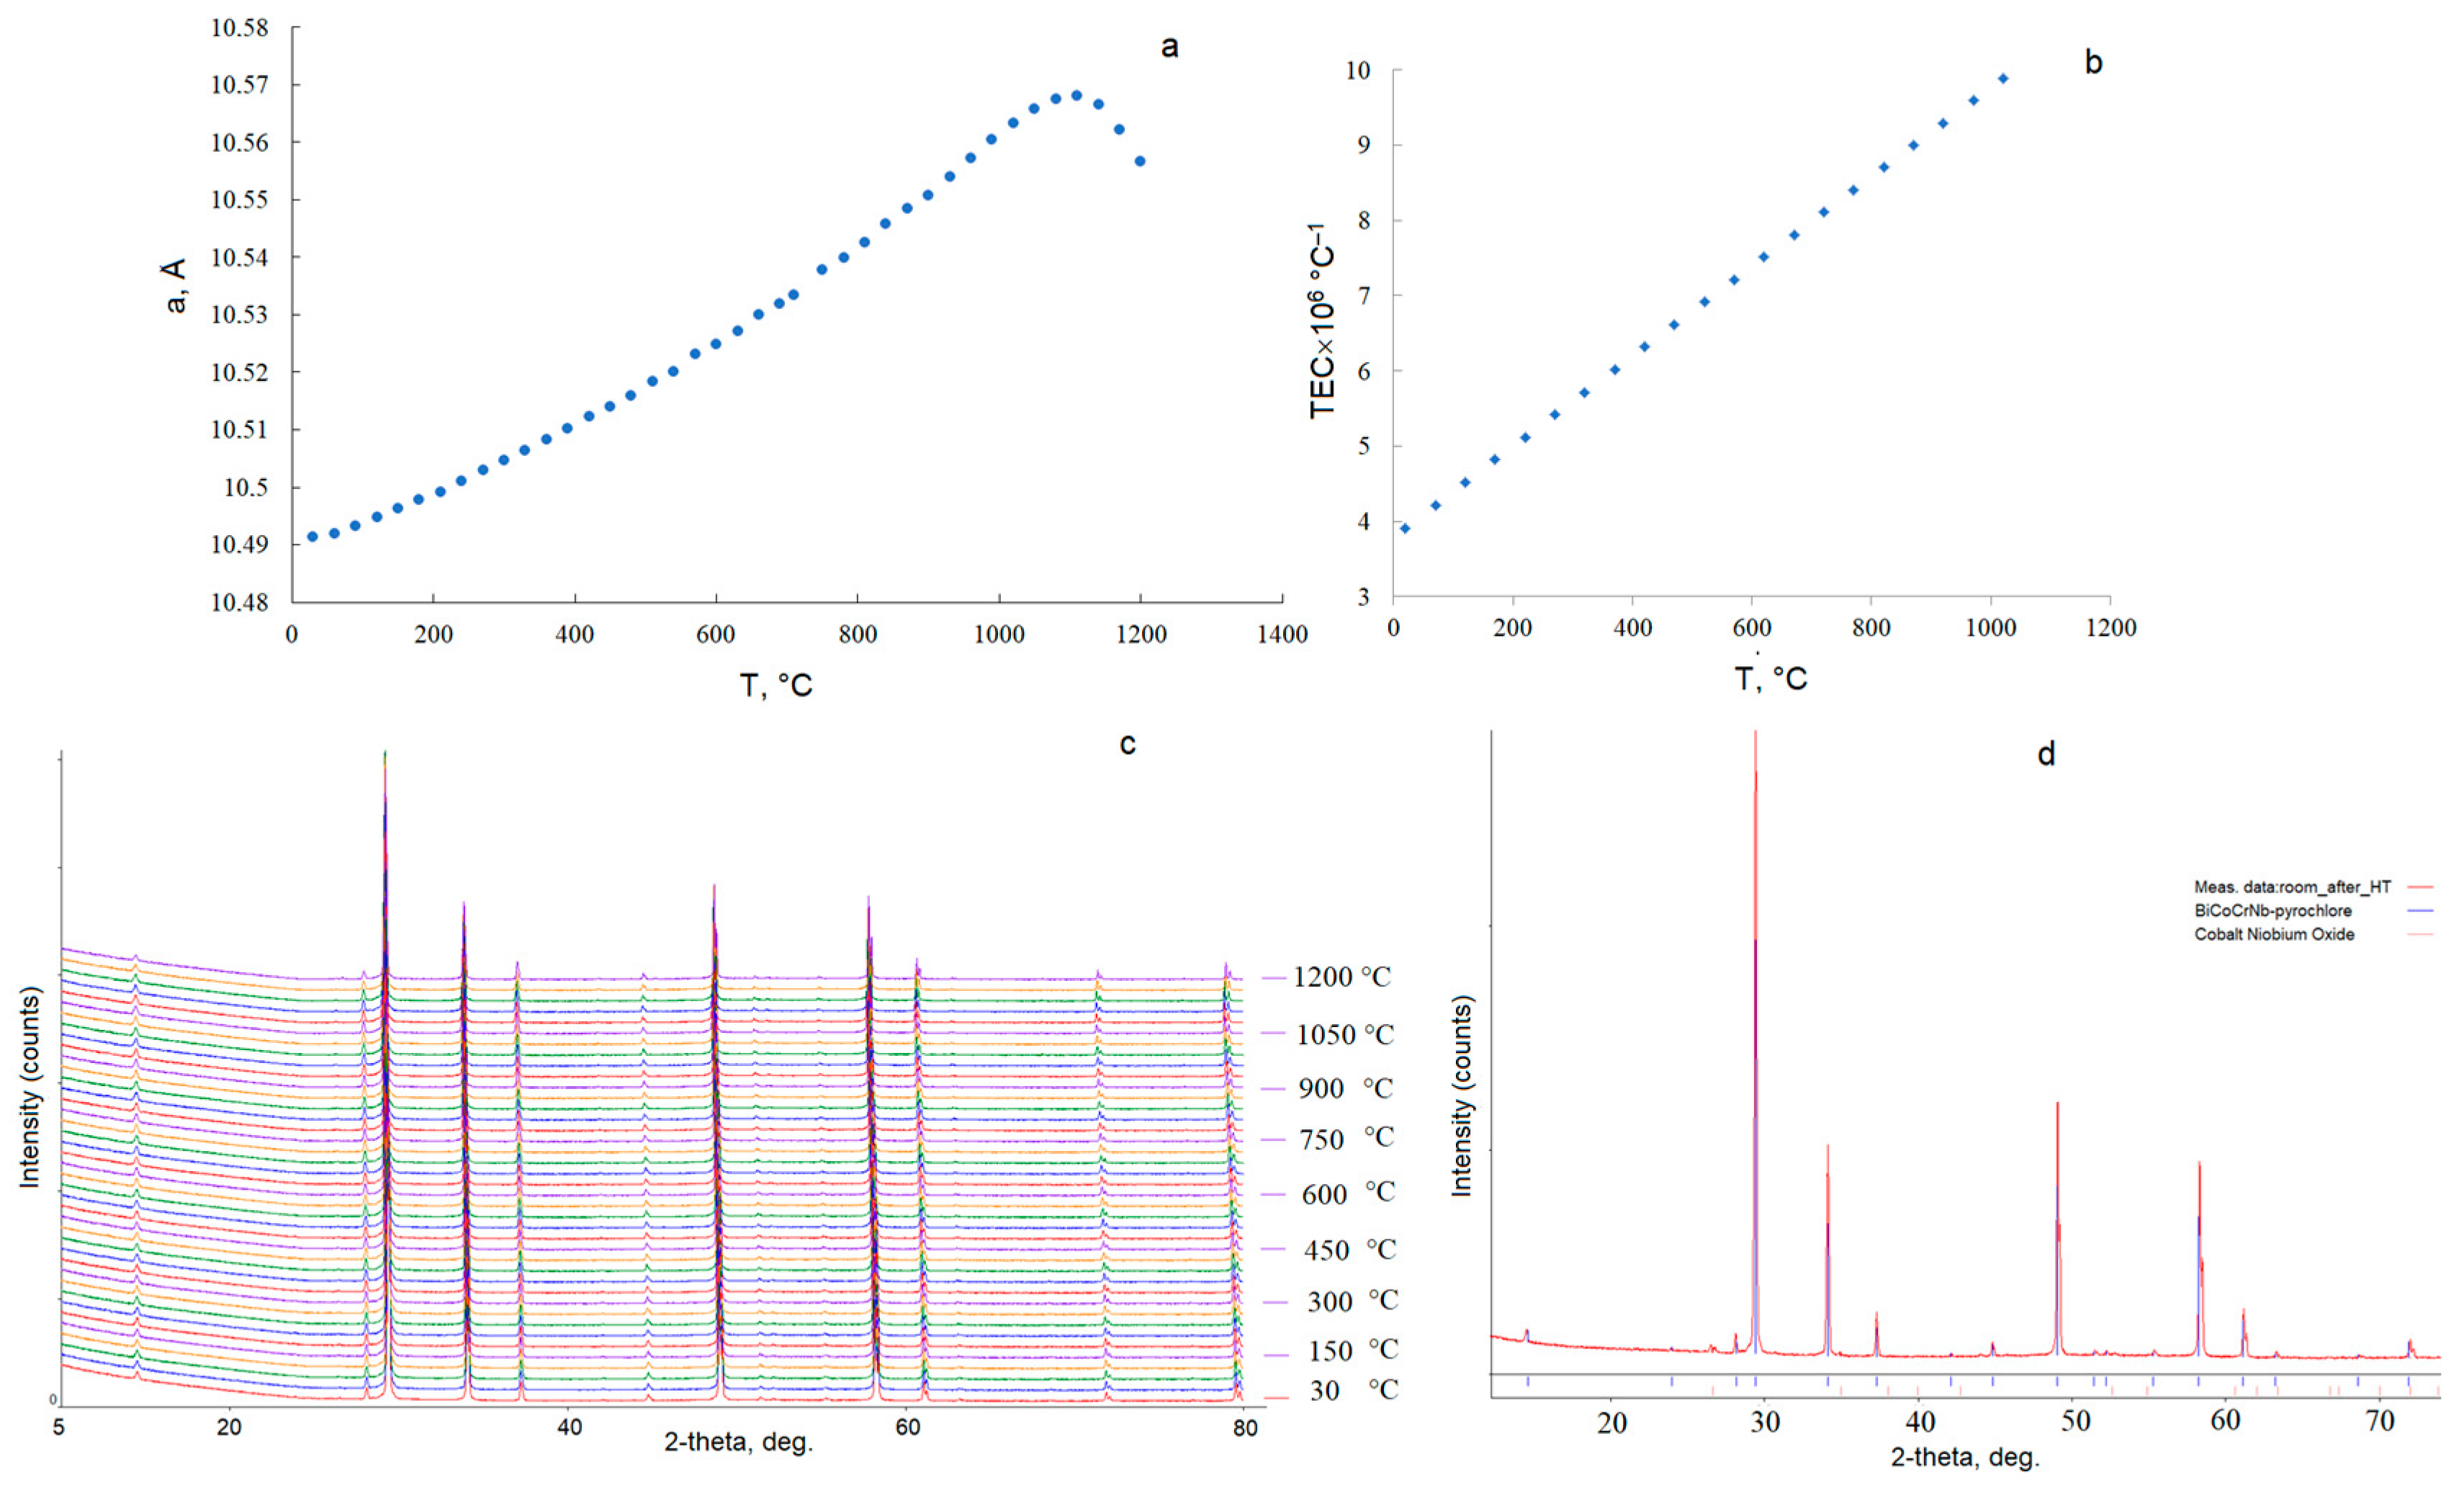
Based on the high-temperature X-ray diffraction data of the Bi2Cr0.5Co0.5Nb2O9+Δ sample, thermal expansion studies were performed in a wide temperature range of 30 ÷ 1200 °C with a step of 30 °C (Figure 7, Table 5). The temperature dependence of the unit cell parameter is shown in Figure 7a. Based on the polynomial approximation (second-degree polynomial) of the temperature dependence of the unit cell parameter, the values of the coefficient of thermal expansion (TEC) α were calculated at different temperatures (Table 5, Figure 7b).
The analysis of the thermal behavior of Bi2Cr0.5Co0.5Nb2O9+Δ showed that the mixed pyrochlore belonged to medium-expanding materials. With increasing temperature, the unit cell parameter a increased nonlinearly—the expansion intensity increased upon heating—from 10.49 Å (30 °C) to 10.56 Å (1200 °C), passing through a maximum of 10.5680 Å at 1110 °C. The decrease in the unit cell parameter above 1110 °C is associated with the thermal dissociation of pyrochlore. As shown by the results of the thermal X-ray diffraction, the X-ray diffraction pattern of the sample (Figure 7c,d) heated to 1200 °C and cooled to room temperature showed reflections of pyrochlore and the impurity phase CoNb2O6, which does not contain bismuth ions. The formation of cobalt(II) niobate was associated with partial evaporation of bismuth at high temperatures. Previous studies of the thermal stability of nickel-containing pyrochlore based on bismuth niobate Bi2NiNb2O9 showed that at temperatures above 1110 °C, bismuth(III) oxide evaporates and an impurity phase of NiNb2O6 formed, which was also recorded during sample cooling. Based on the studies conducted, we can talk about the similarity of the mechanism of thermal destruction of pyrochlores based on bismuth niobate/tantalate, which is associated with volatility and removal of bismuth(III) oxide at high temperatures close to 1080–1100 °C. At the same time, a moderate effect of dopant atoms-transition 3d elements on the stability of pyrochlores can be noted. Multicharged cations stand out as dopants, which are capable of extending the temperature range of pyrochlore stability by several tens of degrees (up to 1110 °C), which is apparently due to a stronger covalent bond M-O in the octahedron and a smaller number of oxygen vacancies with a charge of 3+. It is necessary to pay attention to the temperatures of thermal dissociation of two pyrochlores—for tantalum pyrochlore it is reproducibly lower. The reason for this may be the rigidity of the Ta-O bond compared to Nb-O, which may be due to the highest degree of ionicity of the bond.
Thermal expansion of the cubic structure of Bi2Cr0.5Co0.5Nb2O9+Δ is isotropic, which corresponds to a uniform distribution of bond forces in the pyrochlore structure. TEC varies from 3.9 to 9.9 × 10⁻⁶ °C−1 in the temperature range of 20–1020 °C, the average value of TEC in this temperature range is 6.9 × 10⁻⁶ °C−1. The calculated value of the thermal expansion coefficient is comparable for nickel pyrochlore Bi2NiNb2O9 based on bismuth niobate, for which the average value of TEC in the range of 30–990 °C is 6.4 × 10⁻⁶ °C−1. For monodoped pyrochlores based on bismuth tantalate, the average TEC values in the temperature range of 30–1200 °C are equal to 6.9 × 10¹⁰−6 °C−1 for Bi1.6Cr0.8Ta1.6O7.6 and 6.4 × 10⁻⁶ °C−1 for Bi1.49Co0.8Ta1.6O7.0. A comparison of the TEC values for pyrochlores does not reveal any significant differences. It is interesting to note that for magnesium-containing pyrochlores Bi2Mg(Ta)Nb2O9, niobium pyrochlore is characterized by the highest TEC values compared to tantalum. According to [40], the average TEC values for Bi2MgM2O9 in the range of 30–800 °C are 5.6 × 10⁻⁶ °C−1 (6.4 × 10⁻⁶ °C−1) for M = Ta (Nb), respectively. As it is easy to see, niobium pyrochlores demonstrate greater thermal expansion compared to tantalum pyrochlores, and doping of pyrochlores into the octahedral sublattice does not significantly change the nature of the thermal behavior of pyrochlores. Isotropy of thermal behavior and the average TEC value (6.9×10⁻⁶ °C−1) are typical for compounds with a pyrochlore framework structure [41,42,43,44]. For example, for pyrochlore Pr2Zr2O7 the coefficient of average linear thermal expansion in the range of 298–1073 K is 10.18 × 10⁻⁶ K−1, for Ce2Zr2O7 in the range of 298–898 K it is equal to 9.57 × 10⁻⁶ K−1 Raison et al. [42]. The coefficients of thermal expansion of a number of rare earth zirconates Ln2Zr2O7 (Ln = Nd, Sm, Eu, Gd, Er, Yb and Lu) vary in the range of 7.80 ÷ 8.57 × 10⁻⁶ K−1 [43,44]. The coefficients of thermal expansion calculated by us for Bi2Cr0.5Co0.5Nb2O9+Δ fit satisfactorily into the given values for compounds with the pyrochlore structure, confirming the thesis about the rigidity of the bonds of the framework structures.

3.4. Electrical Properties

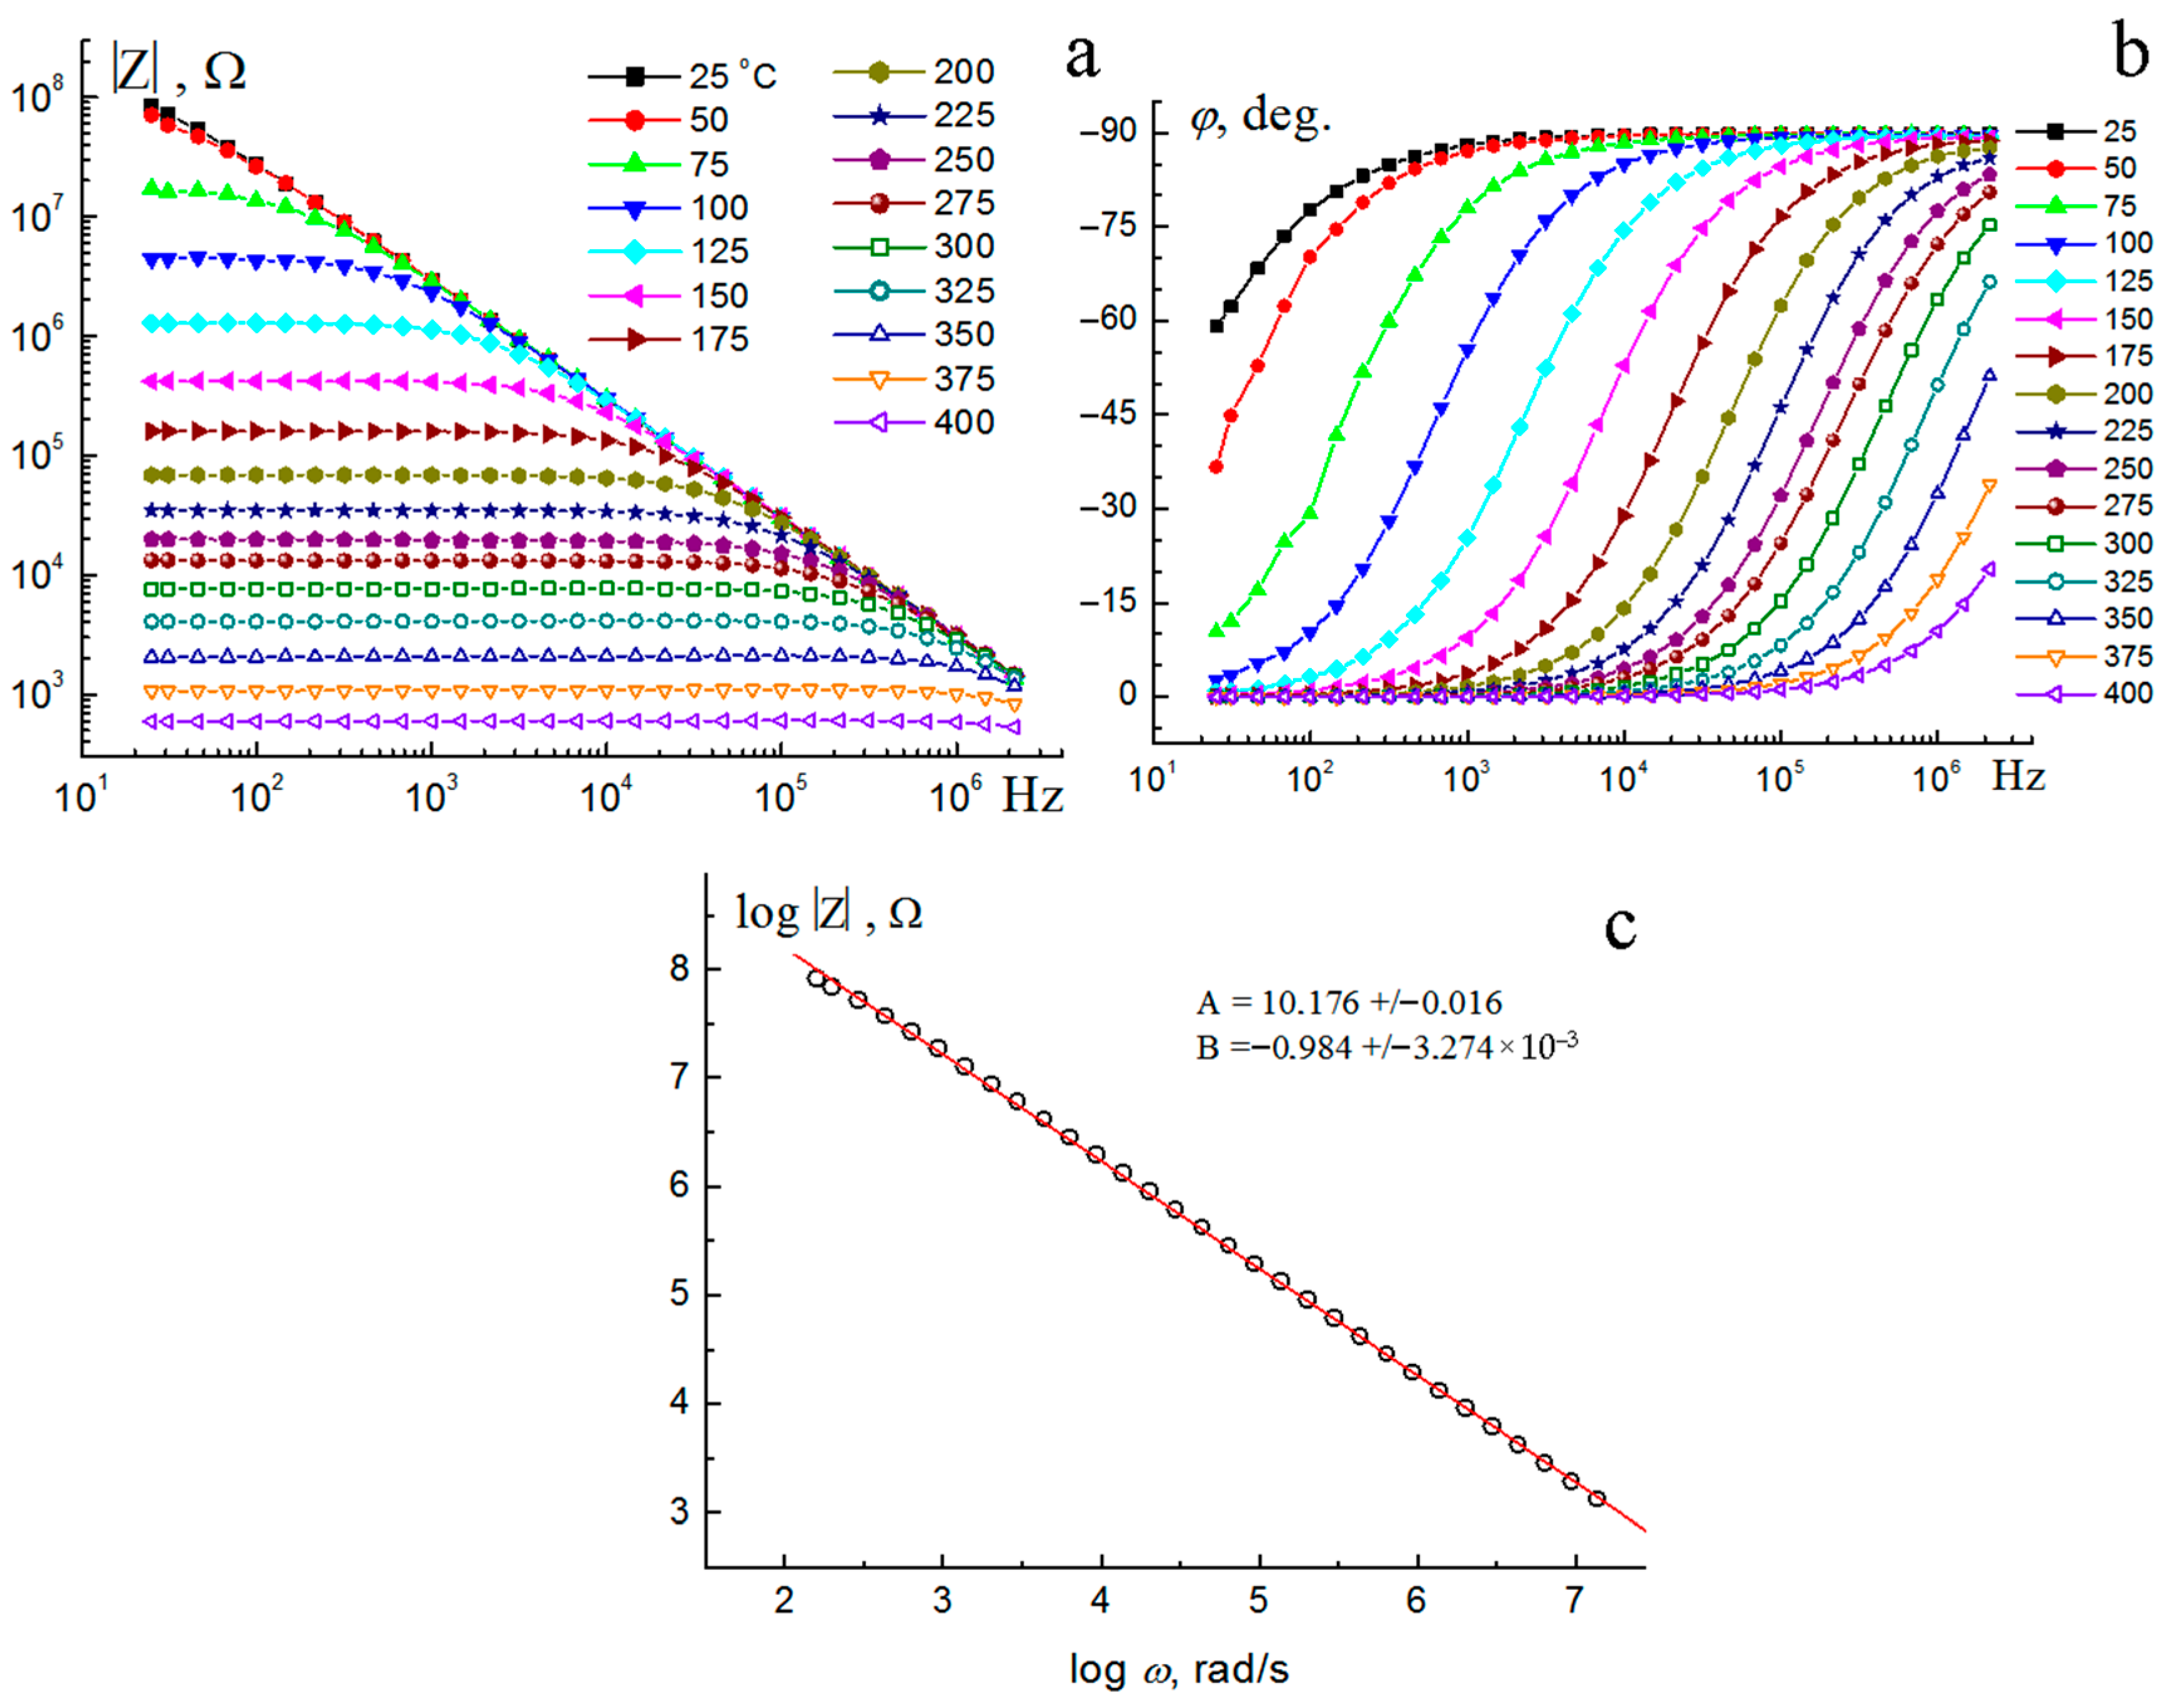
The electrical properties of the Bi2Cr0.5Co0.5Nb2O9+Δ sample synthesized by the sol–gel synthesis method were studied in the temperature range of 25–400 °C at a frequency of 25–1 MHz (Figure 8). Figure 8a,b show the frequency dependences of the impedance modulus and phase angle as a function of temperature. As Figure 8a shows, the impedance modulus of the sample up to 75 °C is proportional to the current frequency over the entire frequency range, which predominantly indicates the flow of capacitive current in the sample. With increasing temperature, the through conductivity begins to prevail over the capacitive conductivity, which is reflected in the frequency independence of the impedance modulus, which is especially noticeable in the low-frequency region. The independence of the impedance modulus from frequency is manifested at a sample temperature above 400 °C. At this temperature, the through current flows. As noted above, the sample at room temperature (25 °C) exhibits purely capacitive conductivity, as a result of which the slope angle of the impedance modulus line is 45° with high accuracy (Figure 8c). This allows us to determine the high-frequency capacitance of the sample using the following formula [45,46]: C = 10 12 A 2 π , where A is the parameter of the approximating line, which has the following formula: log Z = A + B log f ; f is the frequency in Hz; B—numerical parameter. If the impedance is purely capacitive, then log Z = log C log ω . Hence C = 10 A F = 10 1.824 p F = 66.7 p F . The relative error is 0.4%. The relative permittivity does not depend on the frequency and is equal to ε = 98.7 ± 0.6.
The change in the phase angle depending on the frequency and temperature is shown in the figure (Figure 8b). As we can see, at room temperature the phase angle differs slightly from the right angle at low frequencies, which may be a consequence of moisture sorption by the sample surface. At high frequencies (106–103 Hz) the phase angle maintains a value of 90º, indicating the flow of predominantly displacement currents. With increasing temperature, at low frequencies, the capacitive current gives way to through conductivity, which shows the tendency of the phase angle to zero.
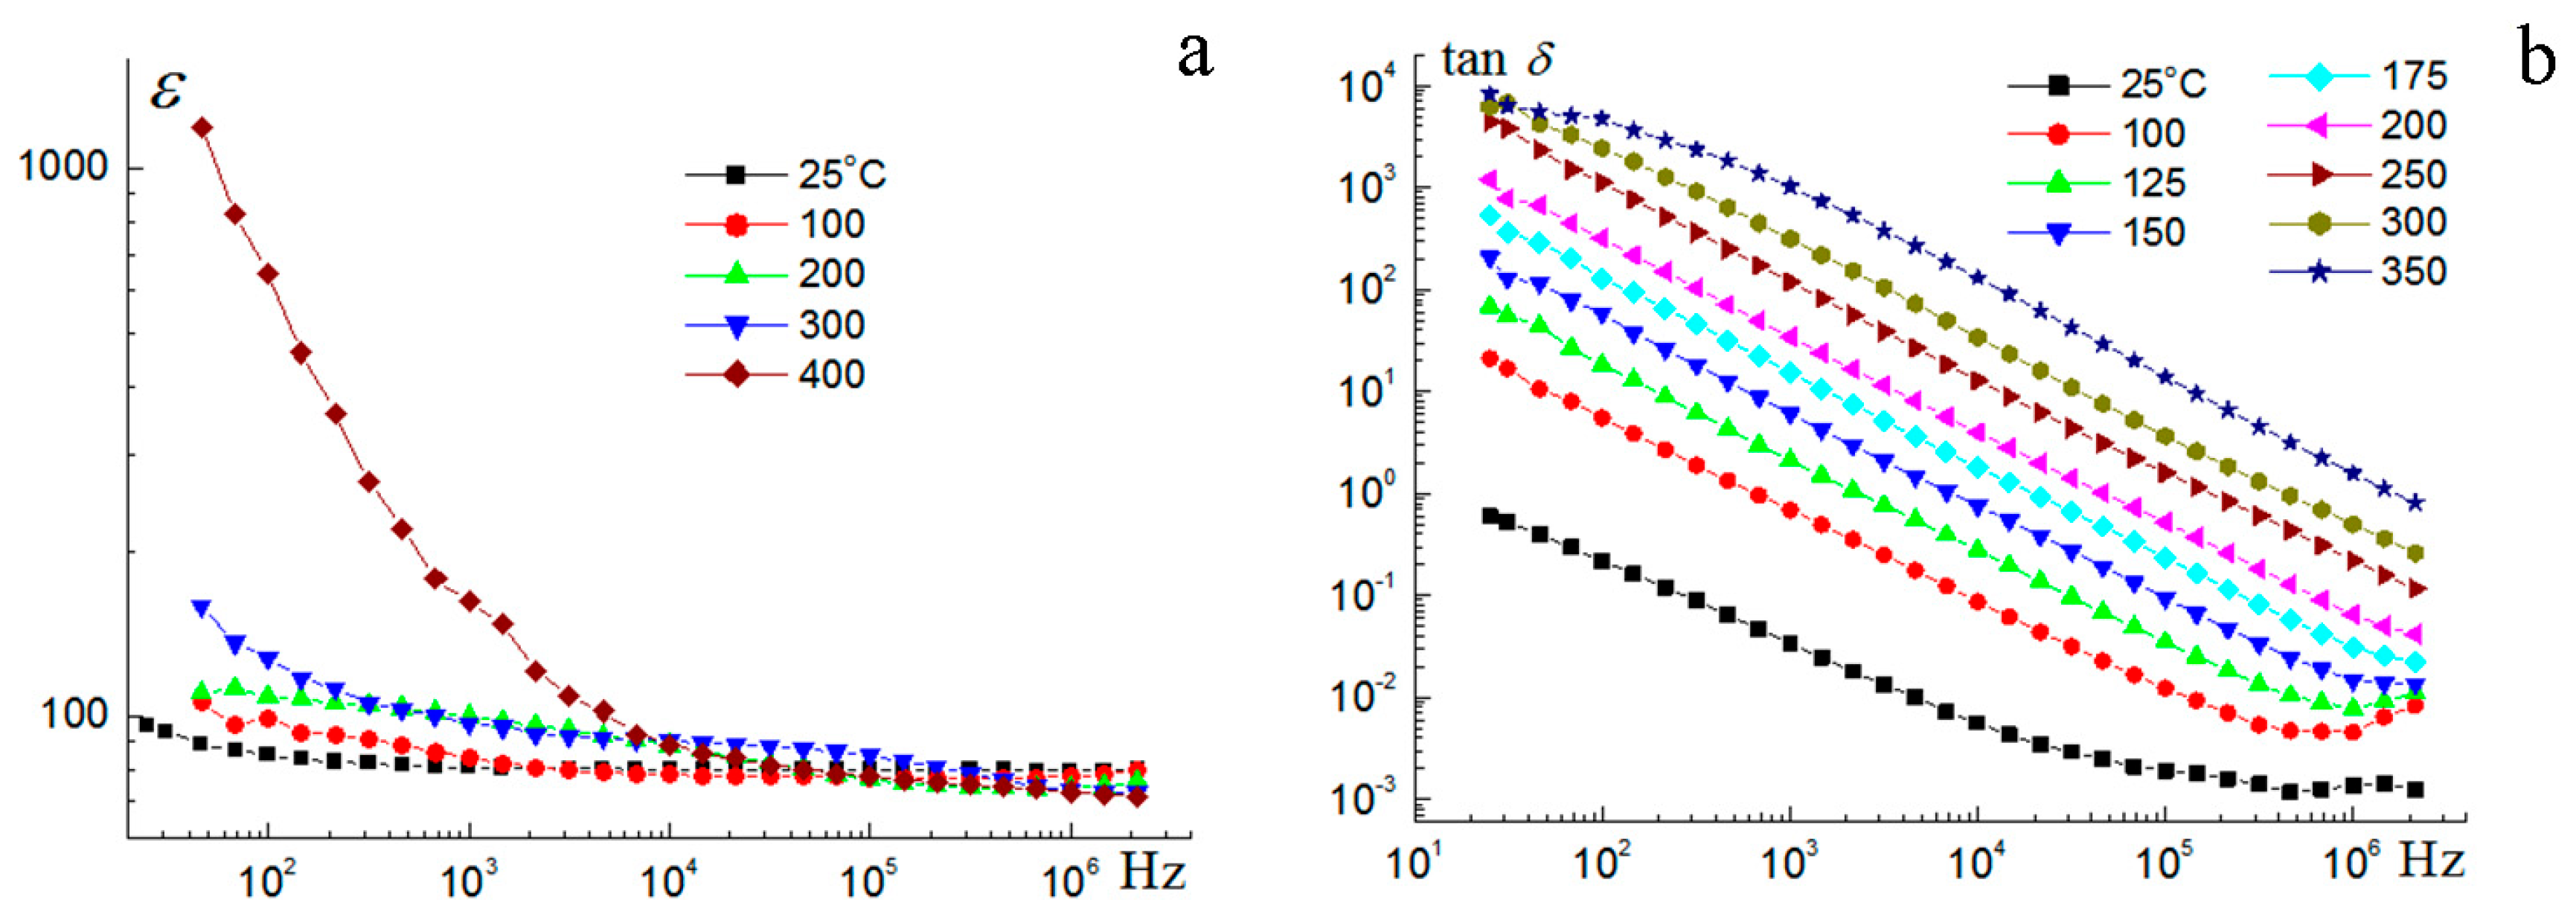
The relative permittivity of the sample in a wide temperature (up to 200 °C) and frequency range (102–106 Hz) exhibits an average value of ~95–100 (Figure 9a). A significant increase in permittivity with decreasing frequency and increasing temperature (over 400 °C) can be associated with an increasing contribution of through conductivity. The temperature dependences of the dielectric loss tangent are almost parallel and linearly dependent on frequency, and the loss tangent values are inversely proportional to frequency (Figure 9b). In a logarithmic scale, the dependence of the dielectric loss tangent on frequency is straight parallel lines. With the same scale on both axes, the slope angle will be 45°. The minimum value of 1 × 10⁻³ dielectric loss tangent is demonstrated by the sample at a frequency of 1 × 10⁶ Hz and 25 °C. With increasing temperature and frequency, dielectric losses increase, which is associated with electronic polarization.
The obtained values of permittivity and the dielectric loss tangent for Bi2Cr0.5Co0.5Nb2O9+Δ do not exceed the electrical characteristics for complex bismuth niobates of the composition Bi1.5MgNb1.5O7 (ε = 120, 1 MHz, tan δ = 0.001) [47] and Bi1.5ZnNb1.5O7 (ε = 130, tan δ = 0.001) [48], Bi1.6Mg0.8–xNixNb1.6O7–δ (ε = 80–65 with increasing x) [24], Bi1.6Ni0.77Nb1.43O6.55 (ε = 127, 1 MHz) [16] and Bi2Ni2/3Nb4/3O7 (ε = 122, 1 MHz, tan δ = 0.001) [4]. The dielectric characteristics of the studied pyrochlore are significantly better than for tantalum-containing pyrochlores [5,49,50], which may be due to the dense, low-porosity microstructure of the sample and the significant polarizability of Nb-O octahedra compared to rigid and more symmetric Ta-O octahedra. In the work [51], it was shown that Bi3Ni1.4Ta3O13.4 exhibits small values of permittivity 44.85 (RT, 105 Hz), and for Bi2NiTa2O9 the permittivity does not exceed 32 at 30 °C and 1 MHz [5].
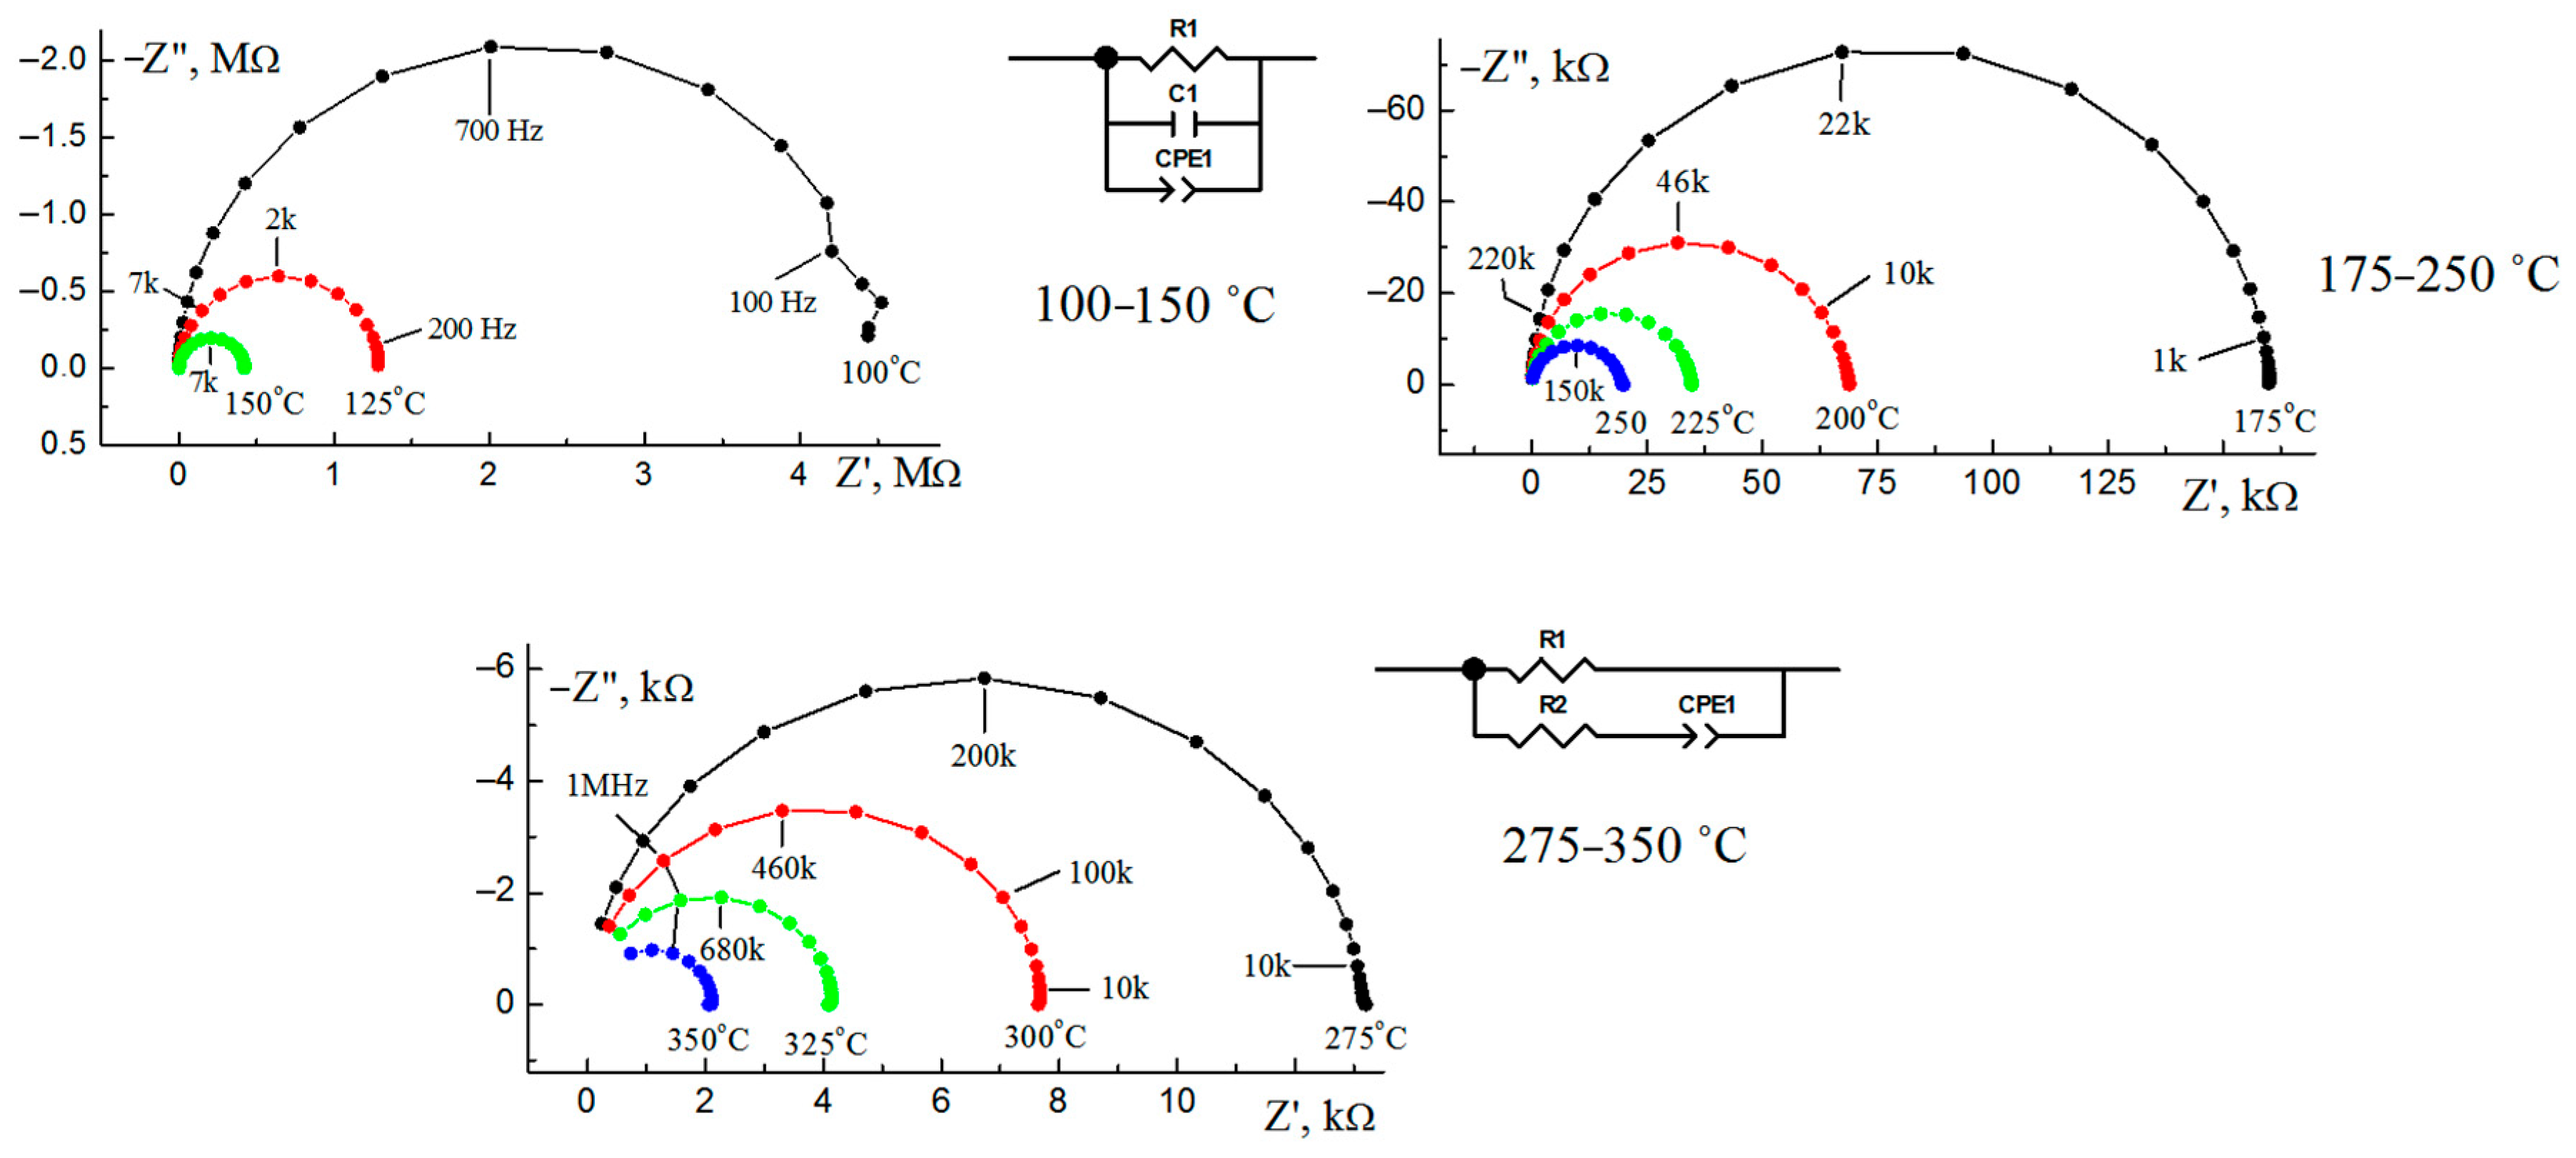
Based on the analysis of the hodograph shape (Figure 10) (Nyquist plots), equivalent electrical circuits describing the electrical behavior of the sample for the temperature ranges of 100–300 °C and 325–350 °C (Figure 10) were simulated using the ZView program. Table 6 shows the ES parameters for temperatures from 100 to 350 °C. Dielectric losses weakly depend on temperature for frequencies above 100 kHz, which indicates the electronic nature of polarization. At frequencies of the order of units of kHz, ions may participate in the polarization (for example, at grain boundaries), the activity of which increases with increasing temperature. At higher temperatures, the process characteristics change. Probably, the semi-infinite cell model is transformed into a finite diffusion impedance model, in which ions can reach the opposite electrode and settle on it at low frequencies. This is indicated by the perpendicularity of the right part of the hodograph curve to the abscissa axis (Figure 10). At high frequencies for the polarization model under consideration, the hodograph curve should tend to a slope of 45°. However, this part of the hodograph turned out to be outside the observation region.
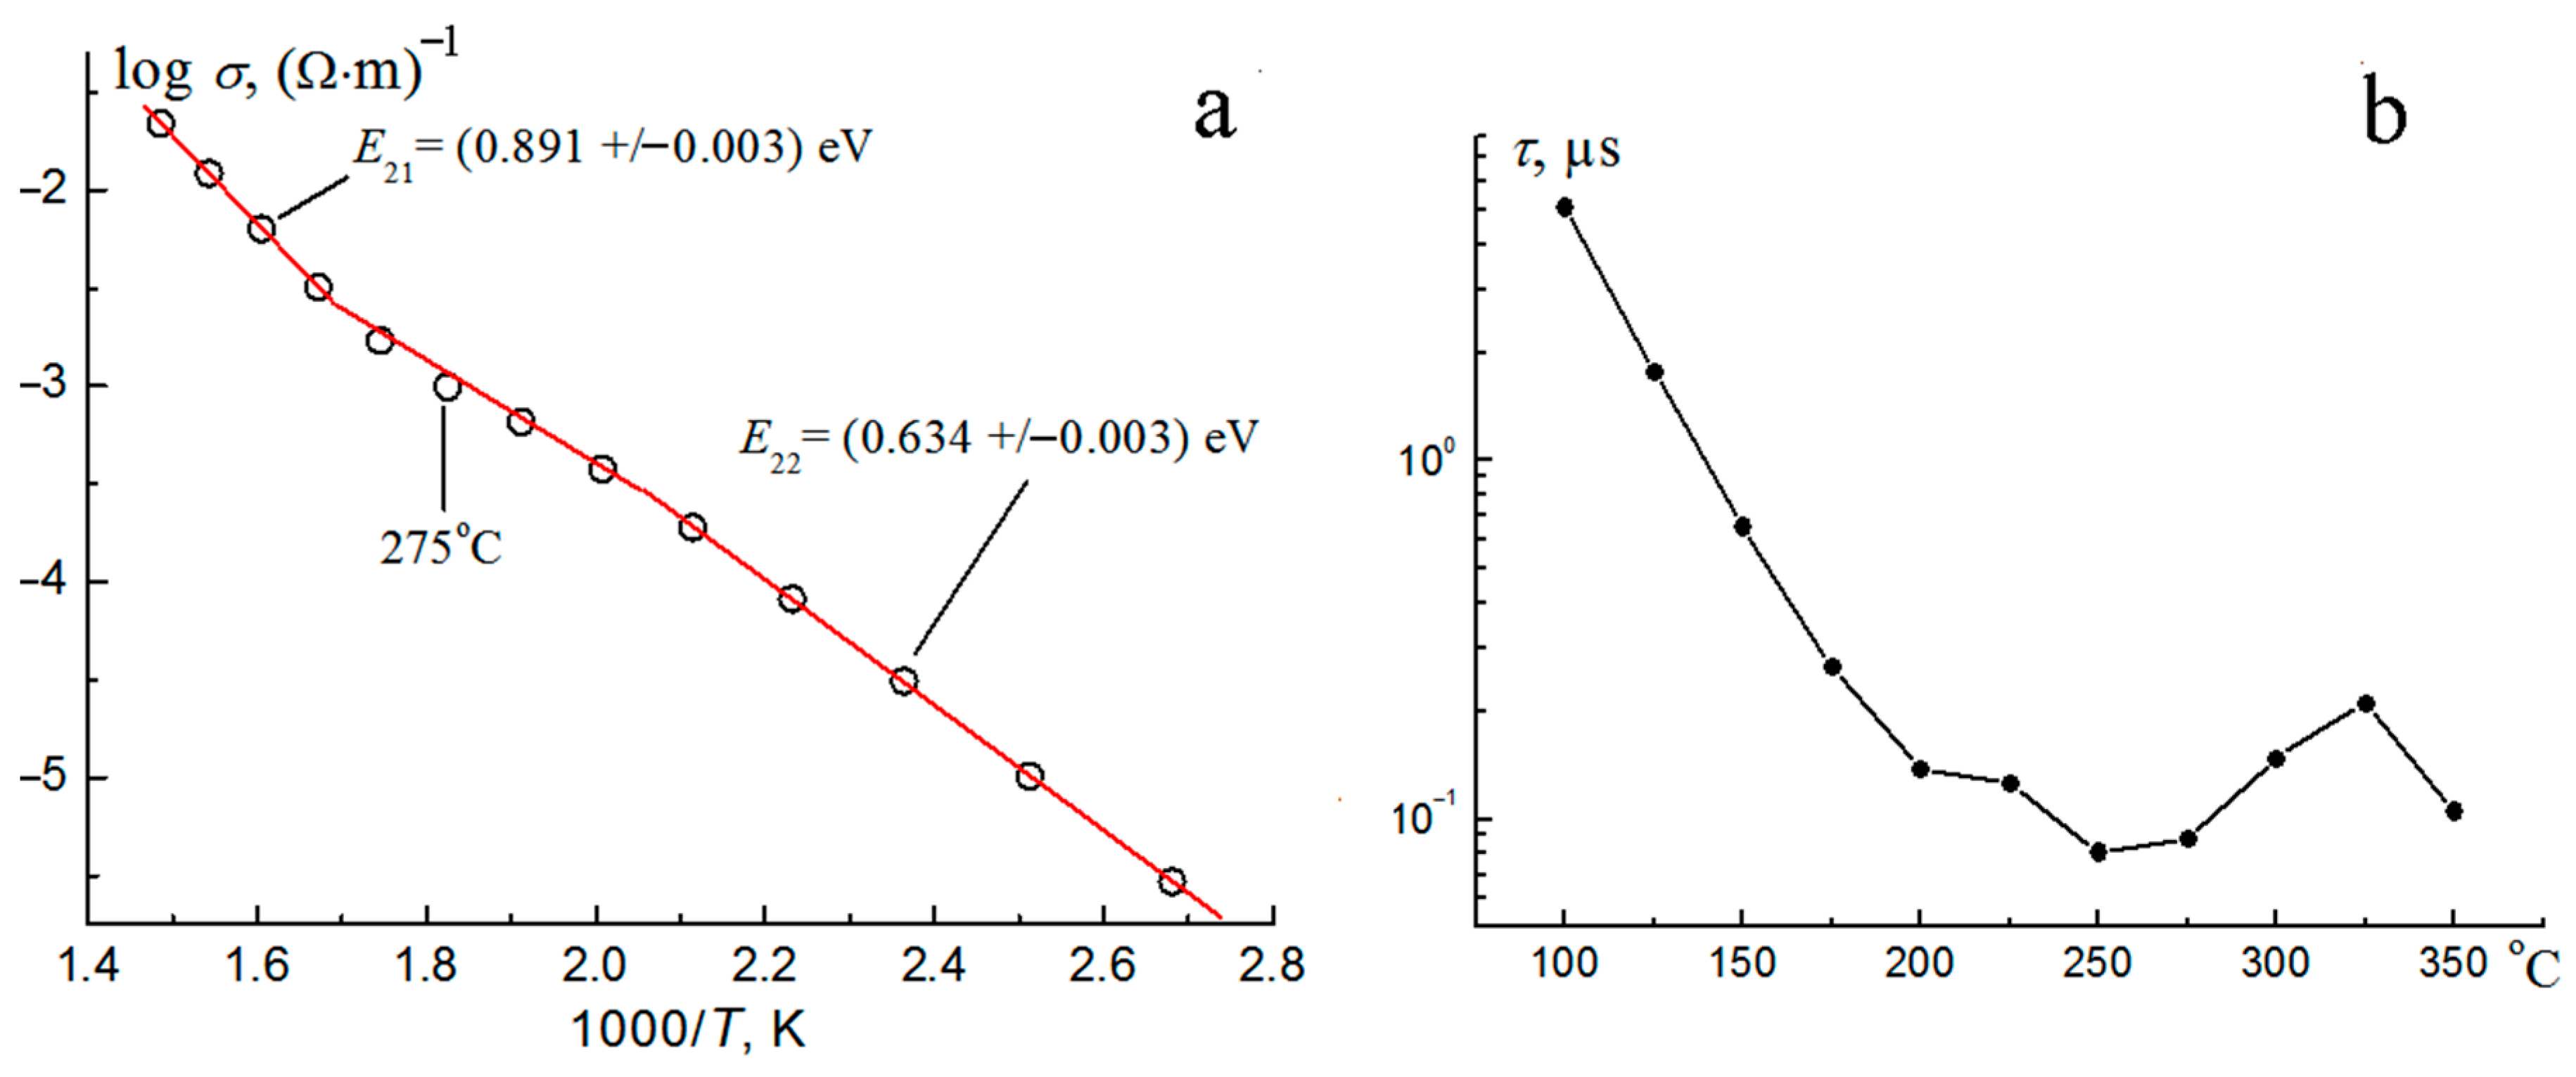
The accuracy of the electrical model can be judged by the χ2 criterion (column 7 in Table 6) and visually by Figure 10, which shows the impedance hodographs. The dots mark the experimental impedance values, and the lines are obtained using the ZView program when approximating the experimental data with an equivalent circuit. The ES of the sample can be considered as a parallel-connected capacitor C and a two-terminal network «R–CPE». The capacitor models the high-frequency part of the impedance, and the two-terminal network is responsible for the low-frequency part of the impedance. The temperature dependence of the through conductivity of the sample is shown in Figure 11a. The calculation of the activation energy of conductivity in the sample showed several linear sections (high-temperature and low-temperature) with an activation value of 0.89 eV and 0.63 eV, which is typical for semiconductor materials. The value of the activation energy is characteristic of hopping electron conductivity along deep “traps” (quantum states). The specific electrical conductivity of Bi2Cr0.5Co0.5Nb2O9+Δ changes with increasing temperature from 3.2 × 10⁻⁵ Ohm−1·m−1 (380 °C) to 2.5 × 10⁻² Ohm−1·m−1 (670 °C). The two-terminal network “R-CPE” can be characterized by a time constant that does not depend on the geometric dimensions of the sample and has a simple dimension [s]-second. It is calculated by the formula: τ = ( R T CPE ) 1 P CPE . The constant τ is the parameter for a polarization-inhomogeneous medium. This value is quite easy to determine in an experiment. To do this, it is necessary to plot the dependence −Z″(f), where f is the frequency in Hz. At the frequency fmax, the curve −Z″(f) will have a maximum. The time constant τ is determined by the formula: τ = 1 2 π f max . Since the PCPE parameter is close to 0.5 (Table 6), the slow polarization process probably occurs via the Warburg mechanism at temperatures below 250 °C. This is the diffusion impedance for a semi-infinite cell. This is one of the variants of ion-migration polarization. In this case, the macroscopic parameter τ shows how the microscopic characteristic of the ion process depends on temperature—this is the “settled life time” of the ion participating in ion-migration polarization (Figure 11b).
A comparison of the electrical properties of the samples synthesized by different methods showed that the electrical characteristics of the samples may differ depending on the synthesis method, or more precisely, on the degree of dispersion of the sample and its sintering.
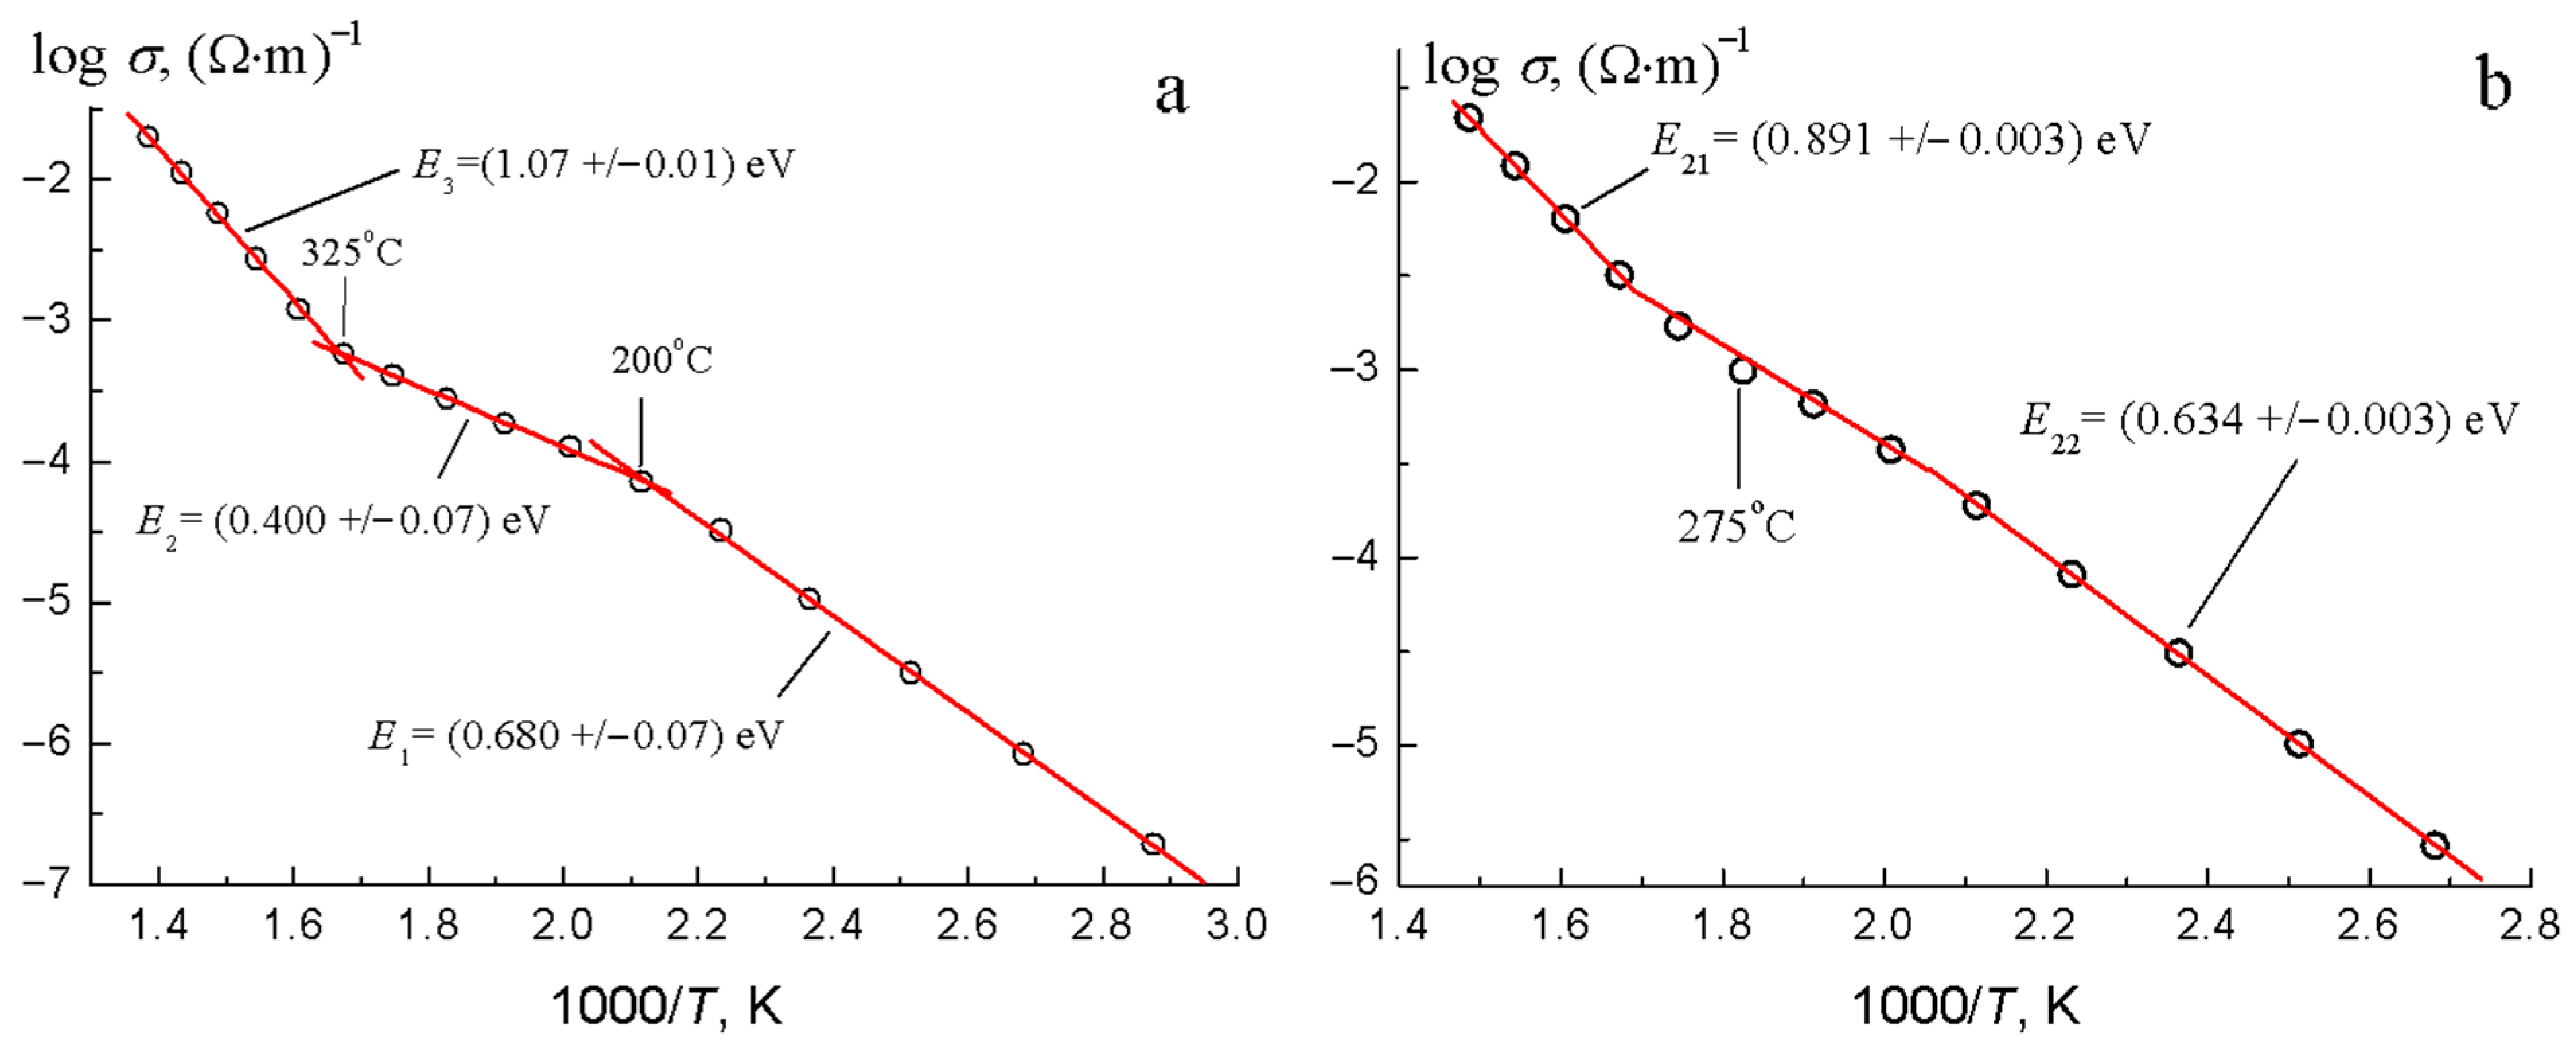
First of all, the difference in the activation energy of conductivity in the samples is striking (Figure 12). The intermediate value of the activation energy, equal to 0.4 eV, is almost absent in the sample synthesized by the sol–gel method. The point at 275 °C is slightly shifted downwards.
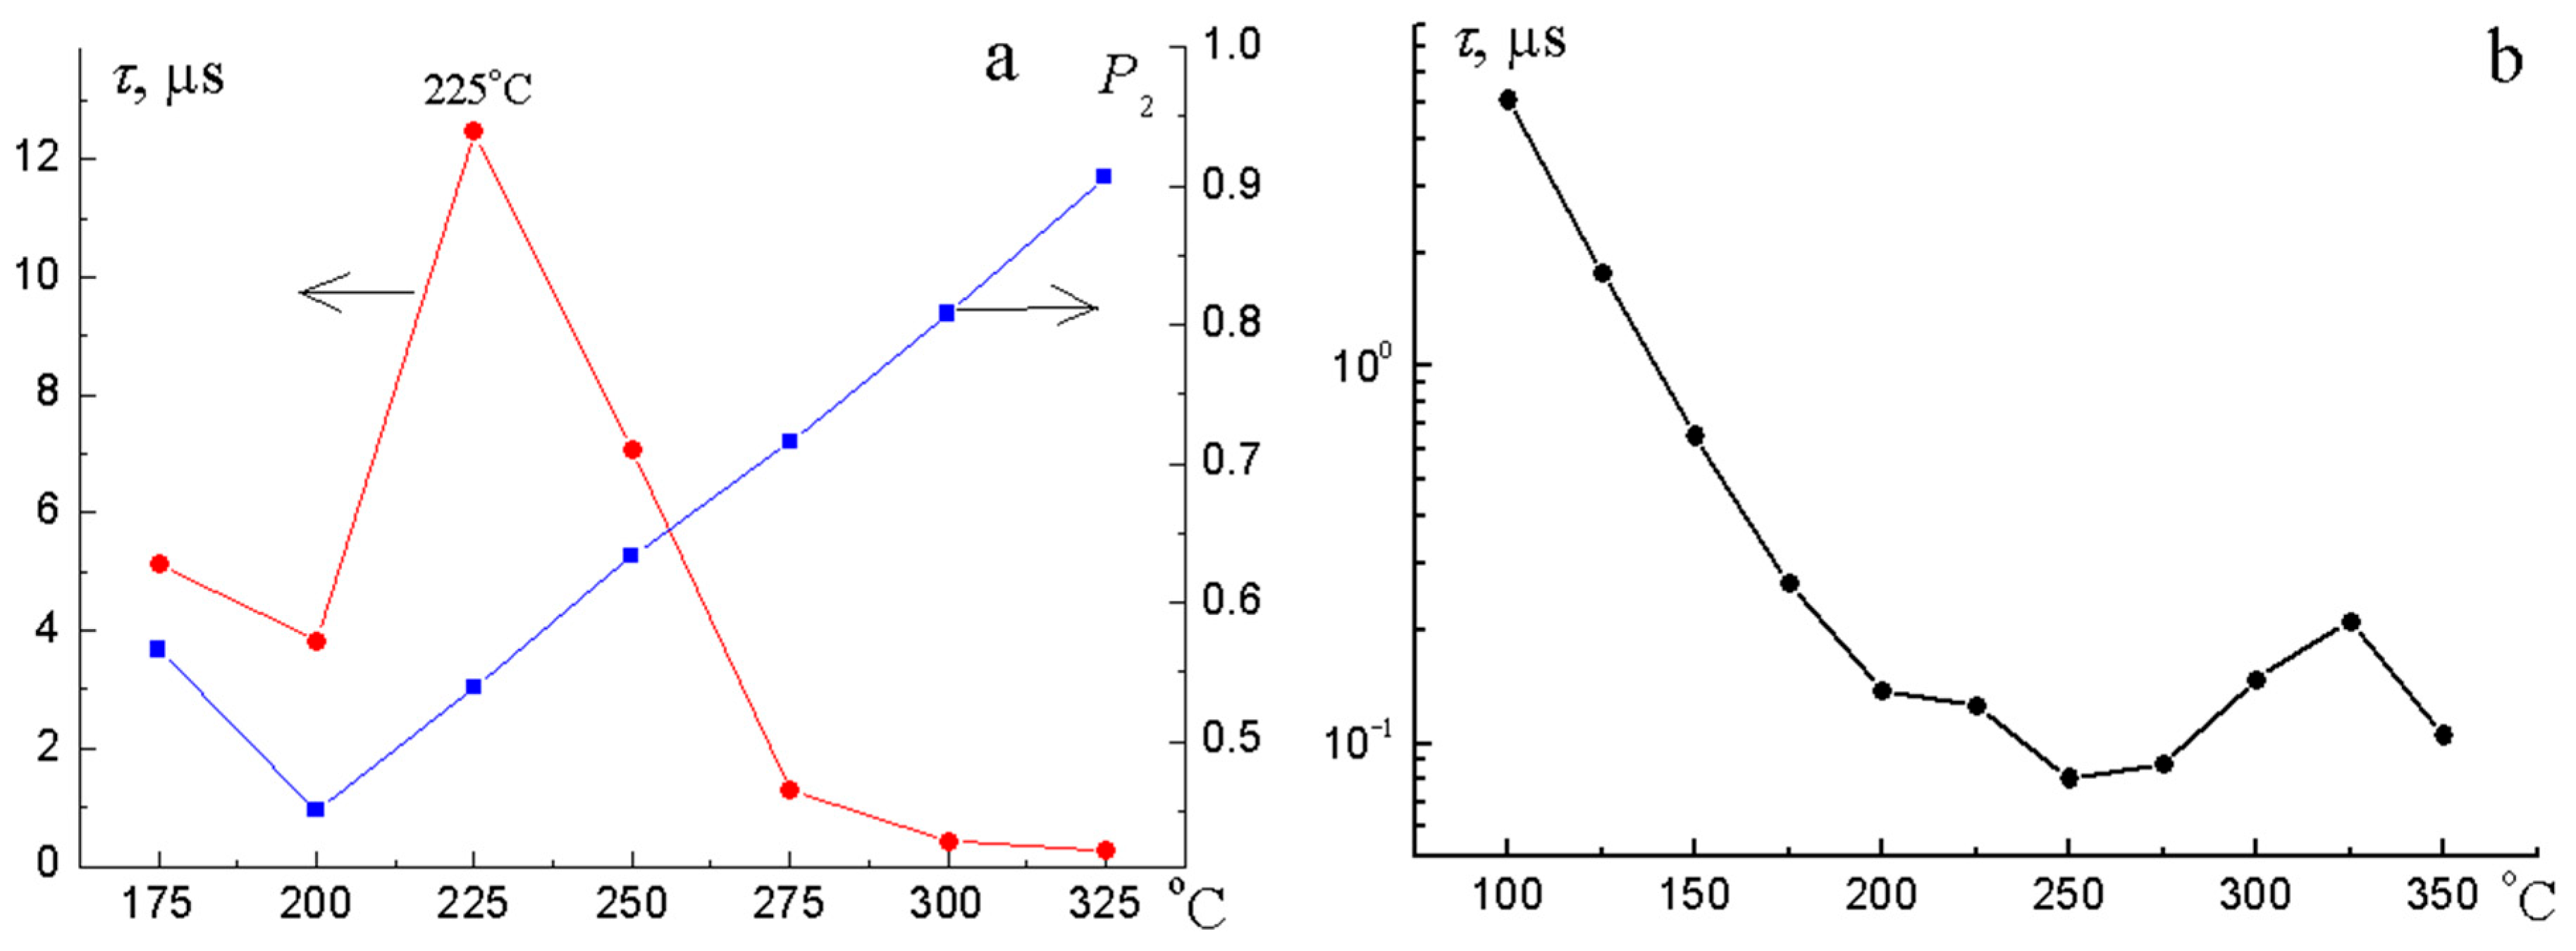
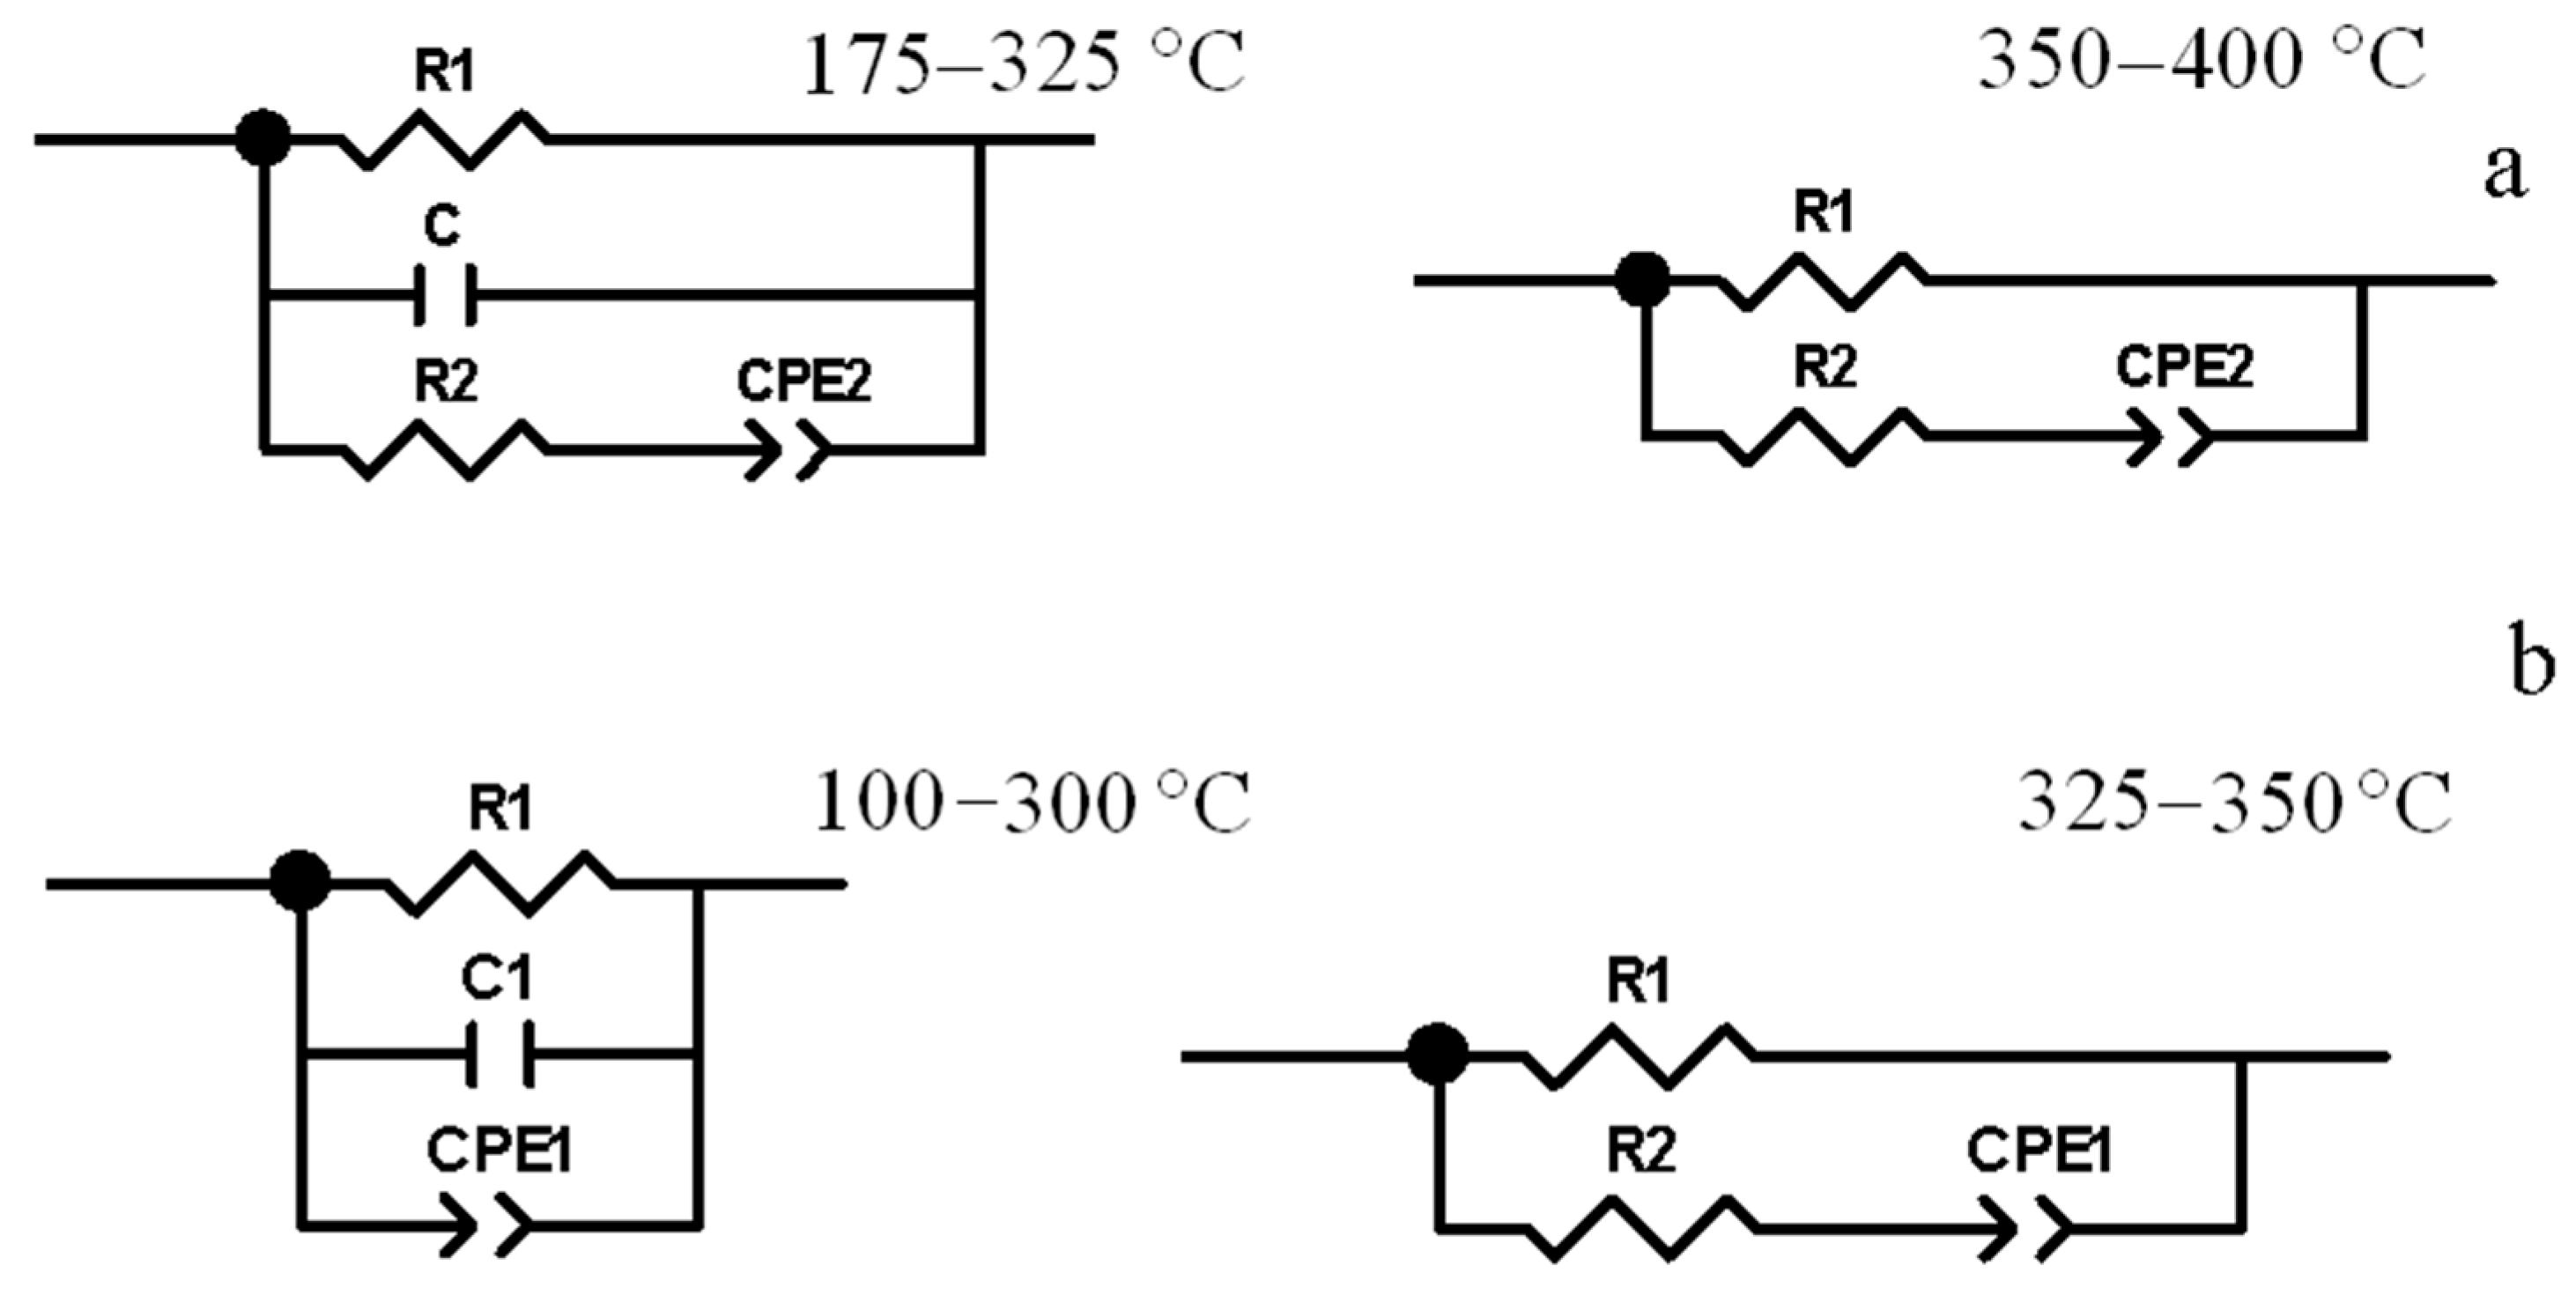
The time constant τ of the sol–gel sample is significantly smaller (approximately an order of magnitude) than that of the sample synthesized by the sol–gel method (Figure 13). This means that the dielectric losses of the slow polarization process of the sol–gel sample are much smaller than those of the ceramic sample. This also follows from the equivalent circuit in Figure 14a, where the resistor R2 is responsible for the dielectric losses. This resistor is missing in Figure 14b.
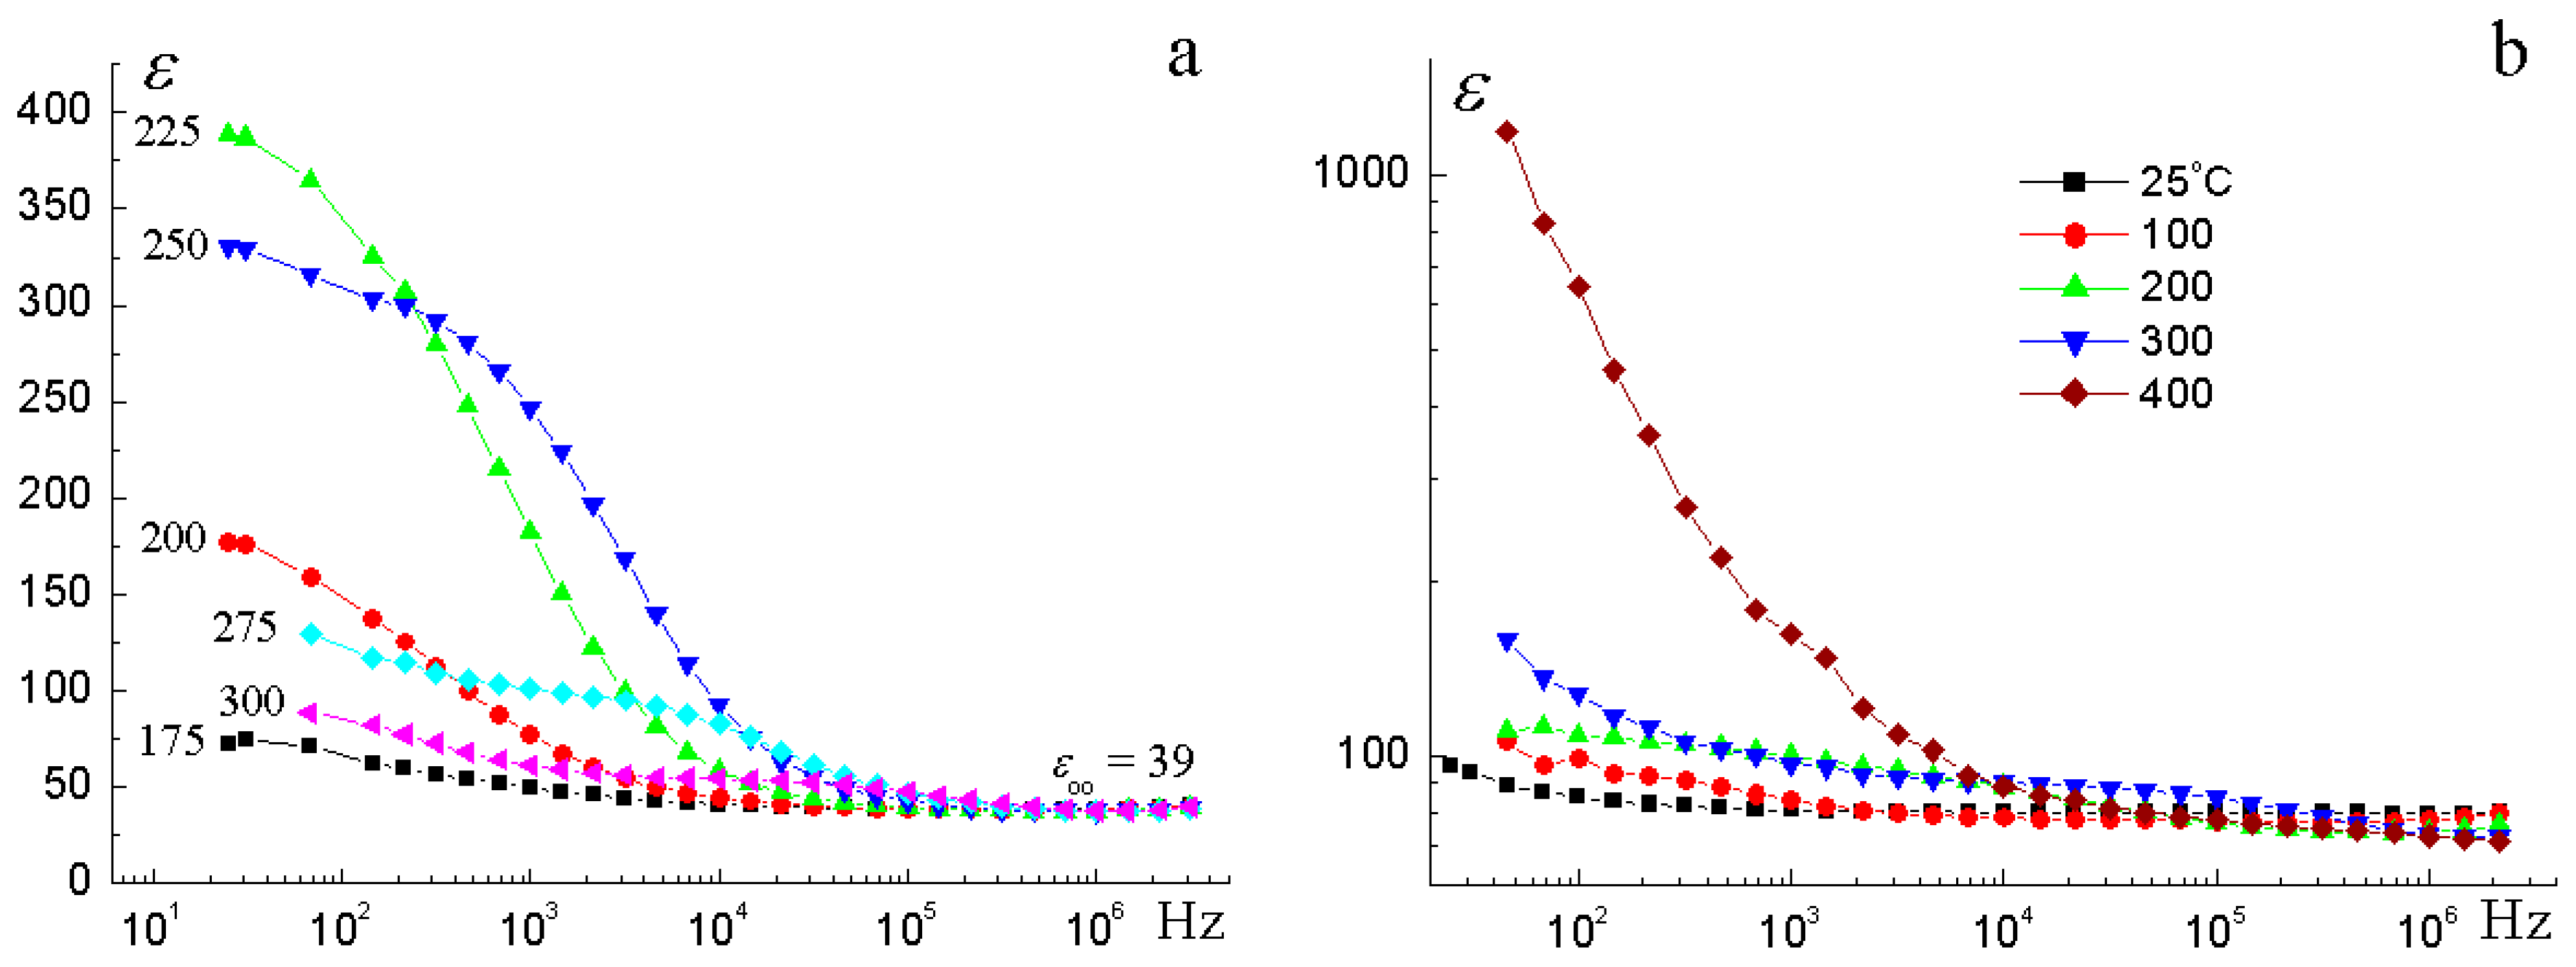
Figure 15 shows that the relative permittivity of the sample synthesized by the solid-phase method is almost three times less than the value for the sample obtained by the Pechini method.
It follows from Table 7 that the high-frequency capacitance of the sol–gel sample is 1.7 times greater than that of the ceramic sample. In other words, the through resistance of the sol–gel sample is two times less than that of the ceramic sample. When using the sol–gel method, the degree of dispersion is probably higher. As a result, the concentration of localized quantum states (traps) increases, through which the charge transfer occurs by the hopping mechanism. This is indicated by lower values of activation energies.

4. Conclusions

Cubic pyrochlore of the Bi2Cr0.5Co0.5Nb2O9+Δ composition was synthesized by the two methods-solid-phase and Pechini. The features of each synthesis method are shown. In the course of the solid-phase method, bismuth chromates (VI) are formed, while in the course of the sol–gel synthesis method, bismuth chromates are not formed due to the formation of a thermally stable salt Bi28O32(SO4)10. The synthesis temperature in the sol–gel method is 100 °C (950 °C) lower than in the solid-phase method. Pyrochlore has a disordered structure with 21.6% vacancy in the bismuth sublattice and 12.6 at.% cobalt cations in the bismuth sublattice. NEXAFS, XPS Cr2p and Co2p spectra of pyrochlore correspond to the charge states of Cr(III), Co(II) and Co(III) ions. Thermal expansion of the cubic structure of Bi2Cr0.5Co0.5Nb2O9+Δ is isotropic, the average TEC value in the range of 20 ÷ 1020 °C is 6.9 × 10⁻⁶ °C−1. Temperature stability of Bi2Cr0.5Co0.5Nb2O9+Δ is up to 1110 °C. Mixed pyrochlore synthesized by the Pechini method exhibits a moderately high permittivity of ∼97 and low dielectric losses of ∼2 × 10⁻³ at 1 MHz and ∼30 °C. The activation energy of the conductivity of the high-temperature region is 0.89 eV. Comparison of the electrical properties of samples synthesized by different methods showed that the electrical characteristics of the samples may differ depending on the synthesis method, or more precisely, on the degree of dispersion of the sample and its sintering. The electrical properties of the sample up to 400 °C were modeled; equivalent electrical circuits were compiled to satisfactorily describe the behavior of the samples upon heating.

Author Contributions

Conceptualization, N.A.Z.; investigation, N.A.Z., N.A.S., S.V.N. and M.G.K.; resources, M.G.K., S.V.N., D.V.S., N.A.S. and V.V.K.; validation, N.A.Z., S.V.N., M.G.K. and N.A.S.; visualization, N.A.Z., S.V.N., N.A.S. and M.G.K.; writing—original draft, N.A.Z., N.A.S. and S.V.N. All authors have read and agreed to the published version of the manuscript.

Funding

The NEXAFS studies were performed on the synchrotron radiation from station “NanoPES” storage ring (National Research Center “Kurchatov Institute”) within the framework of the state budget topic 125020501562-1, as well as with the financial support of the Ministry of Science and Higher Education of Russia within the framework of agreement No. 075-15-2025-455.

Data Availability Statement

The original contributions presented in the study are included in the article, further inquiries can be directed to the corresponding author.

Acknowledgments

Structure analysis was performed at the Center for X-Ray Diffraction Studies of the Research Park of St. Petersburg State University within the project 125021702335-5.

Conflicts of Interest

The authors declare that there are no conflicts of interest.

References

  1. Giampaoli, G.; Siritanon, T.; Day, B.; Li, J.; Subramanian, M.A. Temperature in-dependent low loss dielectrics based on quaternary pyrochlore oxides. Prog. Solid State Chem. 2018, 50, 16–23. [Google Scholar] [CrossRef]
  2. Murugesan, S.; Huda, M.N.; Yan, Y.; Al-Jassim, M.M.; Subramanian, V. Band-Engineered Bismuth Titanate Pyrochlores for Visible Light Photocatalysis. J. Phys. Chem. C 2010, 114, 10598–10605. [Google Scholar] [CrossRef]
  3. Du, H.; Wang, H.; Yao, X. Observations on structural evolution and dielectric properties of oxygen-deficient pyrochlores. Ceram. Int. 2004, 30, 1383–1387. [Google Scholar] [CrossRef]
  4. Cann, D.P.; Randall, C.A.; Shrout, T.R. Investigation of the dielectric properties of bismuth pyrochlores. Solid State Commun. 1996, 100, 529–534. [Google Scholar] [CrossRef]
  5. Zhuk, N.A.; Krzhizhanovskaya, M.G.; Koroleva, A.V.; Nekipelov, S.V.; Kharton, V.V.; Sekushin, N.A. Thermal Expansion, XPS Spectra, and Structural and Electrical Properties of a New Bi2NiTa2O9 Pyrochlore. Inorg. Chem. 2021, 60, 4924–4934. [Google Scholar] [CrossRef]
  6. McCauley, R.A. Structural Characteristics of Pyrochlore Formation. J. Appl. Phys. 1980, 51, 290–294. [Google Scholar] [CrossRef]
  7. Subramanian, M.A.; Aravamudan, G.; Subba Rao, G.V. Oxide pyrochlores—A review. Prog. Solid State Chem. 1983, 15, 55–143. [Google Scholar] [CrossRef]
  8. Yu, S.; Li, L.; Zheng, H. BMN-based transparent capacitors with high dielectric tunability. J. Alloys Compd. 2017, 699, 68–72. [Google Scholar] [CrossRef]
  9. Guo, Q.; Li, L.; Yu, S.; Sun, Z.; Zheng, H.; Li, J.; Luo, W. Temperature–stable dielectrics based on Cu–doped Bi2Mg2/3Nb4/3O7 pyrochlore ceramics for LTCC. Ceram. Int. 2018, 44, 333–338. [Google Scholar] [CrossRef]
  10. Vanderah, T.A.; Lufaso, M.W.; Adler, A.U.; Levin, I.; Nino, J.C.; Provenzano, V.; Schenck, P.K. Subsolidus phase equilibria and properties in the system Bi2O3:Mn2O3±x:Nb2O5. J. Solid State Chem. 2006, 179, 3467–3477. [Google Scholar] [CrossRef]
  11. Vanderah, T.A.; Siegrist, T.; Lufaso, M.W.; Yeager, M.C.; Roth, R.S.; Nino, J.C.; Yates, S. Phase Formation and Properties in the System Bi2O3:2CoO1+x:Nb2O5. Eur. J. Inorg. Chem. 2006, 2006, 4908–4914. [Google Scholar] [CrossRef]
  12. Valant, M.; Suvorov, D. The Bi2O3–Nb2O5–NiO Phase Diagram. J. Am. Ceram. Soc. 2005, 88, 2540–2543. [Google Scholar] [CrossRef]
  13. Dasin, N.A.M.; Tan, K.B.; Khaw, C.C.; Zainal, Z.; Lee, O.J.; Chen, S.K. Doping mechanisms and dielectric properties of Ca-doped bismuth magnesium niobate pyrochlores. Mater. Chem. Phys. 2019, 242, 122558. [Google Scholar] [CrossRef]
  14. Chon, M.P.; Tan, K.B.; Zainal, Z.; Taufiq-Yap, Y.H.; Tan, P.Y.; Khaw, C.C.; Chen, S.K. Synthesis and Electrical Properties of Zn-substituted Bismuth Copper Tantalate Pyrochlores. Int. J. Appl. Ceram. Technol. 2016, 13, 718–725. [Google Scholar] [CrossRef]
  15. Rychkova, L.V.; Sekushin, N.A.; Nekipelov, S.V.; Makeev, B.A.; Fedorova, A.V.; Korolev, R.I.; Zhuk, N.A. Dielectric and magnetic properties, NEXAFS spectroscopy of Co-doped of multicomponent bismuth niobate pyrochlore. Ceram. Int. 2021, 47, 6691–6698. [Google Scholar] [CrossRef]
  16. Valant, M. Dielectric Relaxations in Bi2O3–Nb2O5–NiO Cubic Pyrochlores. J. Am. Ceram. Soc. 2009, 92, 955–958. [Google Scholar] [CrossRef]
  17. Zhuk, N.A.; Sekushin, N.A.; Krzhizhanovskaya, M.G.; Kharton, V.V. Multiple relaxation, reversible electrical breakdown and bipolar conductivity of pyrochlore–type Bi2Cu0.5Zn0.5Ta2O9 ceramics. Solid State Ion. 2022, 377, 115868. [Google Scholar] [CrossRef]
  18. Zhuk, N.A.; Sekushin, N.A.; Krzhizhanovskaya, M.G.; Selutin, A.A.; Koroleva, A.V.; Badanina, K.A.; Nekipelov, S.V.; Petrova, O.V.; Sivkov, V.N. Photoelectron Spectroscopy Study of the Optical and Electrical Properties of Cr/Cu/Mn Tri-Doped Bismuth Niobate Pyrochlore. Sci 2025, 7, 1. [Google Scholar] [CrossRef]
  19. Zhuk, N.A.; Makeev, B.A.; Krzhizhanovskaya, M.G.; Nekipelov, S.V.; Sivkov, D.V.; Badanina, K.A. Features of the Phase Formation of Cr/Mn/Fe/Co/Ni/Cu Codoped Bismuth Niobate Pyrochlore. Crystals 2023, 13, 1202. [Google Scholar] [CrossRef]
  20. Zhuk, N.A.; Badanina, K.A.; Korolev, R.I.; Makeev, B.A.; Krzhizhanovskaya, M.G.; Kharton, V.V. Phase Formation of Co and Cr Co-Doped Bismuth Niobate with Pyrochlore Structure. Inorganics 2023, 11, 288. [Google Scholar] [CrossRef]
  21. Badanina, K.A.; Nekipelov, S.V.; Lebedev, A.M.; Zhuk, N.A.; Beznosikov, D.S. Conversion of Cr(III) and Co(III) During the Synthesis of Co/Cr Codoped Bismuth Niobate Pyrochlore According to NEXAFS Data. J. Sib. Fed. Univ. Math. Phys. 2024, 17, 559–569. [Google Scholar]
  22. Bruker, A.X.S. Topas, version 5.0. General Profile and Structure Analysis Software for Powder Diffraction Data; Bruker AXS: Karlsruhe, Germany, 2014.
  23. Bubnova, R.S.; Firsova, V.A.; Filatov, S.K. Software for determining the thermal expansion tensor and the graphic representation of its characteristic surface (Theta to Tensor-TTT). Glass Phys. Chem. 2013, 39, 347–350. [Google Scholar] [CrossRef]
  24. Zhuk, N.A.; Krzhizhanovskaya, M.G.; Sekushin, N.A.; Kharton, V.V.; Koroleva, A.V.; Nekipelov, S.V.; Sivkov, D.V.; Sivkov, V.N.; Makeev, B.A.; Lebedev, A.M.; et al. Novel Ni-Doped Bismuth–Magnesium Tantalate Pyrochlores: Structural and Electrical Properties, Thermal Expansion, X-ray Photoelectron Spectroscopy, and Near-Edge X-ray Absorption Fine Structure Spectra. ACS Omega 2021, 6, 23262–23273. [Google Scholar] [CrossRef]
  25. Da Cruz, J.A.; Volnistem, E.A.; Ferreira, R.F.; Freitas, D.B.; Sales, A.J.M.; Costa, L.C.; Graça, M.P.F. Structural characterization of Brazilian niobium pentoxide and treatment to obtain the single phase (H-Nb2O5). Therm. Sci. Eng. Prog. 2021, 25, 101015. [Google Scholar] [CrossRef]
  26. Grins, J.; Esmaeilzadeh, S.; Hull, S. Structure and Ionic Conductivity of Bi6Cr2O15, a New Structure Type Containing (Bi12O14)8n+n Columns and CrO42− Tetrahedra. J. Solid State Chem. 2002, 163, 144–150. [Google Scholar] [CrossRef]
  27. Liu, Y.H.; Li, J.B.; Lianga, J.K.; Luo, J.; Ji, L.N.; Zhang, J.Y.; Rao, G.H. Phase diagram of the Bi2O3–Cr2O3 system. Mater. Chem. Phys. 2008, 112, 239–243. [Google Scholar] [CrossRef]
  28. Zahid, A.H.; Han, Q. A review on the preparation, microstructure, and photocatalytic performance of Bi2O3 in polymorphs. Nanoscale 2021, 13, 17687–17724. [Google Scholar] [CrossRef] [PubMed]
  29. Gopalakrishnan, J.; Ramanan, A.; Rao, C.N.R.; Jefferson, D.A.; Smith, D.J. A homologous series of recurrent intergrowth structures of the type Bi4Am+n−2Bm+nO3(m+n)+6 formed by oxides of the aurivillius family. Solid State Chem. 1984, 55, 101–105. [Google Scholar] [CrossRef]
  30. Warda, S.A.; Pietzuch, W.; Massa, W.; Kesper, U.; Reinen, D. Color and Constitution of CrVI-Doped Bi2O3 Phases: The Structure of Bi14CrO24. J. Solid State Chem. 2000, 149, 209–217. [Google Scholar] [CrossRef]
  31. Zhuk, N.A.; Sekushin, N.A.; Krzhizhanovskaya, M.G.; Koroleva, A.; Reveguk, A.; Nekipelov, S.; Sivkov, D.; Lutoev, V.; Makeev, B.; Kharton, V. Cr-doped bismuth tantalate pyrochlore: Electrical and thermal properties, crystal structure and ESR, NEXAFS, XPS spectroscopy. Mater. Res. Bull. 2023, 58, 112067. [Google Scholar] [CrossRef]
  32. Zhuk, N.A.; Krzhizhanovskaya, M.G.; Koroleva, A.V.; Nekipelov, S.; Sivkov, D.; Sivkov, V.; Lebedev, A.; Chumakov, R.; Makeev, B.; Kharton, V. Spectroscopic characterization of cobalt doped bismuth tantalate pyrochlore. Solid State Sci. 2022, 125, 106820. [Google Scholar] [CrossRef]
  33. Zhuk, N.A.; Krzhizhanovskaya, M.G.; Sekushin, N.A.; Sivkov, D.V.; Abdurakhmanov, I.E. Crystal. Structure, dielectric and thermal properties of cobalt doped bismuth tantalate pyrochlore. J. Mater. Res. Technol. 2023, 22, 1791–1799. [Google Scholar] [CrossRef]
  34. Roth, R.S.; Waring, J.L. Synthesis and stability of bismutotantalite, stibiotantalite and chemically similar ABO4 compounds. Am. Mineral. 1963, 48, 1348–1356. [Google Scholar]
  35. Piir, I.V.; Prikhodko, D.A.; Ignatchenko, S.V.; Schukariov, A.V. Preparation and structural investigations of the mixed bismuth niobates, containing transition metals. Solid State Ion. 1997, 101–103, 1141–1146. [Google Scholar] [CrossRef]
  36. Shannon, R.D. Revised effective ionic radii and systematic studies of interatomic distances in halides and chalcogenides. Acta Crystallogr. A 1976, 32, 751–767. [Google Scholar] [CrossRef]
  37. Zhuk, N.A.; Krzhizhanovskaya, M.G.; Koroleva, A.V.; Selyutin, A.; Sekushin, N.; Nekipelov, S.; Sivkov, D.; Kharton, V. Cr and Mg codoped bismuth tantalate pyrochlores: Thermal expansion and stability, crystal structure, electrical and optical properties, NEXAFS and XPS study. J. Solid State Chem. 2023, 323, 124074. [Google Scholar] [CrossRef]
  38. Regan, T.J.; Ohldag, H.; Stamm, C.; Nolting, F.; Luning, J.; Stöhr, J.; Lhite, W.R. Chemical effects at metal/oxide interfaces studied by x-ray-absorption spectroscopy. Phys. Rev. B 2001, 64, 214422. [Google Scholar] [CrossRef]
  39. Gai, X.-M.; You, C.; Gao, Y.-Q.; Li, Z.; Liu, H.-T.; Zhao, W.; Zhu, P.-W.; Wang, X. Irreversible expansion and distortion relief of bismuth ruthenate under high temperature and high pressure. J. Appl. Phys. 2025, 138, 135901. [Google Scholar] [CrossRef]
  40. Zhuk, N.A.; Krzhizhanovskaya, M.G. Thermal expansion of bismuth magnesium tantalate and niobate pyrochlores. Ceram. Int. 2021, 47, 30099–30105. [Google Scholar] [CrossRef]
  41. Shukla, R.; Vasundhara, K.; Krishna, P.S.R.; Shinde, A.B.; Sali, S.K.; Kulkarni, N.K.; Achary, S.N.; Tyagi, A.K. High temperature structural and thermal expansion behavior of pyrochlore-type praseodymium zirconate. Int. J. Hydrogen Energy 2015, 40, 15672–15678. [Google Scholar] [CrossRef]
  42. Raison, P.E.; Pavel, C.C.; Jardin, R.; Suard, E.; Haire, R.G.; Popa, K. Thermal expansion behavior of Ce2Zr2O7 up to 898 K in conjunction with structural analyses by neutron diffraction. Phys. Chem. Miner. 2010, 37, 555–559. [Google Scholar] [CrossRef]
  43. Feng, J.; Xiao, B.; Zhou, R.; Pan, W. Thermal expansions of Ln2Zr2O7 (Ln = La, Nd, Sm, and Gd) pyrochlore. J. Appl. Phys. 2012, 111, 103535. [Google Scholar] [CrossRef]
  44. Qun-bo, F.; Feng, Z.; Fuchi, W.; Lu, W. Molecular dynamic scalculation of thermal expansion coefficient of a series of rareearth zirconates. Comput. Mater. Sci. 2009, 46, 716–719. [Google Scholar] [CrossRef]
  45. Lasia, A. Electrochemical Impedance Spectroscopy and Its Applications; Springer Science + Business Media: New York, NY, USA, 2014; 369p. [Google Scholar]
  46. Barsoukov, E.; Macdonald, J.R. Impedance Spectroscopy: Theory, Experiment and Application; Wiley-Interscience: Hoboken, NJ, USA, 2005; 606p. [Google Scholar]
  47. Zhang, Y.; Zhang, Z.; Zhu, X.; Liu, Z.; Li, Y.; Al-Kassab, T. Dielectric properties and microstructural characterization of cubic pyrochlored bismuth magnesium niobates. Appl. Phys. A 2013, 115, 661–666. [Google Scholar] [CrossRef]
  48. Osman, R.A.M.; Masó, N.; West, A.R. Bismuth Zinc Niobate Pyrochlore, a Relaxor-Like Non-Ferroelectric. J. Am. Ceram. Soc. 2011, 95, 296–302. [Google Scholar] [CrossRef]
  49. Jusoh, F.A.; Tan, K.B.; Zainal, Z.; Chen, S.K.; Khaw, C.C.; Lee, O.J. Novel pyrochlores in the Bi2O3-Fe2O3-Ta2O5 (BFT) ternary system: Synthesis, structural and electrical properties. J. Mater. Res. Technol. 2020, 9, 11022–11034. [Google Scholar] [CrossRef]
  50. Chon, M.P.; Tan, K.B.; Khaw, C.C.; Zainal, Z.; Taufiq-Yap, Y.H.; Chen, S.K.; Tan, P.Y. Subsolidus phase equilibria and electrical properties of pyrochlores in the Bi2O3–CuO–Ta2O5 ternary system. J. Alloys Compd. 2016, 675, 116–127. [Google Scholar] [CrossRef]
  51. Abdullah, A.; Wan Khalid, W.E.F.; Abdullah, S.Z. Synthesis and Characterization of Bismuth Nickel Tantalate Pyrochlore. Appl. Mech. Mater. 2015, 749, 30–35. [Google Scholar] [CrossRef]
Figure 1. X-ray powder diffraction patterns and photographs of Bi2Cr0.5Co0.5Nb2O9+Δ (SPM) samples successively calcined at a temperature of 650–1050 °C.
Chemistry 07 00185 g001
Figure 2. NEXAFS Cr2p-spectra of the Bi2Cr0.5Co0.5Nb2O9+Δ (SPM) synthesized at 650 and 1050 °C, oxides Cr2O3, CrO2, CrO3 and potassium dichromate K2Cr2O7.
Chemistry 07 00185 g002
Figure 3. X-ray powder diffraction patterns, microstructure of the Bi2Cr0.5Co0.5Nb2O9+Δ (PM) sample calcined at 850, 950 and 1050 °C. Element maps are given for the sample calcined at 1050 °C.
Chemistry 07 00185 g003
Figure 4. Photographs of Bi2Cr0.5Co0.5Nb2O9+Δ samples synthesized at 650 °C by the solid-phase reaction method (a) and the Pechini method (b).
Chemistry 07 00185 g004
Figure 5. Survey XPS spectrum of Bi2Cr0.5Co0.5Nb2O9+Δ, synthesized at 1050 °C, (SPM, CoCrNb) (a), Bi4f spectra in CoCrNb and Bi2O3 (b); Nb3d spectra in CoCrNb and Nb2O5 (c); Co2p spectra in CoCrNb, CoO and Co3O4 (d); Cr2p spectra in CoCrNb and CrO2, CrO3, Cr2O3 (e).
Chemistry 07 00185 g005
Figure 6. Image of the unit cell and experimental powder XRD pattern (2θ: 5–105 °) of Bi2Cr0.5Co0.5Nb2O9+Δ, synthesized at 1050 °C, (PM) (blue crosses), Rietveld-simulated pattern (solid red line), the difference between experimental and calculated patterns (gray line at the bottom). The inset shows an enlarged diffraction pattern in the region of 2θ angles: 68–102 °.
Chemistry 07 00185 g006
Figure 7. The temperature dependence of the cubic unit cell parameter a of the Bi2Cr0.5Co0.5Nb2O9+Δ (PM) (a); TECs of the Bi2Cr0.5Co0.5Nb2O9+Δ at different temperatures (b); the detail plot of XRD patterns of Bi2Cr0.5Co0.5Nb2O9+Δ (c) in the heating range 30–1200 °C; X-ray powder diffraction pattern of a cooled sample after calcination at 1200 °C (d).
Chemistry 07 00185 g007
Figure 8. The modulus (a) and phase of the impedance (b), the logarithm of the impedance modulus as a function of frequency (c) of the Bi2Cr0.5Co0.5Nb2O9+Δ (PM) sample, synthesized at 1050 °C.
Chemistry 07 00185 g008
Figure 9. The dielectric permeability (a) and tangent of dielectric losses (b) in the frequency range 25–106 Hz at 24–400 °C of the Bi2Cr0.5Co0.5Nb2O9+Δ (PM) sample.
Chemistry 07 00185 g009
Figure 10. Hodographs of impedance of sample, measured at temperatures 275–400 °C and equivalent circuits used to simulate the impedance of the Bi2Cr0.5Co0.5Nb2O9+Δ (PM) sample.
Chemistry 07 00185 g010
Figure 11. Temperature dependence of the end-to-end conductivity of the sample, plotted in the Arrhenius scale for the temperature range of 350–450 °C (a); dependence of the time constant τ on temperature for the Bi2Cr0.5Co0.5Nb2O9+Δ (PM) sample (b).
Chemistry 07 00185 g011
Figure 12. Specific conductivity as a function of temperature in the Arrhenis scale for the Bi2Cr0.5Co0.5Nb2O9+Δ sample synthesized by the solid-phase (a) and Pechini (b) methods, synthesized at 1050 °C.
Chemistry 07 00185 g012
Figure 13. Dependences of the time constants on temperature for the Bi2Cr0.5Co0.5Nb2O9+Δ sample synthesized by the solid-phase (a) and Pechini (b) methods, synthesized at 1050 °C.
Chemistry 07 00185 g013
Figure 14. Equivalent circuits of the Bi2Cr0.5Co0.5Nb2O9+Δ sample synthesized by the solid-phase (a) and Pechini (b) methods for the temperature range: 175–325 °C and 350–400 °C (a) and 100–300°C, 325–350°C (b), respectively.
Chemistry 07 00185 g014
Figure 15. Frequency dependences of the relative dielectric permittivity of Bi2Cr0.5Co0.5Nb2O9+Δ synthesized by the solid-phase (a) and Pechini method (b).
Chemistry 07 00185 g015
Table 1. Energy positions of the components of the XPS spectra of Bi2Cr0.5Co0.5Nb2O9+Δ (SPM).
PeakEnergy (eV)
Bi4f7/2158.81
Bi4f5/2164.14
Nb3d5/2206.43
Nb3d3/2209.17
Co2p3/2 780.22
Co2p1/2 796.01
Co sat786.11
Co sat801.97
Cr2p3/2 576.25
Cr2p1/2 586.15
Table 2. Atomic parameters of Co,Cr codoped bismuth niobate pyrochlore.
AtomWyckoff
Site
xyzSOFBiso,Å2
Bi96g0−0.02435(13)0.02435(13)0.1307(3)1.82(9)
Nb16b0.50000.50000.50000.660(6)1.07(6)
Co/Cr16b0.50000.50000.50000.167(6)1.07(6)
O148f0.12500.12500.4330(3)10.63(12)
O28a0.12500.12500.12500.706(1)0.63(12)
Table 3. Crystallographic data of the Bi2Cr0.5Co0.5Nb2O9+Δ. (PM).
Parameter
a (Å)10.49360(5)
α, β, γ (°)90, 90, 90
V3)1155.511(16)
Dcalc (g/cm3)6.836(9)
RB0.54
Rwp3.54
Rp2.70
Rexp1.95
GOF1.81
Table 4. Selected bond lengths in the structure of the Bi2Cr0.5Co0.5Nb2O9+Δ. (PM).
BondLength (Å)
Bi1 –O1×22.3005(4)
   –O1×22.368(3)
   –O1×22.695(2)
   –O2×22.985(3)
<Bi1VIII–O>2.59
Nb1–O1 × 61.9836(15)
<Nb1VI–O>1.99
Table 5. TECs (× 106 °C−1) of Bi2Cr0.5Co0.5Nb2O9+Δ (PM) along crystallographic ax at the different temperatures.
T, °CTECs
(×106 °C−1)
T, °CTECs
(×106 °C−1)
T, °CTECs
(×106 °C−1)
203.923706.027208.11
704.224206.327708.41
1204.524706.628208.70
1704.825206.928709.00
2205.125707.229209.30
2705.426207.519709.59
3205.726707.8110209.89
<20–1020>6.91
Table 6. Parameters of the ES of the Bi2Cr0.5Co0.5Nb2O9+Δ sample (PM), synthesized at 1050 °C.
t, °CR1, ΩC1, pFR2, ΩTCPE1PCPE1χ2 × 10⁴
1004.60 × 10651.9-4.73 × 10−100.5038.5
1251.31 × 10650.9-5.51 × 10−100.5466.3
1504.25 × 10549.9-6.10 × 10−100.5806
1751.61 × 10548.9-1.06 × 10−90.5735
20069,22047.7-1.67 × 10−90.5745
22534,77645.7-1.12 × 10−90.6396
25019,68044.7-2.40 × 10−90.6103.3
27513,24242.7-1.08 × 10−90.6875.3
300770631-1.46 × 10−100.8714
3254149-339.08 × 10−110.9622
3502116-807.44 × 10−110.9751.3
Table 7. Parameters of the equivalent circuits for Bi2Cr0.5Co0.5Nb2O9+Δ synthesized by the solid-phase (1) and Pechini method (2).
1
T, °CR, ΩC, pFP2χ2 × 10⁴
R1R2
1753.10 × 1051.48 × 10633.00.5660.7
2001.40 × 1054.48 × 10532.70.4500.8
22579,5441.79 × 10532.40.5392
25054,13781,02232.20.6344.8
27536,43651,93631.50.7164
30024,69939,73431.00.8083.6
32517,46844,40630.80.9062.7
350830863-0.9934
375366489-13.6
2
T, °CR1, ΩC, pFPCPE1χ2 × 10⁴
1004.60 × 10651.90.5038.5
1251.31 × 10650.90.5466.3
1504.25 × 10549.90.5806
1751.61 × 10548.90.5735
20069,22047.70.5745
22534,77645.70.6396
25019,68044.70.6103.3
27513,24242.70.6875.3
3007706310.8714
3254149-0.9622
3502116-0.9751.3
Disclaimer/Publisher’s Note: The statements, opinions and data contained in all publications are solely those of the individual author(s) and contributor(s) and not of MDPI and/or the editor(s). MDPI and/or the editor(s) disclaim responsibility for any injury to people or property resulting from any ideas, methods, instructions or products referred to in the content.