Article

In Situ Encapsulated RhB@Er-MOF with Dual-Emitting Rationmetric Fluorescence for Rapid and Selective Detection of Fe(III) by Dual-Signal Output

Key Laboratory of Marine Chemistry Theory and Technology, Ministry of Education, College of Chemistry and Chemical Engineering, Ocean University of China, Qingdao 266100, China
*
Authors to whom correspondence should be addressed.
These authors contributed equally to this work.
Chemistry 2025, 7(3), 83; https://doi.org/10.3390/chemistry7030083
Submission received: 21 March 2025 / Revised: 9 May 2025 / Accepted: 9 May 2025 / Published: 21 May 2025

Abstract

:
A novel polyhedron-based anionic Er-MOF with three types of cages and abundant open metal sites (OMSs) and Lewis base sites (LBSs) has been successfully synthesized. The inorganic secondary unit possesses a rarely reported six-connected three-nucleated rare-earth cluster, and the overall framework shows a new (3,3,6)-connected topology. The Er-MOF has good fluorescence selectivity and anti-interference performance with Fe3+ and Cu2+. In addition, benefiting from the anionic framework, nanoscale cavity and small window size of the Er-MOF, the composite RhB@Er-MOF has been synthesized by in situ encapsulation of the cationic dye Rhodamine B (RhB). It can provide dual-emitting fluorescence that facilitates self-calibration in sensing. The RhB@Er-MOF has higher accuracy than the Er-MOF with regard to the fluorescence-selective and anti-interference performance of Fe3+ and quenching coefficient Ksv values of 1.97 × 10⁴ M−1, which are attributed to its self-calibration function that can eliminate environmental interference. The fluorescence quenching mechanism was explained by our experiments and density functional theory (DFT) calculations. Furthermore, RhB@Er-MOF can achieve the visual and rapid selective detection of Fe3+ by a smartphone RGB color analysis application, resulting in the dual-signal output performance of the material.

Graphical Abstract

1. Introduction

Heavy metal pollution has become a global environmental problem and the importance of trace inorganic ion sensing is receiving increased attention [1,2]. Fe3+ plays an important role in biological processes such as hemoglobin formation, oxygen absorption and DNA/RNA synthesis [3]. Nevertheless, long-term exposure to high levels of iron can cause disorders in the body that can lead to conditions such as anemia, cancer, mental decline and diabetes [4,5,6]. Therefore, it is necessary to identify high-sensitivity, convenient detection and analysis technologies for Fe3+ [7,8]. Although there are currently many methods for detecting metal ions that have proven to be effective, they often require expensive instruments, complex sample pretreatment steps and highly skilled personnel [9,10,11]. In contrast, fluorescence sensing methods are powerful optical detection methods due to their short analysis time, low cost-effectiveness and high selectivity and sensitivity [12,13,14].
Metal–organic frameworks (MOFs) have the advantages of porosity, large specific surface area, flexible and adjustable pore structure and large porosity [15]. In particular, the unique pore volume of 3D MOFs can be used to encapsulate or modify meaningful functional groups to enrich the host–guest chemistry of MOFs [16,17,18,19]. Furthermore, MOFs can be excellent candidates for chemical sensors used to detect metal ions by resonance energy transfer or competitive absorption based on the fluorescence enhancement or the quenching of MOF materials [20,21,22,23]. However, many reported MOFs exhibit fluorescence quenching for both Fe3+ and Cu2+ ions, which affects their specific selectivity [24,25,26,27]. The absolute fluorescence intensity of a single emission is variable due to various factors such as light shielding and spatial concentration inhomogeneity [28,29]. Therefore, Dye@MOF composites have been designed and synthesized that encapsulate organic dyes into MOFs with large cages [30,31]. These composites have the following advantages: (i) Organic dyes, as excellent color-developing materials, possess significant optical properties [32]. Dye@MOF composites can realize dual-emission fluorescence from dyes and MOFs. The emission intensity from the two materials can be cross-referenced, effectively improving accuracy and playing a self-calibration role [33]. (ii) The framework of MOFs can effectively limit the aggregation-induced quenching of dye molecules and enhance fluorescence tunability [34,35]. (iii) The composites are beneficial for achieving visual detection based on the changes in dye fluorescence color during the detection process [36,37]. At present, the synthesis of Dye@MOF composites can be roughly divided into two categories: post-synthesis and in situ encapsulation [38]. Post-synthesis can maintain the stability of the dyes by avoiding harsh conditions during the synthesis of MOFs, but the synthesis steps are complex, take several days and can lead to the uneven distribution of the dyes [39]. In situ encapsulation is simple, with a shorter reaction time, and the distribution of dyes is uniform. Furthermore, it is conducive to the formation of “core–shell”-type composites for MOFs with a small window aperture and large cage. This is due to the small window that restricts the entry and exit of encapsulated dyes, thus fixing them in the MOF structure [40].
Based on the above considerations, we firstly constructed a novel anionic Er-MOF [Er3(BDCPPy)6(DMF)4] by choosing rare-earth Er (III) as the metal source and the rigid pyrazine-contained carboxylic acid compound 2,6-bis(3′,5′-dicarboxyphenyl) pyridine (H4BDCPPy) as the organic ligand. The inorganic secondary unit possesses a unique six-connected three-nucleated Er cluster with terminal coordinated molecules to provide open metal sites (OMSs). The uncoordinated pyridine-N from the ligand can provide Lewis base sites (LBSs). The overall framework shows a new (3,3,6)-connected topology with three metal–organic polyhedral cages. The largest cage size is 23.4 Å with a window diameter of about 3.0 Å. As with most reported MOFs, the Er-MOF can selectively detect Fe3+ and Cu2+ from other metal ions by fluorescence quenching. Nevertheless, it is difficult for the Er-MOF to distinguish between Fe3+ and Cu2+. Hence, we further synthesized the composite RhB@Er-MOF by encapsulating Rhodamine B (RhB) in situ into the cage of the Er-MOF. RhB@Er-MOF can rapidly and selectively detect Fe3+ by fluorescence quenching under an ultraviolet lamp, which can be recognized by the RGB analysis of smartphones to achieve real-time signal acquisition of detection results. In addition, it shows higher accuracy than the Er-MOF with a Ksv of 1.97 × 10⁴ M−1 for Fe3+. RhB@Er-MOF possesses dual-emitting fluorescence from RhB and Er-MOF that allows self-calibration, which can reduce environmental interference and improve accuracy. Therefore, the strategy of dual-emitting radiometric fluorescence based on dye-encapsulated MOFs is advisable to improve the sensitivity and selectivity of heavy metal ion detection.

2. Results and Discussion

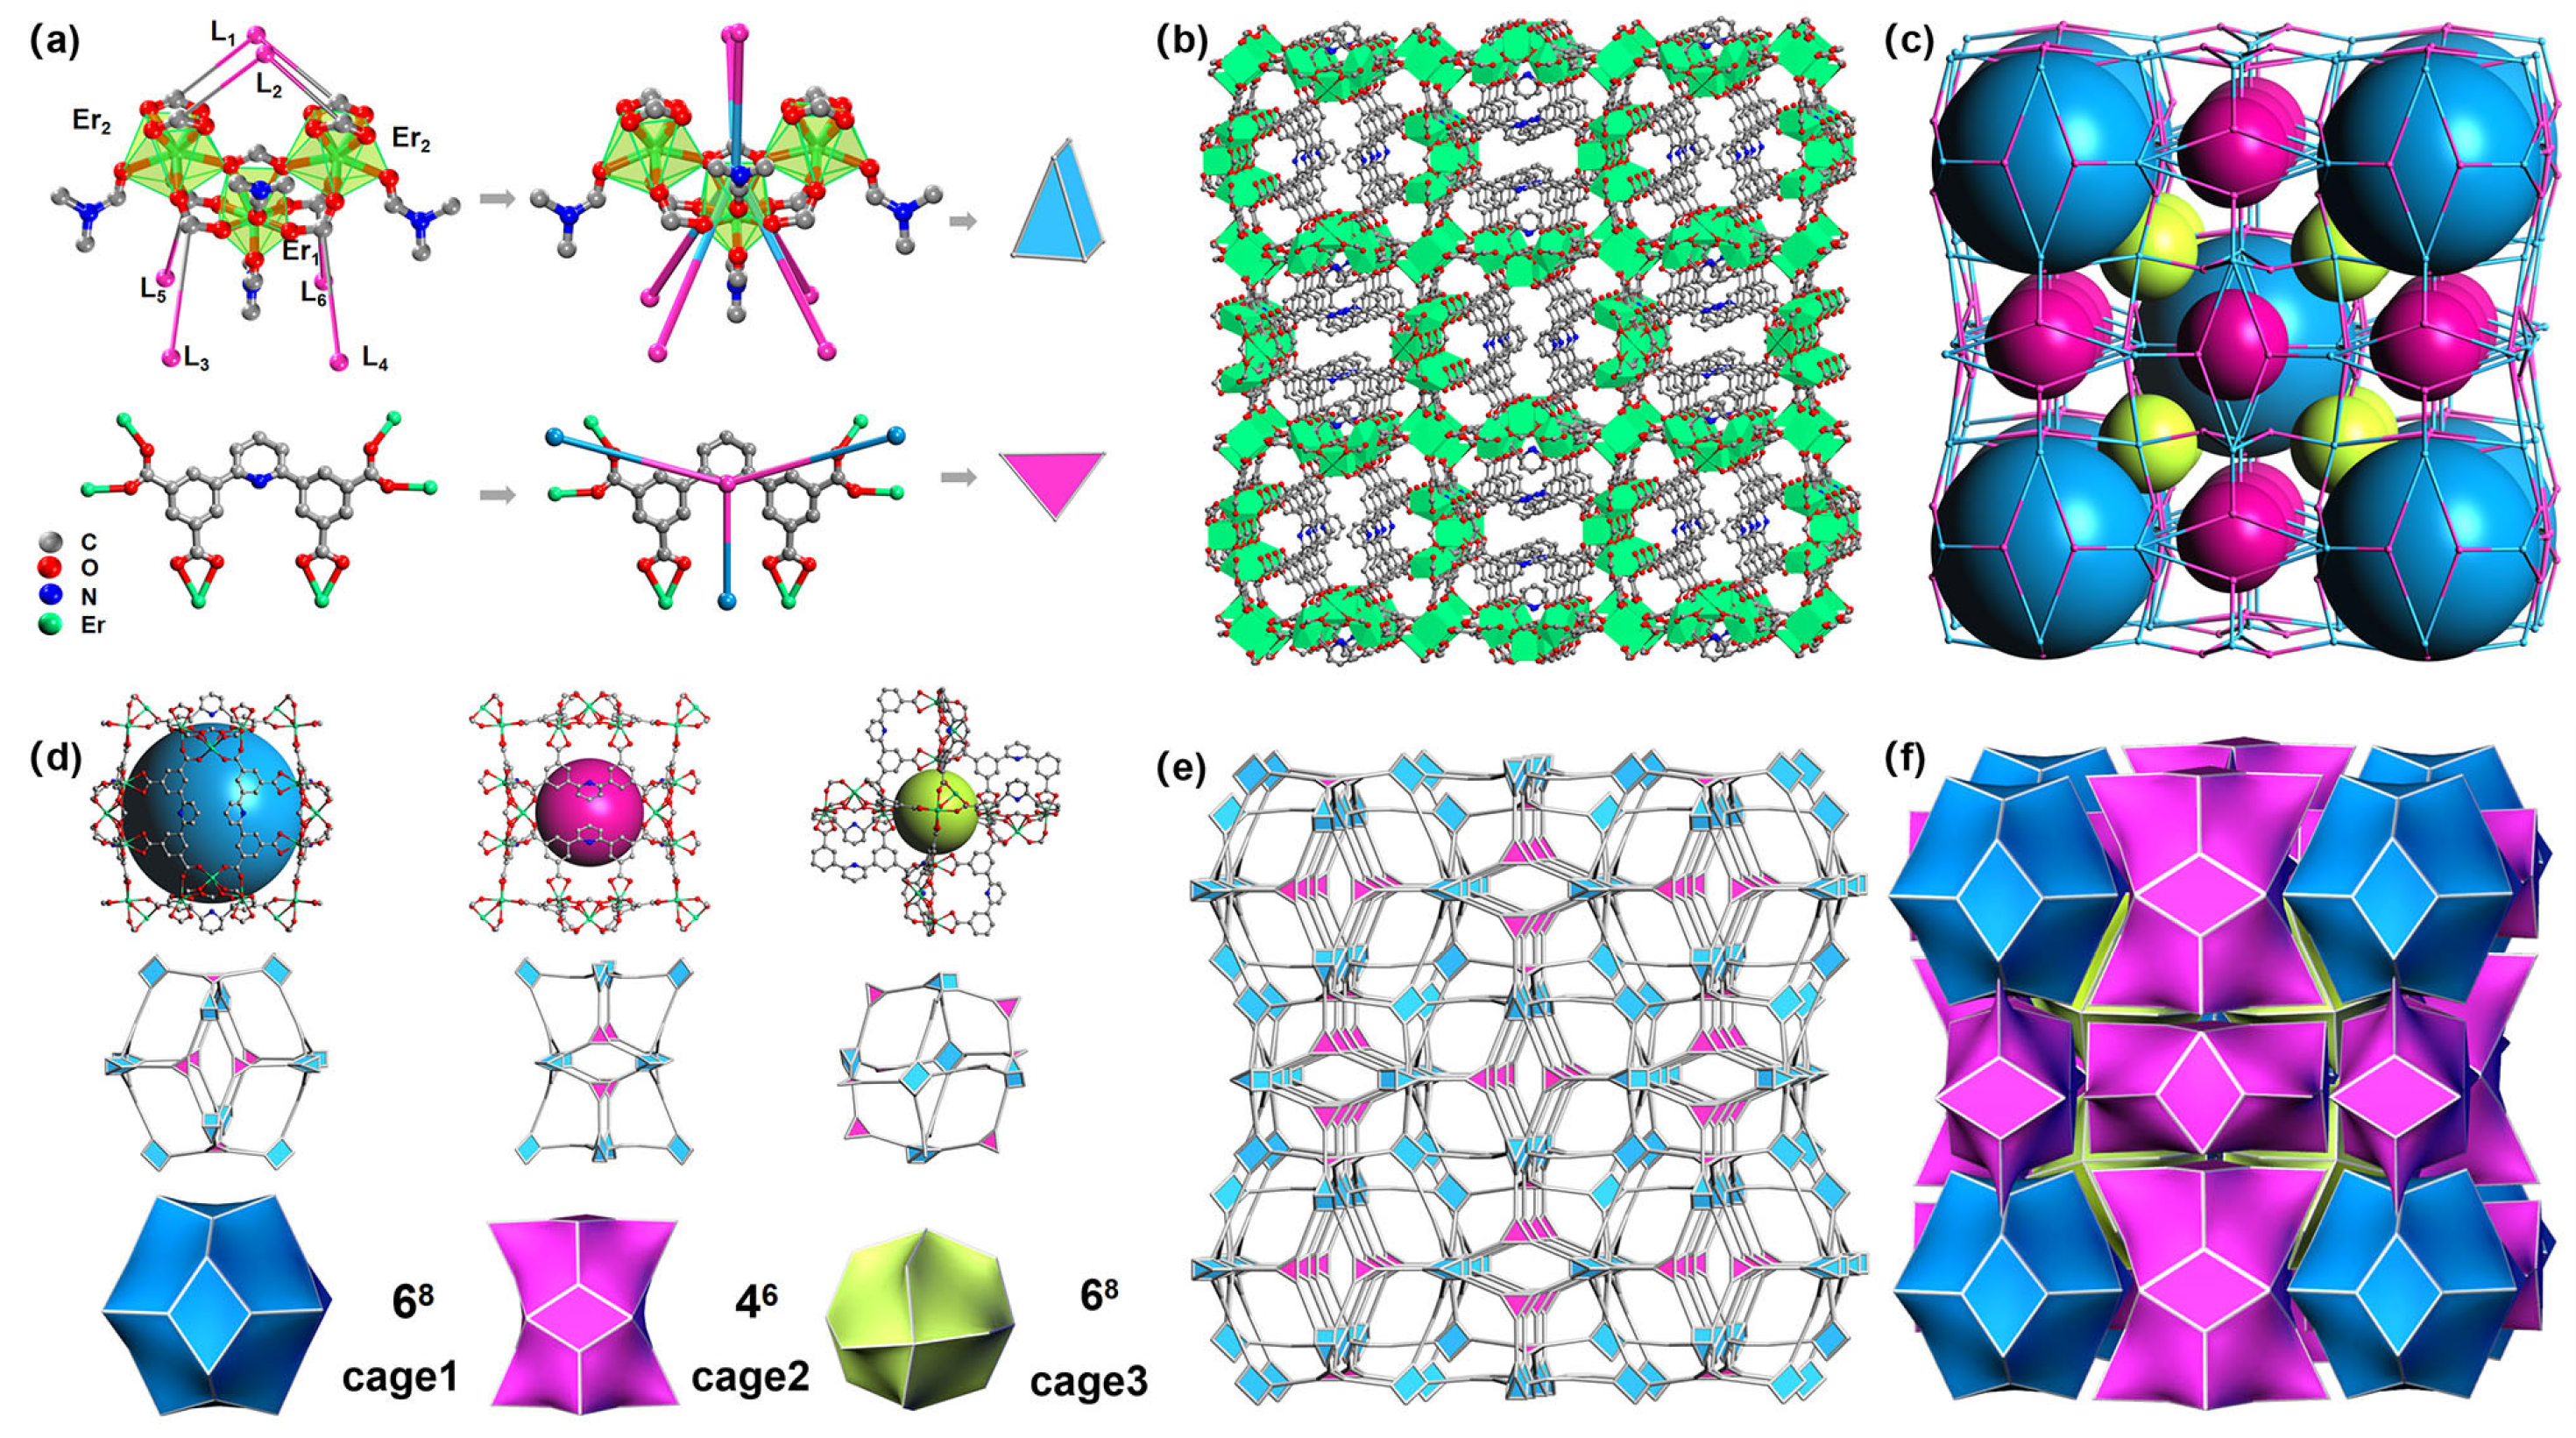
2.1. Crystal Structure

Single-crystal X-ray diffraction confirms that Er-MOF crystallizes in a cubic crystal system with a space group of Im 3 ¯ . As shown in Figure 1a, inorganic SBUs are a rarely reported trinuclear Er metal cluster formed by chelating eight carboxyl groups from six ligands and one formic acid molecule, terminated by four DMF molecules to facilitate the formation of OMSs [41,42,43,44]. Each Er in the metal cluster exhibits octa-coordination: Er (1) is coordinated by four carboxyl oxygen atoms from four ligands, two oxygen atoms from a bridging formic acid molecule and two oxygen atoms from DMF molecules; Er (2) is coordinated by six carboxyl oxygen atoms from four ligands, one oxygen atom from the bridging formic acid molecule and one oxygen atom from a DMF molecule. Although this type of SBU has been previously reported for other rare-earth metals, this work represents the first documented case of its formation with Er [45,46,47]. The ligand is heterofunctional with four carboxyl groups and one pyridine group. All carboxyl groups participate in coordinating and bridging the trinuclear metal clusters, while the non-coordinating pyridine nitrogen atoms provide abundant LBSs. The interconnection of metal clusters and ligands generates an anionic 3D framework containing three distinct types of cages (Figure 1b,c). Both cage 1 and cage 2 are two types of metal–organic polyhedral cages composed of 12 metal clusters and 12 organic ligands. Cage 1 exhibits an inner diameter of 23.4 Å with a window size of 3.0 × 3.0 Å2 considering the van der Waals radius. The inner diameter of cage 2 is 18.5 × 8.2 Å2 with a window size of 3.0 × 3.0 Å2. Cage 3 consists of 6 metal clusters and 12 ligands with an inner diameter of 10.0 Å and a window size of 3.1 Å (Figure 1d). Cage 1 and cage 2 are arranged along the cell axis, while cage 3 is connected to cage 1 and cage 2 by a shared window. The three kinds of cages are arranged in cubic body-centered, cubic face-centered, and cubic primitive form, respectively (Figure S3). In addition, the Er-MOF has straight channels with a size of 4.7 Å along the four diagonals direction of the cube (Figure S4). From the perspective of topology, the inorganic and organic SBUs can be simplified as six and three connected nodes with a triangular prism and triangle geometry, respectively. As shown in Figure 1e, the entire 3D framework possesses a new (3,3,6)-connected topology with a Schlafli symbol of (4.62)2(42.67.86). Topological tiling configurations are shown in Figure 1f, which possesses three kinds of tile, namely [68], [46] and [68], respectively. According to PLATON calculations, Er-MOF has porosity with a solvent-accessible volume of 9488.4 Å3 per unit cell, which counts for 62.0% of the cell volume. The theoretical values of the elemental analysis of the Er-MOF (wt %) are as follows: C, 39.69; H, 2.55; N, 4.45. Moreover, the experimental values (wt %) are as follows: C, 38.77; H, 2.97; N, 4.97.
Due to the anionic framework of Er-MOF, we selected cationic dye RhB to construct the composites RhB@Er-MOF. Although the inner diameter of the cage was large enough to reach the mesoporous level, the small window size hindered the adsorption of organic dye molecules. Therefore, the composite RhB@Er-MOF was synthesized by in situ encapsulation rather than adsorption. As shown in Figure 2, RhB@Er-MOF exhibits a distinct rose-red color, contrasting with the transparent colorless cubic crystals of pristine Er-MOF. In addition, the composite was thoroughly cleaned by an ultrasonic method in fresh DMF for 30 min. The color of the crystals and DMF solution remained, indicating that the dyes had been successfully encapsulated in the Er-MOF and resisted leakage under external forces. The excellent dye encapsulation performance of Er-MOF can be attributed to three key factors: (i) the anionic framework promotes the Coulombic interaction with cationic dyes; (ii) the nanoscale cavity of the polyhedron cage achieved the enrichment of macromolecular dyes; (iii) the small windows of the cage prevented the encapsulated dyes from leaking out. As shown in Figure S5, about 8.5% of low-boiling-point solvents evaporated and lost weight before 100 °C. Before 280 °C, 25.5% of high-boiling-point solvents DMF evaporated and lost weight. The framework of Er-MOF was stable up to 320 °C, and RhB@Er-MOF was stable up to 340 °C. The experimental elemental analysis values (wt%) of RhB@Er-MOF were as follows: C, 41.46; H, 4.24; N, 6.22. By comparing the elemental analysis data of Er-MOF and RhB@Er-MOF, it can be confirmed that RhB was successfully modified into the Er-MOF framework. The increases in the contents of C, H and N were consistent with the molecular composition of RhB, indicating the successful preparation of the target composite material.

2.2. Fluorescence Property

The solid fluorescence spectra of ligand, Er-MOF and RhB@Er-MOF were investigated at room temperature. Fluorescence emission peaks of the ligand and Er-MOF were observed at 380 and 350 nm (Figure S6), respectively. The 30 nm blue shift of Er-MOF was due to the coordination-induced emission (CIE) between the organic ligand and metal ion, which limited intramolecular rotation and adapted the benzene in the ligand to the rigid structure of Er-MOF [48,49]. In contrast, RhB@Er-MOF exhibited two peaks from Er-MOF and RhB at 350 and 584 nm, respectively (Figure S7). The dual peaks of RhB@Er-MOF were conducive to providing a self-calibrating fluorescence detection platform.
We considered Er-MOF and RhB@Er-MOF fluorescence responses in different organic solvents. All samples demonstrated high RFR values across various organic solvents, except for MNT, which exhibited significant fluorescence quenching (Figures S8 and S9). The results demonstrate that they enabled selective fluorescence detection of the organic solvent MNT. After comprehensively considering the stability and dispersity of the materials, DMF was finally selected as the experimental solvent for a series of subsequent experiments.

2.3. Er-MOF Fluorescence Sensing of Metal Ions

The fluorescence sensing performance of Er-MOF toward common contaminant metal cations was investigated. Figure 3a demonstrates that the RFR values of Fe3+ and Cu2+ are significantly lower than those of other metal ions, indicating that Er-MOF exhibits selective detection potential for Fe3+ and Cu2+. Furthermore, the Er-MOF exhibits good anti-interference performance for the detection of Fe3+ and Cu2+ in the presence of a single interfering metal ion (Figure 3b). As shown in Figure 3c,d, the fluorescence intensity of Er-MOF exhibited a gradual decline as the concentrations of Fe3+ and Cu2+ in the solution increased. By fitting the relationship between metal ion concentration and fluorescence intensity with S-V equation, we calculate that the Ksv and LOD values of Er-MOF for Fe3+ and Cu2+ are 1.18 × 10⁴ M−1 and 1.34 μM and 1.15 × 10⁴ M−1 and 1.57 μM, respectively. A six-cycle test shows that Er-MOF maintains good fluorescence properties, indicating that it has good stability and cyclic properties during the detection of Fe3+ and Cu2+ (Figure 3e,f).

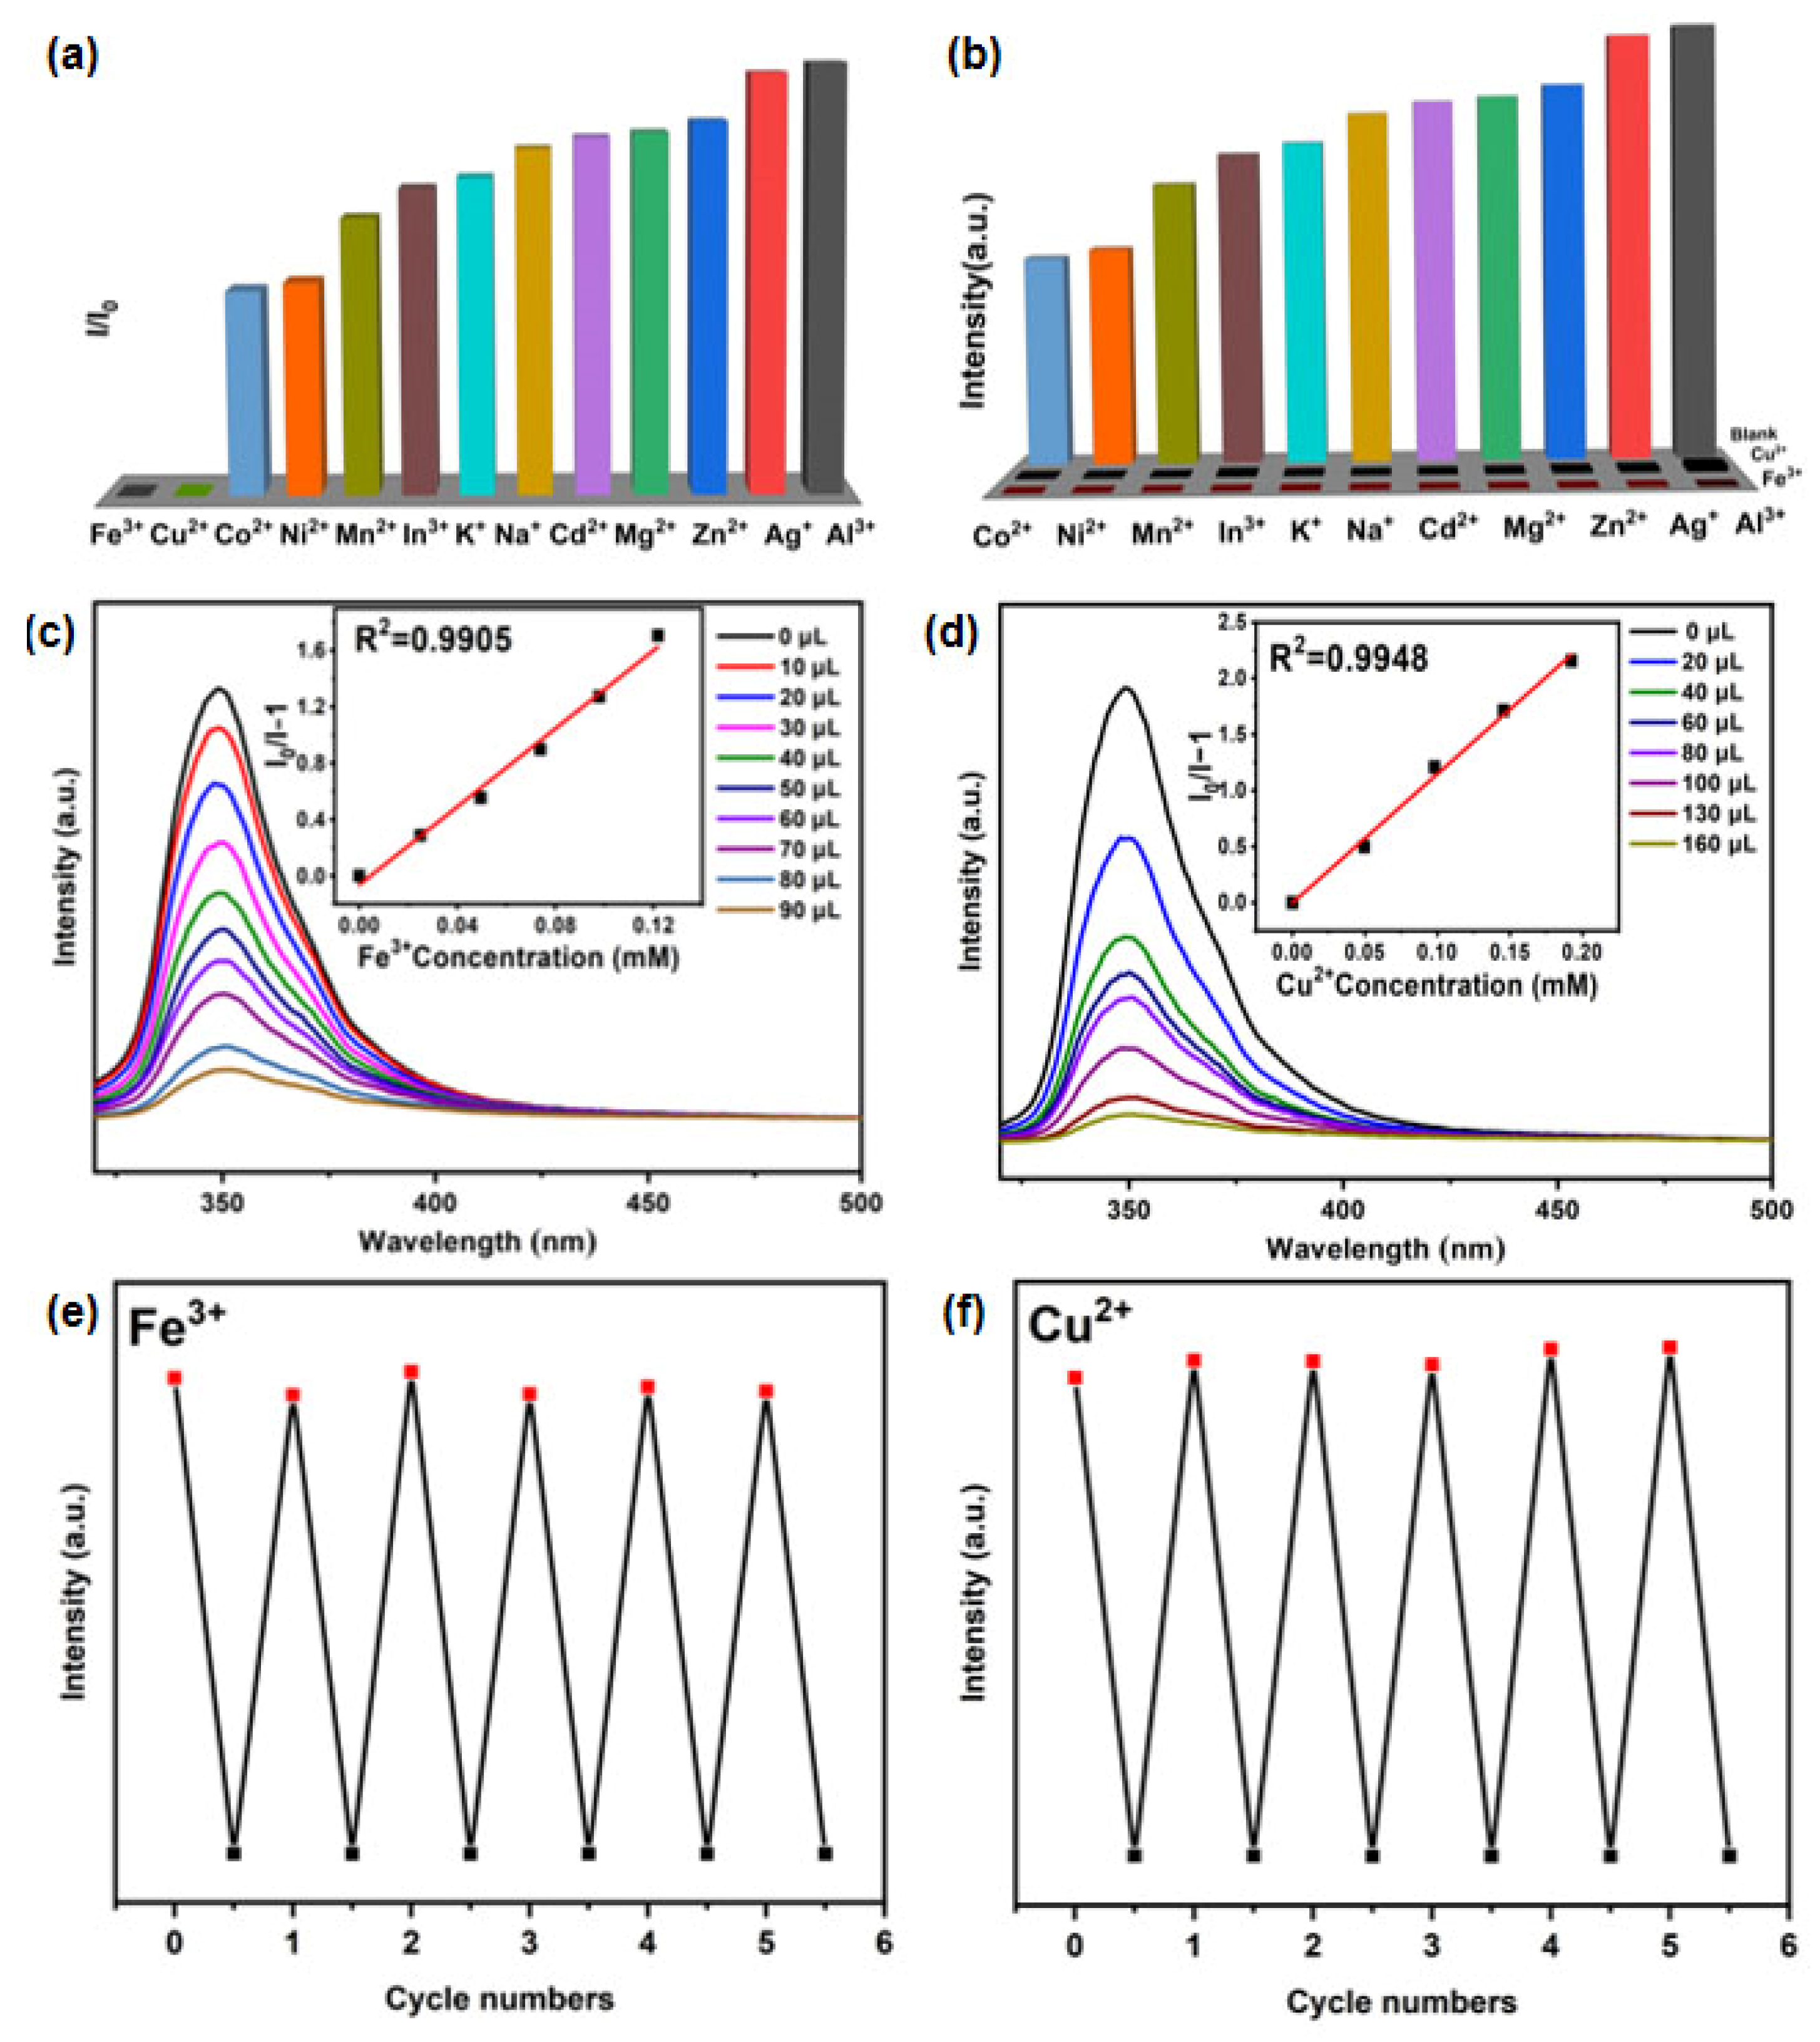
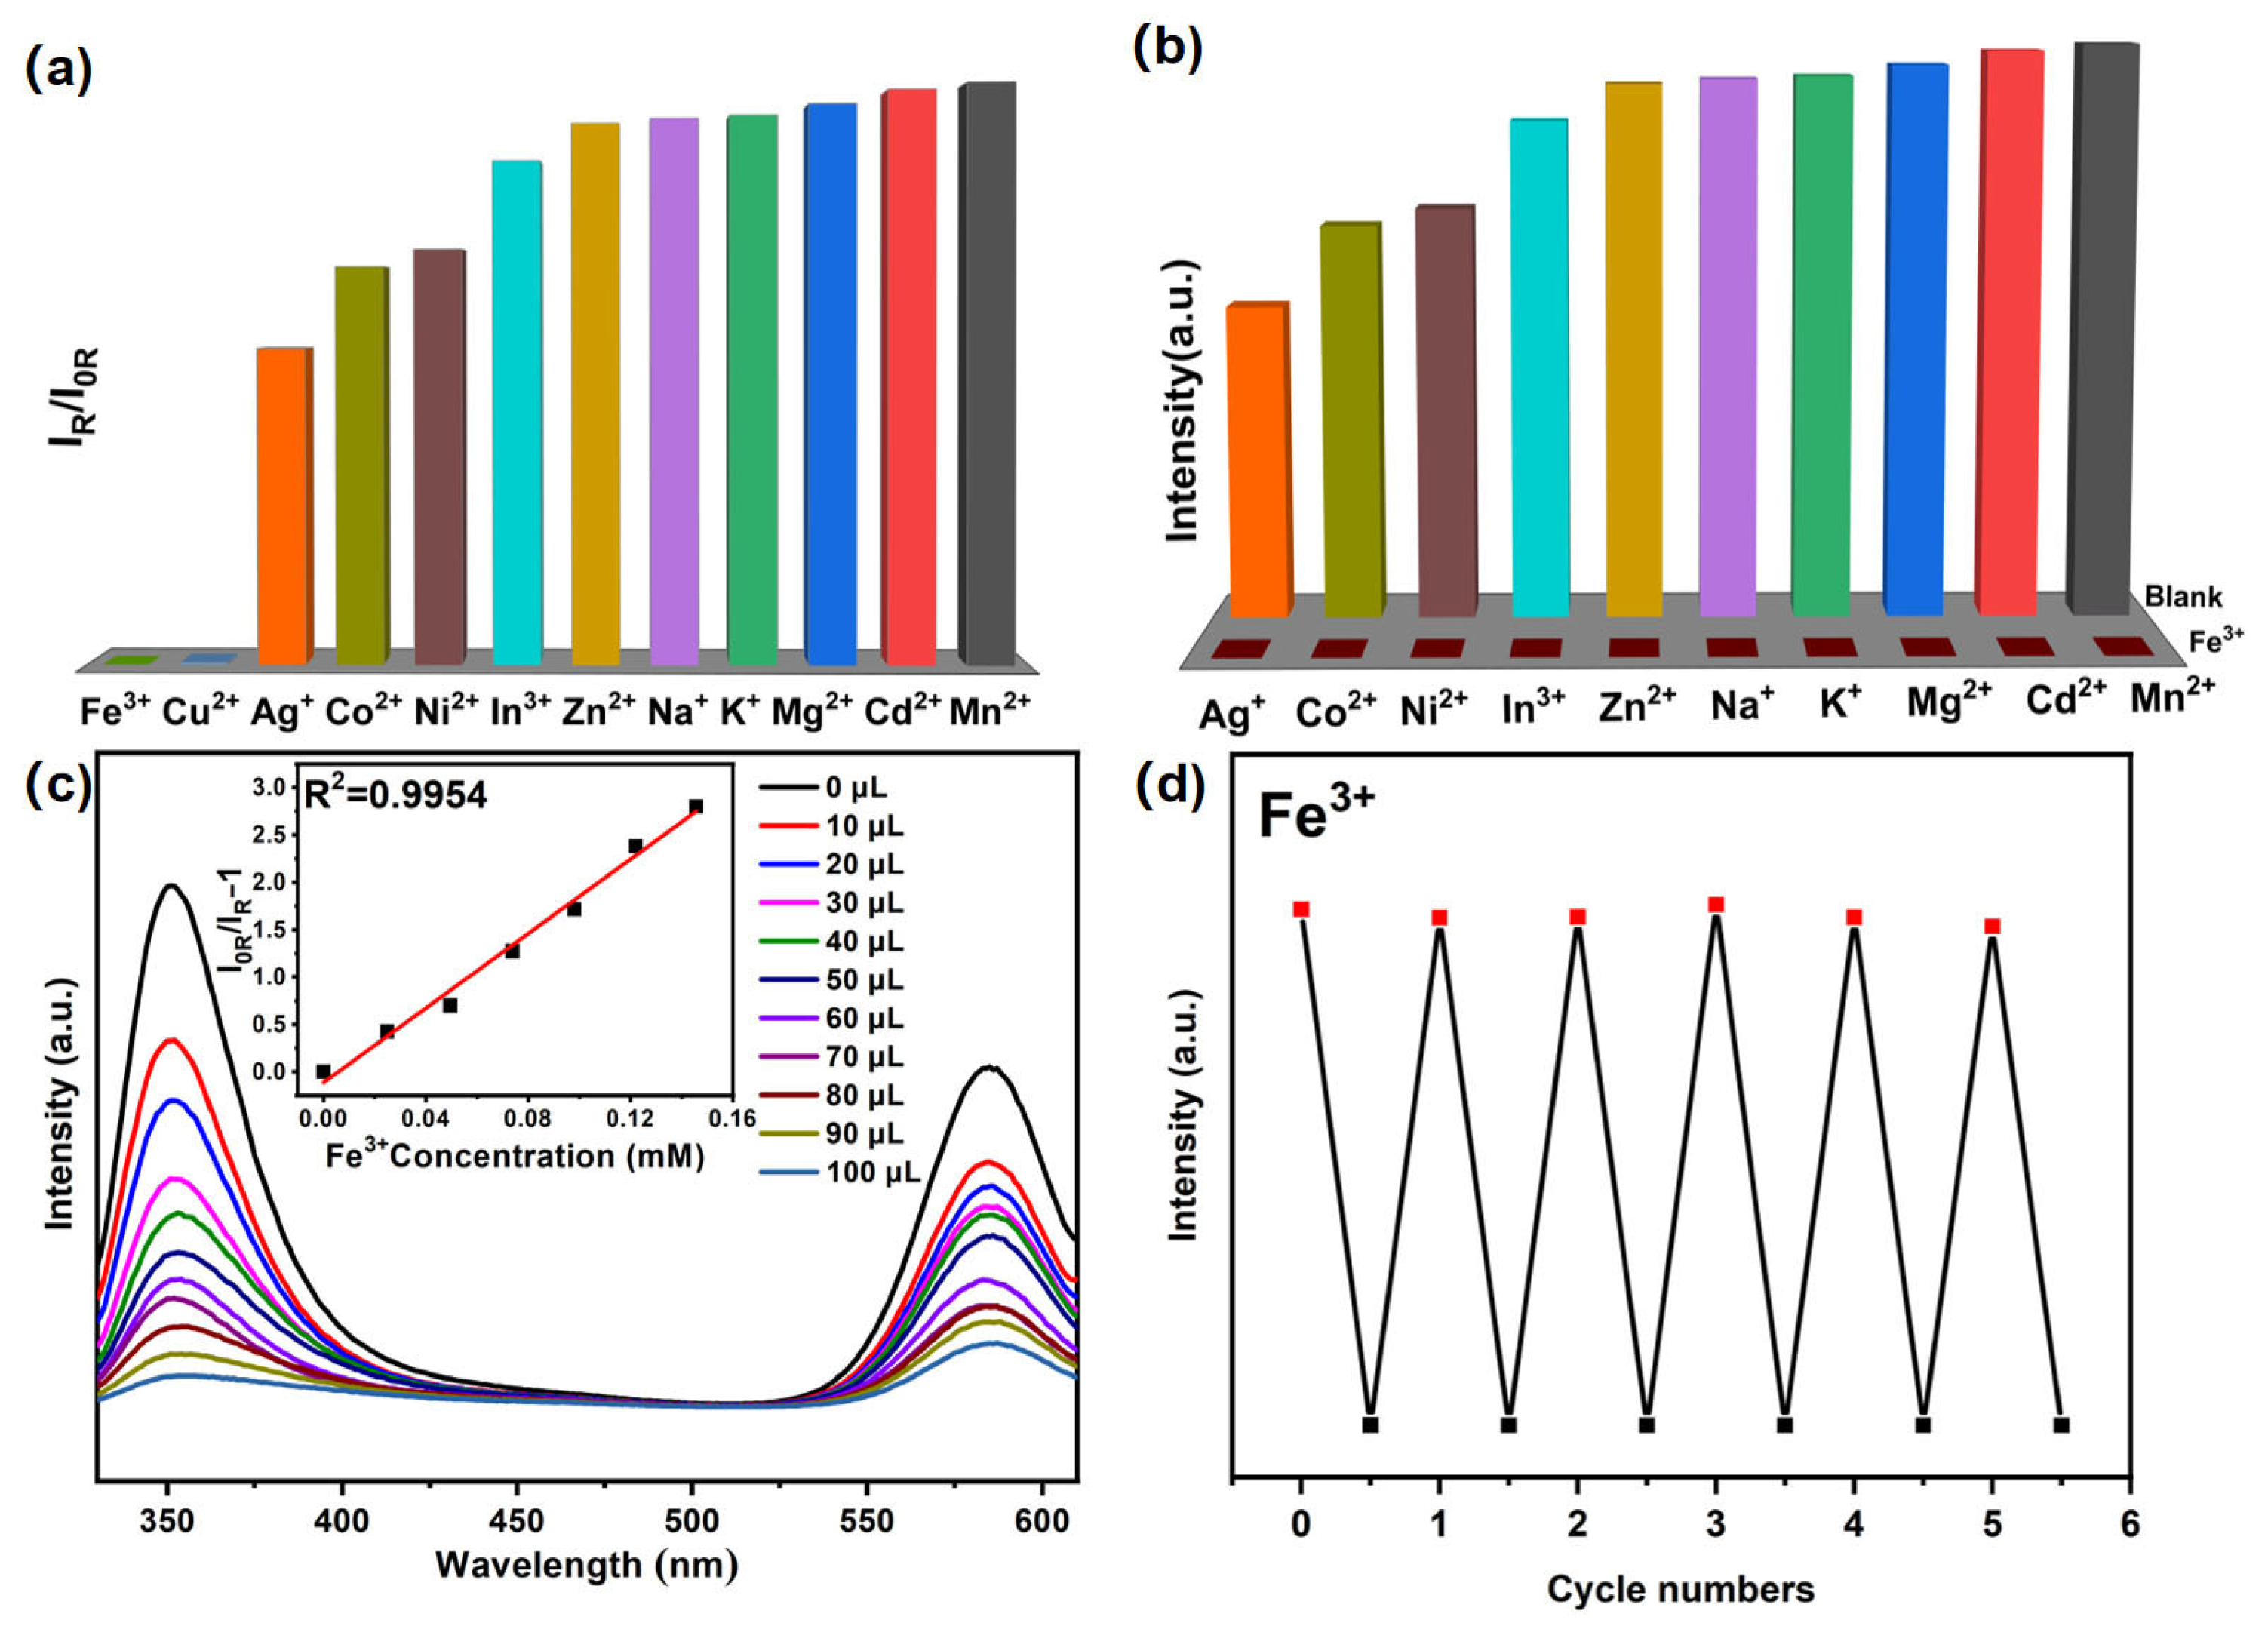
2.4. RhB@Er-MOF Fluorescence Sensing of Metal Ions

Following the incorporation of RhB dye molecules, the RhB@Er-MOF composite exhibits dual emission maxima at 350 nm (attributed to Er-MOF) and 584 nm (from RhB), enabling ratiometric fluorescence sensing for self-calibrated detection. Therefore, the relative fluorescence intensity (RFI) is used as the output signal. The RFI of RhB@Er-MOF in solution is expressed by I0R without analyte and IR with analyte, where I0R and IR are equal to the ratio of the fluorescence intensity between 350 nm and 584 nm. Similar to the Er-MOF, the composite RhB@Er-MOF can also selectively detect Fe3+ and Cu2+ in various metal ions, and it has both anti-interference and recyclability (Figure 4 and Figure S9). By using the S-V equation, the Ksv and LOD values of RhB@Er-MOF obtained by self-calibration for Fe3+ and Cu2+ are 1.97 × 10⁴ M−1 and 0.57 μM and 4.26 × 10³ M−1 and 0.30 μM, respectively. Compared with Er-MOF, RhB@Er-MOF exhibits a higher Ksv value through self-calibration, indicating that it has superior detection performance for Fe3+. Furthermore, the Ksv value of Cu2+ determined via self-calibration decreases significantly, indicating a reduced sensitivity of the material toward Cu2+. The binding energy shift between the N/O sites in Fe3+ and RhB@Er-MOF is significantly greater than that in the Cu2+ system, indicating a stronger coordination effect [50]. Fe3+ (3d5) has a higher Lewis acidity than Cu2+ (3d9) and is more likely to accept ligand electrons [51]. The overlap of the Fe3+ absorption band with the RhB@Er-MOF emission spectrum is 3.2 times that of Cu2+, and this matching difference increases the energy transfer efficiency by approximately 5 times (Figure 5a,b). Therefore, selective detection ability of RhB@Er-MOF for Fe3+ is further improved by self-calibration.

2.5. Fluorescence Detection Mechanism

We explored the mechanism governing the selective quenching of RhB@Er-MOF fluorescence in the presence of Fe3+ and Cu2+ via PXRD, UV–vis absorption spectroscopy and DFT calculation. The PXRD patterns of MOFs treated with Fe3+ and Cu2+ DMF solutions were almost identical to those of untreated samples, which ruled out the possibility of fluorescence quenching caused by structural collapse (Figures S12 and S13). By comparison, it was observed that the UV absorption band of Cu2+ overlapped only with fluorescence excitation peaks of the Er-MOF and RhB@Er-MOF, indicating that fluorescence quenching caused by Cu2+ resulted from competitive absorption (Figure 5a,b) [52,53,54,55]. However, the UV absorption peak of Fe3+ overlapped with the fluorescence emission and absorption bands of Er-MOF and RhB@Er-MOF, indicating that the selective recognition of Fe3+ arose from a synergistic effect of resonance energy transfer and competitive absorption [42,56]. DFT was used to calculate the LUMO and HOMO energies (Figure 5c). The LUMOs of H4BDCPPy + Cu2+ and H4BDCPPy + Fe3+ were lower than the ligand, indicating that photoelectron transfer (PET) existed between the MOFs and analytes due to lower transition energy level. These results indicate that Er-MOF and RhB@Er-MOF could effectively detect Fe3+ and Cu2+.

2.6. Portable Fe(III) Sensing Platform Based on RhB@Er-MOF

Although RhB@Er-MOF possesses good performance in selective, anti-interference and cyclicity for Fe3+ and Cu2+ detection, it is difficult to distinguish the two metal ions. Therefore, a portable sensing platform integrating a detection agent and smartphone was designed, enabling real-time detection [49]. A total of 10 mg fully ground RhB@Er-MOF was dispersed in 2 mL of DMF by ultrasonic homogenization and irradiated with 365 nm of fluorescence excitation wavelength. By using a smartphone equipped with a color extraction app for image capture and signal acquisition, the platform enabled real-time dynamic color extraction and image analysis. As for Er-MOF, it exhibited no observable color emission under UV irradiation, which precluded its applications in visual detection. In contrast, RhB@Er-MOF exhibited obvious pink emission under a 365 nm UV lamp, which was conducive to naked-eye recognition during the fluorescence detection process. Notably, the characteristic pink emission of RhB@Er-MOF was entirely quenched upon the addition of Fe3+, while substantial pink fluorescence remained upon exposure to Cu2+. (Figure S14). This phenomenon indicated that RhB@Er-MOF could make up for the deficiency of Er-MOF in selectively detecting Fe3+ from solution containing Cu2+. Due to the fluorescent emission color of RhB@Er-MOF being pink, the red channel (R) channel signal response of RGB results had an obvious response to Fe3+ (Figure 6a). The linear range between the response value in R channel and the concentration of Fe3+ was 0.1–1.0 mM. The fitted linear equation was R value = −195.5 × [M] + 224.4 (R2 = 0.9893), and the LOD value was 63.8 μM (Figure 6b). The reproducibility of the method was evaluated five times with the same concentration of Fe3+ (0.4 mM). The low relative standard deviation (RSD) of 2.62% indicated that it could produce repeatable results (Figure 6c).

3. Experimental Section

3.1. Materials and Methods

The solvents and reagents were of analytical grade and purchased from commercial sources without further purification. Bruker D8 Advance Powder X-ray diffrotometer was used to obtain powder X-ray diffraction (PXRD) patterns using Cu-Kα radiation at 40 kV and 40 mA to verify the crystallinity of MOF. Fluorescence experiments were performed on an F-4600 (Hitachi). UV–vis absorption spectra were recorded at room temperature by a spectrophotometer (Shimadzu, UV-2550, Kyoto, Japan). Thermogravimetric analysis (TGA) was performed using a simultaneous thermal analyzer (Mettler Toledo, TGA/DSC 3+, Hong Kong, China) at a heating rate of 10 °C/min under nitrogen atmosphere. Organic Elemental Analysis (EA) was performed by Vario EL III (Elementar, Langenselbold, Germany).

3.2. Synthesis of Er-MOF

Er(NO3)3·5H2O (18 mg, 0.04 mmol) and the organic ligand H4BDCPPy (4 mg, 0.01 mmol) were added to a 20 mL screw-capped vial with 1 mL of N,N-dimethylformamide (DMF) as a solvent. Then, 1 mL of acetonitrile and 0.3 mL of HNO3 (2.8 M) were added. The mixture was sonicated and heated in an oven for 24 h at 105 °C. The obtained colorless transparent square crystals were washed with fresh DMF and dried at room temperature.

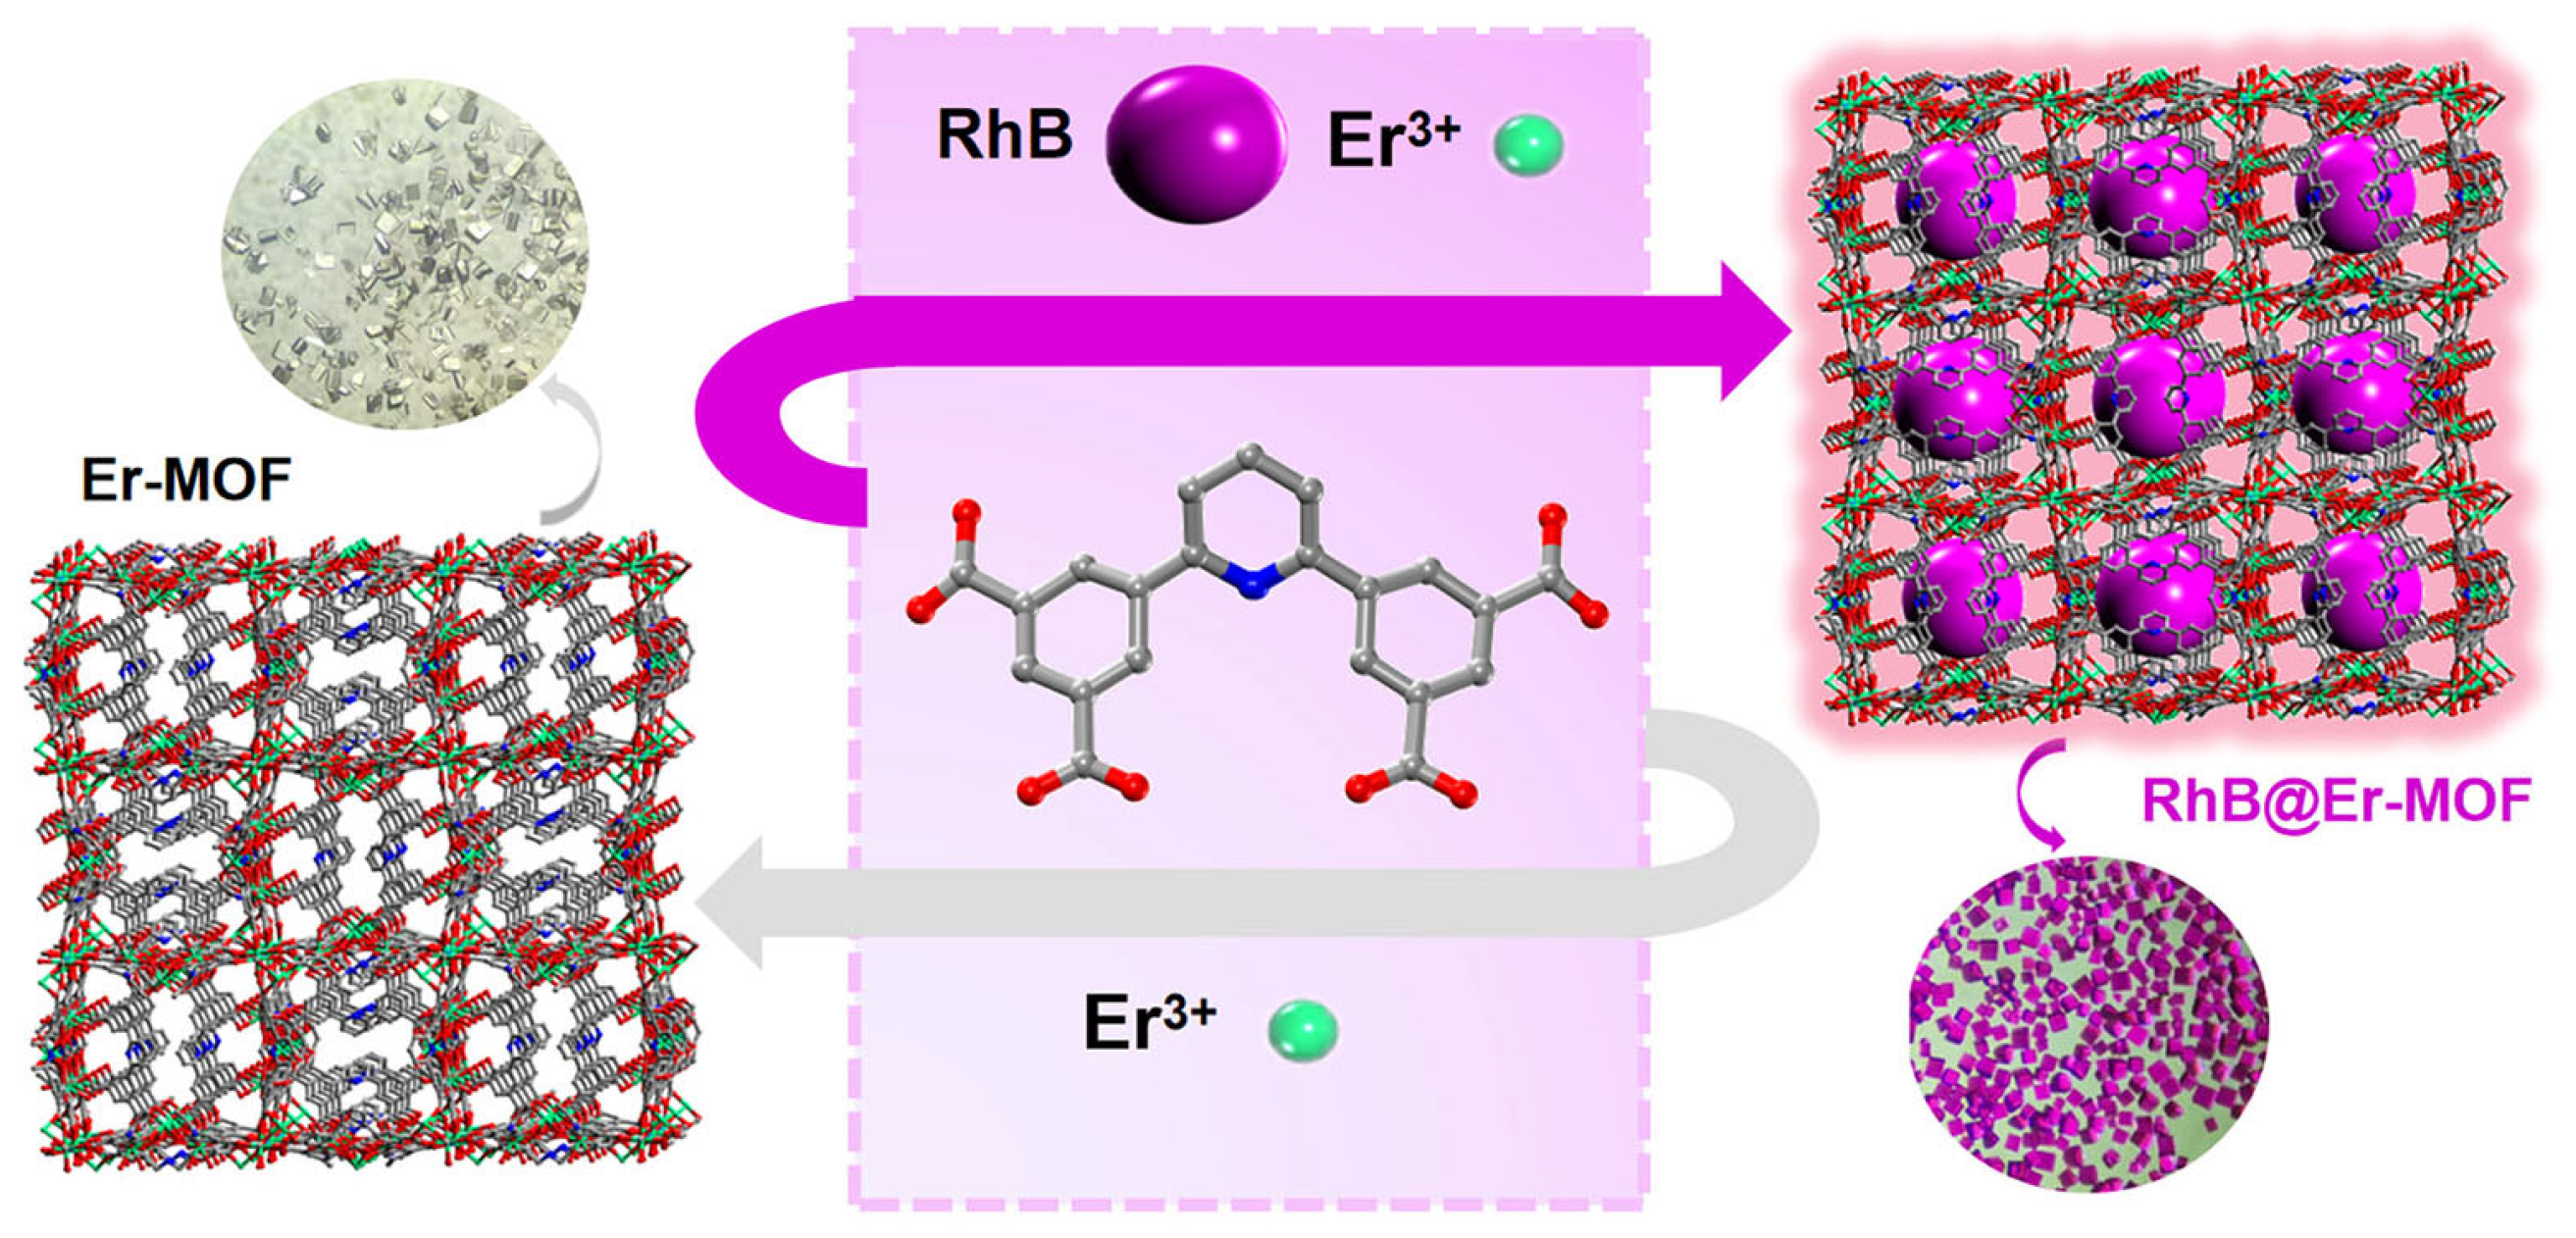
3.3. Synthesis of RhB@Er-MOF

Er(NO3)3·5H2O (18 mg, 0.04 mmol), organic ligand H4BDCPPy (4 mg, 0.01 mmol) and RhB (2 mg 0.004 mmol) were added to a 20 mL screw-capped vial with 1 mL of DMF as a solution. After sonication and dissolution, we added 0.5 mL of acetonitrile and 0.2 mL of HNO3 (2.8 M) to the mixture. Rose-red transparent block crystals were obtained after being heated in a 105 °C oven for 24 h. The product was washed several times with fresh DMF until the solution was clear and dried at room temperature.

3.4. X-Ray Crystallography

The structural refinement and crystallographic data of Er-MOF were obtained using monochromiated Cu-kα (λ = 0.71073 Å) radiation at 298 K using a Bruker Apex II CCD diffractometer. The positions of the metal atoms were first determined, and then the oxygen and carbon atoms of the compound were found from the Fourier diagram. The hydrogen atoms of the ligands were arranged in geometric order. All non-hydrogen atoms were anisotropically refined. All calculations were performed using SHELXTL-NT version 5.1 on F2 for full-matrix least squares refinement, using the direct method to solve the structure [28]. TOPOS 4.0 was used to calculate the topology information of Er-MOF [33]. Detailed crystallographic data are listed in Table S1. Crystallographic data for Er-MOF (2414352) were deposited with the Cambridge Crystallographic Data Centre.

3.5. Fluorescence Sensing Experiments

The solid-state fluorescence properties of ligands, Er-MOF and RhB@Er-MOF were studied at room temperature. The detection performances of samples for organic solvent molecules and metal ions were studied by photofluorescence (PL) spectroscopy. The samples were thoroughly ground and ultrasonic for 30 min to fully disperse the 2 mg sample in 2 mL organic solvents or nitrate metal ions in DMF solution. Organic solvents were DMF, N-methylformamide (NMF), ethanol (EA), dimethyl sulfoxide (DMSO), cyclohexane (CYH), isopropyl alcohol (IPA), acetonitrile (ACN), N, N’-dimethylacetamide (DMA), 1,4-dioxy (DOA), tetrahydrofuran (THF) and M-nitrotoluene (MNT). The metal ions were 10 mM nitrate of Al3+, Ag+, Zn2+, Mg2+, Cd2+, Na+, K+, In3+, Mn2+, Ni2+, Co2+, Fe3+ and Cu2+. The detection sensitivity of three samples for the metal ion were explored by measuring the fluorescence intensity of a 3 mg ground sample in 2 mL of DMF solution with a gradually increased ion concentration. The residual fluorescence ration (RFR) defined as I/I0 was used to determine the detection effect of the compound on various organic solvent molecules, where I0 and I represent the fluorescence intensity of the compound in DMF solution and analysts. The Stern–Volmer (S-V) plot was used to quantify the quenching phenomenon I0/I = Ksv [M]+1, where [M] is the molar concentration of metal ions and Ksv is the quenching constant [48,49]. In addition, the limit of detection (LOD) of the sample was calculated to confirm the sensitivity by using the formula LOD = 3σ/Ksv, where σ is the standard deviation of the 5 repeated fluorescence measurements for the blank solution. The anti-interference properties were also determined. The 3 mg sample was uniformly dispersed in 2 mL of 10 mM competitive metal ion DMF solutions, and then 1 mL or 10 mM of Cu2+ or Fe3+ was added.

3.6. Density Functional Theory (DFT) Calculation

Geometry optimization was conducted to evaluate the energy levels of the lowest unoccupied molecular orbitals (LUMOs) and highest occupied molecular orbitals (HOMOs). The optimization was performed using Dmol3 from the Materials Studio 2019 package. The all-electron interaction theory (AER) potential considers the interaction between electrons and ions. All atoms were allowed to spin unrestricted during the structure optimization process. The GGA-PBE functional and DNP 3.5 basis sets were used for the calculations. The convergence criterion of the electronic self-consistent field (SCF) loop was set to 10−6 with an energy of 10−5 Ha, a force constant of 0.002 Ha/Å, a displacement of 0.005 Å, and a value of smearing of 0.05 Ha [50,51].

4. Conclusions

In summary, we successfully synthesized a novel anionic Er-MOF (C52H40Er3N5O21) with a rare trinuclear Er cluster and a new topology. Due to the presence of a polyhedral cage and OMSs and LBSs in the structure, the material enabled the fluorescence selectivity and cyclic sensing of Fe3+ and Cu2+, demonstrating good anti-interference performance. The composite RhB@Er-MOF was further synthesized by the in situ dye encapsulation method. The material exhibited dual-emission fluorescence of the MOF and RhB, enabling it to serve as a ratiometric fluorescence sensor with self-calibration for interference reduction. Hence, RhB@Er-MOF had higher accuracy than Er-MOF for the fluorescence selective and anti-interference performance of Fe3+ with quenching coefficient Ksv values of 1.97 × 10⁴ M−1. The experimental and DFT theoretical results indicate that fluorescence quenching by Fe3+ was attributed to resonance energy transfer, competitive absorption and PET. In addition, using smartphone RGB color analysis application, the composite could realize the visual fast selective detection of Fe3+ by fluorescence quenching under ultraviolet lamps. Therefore, the preparation of material properties by the dye encapsulation strategy is an effective method for improving the selective sensing performances of MOF-based materials for inorganic ions.

Supplementary Materials

The following supporting information can be downloaded at https://www.mdpi.com/article/10.3390/chemistry7030083/s1, Figure S1: The coordination patterns of tri-nuclear metal clusters of Er-MOF. Figure S2: The topological features of the Er-MOF. Figure S3: The three types of cages and the corresponding topology. Figure S4: Space-filling model for Er-MOF in the [111] direction. Figure S5: The TGA curves for Er-MOF and RhB@Er-MOF. Figure S6: The fluorescence spectra of Er-MOF and the ligand. Figure S7: The fluorescence spectra of RhB@Er-MOF and the ligand. Figure S8: RFR of Er-MOF in different organic solvent molecules. Figure S9: RFR of RhB@Er-MOF in different organic solvent molecules. Figure S10: The fluorescence detection performance of RhB@Er-MOF: (a) RFR in different metal ions. (b) Anti-interference to Cu2+. (c) Fluorescence spectrum by the incremental addition Cu2+ (inset: S-V linear fit graph). (d) Recycle performance for Cu2+ detection. Figure S11: The PXRD patterns of simulated, experimental and MNT-treated Er-MOF. Figure S12: The PXRD patterns of simulated, experimental, Fe3+-treated and Cu2+-treated Er-MOF. Figure S13: The PXRD patterns of simulated, experimental Er-MOF and experimental Fe3+-treated and Cu2+-treated RhB@Er-MOF. Figure S14: The fluorescence color change for RhB@Er-MOF after adding Fe3+ and Cu2+. Figure S15: The adsorption curves of Er-MOF for N2 at 77 K. Figure S16: The UV–vis adsorption spectra of the supernatant solution. Table S1: The crystal data and structure refinements for Er-MOF. Table S2: A comparison of various MOFs used for the sensing of Fe(III) [57,58,59,60,61].

Author Contributions

D.Z., X.Y. and X.L.: Conceptualization; data curation; formal analysis; investigation; methodology; software. K.Z.: Data curation; formal analysis; methodology; software. X.Z. and H.S.: Data curation; software. H.W. and L.L.: Guidance; Financial support. S.Y. and W.W.: Conceptualization; supervision; validation. All authors have read and agreed to the published version of the manuscript.

Funding

The authors acknowledge the support from the Natural Science Foundation of Shandong Province (ZR2021MB075), the National Natural Science Foundation of China (No. U21B2099; 22208377; 51602297), and the Fundamental Research Funds for the Central Universities, Ocean University of China (202461021 and 202364004).

Institutional Review Board Statement

Not applicable.

Informed Consent Statement

Not applicable.

Data Availability Statement

All data generated or analyzed during this study are included in the main manuscript and Supplementary Materials. Additional information or datasets can be made available by the corresponding author upon reasonable request.

Conflicts of Interest

The authors declare no conflicts of interest.

References

  1. Xue, Y.; Peng, Y.; Geng, Z.; Wang, Y.; Ung, C.O.L.; Hu, H. Metal-organic frameworks (MOFs) based analytical techniques for food safety evaluation. eFood 2021, 2, 1–12. [Google Scholar] [CrossRef]
  2. Thakur, S.; Singh, L.; Wahid, Z.A.; Siddiqui, M.F.; Atnaw, S.M.; Din, M.F.M. Plant-driven removal of heavy metals from soil: Uptake, translocation, tolerance mechanism, challenges, and future perspectives. Environ. Monit. Assess. 2016, 188, 206. [Google Scholar] [CrossRef] [PubMed]
  3. Li, Y.; Zhang, X.; Wang, Z.; Zhao, L.; Li, Y. Highly sensitive Fe3+ luminescence detection via single-ion adsorption. Chin. Chem. Lett. 2024, 35, 108532. [Google Scholar] [CrossRef]
  4. Boudebbouz, A.; Boudalia, S.; Bousbia, A.; Habila, S.; Boussadia, M.I.; Gueroui, Y. Heavy metals levels in raw cow milk and health risk assessment across the globe: A systematic review. Sci. Total Environ. 2021, 751, 141830. [Google Scholar] [CrossRef]
  5. Gall, J.E.; Boyd, R.S.; Rajakaruna, N. Transfer of heavy metals through terrestrial food webs: A review. Environ. Monit. Assess. 2015, 187, 201. [Google Scholar] [CrossRef]
  6. Gomes Júnior, O.; Borges Neto, W.; Machado, A.E.H.; Daniel, D.; Trovó, A.G. Optimization of fipronil degradation by heterogeneous photocatalysis: Identification of transformation products and toxicity assessment. Water Res. 2017, 110, 133–140. [Google Scholar] [CrossRef]
  7. Xu, G.; Song, P.; Xia, L. Examples in the detection of heavy metal ions based on surface-enhanced Raman scattering spectroscopy. Nanophotonics 2021, 10, 4419–4445. [Google Scholar] [CrossRef]
  8. Han, X.; Wang, D.-E.; Chen, S.; Zhang, L.; Guo, Y.; Wang, J. A new rhodamine-based chemosensor for turn-on fluorescent detection of Fe3+. Anal. Methods 2015, 7, 4231–4236. [Google Scholar] [CrossRef]
  9. Naik, S.; Jujjavarapu, S.E. Self-powered and reusable microbial fuel cell biosensor for toxicity detection in heavy metal polluted water. J. Environ. Chem. Eng. 2021, 9, 105318. [Google Scholar] [CrossRef]
  10. He, G.; Peng, H.; Liu, T.; Yang, M.; Zhang, Y.; Fang, Y. A novel picric acid film sensor via combination of the surface enrichment effect of chitosan films and the aggregation-induced emission effect of siloles. J. Mater. Chem. 2009, 19, 7347–7353. [Google Scholar] [CrossRef]
  11. Hao, J.; Liu, F.; Liu, N.; Zeng, M.; Song, Y.; Wang, L. Ratiometric fluorescent detection of Cu2+ with carbon dots chelated Eu-based metal-organic frameworks. Sens. Actuators B Chem. 2017, 245, 641–647. [Google Scholar] [CrossRef]
  12. Anastas, P.; Eghbali, N. Green chemistry: Principles and practice. Chem. Soc. Rev. 2010, 39, 301–312. [Google Scholar] [CrossRef]
  13. Wu, D.; Sedgwick, A.C.; Gunnlaugsson, T.; Akkaya, E.U.; Yoon, J.; James, T.D. Fluorescent chemosensors: The past, present and future. Chem. Soc. Rev. 2017, 46, 7105–7123. [Google Scholar] [CrossRef]
  14. Malik, L.A.; Bashir, A.; Qureashi, A.; Pandith, A.H. Detection and removal of heavy metal ions: A review. Environ. Chem. Lett. 2019, 17, 1495–1521. [Google Scholar] [CrossRef]
  15. Kreno, L.E.; Leong, K.; Farha, O.K.; Allendorf, M.; Van Duyne, R.P.; Hupp, J.T. Metal-organic framework materials as chemical sensors. Chem. Rev. 2011, 112, 1105–1125. [Google Scholar] [CrossRef]
  16. Gutiérrez, M.; Zhang, Y.; Tan, J.C. Confinement of luminescent guests in metal-organic frameworks: Understanding pathways from synthesis and multimodal characterization to potential applications of LG@MOF Systems. Chem. Rev. 2022, 122, 10438–10483. [Google Scholar] [CrossRef]
  17. Guo, B.B.; Yin, J.C.; Li, N.; Fu, Z.X.; Han, X.; Xu, J.; Bu, X.H. Recent progress in luminous particle-encapsulated host–guest metal-organic frameworks for optical applications. Adv. Opt. Mater. 2021, 9, 2100283. [Google Scholar] [CrossRef]
  18. Nagarkar, S.S.; Desai, A.V.; Ghosh, S.K. Engineering metal-organic frameworks for aqueous phase 2,4,6-trinitrophenol (TNP) sensing. CrystEngComm 2016, 18, 2994–3007. [Google Scholar] [CrossRef]
  19. Rubab, L.; Anum, A.; Al-Hussain, S.A.; Irfan, A.; Ahmad, S.; Ullah, S.; Al-Mutairi, A.A.; Zaki, M.E.A. Green chemistry in organic synthesis: Recent update on green catalytic approaches in synthesis of 1,2,4-Thiadiazoles. Catalysts 2022, 12, 1329. [Google Scholar] [CrossRef]
  20. Yan, B. Luminescence response mode and chemical sensing mechanism for lanthanide-functionalized metal-organic framework hybrids. Inorg. Chem. Front. 2021, 8, 201–233. [Google Scholar] [CrossRef]
  21. Karmakar, A.; Li, J. Luminescent MOFs (LMOFs): Recent advancement towards a greener WLED technology. Chem. Commun. 2022, 58, 10768–10788. [Google Scholar] [CrossRef] [PubMed]
  22. Wang, X.Y.; Yin, H.Q.; Yin, X.B. MOF@COFs with strong multiemission for differentiation and ratiometric fluorescence detection. ACS Appl. Mater. Interfaces 2020, 12, 20973–20981. [Google Scholar] [CrossRef]
  23. Yan, B. Lanthanide-Functionalized Metal-Organic Framework Hybrid Systems To Create Multiple Luminescent Centers for Chemical Sensing. Acc. Chem. Res. 2017, 50, 2789–2798. [Google Scholar] [CrossRef]
  24. Hu, X.L.; Qin, C.; Wang, X.L.; Shao, K.Z.; Su, Z.M. A luminescent dye@MOF as a dual-emitting platform for sensing explosives. Chem. Commun. 2015, 51, 17521–17524. [Google Scholar] [CrossRef]
  25. Stîngă, G.; Băran, A.; Iovescu, A.; Maxim, M.E.; Jerca, V.V. A highly selective multifunctional naphthalene-labeled polymer sensor for Cu2+ and Fe3+ ions in aqueous medium. J. Mol. Liq. 2024, 406, 125074. [Google Scholar] [CrossRef]
  26. Guo, C.; Zhou, Y.; Chen, X.; Wang, Y.; Shan, J.; Hou, J. Fluorescent sensors and rapid detection films for Fe3+ and Cu2+ based on naphthalene and cholesterol derivative organogels. Colloids Surf. A Physicochem. Eng. Asp. 2023, 663, 131045. [Google Scholar] [CrossRef]
  27. Lal, S.; Kumar, S.; Hooda, S.; Kumar, P. A highly selective sensor for Cu2+ and Fe3+ ions in aqueous medium: Spectroscopic, computational and cell imaging studies. J. Photochem. Photobiol. A Chem. 2018, 364, 811–818. [Google Scholar] [CrossRef]
  28. Yu, H.; Fan, M.; Liu, Q.; Su, Z.; Li, X.; Pan, Q.; Hu, X. Two Highly water-stable imidazole-based Ln-MOFs for sensing Fe3+,Cr2O72–/CrO42– in a water environment. Inorg. Chem. 2020, 59, 2005–2010. [Google Scholar] [CrossRef]
  29. Zhang, Q.; Wang, J.; Kirillov, A.M.; Dou, W.; Xu, C.; Xu, C.; Yang, L.; Fang, R.; Liu, W. Multifunctional Ln–MOF luminescent probe for efficient sensing of Fe3+, Ce3+, and acetone. ACS Appl. Mater. Interfaces 2018, 10, 23976–23986. [Google Scholar] [CrossRef]
  30. Zhao, J.J.; Liu, P.Y.; Dong, Z.P.; Liu, Z.L.; Wang, Y.Q. Eu(III)-organic framework as a multi-responsive photoluminescence sensor for efficient detection of 1-naphthol, Fe3+ and MnO4 in water. Inorg. Chim. Acta 2020, 511, 119843. [Google Scholar] [CrossRef]
  31. Let, S.; Samanta, P.; Dutta, S.; Ghosh, S.K. A Dye@MOF composite as luminescent sensory material for selective and sensitive recognition of Fe(III) ions in water. Inorg. Chim. Acta 2020, 500, 119205. [Google Scholar] [CrossRef]
  32. Shi, H.; Yu, X.; Liu, Y.; Shi, Y.; Liu, H.; Wang, H. Construction of luminescent dye@MOF platforms for sensing antibiotics with enhanced selectivity and sensitivity. Spectrochim. Acta Part A Mol. Biomol. Spectrosc. 2024, 322, 124804. [Google Scholar] [CrossRef] [PubMed]
  33. Shi, W.; Zhang, S.; Wang, Y.; Xue, Y.D.; Chen, M. Preparation of dual-ligands Eu-MOF nanorods with dual fluorescence emissions for highly sensitive and selective ratiometric/visual fluorescence sensing phosphate. Sens. Actuators B Chem. 2022, 367, 132008. [Google Scholar] [CrossRef]
  34. Zhang, Z.; Wei, Z.; Meng, F.; Su, J.; Chen, D.; Guo, Z.; Xing, H. RhB-embedded zirconium–naphthalene-based metal-organic framework composite as a luminescent self-calibrating platform for the selective detection of inorganic ions. Chem. Eur. J. 2020, 26, 1661–1667. [Google Scholar] [CrossRef]
  35. Liu, M.; Yu, X.; Zhong, K.; Chen, X.; Feng, L.; Yao, S. Dye-encapsulated nanocage-based metal-organic frameworks as luminescent dual-emitting sensors for selective detection of inorganic ions. Appl. Organomet. Chem. 2022, 36, e6692. [Google Scholar] [CrossRef]
  36. Mohan, B.; Priyanka; Singh, G.; Chauhan, A.; Pombeiro, A.J.L.; Ren, P. Metal-organic frameworks (MOFs) based luminescent and electrochemical sensors for food contaminant detection. J. Hazard. Mater. 2023, 453, 131324. [Google Scholar] [CrossRef]
  37. Liu, W.; Qiao, J.; Gu, J.; Liu, Y. Hydrogen-bond-connected 2D Zn-LMOF with fluorescent sensing for inorganic pollutants and nitro aromatic explosives in the aqueous phase. Inorg. Chem. 2023, 62, 1272–1278. [Google Scholar] [CrossRef]
  38. Chaudhari, A.K.; Ryder, M.R.; Tan, J.C. Photonic hybrid crystals constructed from in situ host–guest nanoconfinement of a light-emitting complex in metal-organic framework pores. Nanoscale 2016, 8, 6851–6859. [Google Scholar] [CrossRef]
  39. Yuan, S.; Feng, L.; Wang, K.; Pang, J.; Bosch, M.; Lollar, C.; Sun, Y.; Qin, J.; Yang, X.; Zhang, P.; et al. Stable metal-organic frameworks: Design, synthesis, and applications. Adv. Mater. 2018, 30, e1704303. [Google Scholar] [CrossRef]
  40. Juan-Alcañiz, J.; Gascon, J.; Kapteijn, F. Metal-organic frameworks as scaffolds for the encapsulation of active species: State of the art and future perspectives. J. Mater. Chem. 2012, 22, 10102–10118. [Google Scholar] [CrossRef]
  41. Jiang, M.; Zhao, P.-L.; Yue, Y.-N.; Song, X.Q.; Wang, L. A multifunctional Er-MOF for methylene blue adsorption and CO2 cycloaddition catalysis. J. Mol. Struct. 2024, 1316, 138943. [Google Scholar] [CrossRef]
  42. Han, L.; Zhang, S.; Wang, Y.; Yan, X.; Lu, X. A strategy for synthesis of ionic metal-organic frameworks. Inorg. Chem. 2009, 48, 786–788. [Google Scholar] [CrossRef]
  43. Yin, L.; Huang, J.-B.; Yue, T.C.; Wang, L.L.; Wang, D.Z. Two 2D metal-organic frameworks based on purine carboxylic acid ligands for photocatalytic oxidation of sulfides and CO2 chemical fixation. Inorg. Chem. 2024, 63, 9109–9118. [Google Scholar] [CrossRef]
  44. Hu, Q.; Xu, T.; Gu, J.; Zhang, L.; Liu, Y. A series of isostructural lanthanide metal-organic frameworks: Effective fluorescence sensing for Fe3+, 2,4-DNP and 4-NP. CrystEngComm 2022, 24, 2759–2766. [Google Scholar] [CrossRef]
  45. Xu, H.; Fang, M.; Cao, C.S.; Qiao, W.Z.; Zhao, B. Unique (3,4,10)-connected lanthanide-organic framework as a recyclable chemical sensor for detecting Al3+. Inorg. Chem. 2016, 55, 4790–4794. [Google Scholar] [CrossRef]
  46. Liu, J.Q.; Li, X.F.; Gu, C.Y.; da Silva, J.C.; Barros, A.L.; Alves-Jr, S.; Li, B.H.; Ren, F.; Batten, S.R.; Soares, T.A. A combined experimental and computational study of novel nanocage-based metal–organic frameworks for drug delivery. Dalton Trans. 2015, 44, 19370–19382. [Google Scholar] [CrossRef]
  47. Liu, B.; Wu, W.P.; Hou, L.; Wang, Y.Y. Four uncommon nanocage-based Ln-MOFs: Highly selective luminescent sensing for Cu2+ ions and selective CO2 capture. Chem. Commun. 2014, 50, 8731–8734. [Google Scholar] [CrossRef]
  48. Yin, H.Q.; Wang, X.Y.; Yin, X.B. Rotation restricted emission and antenna effect in single metal-organic frameworks. J. Am. Chem. Soc. 2019, 141, 15166–15173. [Google Scholar] [CrossRef]
  49. Razavi, S.A.A.; Morsali, A. metal ion detection using luminescent-mofs: Principles, strategies and roadmap. Coord. Chem. Rev. 2020, 415, 213299. [Google Scholar] [CrossRef]
  50. Dong, M.J.; Zhao, M.; Ou, S.; Zou, C.; Wu, C.D. A luminescent Dye@MOF platform: Emission fingerprint relationships of volatile organic molecules. Angew. Chem. Int. Ed. 2014, 53, 1575–1579. [Google Scholar] [CrossRef]
  51. Yao, G.; Fang, S.; Yin, P.; Li, A.; Yang, W.; Wang, H.; Tan, W. A colorimetric and fluorometric dual-mode probe for Cu2+detection based on functionalized silver nanoparticles. Environ. Sci. Pollut. Res. 2025, 32, 3466–3474. [Google Scholar] [CrossRef] [PubMed]
  52. Shen, G.; Zhong, L.; Bi, Y.; Liu, Y.; Zhao, J.; Wen, X.; Zhu, Y.; Feng, L.; Geng, L.; Yu, F.; et al. Synthesis of Er(III)-based porphyrin metal-organic frameworks for rapid detection of sulfide ions with triple-signal output. Sens. Actuators B Chem. 2024, 404, 135301. [Google Scholar] [CrossRef]
  53. Chen, C.H.; Wang, X.S.; Li, L.; Huang, Y.B.; Cao, R. Highly selective sensing of Fe3+ by an anionic metal-organic framework containing uncoordinated nitrogen and carboxylate oxygen sites. Dalton Trans. 2018, 47, 3452–3458. [Google Scholar] [CrossRef]
  54. Yu, C.; Sun, X.; Zou, L.; Li, G.; Zhang, L.; Liu, Y. A pillar-layered Zn-LMOF with uncoordinated carboxylic acid sites: High performance for luminescence sensing Fe3+ and TNP. Inorg. Chem. 2019, 58, 4026–4032. [Google Scholar] [CrossRef]
  55. Mei, D.; Yan, B. Flumequine-mediated fluorescent zeolitic imidazolate framework functionalized by Eu3+ for sensitive and selective detection of UO22+, Ni2+ and Cu2+ in nuclear wastewater. J. Hazard. Mater. 2023, 447, 130822. [Google Scholar] [CrossRef]
  56. Lei, M.; Zhang, Y.; Wang, M.; Yang, W.; Gao, Z. Density functional theory investigation of As4, As2 and AsH3 adsorption on Ti-doped graphene. Chem. Eng. J. 2021, 421, 129747. [Google Scholar] [CrossRef]
  57. Zhou, Y.; Chen, H.H.; Yan, B. An Eu3+ post-functionalized nanosized metal-organic framework for cation exchange-based Fe3+-sensing in an aqueous environment. J. Mater. Chem. A 2014, 2, 13691–13697. [Google Scholar] [CrossRef]
  58. Ji, W.J.; Liu, G.F.; Wang, B.Q.; Lu, W.B.; Zhai, Q.G. Design of a heterometallic Zn/Ca-MOF decorated with alkoxy groups on the pore surface exhibiting high fluorescence sensing performance for Fe3+ and Cr2O72−. CrystEngComm 2020, 22, 4710–4715. [Google Scholar] [CrossRef]
  59. Liu, W.; Huang, X.; Xu, C.; Chen, C.; Yang, L.; Dou, W.; Chen, W.; Yang, H.; Liu, W. A multi-responsive regenerable europium-organic framework luminescent sensor for Fe(III), Cr(VI) anions, and picric acid. Chem. Eur. J. 2016, 22, 18769–18776. [Google Scholar] [CrossRef]
  60. Gu, J.Z.; Cai, Y.; Liu, Y.; Liang, X.X.; Kirillov, A.M. New lanthanide 2D coordination polymers constructed from a flexible ether-bridged tricarboxylate block: Synthesis, structures and luminescence sensing. Inorg. Chim. Acta 2018, 469, 98–104. [Google Scholar] [CrossRef]
  61. Jing, T.; Chen, L.; Jiang, F.; Yang, Y.; Zhou, K.; Yu, M.; Cao, Z.; Li, S.; Hong, M. Fabrication of a robust lanthanide metal-organic framework as a multifunctional material for Fe(III) detection, CO2 capture, and utilization. Cryst. Growth. Des. 2018, 18, 2956–2963. [Google Scholar] [CrossRef]
Figure 1. The single-crystal structure of Er-MOF: (a) the coordination modes of metal clusters and ligands with polyhedral views. (b) Three-dimensional framework in the [010] direction. (c) Cages in the topology view. (d) Three types of cages with polyhedrals and tiles. (e) A polyhedral view of the framework. (f) Topology displayed by tiling.
Chemistry 07 00083 g001
Figure 2. The scheme of the synthesis of Er-MOF and RhB@Er-MOF.
Chemistry 07 00083 g002
Figure 3. Fluorescence detection performance of Er-MOF: (a) RFR in different metal ions. (b) Anti-interference to Fe3+ and Cu2+. (c,d) Fluorescence spectrum by incremental addition of Fe3+ or Cu2+ (inset: S-V linear fit graph). (e,f) Recycle performance for Fe3+ or Cu2+ detection. RhB@Er-MOF fluorescence sensing of metal ions.
Chemistry 07 00083 g003
Figure 4. Fluorescence detection performance of RhB@Er-MOF: (a) RFR in different metal ions. (b) Anti-interference to Fe3+. (c) Fluorescence by incremental addition Fe3+ (inset: S-V linear fit graph). (d) Recycle performance for Fe3+ detection.
Chemistry 07 00083 g004
Figure 5. (a) Fluorescence spectrum of Er-MOF and UV-vis adsorption spectra of Fe3+ and Cu2+. (b) Fluorescence spectrum of RhB@Er-MOF and UV-vis adsorption spectra of Fe3+ and Cu2+. (c) Frontal molecular orbital distributions of H4BDCPPy, H4BDCPPy + Fe3+ and H4BDCPPy + Cu2+.
Chemistry 07 00083 g005
Figure 6. (a) Color imaging change RhB@Er-MOF with increasing concentrations of Fe3+. (b) Linear curve between R values and Fe3+ concentrations. (c) Reproducibility of Er-MOF in Fe3+ solution.
Chemistry 07 00083 g006
Disclaimer/Publisher’s Note: The statements, opinions and data contained in all publications are solely those of the individual author(s) and contributor(s) and not of MDPI and/or the editor(s). MDPI and/or the editor(s) disclaim responsibility for any injury to people or property resulting from any ideas, methods, instructions or products referred to in the content.

