Article

An Extensive Study of the Production of Hydrogen by Cellulose and Lignin Pyrolysis Using Rhenium-Based Catalysts

by
Mizraim Guillermo Granados-Fitch
1,
Juan Manuel Quintana-Melgoza
2,
Erick Adrian Juarez-Arellano
3,* and
Miguel Avalos-Borja
1
1
Instituto Potosino de Investigación Científica y Tecnológica, División de Materiales Avanzados, Camino a la Presa San José, Col. Lomas, Sección 4, San Luis Potosí C.P. 78216, Mexico
2
Facultad de Ciencias Químicas e Ingeniería, Universidad Autónoma de Baja California, Campus Tijuana, Tijuana C.P. 22424, Mexico
3
Centro de Investigaciones Científicas, Instituto de Química Aplicada, Universidad del Papaloapan, Circuito central # 200, Col. Parque Industrial, Tuxtepec C.P. 68301, Mexico
*
Author to whom correspondence should be addressed.
Chemistry 2025, 7(2), 33; https://doi.org/10.3390/chemistry7020033
Submission received: 24 December 2024 / Revised: 7 February 2025 / Accepted: 24 February 2025 / Published: 1 March 2025
(This article belongs to the Section Catalysis)

Abstract

:
The use of rhenium-based catalysts (Re2C, Re3B, ReB2, and ReS2) obtained by mechanosynthesis in the pyrolysis of cellulose and lignin from 500 to 800 °C using 10 and 20 wt.% of catalysts is reported. The mechanosynthesis of ReS2 has been reported for the first time. The catalytic pyrolysis of cellulose resulted in maximum H2 production at 800 °C and 10 wt.% catalyst, with 44% H2 yield using a Re3B catalyst. In contrast, lignin catalytic pyrolysis also showed maximum production under the same conditions, with an 86.1% H2 yield using the NiO/SiO2 catalyst; however, the catalyst did not drastically enhance H2 production. H2 formation by cellulose pyrolysis is a thermocatalytic process, whereas lignin pyrolysis is an entirely thermic process. A reaction mechanism was proposed to explain the H2 formation by both catalytic cellulose and lignin pyrolysis.

1. Introduction

The rise of civilization and national prosperity is possible through energy consumption. There are many different sources of energy supply, such as primary (directly consumed, e.g., petroleum, coal, and natural gas), secondary (used in refined form, e.g., gasoline, diesel, geothermal, and biomass), and tertiary (feature several transformations of energy, e.g., electric energy and nuclear energy) [1]. The most important primary energy sources that satisfy global energy demand in 2024 are oil (31.2%), coal (27.2%), natural gas (24.7%), renewables (e.g., biomass and waste, 6.9%), and nuclear energy (4.3%) [2]. Petroleum, coal, and natural gas are non-renewable energy sources, and their current rates of extraction and consumption tend to deplete rapidly. Alternative renewable energy sources such as solar energy, wind power, geothermal energy, power from water (e.g., hydroelectric, tidal, ocean currents, wave power), and biomass will reach USD 1512.3 billion in the global renewable energy market by 2025 [3].
Molecular hydrogen (H2) is a clean and reliable energy carrier that can be used as an alternative to fossil fuels. The most significant advantage is the production of water via combustion with oxygen [4]. H2 is produced worldwide from primary energy sources via four catalytic processes: steam methane reforming, partial oxidation of hydrocarbons, auto-thermal reforming, and coal gasification [5]. Biomass pyrolysis is a new process for H2 production that has been studied extensively under non-catalytic and catalytic conditions.
Biomass is a complex mixture of three organic biopolymers: cellulose (40–50 wt.%), hemicellulose (20–40 wt.%), and lignin (5–30 wt.%) [6]. Biomass is abundant, and there have been many efforts worldwide to use it as a resource to generate alternative energy (fuels, electricity, heat, hydrogen, etc.). Although cellulose is widely used in various applications, lignin has been considerably sub-utilized. Therefore, this study focuses on these two main biomass components.
Regarding the production of H2 from cellulose pyrolysis, the results were diverse under noncatalytic pyrolysis conditions. While Simmons et al. [7] reported that H2 was not obtained, Wu et al. [8] reported up to 5.8 mmol H2/g cellulose at 500 °C, whereas Lanza et al. [9] reported that the temperature rise during a short residence time increased the gas yield up to almost 100% at 900 °C. On the other hand, under catalytic pyrolysis conditions, the production of H2 per gram of cellulose ranges from 0.19 to 773.28 mL of H2 [10,11,12,13,14,15,16,17,18,19,20,21,22,23] depending on the catalyst and conditions used. Zhao et al. [10,11,12] reported up to 546 mL H2 at 550 °C using a Ni-Co-CaO/SBA-15 catalyst, 527 mL H2 at 550 °C using Ni-Co-CaO/SiO2 and 773.28 mL H2 at 450 °C using Ca(OH)2:Ni. Widyaningrum et al. [13,14] reported 73.5 mL H2 at 800 °C using 5Ni/MCF and 85 mL H2 at 800 °C using 5Ni-0.7Pd/MCF. Matras et al. [15] reported 246.55 mL H2 at 700 °C using 20Ni/ZrO2. Ruppert et al. [16] reported 242.1 mL H2 at 700 °C using NiO. Donar et al. [17] reported 56 mL H2 at 700 °C using a 5% SnO2 catalyst. Grams et al. [18,19,20] reported 349.66 mL H2 at 700 °C using 20Ni/15CeO2-ZrO2, 237.59 mL H2 at 700 °C using 20Ni/SBA-15 and 264.49 mL H2 at 700 °C using a Ni/ZrAlSBA-15 catalyst. Ryczkowski et al. [21,22] reported 381.04 mL H2 at 700 °C using 20Ni1Ca/ZrO2 and 349.66 mL H2 at 700 °C using 20Ni10CaO/ZrO2, while Memon et al. [23] reported 0.19 mL H2 at 800 °C using NaZrO3 catalyst.
In the same way as for cellulose, the production of H2 from lignin pyrolysis has been widely studied under noncatalytic and catalytic conditions. Under non-catalytic pyrolysis conditions, the main variables are temperature and heating rates [24,25,26,27,28,29,30,31,32]. Ferdous et al. [24,25] reported that H2 production reached up to 73% yield at 800 °C using a heating rate of 15 °C/min. Baunlin et al. [26] reported 40% yield at 527 °C when kraft lignin was pyrolyzed. Widyawati et al. [27] reported that H2 production occurs between 500 and 900 °C with a maximum at 750 °C. Wu et al. [8] reported the production of 40.32 mL of H2 per gram of lignin at 500 °C. Zhou et al. [29] reported 172 mL H2 at 900 °C. Akubo et al. [32] reported 156.8 mL H2 at 550 °C.
Several studies have been conducted under catalytic pyrolysis conditions, and the production of H2 per gram of lignin ranges from 11.2 to 682 mL of H2 [33,34,35,36] depending on the catalyst and conditions used. Collard et al. [34] reported 47 mL H2 at 800 °C using a nickel salt catalyst. Milovanovic et al. [35] reported 682 mL H2 at 500 °C using NiO/H-Y. Yang et al. [36] reported 11.2 mL H2 at 650 °C using a HZSM-5 catalyst.
Therefore, previous studies on cellulose and lignin pyrolysis have shown that the most important parameters for H2 production are high temperature and the amount of catalyst used. However, not every catalyst can be used at high temperatures because of its low melting point or low sintering temperature (microstructural changes that affect the catalytic activity). Thus, rhenium-based catalysts were proposed in this study. Rhenium and rhenium-based catalysts have already been used to produce H2 [37,38,39]. They are of great interest because of their outstanding properties, such as heat resistance, high melting point, high density, and extraordinary corrosion resistance. In this study, rhenium-based catalysts (Re2C, Re3B, ReB2, and ReS2) obtained by mechanosynthesis were tested for H2 production from cellulose and lignin pyrolysis. The mechanosynthesis of ReS2 and its use as a catalyst in the production of H2 have been reported for the first time. Pyrolysis was performed from 500 °C to 800 °C using 10 and 20 wt.% of catalyst. Thus, this study aimed to identify the best temperature and weight percentage of the catalyst to maximize H2 production from both cellulose and lignin pyrolysis. In addition, heteroatoms (C, B, and S) had an effect on the catalytic activity and proposed a reaction mechanism for both the cellulose and lignin catalytic pyrolysis processes.

2. Materials and Methods

2.1. Raw Material and Chemicals

Rhenium (Re, 99.95% purity) and 60%NiO/SiO2 commercial catalyst (labeled as NiO/SiO2 catalyst) were acquired from Merck (Merck S.A. de C.V., Naucalpan de JuárezEstado de Mexico, Mexico). Sulfur (S, 99.8%, sublimed, Fermont) was acquired from Reactivos y Equipos S.A. de C.V. (San Pedro Garza García, Nuevo Leon, Mexico). Cellulose (powder, α-cellulose) and lignin (powder, alkaline, average MW~10,000, 4 wt.% S) were also acquired from Merck.

2.2. Mechanosynthesis and Characterization of Rhenium-Based Catalysts

The mechanosynthesis and the appropriate characterization of all other catalysts (Re2C, Re3B, and ReB2) were reported in detail elsewhere (Re2C catalyst [38,40] and rhenium boride catalysts (Re3B and ReB2) [39,40,41]).
Rhenium forms two sulfides, rhenium (IV) sulfide (ReS2) and rhenium (VII) sulfide (Re2S7). ReS2 is a semiconductor with a bandgap of approximately 1.4 eV. It has been synthesized using a variety of methods, including chemical vapor transport from rhenium and sulfur [42], rhenium sulfidation [43], chemical vapor deposition [44], thermal decomposition of molecular complexes [45], and chemical reactions from inorganic precursors [46]. However, mechanochemical synthesis of ReS2 has not yet been reported.
The ReS2 synthesis was carried out as follows. Briefly, a 1:2 elemental ratio mixture of rhenium and sulfur with a final weight of 5 g was mechanically treated with a mortar and pestle until a homogenous powder was obtained. A WC grinding vial (55 mL volume) with the mixture and 10 balls of WC (11.2 mm in diameter) were placed in a 8000 Mixer/mill (SPEX SamplePrep, Metuchen, NJ, USA), and milling was carried out and monitored every 400 min of milling time by XRD using a Rigaku SmartLab diffractometer (Rigaku, Cedar Park, TX, USA). The surface area was obtained by the BET method using an ASAP 2020 Micromeritics (The Micromeritics Instrument Corporation, Norcross, GA, USA) accelerated surface area system. The morphology and microstructure were characterized using scanning electron microscopy (SEM, Helios Nanolab 600) (Thermo Fisher Scientific, Waltham, MA, USA) and transmission electron microscopy (TEM, Tecnai F30) (Thermo Fisher Scientific, Waltham, MA, USA).

2.3. Cellulose and Lignin Pyrolysis Using Rhenium-Based Catalysts

Cellulose and lignin catalytic pyrolysis were evaluated through the production of H2, CH4, CO, and char generation. The pyrolysis was performed using a methodology reported elsewhere [37,38]. The pyrolysis system used in this study is shown in Figure S1. In summary, 100 mg of cellulose or lignin was placed in porcelain canoes with 10 and 20 wt.% of every rhenium-based catalyst (Re2C, Re3B, ReB2, and ReS2) and NiO/SiO2 commercial catalyst. The canoe was placed inside a quartz tube in a Lindberg/Blue M Mini-Mite) (Thermo Fisher Scientific, Waltham, MA, USA). The carrier gas flow rate was 15 mL/min (helium, 99.998% purity). Catalytic pyrolysis was performed from 500 to 800 °C, and gaseous products were collected in a 10 L gasbag for 40 min in each experiment.

2.4. Monitoring of H2, CH4, CO Production and Char Waste Generation

The methodology used has been reported in detail elsewhere [37,38]. The monitoring system of H2, CH4, CO production used in this study is shown in Figure S2. In summary, H2, CH4, and CO were measured using an 8610C gas chromatograph equipped with a TCD detector (SRI Instruments, Torrance, CA, USA) and a Washed MolSieve 5A packed column (Agilent Technologies Manufacturing GmbH & Co. KG, Waldbronn, Germany). The temperatures of the oven and detector were set to 50 °C and 120 °C, respectively. The standard external method was used to calibrate the gas chromatograph with a standard gas mixture of H2, CH4, and CO (1% of each component equivalent to 10,000 ppm, Supelco) to obtain the concentration of each component in the gasbag.
The concentration of each component of the gaseous products from CS pyrolysis can be calculated using Equation (1):
ppm (H2, CH4 or CO) = SZ/SY × 10,000 ppm
where SZ is the peak area of each component in the gasbag and SY is the peak area of the corresponding components of the standard gas.
Char conversion is an important parameter to evaluate the total pyrolysis of biomass. The char of the pyrolysis of CS can be calculated using Equation (2):
Char (mg) = WZ − WY
where WZ is the weight of the carbonaceous residue after the pyrolysis of CS and WY is the weight of the catalyst used in each experiment.

3. Results and Discussion

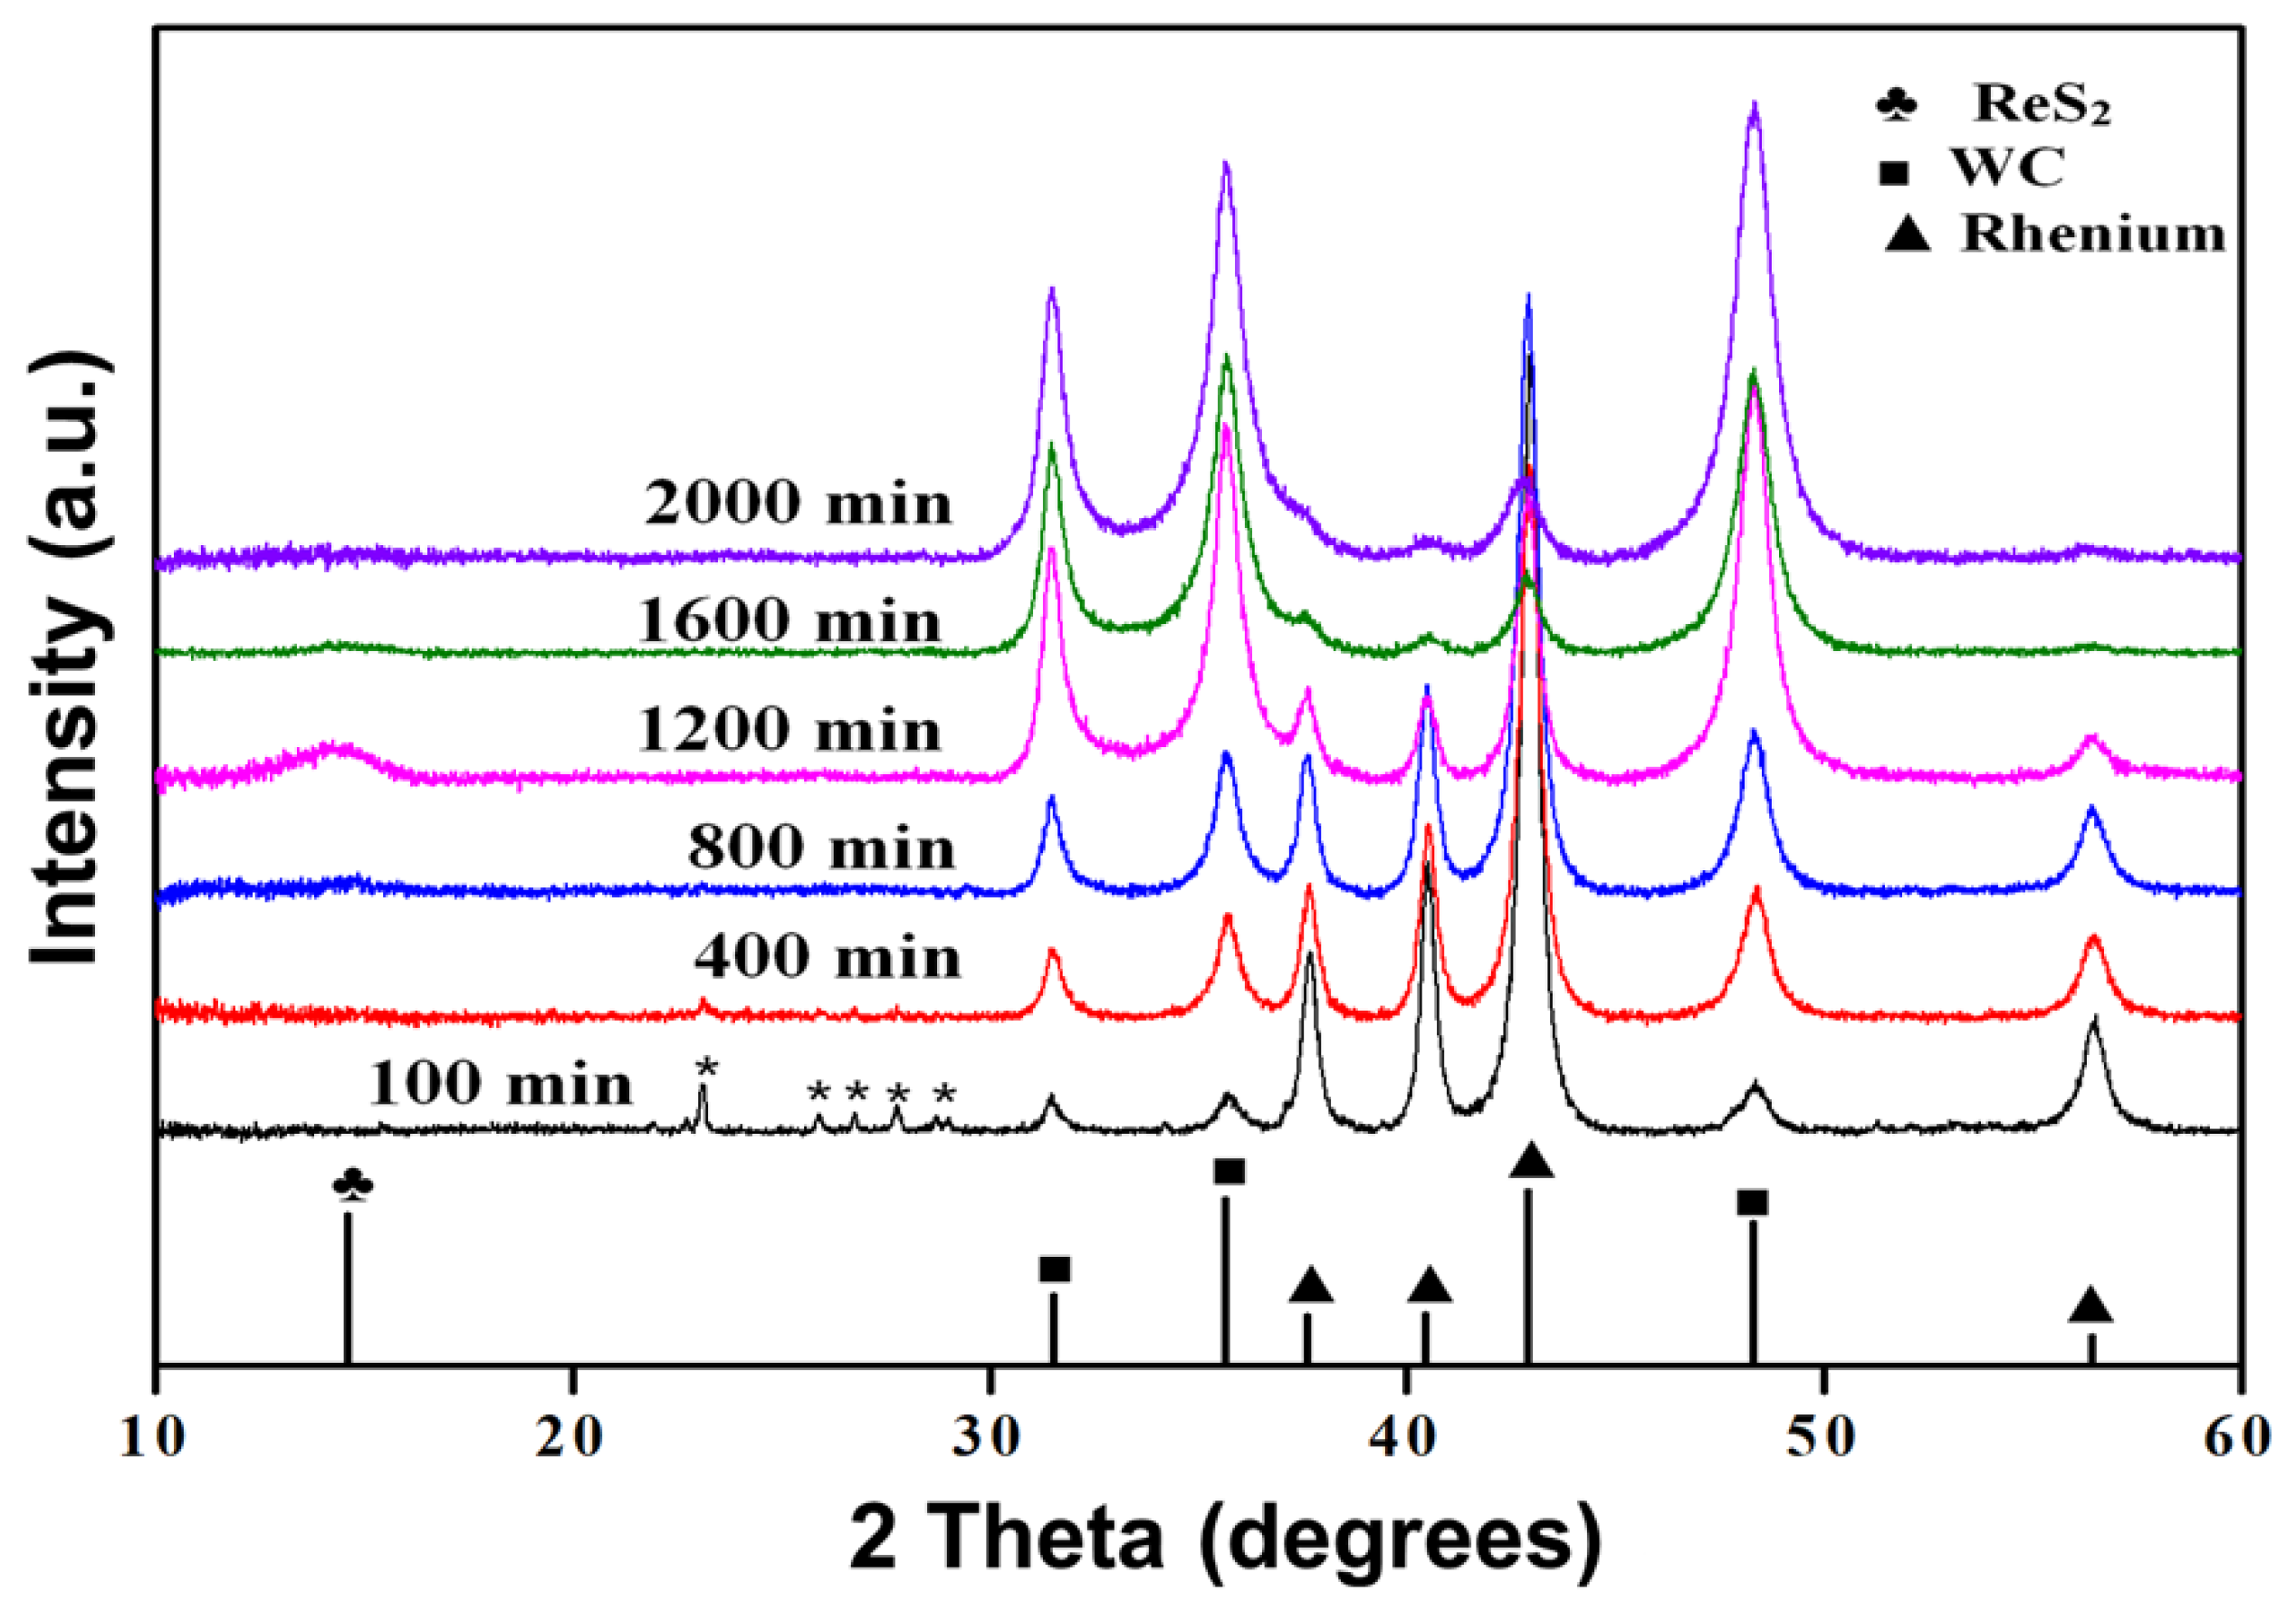
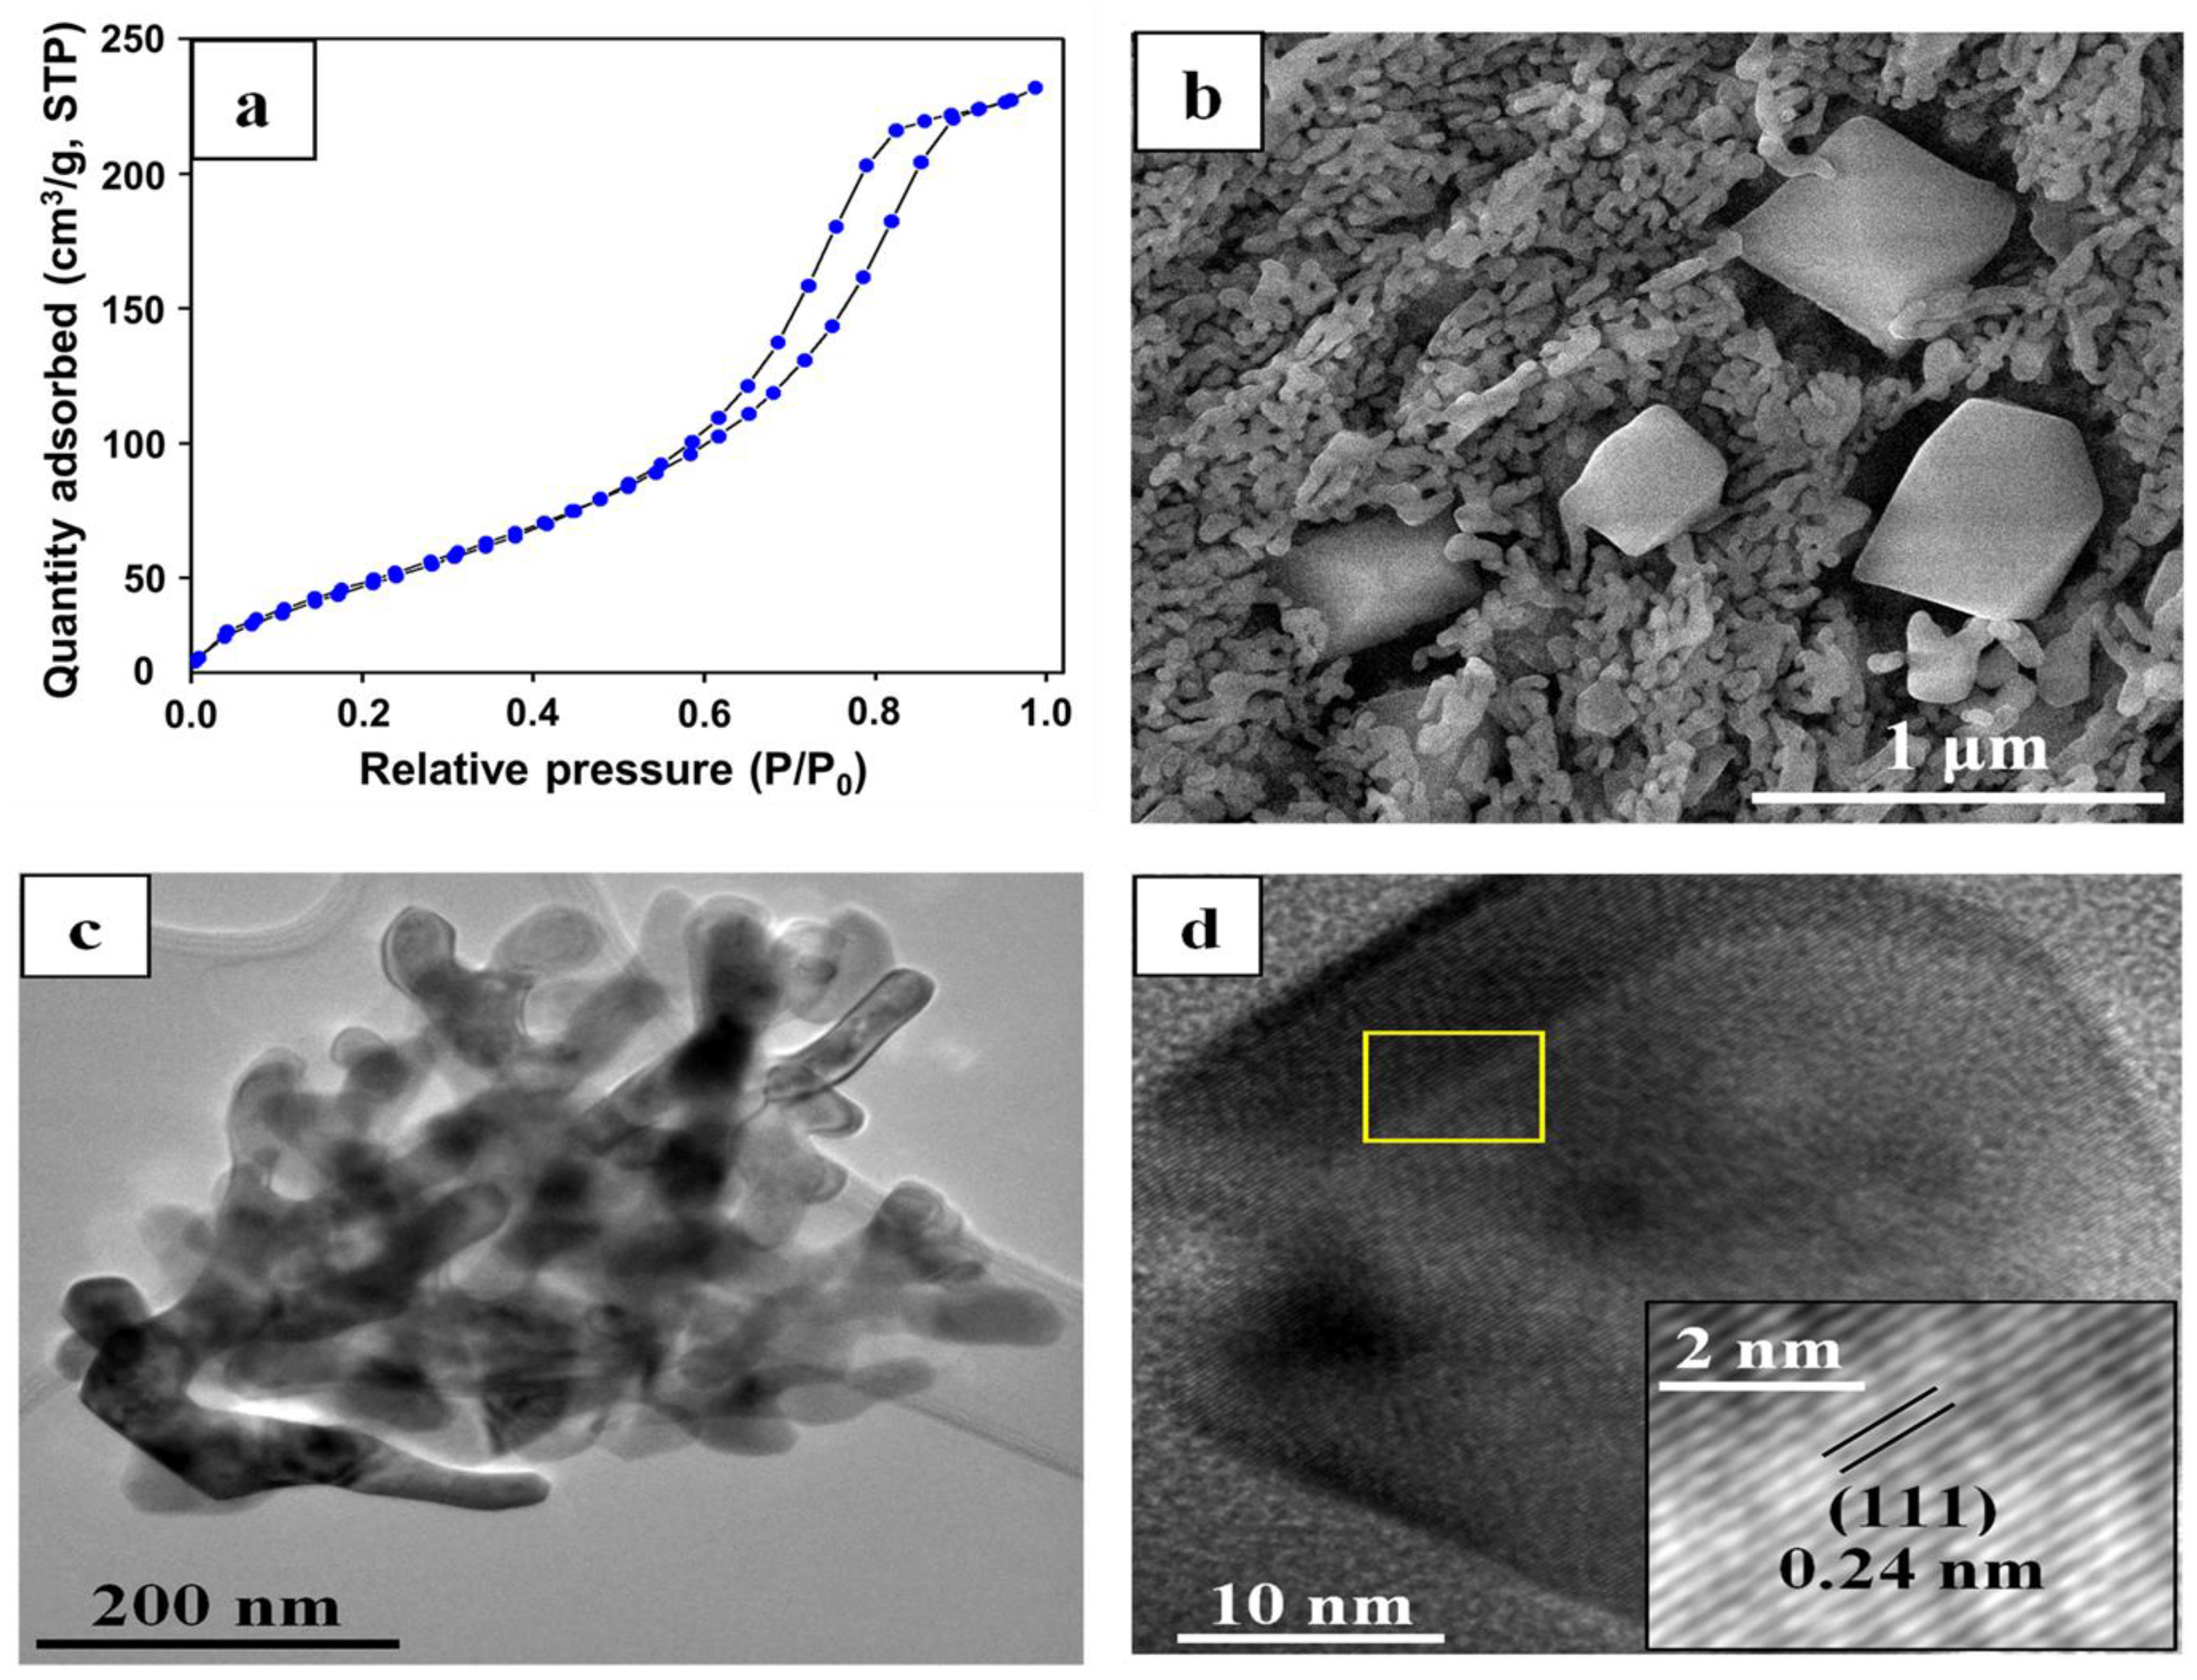
3.1. Characterization of Catalysts

The mechanosynthesis of ReS2 from the Re:S 1:2 stoichiometry was monitored using XRD, and the results are shown in Figure 1. The diffractogram at 100 min shows diffraction peaks of rhenium (▲, PDF4+ 01-087-0599) and sulfur (*, PDF4+ 01-074-1465). At 1600 min of milling time, a diffraction peak at 14.59 of 2θ is observed; this peak belongs to the most intense reflection, the (002) plane of the ReS2 triclinic phase (♣, PDF4+ 04-007-2320). Based on the (002) FWHM peak and using the Scherrer equation, the crystallite size of the Re2S particles was calculated to be approximately 3.7 nm. To our knowledge, this is the first report of the mechanosynthesis of ReS2. However, at 2000 min of milling time, the diffractogram shows only peaks of unreacted rhenium and WC from the milling media (■, PDF4+ 04-007-5192). The disappearance of the (002) peak of ReS2 from the 1600 to 2000 milling time diffractograms is principally attributed to the loss of crystallinity and the crystallite size reduction due to the mechanochemical energy transferred. It has been reported that crystallite sizes less than 3 nm cannot be detected by XRD [47].
Figure 2a shows the adsorption isotherm of the ReS2 material after 2000 min of milling; it is of type III, where the interactions of the adsorbate play a significant role. The surface area of ReS2 was 41.79 m2g−1. The SEM micrograph shows nanoparticles with an average size of less than 200 nm (Figure 2b), whereas the TEM micrograph shows a conglomerate of nanoparticles smaller than 100 nm (Figure 2c). Figure 2d shows that the conglomerate was integrated with the WC and ReS2 nanoparticles. Figure 2d shows nanoparticles with interplanar distances of 0.63–0.67 nm, which are in good agreement with the value of 0.60 nm of the (002) plane of ReS2 (PDF4+ 04-007-2320), confirming the formation of ReS2 particles.
Figure 3 shows the diffractogram of a NiO/SiO2 commercial catalyst. It shows only diffraction peaks associated with NiO (PDF4+ 00-004-0835). No diffraction peaks corresponding to the SiO2 phase were observed, which indicates an amorphous state.
The adsorption isotherm of the NiO/SiO2 catalyst is type IV, which is related to mesoporous materials (Figure 4a). An important characteristic of this isotherm is that it exhibits a hysteresis loop of type H1 associated with porous materials and a narrow pore size distribution. The surface area of NiO/SiO2 was 189.35 m2g−1. SEM micrographs show that in the NiO/SiO2 catalyst, two types of morphologies were observed: polyhedral particles with a size of less than 1 μm and dendritic particles with embedded polyhedral particles (Figure 4b). TEM was performed to characterize both morphologies, and the results are shown in Figure 4c,d. The dendritic particles were amorphous and associated with SiO2 (Figure 4c), while the polyhedral particles were the catalyst (Figure 4d). A magnified and filtered image from the yellow box shows an interplanar distance of 0.24 nm in identical correspondence with the value of 0.24 nm with the (111) plane of NiO PDF4+ 00-004-0835. Thus, the XRD, SEM, and TEM characterizations confirmed that the polyhedral particles were NiO, whereas the dendritic amorphous material was the SiO2 support.

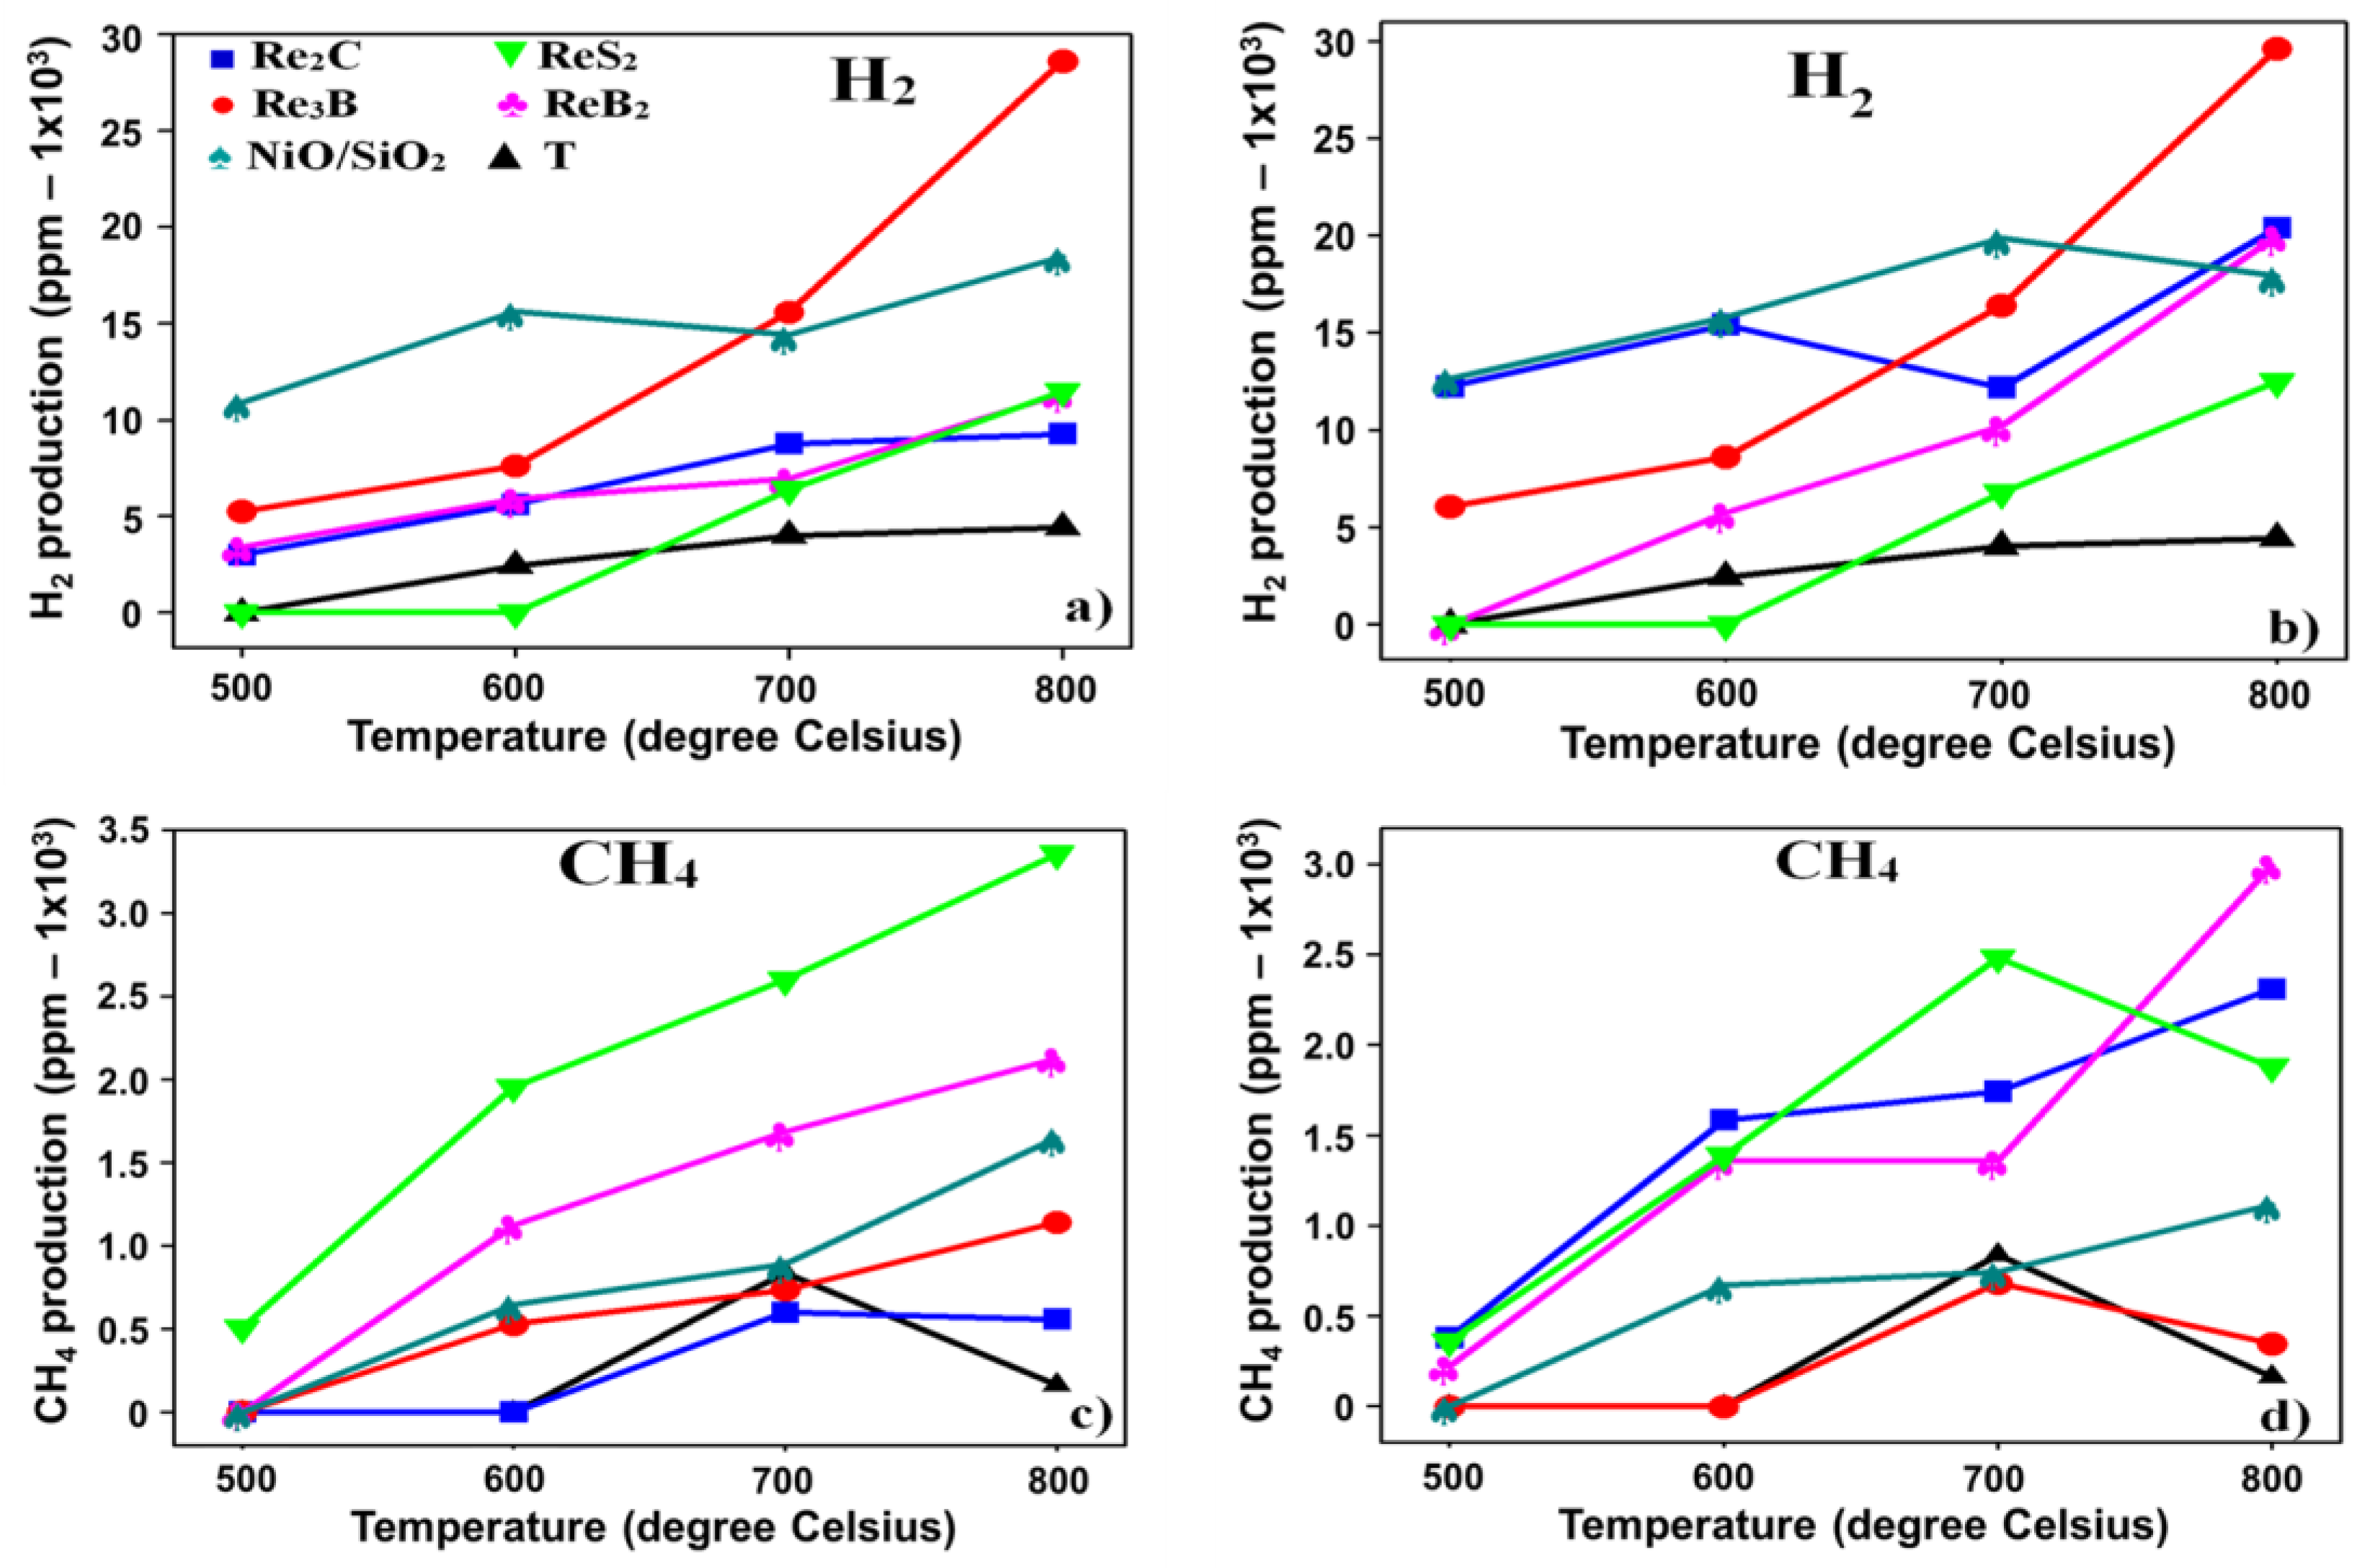
3.2. Cellulose Catalytic Pyrolysis

To evaluate the effect of rhenium-based catalysts on H2, CH4, and CO production and char generation, cellulose was pyrolyzed from 500 °C to 800 °C using 10 and 20 wt.% of Re2C, Re3B, ReB2, ReS2, and NiO/SiO2 catalysts. The results are shown in Figure 5 and Figure 6, and the values obtained at 800 °C are listed in Table 1. Figure 5a shows the H2 production using 10 wt.% catalyst. The maximum H2 production was observed using Re3B, whereas the minimum was achieved without a catalyst (Table 1). Increasing the amount of the catalyst to 20 wt.% (Figure 5b), the same trend was observed. However, the results showed that 10 wt.% catalyst and 800 °C are the best conditions to maximize the H2 production from cellulose catalytic pyrolysis since the gain observed when doubling the amount of catalyst is minimal. Only in the case of Re2C did the H2 production increase considerably, doubling the amount of the catalyst. Garnier et al. [48] reported that the H2 content in cellulose is approximately 6.5 wt.% equivalent to 65,000 ppm of H2. Taking this value as a reference, the H2 yields achieved from cellulose pyrolysis at 800 °C in this study were 6.8% without the catalyst, 19.2% with ReS2 (using 20 wt.% catalyst), 28.4% NiO/SiO2 (10 wt.%), 30.7% ReB2 (20 wt.%), 31.4% Re2C (20 wt.%) and 44.0% Re3B (10 wt.%).
Sabatier’s principle [49] states that the key criterion in designing and screening electrocatalytic materials is that the binding energy between the catalyst and the reactant should be neither too strong nor too weak. To evaluate this principle, the adsorption energies of monoatomic H on C, B, S, Ni, and Re are listed in Table 2. From these energies, the absorption of hydrogen by Re from the Re2C, Re3B, ReB2, and ReS2 compounds indicated the formation of stable intermediate compounds, following Sabatier’s principle [49]. Thus, it can be established that Re plays the principal role in these catalysts. However, the adsorption energy values for carbon allotropes are small; therefore, hydrogen adsorption by C in Re2C creates an unstable intermediate compound with a negative effect on H2 formation. Concerning hydrogen adsorption by B in Re3B and ReB2, the values were similar to those reported for Re. Ferro et al. [50,51] studied the interaction of hydrogen on the surface of boron-doped graphite. They found that the adsorption of two hydrogen atoms on adjacent B atoms causes them to spontaneously recombine to form molecular H2 and that diffusion is the rate-limiting step. Therefore, the high% H2 yield obtained using the Re3B and ReB2 catalysts is a combination of the positive effects of the Re and B active sites to form H2. The higher% H2 yield obtained using the Re3B rather than the ReB2 catalysts indicates that Re plays a more important role than B in these catalysts. In addition, the difference in the catalytic activity of B between Re3B and ReB2 is due to their oxidized surfaces, as shown by their TPR characterization reported elsewhere [39]. The values for hydrogen adsorption by S in ReS2 are small. Therefore, hydrogen adsorption by S created an unstable intermediate compound with a negative effect on H2 formation and hydrogen adsorption by C in Re2C. In addition, the low% H2 yield using the ReS2 catalyst can be attributed to the formation of H2S, as it has been reported that H2S forms between 602 and 1290 °C [52]. Finally, the hydrogen adsorption by Ni in NiO/SiO2 is like Re; therefore, it shows a high% H2 yield.
The results show that the Re3B catalyst has the highest catalytic activity for H2 production from cellulose pyrolysis, which is in good agreement with the results of H2 production from coconut shell pyrolysis reported previously [38]. In addition, it was confirmed that rhenium catalysts increased H2 production, promoting the dehydrogenation of H-C-O-H groups instead of the cellulose dehydration reaction [27].
The production of CH4 using 10 wt.% is shown in Figure 5c. The maximum CH4 production was observed using ReS2, whereas the minimum was achieved without a catalyst (Table 1). Increasing the amount of catalyst to 20 wt.%, the same trend was observed (Figure 5d). However, the Re3B catalyst had a negative effect on CH4 formation, as the CH4 production decreased from 1141 ppm (10 wt.%) to 347 ppm (20 wt.%). This result implies that the Re3B catalyst has both the desired properties for use in H2 production from biomass pyrolysis: high H2 and low CH4 production.
CO production using 10 wt.% of catalysts is shown in Figure 6a. The maximum CO production was observed using Re3B, whereas the minimum was achieved without a catalyst (Table 1). Increasing the amount of catalyst to 20 wt.%, the same trend was observed (Figure 6b). The highest CO production was observed when the Re3B catalyst was used, which was related to the highest H2 production (Figure 5a) and lowest CH4 production (Figure 5c). It has been reported that an increase in CO production positively affects H2 formation [38,39]. Therefore, the Re3B catalyst fulfills three essential functions for H2 production from cellulose: high (H2–CO) and low CH4 production.
Char generation using 10 wt.% catalysts is shown in Figure 6a. The maximum char generation was observed using ReB2, whereas the minimum was achieved using ReS2 (Table 1). Increasing the amount of catalyst to 20 wt.%, the same trend was observed (Figure 6b). In all cases the char generation values are within 2.9–9.2 mg, which agrees with the values reported for char generation by cellulose pyrolysis (6.5 to 8.5 mg at 800 °C) [75,76,77].
To compare the results obtained in this study, Table 3 shows the H2 production by cellulose pyrolysis using other methodologies. H2 production from steam cellulose gasification was omitted because the H2 yield was overestimated because of water decomposition. From the information in Table 3, several statements can be made about H2 production by catalytic cellulose pyrolysis: (1) the catalytic pyrolysis of cellulose is a way to enhance H2 production; (2) the surface area of the catalyst has a determinant role in the% H2 yield; (3) the% H2 yield of the Re3B catalyst (44%) is one of the highest reported; (4) the high pyrolysis temperature, up to 800 °C, is vital to achieve a high H2 yield; and (5) the recombination of monoatomic H to form H2 is the most important step.
Based on the results of this study, a reaction mechanism explaining H2 production from catalytic cellulose pyrolysis is proposed (Figure 7). This shows that CH4 and CO formation is carried out by thermic and catalytic pyrolysis, in contrast to the literature, which mentions that CH4 is principally obtained through the thermic decomposition of lignin in biomass. Concerning H2 formation, the H2 hydrogen production by cellulose pyrolysis is a thermocatalytic process at high temperatures. The% H2 yield followed the order: Re3B >> Re2C > ReB2 > NiO/SiO2 > ReS2 >> T. This behavior is in good agreement with the hydrogen adsorption energies of the catalytic centers (Re > B > Ni >> C > S). These results show that cellulose pyrolysis using rhenium-based catalysts drastically increased H2 production. In addition, the catalysts benefit the dehydrogenation of H-C-O-H groups to form H2 instead of cellulose dehydration itself without a catalyst.

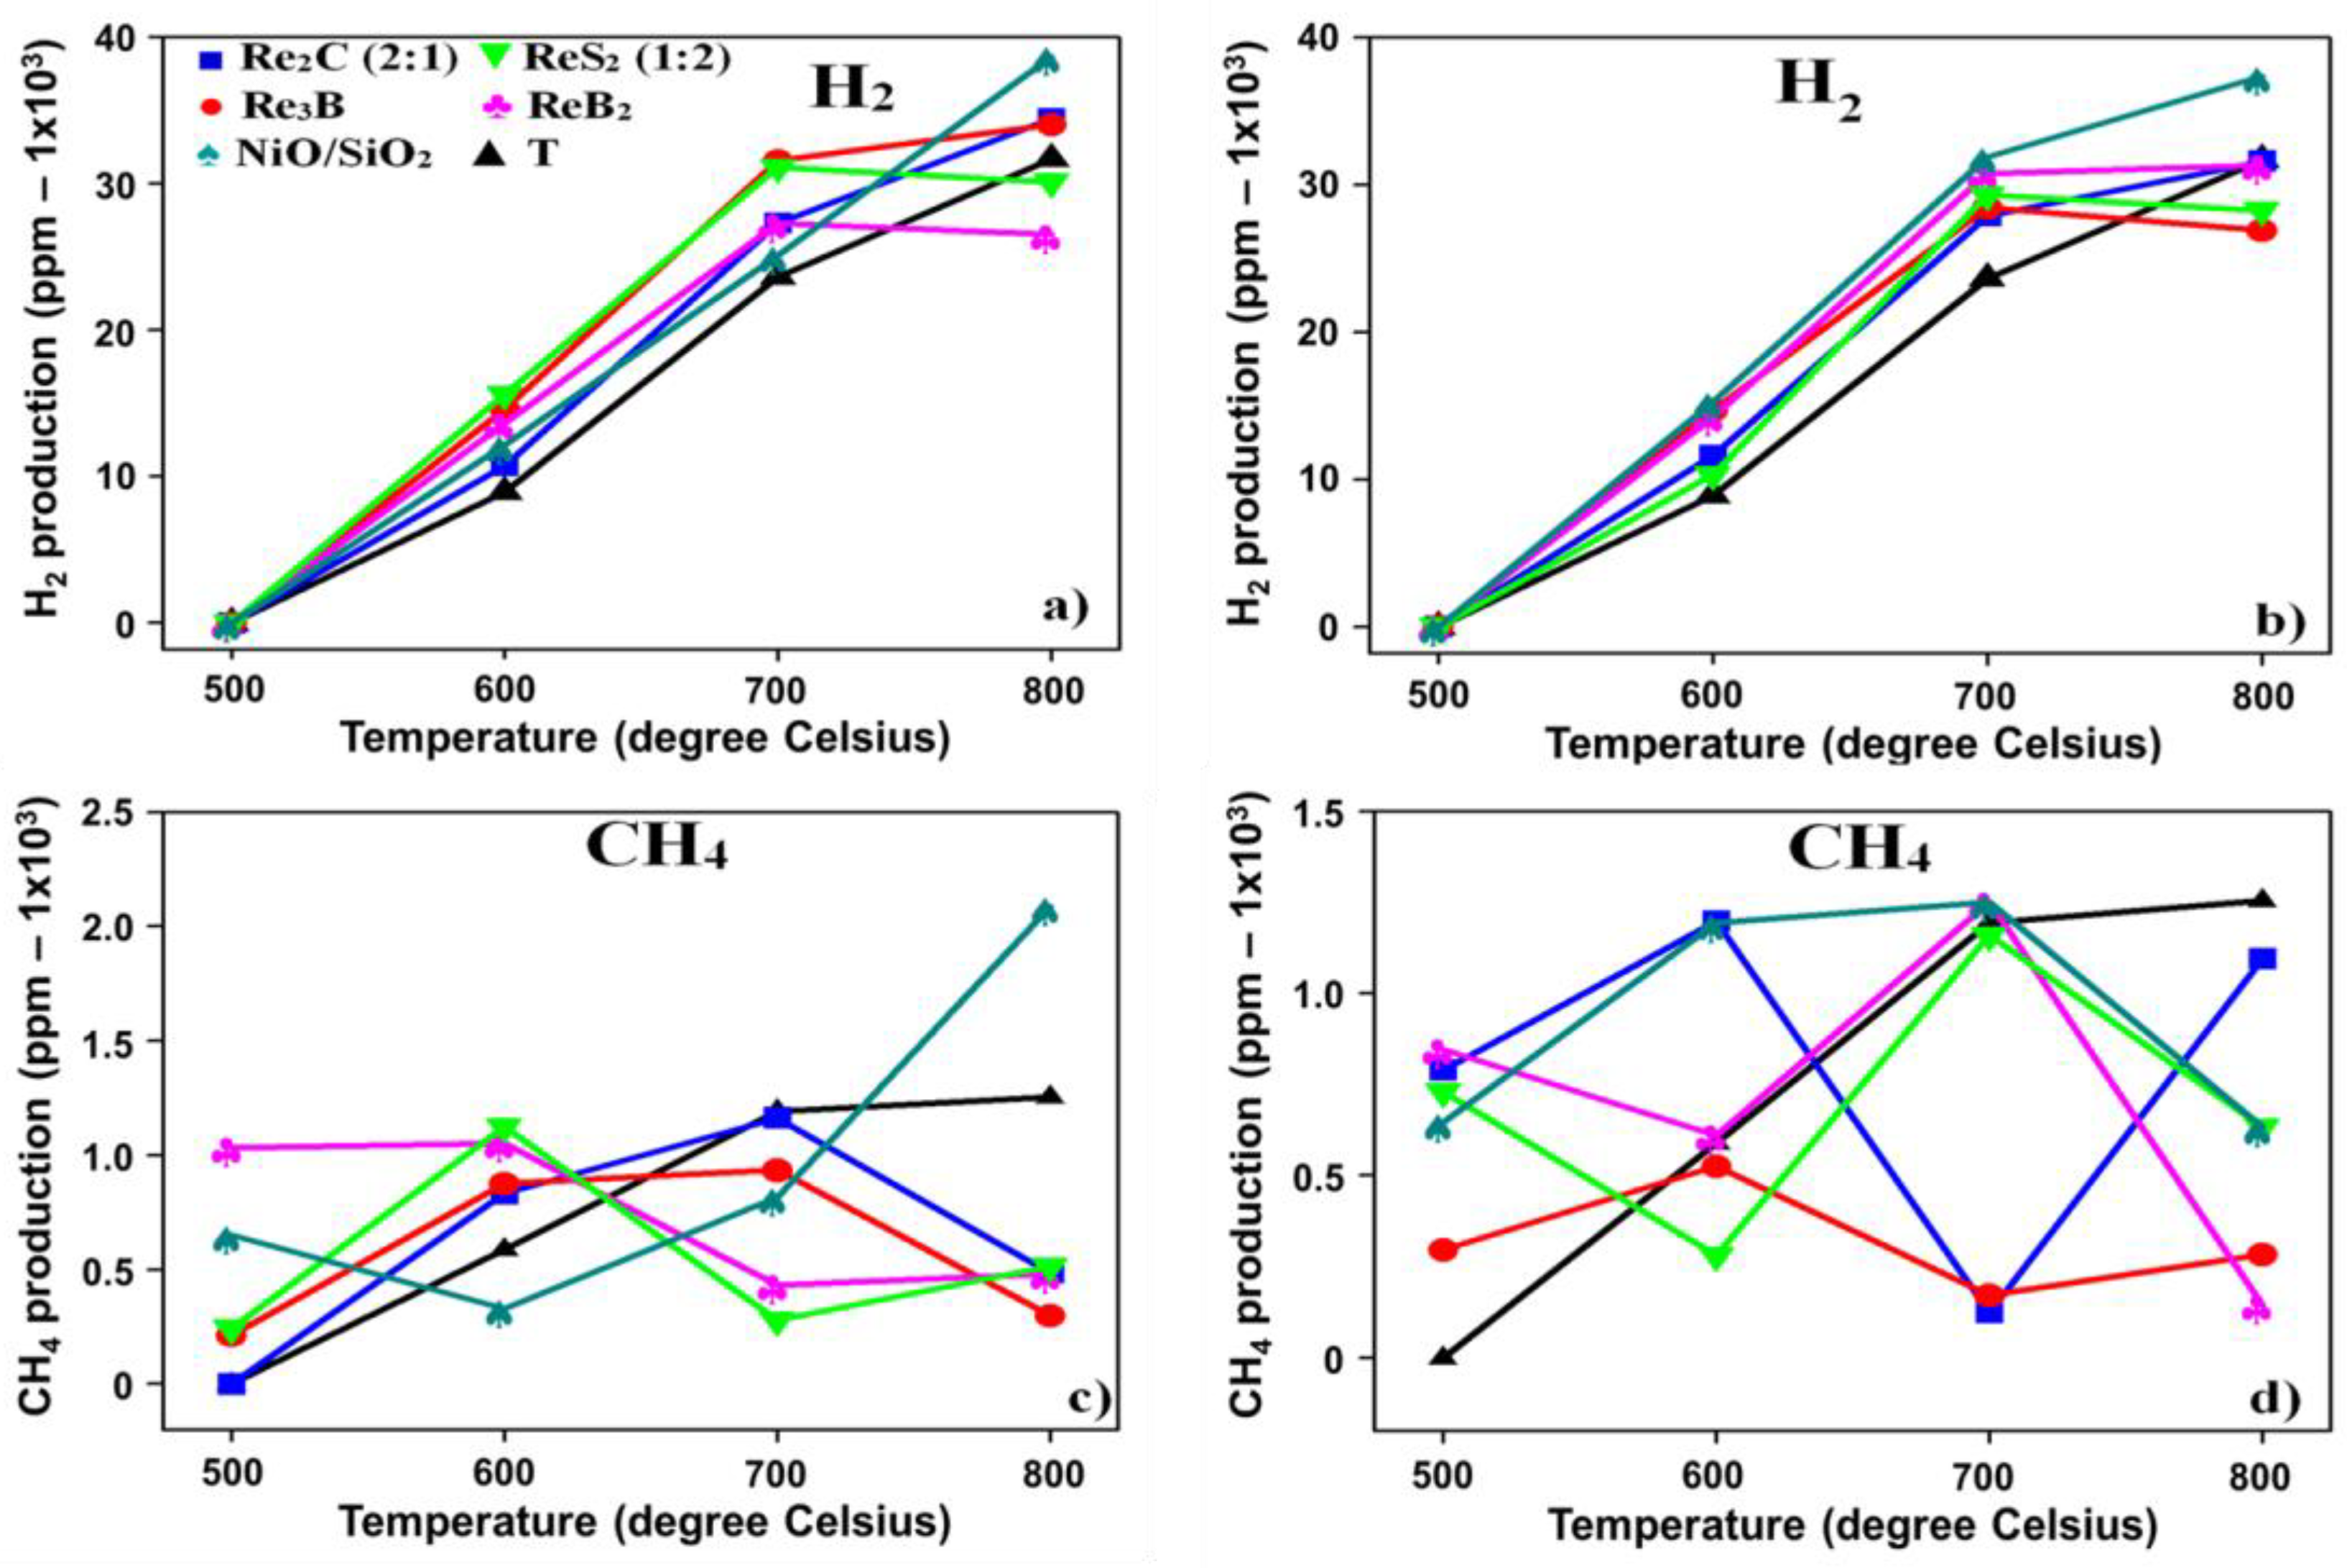
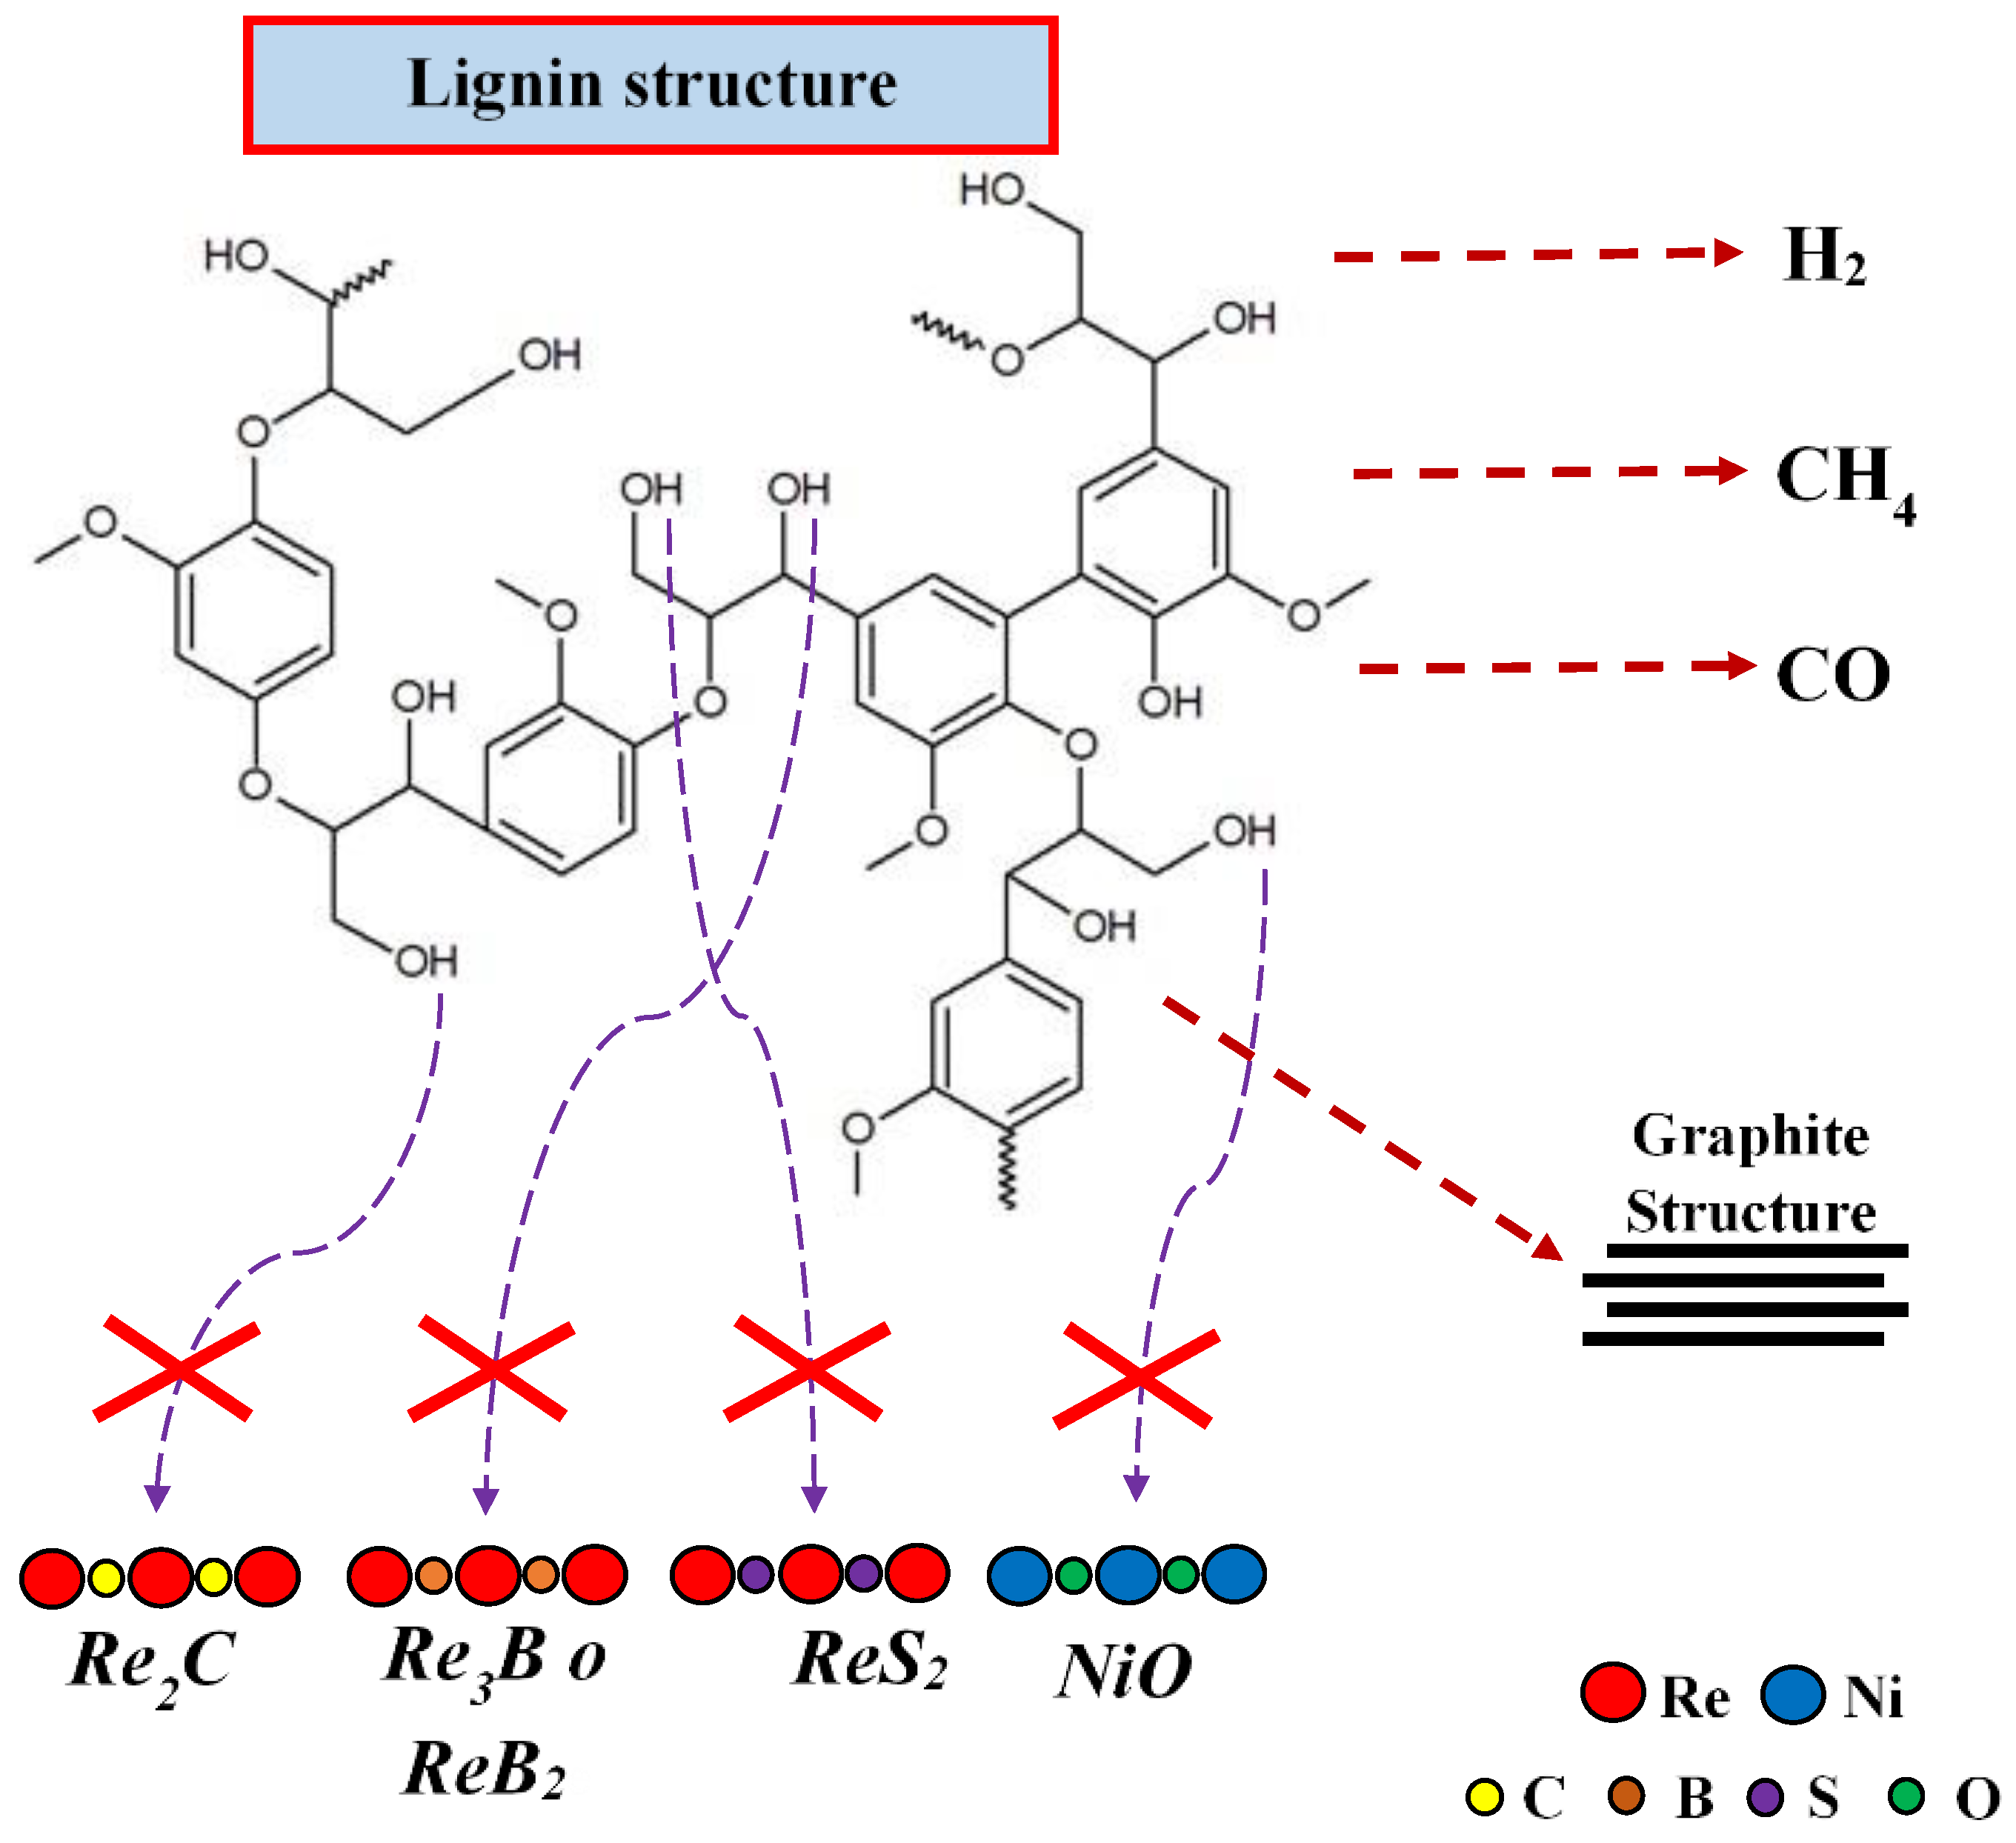
3.3. Lignin Catalytic Pyrolysis

Similar to the catalytic pyrolysis of cellulose, the results of H2, CH4, and CO production, as well as char generation by lignin pyrolysis using rhenium-based catalysts from 500 to 800 °C using 10 and 20 wt.% of catalysts are shown in Figure 8 and Figure 9. The values obtained at 800 °C are listed in Table 4.
Figure 8a shows the H2 production using 10 wt.% catalyst. The maximum H2 production was observed using NiO/SiO2, whereas the minimum was achieved using ReB2 (Table 4). Increasing the amount of the catalyst to 20 wt.% (Figure 8b), the H2 production dropped for most of the cases, while just using ReB2 the production increased slightly. Watanabe et al. [78] reported the H2 content in lignin is approximately 4.49 wt.% equivalent to 44,900 ppm of H2. Taking this value as a reference, the H2 yield achieved from lignin pyrolysis at 800 °C in this study was 59.0% ReB2 (20 wt.%), 67.7% ReS2 (10 wt.%), 70.5% without catalyst, 75.7% Re3B (10 wt.%), 76.6% Re2C (10 wt.%), and 86.1% NiO/SiO2 (10 wt.%). The results indicate that only the Re3B, Re2C, and NiO/SiO2 catalysts had a positive effect on H2 production by lignin pyrolysis using 10 wt.% of the catalyst. However, this increase was not significant, as observed for the production of H2 by the catalytic pyrolysis of cellulose (Figure 5a). Several studies have been reported on H2 production via lignin pyrolysis under catalytic and non-catalytic conditions. Ferdous et al. [24,25] reported that H2 formation is the result of breaking lignin subunits and rearranging aromatic rings at high temperatures. Widyawati et al. [27] reported a maximum H2 production peak at 750 °C. Jung et al. [30] reported an increase in H2 production at a higher temperature of 500 °C because of the breaking and deformation of C=C and C-H bonds in aromatic rings. Lv et al. [33] reported the catalytic lignin pyrolysis at 700 °C and using nickel and dolomite catalysts found an increase in H2 production. Collard et al. [34] carried out lignin pyrolysis at 600 °C using Fe and Ni catalysts and found an increase in H2 production because of the formation of graphitic structure from cracking of aromatic rings attributed to catalysts. Yu et al. [79] reported lignin pyrolysis using dolomite with an increase in H2 production, while a decrease was observed using a Na2CO3 catalyst. These results indicate that H2 production by lignin during pyrolysis is mainly a thermic process, whereas H2 production by cellulose pyrolysis is mainly a thermocatalytic process. These results are of great importance because H2 production by catalytic biomass pyrolysis is only catalytically dependent on the cellulose and hemicellulose fractions and not on the lignin fraction.
The production of CH4 using 10 wt.% is shown in Figure 8c and the values are in Table 4. These results indicate that all the rhenium-based catalysts explored in this study have a negative effect on CH4 formation. CH4 formation is one of the biggest problems in H2 production from biomass because it involves the reaction of H2 with carbon. Increasing the amount of catalyst to 20 wt.%, the same trend was observed (Figure 8d). Unusual CH4 production is a consequence of the complex structure of lignins. This implied that the catalyst did not actively intervene in the formation of H2 and CH4 during the catalytic pyrolysis of lignin.
CO production using 10 wt.% of catalysts is shown in Figure 9a and the values are in Table 4. These results indicate that only Re2C and NiO/SiO2 had a positive effect on CO formation. However, when the concentration is increased to 20 wt.% of catalysts (Figure 9b), all rhenium-based catalysts explored show a negative effect on the CO formation. As mentioned above, an increase in CO production indicates an increase in H2 production. This behavior coincided with the dehydrogenation of aromatic rings [27].
Char generation using 10 wt.% of catalysts is shown in Figure 9c. The maximum char generation was observed using ReS2, whereas the minimum was achieved using Re2C (Table 4). Increasing the amount of the catalyst to 20 wt.% (Figure 9d), the maximum char generation was observed using Re2C, while the minimum was seen using Re3B. In all cases, the char generation values are within 32.6–41.5 mg, which agrees with the values reported for char generation by lignin pyrolysis (43–44 mg at 800 °C) [24,32].
To compare the results obtained in this study, Table 5 shows the H2 production by lignin pyrolysis using other methodologies. The H2 production from steam lignin gasification was omitted because the H2 yield was overestimated owing to water decomposition. From the information in Table 5, several statements can be made regarding H2 production by catalytic lignin pyrolysis: (1) the use of catalysts during lignin pyrolysis does not improve H2 production; (2) the surface area of the catalyst is not a determinant of the% H2 yield; (3) the% H2 yield using the NiO/SiO2 catalyst (86.1%) is the highest reported; and (4) the pyrolysis temperature, up to 800 °C, is the most important parameter for improving% H2 yield.
Based on the results observed in this study, a reaction mechanism explaining H2 production from the catalytic pyrolysis of lignin was proposed (Figure 10). It has been shown that the H2, CO, and char formation do not require the presence of a rhenium-based catalyst.
Regarding CH4 formation, the complex structure of lignin and the results obtained from its pyrolysis did not allow us to establish whether this was a catalytic process. However, it can be concluded that H2 formation via lignin pyrolysis is a thermic process.

4. Conclusions

In this study, it is reported the use of rhenium-based catalysts for H2 production via cellulose and lignin pyrolysis. To our knowledge, this is the first report of the mechanosynthesis of ReS2. Catalytic cellulose pyrolysis results showed the highest H2 production at 800 °C with 10 wt.% of the Re3B catalyst. Using the Re3B catalyst resulted in up to 44% H2 yield, which is one of the highest reported in the literature. In contrast, ReS2 had a lower value, which is attributed to the poisoning effect of S on the surface of ReS2 and the reaction of S and H2 to form H2S. H2 formation by cellulose pyrolysis is a thermocatalytic process, whereas H2 formation by lignin pyrolysis is an entirely thermic process, in which the use of catalysts does not enhance H2 production. Therefore, H2 production by the catalytic pyrolysis of biomass depends only on the cellulose and hemicellulose fractions and not on the lignin fraction.

Supplementary Materials

The following supporting information can be downloaded at: https://www.mdpi.com/article/10.3390/chemistry7020033/s1, Figure S1 Pyrolysis system used in this study; Figure S2 Monitoring system of H2, CH4, CO production used in this study.

Author Contributions

Conceptualization, M.G.G.-F., J.M.Q.-M., E.A.J.-A. and M.A.-B.; methodology, M.G.G.-F.; validation, J.M.Q.-M., E.A.J.-A. and M.A.-B.; formal analysis, M.G.G.-F., J.M.Q.-M., E.A.J.-A. and M.A.-B.; investigation, M.G.G.-F.; resources, J.M.Q.-M. and M.A.-B.; data curation, J.M.Q.-M., E.A.J.-A. and M.A.-B.; writing—original draft preparation, M.G.G.-F.; writing—review and editing, J.M.Q.-M., E.A.J.-A. and M.A.-B.; funding acquisition, M.A.-B. All authors have read and agreed to the published version of the manuscript.

Funding

This research was funded by Consejo Nacional de Ciencia y Tecnología (CONACYT), grant number FC-2015-2-947.

Data Availability Statement

Data will be available upon request.

Acknowledgments

This work was supported by the Consejo Nacional de Ciencia y Tecnología (CONACYT) under the grant FC-2015-2-947. The authors wish to acknowledge scholarship support from CONACYT for MGGF. The authors also acknowledge Hector Silva, Beatriz Rivera, Dulce Partida, Gladis Labrada, Ignacio Becerril, Ana Irais Peña, the LINAN, the IPICYT, and the UABC for providing laboratory support.

Conflicts of Interest

The authors declare no conflicts of interest.

References

  1. Machrafi, H. Green Energy and Technology; Benthan Science Publishers: Sharjah, United Arab Emirates, 2012. [Google Scholar]
  2. Energy Mix. How Much of Global Energy Comes from Low-Carbon Sources. Available online: https://ourworldindata.org/energy-mix (accessed on 11 December 2024).
  3. Renewable Energy Market Outlook—2025. Available online: https://www2.deloitte.com/us/en/insights/industry/renewable-energy/renewable-energy-industry-outlook.html (accessed on 11 December 2024).
  4. Huggins, R.A. Energy Storage: Fundamentals, Materials and Applications, 2nd ed.; Springer: New York, NY, USA, 2015. [Google Scholar]
  5. Gupta, R.B. Hydrogen Fuel: Production, Transport and Storage; CRC Press: Boca Raton, FL, USA, 2008. [Google Scholar]
  6. McKendry, P. Energy production from biomass (Part 1): Overview of biomass. Bioresour. Technol. 2002, 83, 37–46. [Google Scholar] [CrossRef] [PubMed]
  7. Simmons, G.M.; Gentry, M. Kinetic formation of CO, CO2, H2, and light hydrocarbon gases from cellulose pyrolysis. J. Anal. Appl. Pyrolysis 1986, 10, 129–138. [Google Scholar] [CrossRef]
  8. Wu, C.; Wang, Z.; Huang, J.; Williams, P.T. Pyrolysis/gasification of cellulose, hemicellulose and lignin for hydrogen production in the presence of various nickel-based catalysts. Fuel 2013, 106, 697–706. [Google Scholar] [CrossRef]
  9. Lanza, R.; Nogare, D.D.; Canu, P. Gas phase chemistry in cellulose fast pyrolysis. Ind. Eng. Chem. Res. 2009, 48, 1391–1399. [Google Scholar] [CrossRef]
  10. Zhao, M.; Yang, X.; Church, T.L.; Harris, A.T. Interaction between a bimetallic Ni-Co catalyst and micrometer-sized CaO for enhanced H2 production during cellulose decomposition. Int. J. Hydrogen Energy 2011, 36, 421–431. [Google Scholar] [CrossRef]
  11. Zhao, M.; Yang, X.; Church, T.L.; Harris, A.T. Novel CaO-SiO2 sorbent and bifunctional Ni/Co-CaO/SiO2 complex for selective H2 synthesis from cellulose. Environ. Sci. Technol. 2012, 46, 2976–2983. [Google Scholar] [CrossRef]
  12. Zhao, M.; Cui, X.; Ji, G.; Zhou, H.; Vuppaladadiyam, A.K.; Zhao, X. Alkaline Thermal Treatment of Cellulosic Biomass for H2 Production Using Ca-Based Bifunctional Materials. ACS Sustain. Chem. Eng. 2019, 7, 1202–1209. [Google Scholar] [CrossRef]
  13. Widyaningrum, R.N.; Church, T.L.; Zhao, M.; Harris, A.T. Mesocellular-foam-silica supported Ni catalyst: Effect of pore size on H2 production from cellulose pyrolysis. Int. J. Hydrogen Energy 2012, 37, 9590–9601. [Google Scholar] [CrossRef]
  14. Widyaningrum, R.N.; Church, T.L.; Harris, A.T. Promoting effect of Pd on H2 production from cellulose pyrolysis over mesocellular-foam-supported Ni catalysts. Catal. Commun. 2013, 35, 45–50. [Google Scholar] [CrossRef]
  15. Matras, J.; Niewiadomski, M.; Ruppert, A.; Grams, J. Activity of Ni catalysts for hydrogen production via biomass pyrolysis. Kinet. Catal. 2012, 53, 565–569. [Google Scholar] [CrossRef]
  16. Ruppert, A.M.; Niewiadomski, M.; Grams, J.; Kwapiński, W. Optimization of Ni/ZrO2 catalytic performance in thermochemical cellulose conversion for enhanced hydrogen production. Appl. Catal. B Environ. 2014, 145, 85–90. [Google Scholar] [CrossRef]
  17. Donar, Y.O.; Sinaǧ, A. Catalytic effect of tin oxide nanoparticles on cellulose pyrolysis. J. Anal. Appl. Pyrolysis 2016, 119, 69–74. [Google Scholar] [CrossRef]
  18. Grams, J.; Niewiadomski, M.; Ryczkowski, R.; Ruppert, A.M.; Kwapiński, W. Activity and characterization of Ni catalyst supported on CeO2-ZrO2 for thermo-chemical conversion of cellulose. Int. J. Hydrogen Energy 2016, 41, 8679–8687. [Google Scholar] [CrossRef]
  19. Grams, J.; Potrzebowska, N.; Goscianska, J.; Michalkiewicz, B.; Ruppert, A.M. Mesoporous silicas as supports for Ni catalyst used in cellulose conversion to hydrogen rich gas. Int. J. Hydrogen Energy 2016, 41, 8656–8667. [Google Scholar] [CrossRef]
  20. Grams, J.; Goscianska, J.; Potrzebowska, N.; Ryczkowski, R.; Michalkiewicz, B.; Ruppert, A.M. Impact of Zr Incorporation into the Ni/AlSBA-15 Catalyst on Its Activity in Cellulose Conversion to Hydrogen-Rich Gas. Energy Fuels 2017, 31, 14089–14096. [Google Scholar] [CrossRef]
  21. Ryczkowski, R.; Niewiadomski, M.; Michalkiewicz, B.; Skiba, E.; Ruppert, A.M.; Grams, J. Effect of alkali and alkaline earth metals addition on Ni/ZrO2 catalyst activity in cellulose conversion. J. Therm. Anal. Calorim. 2016, 126, 103–110. [Google Scholar] [CrossRef]
  22. Ryczkowski, R.; Ruppert, A.M.; Przybysz, P.; Chałupka, K.; Grams, J. Hydrogen production from biomass woodchips using Ni/CaO–ZrO2 catalysts. React. Kinet. Mech. Catal. 2017, 121, 97–107. [Google Scholar] [CrossRef]
  23. Memon, M.Z.; Ji, G.; Li, J.; Zhao, M. Na2ZrO3 as an Effective Bifunctional Catalyst Sorbent during Cellulose Pyrolysis. Ind. Eng. Chem. Res. 2017, 56, 3223–3230. [Google Scholar] [CrossRef]
  24. Ferdous, D.; Dalai, A.K.; Bej, S.K.; Thring, R.W.; Bakhshi, N.N. Production of H2 and medium Btu gas via pyrolysis of lignins in a fixed-bed reactor. Fuel Process. Technol. 2001, 70, 9–26. [Google Scholar] [CrossRef]
  25. Ferdous, D.; Dalai, A.K.; Bej, S.K.; Thring, R.W. Pyrolysis of lignins: Experimental and kinetics studies. Energy Fuels 2002, 16, 1405–1412. [Google Scholar] [CrossRef]
  26. Baumlin, S.; Broust, F.; Bachi, F.B.; Bourdeaux, T.; Herbinet, O.; Ndiaye, F.T.; Ferrer, M.; Lédé, J. Production of hydrogen by lignins fast pyrolysis. Int. J. Hydrogen Energy 2006, 31, 2179–2192. [Google Scholar] [CrossRef]
  27. Widyawati, M.; Church, T.L.; Florin, N.H.; Harris, A.T. Hydrogen synthesis from biomass pyrolysis with in situ carbon dioxide capture using calcium oxide. Int. J. Hydrogen Energy 2011, 36, 4800–4813. [Google Scholar] [CrossRef]
  28. Trinh, T.N.; Jensen, P.A.; Sárossy, Z.; Johansen, K.D.; Knudsen, N.O.; Sørensen, H.R.; Egsgaard, H. Fast pyrolysis of lignin using a pyrolysis centrifuge reactor. Energy Fuels 2013, 27, 3802–3810. [Google Scholar] [CrossRef]
  29. Zhou, H.; Wu, C.; Onwudili, J.A.; Meng, A.; Zhang, Y.; Williams, P.T. Polycyclic aromatic hydrocarbon formation from the pyrolysis/gasification of lignin at different reaction conditions. Energy Fuels 2014, 28, 6371–6379. [Google Scholar] [CrossRef]
  30. Jung, K.A.; Nam, C.W.; Woo, S.H.; Park, J.M. Response surface method for optimization of phenolic compounds production by lignin pyrolysis. J. Anal. Appl. Pyrolysis 2016, 120, 409–415. [Google Scholar] [CrossRef]
  31. Volpe, R.; Zabaniotou, A.A.; Skoulou, V. Synergistic Effects between Lignin and Cellulose during Pyrolysis of Agricultural Waste. Energy Fuels 2018, 32, 8420–8430. [Google Scholar] [CrossRef]
  32. Akubo, K.; Nahil, M.A.; Williams, P.T. Pyrolysis-catalytic steam reforming of agricultural biomass wastes and biomass components for production of hydrogen/syngas. J. Energy Inst. 2019, 92, 1987–1996. [Google Scholar] [CrossRef]
  33. Lv, P.; Chang, J.; Wang, T.; Wu, C.; Tsubaki, N. A kinetic study on biomass fast catalytic pyrolysis. Energy Fuels 2004, 18, 1865–1869. [Google Scholar] [CrossRef]
  34. Collard, F.X.; Blin, J.; Bensakhria, A.; Valette, J. Influence of impregnated metal on the pyrolysis conversion of biomass constituents. J. Anal. Appl. Pyrolysis 2012, 95, 213–226. [Google Scholar] [CrossRef]
  35. Milovanović, J.; Luque, R.; Tschentscher, R.; Romero, A.A.; Li, H.; Shih, K.; Rajić, N. Study on the pyrolysis products of two different hardwood lignins in the presence of NiO contained-zeolites. Biomass Bioenergy 2017, 103, 29–34. [Google Scholar] [CrossRef]
  36. Yang, H.; Norinaga, K.; Li, J.; Zhu, W.; Wang, H. Effects of HZSM-5 on volatile products obtained from the fast pyrolysis of lignin and model compounds. Fuel Process. Technol. 2018, 181, 207–214. [Google Scholar] [CrossRef]
  37. Simonetti, D.A.; Kunkes, E.L.; Dumesic, J.A. Gas-phase conversion of glycerol to synthesis gas over carbon-supported platinum and platinum-rhenium catalysts. J. Catal. 2007, 247, 298–306. [Google Scholar] [CrossRef]
  38. Granados-Fitch, M.G.; Quintana-Melgoza, J.M.; Juarez-Arellano, E.A.; Avalos-Borja, M. Mechanism to H2 production on rhenium carbide from pyrolysis of coconut shell. Int. J. Hydrogen Energy 2019, 44, 2784–2796. [Google Scholar] [CrossRef]
  39. Granados-Fitch, M.G.; Quintana-Melgoza, J.M.; Juarez-Arellano, E.A.; Avalos-Borja, M. Rhenium borides (Re3B and ReB2) mechanosynthesis and their use as a catalyst for H2 production from biomass pyrolysis. Mater. Res. Bull. 2021, 137, 111180. [Google Scholar] [CrossRef]
  40. Granados-Fitch, M.G.; Juarez-Arellano, E.A.; Quintana-Melgoza, J.M.; Avalos-Borja, M. Mechanosynthesis of rhenium carbide at ambient pressure and temperature. Int. J. Refract. Met. Hard Mat. 2016, 55, 11–15. [Google Scholar] [CrossRef]
  41. Granados-Fitch, M.G.; Quintana-Melgoza, J.M.; Juarez-Arellano, E.A.; Avalos-Borja, M. Chemical stability of ReB2 at oxygen and moisture ambient environmental conditions prepared by mechanical milling. J. Am. Ceram. Soc. 2018, 101, 3148–3155. [Google Scholar] [CrossRef]
  42. Murray, H.H.; Kelty, S.P.; Chianelli, R.R.; Day, C.S. Structure of Rhenium Disulfide. Inorg. Chem. 1994, 33, 4418–4420. [Google Scholar] [CrossRef]
  43. Coleman, K.S.; Sloan, J.; Hanson, N.A.; Brown, G.; Clancy, G.P.; Terrones, M.; Terrones, H.; Green, M.L.H. The Formation of ReS2 Inorganic Fullerene-like Structures Containing Re4 Parallelogram Units and Metal–Metal Bonds. Am. Chem. Soc. 2002, 124, 11580–11581. [Google Scholar] [CrossRef]
  44. Yella, A.; Therese, H.A.; Zink, N.; Panthöfer, M.; Tremel, W. Large Scale MOCVD Synthesis of Hollow ReS2 Nanoparticles with Nested Fullerene-Like Structure. Chem. Mater. 2008, 20, 3587–3593. [Google Scholar] [CrossRef]
  45. Ho, T.C.; Shen, Q.; McConnachie, J.M.; Kliewer, C.E. Kinetic characterization of unsupported ReS2 as hydroprocessing catalyst. J. Catal. 2010, 176, 114–122. [Google Scholar] [CrossRef]
  46. Tu, W.; Denizot, B. Synthesis of small-sized rhenium sulfide colloidal nanoparticles. J. Colloid Interface Sci. 2007, 30, 167–170. [Google Scholar] [CrossRef] [PubMed]
  47. Uvarov, V.; Popov, I. Metrological characterization of X-ray diffraction methods for determination of crystallite size in nano-scale materials. Mater. Charact. 2007, 58, 883–891. [Google Scholar] [CrossRef]
  48. Garnier, G.; Bouchard, J.; Overend, R.P.; Chornet, E.; Vidal, P.F. High yield production of microcrystalline cellulose by a thermo-mechano-solvolytic treatment. Can. J. Chem. Eng. 1990, 68, 113–118. [Google Scholar] [CrossRef]
  49. Che, M. Nobel Prize in chemistry 1912 to Sabatier: Organic chemistry or catalysis? Catal. Today 2013, 218–219, 162–171. [Google Scholar] [CrossRef]
  50. Ferro, Y.; Marinelli, F.; Allouche, A.; Brosset, C. Density functional theory investigation of H adsorption on the basal plane of boron-doped graphite. J. Chem. Phys. 2003, 118, 5650–5657. [Google Scholar] [CrossRef]
  51. Ferro, Y.; Marinelli, F.; Jelea, A.; Allouche, A. Adsorption, diffusion, and recombination of hydrogen on pure and boron-doped graphite surfaces. J. Chem. Phys. 2004, 120, 11882–11888. [Google Scholar] [CrossRef]
  52. Dowling, N.I.; Hyne, J.B.; Brown, D.M.; Brown, D.M. Kinetics of the Reaction between Hydrogen and Sulfur under High-Temperature Claus Furnace Conditions. Ind. Eng. Chem. Res. 1990, 29, 2327–2332. [Google Scholar] [CrossRef]
  53. Ducros, R.; Ehrhardt, J.J.; Alnot, M.; Cassuto, A. Hydrogen and deuterium adsorption on polycrystalline rhenium surfaces; effect of carbon and oxygen coadsorption. Surf. Sci. 1976, 55, 509–522. [Google Scholar] [CrossRef]
  54. Pallassana, V.; Neurock, M. Theoretical analysis of hydrogen chemisorption on Pd(111), Re(0001) and PdML/Re(0001), ReML/Pd(111) pseudomorphic overlayers. Phys. Rev. B Condens. Matter Mater. Phys. 1999, 60, 6146–6154. [Google Scholar] [CrossRef]
  55. Poulter, K.F.; Pryde, J.A. Chemisorption of hydrogen on rhenium. J. Phys. D. Appl. Phys. 1968, 1, 169–172. [Google Scholar] [CrossRef]
  56. Muschiol, U.; Lenz, J.; Schwarz, E.; Christmann, K. Interaction of hydrogen with Re(10 10): H binding states and ordered phases. Surf. Sci. 1995, 333, 127–132. [Google Scholar] [CrossRef]
  57. Zhou, Z.; Zhao, J.; Chen, Z.; Gao, X.; Yan, T.; Wen, B.; Schleyer, P.V.R. Comparative study of hydrogen adsorption on carbon and BN nanotubes. J. Phys. Chem. B 2006, 110, 13363–13369. [Google Scholar] [CrossRef] [PubMed]
  58. Shao, X.; Luo, H.; Cai, J.; Dong, C. First-principles study of single atom adsorption on capped single-walled carbon nanotubes. Int. J. Hydrogen Energy 2014, 39, 10161–10168. [Google Scholar] [CrossRef]
  59. Andreoni, W.; Curioni, A.; Kroes, J.M.H.; Pietrucci, F.; Gröning, O. Exohedral hydrogen chemisorption on a carbon nanotube: The clustering effect. J. Phys. Chem. C 2012, 116, 269–275. [Google Scholar] [CrossRef]
  60. Kayanuma, M.; Nagashima, U.; Nishihara, H.; Kyotani, T.; Ogawa, H. Adsorption and diffusion of atomic hydrogen on a curved surface of microporous carbon: A theoretical study. Chem. Phys. Lett. 2010, 495, 251–255. [Google Scholar] [CrossRef]
  61. Boukhvalov, D.W.; Katsnelson, M.I.; Lichtenstein, A.I. Hydrogen on graphene: Electronic structure, total energy, structural distortions and magnetism from first-principles calculations. Phys. Rev. B Condens. Matter Mater. Phys. 2008, 77, 035427. [Google Scholar] [CrossRef]
  62. Yang, M.; Nurbawono, A.; Zhang, C.; Wu, R.; Feng, Y. Ariando, Manipulating absorption and diffusion of H atom on graphene by mechanical strain. AIP Adv. 2011, 1, 032109. [Google Scholar] [CrossRef]
  63. Casolo, S.; Løvvik, O.M.; Martinazzo, R.; Tantardini, G.F. Understanding adsorption of hydrogen atoms on graphene. J. Chem. Phys. 2009, 130, 054704. [Google Scholar] [CrossRef]
  64. Katin, K.P.; Prudkovskiy, V.S.; Maslov, M.M. Chemisorption of hydrogen atoms and hydroxyl groups on stretched graphene: A coupled QM/QM study. Phys. Lett. A 2017, 381, 2686–2690. [Google Scholar] [CrossRef]
  65. Radosinski, L.; Kuchta, B. Hydrogen chemisorption on carbon structure with mixed sp2 sp3 hybridization: Empirical potential studies. Adsorption 2014, 20, 875–882. [Google Scholar] [CrossRef]
  66. Mårlid, B.; Larsson, K.; Carlsson, J.O. Chemical interaction of H2, Br2, and HBr with α boron surfaces. J. Phys. Chem. B 2001, 105, 12797–12802. [Google Scholar] [CrossRef]
  67. Oku, T. Hydrogen storage in boron nitride and carbon nanomaterials. Energies 2015, 8, 319–337. [Google Scholar] [CrossRef]
  68. Koi, N.; Oku, T. Molecular orbital calculations of hydrogen storage in carbon and boron nitride clusters. Sci. Technol. Adv. Mater. 2004, 5, 625–628. [Google Scholar] [CrossRef]
  69. Manchanda, P.; Enders, A.; Sellmyer, D.J.; Skomski, R. Hydrogen-induced ferromagnetism in two-dimensional Pt dichalcogenides. Phys. Rev. B 2016, 94, 104426. [Google Scholar] [CrossRef]
  70. Chen, W.; Santos, E.J.G.; Zhu, W.; Kaxiras, E.; Zhang, Z. Tuning the electronic and chemical properties of monolayer MoS2 adsorbed on transition metal substrates. Nano Lett. 2013, 13, 509–514. [Google Scholar] [CrossRef] [PubMed]
  71. Han, S.W.; Cha, G.B.; Park, Y.; Hong, S.C. Hydrogen physisorption based on the dissociative hydrogen chemisorption at the sulfur vacancy of MoS2 surface. Sci. Rep. 2017, 7, 7152. [Google Scholar] [CrossRef]
  72. Mele, F.; Russo, N.; Toscano, M. Hydrogen chemisorption on the Ni(100) surface: Electronic and magnetic properties from a local-spin-density study. Surf. Sci. 1991, 251–252, 46–50. [Google Scholar] [CrossRef]
  73. Paul, J.F.; Sautet, P. Comparison of the nature of the hydrogen-metal bond on Pd(111) and Ni(111) by a periodic density functional method. Surf. Sci. 1996, 356, L403–L409. [Google Scholar] [CrossRef]
  74. Klinke, D.J.; Dooling, D.J.; Broadbelt, L.J. Theoretical study of methylidyne chemisorption on Ni(111) and Co(0001) surfaces. Surf. Sci. 1999, 425, 334–342. [Google Scholar] [CrossRef]
  75. Yeo, J.Y.; Chin, B.L.F.; Tan, J.K.; Loh, Y.S. Comparative studies on the pyrolysis of cellulose, hemicellulose, and lignin based on combined kinetics. J. Energy Inst. 2019, 92, 27–37. [Google Scholar] [CrossRef]
  76. Ferreiro, A.I.; Rabaçal, M.; Costa, M.; Giudicianni, P.; Grottola, C.M.; Ragucci, R. Modeling the impact of the presence of KCl on the slow pyrolysis of cellulose. Fuel 2018, 215, 57–65. [Google Scholar] [CrossRef]
  77. Wang, W.; Shi, Y.; Cui, Y.; Li, X. Catalytic fast pyrolysis of cellulose for increasing contents of furans and aromatics in biofuel production. J. Anal. Appl. Pyrolysis 2018, 131, 93–100. [Google Scholar] [CrossRef]
  78. Watanabe, H.; Shimomura, K.; Okazaki, K. Carbonate formation during lignin pyrolysis under CO2 and its effect on char oxidation. Proc. Combust. Inst. 2015, 35, 2423–2430. [Google Scholar] [CrossRef]
  79. Yu, H.; Wu, Z.; Chen, G. Catalytic gasification characteristics of cellulose, hemicellulose and lignin. Renew. Energy 2018, 121, 559–567. [Google Scholar] [CrossRef]
Figure 1. X-ray diffraction patterns of ReS2 mechanosynthesis at different milling times. Crystallographic PDF4+ cards: rhenium (▲, 01-087-0599), tungsten carbide (■, 04-007-5192) and ReS2 (♣, 04-007-2320). Sulfur (*, 01-074-1465).
Chemistry 07 00033 g001
Figure 2. Surface and morphological characterization of the ReS2 catalyst after 2000 min of milling. (a) BET isotherm and (b) SEM characterization. TEM bright field (c) and filtered image (d); the interplanar distances of 0.63 and 0.67 nm are in good agreement with the value of 0.60 nm belonging to (002) plane of ReS2 (PDF4+ 04-007-2320).
Chemistry 07 00033 g002
Figure 3. X-ray diffraction pattern of commercial catalyst NiO/SiO2. Stick diagram of NiO, PDF4+ card 00-004-0835.
Chemistry 07 00033 g003
Figure 4. Surface and morphological characterization of the NiO/SiO2 catalyst. (a) BET isotherm and (b) SEM characterization. TEM characterization (c,d); the interplanar distance of 0.24 nm in identical correspondence with the value of 0.24 nm of (111) plane of NiO PDF4+ 00-004-0835. The yellow rectangle in (d) shows the region where the high-resolution image shown at the bottom right of the image was obtained.
Chemistry 07 00033 g004
Figure 5. Catalytic pyrolysis of cellulose using rhenium catalysts. H2 production: 10 wt.% (a) and 20 wt.% (b); CH4 production: 10 wt.% (c) and 20 wt.% (d).
Chemistry 07 00033 g005
Figure 6. Catalytic pyrolysis of cellulose using rhenium catalysts. CO production: 10 wt.% (a) and 20 wt.% (b); char generation: 10 wt.% (c) and 20 wt.% (d).
Chemistry 07 00033 g006
Figure 7. Reaction mechanism for H2 formation from cellulose pyrolysis using rhenium catalysts.
Chemistry 07 00033 g007
Figure 8. Catalytic pyrolysis of lignin using rhenium catalysts. H2 production: 10 wt% (a) and 20 wt% (b); CH4 production: 10 wt% (c) and 20 wt% (d).
Chemistry 07 00033 g008
Figure 9. Catalytic pyrolysis of lignin using rhenium catalysts. CO production: 10 wt% (a) and 20 wt% (b); char generation: 10 wt% (c) and 20 wt% (d).
Chemistry 07 00033 g009
Figure 10. Reaction mechanism for H2 formation during lignin pyrolysis using rhenium catalysts.
Chemistry 07 00033 g010
Table 1. The production of H2, CH4, CO, and char during the catalytic pyrolysis of cellulose at 800 °C using 10 and 20 wt.% rhenium-based catalysts.
Catalyst10 wt.% Catalyst20 wt.% Catalyst
H2/ppmCH4/ppmCO/ppmChar/mgH2/ppmCH4/ppmCO/ppmChar/mg
without445311644538.7445311644538.7
ReS211,512335920,8525.212,494188032,5872.1
ReB211,389212919,0709.220,012229828,1829.1
Re3B28,616114132,0425.429,63234736,5472.9
Re2C927255781539.120,421231219,6138.9
NiO/SiO218,486165414,8136.817,949112017,8023.1
Table 2. Adsorption energies of monoatomic hydrogen over the catalytic centers in the tested catalysts.
ProcessAdsorption Energy (kJ mol−1)Reference
Re-H280, 272, 127, 125[53,54,55,56]
C-H (CNT)190, 185, 158[57,58,59]
C-H (graphene)140, 138, 73, 72, 66[60,61,62,63,64]
C-H (graphite)31[65]
B-H290, 144, 140[66,67,68]
S-H110 (PtS2), 103 y 63 (MoS2)[69,70,71]
Ni-H299, 200, 197[72,73,74]
Table 3. H2 yield by catalytic cellulose pyrolysis at high temperatures.
CatalystSBET (m2g−1)% H2 YieldTemperatureReference
20Ni1Ca/ZrO22.056.9700 °C[21]
20Ni10CaO/ZrO2(CI) a32.052.2700 °C[22]
20Ni10CaO/ZrO2(I) b37.050.2700 °C[22]
20Ni/ZrO2127.048.5700 °C[22]
20Ni/15CeO2-ZrO2(I) b70.048.0700 °C[18]
20Ni1Na/ZrO2128.046.1700 °C[21]
20Ni/15CeO2-ZrO2(S) c30.046.1700 °C[18]
20Ni1Mg/ZrO27.045.5700 °C[21]
20Ni/50CeO2-ZrO2(I) b47.044.9700 °C[18]
20Ni/50CeO2-ZrO2(S) c9.044.9700 °C[18]
Re3B0.4844.0800 °CThis study
20Ni1K/ZrO2148.043.5700 °C[21]
20Ni/15CeO2-ZrO2(P) c135.042.7700 °C[18]
20Ni/50CeO2-ZrO2(P) c140.042.1700 °C[18]
Ni/ZrAlSBA-15 (I) b495.040.1700 °C[20]
20Ni/ZrO2N.V.37.4700 °C[15]
NiON.V.36.8700 °C[16]
20Ni/ZrO2164.034.8700 °C[21]
20Ni/(10ZrO2+Al2O3)N.V.33.4700 °C[15]
20Ni/SiO2N.V.32.8700 °C[15]
20Ni/SBA-15475.032.6700 °C[19]
Ni/SiO2219.032.4700 °C[20]
20Ni/KIT-6397.032.0700 °C[19]
20Ni/CeO2N.V.31.8700 °C[15]
20Ni/Al2O3N.V.31.4700 °C[15]
Re2C0.4331.4800 °CThis study
ReB20.5230.7800 °CThis study
20Ni/SiO2232.029.8700 °C[19]
20Ni/ZrO2122.028.9f700 °C[18]
Ni/AlSBA-15386.028.4700 °C[20]
NiO/SiO2189.328.4800 °CThis study
20Ni/MCM-41493.026.7700 °C[19]
20Ni/SBA-16328.021.2700 °C[19]
N.C.N.V.20.4500 °C[8]
N.C.N.V.20.0700 °C[15]
ReS241.719.2800 °CThis study
N.C.N.V.18.7700 °C[18]
KIT-6667.018.4700 °C[19]
SBA-15802.013.5700 °C[19]
MCM-41852.011.0700 °C[19]
SnO2N.V.7.6700 °C[17]
N.C.N.V.6.8800 °CThis study
SBA-16743.05.5700 °C[19]
N.C.N.V.4.3700 °C[22]
Notes. a: CI (co-impregnation); b: I (impregnation); c: S (solgel), P (precipitation); N.C., not catalytic; N.V., non-value.
Table 4. The production of H2, CH4, CO, and char generation during the catalytic pyrolysis of lignin at 800 °C using 10 and 20 wt.% of rhenium-based catalysts.
Catalyst10 wt.% Catalyst20 wt.% Catalyst
H2/ppmCH4/ppmCO/ppmChar/mgH2/ppmCH4/ppmCO/ppmChar/mg
without31,664125431,34734.131,664125431,34734.1
ReS230,11151719,2443928,27260820,87439.4
ReB226,51648120,23037.231,32418725,64033.6
Re3B34,02830126,62533.926,88929423,97432.8
Re2C34,39948535,18232.6 31,594102824,96141.5
NiO/SiO238,687208943,47733.537,39360233,28132.9
Table 5. H2 yield from pyrolysis of different lignins under non-catalytic and catalytic conditions.
Type of LigninCatalystSBET (m2g−1)% H2 YieldTemperatureReference
Alkali ligninNiO/SiO2189.386.1800 °CThis study
Eucalyptus ligninNiO/H-Y642.081.5500 °C[35]
Alkali ligninRe2C0.4376.6800 °CThis study
Alkali ligninRe3B0.4875.7800 °CThis study
Kraft ligninN.C.N.V.73.0800 °C[25]
Alkali ligninN.C.N.V.70.5800 °CThis study
Alkali ligninReS241.767.7800 °CThis study
Eucalyptus ligninNiO/HSZM-5330.061.4500 °C[35]
Eucalyptus ligninNiO/H-BETA537.061.4500 °C[35]
Alkali ligninReB20.5259.0800 °CThis study
Alkali ligninN.C.N.V.40.0527 °C[26]
Dealkaline ligninN.C.N.V.26.3900 °C[29]
Merck ligninN.C.N.V.25.8550 °C[32]
Alkali ligninN.C.N.V.7.0500 °C[8]
Eucalyptus ligninN.C.N.V.6.2500 °C[35]
Disclaimer/Publisher’s Note: The statements, opinions and data contained in all publications are solely those of the individual author(s) and contributor(s) and not of MDPI and/or the editor(s). MDPI and/or the editor(s) disclaim responsibility for any injury to people or property resulting from any ideas, methods, instructions or products referred to in the content.

