Article

Hybrid Nanoparticles as Theranostics Platforms for Glioblastoma Treatment: Phototherapeutic and X-ray Phase Contrast Tomography Investigations

1
CNR NANOTEC-Institute of Nanotechnology U.O.S. Cosenza, 87036 Rende, Italy
2
Department of Physics, University of Calabria, 87036 Rende, Italy
3
Coriolan Dragulescu Institute of Chemistry, Romanian Academy, 24 Mihai Viteazu Bvd., 300223 Timisoara, Romania
4
CNR NANOTEC-Institute of Nanotechnology U.O.S. Roma, Piazzale Aldo Moro 5, 00185 Roma, Italy
5
Department of Chemistry and Chemical Technologies, University of Calabria, 87036 Rende, Italy
6
Calabria Unit, National Interuniversity Consortium of Materials Science and Technology, LASCAMM, 87036 Rende, Italy
7
Department of Physics and Case Comprehensive Cancer Center, Case Western Reserve University, 10600 Euclid Avenue, Cleveland, OH 44106, USA
*
Authors to whom correspondence should be addressed.
J. Nanotheranostics 2022, 3(1), 1-17; https://doi.org/10.3390/jnt3010001
Submission received: 8 November 2021 / Revised: 14 January 2022 / Accepted: 18 January 2022 / Published: 20 January 2022

Abstract

:
Glioblastoma multiforme (GBM) is one of the deadliest and most aggressive cancers, remarkably resilient to current therapeutic treatments. Here, we report preliminary in vivo studies of GBM treatments based on photo-nanotherapeutics to activate synergistic killing mechanisms. Core-shell nanoparticles have been weaponized by combining photophysical properties of a new generation PDT agent (Ir(III) complex) with the thermoplasmonic effects of resonant gold nanospheres. In order to investigate the damages induced in GBM treated with these photoactivable nanosystems, we employed X-ray phase-contrast tomography (XPCT). This high-resolution three-dimensional imaging technique highlighted a vast devascularization process by micro-vessels disruption, which is indicative of tumor elimination without relapse.

1. Introduction

Glioblastoma multiforme (GBM) is the most aggressive and prevalent brain cancer, accounting for over 70% of high-grade gliomas diagnosed [1,2,3,4]. Characterized by necrotic primary tumor centers with abundant and aberrant neovascularization [5], current therapeutic treatments include surgical resection followed by adjuvant chemotherapy and radiotherapy [6]. Despite the recent advances in conventional therapeutic strategies, the GBM prognosis remains poor, with a median survival of 12–14 months [7,8,9,10]. One of the important features of GBM cells is their infiltrative nature which leads to indistinguishable margins between normal and malignant brain tissue [11]. Consequently, complete resection is rarely feasible. In order to identify and eliminate residual tumor cells at the boundaries of the resection area and at the same time minimize the damage to the surrounding healthy brain tissue, currently a new therapeutic strategy—undergoing phase I clinical trial—consists of intraoperative fluorescent-guided resection followed by photodynamic treatment [12].
Photodynamic Therapy (PDT) is a minimally invasive cancer treatment approach that employs light to trigger a photodynamic mechanism mediated by a drug, the photosensitizer (PS), able to absorb and transfer the radiant energy to the ubiquitous molecular oxygen, generating reactive oxygen species (ROS), i.e., free radicals (type I reaction) and singlet oxygen (1O2; type II reaction) [13,14]. Recently, extraordinary efforts have been focused on investigating transition metal complexes (TMCs) as PSs for PDT applications [15]. Because of their photophysical properties, TMCs meet several essential requirements as PDT agents [16]. Furthermore, the remarkable luminescence associated with long emission lifetimes makes TMCs a useful probe for imaging [17,18]. Currently, the application of these complexes in PDT is in its infancy, with the first TMC entered into human clinical trials in early 2017 [19].
In the last decades, the development of nanotechnologies has opened new promising avenues in the biomedical field, improving the clinical outcomes of many lethal diseases, such as cancer [20,21]. Among the wide variety of nanomaterials reported in the literature, inorganic nanoparticles possess very interesting properties for clinical application [22,23]. In this frame, gold-core silica shell nanoparticles can be used to vehiculate treatment agents in specific sites by enhancing their efficacy significantly, thereby proving to be extremely promising for theranostic purposes [24]. Gold nanoparticles exhibit interesting size-dependent optical properties associated with the localized surface plasmon resonance phenomenon (LSPR) [25,26]. The interaction with light at a specific resonance wavelength (which depends on the particle size and shape) leads to the absorption of the radiant energy and its conversion both into heat and scattered radiation. Accordingly, if properly localized inside or in close proximity of tumor cells, light-activated metal nanoparticles induce temperature increase with consequent photothermal-mediated cell ablation (Photothermal Therapy, PTT) [27,28,29]. The inclusion of a silica shell confers stability to the gold nucleus and provides a reservoir for the encapsulation of PSs molecules acting as PDT therapeutic agents and imaging probes, simultaneously leading to the implementation of multifunctional nanoplatforms [30]. Recently, we reported the design and the development of a de novo platform for simultaneous cellular imaging, photodynamic and photothermal therapies [31]. The nanostructure is based on a highly luminescent water-soluble Ir(III) complex (Ir1) [32] embedded into gold-core silica shell nanoparticles (Ir1-AuSiO2). In vitro photo-cytotoxicity tests on GBM cells clearly demonstrated the potential of this nanoplatform to play a key role in the imaging and treatment of GBM [31]. These results emphasized striking synergistic photodynamic and photothermal effects as a result of the coupling between the photophysical properties of the TMC with the thermoplasmonic effects of the gold nanospheres [31].
Here, we report preliminary in vivo studies based on the phototherapeutic treatment of human GBM xenograft mouse model after Ir1 or Ir1-AuSiO2 intratumoral injection. High-resolution X-ray phase-contrast tomography (XPCT) [33,34] was employed to image the three-dimensional tumor vascular network with microscale resolution of ex vivo samples. In Figure 1a, a schematic illustration shows the treatment diagram and the effects of the nanotherapeutic agent, whereas Figure 1b shows a table of a direct comparison of Ir1 and Ir1-AuSiO2 properties and resulting advantages and disadvantages for in vivo photo-theranostics application.

2. Materials and Methods

2.1. Nanoplatform Synthesis and Characterization

Ir1 and Ir1-AuSiO2 were prepared according to the previously reported procedures [31,32], and all the reported studies were performed using the same nanoparticles sample batch. The obtained Ir1-AuSiO2 nanostructures were purified and concentrated by ultrafiltration method (Vivaspin R 20 equipped with a 100 KDa membrane), dispersed in pure water and finally filtered by using a 200 nm nylon membrane. The nanoparticles morphology was observed using a JEOL 2010F TEM at an operating voltage of 80 kV. The size distribution measurements were performed in triplicate at 25 °C by using the Dynamic Light Scattering (DLS) technique on a Zetasizer Nano ZS system from Malvern Instruments (632.8 nm, 4 mW HeNe gas laser, avalanche photodiode detector, 175° detection). Extinction spectra were recorded on a PerkinElmer Lambda 900 spectrophotometer, while steady-state excitation/emission spectra were collected with a HORIBA Joiobin-Yvon Fluorolog-3 FL3-211 fluorometer equipped with a 450 W xenon arc lamp, double-grating excitation and single-grating emission monochromators (2.1 nm mm−1 dispersion; 1200 grooves per mm), and a Hamamatsu R928 photomultiplier tube.
The studies reported below involving Ir1 and Ir1-AuSiO2 (singlet oxygen generation and in vivo experiments) were performed by irradiating with a lamp at 365 nm (Thermo Fisher Scientific, Waltham, MA, USA). In all cases, the treatment consisted of a single optical radiation dose (20 mW/cm2 for 15 min, equivalent to 18 J/cm2).

2.2. Detection of 1O2 Generation

Singlet oxygen generation was monitored by chemical oxidation of 9,10-Anthracenediyl-bis(methylene)dimalonic acid (ABDA) (Sigma-Aldrich, St. Louis, MO, USA) in an aqueous solution. The anthracene derivative reacts specifically and irreversibly with 1O2, leading to the corresponding endoperoxide (Scheme S1); the reaction can be monitored spectrophotometrically by measuring the decrease in the optical density at 378 nm [35]. Briefly, 15 µL of ABDA solution (2 mg/mL DMSO) was mixed, respectively, with 300 µL of Ir1 and Ir1-AuSiO2 water solutions ([Ir1] = 2 × 10⁻⁵ M) and placed in a quartz cuvette with an optical path length of 0.2 cm. The absorption spectra were recorded upon irradiation at 365 nm for 15 min (20 mW/cm2) at 3 min intervals. For comparative purposes, a similar ABDA solution was dispersed in water and irradiated under the same conditions. The reaction stoichiometric ratio (Scheme S1), leading to the formation of endoperoxides, implies the involvement of an equal number of moles of ABDA as well 1O2. Monitoring the ABDA absorbance as a function of the number of moles present in solution (Figure S1) and the amount of reacted ABDA molecules was calculated, and conversely of 1O2, after defined irradiation times. The absorption spectra were recorded using a Cary 300 UV-Vis spectrophotometer.

2.3. In Vivo and Ex Vivo Experiments

All animal studies were performed according to the guidelines of the Institutional Animal Care and Use Committee of Case Western Reserve University (Cleveland, OH, USA). Six to eight-week-old male athymic mice were injected subcutaneously into the right flank with 1 × 10⁶ of human glioblastoma Gli36∆5 cells (kindly provided by Prof. James P. Basilion, Case Western Reserve University, USA). Three to four weeks after cells implantation, when the tumors reached 120–170 mm3 in volume, the mice were randomly divided into groups with equivalent average starting tumor sizes and used to perform in vivo and ex vivo experiments.

2.3.1. Imaging

For in vivo imaging, mice bearing Gli36∆5 tumors were anesthetized with isoflurane and injected intratumorally with Ir1 or Ir1-AuSiO2 (200 µL, [Ir1] = 2 × 10⁻⁵ M in water). Fluorescent images were obtained using the IVIS Spectrum in vivo imaging system with the appropriate filters for Ir(III) complex (excitation = 430 nm, emission = 520 nm, acquisition settings = 520–620 in 20 nm steps). In order to provide autofluorescence spectra, background images were carried out before the Ir1 or Ir1-AuSiO2 intratumoral injection. After samples administration, fluorescence images were acquired at regular intervals for 24 h. The region-of-interest (ROI) was selected over the tumor, and pixel values for the Ir(III) complex signal were determined within these regions. The obtained values were normalized to the pre-injection ROI and then plotted.

2.3.2. Therapeutic Treatment

The in vivo phototherapy efficacy of Ir1 and Ir1-AuSiO2 was preliminarily investigated using five experimental groups of Gli36∆5-bearing mice (two treatment groups and three controls; n = 2 mice per group). In the treatment groups (Ir1 + light illumination or Ir1-AuSiO2 + light illumination), an aliquot of Ir1 or Ir1-AuSiO2 ([Ir1] = 2 × 10⁻⁵ M in water) was directly injected into the tumor by five injection points, arranged according to a starry symmetry. The total volume injected was 50 µL, equally distributed over the five injection points (10 µL per injection point). After 2 min post-injection, the entire tumor region was irradiated at 365 nm for 15 min (20 mW/cm2). One control group received an equivalent optical radiation dose and one an aliquot of Ir1 or Ir1-AuSiO2 without light exposure. Tumor volume and body weight evolution were monitored for all mice for over 100 days after treatment. During the entire treatment period, no detectable signs of toxicity, side effects such as loss of body weight and activity, or neurological issues were observed in all the experimental groups. Tumor volumes were measured with a digital caliper every other day and were calculated according to the formula: volume = (tumor length × tumor width × tumor height)/2. When the tumor size exceeded 1500 mm3, the mice were euthanized.

2.3.3. X-ray Phase-Contrast Tomography

In order to image the three-dimensional vasculature network and detect any abnormalities consequent to the phototherapy treatment, high-resolution X-ray phase-contrast tomography was performed on ex vivo Gli36∆5 tumors. Mouse xenograft models were intratumorally injected with Ir1 or Ir1-AuSiO2 (50 µL, [Ir1] = 2 × 10⁻⁵ M in water) and then irradiated at 365 nm for 15 min (20 mW/cm2). A control mouse was treated only with the same optical radiation dose. Twenty-four hours after treatment, the mice were euthanized, then the flank tumors were excised, fixed in 4% paraformaldehyde for 24 h and stored in PBS at 4 °C until the phase-contrast tomography experiments were performed.
Phase-contrast tomography experiments were carried out at I13 Manchester Beamline at the Diamond Light Source in Didcot, UK. The measurements were performed in free space propagation mode [36] with a propagation distance of 15 cm and an incident filtered pink beam with X-ray energy peaked at 27 keV. Images were detected with a PCO.Edge 5.5 (sCMOS-technology, 2560 × 2160 pixels, 6.5 µm pixel size and a 16-bit nominal dynamic range) coupled with a scintillator screen and 1.25× optics resulting in a total magnification of 2.5× due to the setup configuration. The effective pixel size was 2.6 µm and had a field of view of 6.65 mm × 5.616 mm. Tomography was performed by acquiring 4001 projections, with an acquisition time of 0.06 s per projection. During acquisition, samples were kept in the air.
Data pre-processing, phase retrieval [37] and filter back-projection reconstruction were performed with the open-source software toolkit SYRMEP Tomo Project (STP) [38], implementing the ASTRA toolbox for efficient tomographic reconstruction on GPU. Post-processing and three-dimensional rendering procedures of the vasculature and nanoparticles were carried out using the image processing program ImageJ 1.8 and VGstudio Max 3.2 software, respectively.

3. Results

3.1. Nanoplatform Synthesis and Characterization

Ir1 and Ir1-AuSiO2 were synthesized according to the reported procedures [31,32], and the characterization results (Figures S2–S4) confirmed the successful preparations. In particular, TEM images reveal a homogeneous population of spherical gold-core silica-shell nanostructures with an average size of 35 ± 2 nm and a metal core of 5 ± 1 nm (Figure S2a,b). The hydrodynamic diameter measured by the DLS technique is equal to 52 ± 1 nm (Polydispersity Index: PdI = 0.035), in line with the geometric one (Figure S3). The synthesized nanoparticles are water-soluble and exhibit long-term colloidal stability with no agglomeration even after 18 months. The extinction spectrum of Ir1-AuSiO2 displays a plasmon resonant frequency at 520 nm, whereas excitation and emission spectra confirm the Ir1 loading into the polysiloxane matrix (Figure S4a,b). The total amount of Ir(III) complex loaded into a nanoparticle was calculated as described elsewhere [31].

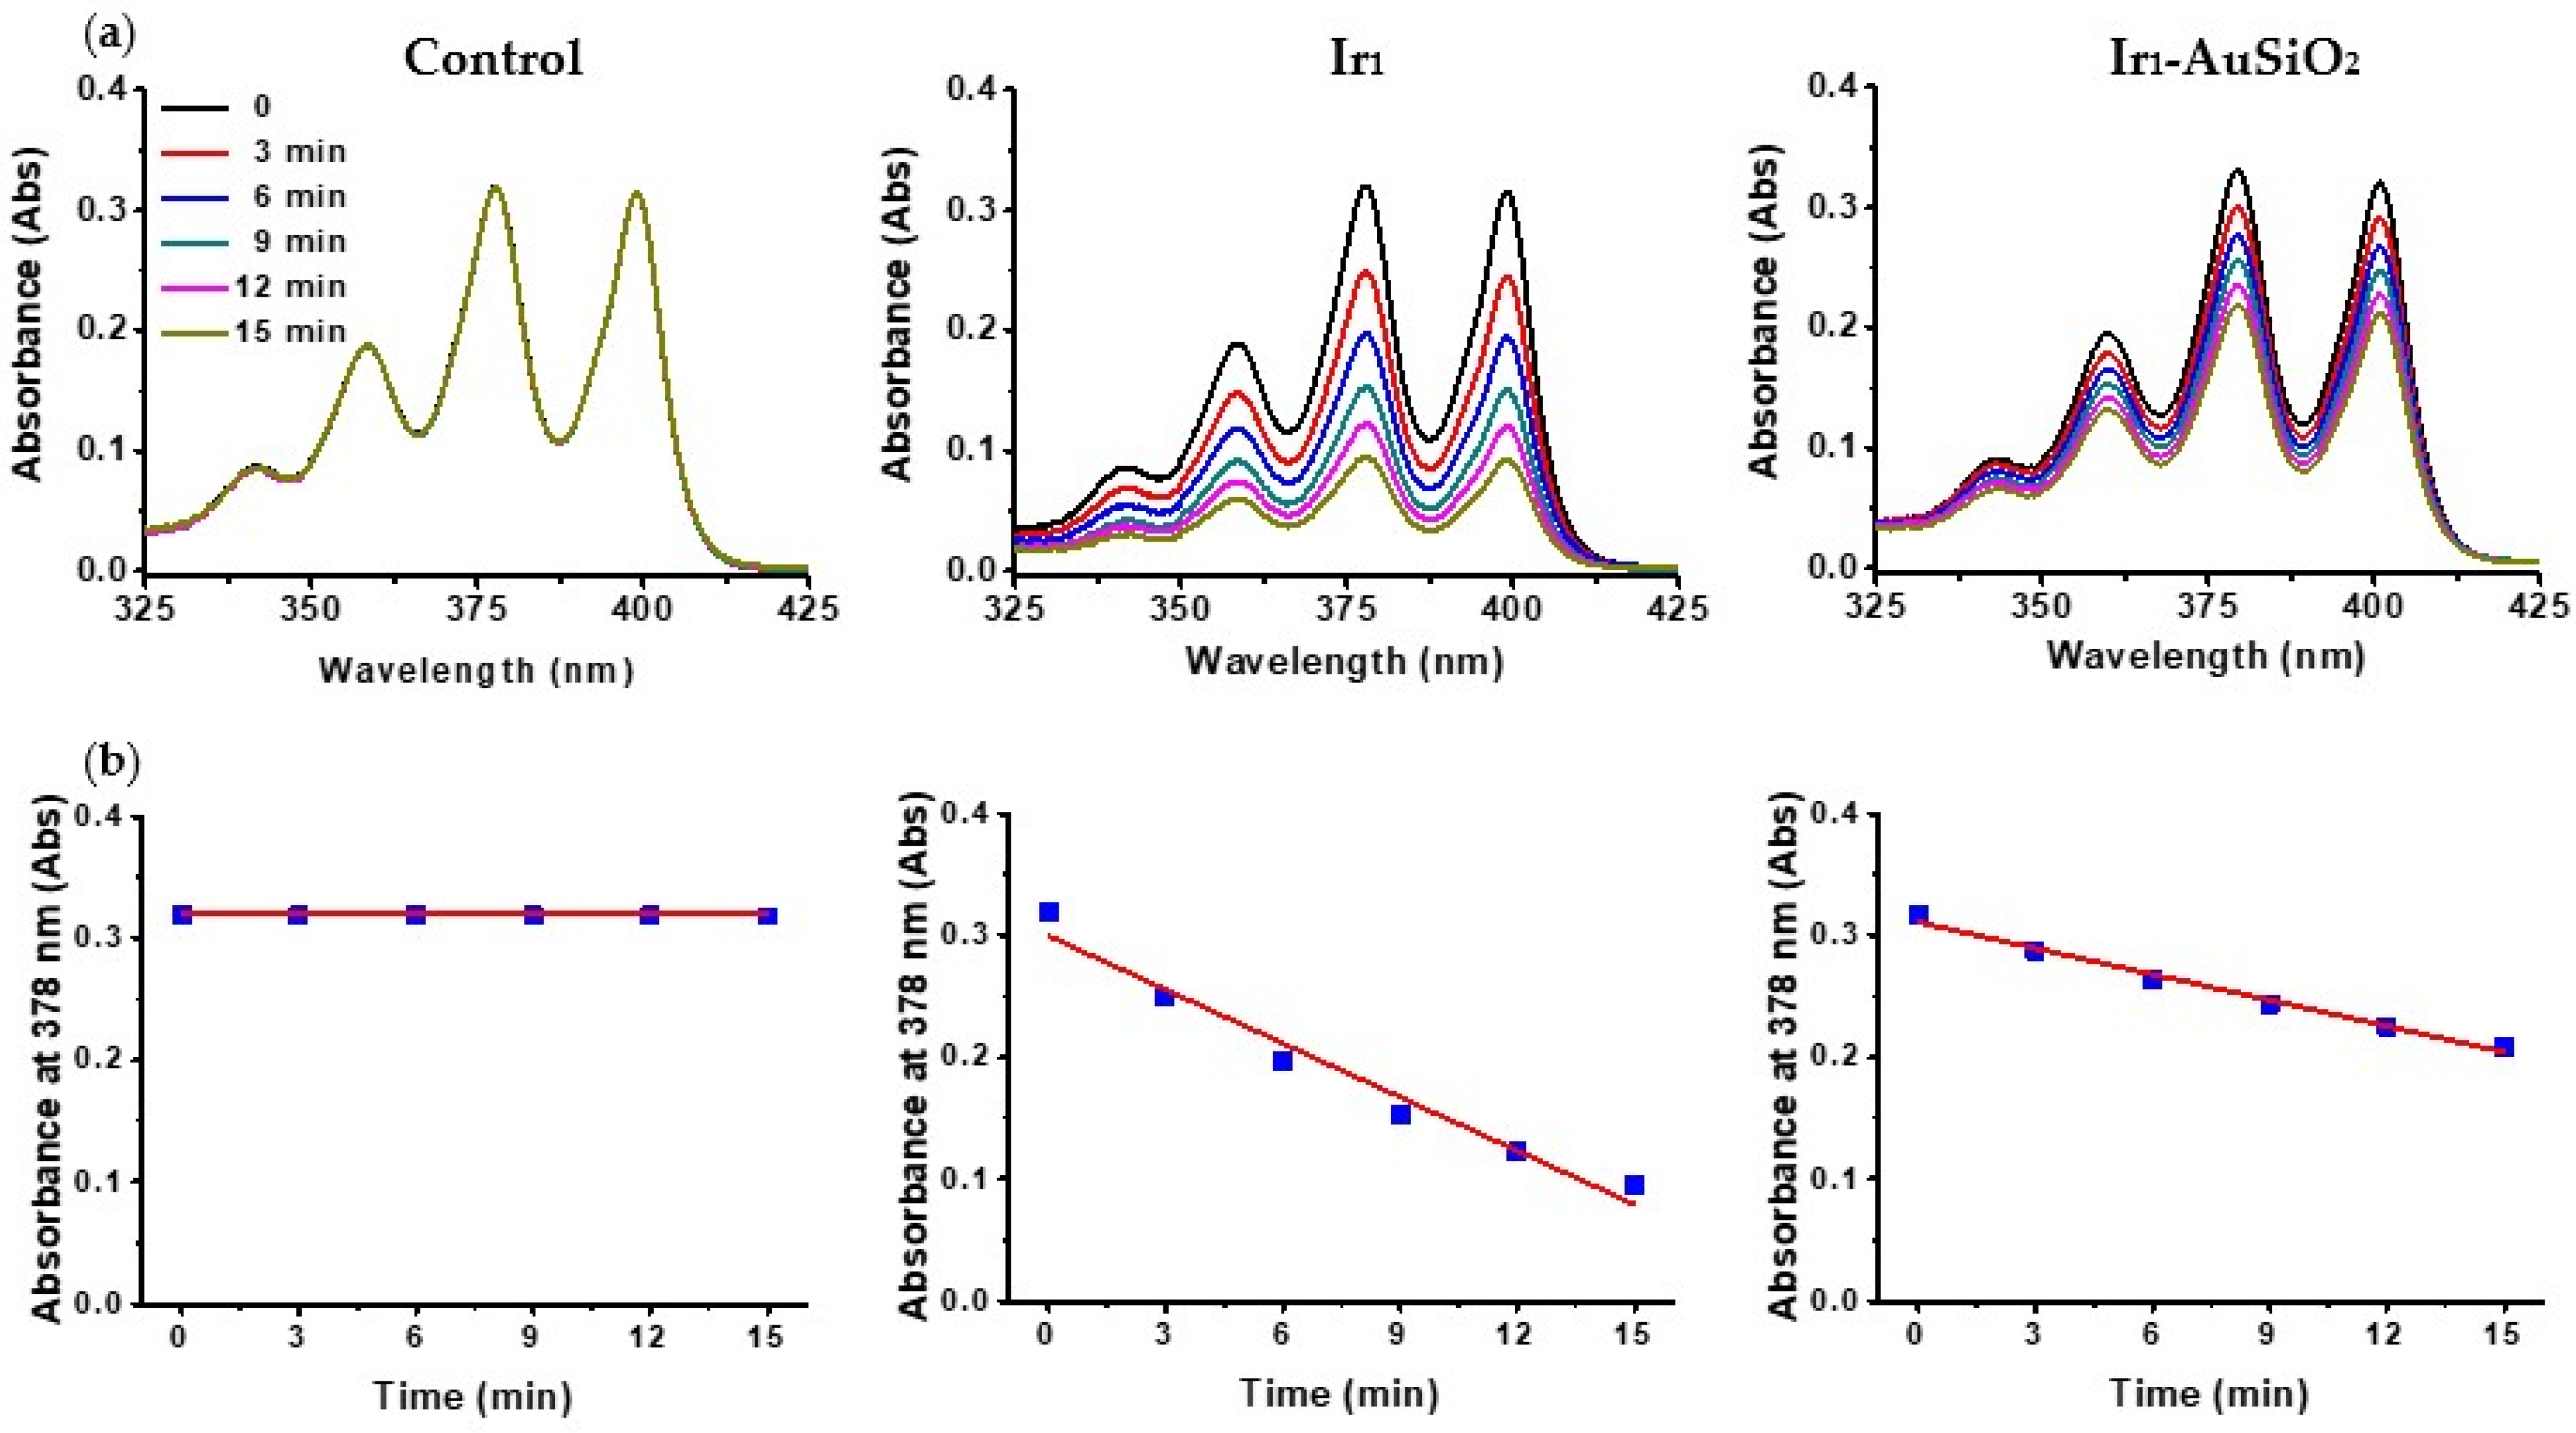
3.2. Singlet Oxygen Studies

Since PDT efficacy mostly depends on the PS ability to produce 1O2, the amount generated by Ir1 and Ir1-AuSiO2 was evaluated using ABDA as a detection probe. The selected experimental conditions (PS concentration, fluence rate and distance between the excitation source and the sample solution) were the same used to carry out in vivo studies so as to mimic the 1O2 generation occurring in the treated tumor tissue. Figure 2a shows the absorption spectra of ABDA in an aqueous solution (control) in the presence of Ir1 and Ir1-AuSiO2 at different irradiation times. Although for the control sample, no change in the ABDA optical density was observed, in the presence of Ir1 or Ir1-AuSiO2, the ABDA absorption peaks decrease in intensity as the exposure time increases, highlighting a generation of 1O2 in both cases but with different efficiencies. In fact, as clearly shown in Figure 2b, the plots of ABDA absorption at 378 nm as a function of exposure time exhibit a linear trend with a slope for Ir1 sharper than that obtained for Ir1-AuSiO2. The 1O2 generation was quantitatively estimated by calculating the total number of moles produced upon photoirradiation, obtaining values of 5.4 × 10⁻⁸ for Ir1 and 2.6 × 10⁻⁸ mol for Ir1-AuSiO2 (Table 1).
For comparison, the 1O2 generation was measured in the same experimental conditions (PS concentration and radiation dose) for one of the most efficient phthalocyanine-based photosensitizers, the silicon phthalocyanine 4 (Pc4) [39] (Figure S5). Since Pc4 is insoluble in water, the sample was prepared by dissolving the compound in a small amount of ethanol (25 µL) and then dispersed in water (275 µL), reaching a final concentration of 2 × 10⁻⁵ M. As reported in Table 1, the Pc4 exhibits a molar amount of 1O2 generated of 4.3 × 10⁻⁸ moles, a value lower than that obtained for Ir1.

3.3. In Vivo Imaging

To demonstrate the efficiency of Ir1 as a luminescent probe for in vivo imaging, we first tested the emission intensity, under 430 nm irradiation, immediately after subcutaneous injection. As shown in Figure 3a, the acquired fluorescence image exhibits a huge emission in the region of interest. Then, we injected Ir1 or Ir1-AuSiO2 into the tumor of the human GBM xenograft mouse model for real-time imaging at different time points post-injection in order to follow their fate in terms of biodistribution, accumulation and permanence in the diseased region. Representative images pre- and post-injection of Ir1 are displayed in Figure 3b; in particular, 30 min after the injection of Ir1, a bright fluorescence was highlighted in the whole body of the animal, widely spread, with a considerable intensity detected in the tumor region (ROI Figure 3b). The fluorescence images acquired before the time course and after injection of both samples, Ir1 and Ir1-AuSiO2, are reported in Figures S6 and S7, whereas the light signal intensity within the ROI as a function of time (0–24 h) is shown in Figure 3c. Here, two distinct trends were observed. After injection of Ir1, the fluorescence intensity in the tumor region sharply increases, reaching a maximum after 30 min and then rapidly decreasing within a few hours (Figure 3c and Figure S6). Conversely, the luminescent signal of Ir1-AuSiO2 increases gradually up to 90 min, then remaining mostly constant even at 24 h post-injection (Figure 3c and Figure S7), suggesting a higher permanence of the luminescent nanostructures in the tumor tissue compared to the free PS.

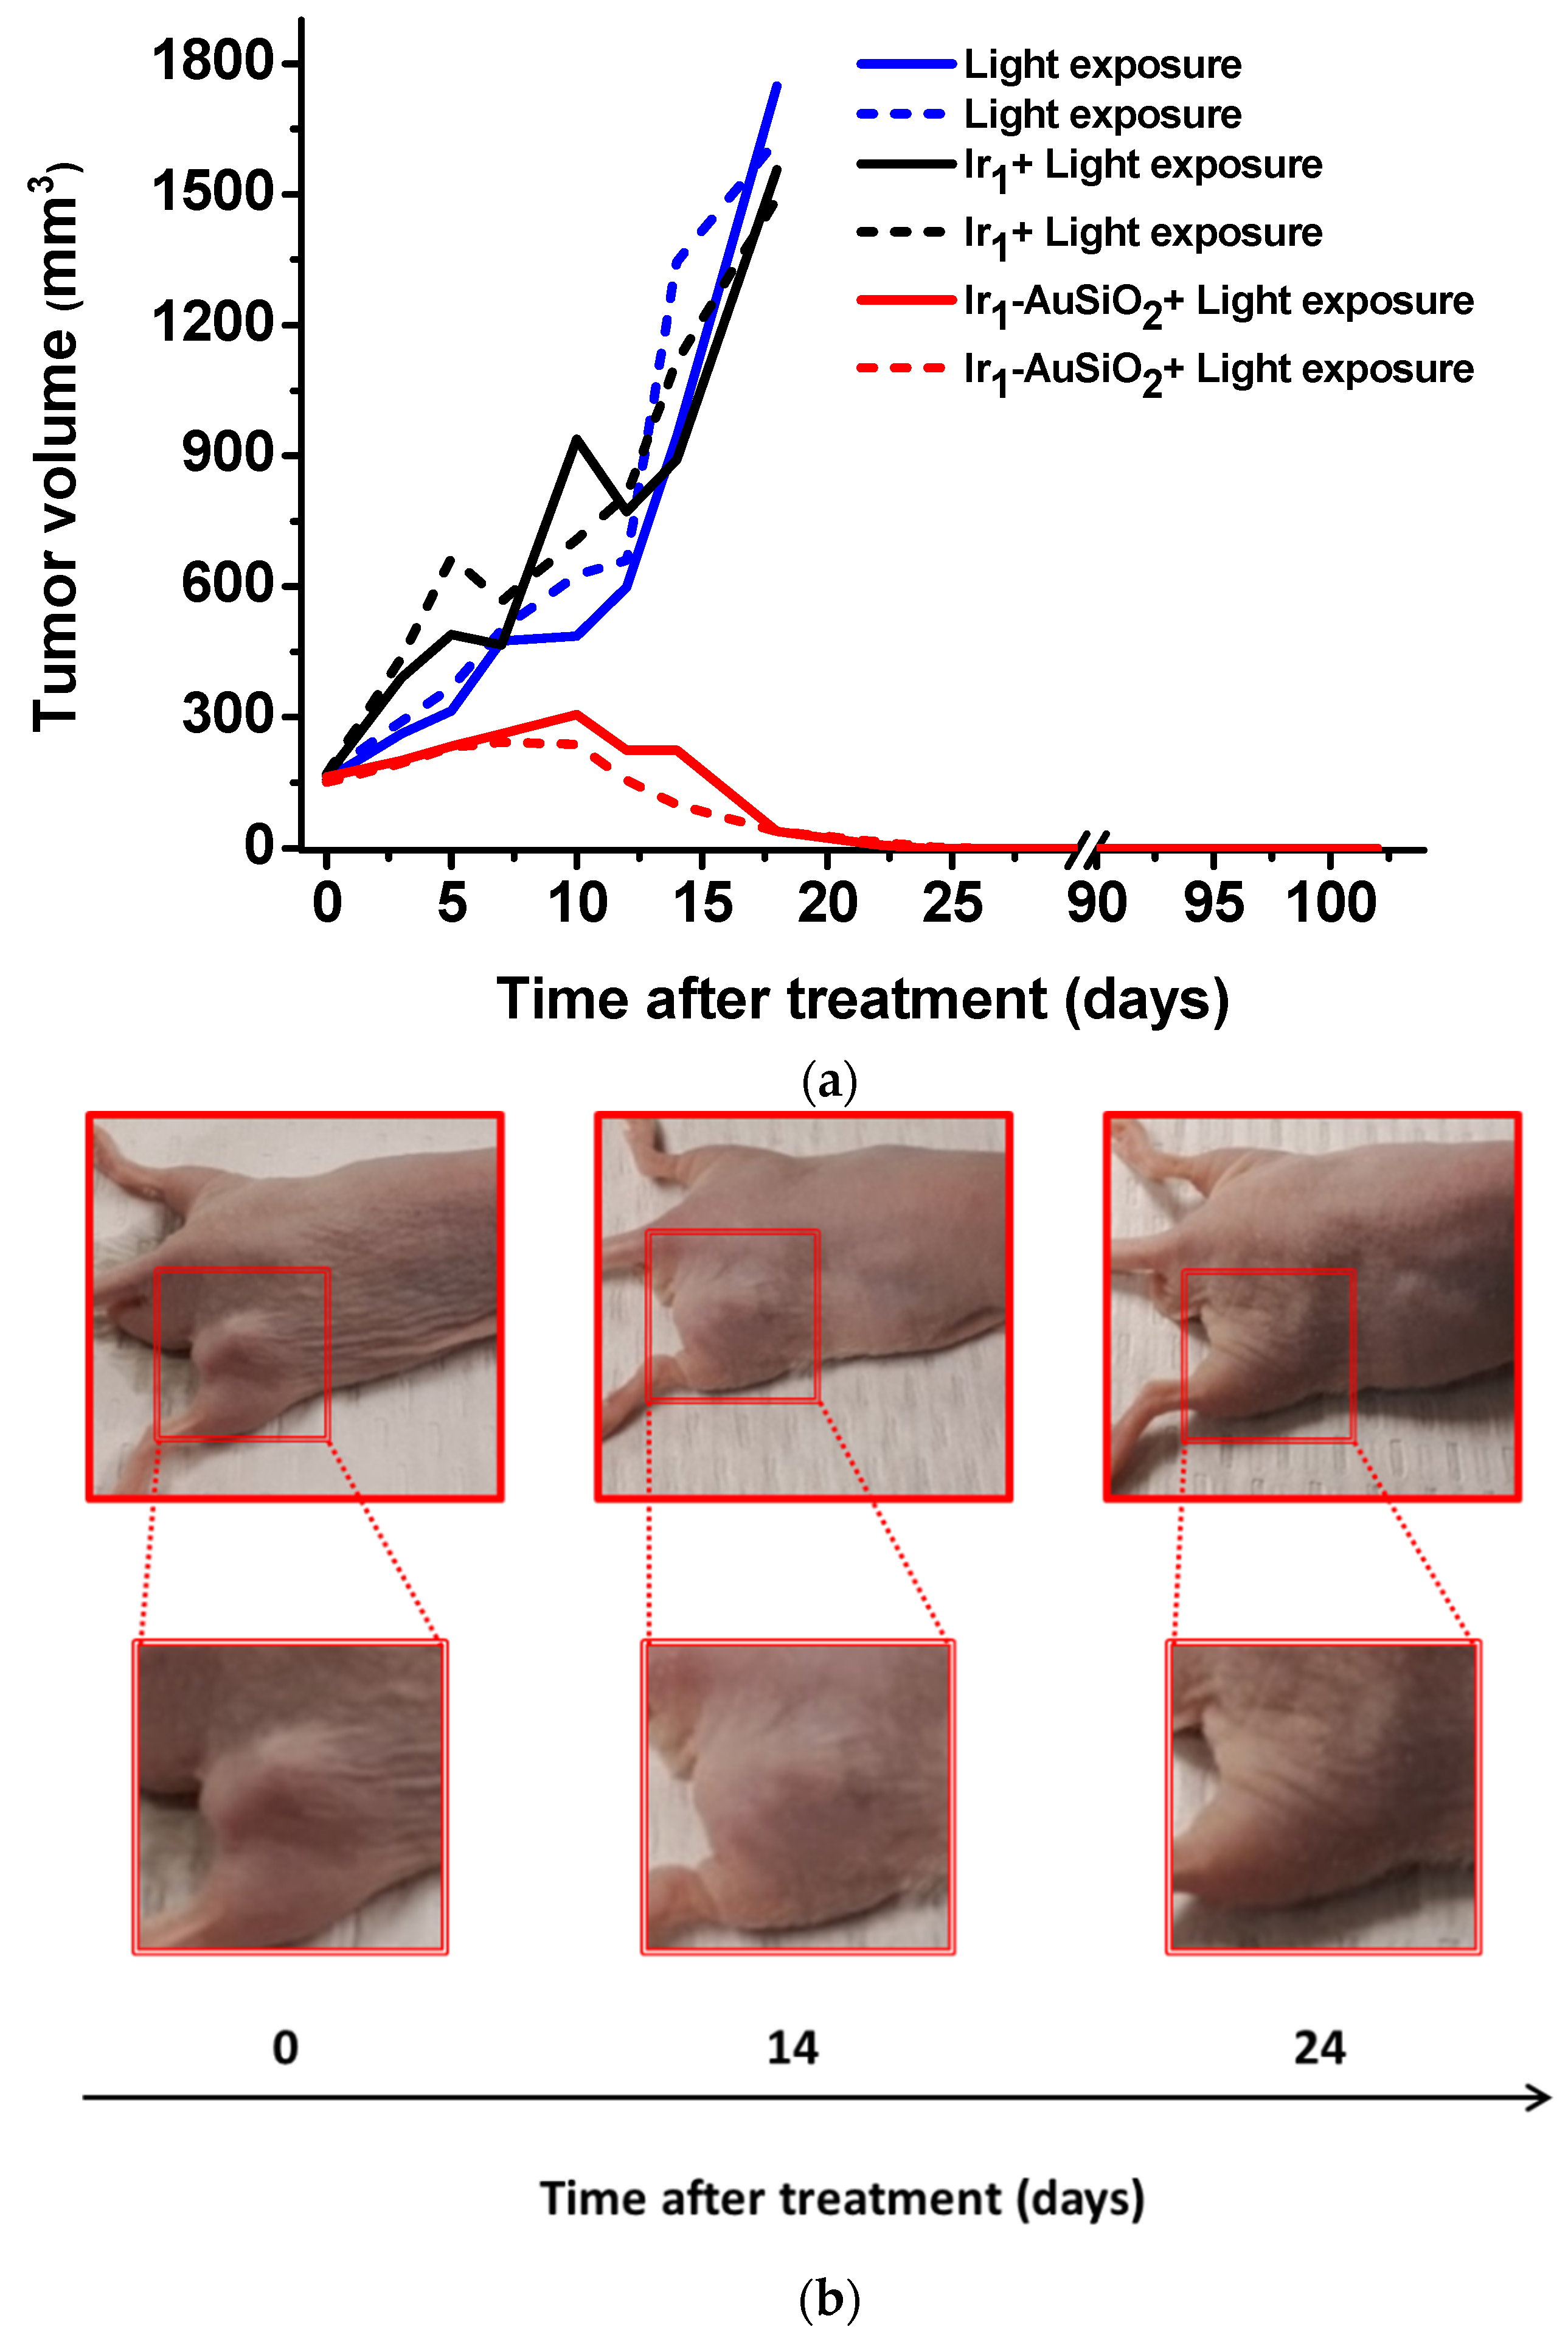
3.4. In Vivo Phototherapeutic Treatment

In order to evaluate the efficacy of Ir1 and Ir1-AuSiO2 as phototherapeutic agents in vivo, Gli36∆5 tumors were established into the right flank of nude mice. Ir1 or Ir1-AuSiO2 were injected into the tumor site, then irradiated at 365 nm for 15 min (20 mW/cm2), delivering radiant exposure of 18 J/cm2. As controls, one group received only the radiation dose and one group the intratumoral injection of Ir1 or Ir1-AuSiO2 without light exposure. Then, the phototherapeutic effect was assessed by monitoring the tumor volumes of the different groups over a period of 14 weeks. As clearly shown in Figure 4a and Figure S8, the control groups’ tumor sizes increased dramatically up to 1500 mm3 in less than 18 days. For the group treated with Ir1 + light exposure, the tumor growth showed some fluctuations with spikes and slight inflections in the early days post-treatment, and then a rapid increase, reaching the ethical limit (1500 mm3) in 18 days (Figure 4a). Of note, for this treatment group, in the initial stage, the growth of the tumor size is more significant than that observed for the control groups (Figure 4a and Figure S8). Regarding the Ir1-AuSiO2 treatment group, Figure 4a,b clearly shows a volume increase in the tumor region in the phase immediately following the treatment, properly attributable to a swelling process, with a maximum value reached in 10 days. Beyond this stage, a gradual reduction in the tumor size was observed, leading to surprisingly complete tumor regression in 24–26 days post-treatment without highlighting relapses for over 100 days (Figure 4a).

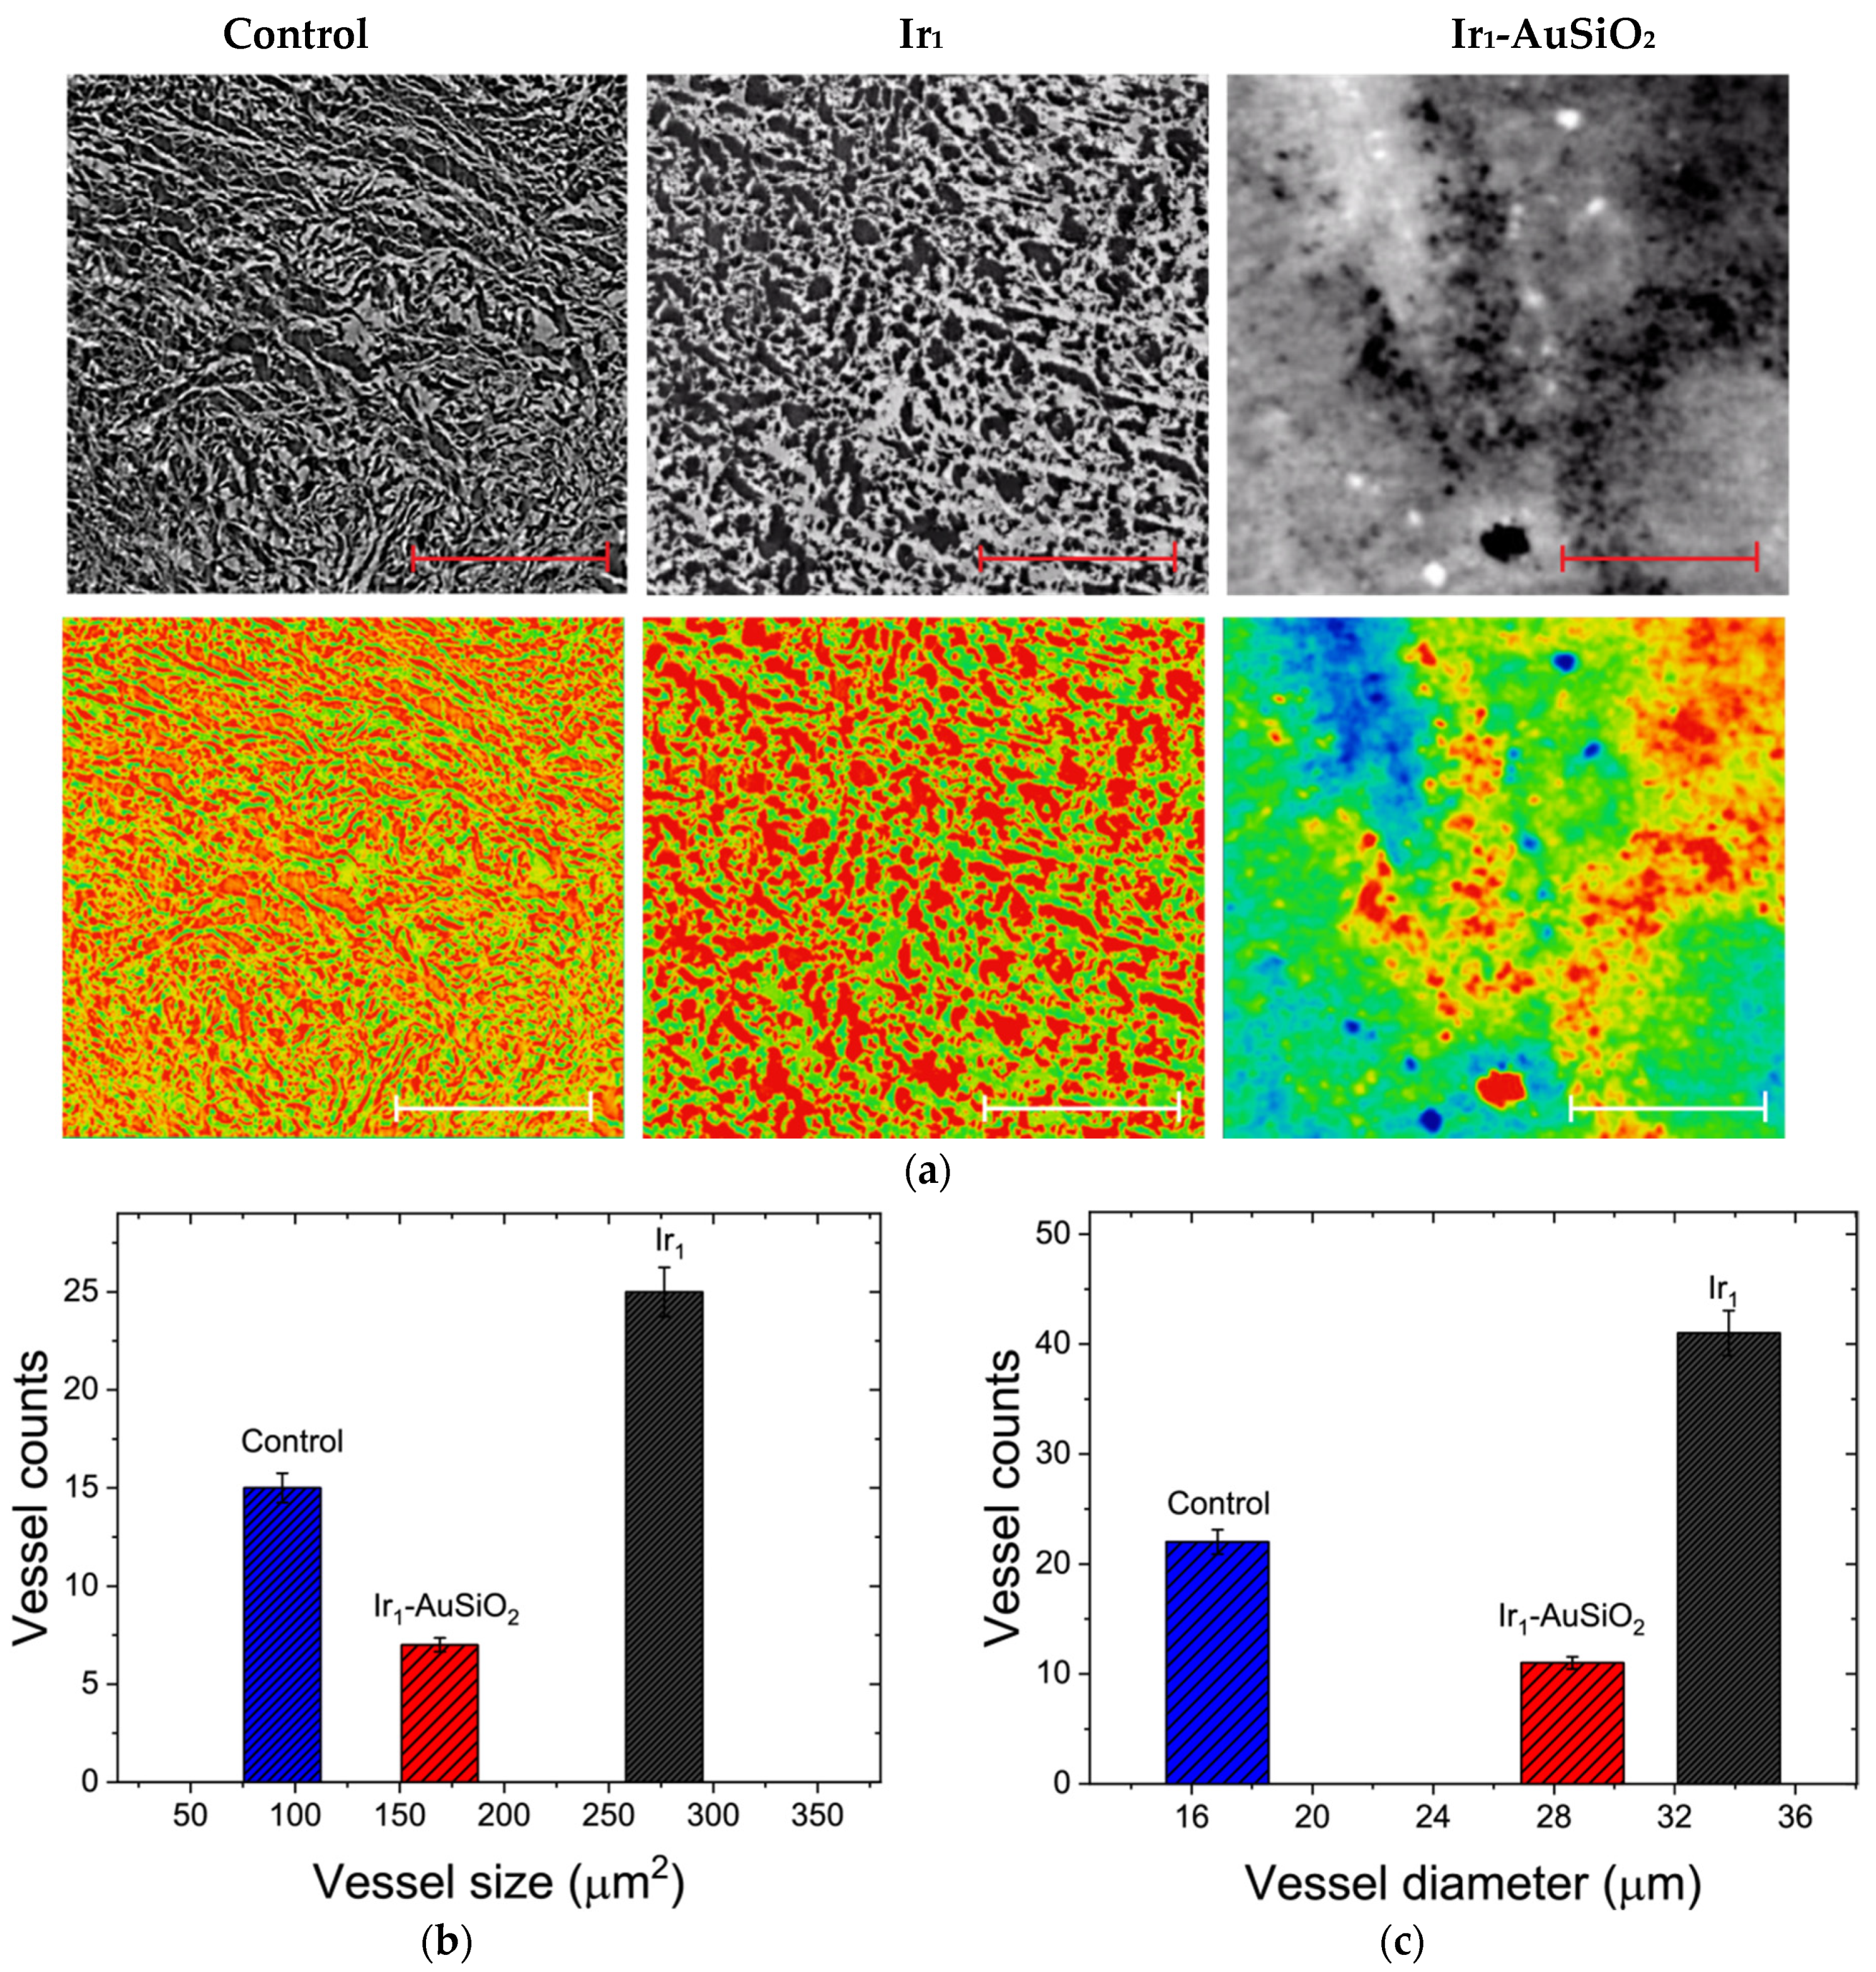
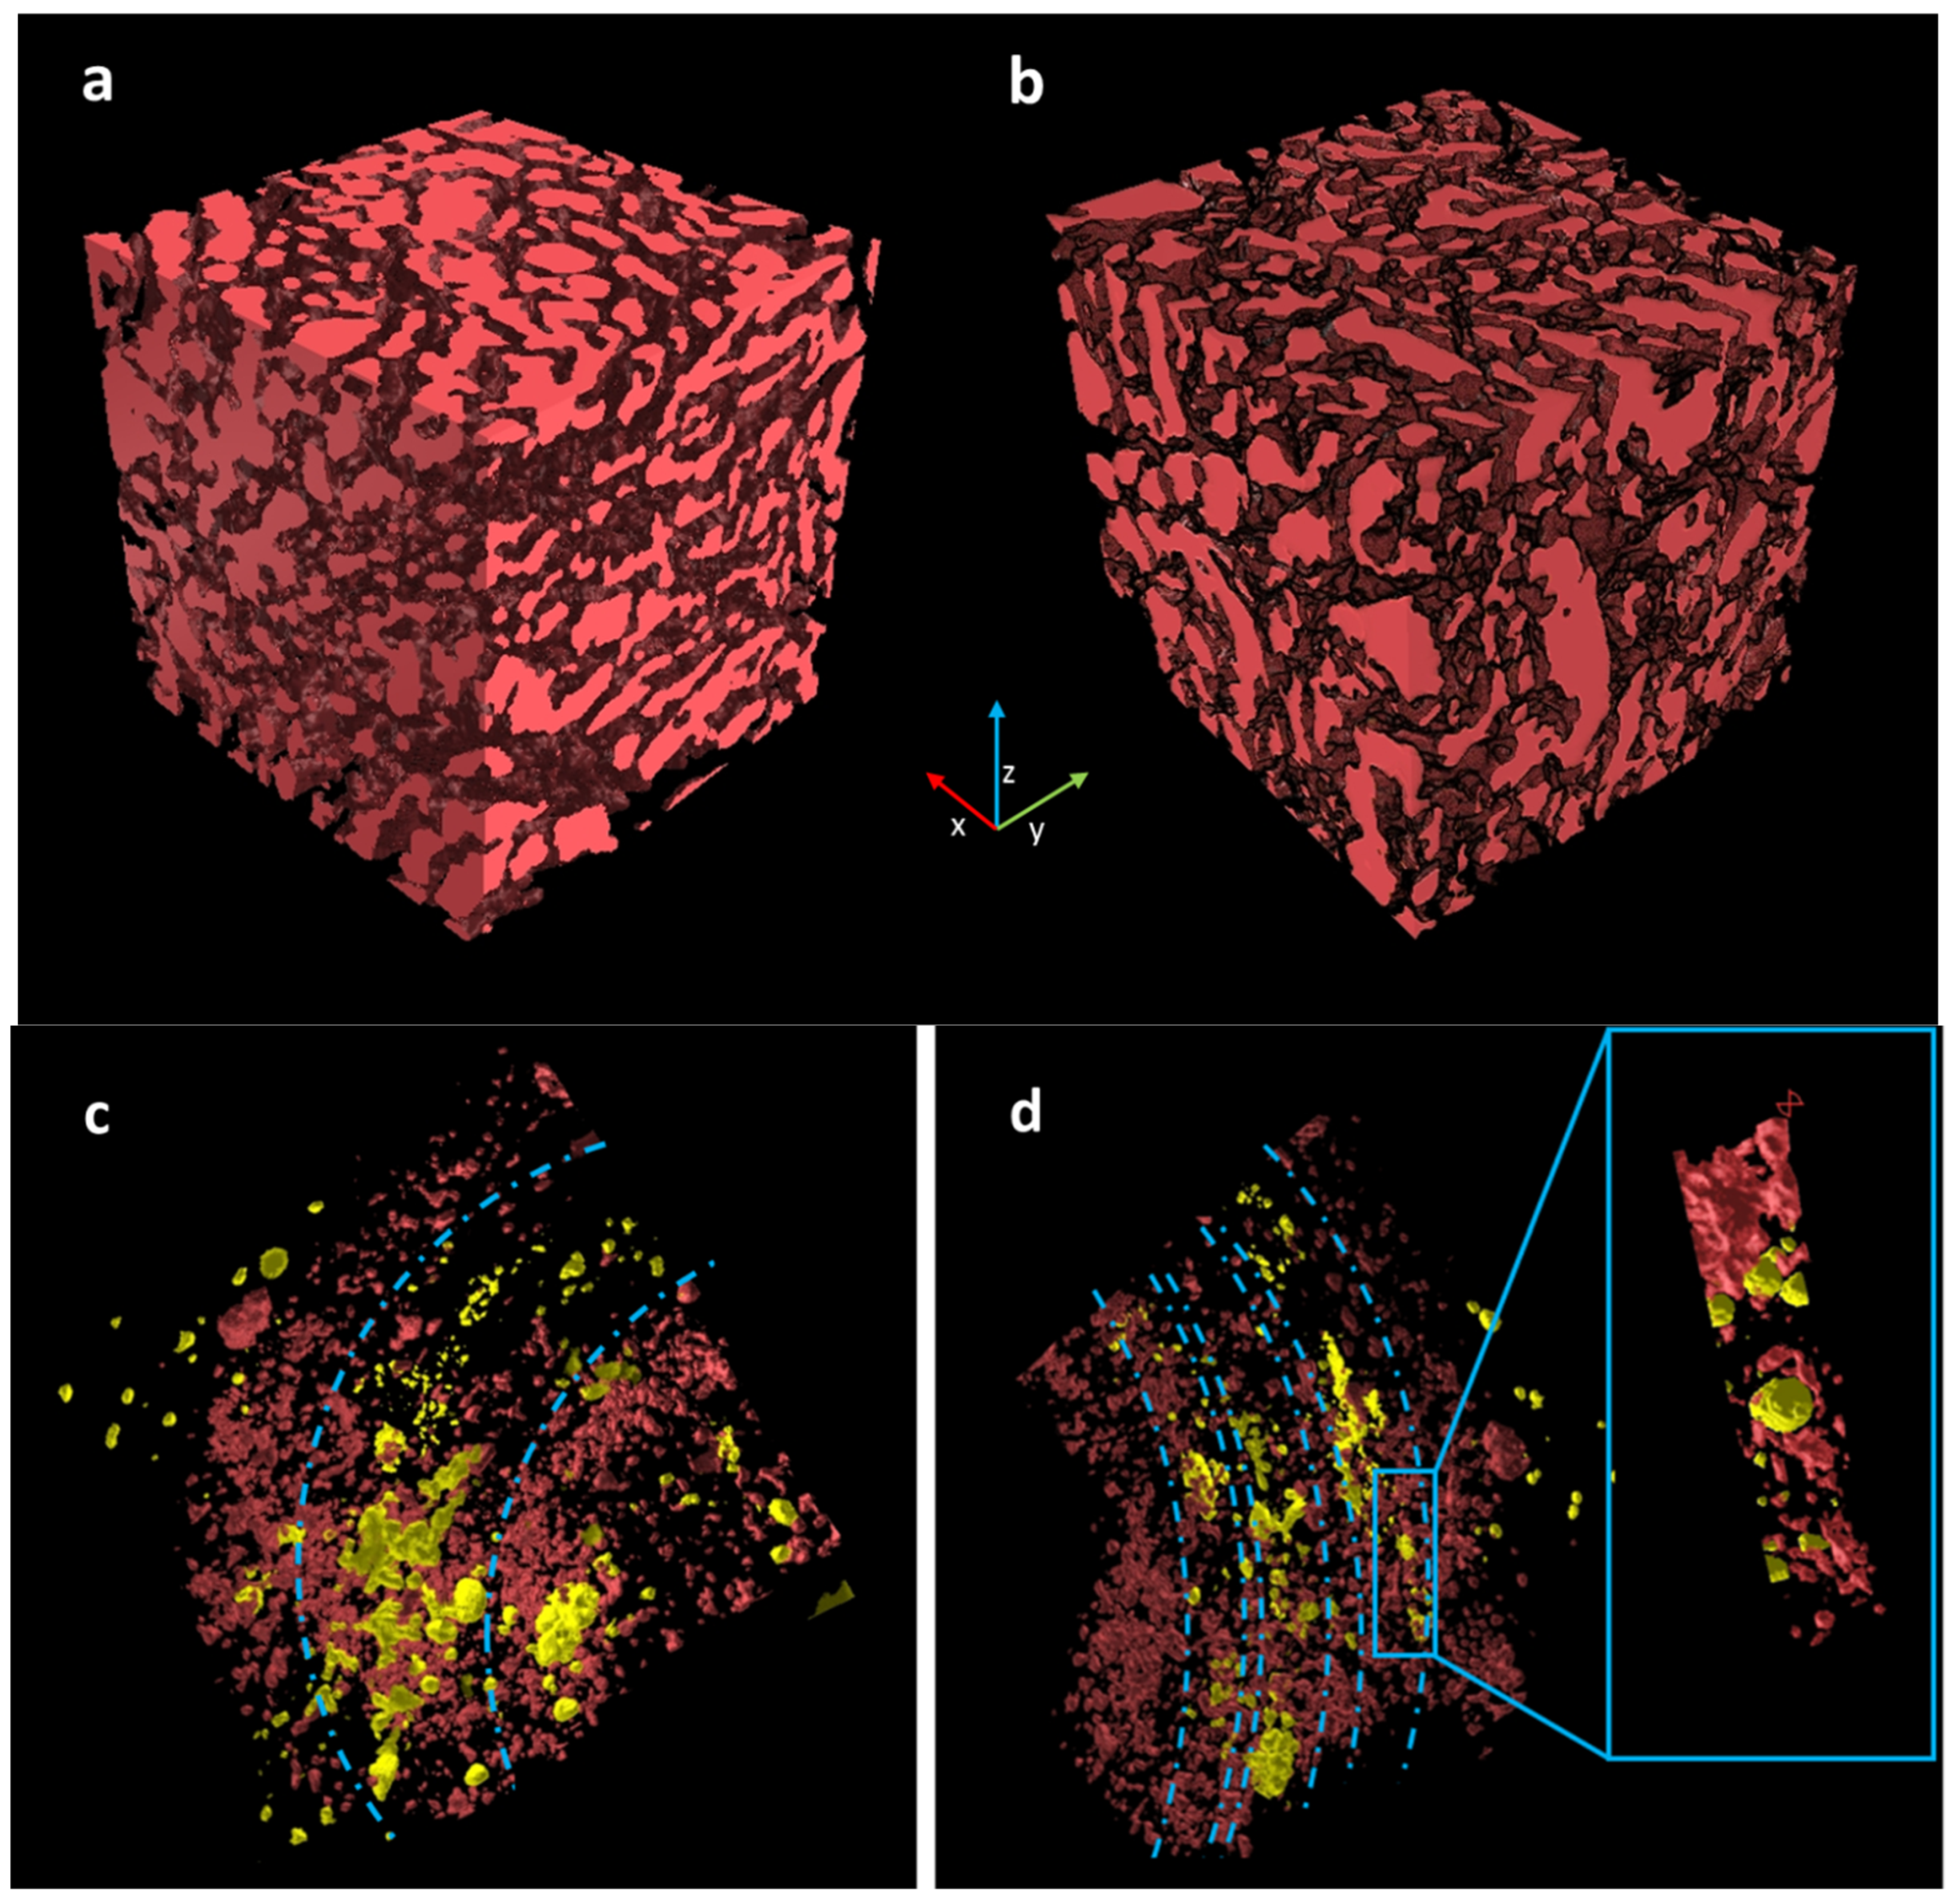
3.5. X-ray Phase-Contrast Tomography Investigations
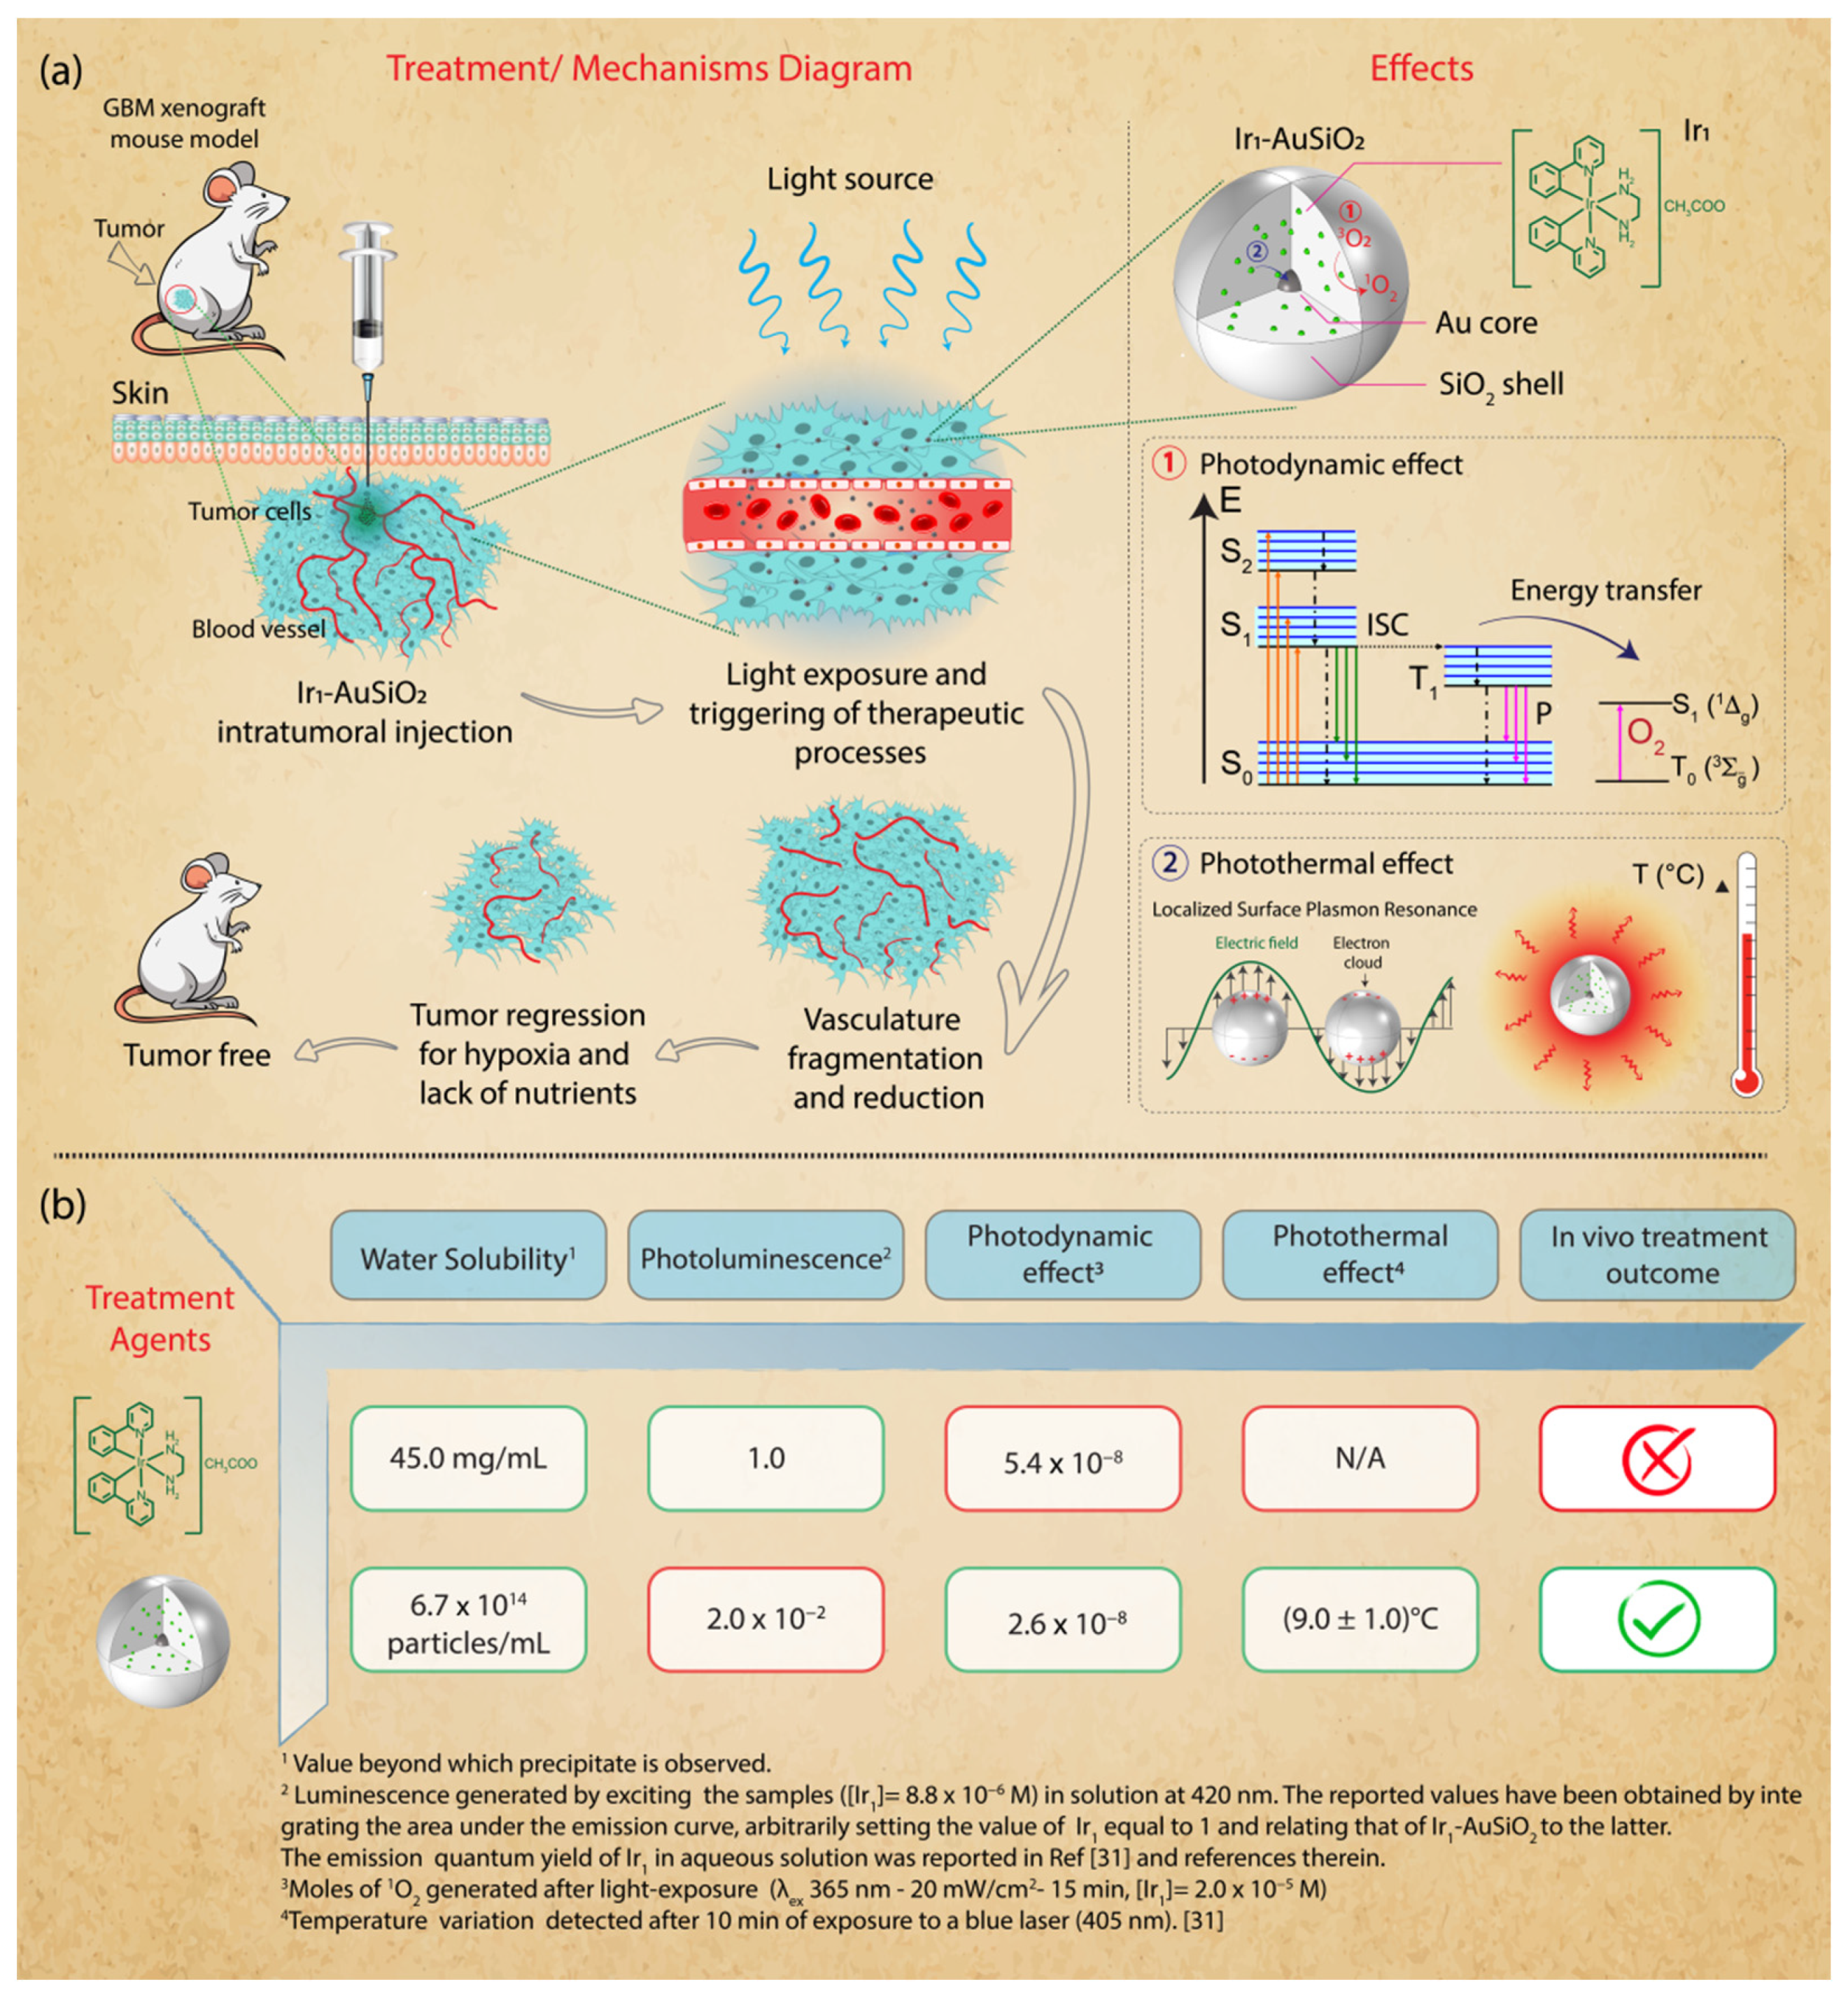
Figure 5a shows tomographic images of ex vivo GBM samples, both control and treated, which were illuminated with the same light dose (365 nm for 15 min—20 mW/cm2) delivered during the in vivo studies. The XPCT image of the control sample is reported as the top left panel of Figure 5a, whereas the treated sample after intratumoral injection of Ir1 or Ir1-AuSiO2 is shown in the top-mid panel and top-right panel, respectively. Anatomical structures of GBM, such as blood vessels (black areas) and cancer cells (gray areas), are clearly recognized at micrometer-scale resolution in all the samples, whereas the sample treated with Ir1-AuSiO2 shows clusters of nanoparticles (white areas) easily identified mostly in the proximity of the microvessels. For better visualization, the same images are shown by using bright colors. The color gradient reflects the tissue density ranging from high (blue) to low (red) (Figure 5a, bottom). A quantitative analysis of vessel cross-section (µm2) and diameter (µm) was performed, and the average distribution is reported in Figure 5b,c, respectively. Both histograms are obtained by calculating a weighted average of the datasets displayed in Figures S9–S11. Regarding the control sample, an average lumen area and diameter of 94 µm2 and 17 µm were, respectively, measured, in agreement with the values reported for GBM vessels [5]. By comparing the control sample with the tumor sample treated with Ir1, a massive increase in the vascular network is clearly present, with a significantly larger vessel lumen area (276 µm2) and diameter (34 µm) compared with the control. On the contrary, the tumor treated with Ir1-AuSiO2 shows a remarkable devascularization in terms of reduction in the number of microvessels. However, in this tumor sample, we only observed a moderate increase in both the average vessel diameter (29 µm) and the average lumen area (169 µm2).
Three-dimensional renderings of the segmented vascular network are reported in Figure 6. In particular, the control sample (Figure 6a) shows an enormous hypervascularization of the tumor, where the microvascular structure appears as a glomeruloid tuft [40] with a high degree of branching. A similar network with dense and proliferative vessels is observed in the case of the GBM treated with Ir1 and exposed to light waves (Figure 6b). On the contrary, as clearly shown in Figure 6c,d and Supplementary Video S1, after Ir1-AuSiO2/light treatment, the tumor tissue appears vastly devascularized, and the residual vascular structure seems to be collapsed, discontinuous and highly fragmented.

4. Discussion

The in vitro cytotoxic activity of Ir1 and Ir1-AuSiO2 on GBM cells was previously reported [31]. In particular, the incubation of GBM cells with Ir1-AuSiO2 was followed by a radiant exposure of 1.44 J/cm2. It revealed a 50% of the cell viability at the photosensitizer concentration of 0.3 μg/mL, reaching a value of 5% at 3 μg/mL [31]. As reported by Chakrabarti et al. [41], the light treatment of GBM cells by using the same fluence (1.44 J/cm2), after incubation with Photofrin, one of the most used PDT agent, reduces the cell viability to 50% by using a photosensitizer concentration of 1 μg/mL. In vitro results, where remarkable light-induced cytotoxicity of the nanosystem Ir1-AuSiO2 was observed, led to performing further in vivo studies.
It is broadly reported that ROS plays an important role in cancer treatments [42,43]. Elevated oxidative signaling, contributing to mutation and growth, can be implicated in the promotion and progression of malignant diseases, including GBM [44], whereas a huge increase in ROS up to toxic intracellular levels may provide a unique opportunity to destroy cancer cells activating various ROS-induced cell death pathways [43].
The ROS generation, particularly 1O2, is the key event underlying the tumor destruction process promoted by the PDT agent and three distinct and interrelated mechanisms are responsible for the in vivo anti-tumor effects of the phototherapeutic treatment [45,46]. In particular, the generated 1O2 can (I) directly kill the tumor cells by apoptosis and/or necrosis, (II) damage the tumor-associated vasculature, resulting in tumor death via deprivation of oxygen and nutrients, (III) induces an acute inflammation with consequent activation of the immune response to recognize, track down and destroy tumor cells [47].
In our study, we performed a comparative analysis of the Ir1 and Ir1-AuSiO2 1O2 generation efficiency for the experimental conditions chosen to carry out preliminary in vivo studies. The high photosensitizing ability of the organometallic complex is observed by measuring the molar amount of 1O2 generated after irradiation. Considering the solubility of molecular oxygen in water at room temperature (0.27 mmol/L) [48], we observed that after 15 min of light exposure in the presence of Ir1, most of the molecular oxygen present in the solution was converted into 1O2 (5.4 × 10⁻⁸ moles of 8.1 × 10⁻⁸, Table 1). By comparing Ir1 with the well-known photosensitizer Pc4, Ir1 displays a higher 1O2 generation efficiency, as well as a better solubility in an aqueous solution.
The Ir1-AuSiO2 1O2 generation ability turns out to be lower than that of Ir1 at the same TMC concentration. The spectral overlap between the emission band of the cyclometalated complex and the gold nanostructure plasmon resonance leads to a competitive energy transfer process from the molecule to the metal core [31]. Then, in the implemented nanosystem Ir1-AuSiO2, the radiant energy absorbed by Ir1 is partly transferred to molecular oxygen-generating 1O2 and partly to the metal core, with consequent conversion into heat. The energy transfer towards the gold sphere is also highlighted by the quenching of the nanoplatform luminescence intensity compared with that of the bare compound [31].
In vivo fluorescence imaging of the GBM xenograft mouse model after intratumoral injection of Ir1 or Ir1-AuSiO2 allowed for tracking and localizing the distribution of the PDT agent over time, both as single molecules and those embedded in the nanostructure. After intratumoral injection of Ir1 or Ir1-AuSiO2, the fluorescence emission intensity in the tumor region reaches the maximum level after 30 min for Ir1 and after 90 min for Ir1-AuSiO2. This delay relative to the time of the injection could be attributed to phenomena that occur at high concentrations of an organometallic compound or plasmonic nanostructures. In particular, high concentrations of Ir1 could lead to luminescence quenching processes due to intermolecular interactions, thus favoring non-radiative deactivation paths of the single-molecule excited state. In the case of Ir1-AuSiO2, the presence of high concentrations of plasmonic gold nanoparticles, with absorbing and scattering properties, could give rise to “Inner Filter Effect” phenomena, preventing the excitation light penetration and photo-activation of the Ir1-AuSiO2 nanoplatforms located into depth regions of the tumor. In order to confirm the above, the emission spectra of Ir1 and Ir1-AuSiO2 water solution at different concentrations were acquired and reported in Figure S12. As clearly shown, the luminescence intensity of both Ir1 and Ir1-AuSiO2 in the investigated concentration range increases as the sample concentration decreases.
After a time lapse which allows the distribution and dilution of the administered aliquot in the tumor tissue, the luminescence of Ir1 or Ir1-AuSiO2 reach its highest level.
While the decrease in luminescence of Ir1 within the tumor site proves to be rapid, the luminescence intensity of Ir1-AuSiO2 reveals the nanostructure permanence in the ROI even 24 h post-injection.
Since both Ir1 and Ir1-AuSiO2 are water-soluble, their size could be the key parameter dominating the different kinetics, thereby accumulating nanoparticles in the tumor region via Enhanced Permeability and Retention (EPR) effect [49,50,51]. Strikingly, the in vivo treatment after Ir1 and Ir1-AuSiO2 intratumoral injection followed by a radiant exposure of 18 J/cm2 (365 nm for 15 min-20 mW/cm2) revealed opposite clinical outcomes: Ir1 treated tumors have shown a tumor growth similar to the control, whereas the cases treated with Ir1-AuSiO2 have shown a slow regression, which leads to tumor elimination without recurrence. It is important to remark that in the latter cases, the tumor regression was achieved by administering a single intratumoral injection of Ir1-AuSiO2 (Ir1 = 24 μg Kg−1 body weight) followed by a single optical radiation dose (18 J/cm2). Chakrabarti et al. reported in vivo studies on GBM xenograft murine models using Photofrin (10 mg Kg−1 body weight, intravenous injection; radiant exposure 100 J/cm2; fluence rate 50 mW/cm2). The phototherapeutic treatment based on the porphyrin-based compound led to a limited regression of the tumor, and no elimination was observed [41]. A recent review by Alphandéry et al. focused on nanosystems with different compositions and mechanisms of action for GBM treatment. Concerning the in vivo efficacy, a decrease in the tumor growth and increased survival of mice were observed in several cases, but no tumor eradication without relapse was observed [52]. In particular, Seo et al. used gold nanostructures as efficient photothermal agents for GBM treatment, developing small gold nanorods, loaded hybrid albumin nanoparticles that, after irradiation, caused a decrease in tumor growth in the xenograft mouse model [53]. Likewise, Lee et al. observed a tumor growth delay in GBM tumor-bearing mice after treatment with virus-mimetic silica-coated gold nanorods able to induce a hyperthermal effect in response to NIR irradiation [54].
Three-dimensional XPCT investigations of ex vivo GBM tissues after Ir1 or Ir1-AuSiO2 treatment provided considerable insights regarding the tumor vascular network, highlighting large morphological and structural differences between the two samples with respect to the control sample.
Upon analyzing the XPCT images after treatment with Ir1, neovascularization accompanied by a marked vessel dilation is observed, whereas, after Ir1-AuSiO2 treatment, we observed a significant microvascular collapse with only a slight increase in the average diameter of the vessels.
In order to elucidate the different effects caused by the bare Ir1 photosensitizer and by the Ir1-AuSiO2 nanosystem, in terms of mechanism of action and treatment outcome, it was important to focus on the peculiar features of the two samples. In both cases, the same light dose (365 nm for 15 min-20 mW/cm2) was applied a few minutes after intratumoral injection. The short time frame between the administration and light-mediated activation excludes an efficient cell internalization of both phototherapeutic agents, Ir1 and even more Ir1-AuSiO2. This suggests that the localization may predominantly be in the interstitial space and/or close to the blood vessels, limiting a possible anti-tumor effect through the direct cellular damage of bulk tumor cells.
Regarding the process of generation of 1O2, Ir1 gives rise to an enormous amount of reactive oxygen species in a relatively short time (Figure 2 and Table 1). The rates of 1O2 generation, and therefore the oxygen depletion within the tumor, are key factors in the efficacy of PDT treatment [46]. Paradoxically, a high 1O2 generation rate achieved, for instance, with high photosensitizer concentrations and/or high light fluence rate, causes faster oxygen consumption than that replaced by the bloodstream leading to severe levels of tumor hypoxia. The latter is known as the main stimulator of tumor angiogenesis [55], especially in GBM [5,56,57], by promoting the secretion of growth factors.
In our case, although Ir1 concentration and fluence rate are significantly low, the amount of 1O2 generated in 15 min is high considering the total amount of molecular oxygen dissolved in the solution. Conversely, the treatment carried out with Ir1-AuSiO2 exhibits a lower 1O2 generation rate, avoiding plausibly oxygen-depleted conditions. Moreover, the sample treated with Ir1 highlights an average vessel dilation where approximately 60% of vessels double the lumen area. The PDT-induced oxidative stress is known to activate an acute inflammatory response with consequent vessel dilation, which promotes the infiltration of the treated tissue by cells of the immune system with the presentation of tumor-derived antigens [47].
As mentioned above, the anti-tumor immune development process is a potential tumor destruction mechanism mediated by PDT. However, unless to innate immune cell-related effects, we exclude an immune system response activated by these treatments since the in vivo studies were carried out on immunodeficient nude mice.
On the contrary, the higher blood supply, following the vessel dilation, could provide more nutrients and oxygen to the tumor, thus promoting its proliferation. These observations shed some light on our hypothesis regarding the failure of the in vivo treatment with Ir1, as opposed to the results achieved with Ir1-AuSiO2. In the latter case, in fact, a lower generation of ROS determines a lower inflammatory response, as confirmed by the less pronounced vessel dilation. In this regard, it is broadly reported in the literature that the optimal curative treatment with PDT should produce minimal inflammation [47,58].

5. Conclusions

To summarize, we reported a comparative in vivo study of GBM treatments by using two phototherapeutic agents: an Ir(III) complex (Ir1) and the same compound embedded in core-shell plasmonic nanoparticles (Ir1-AuSiO2), spectrally resonant with the luminescent TMC. GBM xenograft mice were exposed to a single light dose after treatment with the two therapeutics, inducing the generation of ROS (Ir1) or transducing the radiant energy into ROS and heat (Ir1-AuSiO2). The regression and elimination of the tumor in mice treated with Ir1-AuSiO2 and exposed to VIS light required a more detailed analysis of the damages to understand the mechanism underlying the tumor elimination. Three-dimensional high-resolution XPCT reveals a massive devascularization of the region where clusters of particles were concentrated, first inducing a vascular shut down followed by a significant tumor mass regression. On the other hand, an XPCT study on mice treated with Ir1 shows that the vasculature remains structurally unmodified, but a significant vessel dilation occurs as a consequence of local inflammatory processes. However, these results provide evidence that nanotherapeutics based on plasmonic nanoparticles and weaponized with PDT agents have the potential to operate an effective killing physical mechanism in solid tumors by harnessing synergistic effects.
The reported studies are preliminary investigations deserving—for the great value of the obtained results—further insights. In particular, accurate research involving a higher number of animals per group is currently underway. Moreover, in order to improve the tissue penetration of the excitation wavelength, the two-photon absorption abilities of the Ir(III) compound will be exploited to trigger the multifunctional nanosystem.

Supplementary Materials

The following are available online at https://www.mdpi.com/article/10.3390/jnt3010001/s1, Scheme S1: Chemical reaction of ABDA with singlet oxygen. Figure S1: Correlation between optical density and molar concentration of ABDA. Figure S2: Morphological characterization of the photo-therapeutic nanoplatform. Figure S3: Nanoparticles analysis via Dynamic Light Scattering. Figure S4: Photophysical characterization of Ir1-AuSiO2. Figure S5: Detection of 1O2 generation of Pc4 by ABDA method. Figure S6: Post-injection trafficking of Ir1 analyzed via in vivo imaging. Figure S7: Post-injection trafficking of Ir1-AuSiO2 analyzed via in vivo imaging. Figure S8: Control groups—Follow-up of GBM xenograft mice treated with Ir1 or Ir1-AuSiO2 in absence of optical radiation dose. Figure S9: X-ray phase-contrast tomography images and quantitative analysis of the vascular network of ex vivo GBM sample treated only with the radiation dose. Figure S10: X-ray phase-contrast tomography images and quantitative analysis of the vascular network of ex vivo GBM sample treated with Ir1 + light exposure. Figure S11: X-ray phase-contrast tomography images and quantitative analysis of the vascular network of ex vivo GBM sample treated with Ir1-AuSiO2 + light exposure. Figure S12: Emission spectra of Ir1 and Ir1-AuSiO2 in water solution at different concentrations, Video S1: Three-dimensional volume (350 × 350 × 350 µm3) of GBM sample after intratumoral injection of Ir1-AuSiO2 followed by light exposure.

Author Contributions

Conceptualization, L.R., M.L.D. and G.S.; formal analysis, L.R., S.C., G.P. and E.I.S.; investigation, L.R., S.C., A.S., F.P., N.P., M.F. and A.C.; resources, M.L.D., R.B. and G.S.; data curation, L.R., S.C., G.P., A.S., F.P., N.P., M.F. and A.C.; writing—original draft preparation, L.R.; writing—review and editing, L.R. and G.S. All authors have read and agreed to the published version of the manuscript.

Funding

This research was funded by: Romanian Ministry of Education and Research, CNCS-UEFISCDI, project number PN-III-P4-ID-PCE-2020-1958, within PNCDI III; FISR Project “Tecnopolo di nanotecnologia e fotonica per la medicina di precisione” (funded by MIUR/CNR, CUP B83B17000010001); TECNOMED project (funded by Regione Puglia, CUP B84I18000540002).

Institutional Review Board Statement

The animal study protocol was approved by the Institutional Animal Care and Use Committee of Case Western Reserve University (Cleveland, OH, USA) (protocol code 2015-0033, 17 February 2021).

Informed Consent Statement

Not applicable.

Data Availability Statement

Not applicable.

Acknowledgments

The authors thank Ramamurthy Gopalakrishnan and James P. Basilion (Case Western Reserve University, Cleveland, OH, USA) for technical support for in vivo studies. E.I.S. acknowledges the Romanian Academy, Program 4.

Conflicts of Interest

The authors declare no conflict of interest. The funders had no role in the design of the study; in the collection, analyses, or interpretation of data; in the writing of the manuscript, or in the decision to publish the results.

References

  1. Louis, D.N.; Ohgaki, H.; Wiestler, O.D.; Cavenee, W.K.; Burger, P.C.; Jouvet, A.; Scheithauer, B.W.; Kleihues, P. The 2007 WHO Classification of Tumours of the Central Nervous System. Acta Neuropathol. 2007, 114, 97–109. [Google Scholar] [CrossRef] [PubMed] [Green Version]
  2. Schwartzbaum, J.A.; Fisher, J.L.; Aldape, K.D.; Wrensch, M. Epidemiology and molecular pathology of glioma. Nat. Clin. Pr. Cardiovasc. Med. 2006, 2, 494–503. [Google Scholar] [CrossRef]
  3. Thakkar, J.P.; Dolecek, T.A.; Horbinski, C.; Ostrom, Q.T.; Lightner, D.D.; Barnholtz-Sloan, J.; Villano, J.L. Epidemiologic and Molecular Prognostic Review of Glioblastoma. Cancer Epidemiol. Biomark. Prev. 2014, 23, 1985–1996. [Google Scholar] [CrossRef] [PubMed] [Green Version]
  4. Hardee, M.E.; Zagzag, D. Mechanisms of Glioma-Associated Neovascularization. Am. J. Pathol. 2012, 181, 1126–1141. [Google Scholar] [CrossRef] [Green Version]
  5. Jain, R.K.; Di Tomaso, E.; Duda, D.G.; Loeffler, J.S.; Sorensen, A.G.; Batchelor, T.T. Angiogenesis in brain tumours. Nat. Rev. Neurosci. 2007, 8, 610–622. [Google Scholar] [CrossRef] [PubMed]
  6. Stupp, R.; Hegi, M.E.; Mason, W.P.; van den Bent, M.J.; Taphoorn, M.J.B.; Janzer, R.C.; Ludwin, S.K.; Allgeier, A.; Fisher, B.; Belanger, K.; et al. Effects of radiotherapy with concomitant and adjuvant temozolomide versus radiotherapy alone on survival in glioblastoma in a randomised phase III study: 5-year analysis of the EORTC-NCIC trial. Lancet Oncol. 2009, 10, 459–466. [Google Scholar] [CrossRef]
  7. Koshy, M.; Villano, J.L.; Dolecek, T.A.; Howard, A.; Mahmood, U.; Chmura, S.J.; Weichselbaum, R.R.; McCarthy, B.J. Improved survival time trends for glioblastoma using the SEER 17 population-based registries. J. Neuro-Oncol. 2011, 107, 207–212. [Google Scholar] [CrossRef] [PubMed] [Green Version]
  8. Tran, B.; Rosenthal, M.A. Survival comparison between glioblastoma multiforme and other incurable cancers. J. Clin. Neurosci. 2010, 17, 417–421. [Google Scholar] [CrossRef]
  9. Legler, J.M.; Ries, L.A.G.; Smith, M.A.; Warren, J.L.; Heineman, E.F.; Kaplan, R.S.; Linet, M.S. Brain and Other Central Nervous System Cancers: Recent Trends in Incidence and Mortality. J. Natl. Cancer Inst. 1999, 91, 1382–1390. [Google Scholar] [CrossRef]
  10. De Paula, L.B.; Primo, F.L.; Tedesco, A.C. Nanomedicine associated with photodynamic therapy for glioblastoma treatment. Biophys. Rev. 2017, 9, 761–773. [Google Scholar] [CrossRef]
  11. Silbergeld, D.L.; Chicoine, M.R. Isolation and characterization of human malignant glioma cells from histologically normal brain. J. Neurosurg. 1997, 86, 525–531. [Google Scholar] [CrossRef] [PubMed] [Green Version]
  12. Dupont, C.; Vermandel, M.; Leroy, H.-A.; Quidet, M.; Lecomte, F.; Delhem, N.; Mordon, S.; Reyns, N. INtraoperative photoDYnamic Therapy for GliOblastomas (INDYGO): Study Protocol for a Phase I Clinical Trial. Neurosurgery 2018, 84, E414–E419. [Google Scholar] [CrossRef] [Green Version]
  13. Dolmans, D.E.J.G.J.; Fukumura, D.; Jain, R.K. Photodynamic therapy for cancer. Nat. Rev. Cancer 2003, 3, 380–387. [Google Scholar] [CrossRef] [PubMed]
  14. Castano, A.P.; Demidova, T.N.; Hamblin, M.R. Mechanisms in photodynamic therapy: Part one—Photosensitizers, photochemistry and cellular localization. Photodiagn. Photodyn. Ther. 2004, 1, 279–293. [Google Scholar] [CrossRef] [Green Version]
  15. McKenzie, L.K.; Bryant, H.E.; Weinstein, J.A. Transition metal complexes as photosensitisers in one- and two-photon photodynamic therapy. Co-ord. Chem. Rev. 2019, 379, 2–29. [Google Scholar] [CrossRef] [Green Version]
  16. Zhao, J.; Wu, W.; Sun, J.; Guo, S. Triplet photosensitizers: From molecular design to applications. Chem. Soc. Rev. 2013, 42, 5323–5351. [Google Scholar] [CrossRef]
  17. Baggaley, E.; Weinstein, J.A.; Williams, J.A.G. Lighting the way to see inside the live cell with luminescent transition metal complexes. Co-ord. Chem. Rev. 2012, 256, 1762–1785. [Google Scholar] [CrossRef]
  18. Ko, C.-N.; Li, G.; Leung, C.-H.; Ma, D.-L. Dual function luminescent transition metal complexes for cancer theranostics: The combination of diagnosis and therapy. Co-ord. Chem. Rev. 2018, 381, 79–103. [Google Scholar] [CrossRef]
  19. Monro, S.; Colón, K.L.; Yin, H.; Roque, J., III; Konda, P.; Gujar, S.; Thummel, R.P.; Lilge, L.; Cameron, C.G.; McFarland, S.A. Transition Metal Complexes and Photodynamic Therapy from a Tumor-Centered Approach: Challenges, Opportunities, and Highlights from the Development of TLD1433. Chem. Rev. 2019, 119, 797–828. [Google Scholar] [CrossRef]
  20. Norouzi, M.; Amerian, M.; Amerian, M.; Atyabi, F. Clinical applications of nanomedicine in cancer therapy. Drug Discov. Today 2020, 25, 107–125. [Google Scholar] [CrossRef]
  21. Wong, X.Y.; Sena-Torralba, A.; Álvarez-Diduk, R.; Muthoosamy, K.; Merkoçi, A. Nanomaterials for Nanotheranostics: Tuning Their Properties According to Disease Needs. ACS Nano 2020, 14, 2585–2627. [Google Scholar] [CrossRef] [PubMed]
  22. Giner-Casares, J.J.; Henriksen-Lacey, M.; Coronado-Puchau, M.; Liz-Marzán, L.M. Inorganic nanoparticles for biomedicine: Where materials scientists meet medical research. Mater. Today 2015, 19, 19–28. [Google Scholar] [CrossRef]
  23. Bobo, D.; Robinson, K.J.; Islam, J.; Thurecht, K.J.; Corrie, S.R. Nanoparticle-Based Medicines: A Review of FDA-Approved Materials and Clinical Trials to Date. Pharm. Res. 2016, 33, 2373–2387. [Google Scholar] [CrossRef]
  24. Moreira, A.F.; Rodrigues, C.F.; Reis, C.A.; Costa, E.C.; Correia, I.J. Gold-core silica shell nanoparticles application in imaging and therapy: A review. Microporous Mesoporous Mater. 2018, 270, 168–179. [Google Scholar] [CrossRef]
  25. Louis, C.; Pluchery, O. Gold Nanoparticles in the Past: Before the Nanotechnology Era. In Gold Nanoparticles for Physics, Chemistry and Biology; World Scientific: Singapore, 2012. [Google Scholar]
  26. Hutter, E.; Fendler, J.H. Exploitation of Localized Surface Plasmon Resonance. Adv. Mater. 2004, 16, 1685–1706. [Google Scholar] [CrossRef]
  27. Huang, X.; Jain, P.K.; El-Sayed, I.H.; El-Sayed, M.A. Plasmonic photothermal therapy (PPTT) using gold nanoparticles. Lasers Med. Sci. 2008, 23, 217–228. [Google Scholar] [CrossRef]
  28. Jaque, D.; Martínez Maestro, L.; del Rosal, B.; Haro-Gonzalez, P.; Benayas, A.; Plaza, J.L.; Rodríguez, E.M.; Solé, J.G. Nanoparticles for photothermal therapies. Nanoscale 2014, 6, 9494–9530. [Google Scholar] [CrossRef]
  29. Hu, Q.; Huang, Z.; Duan, Y.; Fu, Z.; Liu, B. Reprogramming Tumor Microenvironment with Photothermal Therapy. Bioconjugate Chem. 2020, 31, 1268–1278. [Google Scholar] [CrossRef]
  30. Vivero-Escoto, J.L.; Huxford-Phillips, R.C.; Lin, W. Silica-based nanoprobes for biomedical imaging and theranostic applications. Chem. Soc. Rev. 2012, 41, 2673–2685. [Google Scholar] [CrossRef] [Green Version]
  31. Ricciardi, L.; Sancey, L.; Palermo, G.; Termine, R.; De Luca, A.; Szerb, E.I.; Aiello, I.; Ghedini, M.; Strangi, G.; La Deda, M. Plasmon-mediated cancer phototherapy: The combined effect of thermal and photodynamic processes. Nanoscale 2017, 9, 19279–19289. [Google Scholar] [CrossRef]
  32. Ricciardi, L.; Mastropietro, T.F.; Ghedini, M.; La Deda, M.; Szerb, E.I. Ionic-pair effect on the phosphorescence of ionic iridium(III) complexes. J. Organomet. Chem. 2014, 772–773, 307–313. [Google Scholar] [CrossRef]
  33. Zhang, W.; Jian, J.; Sun, C.; Chen, J.; Lv, W.; Sun, M.; Zhao, Y.; Zhao, Q.; Hu, C. High-resolution 3D imaging of microvascular architecture in human glioma tissues using X-ray phase-contrast computed tomography as a potential adjunct to histopathology. Int. J. Imaging Syst. Technol. 2020, 30, 464–472. [Google Scholar] [CrossRef]
  34. Momose, A.; Takeda, T.; Itai, Y.; Hirano, K. Phase–contrast X–ray computed tomography for observing biological soft tissues. Nat. Med. 1996, 2, 473–475. [Google Scholar] [CrossRef] [PubMed]
  35. Krajczewski, J.; Rucińska, K.; Townley, H.E.; Kudelski, A. Role of various nanoparticles in photodynamic therapy and detection methods of singlet oxygen. Photodiagnosis Photodyn. Ther. 2019, 26, 162–178. [Google Scholar] [CrossRef] [PubMed]
  36. Bravin, A.; Coan, P.; Suortti, P. X-ray phase-contrast imaging: From pre-clinical applications towards clinics. Phys. Med. Biol. 2012, 58, R1–R35. [Google Scholar] [CrossRef] [PubMed]
  37. Paganin, D. Coherent X-ray Optics, 6th ed.; Oxford University Press: Oxford, UK, 2006. [Google Scholar]
  38. Brun, F.; Massimi, L.; Fratini, M.; Dreossi, D.; Billé, F.; Accardo, A.; Pugliese, R.; Cedola, A. SYRMEP Tomo Project: A graphical user interface for customizing CT reconstruction workflows. Adv. Struct. Chem. Imaging 2017, 3, 4. [Google Scholar] [CrossRef] [PubMed] [Green Version]
  39. Zhao, B.; Yin, J.-J.; Bilski, P.J.; Chignell, C.F.; Roberts, J.E.; He, Y.-Y. Enhanced photodynamic efficacy towards melanoma cells by encapsulation of Pc4 in silica nanoparticles. Toxicol. Appl. Pharmacol. 2009, 241, 163–172. [Google Scholar] [CrossRef] [Green Version]
  40. Rojiani, A.M.; Dorovini-Zis, K. Glomeruloid vascular structures in glioblastoma multiforme: An immunohistochemical and ultrastructural study. J. Neurosurg. 1996, 85, 1078–1084. [Google Scholar] [CrossRef]
  41. Chakrabarti, M.I.; Banik, N.L.; Ray, S.K. Photofrin Based Photodynamic Therapy and miR-99a Transfection Inhibited FGFR3 and PI3K/Akt Signaling Mechanisms to Control Growth of Human Glioblastoma In Vitro and In Vivo. PLoS ONE 2013, 8, e55652. [Google Scholar] [CrossRef]
  42. Schumacker, P.T. Reactive Oxygen Species in Cancer: A Dance with the Devil. Cancer Cell 2015, 27, 156–157. [Google Scholar] [CrossRef] [Green Version]
  43. Galadari, S.; Rahman, A.; Pallichankandy, S.; Thayyullathil, F. Reactive oxygen species and cancer paradox: To promote or to suppress? Free Radic. Biol. Med. 2017, 104, 144–164. [Google Scholar] [CrossRef] [PubMed]
  44. Prasad, S.; Gupta, S.C.; Tyagi, A.K. Reactive oxygen species (ROS) and cancer: Role of antioxidative nutraceuticals. Cancer Lett. 2016, 387, 95–105. [Google Scholar] [CrossRef]
  45. Liu, Y.; Meng, X.; Bu, W. Upconversion-based photodynamic cancer therapy. Co-ord. Chem. Rev. 2019, 379, 82–98. [Google Scholar] [CrossRef]
  46. Castano, A.P.; Demidova, T.N.; Hamblin, M.R. Mechanisms in photodynamic therapy: Part three—Photosensitizer pharmacokinetics, biodistribution, tumor localization and modes of tumor destruction. Photodiagnosis Photodyn. Ther. 2005, 2, 91–106. [Google Scholar] [CrossRef] [Green Version]
  47. Castano, A.P.; Mroz, P.; Hamblin, M.R. Photodynamic therapy and anti-tumour immunity. Nat. Cancer 2006, 6, 535–545. [Google Scholar] [CrossRef] [PubMed] [Green Version]
  48. Montalti, M.; Credi, A.; Prodi, L.; Gandolfi, M.T. Handbook of Photochemistry, 3rd ed.; CRC Press: Boca Raton, FL, USA, 2006; ISBN 978-0-429-11538-7. [Google Scholar]
  49. Golombek, S.K.; May, J.-N.; Theek, B.; Appold, L.; Drude, N.; Kiessling, F.; Lammers, T. Tumor targeting via EPR: Strategies to enhance patient responses. Adv. Drug Deliv. Rev. 2018, 130, 17–38. [Google Scholar] [CrossRef] [PubMed]
  50. Kalyane, D.; Raval, N.; Maheshwari, R.; Tambe, V.; Kalia, K.; Tekade, R.K. Employment of enhanced permeability and retention effect (EPR): Nanoparticle-based precision tools for targeting of therapeutic and diagnostic agent in cancer. Mater. Sci. Eng. C 2019, 98, 1252–1276. [Google Scholar] [CrossRef]
  51. Shi, J.; Kantoff, P.W.; Wooster, R.; Farokhzad, O.C. Cancer nanomedicine: Progress, challenges and opportunities. Nat. Rev. Cancer 2017, 17, 20–37. [Google Scholar] [CrossRef]
  52. Alphandéry, E. Nano-Therapies for Glioblastoma Treatment. Cancers 2020, 12, 242. [Google Scholar] [CrossRef] [Green Version]
  53. Seo, B.; Lim, K.; Kim, S.S.; Oh, K.T.; Lee, E.S.; Choi, H.-G.; Shin, B.S.; Youn, Y.S. Small gold nanorods-loaded hybrid albumin nanoparticles with high photothermal efficacy for tumor ablation. Colloids Surf. B Biointerfaces 2019, 179, 340–351. [Google Scholar] [CrossRef]
  54. Lee, C.; Hwang, H.S.; Lee, S.; Kim, B.; Kim, J.O.; Oh, K.T.; Lee, E.S.; Choi, H.-G.; Youn, Y.S. Rabies Virus-Inspired Silica-Coated Gold Nanorods as a Photothermal Therapeutic Platform for Treating Brain Tumors. Adv. Mater. 2017, 29. [Google Scholar] [CrossRef]
  55. Castano, A.P.; Demidova, T.N.; Hamblin, M.R. Mechanisms in photodynamic therapy: Part two—cellular signaling, cell metabolism and modes of cell death. Photodiagnosis Photodyn. Ther. 2005, 2, 1–23. [Google Scholar] [CrossRef] [Green Version]
  56. Zagzag, D.; Zhong, H.; Scalzitti, J.M.; Laughner, E.; Simons, J.W.; Semenza, G.L. Expression of Hypoxia-Inducible Factor 1? In Brain Tumors: Association with Angiogenesis, Invasion, and Progression. Cancer 2000, 88, 2606–2618. [Google Scholar] [CrossRef]
  57. Shweiki, D.; Itin, A.; Soffer, D.; Keshet, E. Vascular endothelial growth factor induced by hypoxia may mediate hypoxia-initiated angiogenesis. Nature 1992, 359, 843–845. [Google Scholar] [CrossRef] [PubMed]
  58. Arum, C.-J.; Gederaas, O.A.; Larsen, E.L.P.; Randeberg, L.L.; Hjelde, A.; Krokan, H.E.; Svaasand, L.O.; Chen, D.; Zhao, C.-M. Tissue responses to hexyl 5-aminolevulinate-induced photodynamic treatment in syngeneic orthotopic rat bladder cancer model: Possible pathways of action. J. Biomed. Opt. 2011, 16, 028001. [Google Scholar] [CrossRef] [PubMed]
Figure 1. Overview of the therapeutic approach for human GBM treatment in xenograft mouse model. (a) Intratumoral injection of Ir1-AuSiO2, distribution and accumulation next to blood vessel walls followed by light-activation of photodynamic and photothermal processes. 1 The light exposure excites the photosensitizer (Ir1) loaded in the silica shell of AuSiO2 nanoparticles, from the ground state to the short-lived excited singlet state. Following intersystem crossing (ISC), the resulting triplet state can directly interact with molecular oxygen (3O2) and, via an energy transfer mechanism, generate cytotoxic singlet oxygen (1O2). Competitively, Ir1 from the triplet state drops to the ground level radiatively, giving rise to phosphorescence (P). 2 Ir1 molecules in the shell and in close proximity to gold core nanospheres leads to a resonant energy transfer process from Ir1 to the plasmonic nanostructure, with consequent conversion of the radiant energy into heat. The synergistic combination of photodynamic and photothermal effects induces fragmentation and reduction in the tumor vasculature network, preventing the delivery of oxygen and nutrients. The starved tumor regresses because of a massive devascularization leading to the complete tumor elimination; (b) Schematic illustration of Ir1 and Ir1-AuSiO2 properties and resulting advantages (green) and disadvantages (red) for in vivo photo-theranostics application.
Jnt 03 00001 g001
Figure 2. Comparative analysis of 1O2 generation detected by ABDA method. (a) Photobleaching of ABDA by 1O2 at different irradiation times (0–15 min) in water and in the presence of Ir1 or Ir1-AuSiO2 ([Ir1] = 2 × 10⁻⁵ M). The experiments were carried out by using an excitation source at 365 nm-20 mW/cm2; (b) plotting of ABDA absorption at 378 nm as a function of the illumination time.
Jnt 03 00001 g002
Figure 3. In vivo imaging of mice treated with Ir1 or Ir1-AuSiO2. (a) Fluorescence image of Ir1 injected subcutaneously into the mouse. The fluorescence signal intensity, measured as photon counts, is shown as color scale bar (radiant efficiency from 5.27 × 10⁹ (blue) to 4.74 × 10¹⁰ (red)); (b) representative real-time in vivo fluorescence images pre and 30 min post-injection of Ir1 into the GBM mass; (c) normalized fluorescence signals acquired before time course and after injection of Ir1 (black) or Ir1-AuSiO2 (red) into the GBM mass. Inset: bright field image of the flank tumor. The blue circle in all the images identifies the region-of-interest (ROI).
Jnt 03 00001 g003
Figure 4. Follow-up of GBM xenografted mice after photo-treatment. (a) Time-dependent tumor growth curves after light exposure (control group) or after intratumoral injection of Ir1 or Ir1-AuSiO2 + light exposure (treatment groups) in GBM-bearing mice (n = 2 mice per group). Solid or dotted lines were used to better distinguish the tumor growth curves of mice within each group. (b) Photographs of a representative mouse from Ir1-AuSiO2 + light exposure group showing the complete post-treatment tumor regression.
Jnt 03 00001 g004
Figure 5. X-ray phase-contrast tomography images and quantitative analysis of the vascular network of ex vivo GBM samples. (a) Grayscale (top) tomography images of GBM samples treated (from left to right) only with the radiation dose (control), or after intratumoral injection of Ir1 or Ir1-AuSiO2 followed by light exposure. At the bottom, the same images are reported by using different colors for better visualization (red: blood vessels; green: GBM cells; blue: Ir1-AuSiO2 clusters). Scale bar: 300 µm; box: 800 × 800 pixels. (b) Average distribution of vessels at different sizes and (c) diameter range in GBM samples treated only with the radiation dose (control) or after intratumoral injection of Ir1 or Ir1-AuSiO2 followed by light exposure. Quantitative analysis was performed on a working area of 400 × 400 pixels.
Jnt 03 00001 g005
Figure 6. Three-dimensional images of the vasculature of ex vivo GBM samples. Three-dimensional volume (350 × 350 × 350 µm3) of GBM samples treated (a) only with the optical radiation dose (control) and (b) after intratumoral injection of Ir1 followed by light exposure. The microvasculature is rendered in red. The tissues were computationally removed from the three-dimensional rendering to highlight the vessel’s distribution. (c,d) Three-dimensional volume (350 × 350 × 350 µm3) of GBM sample after intratumoral injection of Ir1-AuSiO2 followed by light exposure (top view). Vessels are rendered in red, and the Ir1-AuSiO2 clusters in yellow. Clusterized nanostructures appear distributed along some vascular channels highlighted by blue dashed lines. The inset highlights the details of nanoparticle clusters in the vascular structure and how their distribution correlates with the devascularized structure, which appears to be reduced and discontinued.
Jnt 03 00001 g006
Table 1. Moles of 1O2 generated after light exposure of Ir1, Ir1-AuSiO2 and Pc4 (λex 365 nm—20 mW/cm2—15 min).
SampleConcentration/mol L−1mol 1O2
Ir12 × 10−55.4 × 10⁻⁸
Ir1-AuSiO22 × 10−52.6 × 10⁻⁸
Pc42 × 10−54.3 × 10⁻⁸
Publisher’s Note: MDPI stays neutral with regard to jurisdictional claims in published maps and institutional affiliations.

