Article

The Influence of the Inelastic Electron–Phonon Collision Time on the Resistive State of 3D Superconducting Materials

by
Lucas Veneziani de Toledo
*,
Breno Justen de Castro Moreira
,
Leonardo Rodrigues Cadorim
and
Edson Sardella
Departamento de Física, Faculdade de Ciências, Universidade Estadual Paulista (UNESP), Caixa Postal 473, Bauru 17033-360, SP, Brazil
*
Author to whom correspondence should be addressed.
Physics 2025, 7(4), 61; https://doi.org/10.3390/physics7040061
Submission received: 16 July 2025 / Revised: 7 October 2025 / Accepted: 20 October 2025 / Published: 26 November 2025

Abstract

This study investigates the influence of inelastic electron–phonon collision time ( τ e - ph ) on the behavior of the resistive state of three-dimensional superconducting systems. Using the generalized time-dependent Ginzburg–Landau formalism, we model the interplay between vortex dynamics, energy dissipation, and thermal effects across varying values of the dimensionless parameter γ proportional to τ e - ph and different values of the Ginzburg–Landau parameter. The results show that larger values of γ enhance the superconducting state by delaying the transition to the normal state, modulating critical currents, and altering differential resistance. An exponential relationship between the upper critical current and γ is observed, indicating prolonged resistive states as the inelastic electron–phonon collision time becomes larger. Furthermore, the study investigates the maximum local peaks in the differential resistance curves, revealing their exponential decay with increasing γ .

1. Introduction

In type-II superconductors, the penetration and motion of vortices induced by magnetic fields or transport currents lead to a local suppression of superconductivity, resulting in a resistive state [1,2,3,4,5]. The dynamics of these vortices is significantly influenced by microscopic parameters, particularly the inelastic electron–phonon collision time ( τ e - ph ) [6], which directly affects the relaxation dynamics of the superconducting order parameter [7,8]. Within the generalized time-dependent Ginzburg–Landau (GTDGL) framework adopted here, where explicit pinning centers are absent and electron–phonon scattering is taken as the dominant relaxation channel, a shorter τ e - ph indeed corresponds to faster quasiparticle relaxation, which reduces viscous drag and thereby enhances vortex mobility. This enhanced mobility directly influences the resistive behavior of the material in the flux–flow regime. It must be stressed, however, that this interpretation is not universal: in the cases dominated by strong pinning or by electron–electron scattering, faster relaxation can instead increase damping rather than mobility.
Understanding the role of τ e - ph is essential for accurately describing vortex dynamics and developing comprehensive models of nonequilibrium phenomena in superconductors. This relaxation scale has been commonly recognized in the broader nonequilibrium superconductivity literature, from studies [7,9,10,11] to more recent treatments [12], which discuss its fundamental role in energy relaxation.
The importance of inelastic electron–phonon collision time interactions in the determination of energy relaxation times has been emphasized in foundational studies. Gerasim Eliashberg [9] highlighted the necessity of incorporating inelastic electron–phonon collision time into theoretical models of nonequilibrium superconducting states, as these collisions are central to dissipation mechanisms and critically shape the resistive response under applied currents or magnetic fields. Furthermore, Michael Reizer and Andrei Sergeev [6,13] demonstrated that in pure metals, interactions with transverse phonons significantly accelerate energy relaxation, an effect potentially relevant in superconductors at relaively low temperatures.
Theoretical studies of viscous vortex dynamics have emphasized the influence of the inelastic electron–phonon collision time and impurity concentrations in determining vortex mobility and energy dissipation [14,15]. Within this context, the GTDGL theory has provided a robust framework for describing dissipative superconducting states, incorporating both thermal diffusion and intrinsic relaxation mechanisms [16,17]. More recently, numerical simulations have reinforced these findings by showing how mesoscopic parameters, such as geometry and boundary conditions, interact with thermal effects to modulate vortex dynamics and resistive behavior in nanostructured superconducting devices [1,18].
In thin superconducting films, the kinetics of inelastic electron–phonon collision time relaxation further illustrate the impact of τ e - ph on resistive behavior. Alexey Bezuglyĭ and Valeriy Shklovskiĭ [19] discussed how rapidly heated electrons emit nonequilibrium phonons that can escape to the substrate without reabsorption, affecting the thermalization process and, consequently, the dynamics of vortices under nonequilibrium conditions.
During the past decades, significant advances in both experimental and theoretical techniques have improved the understanding of τ e - ph . Advanced spectroscopic methods, such as time-resolved optical spectroscopy and ultrafast electron microscopy, have enabled direct measurements of relaxation time scales in superconductors, providing detailed insights into inelastic electron–phonon collision time interactions at ultrafast time scales [20,21]. Concurrently, the development of new superconducting materials, including quite high critical temperature superconductors and iron-based superconductors, has expanded the understanding of how τ e - ph varies with the composition and structure of the material. Studies have demonstrated that different crystal structures and electronic densities exhibit different inelastic electron–phonon collision time [22,23].
Finally, the time-dependent Ginzburg–Landau theory provides a theoretical framework for understanding how collective behavior emerges in superconductors near critical temperatures. In particular, the slowdown of the order-parameter relaxation near the critical temperature T c is a universal feature of TDGL dynamics, independent of specific scattering mechanisms. The inelastic electron–phonon time τ e - ph sets the baseline relaxation timescale, but it does not cause the divergence itself; here we use the parameter γ τ e - ph just as a qualitative control of this timescale.
Building upon this theoretical and computational foundation, in our earlier studies [24,25], we explored in detail the three-dimensional (3D) dynamics of vortex–antivortex (V–aV) structures induced by transport currents in mesoscopic type-II superconductors. In Ref. [24], we employed the full 3D GTDGL formalism to reveal that, for sufficiently thick superconducting films, the self-induced magnetic field generated by the transport current leads to curved V-aV lines that merge into closed vortex loops prior to annihilation. This entirely electrodynamic mechanism, inherently dependent on the sample thickness and the Ginzburg–Landau parameter κ , was quantitatively characterized via a geometric criterion based on the aspect ratio of the vortex lines. Furthermore, we proposed an indirect experimental detection strategy based on the measurement of time-averaged magnetic flux at the sample boundaries, offering a practical approach for identifying these elusive topological configurations.
In a subsequent study [25], we extended that study by coupling the GTDGL equations to the heat diffusion equation, thereby enabling a systematic investigation of thermal feedback effects arising from vortex dynamics. Our results demonstrated that the nucleation and annihilation of closed V–aV pairs act as localized heat sources that significantly alter the temperature distribution within the superconducting film. We further showed that variations in substrate thermal coupling and sample geometry strongly influence the onset of the resistive state, the associated hysteresis in the characteristics IV, and the overall stability of the superconducting phase under nonequilibrium conditions.
The present study advances this investigation program by incorporating a microscopic description of quasiparticle relaxation through the explicit inclusion of inelastic electron–phonon collision time τ e - ph into the GTDGL framework. By systematically varying the dimensionless parameter γ = 2 τ e - ph Δ 0 / , with Δ 0 the superconducting gap and the reduced Planck constant, we examine how inelastic electron–phonon collision time influences the dynamics of vortex loops and the evolution of the resistive state. This refinement enables a more realistic modeling of dissipation in superconductors. Earlier studies based on the GL formalism have clarified numerous aspects of vortex dynamics and critical currents, but those studies were mostly limited to simplified two-dimensional systems or did not systematically explore the role of the dimensionless parameter γ . Here, we extend the studies to fully three-dimensional geometries, showing in a qualitative way how γ governs the critical currents ( I c 1 and I c 2 ) and the behavior of the differential resistance within the resistive regime. In particular, we establish that both I c 2 and the maximum differential resistance R max exhibit exponential dependence on γ , providing a numerical framework that serves as a guide for future theoretical and computational studies of resistive states.

2. Model and Methodology

In this paper, we apply the GTDGL formalism [16,26] to model vortex dynamics and explore how the inelastic electron–phonon collision time affects the resistive state of superconducting materials. This framework provides a robust approach to describe the temporal evolution of both the superconducting order parameter ψ and the electromagnetic fields, represented by the vector potential A . By incorporating these effects, we investigate how external magnetic fields and transport currents interact with the system.
The evolution of the superconducting order parameter ψ is governed by the dimensionless form of the GTDGL equation, which incorporates dissipative processes associated with the relaxation of ψ and is given by
u 1 + γ 2 | ψ | 2 t + i φ + 1 2 γ 2 | ψ | 2 t ψ = i A 2 ψ + ψ ( 1 T | ψ | 2 ) ,
where the electromagnetic field within the superconductor is described by the dimensionless form of Ampère’s law:
σ A t + φ = J s κ 2 × h ,
with u denoting the relaxation constant of the superconducting order parameter, t denoting the time, T the temperature, σ the normal-state electrical conductivity, J s the superconductivity current and h denoting the local magnetic field.
To complete the theoretical framework of the approach applied, the scalar potential φ , which is essential to describe the electromagnetic dynamics within the superconductor has to be determined. Calculating the scalar potential is necessary to determine the electric field E and ensure charge conservation in the system. We begin by considering the following continuity equation for an electric charge:
ρ t + · J = 0 ,
where ρ is the electric charge density, and J = J s + J n represents the total current density, comprising both the superconducting current J s and the normal current J n . The superconducting current is given by
J s = Re ψ i A ψ ,
and the normal current follows Ohm’s law:
J n = σ E .
In this formalism, density is expressed in units of J GL = σ / 2 e ξ ( 0 ) t GL , and we use I GL = J GL ξ 2 ( 0 ) as the unit of total current, where ξ ( 0 ) is the superconducting coherence length at zero temperature and t GL represents the characteristic Ginzburg–Landau time scale, t GL = ξ 2 ( 0 ) / D , with D the diffusion coefficient.
The electric field E is related to the scalar and vector potentials by
E = A t φ .
Assuming no net accumulation of charge within the superconductor (i.e., ρ / t = 0 ), the continuity equation simplifies to
· J s + σ A t φ = 0 .
To further simplify the equation, we adopt the Coulomb gauge condition · A = 0 . This choice causes the divergence of the time derivative of the vector potential to vanish. Rearranging terms, one obtains an equation for the scalar potential,
2 φ = 1 σ · J s .
In this formalism, the superconducting order parameter ψ is normalized by ψ = α / β , where α and β are phenomenological constants. The vector potential A is expressed in units of H c 2 ( 0 ) ξ ( 0 ) , and the local magnetic field h = × A is given in units of the upper critical field H c 2 ( 0 ) . All quantities in this formulation are expressed in dimensionless form by introducing normalization scales that absorb the universal constants. For instance, lengths are measured in units of ξ ( 0 ) fields are defined in units of H c 2 ( 0 ) , and times in units of t GL . In this way, constants such as , the elementary electrical charge e, the speed of light c, and the Boltzmann constant k B do not appear explicitly in most equations, although they remain embedded in the chosen units. The critical temperature T c , however, still enters explicitly in some relations, reflecting its role as the fundamental temperature scale in the GL framework. Within this convention, the Ginzburg–Landau parameter is defined as κ = λ ξ with λ denoting the penetration length. Time is expressed in terms of the time scale t GL . The temperature T is normalized by the critical temperature T c , and the scalar potential φ is expressed in units of φ GL = H c 2 ( 0 ) D / c , where c is in Gaussian (cgs) units. In dimensionless formulation here, c is absorbed into the normalization and acts only as a scale factor, without affecting the final numerical results. The material parameter γ = 2 τ e - ph Δ 0 / links the inelastic electron–phonon collision time τ e - ph with the superconducting gap Δ 0 (the superconducting energy gap at zero temperature). Furthermore, κ = λ ( 0 ) / ξ ( 0 ) represents the scaled Ginzburg–Landau parameter, and σ is normalized by c 2 / 4 π D κ 2 .
For completeness, within the Ginzburg–Landau theory, the penetration depth and the coherence length vary with temperature as
λ ( T ) = λ ( 0 ) 1 T / T c
and
ξ ( T ) = ξ ( 0 ) 1 T / T c ,
respectively.
Since both quantities (9) and (10) diverge in the vicinity of T c in the same way, their ratio κ = λ / ξ is approximately temperature independent close to T c , which justifies using κ = λ ( 0 ) / ξ ( 0 ) in the formulation applied here. Let us emphasize that the GTDGL formalism is not restricted to a specific dimensionality: its assumptions remain valid in both two-dimensional and three-dimensional geometries. The essential requirement is that the system is studied sufficiently close to the critical temperature T c , where the GL theory provides a reliable description. Therefore, extending the model to fully three-dimensional simulations does not introduce additional limitations, and the results obtained remain consistent within the validity range of the theory.
By coupling the GTDGL equation with Ampère’s law, one can analyze how τ e - ph modifies the resistive behavior of the superconductor under the influence of external currents and magnetic fields. This approach allows us to quantify the energy dissipation that occurs due to vortex dynamics, which contributes to the resistive state. The total energy dissipation, W T [27], is expressed as the sum of three primary contributions:
W T = W A + W ψ + W γ ,
where
W A = σ E 2 = σ A t φ 2
represents the dissipation due to the induced electric field,
W ψ = u 1 + γ 2 | ψ | 2 ψ t 2
represents the dissipation associated with the relaxation of the order parameter ψ and
W γ = u γ 2 4 1 + γ 2 | ψ | 2 | ψ | 2 t 2
is the dissipation related to the relaxation of the superconducting electron density.
Equations (13) and (14) were generalized for gap superconductors ( γ 0 ) in Ref. [28] (see also [18]). In these equations, the parameter u denotes the relaxation constant of the superconducting order parameter. From physics viewpoint, the parameter u sets the relative timescale for the relaxation of the order parameter amplitude compared to the characteristic electromagnetic timescales. This parameter, often referred to in the literature as the “Schmid parameter” (see Ref. [27]), plays a central role in nonequilibrium TDGL formulations [18,28].
The parameter γ straightforwardly couples the relaxation of the superconducting order parameter with τ e ph , influencing both the relaxation processes and the energy dissipation in the system. This dissipative process is further coupled with the thermal dynamics described by the heat diffusion Equation [17]
C T t = ζ 2 T + W ,
where C is the effective heat capacity and ζ is the thermal conductivity being set here to C = 0.03 and ζ = 0.06 . The heat generated due to vortex dynamics and relaxation processes contributes to the overall thermal behavior of the superconductor, particularly under varying inelastic electron–phonon collision time conditions.
In the framework used here, energy arises from two coupled channels. First, the order parameter dynamics, governed by the GTDGL equations with finite γ , provide an intrinsic dissipative mechanism. Second, thermal feedback is introduced through the heat diffusion equation, where C and ζ determine how the system redistributes the locally generated power W. From physics point of view, this signifies that in the Meissner state the current flows without significant energy loss, whereas in the resistive regime the nucleation and motion of vortex–antivortex pairs convert part of the injected electrical energy into heat, raising the local temperature and modifying the superconducting response. In the simulations, we treat C and ζ as effective constants: changing their values shifts relaxation times quantitatively, but the qualitative dependence of I c 2 and R max on γ remains unchanged. Thus, the exponential trends reported here reflect the role of γ in quasiparticle relaxation rather than an artifact of the chosen thermal parameters.
It is worthy noting that in our dimensionless formulation, both C and ζ act as normalized parameters that set the relative timescale of thermal relaxation. The adopted values were chosen for two main reasons: (i) small C accelerates thermal equilibration and reduces the computational cost of fully 3D simulations as also discussed in Ref. [17], and (ii) in mesoscopic superconductors these quantities should be regarded as effective parameters, since the actual thermal response is strongly influenced by substrate coupling, interface transparency, and geometric confinement. Although real materials exhibit temperature and field-dependent heat capacity and conductivity, the tests we had performed confirm that the qualitative trends reported here, such as the exponential scaling of I c 2 and R max with γ remain robust against variations of C and ζ .
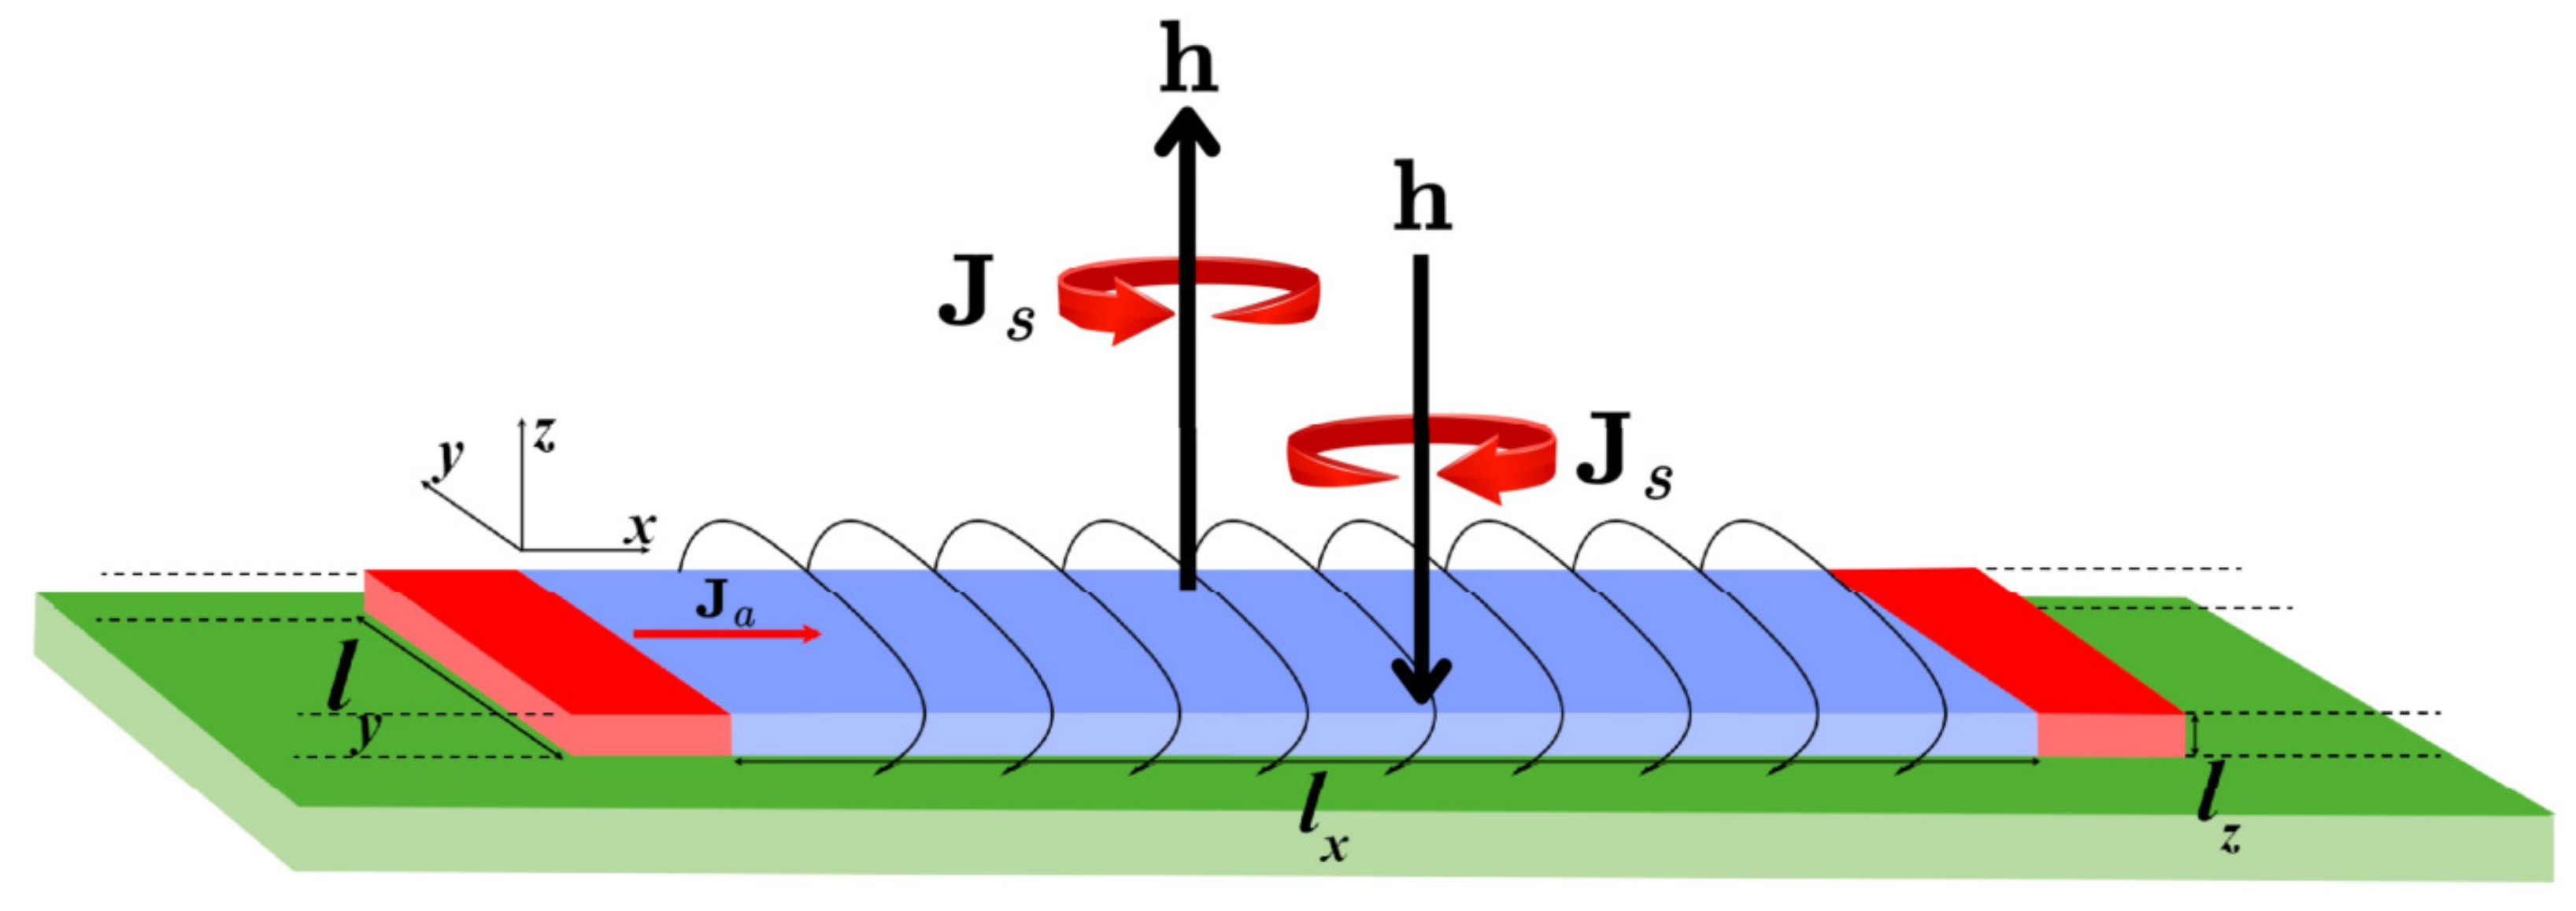
Figure 1 gives a schematic view of the system under investigation, which consists of a superconducting film with dimensions l x , l y and l z . Metallic contacts are attached on both sides of the superconductor, through which a constant current density J a is applied. The total current injected into or extracted from the superconductor through these contacts is given by I = l y l z J a . The magnetic field h at the two lateral edges is generated by the transport current according to Ampère’s law. This configuration forms a normal metal–superconductor–normal metal (NSN) junction, placed atop a substrate.
The external current is introduced through boundary conditions applied to the scalar potential φ . At the interfaces between the superconductor and the normal metal contacts, we use the condition n ^ · φ = J a , where n ^ denotes the unit normal vector to the interface. This condition ensures that the current density flowing into the superconductor matches the applied current density J a . For all other boundaries, we apply the condition n ^ · φ = 0 . At the boundaries of the order parameter and temperature fields, we impose Dirichlet, Neumann, and Robin boundary conditions, depending on the variable considered. Specifically, Dirichlet conditions fix the field value at the boundary (for example, ψ = 0 or T = T 0 , where T 0 is the bath temperature), Neumann conditions fix the normal derivative of the field (for example, u / n = 0 , corresponding to zero flux through the boundary), and Robin conditions impose a linear combination of both, Θ u + Σ u / n = g , where u is the field, u / n is its derivative along the outward normal, and Θ , Σ , and g are constants. This interpolating form allows partial leakage of the order parameter or heat flux across the boundary. Such Robin-type conditions have been earlier applied in TDGL-based simulations of mesoscopic superconductors; see Refs. [26,27].
To confine the superconducting current within the superconductor, boundary conditions are imposed on the order parameter ψ at the edges of the system:
n ^ · i A ψ = i b ψ ,
where b is the de Gennes extrapolation length, set to b = 20 in the model here at the superconductor/normal metal interfaces to simulate finite interface transparency, and to b (effectively applying Neumann boundary conditions) at all other surfaces.
At the boundaries of the 3D system, the local magnetic field h is set equal to the field H generated by the uniform current density J a in the superconductor. This magnetic field satisfies the following equation:
κ 2 × H = J a x ^ ,
where x ^ is the unit vector along the x-axis. The solution to this equation can be found in the Supplementary Material to Ref. [5]. By using this boundary condition, we disregard demagnetization effects at the system edges. This simplification is necessary due to the computational complexity of solving Ampère’s law in the regions surrounding the superconductor to account for stray magnetic fields.
The boundary conditions for the temperature T at the superconductor/normal metal interfaces are fixed at the bath temperature T 0 . For the other boundaries, we apply a condition that combines Dirichlet and Robin boundary conditions:
T Out = T In h α ( T In T 0 ) ,
where T In and T Out denote the temperatures just inside and outside the superconductor, respectively, with h α = h f on the lateral surfaces ( y = ± l y / 2 ) and on the top surface ( z = l z / 2 ) and h α = h s at the superconductor/substrate interface ( z = l z / 2 ), where h f and h s are the efficiencies of heat dissipation through those surfaces. h α = 0 at an insulating boundary and h α = 1 at perfect thermal contact with the bath.
We adjust the size of the system according to the bath temperature T 0 , ensuring that the confinement remains consistent in units of ξ ( T ) for all temperature values. In our simulations, the system dimensions are fixed, but in the numerical implementation they are expressed in dimensionless form as multiples of ξ ( T ) = ξ ( 0 ) / 1 T / T c . This rescaling is used only for normalization and comparison between different temperatures. Importantly, since all calculations are performed at T < T c , ξ ( T ) remains finite and the actual system size does not diverge. As an example, for T 0 = 0.84 T c , the dimensionless lengths correspond to l x = 12 ξ ( T ) = 30 ξ ( 0 ) , l y = 8 ξ ( T ) = 20 ξ ( 0 ) , and l z = 1.2 ξ ( T ) = 3 ξ ( 0 ) .
By implementing these boundary conditions, a comprehensive and self-consistent simulation of the behavior of the superconducting system are ensured under various external influences. The integration of the GTDGL equations with appropriate electromagnetic and thermal boundary conditions enables us to model the interaction between inelastic electron–phonon collision time, vortex motion, and heat dissipation. This methodology provides an understanding of the behavior of superconductors, particularly in revealing how τ e - ph influences their resistive states.
3. Results and Discussion

The discretization of the equations introduced in Section 2 is performed using the commonly adopted link-variable method, as detailed in Ref. [29] (for further discussions, see Ref. [30]). This approach is then implemented in Fortran 90 and executed on a Graphics Processing Unit (GPU) to use computational acceleration. A forward-time central-space scheme is employed for numerical integration. The spatial grid is defined with a resolution of Δ x = Δ y = Δ z = 0.4 ξ ( 0 ) when T 0 = 0.75 T c , and Δ x = Δ y = Δ z = 0.5 ξ ( 0 ) for T 0 = 0.84 T c .
The values of κ and γ used in the current paper were primarily selected for computational reasons. Fully three-dimensional GTDGL simulations are numerically high demanding, and moderate values of κ (0.5 and 1) as well as a restricted range of γ (10–35) make the calculations tractable while still reflecting experimentally reasonable regimes. Although real materials may present γ values up to O ( 10 3 ) , such large parameters may shrink the GL timescale and make the 3D integration prohibitively expensive. The ranges adopted here thus provide a practical compromise that captures the essential qualitative trends of the resistive state while keeping the numerical effort feasible.

3.1. Effect of γ on the Characteristic I–V and I–R Curves in Type II Superconductors

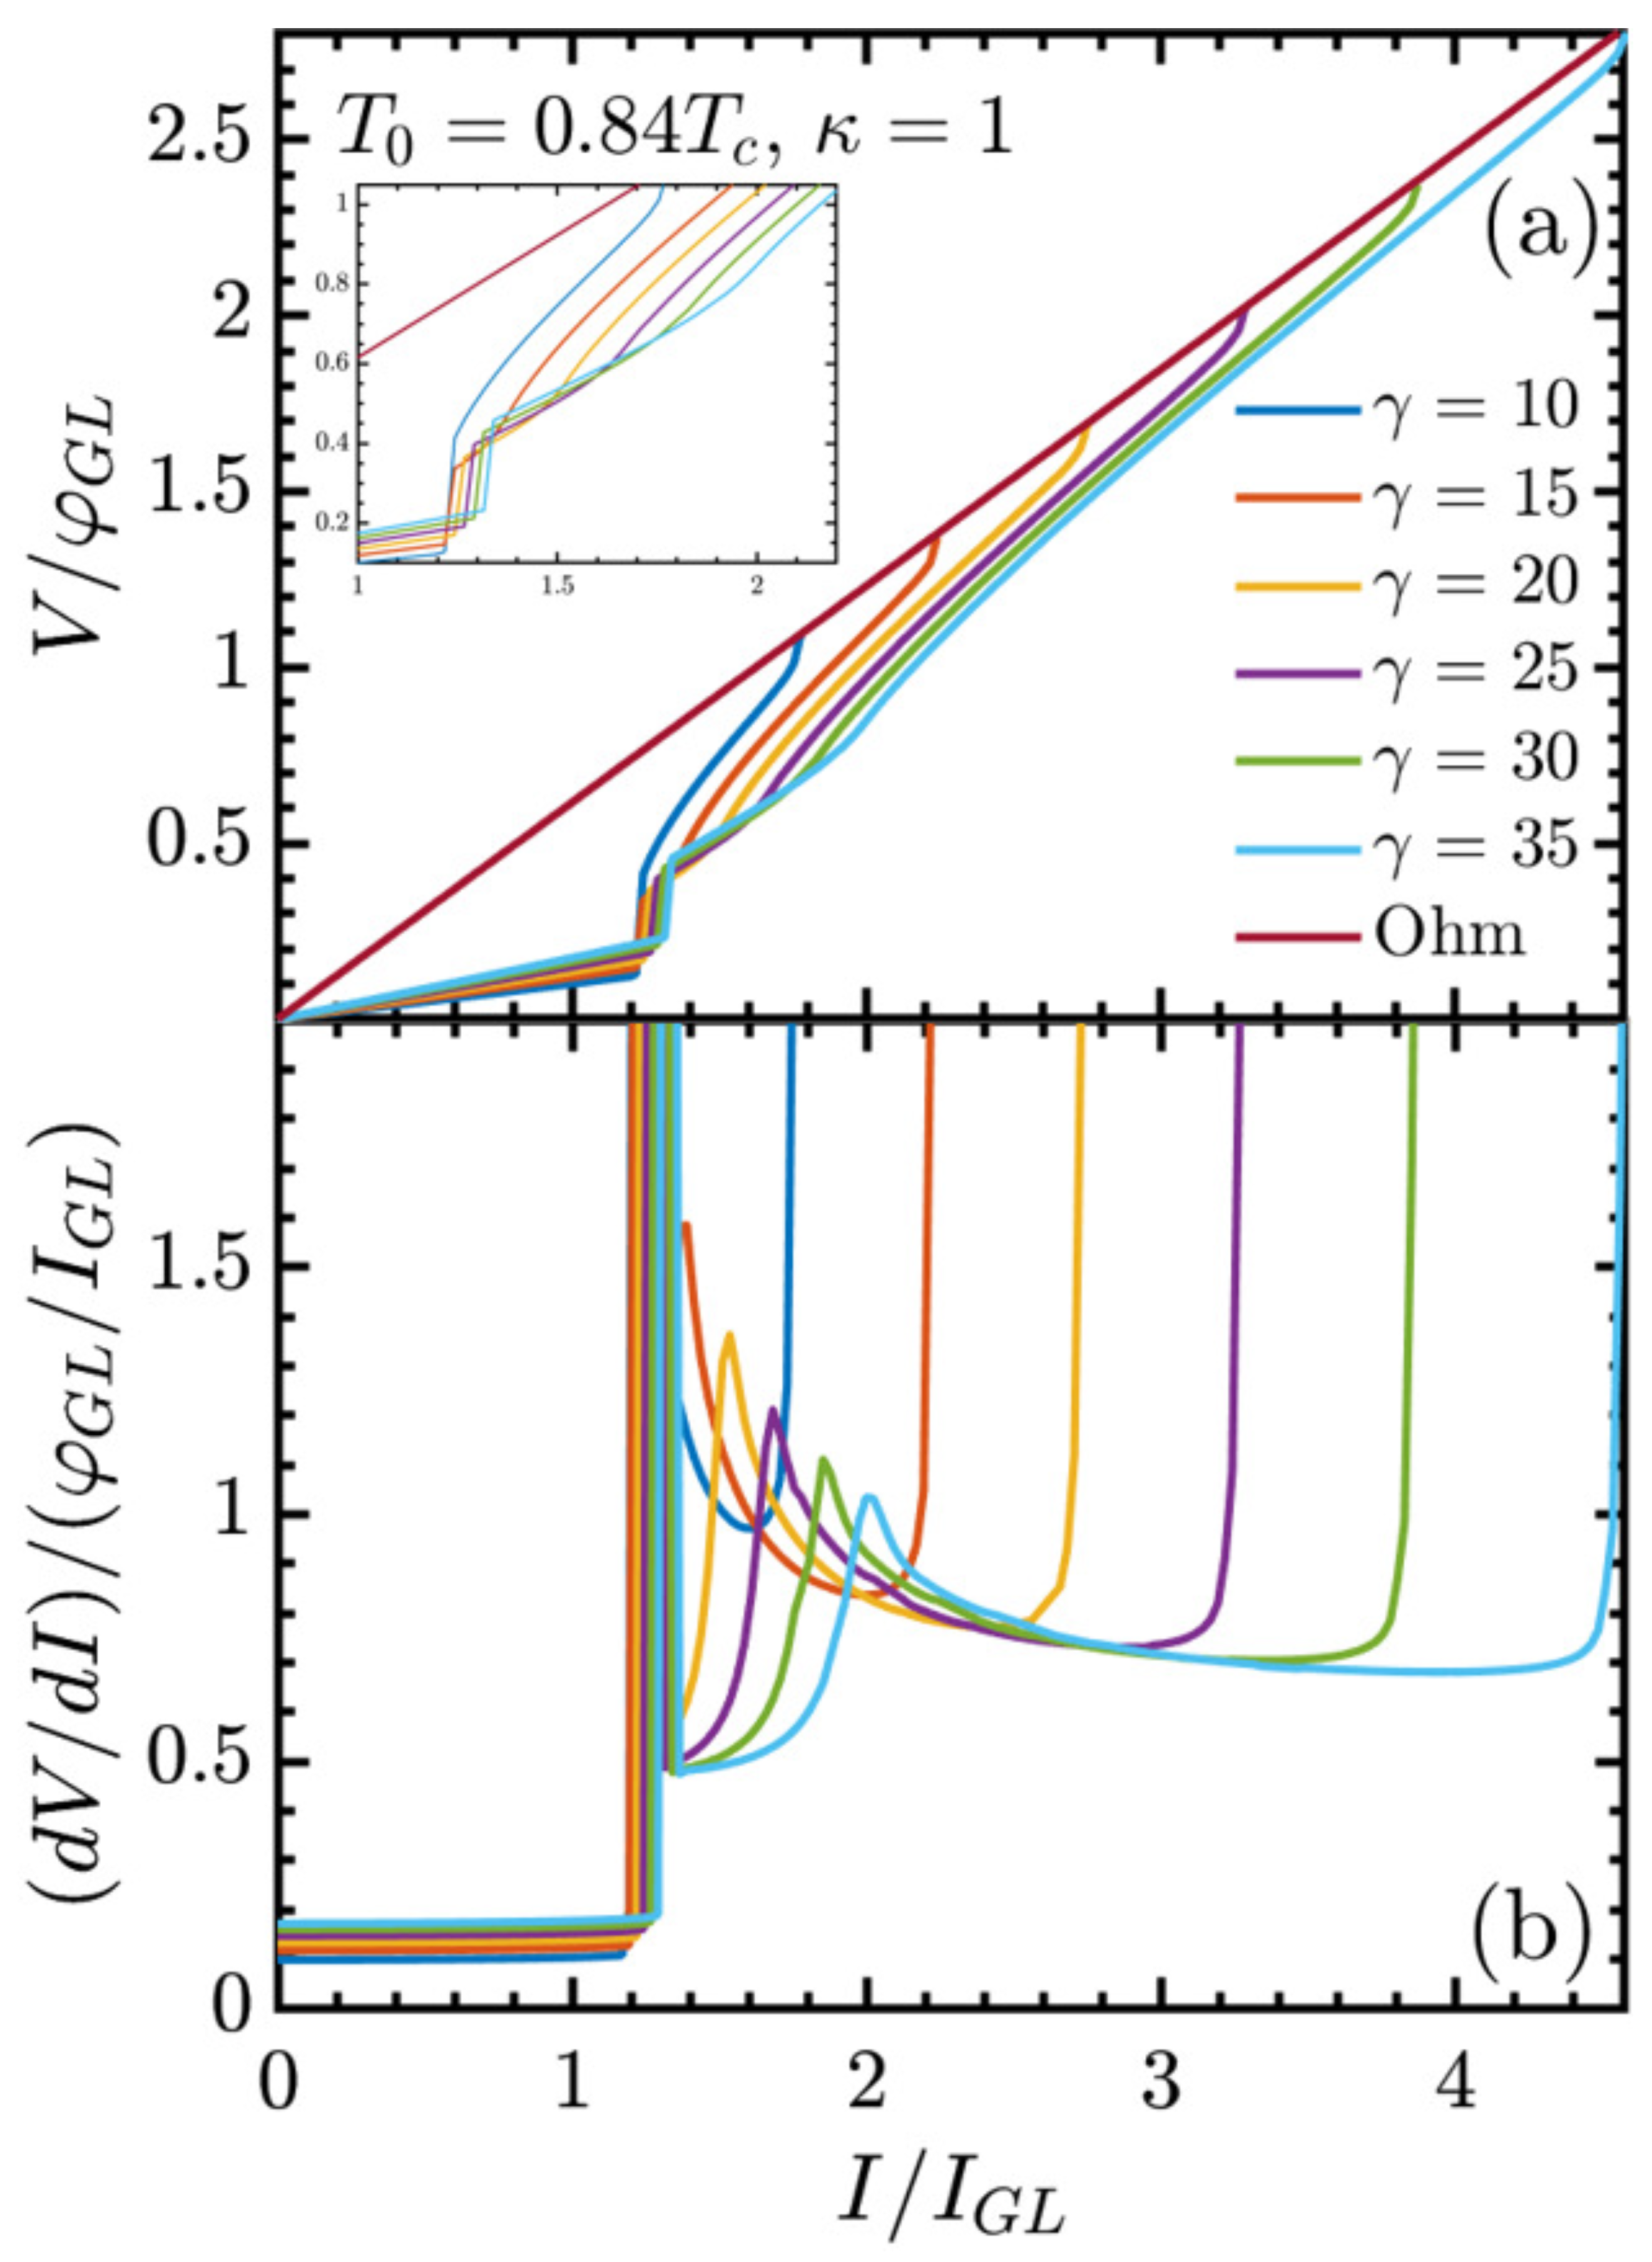
Figure 2 shows the characteristics current–voltage IV (Figure 2a) and the corresponding differential resistance IR (Figure 2b) for different values of the parameter γ , spanning 10 to 35. Let us note here that γ can be one or two orders of magnitudes larger in real materials. We limit ourselves to this range due to the quite fast increase in computational time as γ increases. Nevertheless, it is expected that the trends discussed in what follows are still valid at the considerably large γ limit. The temperature is fixed at T 0 = 0.84 T c , and the Ginzburg–Landau parameter is set to κ = 1 , ensuring a consistent superconducting regime throughout the simulations. Initially, a flat region is observed, corresponding to the Meissner state, where the material exhibits zero resistance. The finite voltage seen in this region results from normal contacts. This state persists until the first critical current I c 1 , marking the transition to the resistive state. Figure 2a highlights the shift in the onset of the resistive state as γ increases. This effect is visible in the inset, which provides a closer look at the voltage–current behavior near the transition. For lower γ , the resistive state emerges at lower currents, resulting in a lower upper critical current I c 2 . In contrast, higher values of γ delay this transition, leading to a significant increase in the critical current.
The parameter γ influences the dynamics of inelastic electron–phonon collision within the superconducting material. The larger γ corresponds to longer relaxation times after inelastic collisions, reducing the dissipative mechanisms that contribute to resistance. As a result, the system retains superconducting properties over a wider range of currents, postponing the complete suppression of superconductivity and the transition to the normal state.
Figure 2b supports this feature by showing differential resistance as a function of the applied current. For lower γ , the differential resistance increases sharply just after the critical current, indicating quite a rapid transition to the resistive state. The first discontinuity in the derivative reflects the breakdown of the Meissner state as a result of vortex penetration. At higher currents, differential resistance growth becomes more gradual, suggesting that V-aV annihilation contributes less to heating. This gradual increase aligns with the point that the larger γ enhances the material’s ability to dissipate heat while maintaining superconductivity.
Although the initial transition from the Meissner state to the resistive state is largely unaffected by variations in γ , the progression to the normal state is highly sensitive to this parameter. A local maximum in the IR curve corresponds to a dynamic vortex flow regime with increased energy dissipation. This feature is further analyzed in Section 3.2, Section 3.3 and Section 3.4 as it provides information on vortex interactions and dynamics. The ability of superconductivity to persist at higher currents for larger γ values underscores the role of γ in shaping superconducting behavior, highlighting the interplay between inelastic electron–phonon collision and vortex dynamics.
The second discontinuity in the IR curve marks the upper critical current, beyond which the superconductivity is fully suppressed, and the material transitions to the normal state. In summary, Figure 2 illustrates the significant impact of γ on the resistive state. Higher γ strengthens the superconducting phase, extending the resistive state and delaying the normal-state transition. This demonstrates the importance of γ in tuning superconducting properties, with potential implications for optimizing devices operating under quite high currents.
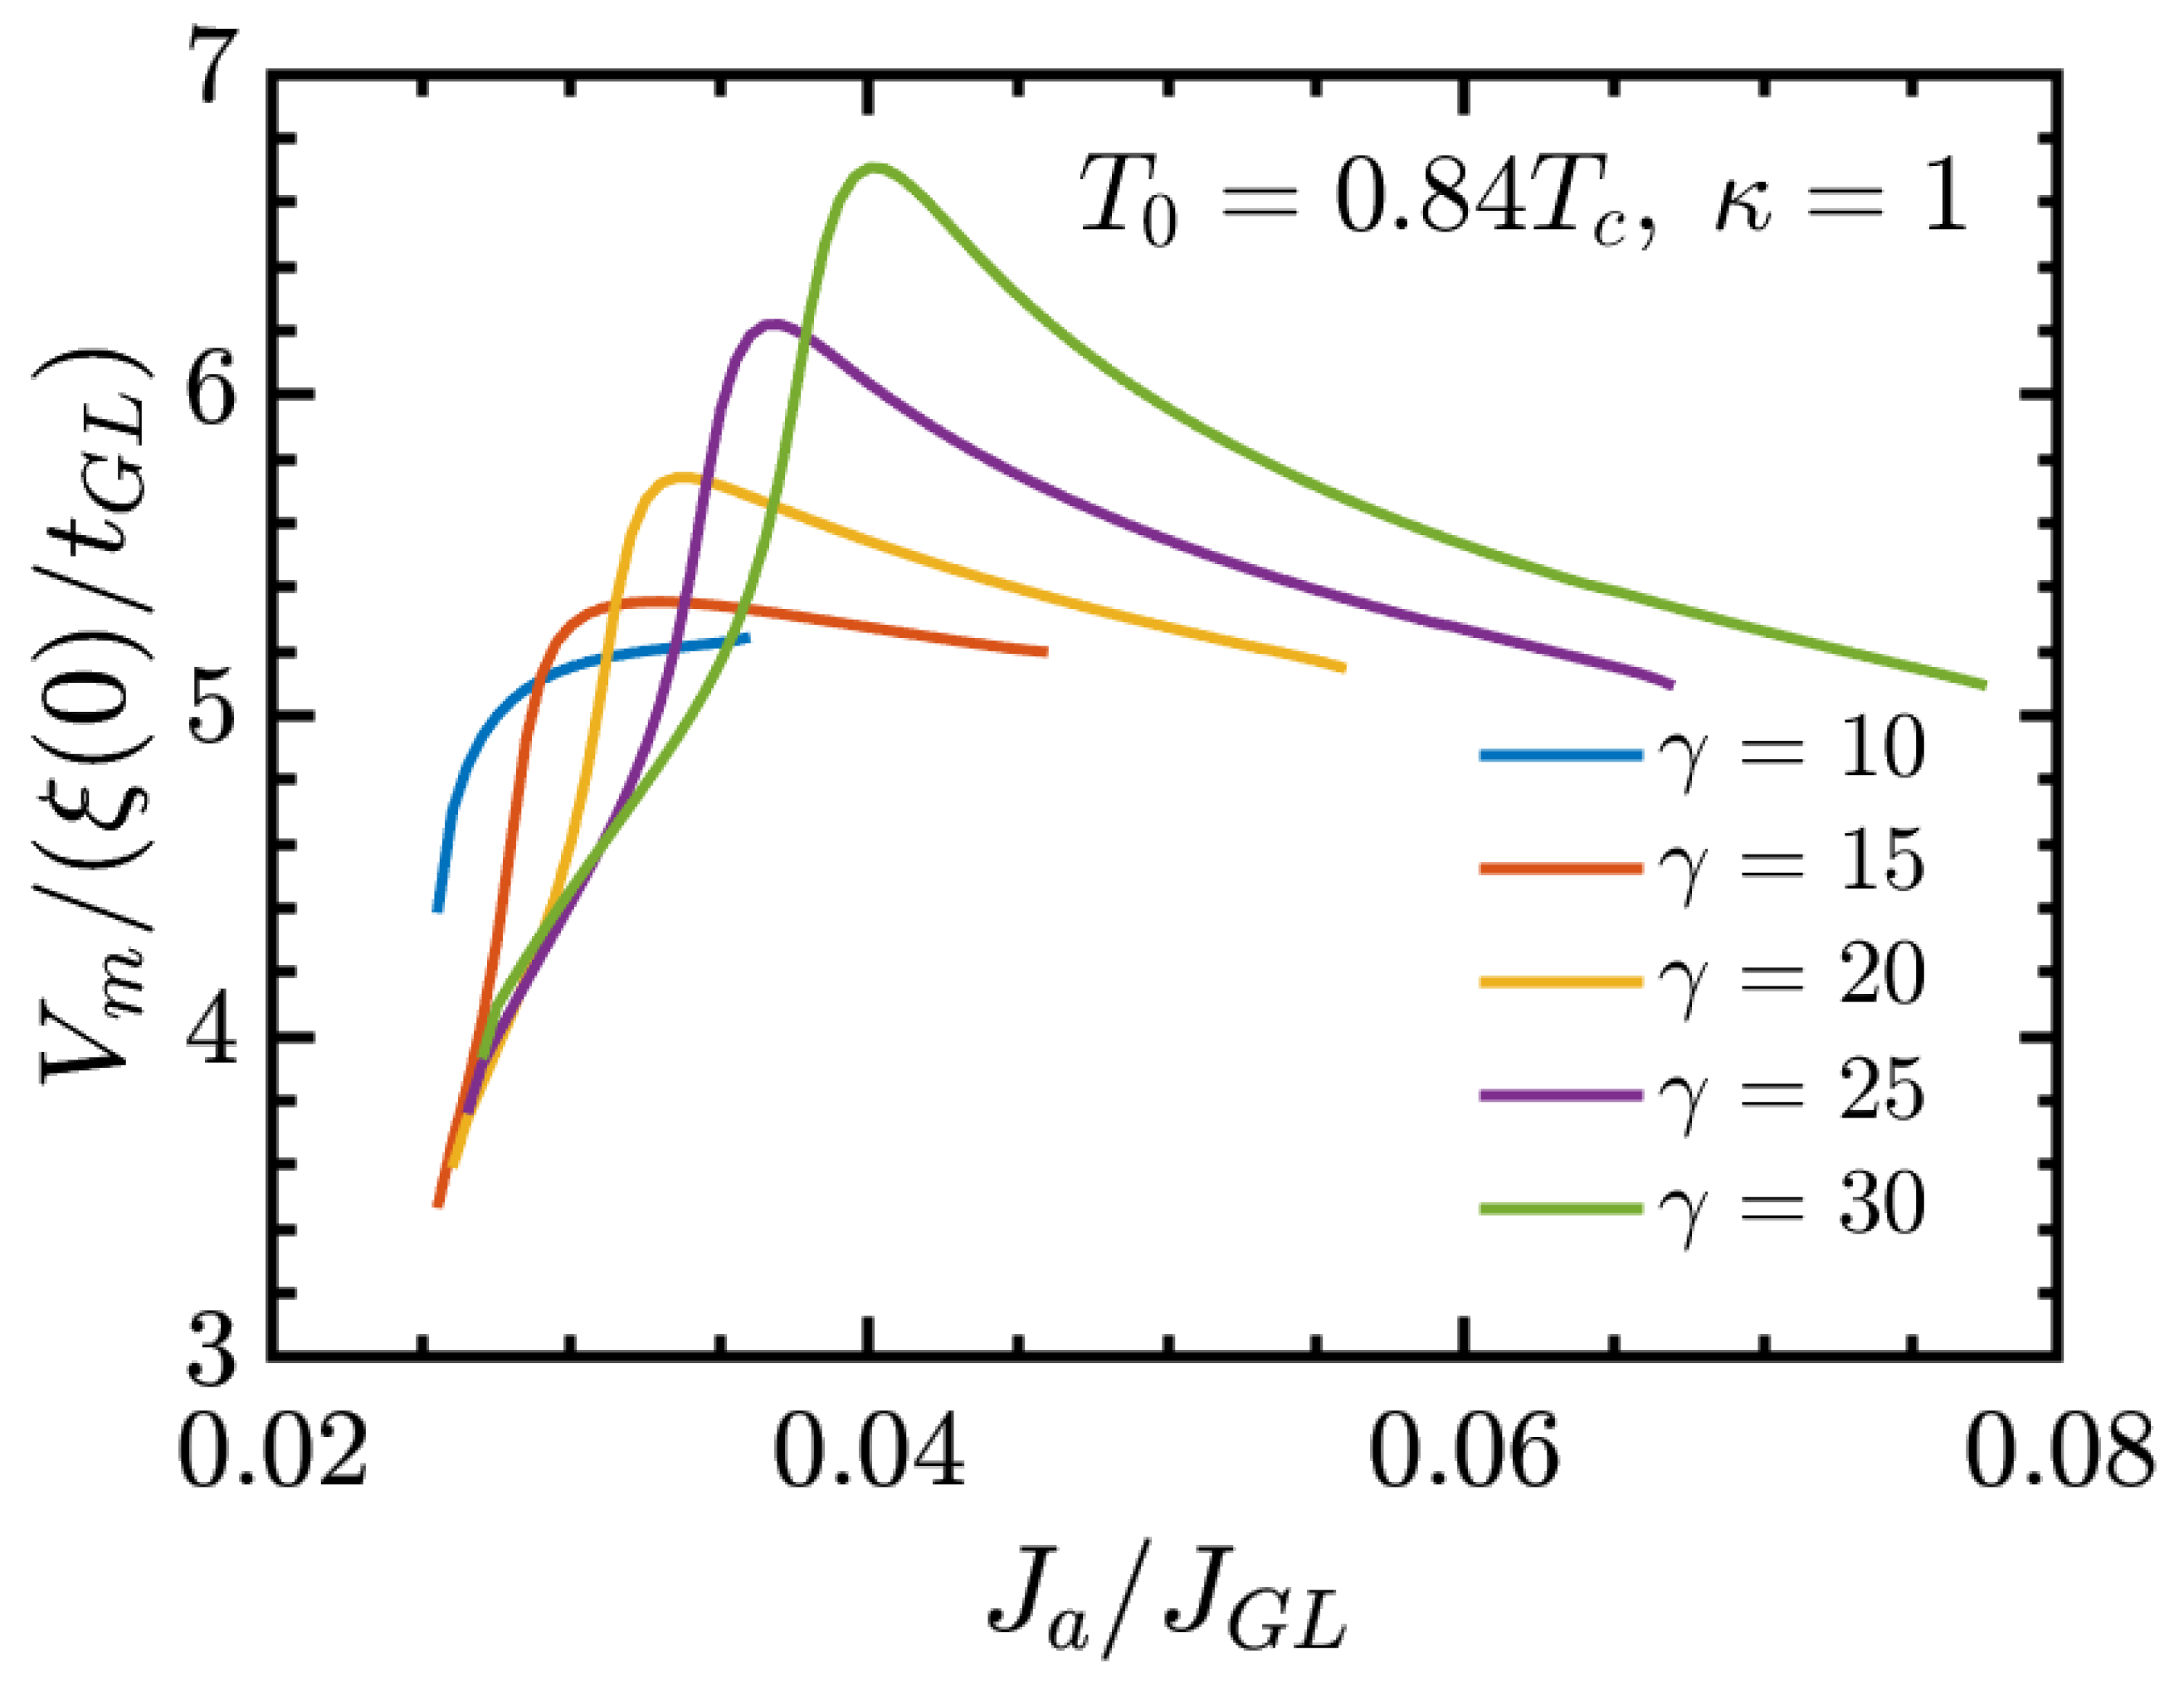
Figure 3 shows the average velocity of the V-aV pairs as a function of the applied current density for the values of γ from 10 to 30. As the parameter γ increases, the peak velocity shifts toward higher values of current density. This behavior indicates that materials with higher γ require higher current densities to reach maximum vortex–antivortex velocities. Furthermore, an increase in γ leads to an enhancement in the maximum velocity of the V-aV pairs, indicating that longer inelastic electron–phonon collision time facilitates a less dissipative and more efficient dynamic of these pairs during the resistive regime. At the same time, the maximum differential resistance decreases with increasing γ , reflecting reduced resistive responses.

3.2. Exponential Dependence of the Upper Critical Current on γ in Type II Superconductors

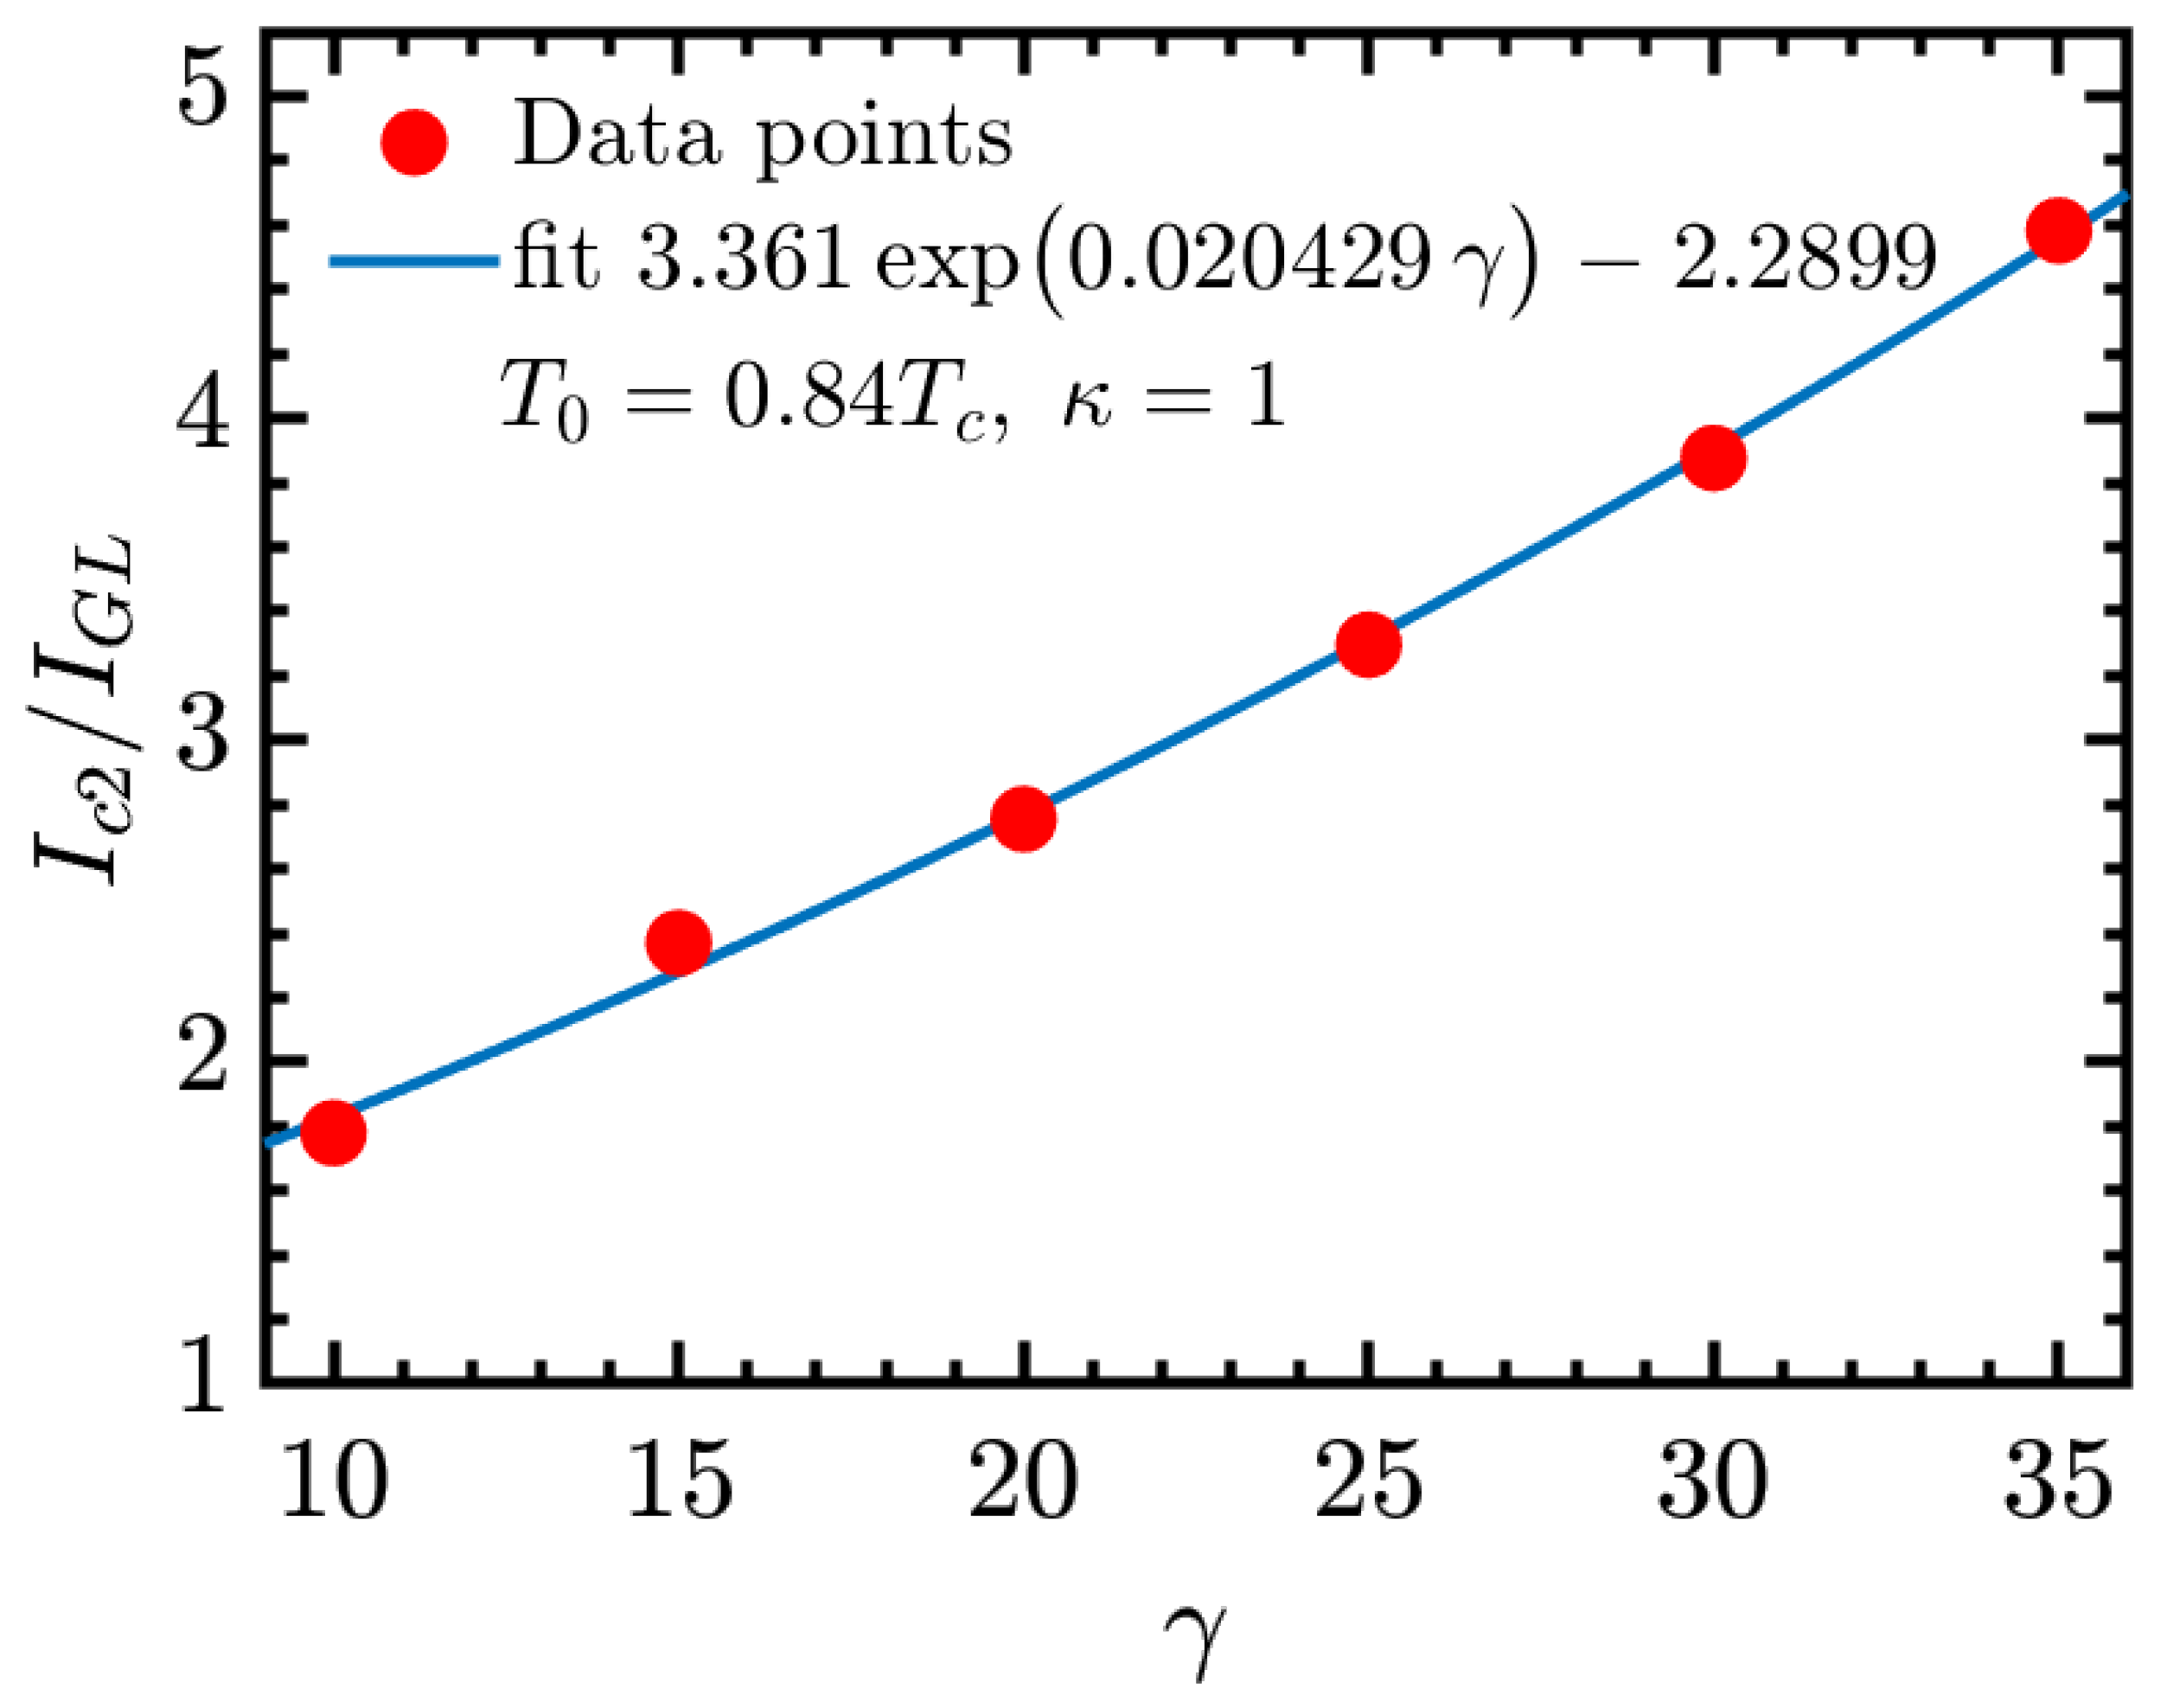
Figure 4 shows the dependence of the upper critical current I c 2 on the parameter γ , with simulation data and an exponential fit function. The fitted function indicates that I c 2 increases exponentially as γ grows. This behavior reflects the progressive enhancement of the resistive state with increasing γ .
The observed exponential growth suggests that the resistive state in the superconductor persists longer for higher values of γ . This behavior may be attributed to greater energy dissipation, driven by the interaction between the V–aV pairs and the thermal reservoir. As γ increases, the V–aV pairs remain in the system for longer periods before being reabsorbed, extending the resistive state duration. This is consistent with the theoretical framework discussed in Section 3.1 above, reinforcing the role of γ as a key parameter in the nonequilibrium dynamics of superconductors. More broadly, τ e - ph has long been recognized as a fundamental scale in nonequilibrium superconductivity, from seminal investigations [7,10,11,31] to more recent considerations in nanoscale systems [12]. Our results provide a qualitative illustration of this framework within the GTDGL model and under metallic-contact boundary conditions.
The fit is performed with a coefficient of determination R 2 = 0.99734 , indicating a an exceptionally strong agreement between the model and the data for κ = 1 . Within the accessible range of γ values explored here, the data show an approximately exponential increase of I c 2 . However, this behavior to be not extrapolated indefinitely. I c 2 is bounded by the maximum sustainable supercurrent density imposed by the boundary conditions at the metallic contacts, beyond which the exponential trend must saturate. In the simulations performed, the saturation emerges because the applied current J a injected through the contacts cannot be fully converted into supercurrent J s : the excess flows as normal current J n , so that J s never exceeds its local stability limit. In the simulations, the growth reflects reduced dissipation for larger γ as the order parameter relaxes more slowly, together with residual superconductivity quite near the sample edges due to boundary conditions. Let us emphasize that the exponential dependence is robust in the simulated interval but must eventually level off for considerably large γ , consistent with the constraints.
The parameter γ is associated with the relaxation time governing the dynamics of the V–aV pair. As γ increases, the frequency of vortex–antivortex annihilation decreases, allowing more effective heat absorption by the thermal reservoir. This prolongs the resistive state, highlighting the influence of γ on the transition between the superconducting and resistive regimes. As γ modulates the relaxation processes, it effectively controls the rate at which dissipative effects manifest in the system. These results highlight the balance between vortex dynamics and thermal interactions, providing an understanding of the mechanisms that govern resistive states in type-II superconductors.

3.3. Dependence of Maximum Differential Resistance and Critical Current Density on γ in Type II Superconductors

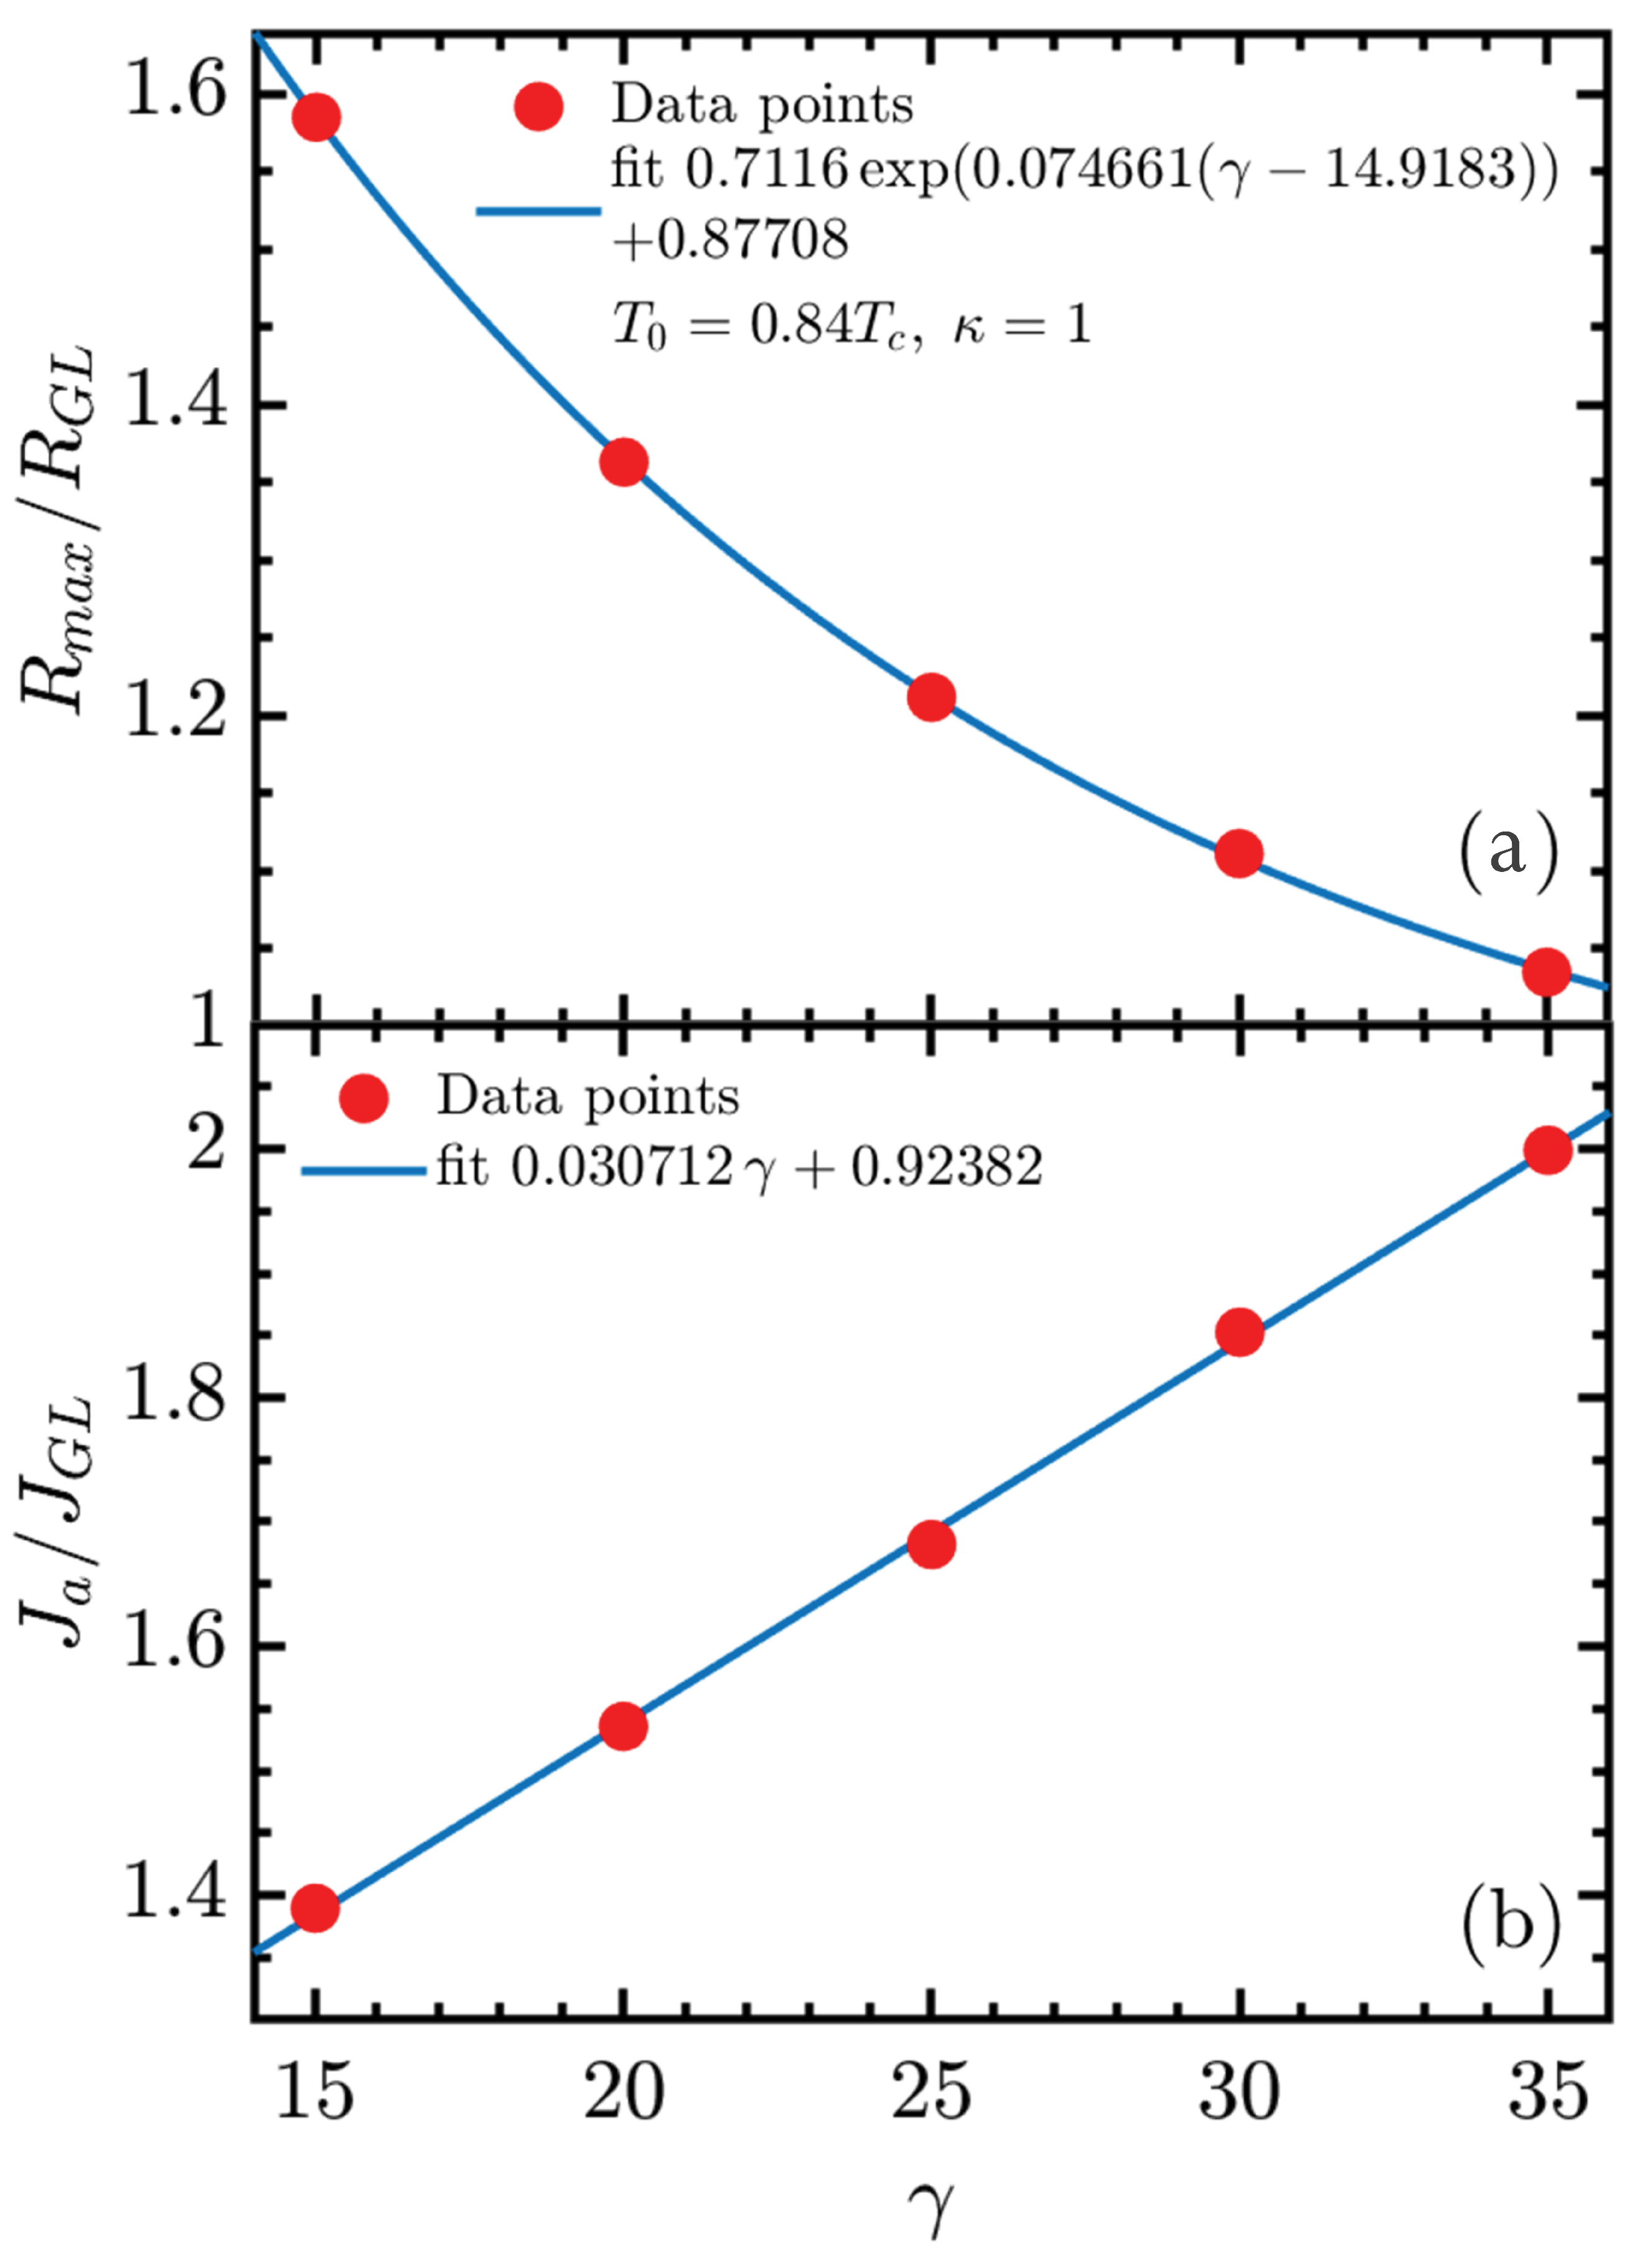
A detailed analysis of the R max values and the applied current density as functions of the parameter γ is presented in Figure 5. Figure 5a shows the relationship between R max and γ . The data exhibit an exponential decay, quite well described by the exponent fitfunction. The coefficient of determination R 2 = 0.99993 indicates an exceptionally good agreement between the model and the data. This behavior suggests that R max decreases as γ increases, consistent with reduced nonequilibrium dissipation within the GTDGL framework. Since γ τ e - ph , larger γ corresponds to slower electron–phonon energy relaxation; in GTDGL, γ chiefly controls the relaxation of the order-parameter amplitude. Thus, the exponential decay of R max reflects the less efficient generation of resistive peaks by order-parameter oscillations and vortex motion, rather than improved cooling.
As γ increases, the system transitions more smoothly to the resistive state, indicating that higher values of γ mitigate the abrupt onset of dissipation. This behavior highlights the role of γ in controlling the transition dynamics of the superconducting state.
Figure 5b demonstrates the linear γ -dependence between the applied critical current density J a / J GL , for the corresponding R max , and γ . The fit is performed with R 2 = 0.99925 , highlighting the robustness of the linear model. The linear growth obtained suggests that as γ increases, the system requires a higher applied current to reach the normal state. This behavior reflects the delayed formation of V–aV pairs, which requires higher current densities to initiate and sustain dissipation.
Now let us address Figure 6. First, let us decompose the total current I injected (ejected) through the metallic contacts into components:
I ¯ s = I s I 2 ,
I ¯ n = I n I 2 ,
where I s and I n are, respectively, the time-averaged values of the superconducting and normal currents through the central plane at x = 0 .
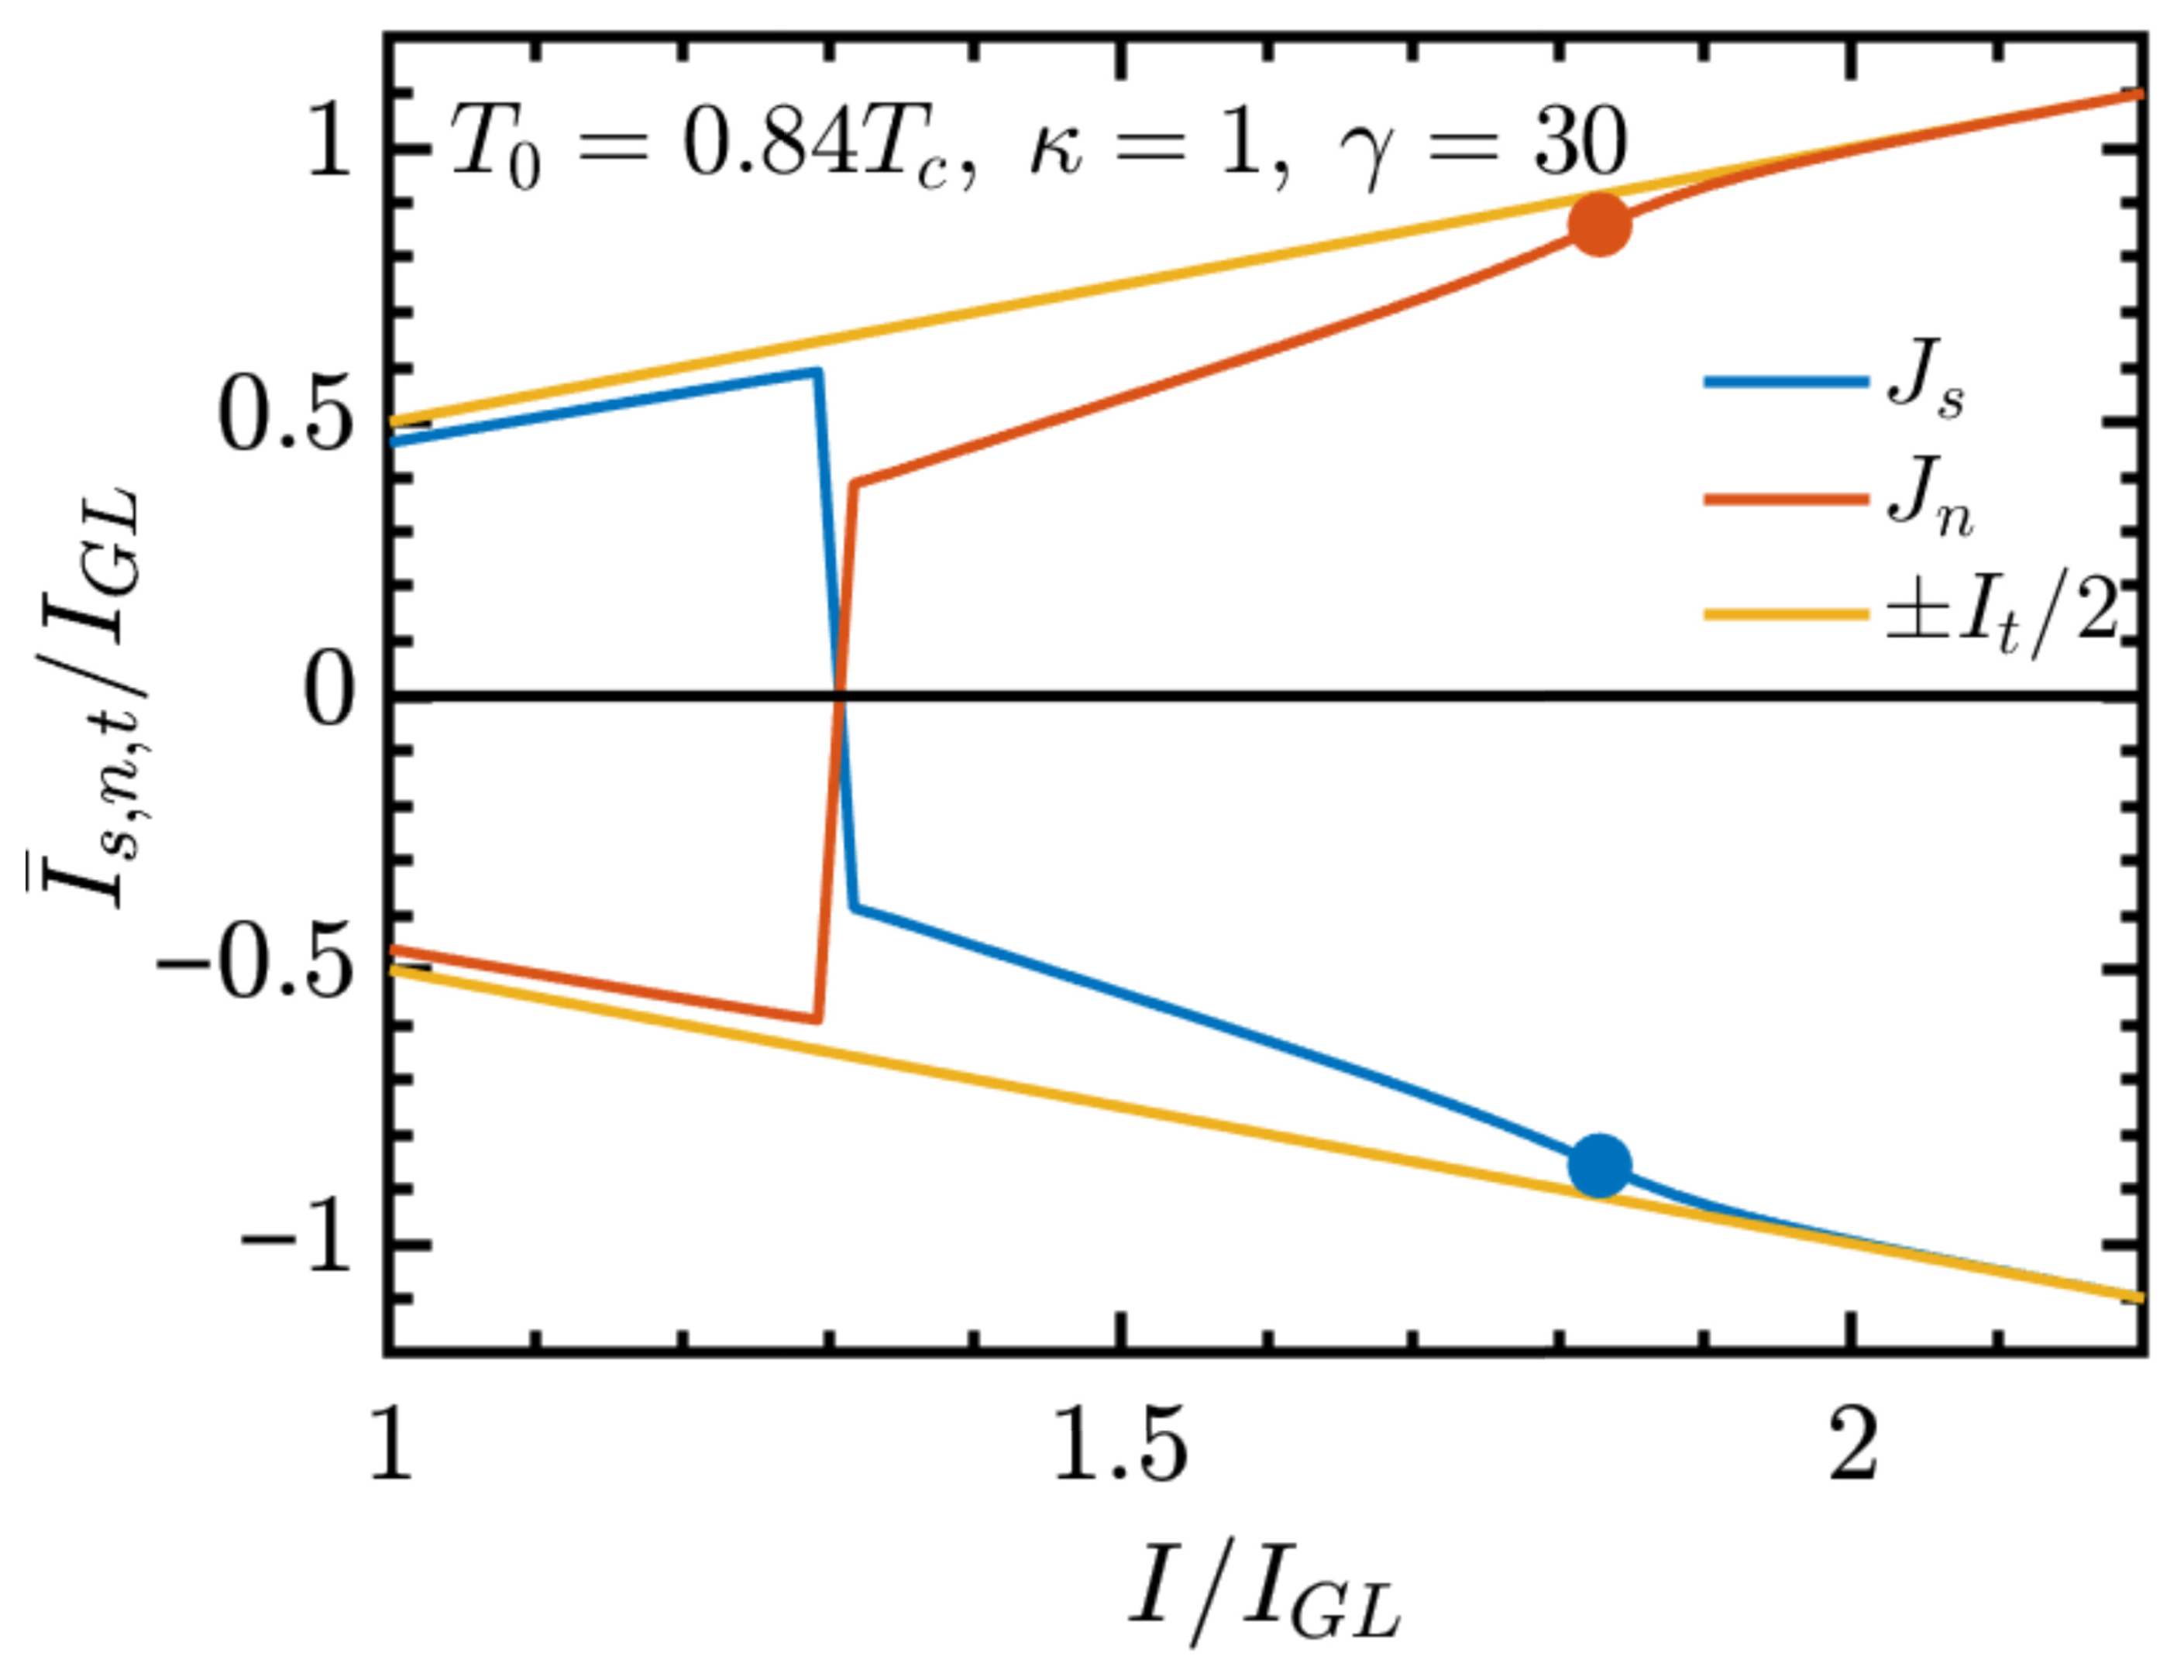
Figure 6 shows the symmetrized current components I ¯ s and I ¯ n , normalized by the characteristic current I GL . These centered components represent the deviations of the superconducting and normal currents from an equal partitioning of the total current. The yellow indicate the straight lines ± I / 2 , and are shown for reference to highlight the symmetric nature of the redistribution. As expected from the construction, I ¯ s + I ¯ n = 0 ( I s + I n = 1 ), and their respective curves are exceptionally antisymmetric with respect to the horizontal axis. As can be seen, the plot reveals a nontrivial current redistribution mechanism characterized by a sharp transition in I ¯ s and I ¯ n , indicating a sudden change in the transport regime.
The two points highlighted in Figure 6 indicate the inflection points of both I ¯ s , n curves. Reference [5], which assumes that the properties of the system are invariant along the z-direction, argues that the inflection points are closely related to the maximum value of the differential resistance. The present results therefore indicate that this behavior is not dependent on dimensionality.
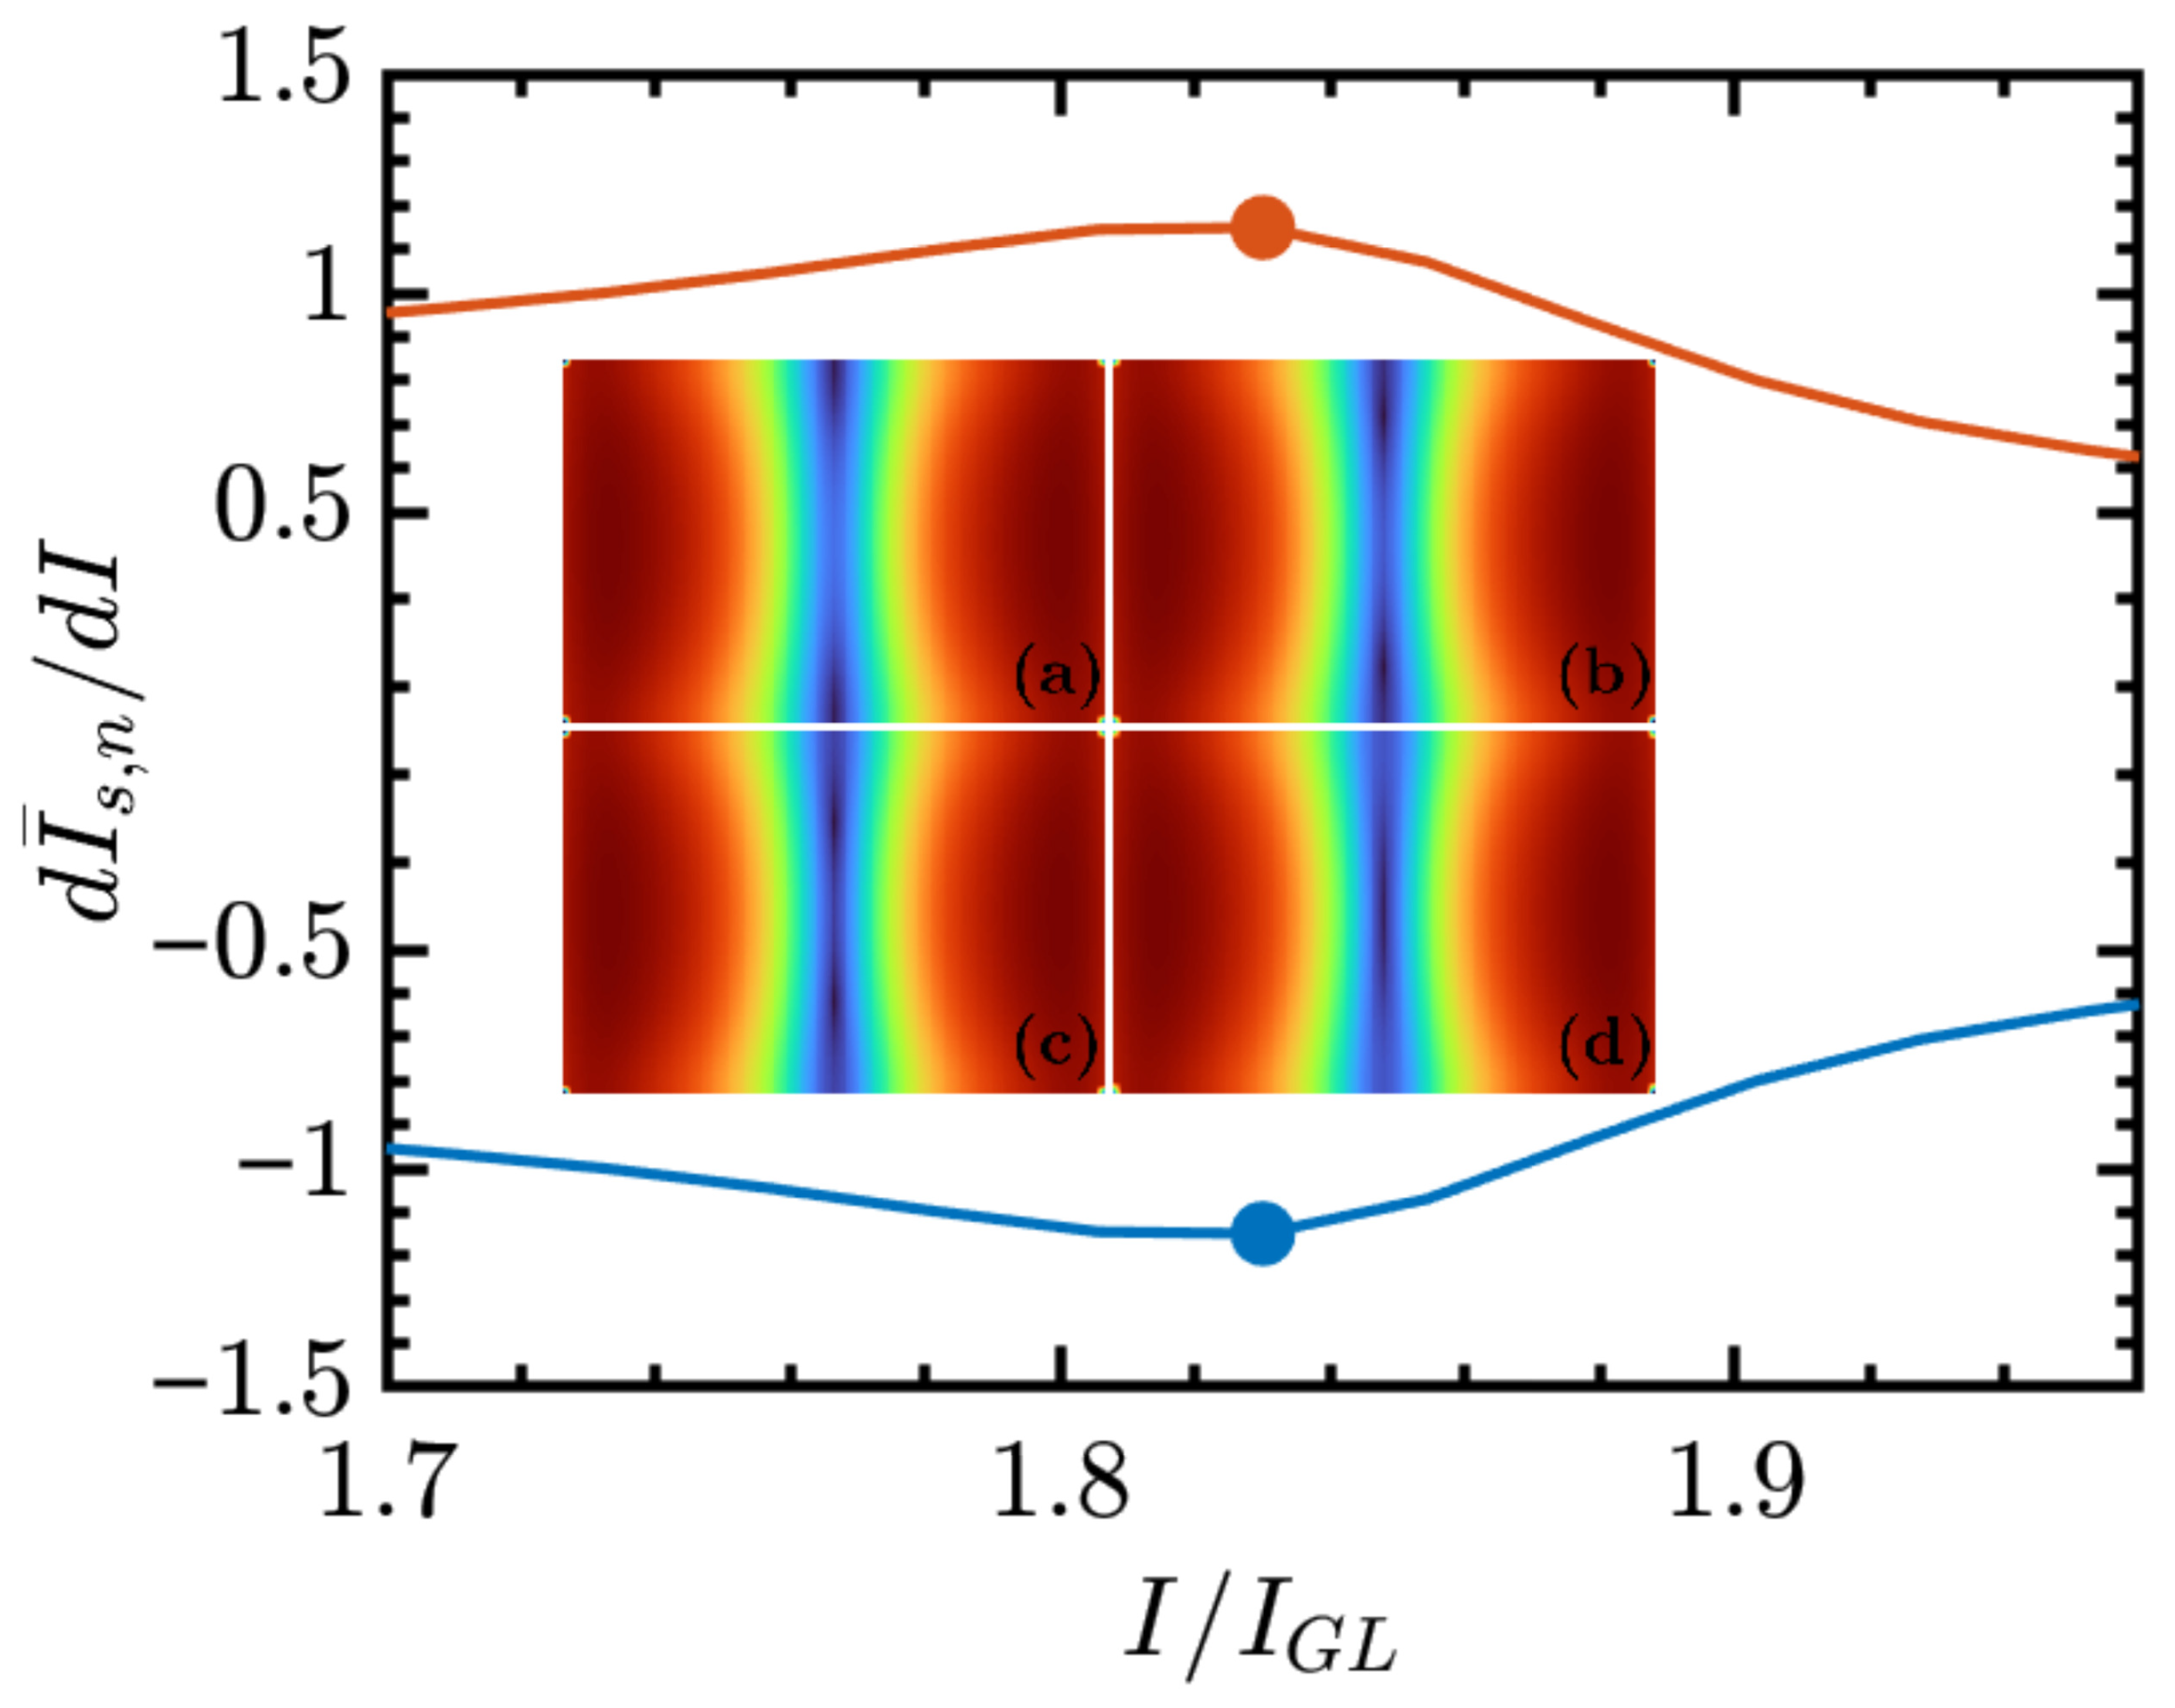
Next, to better understand Figure 6, we plot in Figure 7 the derivatives of the superconducting and normal current components with respect to the applied current, d I ¯ s , n / d I , which quantify the sensitivity of each current channel to variations in I. The subtraction of 0.5 centers the derivatives around zero, facilitating the comparison of deviations from an ideal equal-sharing scenario, that is, d I ¯ s , n / d I = 0 ( d I s , n / d I = 0.5), when the system does share the current equally. The inflection points (colored dots) signal on critical regions where the system undergoes abrupt changes in current distribution. These features are closely tied to the underlying vortex dynamics that govern the nonuniform behavior of the superconducting state.
To illustrate these dynamics, four snapshots (Figure 7a–d) of the modulus of the superconducting order parameter in the z = 0 plane. These frames capture the evolution of a vortex–antivortex pair, from its nucleation at the sample boundaries to its annihilation at the center. This space and time evolution behavior is closely correlated with the inflection regions observed in both the I s , n curves and their derivatives. The annihilation of vortex structures leads to abrupt rearrangements in the current flow, offering an interpretation of the observed symmetry and structure in the centered current components. From this point on, the vortex street becomes larger until the superconductivity is destroyed in the pads.

3.4. Comparative Analyses of Resistance Current Density for Different Values of κ

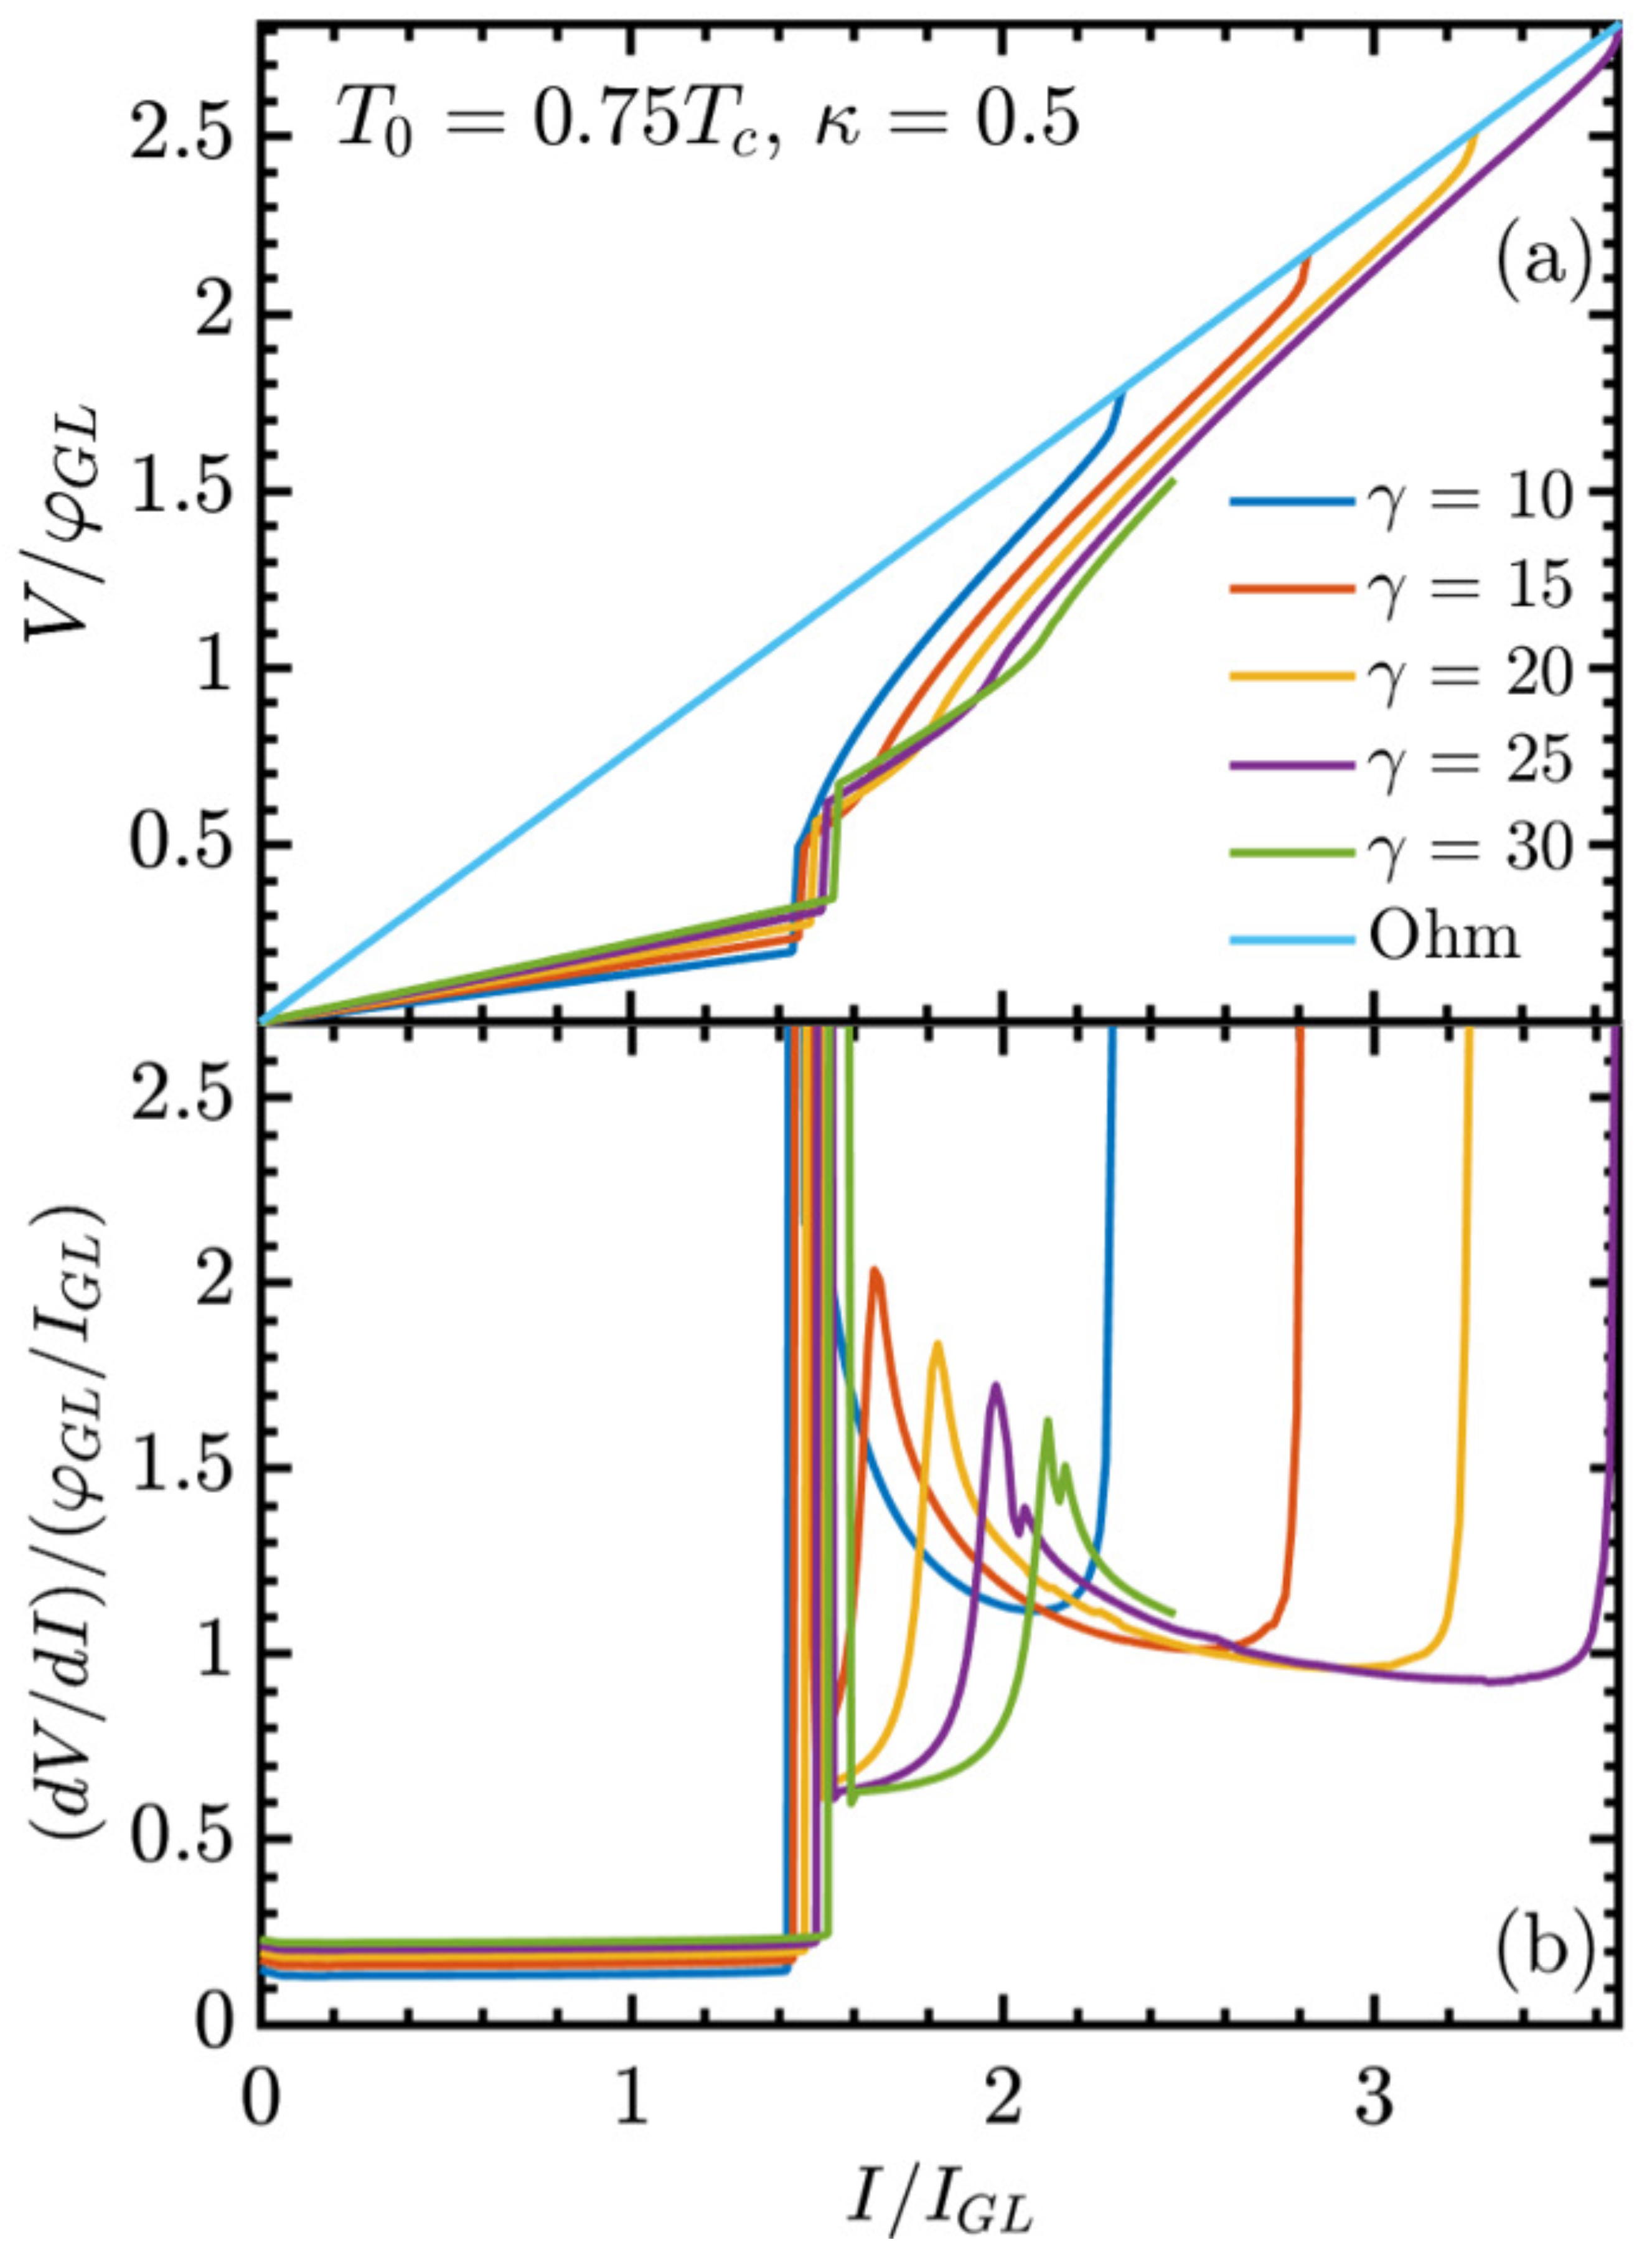
To investigate the behavior of local maxima in the IR curve, the same procedure was applied for κ = 0.5 , superconductor. The characteristics IV (Figure 8a) and IR (Figure 8b) exhibit behavior similar to that observed for κ = 1 (Figure 2), except an adjacent peak near the maxima as identified for k = 0.5 case.
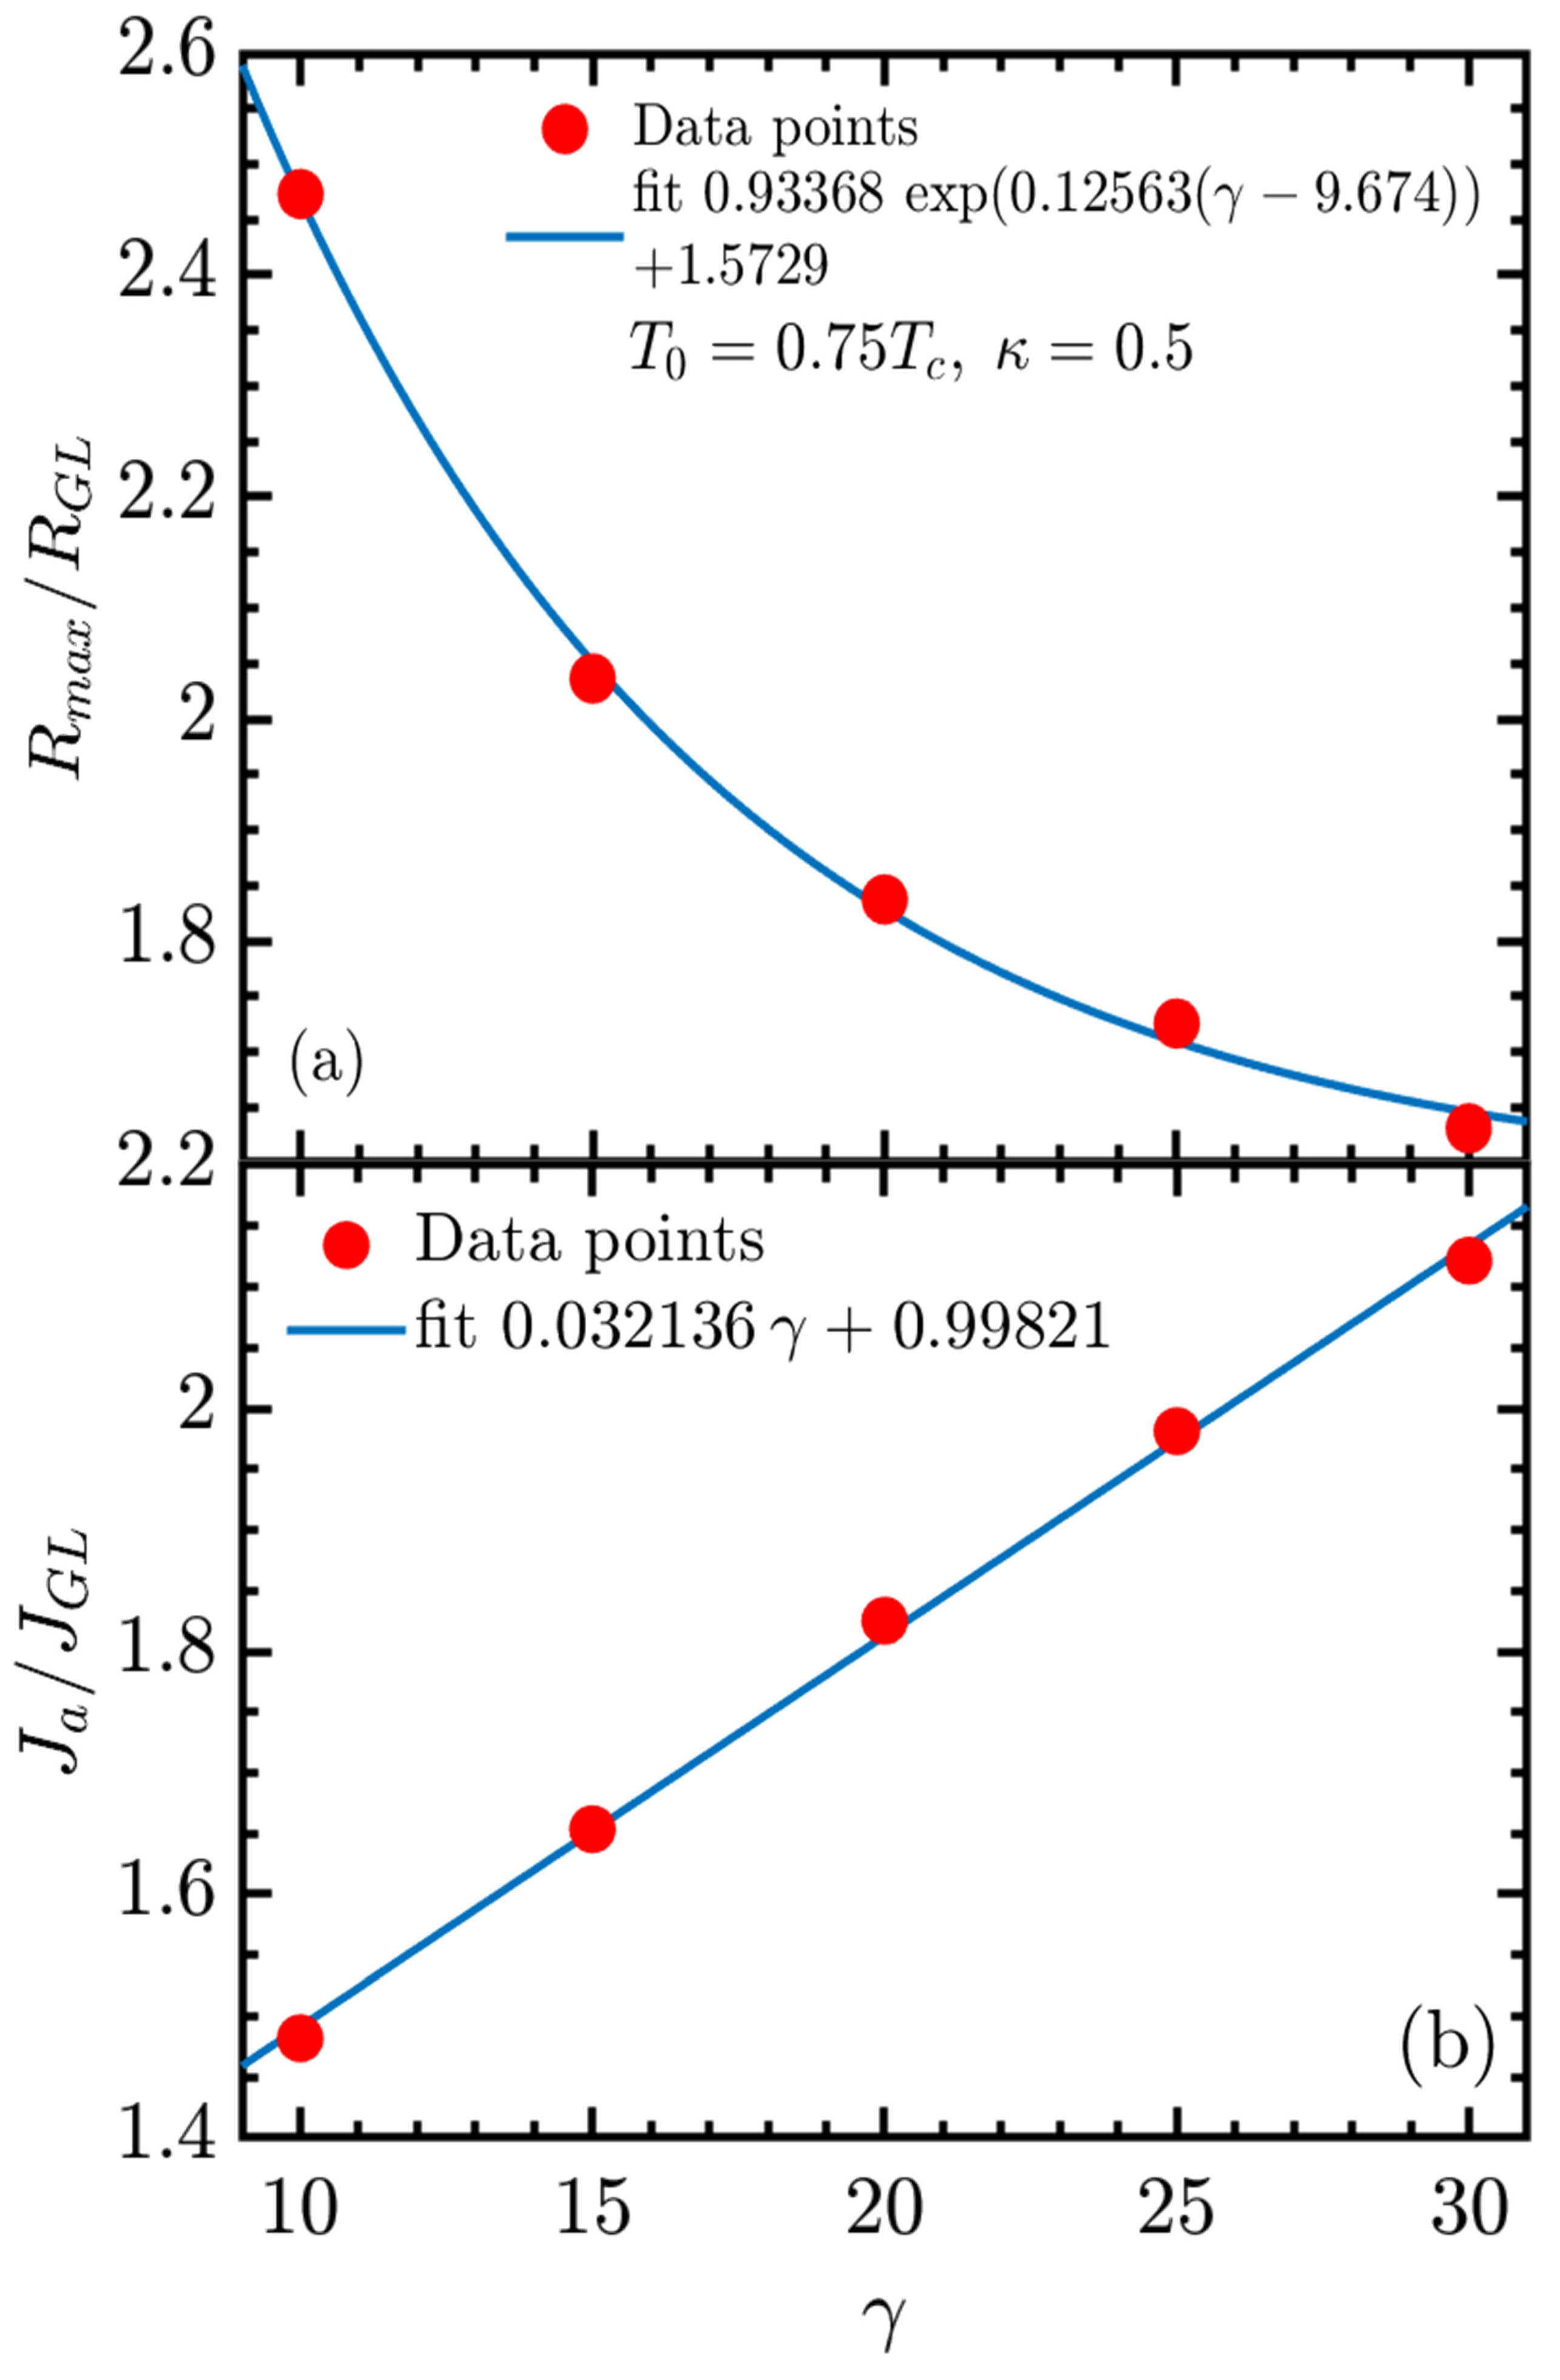
Figure 9 examines the maximum resistance and applied current density as functions of γ for κ = 0.5 . Figure 9a demonstartes the exponential decay of the maximum resistance following the onset of the resistive state. The fit resuts in R 2 = 0.99993 . This decay indicates a decrease in the resistive response as γ increases, reflecting a systematic reduction in R max .
Figure 9b demonstrates the linear relationship between the applied current density J a / J GL and γ . The linear fit is performed with R 2 = 0.99821 , demonstrating exceptionally good agreement with the data. The linear growth in the applied current density aligns closely with the behavior observed for κ = 1 ; see Figure 5b. The results indicate that the role of γ in controlling the resistive response is robust across different values of κ .
Within the accessible parameter range, the data exhibit an approximately exponential increase of I c 2 with γ , reflecting the suppression of dissipation as the order parameter relaxes more slowly. This not to be interpreted as a universal law: in real superconductors, I c 2 is ultimately bounded by the local superconducting transport limits determined by the contact geometry and boundary conditions, so the exponential trend must eventually saturate. The simulations performed do not access this saturation regime because realistic values of γ (up to O ( 10 3 ) in some materials) are computationally prohibitive in fully three-dimensional geometries. Thus, the exponential dependence reported here should be regarded as a numerical trend that clarifies the qualitative influence of γ , rather than a direct prediction of experimental results.
The results suggest a smooth evolution in superconducting properties, as κ varies from 0.5 to 1. The linear growth observed in the current density and the exponential decay of the resistance maxima indicate that the system’s response to increasing γ is consistent across both κ values used. Although κ = 0.5 would correspond to a bulk type-I superconductor (which does not sustain stable vortices), our confined 3D geometry modifies the effective magnetic screening. In thin samples with thickness d λ , ξ , the relevant penetration depth becomes Λ = λ 2 / d so that the effective GL parameter reads κ eff = Λ / ξ . This effective parameter can exceed 1 / 2 even when the bulk κ is below the type-I/II threshold. As a consequence, vortex-like excitations and dissipative features typical of type-II superconductivity emerge, explaining why the resistive responses in Figure 8 and Figure 9 ( κ = 0.5 ) closely resemble those of Figure 2, Figure 3, Figure 4, Figure 5, Figure 6 and Figure 7 ( κ = 1 ). This crossover effect has also been demonstrated in Ref. [30]. Although the case with κ = 0.5 would correspond to a bulk type-I superconductor, the confined 3D geometry alters the screening properties in such a way that the effective Ginzburg–Landau parameter κ eff can drive the system into a regime with type-II-like signatures. This explains why the IV and IR characteristics obtained for κ = 0.5 (Figure 8, T 0 = 0.75 T c ) share qualitative similarities with those for κ = 1 (Figure 2, T 0 = 0.84 T c ). However, these regimes are not equivalent: for κ = 0.5 , the IR curve shows an additional secondary peak near the principal maximum, which is absent when κ = 1 . Moreover, the fitting parameters extracted from the exponential decay of R max ( γ ) and from the linear increase in the current density at the IR maximum exhibit systematic differences between the two values of κ . For instance, the slope of the linear relation is slightly higher for κ = 0.5 , and the intercept is also shifted compared to κ = 1 . These quantitative distinctions demonstrate that the resemblance of the curves originates from the mesoscopic crossover governed by κ eff , while maintaining measurable differences that separate the weak type-II case from the confined type-I system.
Notice that, for larger values of γ , the differential resistance exhibits an adjacent maximum, a feature that is not observed in 2D superconductors. The simulations we performed indicate that these peaks arise from dynamical regimes where vortex–antivortex motion and oscillations of the order parameter are strongly excited before the complete transition to the normal state. Similar features have been discussed in the literature in connection with vortex–antivortex dynamics, phase–slip centers, and condensate instabilities [2,3,4]. While the precise microscopic mechanism underlying these peaks may vary, their systematic decay with increasing γ observed here highlights their robustness as a manifestation of vortex-driven dissipation.

4. Conclusions

In conclusion, this study investigated the influence of the inelastic electron–phonon collision time ( τ e - ph ) on the resistive state of 3D superconducting materials. By analyzing the behavior of the IV and IR characteristic curves for different values of the material-dependent parameter γ , we demonstrated that the resistive state is strongly affected by variations in τ e - ph . Specifically, longer inelastic electron–phonon collision time results in enhanced superconducting stability, i.e., within the simulations we performed: (i) higher I c 1 and I c 2 over the explored γ range, (ii) suppression of vortex-induced dissipation, evidenced by the decay of R max , and (iii) an extended metastable resistive regime prior to the normal transition, delaying the transition to the normal state and significantly modifying the vortex dynamics.
Furthermore, the results obtained here show that the correlation between R max and the inflection points of the IV characteristics highlights the interplay between the superconducting and resistive states. As γ increases, the resistive state expands, contributing to the overall stability of the superconducting phase. Further investigation into resonance phenomena and V–aV pair dynamics may offer deeper insight into the mechanisms driving the transition between superconducting regimes. A Complementary Figure S1 and an animation illustrating vortex–antivortex dynamics for different γ values are provided in the Supplementary Material, offering additional qualitative support to these discussions.
Finally, beyond the methodological aspects, the present results also carry implications for the design of superconducting devices. The simulations performed within the GTDGL framework show that longer quasiparticle relaxation times (then, larger γ s) delay the current-induced transition to the normal state and suppress dissipative peaks in the differential resistance. These features point to enhanced robustness of the superconducting state under dynamic operating conditions. Although our study made here remains phenomenological and not tailored to a specific material, the trends identified here provide qualitative guidelines that may inform strategies for improving the stability of superconducting devices, while more microscopic or experimental studies would be needed to establish direct quantitative predictions.
In addition, the comparison between κ = 1 and κ = 0.5 emphasizes that mesoscopic confinement can drive a bulk type-I material into an effective type-II–like regime. This crossover explains the qualitative resemblance between their IV/IR curves, while quantitative differences, such as the emergence of a secondary peak in the IR response and distinct fitting parameters, reveal measurable shifts in the dissipative dynamics. These findings reinforce the robustness of the resistive state and underline the relevance of effective κ eff when assessing the stability of confined superconductors.

Supplementary Materials

The following supporting information can be downloaded at: https://www.mdpi.com/article/10.3390/physics7040061/s1, Figure S1: Superconducting order parameter along the transversal x = 0 plane for several values of the constant γ , which is related to the inelastic electron-collision time (see left column of panels (a) to (e)). In the same plane, the right column of the panels, the corresponding temperature distributions are plotted. Figures (a) to (e) correspond to the values γ = 10 , γ = 15 , γ = 20 , γ = 25 , and γ = 30 , respectively. The maximum value of the order parameter represents a state of more robust superconductivity, while | ψ | = 0 indicates that the superconductivity is completely destroyed. Video S1: Dynamics of Vortex–Antivortex Pair and Temperature Profile for γ = 30 .

Author Contributions

Conceptualization, methodology, L.V.d.T.; software, L.R.C. and E.S.; validation, L.R.C. and E.S.; formal analysis, L.V.d.T. and B.J.d.C.M.; investigation, L.R.C.; resources, E.S.; writing—original draft preparation, L.V.d.T. and B.J.d.C.M.; writing—review & editing, L.V.d.T., L.R.C. and E.S.; supervision, E.S.; project administration, E.S.; funding acquisition, E.S. All authors have read and agreed to the published version of the manuscript.

Funding

This research was funded by the Coordenação de Aperfeiçoamento de Pessoal de Nível Superior (CAPES), Brazil, and Brazilian Agency Fundação de Amparo a Pesquisa do Estado de São Paulo (FAPESP), grant numbers 8887.000088/2024-00 (CAPES), 23/14604-7 (FAPESP), 20/03947-2 (FAPESP), 20/10058-0 (FAPESP).

Data Availability Statement

Data will be provided upon request.

Conflicts of Interest

The authors declare no conflicts of interest.

References

  1. Berdiyorov, G.R.; Miločević, M.V.; Peeters, F.M. Kinematic vortex–antivortex lines in strongly driven superconducting stripes. Phys. Rev. B 2009, 79, 184506. [Google Scholar] [CrossRef]
  2. Berdiyorov, G.; Harrabi, K.; Oktasendra, F.; Gasmi, K.; Mansour, A.I.; Maneval, J.-P.; Peeters, F.M. Dynamics of current-driven phase-slip centers in superconducting strips. Phys. Rev. B 2014, 90, 054506. [Google Scholar] [CrossRef]
  3. Andronov, A.; Gordion, I.; Kurin, V.; Nefedov, I.; Shereshevsky, I. Kinematic vortices and phase slip lines in the dynamics of the resistive state of narrow superconductive thin-film channels. Physica C 1993, 213, 193–199. [Google Scholar] [CrossRef]
  4. Sivakov, A.G.; Glukhov, A.M.; Omelyanchouk, A.N.; Koval, Y.; Müller, P.; Ustinov, A.V. Josephson behavior of phase-slip lines in wide superconducting strips. Phys. Rev. Lett. 2003, 91, 267001. [Google Scholar] [CrossRef] [PubMed]
  5. Cadorim, L.R.; de Oliveira Junior, A.; Sardella, E. Ultra-fast kinematic vortices in mesoscopic superconductors: The effect of the self-field. Sci. Rep. 2020, 10, 18662. [Google Scholar] [CrossRef] [PubMed]
  6. Reizer, M.Y.; Sergeev, A.V. Electron–phonon interaction in impure metals and superconductors. Zh. Eksp. Teor. Fiz. 1986, 90, 1056–1070. (In Russian); English translation: Sov. Phys. JETP 1986, 63, 616–624. Available online: http://www.jetp.ras.ru/cgi-bin/e/index/e/65/6/p1291?a=list (accessed on 15 October 2025).
  7. Kopnin, N.B. Theory of Nonequilibrium Superconductivity; Oxford University Press Inc.: New York, NY, USA, 2001. [Google Scholar] [CrossRef]
  8. Kopnin, N.B. Vortex dynamics and mutual friction in superconductors and Fermi superfluids. Rep. Prog. Phys. 2002, 65, 1633–1678. [Google Scholar] [CrossRef]
  9. Eliashberg, G.M. Inelastic electron collisions and nonequilibrium stationary states in superconductors. Zh. Eksp. Teor. Fiz. 1972, 34, 1254–1272. (In Russian). Sov. Phys. JETP 1972, 34, 668–676. Available online: http://jetp.ras.ru/cgi-bin/e/index/e/34/3/p668?a=list (accessed on 15 October 2025).
  10. Larkin, A.I.; Ovchinnikov, Y.N. Nonlinear conductivity of superconductors in the mixed state. Zh. Eksp. Teor. Fiz. 1975, 68, 1915–1927. (In Russian); English translation: Sov. Phys. JETP 1975, 41, 960–965. Available online: http://jetp.ras.ru/cgi-bin/e/index/e/41/5/p960?a=list (accessed on 15 October 2025).
  11. Schmid, A.; Schön, G. Linearized kinetic equations and relaxation processes of a superconductor near Tc. J. Low Temp. Phys. 1975, 20, 207–227. [Google Scholar] [CrossRef]
  12. Croitoru, M.D.; Shanenko, A.A.; Vagov, A.; Milošević, M.V.; Axt, V.M.; Peeters, F.M. Phonon limited superconducting correlations in metallic nanograins. Sci. Rep. 2015, 5, 16515. [Google Scholar] [CrossRef] [PubMed]
  13. Reizer, M.Y. Electron-phonon relaxation in pure metals and superconductors at very low temperatures. Phys. Rev. B 1989, 40, 5411–5416. [Google Scholar] [CrossRef]
  14. Gor’kov, L.P.; Kopnin, N.B. Viscous vortex flow in superconductors with paramagnetic impurities. Zh. Eksp. Teor. Fiz. 1971, 60, 2331–2343. (In Russian); English translation: Sov. Phys. JETP 1971, 33, 1251–1256. Available online: http://jetp.ras.ru/cgi-bin/e/index/e/33/6/p1251?a=list (accessed on 15 October 2025).
  15. Kupriyanov, M.Y.; Likharev, K.K. Viscous motion of vortices in type-II superconductors. Pis’ma ZhETF 1972, 15, 349–353. (In Russian); English translation: Sov. Phys. JETP Lett. 1972, 15, 247–250. Available online: http://jetpletters.ru/ps/1748/article_26589.shtml (accessed on 15 October 2025).
  16. Kramer, L.; Watts-Tobin, R.J. Theory of dissipative current-carrying states in superconducting filaments. Phys. Rev. Lett. 1978, 40, 1041–1044. [Google Scholar] [CrossRef]
  17. Vodolazov, D.Y.; Peeters, F.M.; Morelle, M.; Moshchalkov, V.V. Masking effect of heat dissipation on the current–voltage characteristics of a Mmsoscopic superconducting sample with leads. Phys. Rev. B 2005, 71, 184502. [Google Scholar] [CrossRef]
  18. Duarte, E.C.S.; Sardella, E.; Saraiva, T.T.; Vasenko, A.S.; Zadorosny, R. Comparing energy dissipation mechanisms within the vortex dynamics of gap and gapless nano-sized superconductors. arXiv 2022, arXiv:2209.11547. [Google Scholar] [CrossRef]
  19. Bezuglyĭ, A.I.; Shklovskiĭ, V.A. The kinetics of low-temperature electron–phonon relaxation in a metallic film following instantaneous heating of the electrons. Zh. Éksp. Teor. Fiz. 1997, 111, 2106–2133. (In Russian); English translation: J. Exp. Theor. Phys. (JETP) 1997, 84, 1149–1163 [Google Scholar] [CrossRef]
  20. Gedik, N.; Yang, D.-S.; Logvenov, G.; Bozovic, I.; Zewail, A.H. Nonequilibrium phase transitions in cuprates observed by ultrafast electron crystallography. Science 2007, 316, 425–429. [Google Scholar] [CrossRef] [PubMed]
  21. Beck, M.; Klammer, M.; Lang, S.; Leiderer, P.; Kabanov, V.V.; Gol’tsman, G.N.; Demsar, J. Energy-gap dynamics of superconducting NbN thin films studied by time-resolved terahertz spectroscopy. Phys. Rev. Lett. 2011, 107, 177007. [Google Scholar] [CrossRef]
  22. Paglione, J.; Greene, R.L. High-temperature superconductivity in iron-based materials. Nat. Phys. 2010, 6, 645–658. [Google Scholar] [CrossRef]
  23. Hosono, H.; Yamamoto, A.; Hiramatsu, H.; Ma, Y. Recent advances in iron-based superconductors toward applications. Mater. Today 2018, 21, 278–302. [Google Scholar] [CrossRef]
  24. Cadorim, L.R.; de Toledo, L.V.; Ortiz, W.A.; Berger, J.; Sardella, E. Closed vortex state in three-dimensional mesoscopic superconducting films under an applied transport current. Phys. Rev. B 2023, 107, 094515. [Google Scholar] [CrossRef]
  25. Cadorim, L.R.; de Toledo, L.V.; Sardella, E. Describing heat dissipation in the resistive state of three-dimensional superconductors. Physica C 2024, 622, 1354531. [Google Scholar] [CrossRef]
  26. Watts-Tobin, R.J.; Krähenbühl, Y.; Kramer, L. Nonequilibrium theory of dirty, current-carrying superconductors: Phase-slip sscillators in narrow filaments near Tc. J. Low Temp. Phys. 1981, 42, 459–501. [Google Scholar] [CrossRef]
  27. Schmid, A. A Time Dependent Ginzburg–Landau equation and its application to the problem of resistivity in the mixed state. Phys. Kondens. Mater. 1966, 5, 302–317. [Google Scholar] [CrossRef]
  28. Duarte, E.C.S.; Sardella, E.; Ortiz, W.A.; Zadorosny, R. Dynamics and heat diffusion of Abrikosov’s vortex–antivortex pairs during an annihilation process. J. Phys. Condens. Matter 2017, 29, 405605. [Google Scholar] [CrossRef]
  29. Gropp, W.D.; Kaper, H.G.; Leaf, G.K.; Levine, D.M.; Palumbo, M.; Vinokur, V.M. Numerical simulation of vortex dynamics in type-II superconductors. J. Comput. Phys. 1996, 123, 254–266. [Google Scholar] [CrossRef]
  30. Cadorim, L.R.; de Oliveira Calsolari, T.; Zadorosny, R.; Sardella, E. Crossover from type-I to type-II regime of mesoscopic superconductors of the first group. J. Phys. Condens. Matter 2019, 32, 095304. [Google Scholar] [CrossRef]
  31. Éliashberg, G.M. Interactions between electrons and lattice vibrations in a superconductor. Zh. Eksp. Teor. Fiz. 1960, 38, 966–976. (In Russian); English translation: Sov. Phys. JETP 1960, 11, 696–702. Available online: http://jetp.ras.ru/cgi-bin/e/index/e/11/3/p696?a=list (accessed on 15 October 2025).
Figure 1. Schematic view of a superconducting film (blue) with dimensions l x , l y and l y as indicated. The red regions indicate metallic contacts through which a constant current density J a is injected (ejected) into the superconductor, similar to an normal metal–supercondictor–normal metal junction. All these elements are placed on top of a substrate (green). A red horizontal arrow indicates the direction of the applied current density J a along the x ^ axis. The black vertical arrows for the magnetic field h at the two opposite edges are intentionally drawn in opposite directions, representing the current-induced magnetic field according to Ampère’s law. The red circular arrows indicate the supercoducting current J s direction.
Physics 07 00061 g001
Figure 2. (a) Characteristic current–voltage curves of a superconducting material for various values of the material-dependent parameter γ and the Ohm’s law as indicated. The inset shows a magnified zoomed-in view of the onset of the resistive state. (b) The respective differential resistance as a function of the applied current. The bath temperature and the Ginzburg–Landau parameter are set to T 0 = 0.84 T c and κ = 1 , respectively.
Physics 07 00061 g002
Figure 3. Average velocity of vortex–antivortex (V–aV) pairs as a function of the current density J a for γ = 20 . The temperature is fixed at T 0 = 0.84 T c and the Ginzburg–Landau parameter is set to κ = 1 . See text for details.
Physics 07 00061 g003
Figure 4. The upper critical current as a function of the γ parameter. The fit indicates a gradual exponential increase in the critical current. The fit is performed with a coefficient of determination R 2 = 0.99734 . A thermal bath temperature of T 0 = 0.84 T c and a Ginzburg–Landau parameter of κ = 1 are used.
Physics 07 00061 g004
Figure 5. (a) The maximum differential resistance immediately after the onset of the resistive state as shown in Figure 2b. The fit is performed with a coefficient of determination R 2 = 0.99993 . (b) The corresponding value of the applied current density as a function of γ . The fit is performed with a coefficient of determination R 2 = 0.99925 . The thermal bath temperature is set to T 0 = 0.84 T c and the Ginzburg–Landau parameter to κ = 1 .
Physics 07 00061 g005
Figure 6. The total superconducting I s and normal I n currents through the central plane at x = 0 , considering T 0 = 0.84 T c , κ = 1 and γ = 30 . The straight lines emphasize the symmetric nature of the redistribution of the currents. The dots indicate the inflection points of the I ¯ s , n curves.
Physics 07 00061 g006
Figure 7. The two derivatives d I ¯ s , n / d I as functions of I (the lines), highlighting the inflection points (the dots). (ad) Snapshots of the space and time evolution of the modulus of the superconducting order parameter in the z = 0 plane, illustrating the nucleation and annihilation of V–aV pairs correlated with the current redistribution.
Physics 07 00061 g007
Figure 8. Characteristic current–voltage (a) and resistance curves (b) of a superconducting material for various values of the material-dependent constant γ and the Ohm’s law as indicated. T 0 = 0.75 T c and κ = 0.5 are used. Note that, despite the bulk value κ = 0.5 placing the material in the type-I regime, the confined geometry induces type-II–like behavior. In this case, the IR response (b) develops a secondary peak near the main maximum, a feature not observed for κ = 1 (Figure 2b).
Physics 07 00061 g008
Figure 9. Same as Figure 5, but for T 0 = 0.75 T c and κ = 0.5 . The fits are performed with coefficients of determination R 2 = 0.99993 (a) and R 2 = 0.99821 (b).
Physics 07 00061 g009
Disclaimer/Publisher’s Note: The statements, opinions and data contained in all publications are solely those of the individual author(s) and contributor(s) and not of MDPI and/or the editor(s). MDPI and/or the editor(s) disclaim responsibility for any injury to people or property resulting from any ideas, methods, instructions or products referred to in the content.