Article

Intrinsic Thermal Shock Behavior of Common Rutile Oxides

Materials Chemistry, RWTH Aachen University, Kopernikusstr. 10, D-52074 Aachen, Germany
*
Author to whom correspondence should be addressed.
Physics 2019, 1(2), 290-300; https://doi.org/10.3390/physics1020022
Submission received: 16 July 2019 / Revised: 26 August 2019 / Accepted: 27 August 2019 / Published: 28 August 2019
(This article belongs to the Section Applied Physics)

Abstract

:
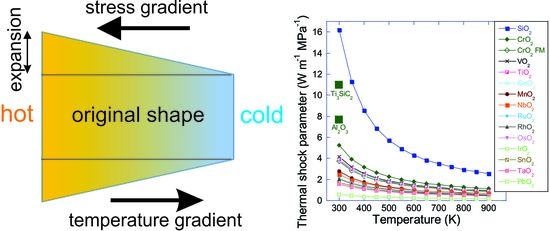
Rutile TiO2, VO2, CrO2, MnO2, NbO2, RuO2, RhO2, TaO2, OsO2, IrO2, SnO2, PbO2, SiO2, and GeO2 (space group P42/mnm) were explored for thermal shock resistance applications using density functional theory in conjunction with acoustic phonon models. Four relevant thermomechanical properties were calculated, namely thermal conductivity, Poisson’s ratio, the linear coefficient of thermal expansion, and elastic modulus. The thermal conductivity exhibited a parabolic relationship with the linear coefficient of thermal expansion and the extremes were delineated by SiO2 (the smallest linear coefficient of thermal expansion and the largest thermal conductivity) and PbO2 (vice versa). It is suggested that stronger bonding in SiO2 than PbO2 is responsible for such behavior. This also gave rise to the largest elastic modulus of SiO2 in this group of rutile oxides. Finally, the intrinsic thermal shock resistance was the largest for SiO2, exceeding some of the competitive phases such as Al2O3 and nanolaminated Ti3SiC2.

Graphical Abstract

1. Introduction

Rutile oxides (space group P42/mnm, prototype TiO2), including TiO2, VO2, CrO2, MnO2, NbO2, RuO2, RhO2, TaO2, OsO2, IrO2, SnO2, PbO2, SiO2, and GeO2, are very common oxides and broadly explored due to their interesting properties [1,2]. For example, TiO2 possesses a large band gap of about 3 eV [3]. RuO2 is electrically conductive [4], which is highly unusual for oxides. On the one hand, NbO2 exhibits the highest known Mott transition temperature of approximately 800 °C [5,6,7]. On the other hand, VO2 undergoes the Mott transition at a low temperature of 68 °C [8], which is relevant for some applications such as smart windows. SiO2, in its various forms, is known for high thermal shock resistance [9]. In general, oxides are refractory solids [10,11], but still many of their high-temperature properties are either unknown or not systematically explored. One of these is thermal shock behavior.
Thermal shock occurs when a system is subjected to rapid changes in temperature [9]. An abrupt temperature increase gives rise to thermal gradients and hence stress gradients, which may in turn result in damage and catastrophic failure [9]. Therefore, many applications where extreme temperature gradients are required—such as spacecraft propulsion, spacecraft atmospheric entry, immobilization of radioactive waste, combustion, thermoelectric devices, various metallurgical processes, and high-power lasers—are prone to thermal shock [9,12]. Furthermore, physical properties governing the thermal shock behavior are also relevant for other thermomechanical properties such as thermal fatigue [13]. Thermal shock resistance can be described by the thermal shock parameter (RT), which is defined as
R T = σ f κ ( 1 ν ) α Y ,
where σf, κ, ν, α, and Y designate flexural strength, thermal conductivity, Poisson’s ratio, the linear coefficient of thermal expansion, and elastic (Young’s) modulus, respectively [9,14]. To increase the thermal shock resistance, RT should be maximized, which can be achieved by maximizing the numerator and/or minimizing the denominator in Equation (1). Hence, high σf is required to enhance resistance to crack propagation, high κ conducts heat away from an active component and minimizes temperature gradients, large ν may give rise to a more ductile response, as well as a combination of low α and small Y leads to a thermal stress reduction [9,14]. It should be noted that an improvement of one physical property in Equation (1) is often accompanied by the deterioration of another property. For instance, a decreased Y is often associated with a larger α value [15], rendering the design of novel thermal shock resistant solids challenging. A typical research strategy is to enhance RT by concentrating on a single thermomechanical property in Equation (1). For instance, a large RT value of fused SiO2 is enabled by very low α [14]. It should also be noted that quantum mechanical predictions, beneficial and efficient in many cases [16], are very challenging for thermal shock behavior since there is an interplay between phonons and electrons in these thermomechanical properties. Hence, to replace the traditional trial-and-error approach—which aims to optimize one of the relevant properties to enhance thermal shock resistance with the knowledge-based design of thermal shock-resistant solids taking into account all (or most) key properties—presents a formidable challenge.
In this work, 14 binary oxides TiO2, VO2, CrO2, MnO2, NbO2, RuO2, RhO2, TaO2, OsO2, IrO2, SnO2, PbO2, SiO2, and GeO2 are considered for thermal shock resistance applications using density functional theory [17] in conjunction with the Slack [18] and Debye–Grüneisen model [19]. It should be remarked that many of these thermomechanical properties are affected by extrinsic factors. One of these is microstructure. Flexural strength [20], thermal conductivity [21,22], and the linear coefficient of thermal expansion [23] depend on grain size. For instance, the flexural strength of bulk Ti3SiC2, a promising nanolaminate for thermal shock resistance applications, is 330 and 600 MPa at room temperature for grain sizes of 100–200 and 3–5 μm, respectively [20]. The extrinsic factors cannot be straightforwardly addressed by quantum mechanical methods and hence are not considered in the current work. In particular, due to a complex mechanical loading during flexural strength measurements (standard three-point loading) [24], σf is not considered in this work. All other four relevant parameters in Equation (1), namely κ, ν, α, and Y, are systematically explored for the common rutile oxides in this study.

2. Methods

Density functional theory [17] was employed in the current work to calculate κ, ν, α, and Y for TiO2, VO2, CrO2, MnO2, NbO2, RuO2, RhO2, TaO2, OsO2, IrO2, SnO2, PbO2, SiO2, and GeO2. The Vienna ab initio simulation package (VASP) was used within the framework of the projector augmented wave potentials [25,26,27] and generalized gradient approximation, which were parametrized by Perdew, Burke, and Ernzerhof [28]. The Blöchl correction in the VASP code was applied [29] for these rutile oxides and an integration in the Brillouin zone was carried out by employing the Monkhorst–Pack approach [30] with a k-point mesh of 7 × 7 × 5 (2 × 2 × 2 tetragonal supercell, 48 atoms). The supercell was considered rather than a primitive cell in order to allow for the treatment of diluted alloying (2.1 at.%). No symmetry breaking was observed. Full structural optimization for these tetragonal supercells was made by minimizing the interatomic forces and optimizing the lattice parameters, a and c. The convergence criterion for the total energy was 0.01 meV and a cut-off energy was 500 eV. All configurations were treated as nonmagnetic apart from CrO2. In the case of CrO2, spin polarization (ferromagnetic ordering) was also taken into account. Electronic structure analysis of these oxides was performed employing the VESTA software [31].
Two acoustic phonon models were considered. These two phonon models are complementary; one regards the thermal conductivity and the other thermal expansion and temperature-dependent elasticity. Taking Umklapp phonon–phonon scattering into account within the Slack model [18,32], κ values were obtained as
κ = A M ¯ D a 3 δ n 1 / 3 γ 2 T ,
where A is a constant, which can be attained as
A = 2.43 × 10 6 1 0.514 γ 1 + 0.228 γ 2 ,
with γ designating the acoustic mode Grüneisen parameter [33,34]. M ¯ in Equation (2) is the average atomic mass and Da is the Debye temperature (D) of acoustic phonons calculated as
D a = D n 1 / 3 .
Further parameters used in Equation (2), δ3, n, and T are the volume per atom, number of atoms in the 2 × 2 × 2 tetragonal supercell, and absolute temperature, respectively [32]. The values for γ and Da can be extracted from elastic constants [33,35]. In particular, all tetragonal elastic constants, C11, C12, C13, C33, C44, and C66, were calculated using a method described previously [36]. The tetragonal lattice was strained using a different distortion for each elastic constant (maximum distortion 2%) and the resulting total energy change (quadratic energy–distortion dependence) was utilized to calculate the corresponding elastic constant at 0 K, as detailed in the literature [36]. The elastic constants were also utilized to obtain ν and Y at 0 K within the Hill approximation [37].
The Debye–Grüneisen (acoustic phonon) model was employed for estimating α [19,38,39]. Within the Debye–Grüneisen model [19], the Helmholtz free energy (F) is defined as
F = E t o t n k B T [ 3 ( T D ) 3 0 D / T x 3 e x 1 d x 3 ln ( 1 e D T ) 9 D 8 T ] ,
where Etot and kB are the total energy at 0 K and the Botzmann constant, respectively. These data were fitted to the Birch–Murnagham equation of state [40] at each temperature to acquire the temperature dependent equilibrium volume and bulk moduli data. The bulk moduli were then used to estimate the temperature dependent Y values, using ν. In the original work on the Debye–Grüneisen model [19], ν was assumed to be constant (0.33) since only metals were considered, but in this work, the ν value was explicitly calculated for each compound minimizing possible errors. In particular, ν was obtained from (3B − 2G)/(6B + 2G)), where B and G are bulk and shear modulus, respectively, within the Hill approximation [37]. The value of α was extracted from the temperature-dependent equilibrium volume datasets. In this work, α was considered instead of volume expansion, since the original Debye–Grüneisen model [19] contains α.

3. Results and Discussion

Figure 1 contains the calculated κ data at 300 K as a function of α for common rutile oxides explored in this study, including TiO2, VO2, CrO2, MnO2, NbO2, RuO2, RhO2, TaO2, OsO2, IrO2, SnO2, PbO2, SiO2, and GeO2. Based on the Debye–Grüneisen theory, α and γ are linearly proportional [41]. Hence, an inverse quadratic dependence (parabolic relationship) based on Equation (2) is expected for κ and α. As α increases from 3.3 × 10⁻⁶ to 13.4 × 10⁻⁶ K−1, κ decreases from 35.4 to 1.4 W m1 K1. The boundary of the data in Figure 1 is span by SiO2 (the smallest α value and the largest κ value) and PbO2 (vice versa). The rest of the data exhibit the values between these two extremes in a parabolic arrangement. The here calculated α and κ value for TiO2 deviates 29% and 17% from the measured data in the literature [42,43]. It should be mentioned that α is typically within 30% deviated from experiments when the Debye–Grüneisen model is employed [38]. The Slack model is typically less precise, but it reaches a correct order of magnitude [22]. The influence of magnetism is present within these deviations, as probed for CrO2. For accuracy reasons, the data in Figure 1 are not fitted at this point, but the exact parabolic relationship is discussed below when more datasets are regarded. It should also be noted that the theoretical data obtained by these models may deviate not only due to approximations (single crystals are considered, only acoustic phonons are included in the Slack and Debye–Grüneisen model, no electronic contributions are taken into account within the Slack model, etc.), but also due to difficulties in comparison with available experimental data (polycrystalline samples, impurities, defects, etc.). Nevertheless, important trends are captured in Figure 1. It is also feasible to affect the data in Figure 1 by dilute alloying. Adding 2.1 at.% of Si into TiO2, increases its κ value by 10.2%. Oppositely, the same amount of Pb leads to a reduction of κ by 15.3%. It should be noted that κ also scales with equilibrium volume in the same fashion as it does with α. This is indicative that the equilibrium volume or bond length governs the thermal response of these isostructural compounds. However, Umklapp phonon–phonon scattering is considered (parabolic relationship between κ and α) as a major physical mechanism for the data shown in Figure 1.
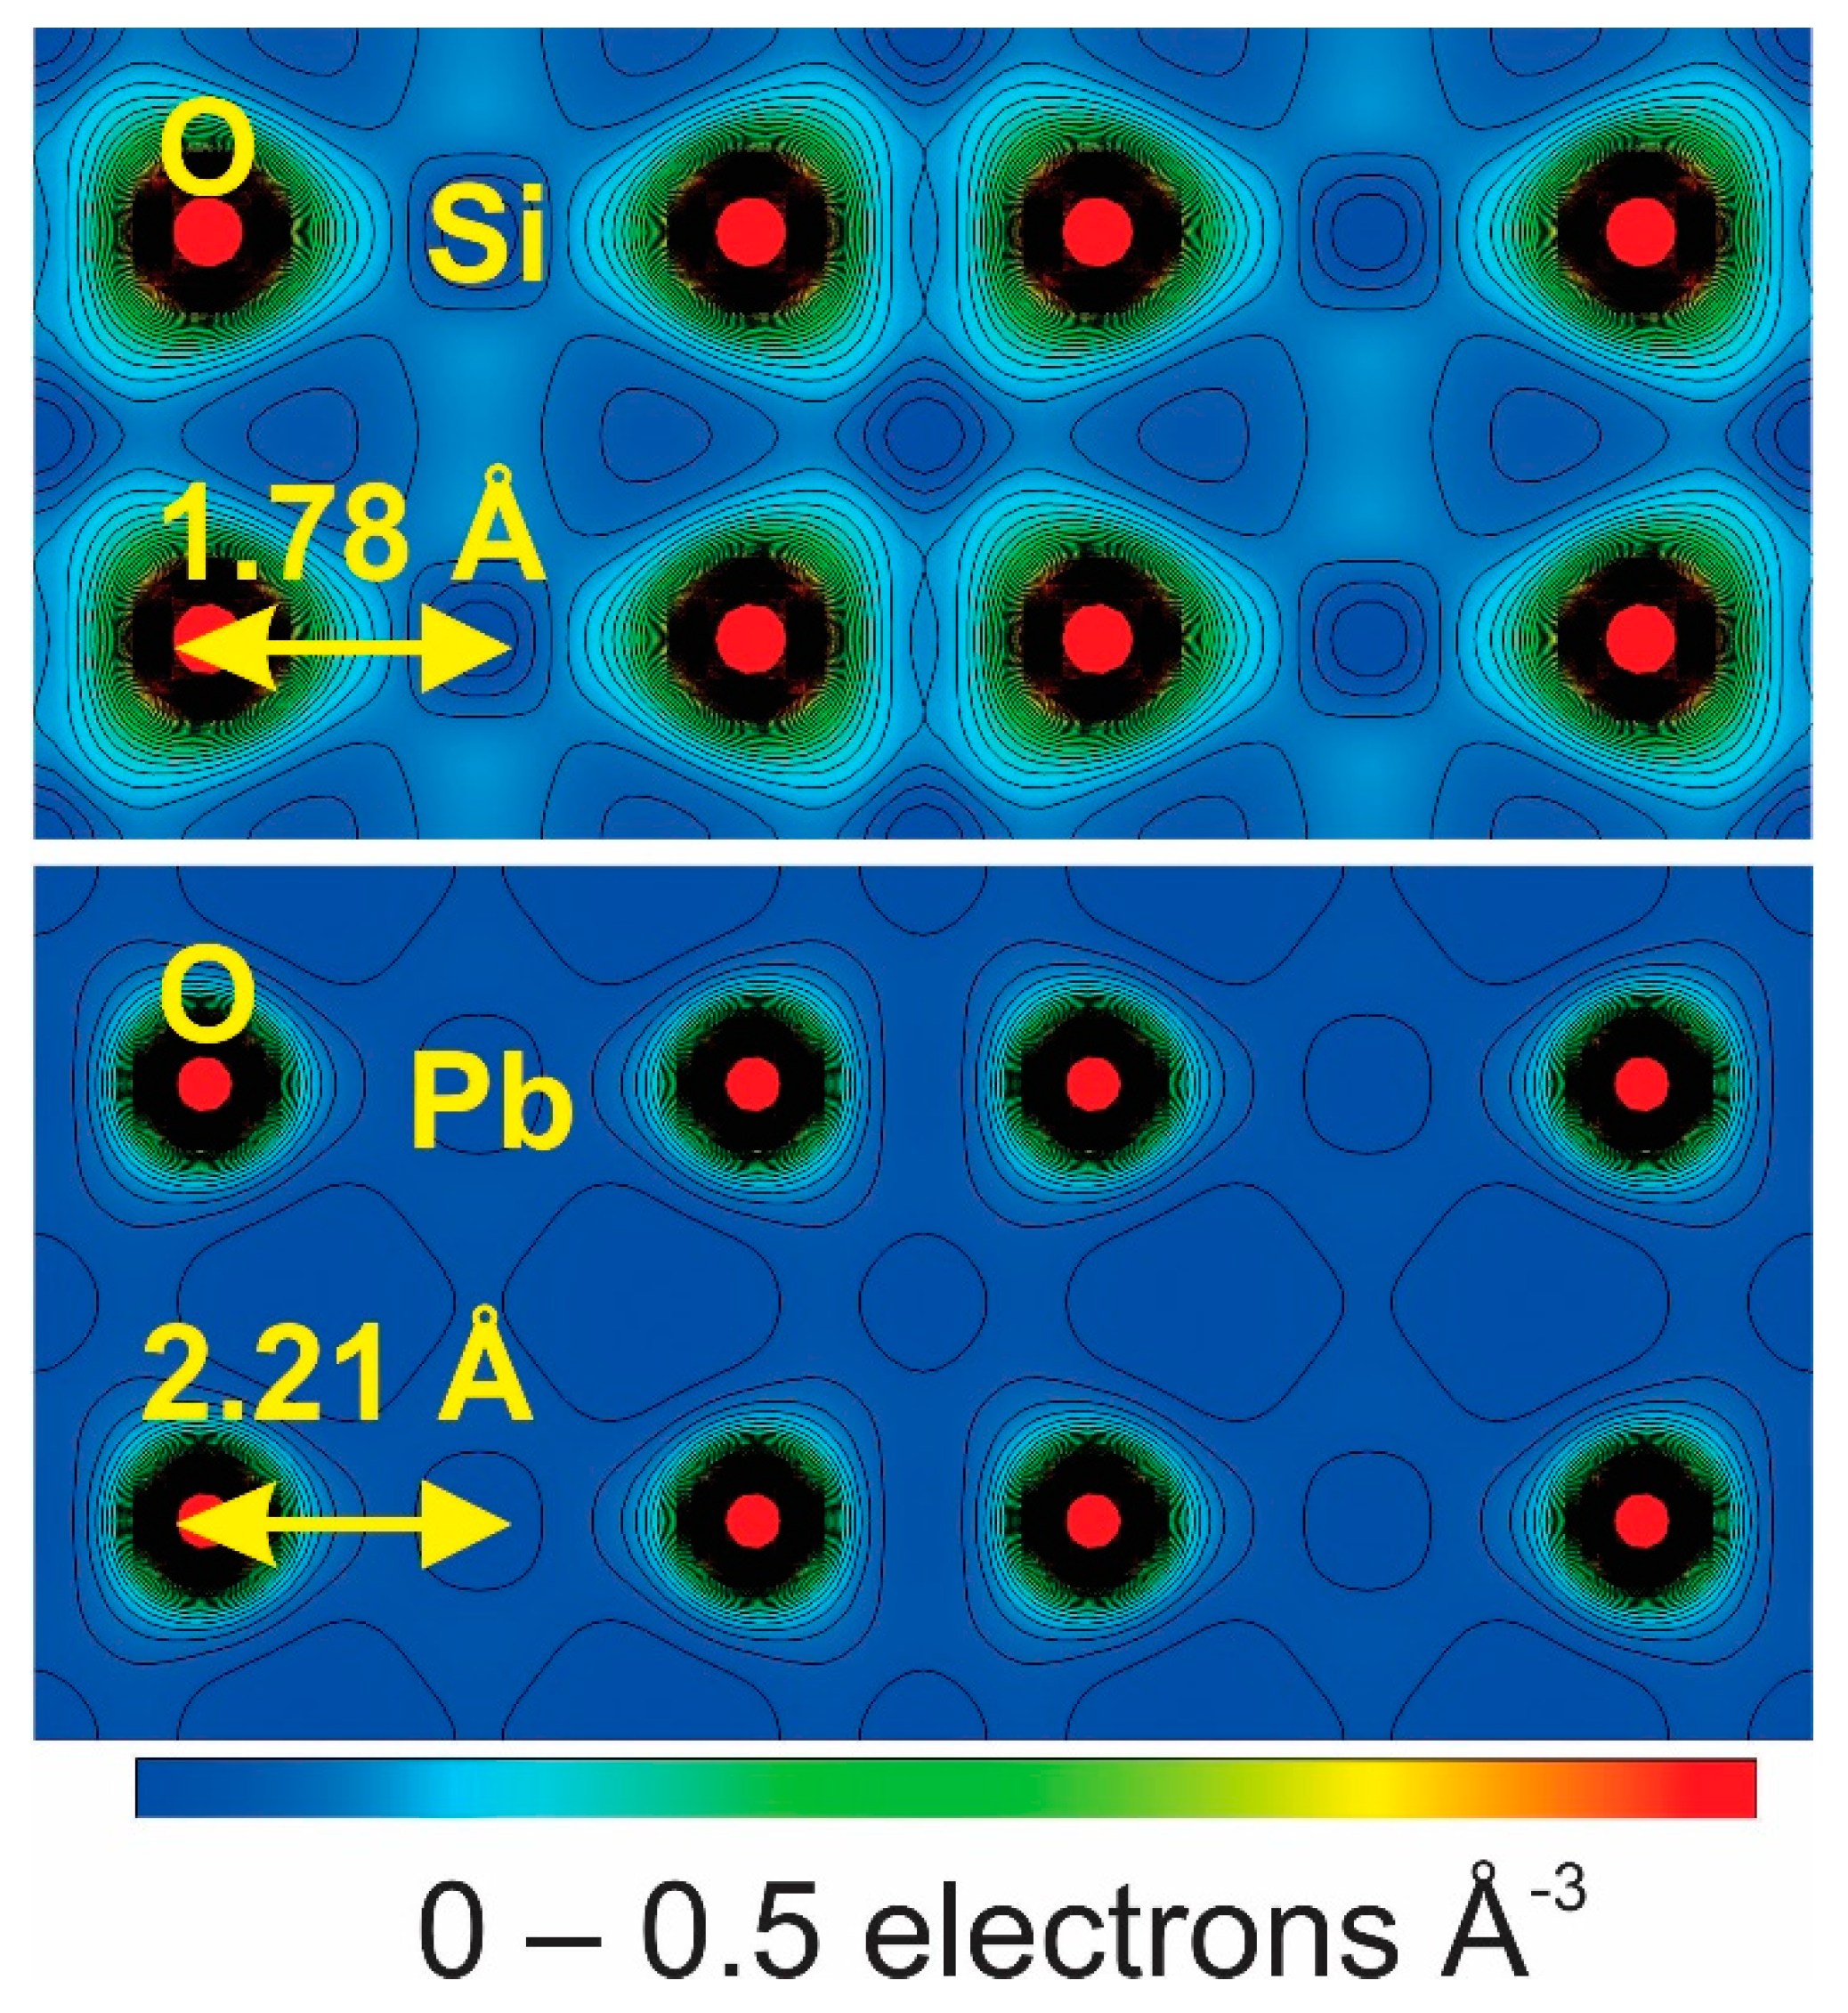
To rationalize the behavior of the boundaries (extremes) in Figure 1, the electronic structure of SiO2 (the smallest α value and the largest κ value) and PbO2 (vice versa) is explored in Figure 2. Both Si and Pb are depleted and the majority of charge is attracted by O. This is consistent with ionic bonding. There are important differences between these two rutile phases. While there is essentially no charge localized between Pb and O in PbO2, a considerable number of electrons are shared by Si and O in SiO2. Hence, SiO2 is characterized by ionic–covalent bonding and PbO2 possesses mainly the ionic contribution to the overall bonding. This is also mirrored in the bond length values for these two extremes, i.e., 1.78 vs. 2.21 Å, respectively. These electronic structure data are consistent with the literature [44,45]. Due to the bonding nature, SiO2 is expected to have stronger bonds than PbO2. Stronger bonds thus lead to low α and high κ, as observed in Figure 1 for SiO2. The opposite occurs for PbO2.
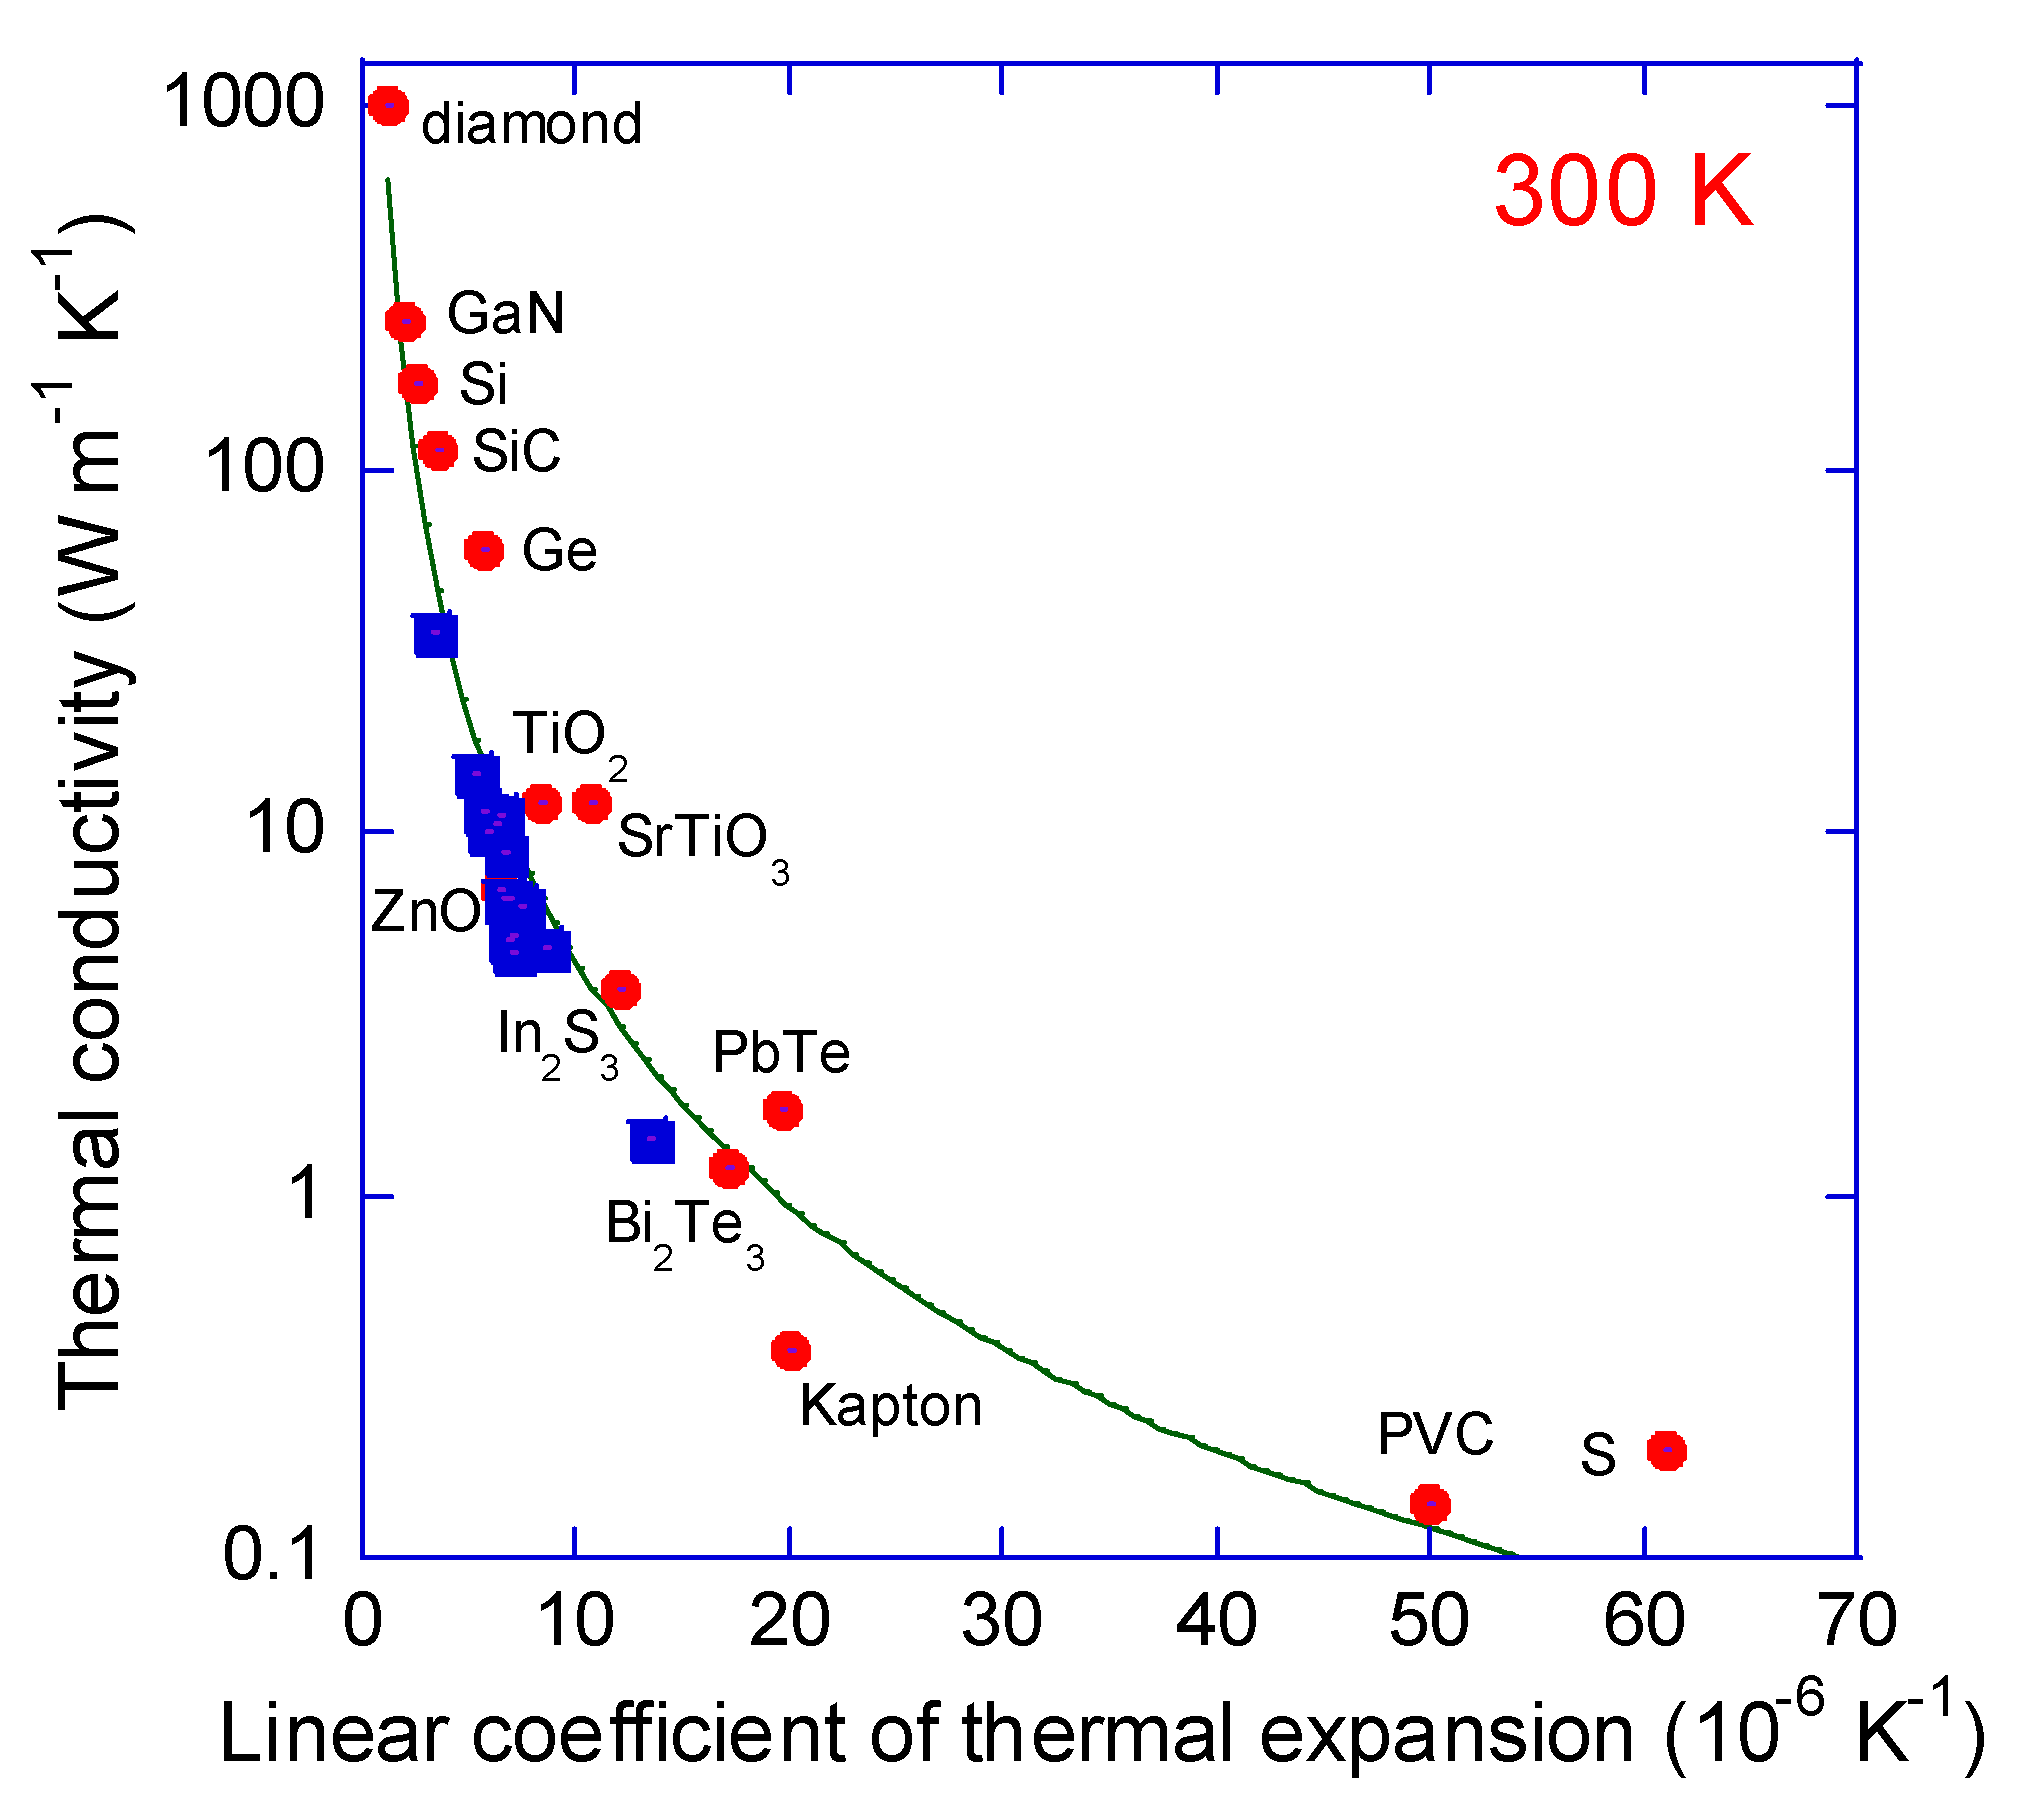
Figure 3 contains the calculated κ data at 300 K as a function of α for common rutile oxides investigated in this study, previously included in Figure 1, as well as literature values for various semiconductive and insulating phases, including diamond [46], Ge [46], Si [46], S [46], In2S3 [47], SiC [48,49], GaN [50,51], Bi2Te3 [52], PbTe [13,53], HgTe [54], TiO2 [42,43], ZnO [55,56], SrTiO3 [57,58], Kapton (poly-oxydiphenylene-pyromellitimide) [59], and polyvinyl chloride (PVC) [60]. As α increases from 1 × 10⁻⁶ to 61 × 10−6 K−1, κ decreases from 1000 to 0.1 W m−1 K−1. The κ and α values for the common rutile oxides explored herein are consistent with the functional dependence of the literature data. The obtained inverse square fit for the data in Figure 3 at 300 K gives κ = 763 α−2, as provided by the solid line, where κ is in units of W m−1 K−1 and α in units of 10−6 K−1. It is proposed that the constant in the acquired relationship is predominantly determined by the product between the Debye temperature and average atomic mass in Equation (2). These two factors change to a large extent, unlike the other factors, but their product is approximately constant. For instance, this product for isostructural diamond and Ge is 26,443 and 29,322 K u, respectively, where u is the unified atomic mass unit. Furthermore, it is known that small changes in the bonding nature can give rise to a diverse thermal response [61,62]. Since all rutile oxides explored in the current study are isostructural and exhibit similar ionic–covalent bonding (see Figure 2 for extremes), the bond strength is likely the key factor responsible for differences in the thermal properties (Figure 3). For instance, TiO2 [63] and RuO2 [64] exhibit an equivalent phonon band structure. With the bond length of 1.97 and 1.99 Å for TiO2 and RuO2, respectively, TiO2 exhibits stronger bonds and should thus possess a higher κ and smaller α value. Indeed, this is observed herein (see Figure 1 for details). Extremes, SiO2 and PbO2, undergo the same rationale, as discussed above. To vindicate the whole range of data shown in Figure 3, lattice dynamics of all compounds should be considered. This is beyond the scope of this work, since the Slack and Debye–Grüneisen model is employed instead of full phonon calculations, but the important trends are captured, which is valuable for physical insights and further explorations.
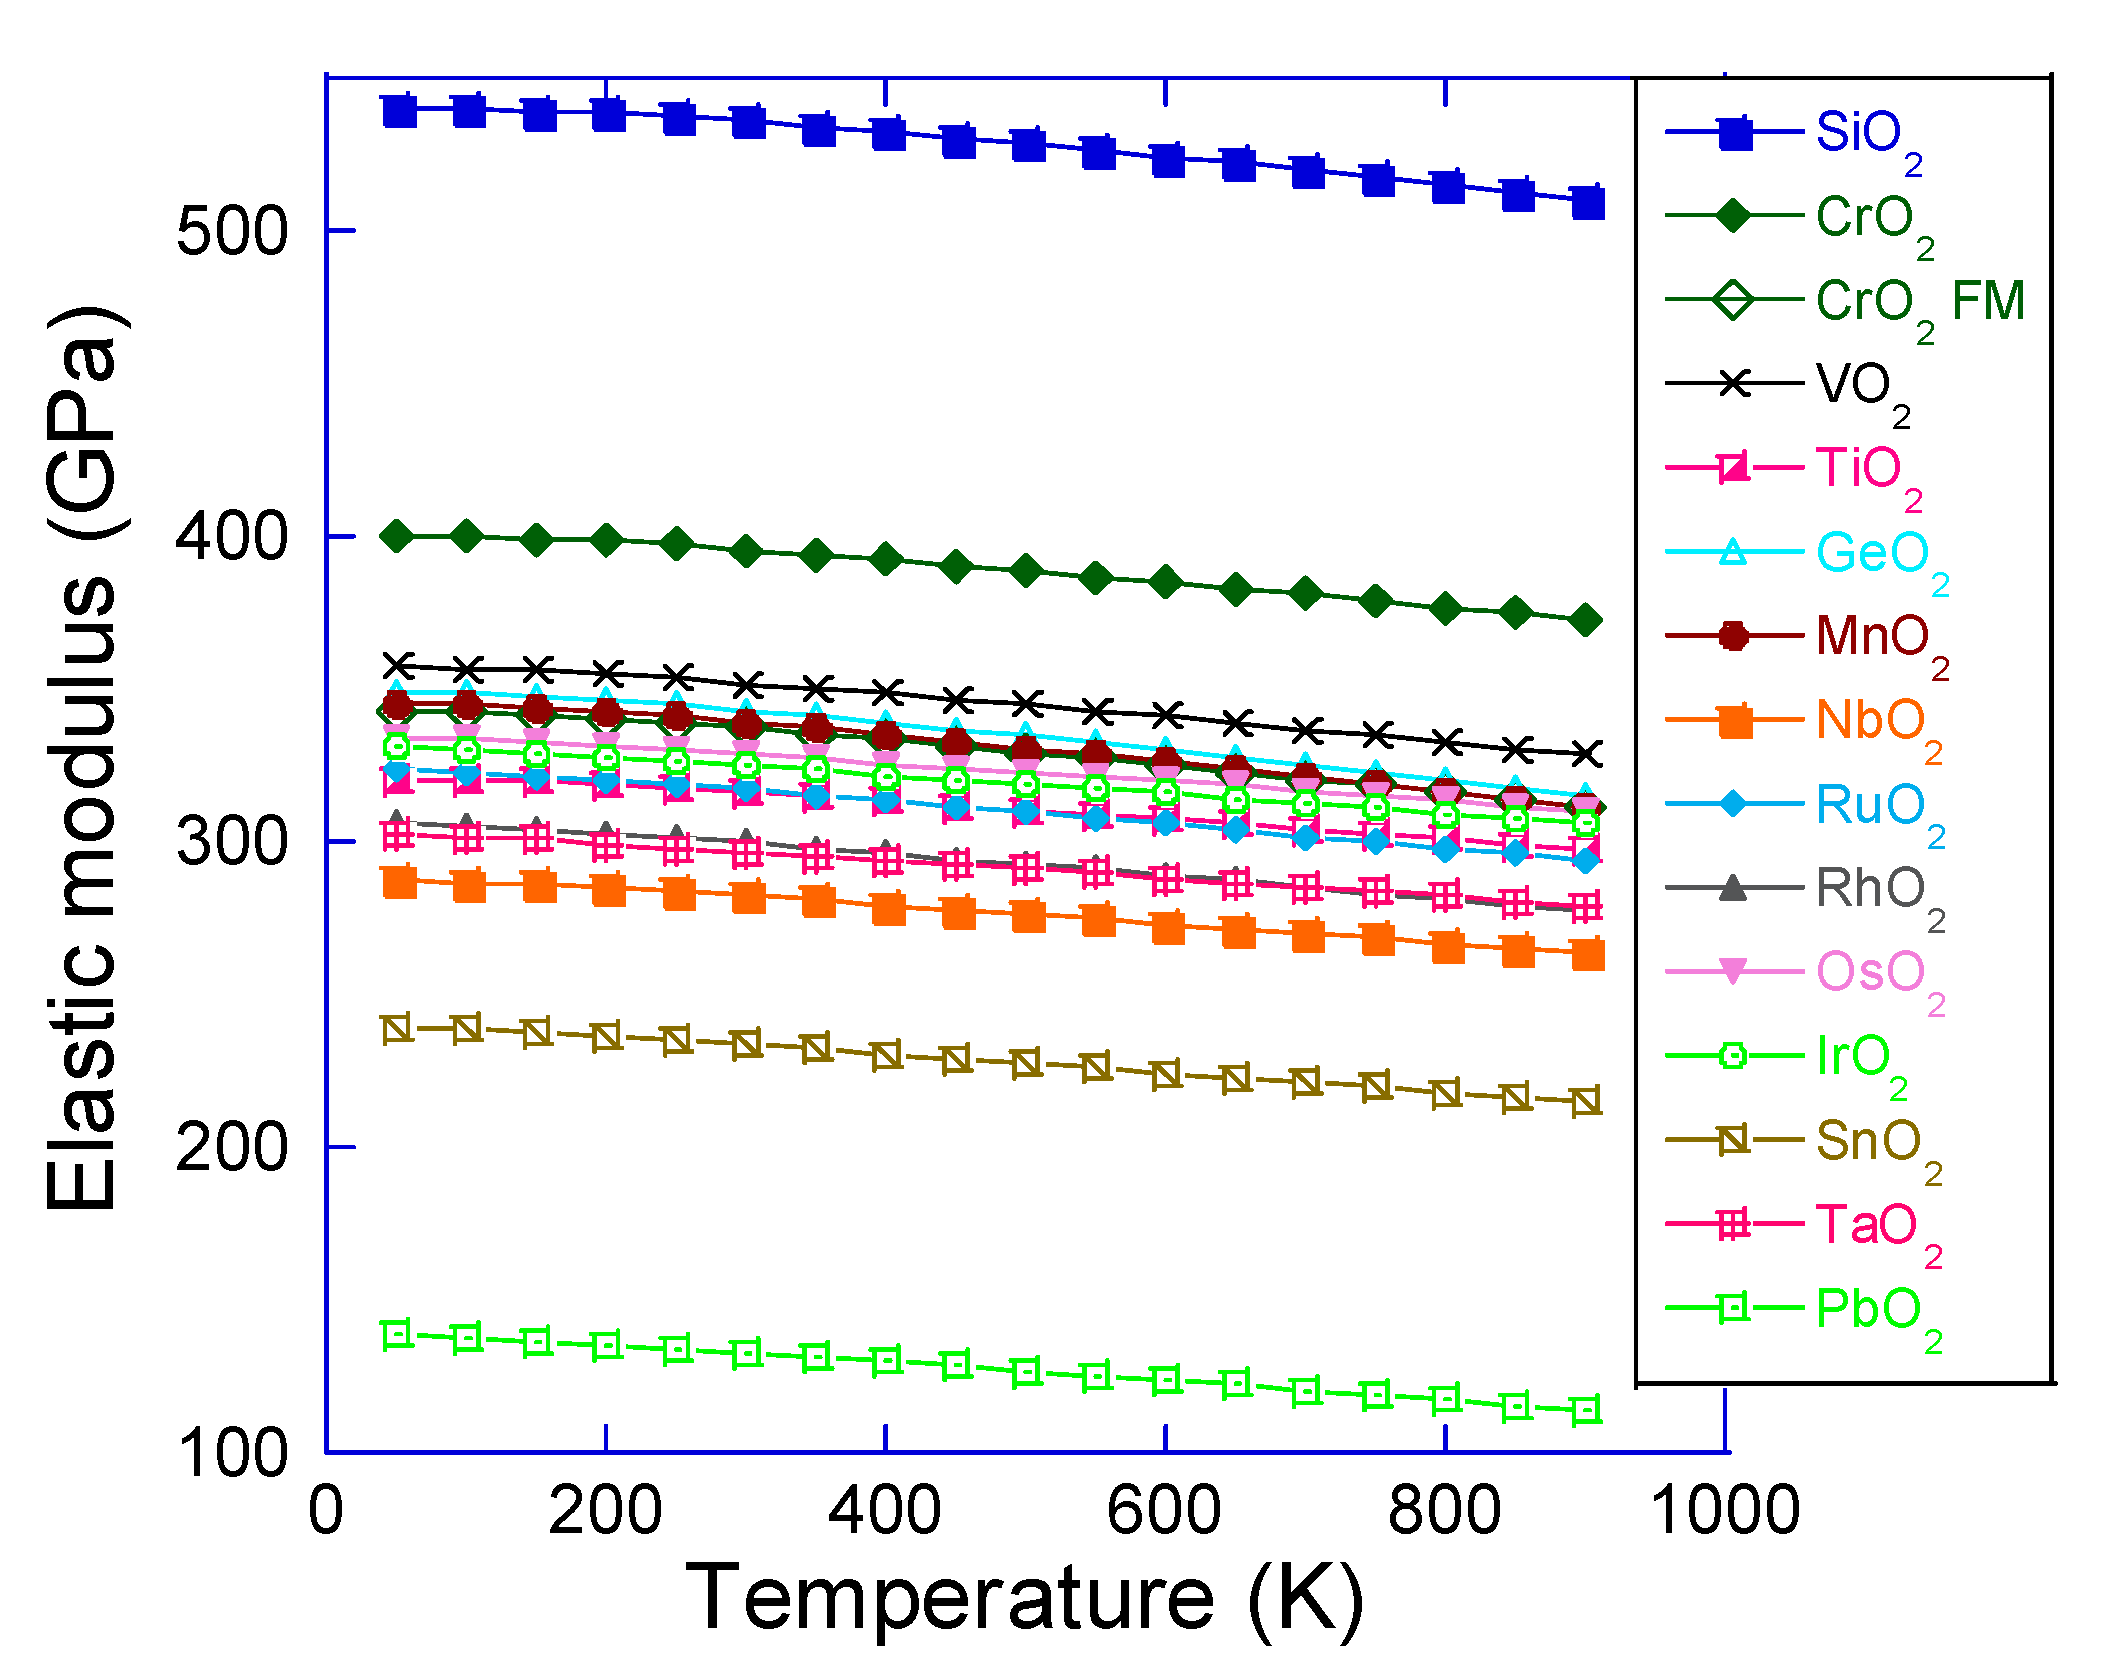
After discussing the behavior of κ and α in Equation (1), the elastic properties are considered. Figure 4 shows the dependence of Y on T for the common rutile oxides explored herein. The Y value slowly decreases with T, as expected, and the difference between the values for these binary oxides is constant. The stiffest rutile oxide is SiO2 and the softest one is PbO2, which is in agreement with the bonding analysis (see Figure 2) since SiO2 possesses the strongest bonds. The obtained elasticity values at 300 K are consistent with the available experimental data, deviating by 7.8% for TiO2 [65], 2.4% for CrO2 [2], 16.1% for MnO2 [66], 2.6% for NbO2 [67], 5.4% for OsO2 [68], 9.9% for IrO2 [69], 0.3% for PbO2 [70], and 7.9% for SiO2 [71]. This is acceptable based on the employed exchange-correlation functional, since deviations are commonly within 20% [72]. The calculated internal free parameter for the 4f Wyckoff site (O position) is in a narrow range from 0.345 to 0.348, being 11% deviated from the experiment value [73], but due to the obtained consistency with the elasticity data, this is acceptable. Moreover, the calculated values of Poisson’s ratio are in the range from 0.20 (SiO2) to 0.32 (PbO2).
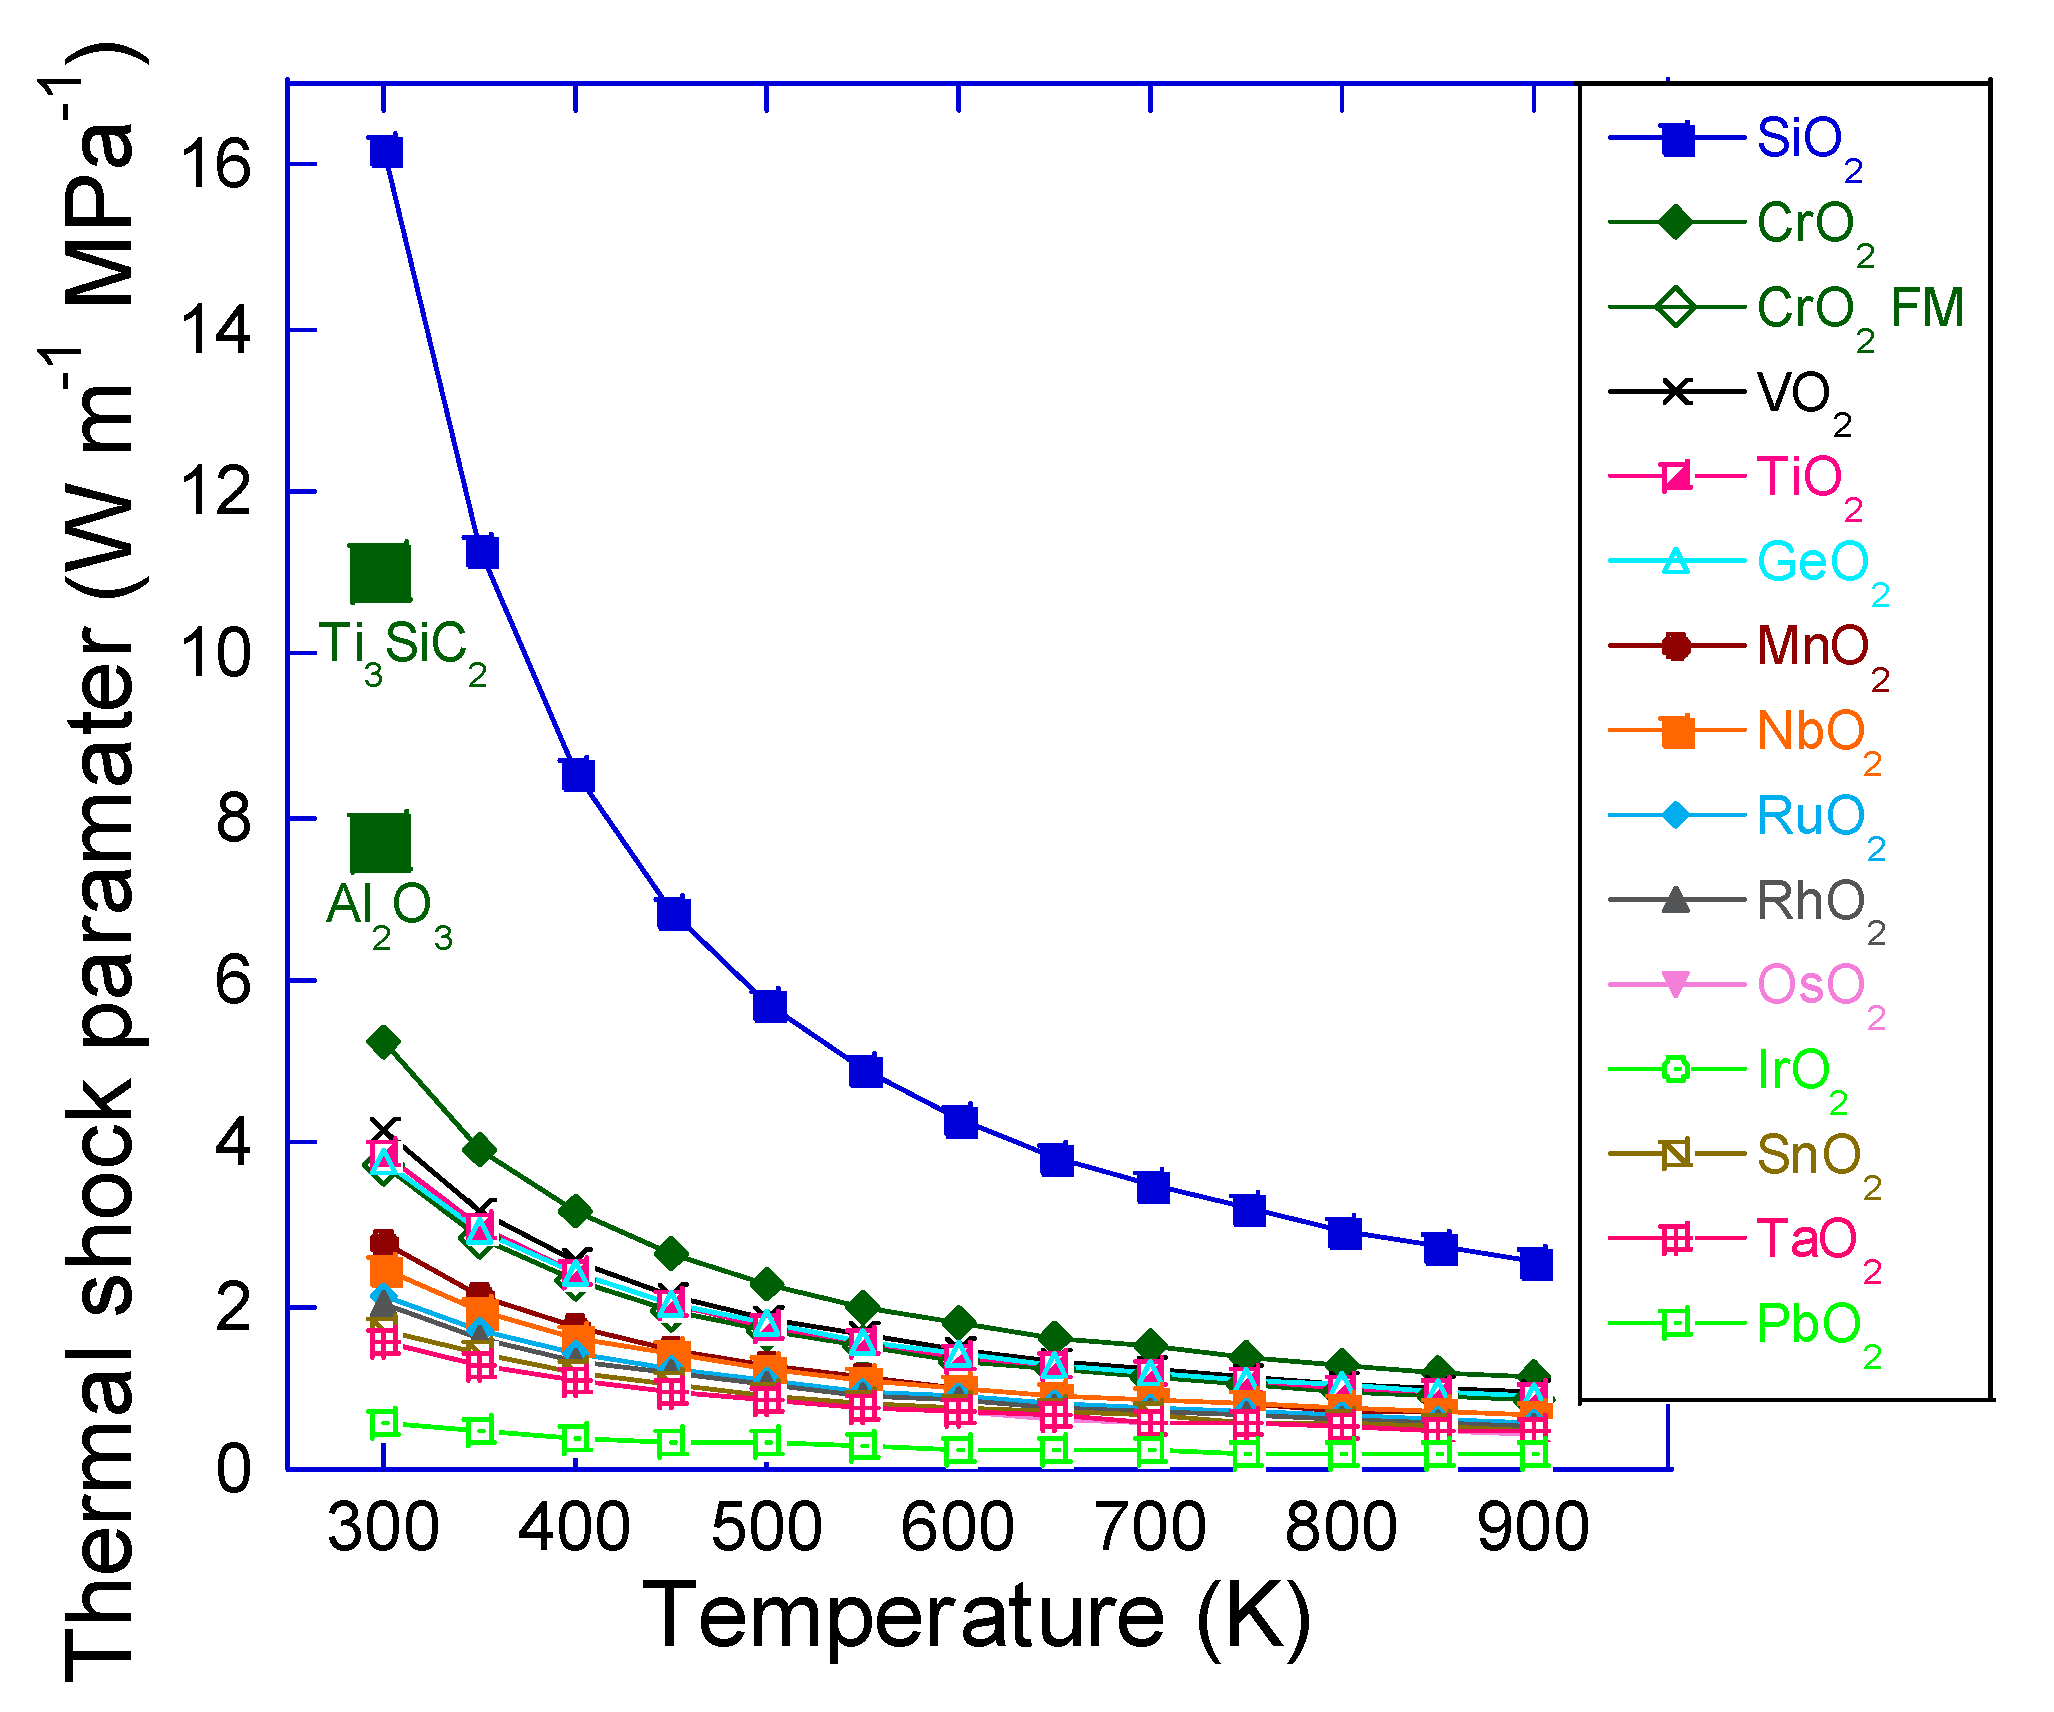
With calculated elasticity (Figure 4) and thermal properties (Figure 1), it is possible to estimate the temperature behavior of RT, as defined in Equation (1), for the rutile oxides addressed in this study. As argued above, σf is obtained under complex mechanical loading and it exhibits the strongest extrinsic response (grain size dependence). Hence, the thermal shock behavior of the common rutile oxides is herein described within density functional theory as RT/σf (units of W m−1 MPa−1 instead of W m−1) and referred to as an intrinsic thermal shock parameter. Figure 5 contains such data as a function of temperature. The intrinsic thermal shock parameter for SiO2 is the largest in the whole temperature range and decreases from 16.2 to 2.6 W m−1 MPa−1 upon temperature increase from 300 to 900 K. It exceeds the room-temperature value of 11.2 W m−1 MPa−1 measured for nanolaminated Ti3SiC2 [74,75] and 7.7 W m−1 MPa−1 for corundum Al2O3 [14], which are commonly employed for thermal shock resistance. The rest of the other rutile oxides in Figure 5 exhibit the intrinsic thermal shock parameter lower than 6 W m−1 MPa−1, whereby PbO2 constitutes the lower bound. Hence, in applications where thermal shock resistant phases are required, Si-based systems are expected to perform well based on the data in Figure 5. At elevated temperatures and under atmospheric conditions, constituting Si is likely to oxidize and enhance the thermal shock resistance. This of course requires an experimental validation, indicating that this work may inspire future investigations. A clue that this notion is correct can be found in the literature on ZrO2, claiming that additions of SiO2 enhance its thermal shock resistance [76]. It should also be mentioned that some applications benefit from low κ, such as energy generation and sensing by thermoelectric devices, so that Pb-based systems are of interest, but an interplay with thermal shock resistance and thermal fatigue is challenging to capture and often overlooked in many studies. Holistic approaches, including both primary and secondary properties, are crucial for future design efforts of multifunctional solids.

4. Conclusions

Fourteen rutile oxides have systematically been explored for thermal shock resistance applications using density functional theory in conjunction with the Slack and Debye–Grüneisen model. Four thermomechanical properties (κ, ν, α, and Y) were evaluated, omitting σf due to complex mechanical loading and its compelling extrinsic response (grain size dependence). As α increases from 3.3 × 10⁻⁶ to 13.4 × 10⁻⁶ K−1, κ decreases from 35.4 to 1.4 W m−1 K−1, exhibiting a parabolic relationship. The boundary of these data is span by SiO2 (the smallest α value and the largest κ value) and PbO2 (vice versa). In a broad comparison with the literature data, an inverse square fit at 300 K was obtained yielding κ = 763 α−2, where κ is in units of W m−1 K−1 and α in units of 10−6 K−1. The constant in the acquired relationship may predominantly be determined by the product between the Debye temperature and the average atomic mass. The boundary in the κα space for these rutile oxides may be due to stronger bonding in SiO2 than PbO2, since SiO2 is characterized by ionic–covalent bonding and PbO2 is mainly ionic. This also gives rise to the largest elastic modulus of SiO2 in the order of 500 GPa at a wide temperature range up to 900 K. Finally, the intrinsic thermal shock resistance is the largest for SiO2, exceeding some of the competitive phases such as nanolaminated Ti3SiC2 and corundum Al2O3. It may be argued that at elevated temperatures and under atmospheric conditions, Si-containing systems oxidize, forming SiO2, and in turn enhance the overall thermal shock resistance.

Author Contributions

D.M. conceived and performed all density functional theory calculations. Both authors analyzed the data. B.S. provided ideas and insights as well as initiating intensive discussions. Both authors contributed to the interpretation of the results and writing of the manuscript.

Funding

This research was funded by the Deutsche Forschungsgemeinschaft (DFG), grant number MU 2866/4. Simulations were performed with computing resources granted by JARA-HPC from RWTH Aachen University under project JARA0131.

Conflicts of Interest

The authors declare no conflict of interest.

References

  1. Baur, W.H. Rutile-type compounds. Acta Cryst. B 1976, 32, 2200. [Google Scholar] [CrossRef]
  2. Maddox, B.R.; Yoo, C.S.; Kasinathan, D.; Pickett, W.E.; Scalettar, R.T. High-pressure structure of half-metallic CrO2. Phys. Rev. B 2006, 73, 144111. [Google Scholar] [CrossRef]
  3. Pascual, J.; Camassel, J.; Mathieu, H. Fine structure in the intrinsic absorption edge of TiO2. Phys. Rev. B 1978, 18, 5606. [Google Scholar] [CrossRef]
  4. Lee, J.M.; Shin, J.C.; Hwang, C.S.; Kim, H.J.; Suk, C.-G. Preparation of high quality RuO2 electrodes for high dielectric thin films by low pressure metal organic chemical vapor deposition. J. Vac. Sci. Technol. A 1998, 16, 2768. [Google Scholar] [CrossRef]
  5. O’Hara, A.; Nunley, T.N.; Posadas, A.B.; Zollner, S.; Demkov, A.A. Electronic and optical properties of NbO2. J. Appl. Phys. 2014, 116, 213705. [Google Scholar] [CrossRef]
  6. Joshi, T.; Senty, T.R.; Borisov, P.; Bristow, A.D.; Lederman, D. Preparation, characterization, and electrical properties of epitaxial NbO2 thin film lateral devices. J. Phys. D Appl. Phys. 2015, 48, 335308. [Google Scholar] [CrossRef]
  7. Bolzan, A.A.; Fong, C.; Kennedy, B.J.; Howard, C.J. A powder neutron diffraction study of semiconducting and metallic niobium dioxide. J. Solid State Chem. 1994, 113, 9. [Google Scholar] [CrossRef]
  8. Qazilbash, M.M.; Brehm, M.; Chae, B.-G.; Ho, P.-C.; Andreev, G.O.; Kim, B.-J.; Yun, S.J.; Balatsky, A.V.; Maple, M.B.; Keilmann, F.; et al. Mott transition in VO2 revealed by infrared spectroscopy and nano-imaging. Science 2007, 318, 1750. [Google Scholar] [CrossRef]
  9. Lu, T.J.; Fleck, N.A. The thermal shock resistance of solids. Acta Mater. 1998, 46, 4755. [Google Scholar] [CrossRef]
  10. Rao, C.N.R. Transition metal oxides. Annu. Rev. Phys. Chem. 1989, 40, 291. [Google Scholar] [CrossRef]
  11. Saidi, H.; Roudini, G.; Afarani, M.S. High-volume-fraction Cu/Al2O3-SiC hybrid interpenetrating phase composite. Appl. Phys. A 2015, 121, 109. [Google Scholar] [CrossRef]
  12. Xin, D.Y.; Komatsu, K.; Abe, K.; Costa, T.; Ikeda, Y.; Nakamura, A.; Ohshio, S.; Saitoh, H. Heat-shock properties in yttrium-oxide films synthesized from metal-ethylenediamine tetraacetic acid complex through flame-spray apparatus. Appl. Phys. A 2017, 123, 194. [Google Scholar] [CrossRef]
  13. Case, E.D. Thermal fatigue and waste heat recovery via thermoelectrics. J. Electron. Mater. 2012, 41, 1811. [Google Scholar] [CrossRef]
  14. Krupke, W.F.; Shinn, M.D.; Marion, J.E.; Caird, J.A.; Stokowski, S.E. Spectroscopic, optical, and thermomechanical properties of neodymium- and chromium-doped gadolinium scandium gallium garnet. J. Opt. Soc. Am. B 1986, 3, 102. [Google Scholar] [CrossRef]
  15. Music, D.; Bliem, P.; Hans, M. Holistic quantum design of thermoelectric niobium oxynitride. Solid State Commun. 2015, 212, 5. [Google Scholar] [CrossRef]
  16. Music, D.; Geyer, R.W.; Schneider, J.M. Recent progress and new directions in density functional theory based design of hard coatings. Surf. Coat. Technol. 2016, 286, 178. [Google Scholar] [CrossRef]
  17. Hohenberg, P.; Kohn, W. Inhomogeneous electron gas. Phys. Rev. 1964, 136, B864–B871. [Google Scholar] [CrossRef]
  18. Slack, G.A. Nonmetallic crystals with high thermal conductivity. J. Phys. Chem. Solids 1973, 34, 321. [Google Scholar] [CrossRef]
  19. Söderlind, P.; Nordström, L.; Yongming, L.; Johansson, B. Relativistic effects on the thermal expansion of the actinide elements. Phys. Rev. B 1990, 42, 4544. [Google Scholar] [CrossRef] [PubMed]
  20. El-Raghy, T.; Barsoum, M.W.; Zavaliangos, A.; Kalidini, S.R. Processing and mechanical properties of Ti3SiC2: II, effect of grain size and deformation temperature. J. Am. Ceram. Soc. 1999, 82, 2855. [Google Scholar] [CrossRef]
  21. Feng, B.; Li, Z.; Zhang, X. Prediction of size effect on thermal conductivity of nanoscale metallic films. Thin Solid Films 2009, 517, 2803. [Google Scholar] [CrossRef]
  22. Music, D.; Kremer, O.; Pernot, G.; Schneider, J.M. Designing low thermal conductivity of RuO2 for thermoelectric applications. Appl. Phys. Lett. 2015, 106, 063906. [Google Scholar] [CrossRef]
  23. Daniel, R.; Holec, D.; Bartosik, M.; Keckes, J.; Mitterer, C. Size effect of thermal expansion and thermal/intrinsic stresses in nanostructured thin films: Experiment and model. Acta Mater. 2011, 59, 6631. [Google Scholar] [CrossRef]
  24. Zhang, J.; Estévez, D.; Zhao, Y.-Y.; Huo, L.; Chang, C.; Wang, X.; Li, R.-W. Flexural strength and Weibull analysis of bulk metallic glasses. J. Mater. Sci. Technol. 2016, 32, 129. [Google Scholar] [CrossRef]
  25. Kresse, G.; Hafner, J. Ab initio molecular dynamics for open-shell transition metals. Phys. Rev. B 1993, 48, 13115–13118. [Google Scholar] [CrossRef]
  26. Kresse, G.; Hafner, J. Ab initio molecular-dynamics simulation of the liquid-metal-amorphous-semiconductor transition in germanium. Phys. Rev. B 1994, 49, 14251–14271. [Google Scholar] [CrossRef]
  27. Kresse, G.; Joubert, D. From ultrasoft pseudopotentials to the projector augmented wave method. Phys. Rev. B 1999, 59, 1758–1775. [Google Scholar] [CrossRef]
  28. Perdew, J.P.; Burke, K.; Ernzerhof, M. Generalized gradient approximation made simple. Phys. Rev. Lett. 1996, 77, 3865–3868. [Google Scholar] [CrossRef]
  29. Blöchl, P.E. Projector augmented-wave method. Phys. Rev. B 1994, 50, 17953–17979. [Google Scholar] [CrossRef] [Green Version]
  30. Monkhorst, H.J.; Pack, J.D. Special points for Brillouin-zone integrations. Phys. Rev. B 1976, 13, 5188–5192. [Google Scholar] [CrossRef]
  31. Momma, K.; Izumi, F. VESTA: A three-dimensional visualization system for electronic and structural analysis. J. Appl. Cryst. 2008, 41, 653. [Google Scholar] [CrossRef]
  32. Morelli, D.T.; Heremans, J.P. Thermal conductivity of germanium, silicon, and carbon nitrides. Appl. Phys. Lett. 2002, 81, 5126. [Google Scholar] [CrossRef]
  33. Sanditov, B.D.; Tsydypov, S.B.; Sanditov, D.S. Relation between the Grüneisen constant and Poisson’s ratio of vitreous systems. Acoust. Phys. 2007, 53, 594. [Google Scholar] [CrossRef]
  34. Wang, H.-F.; Chu, W.-G.; Guo, Y.-J.; Jin, H. Thermal transport property of Ge34 and d-Ge investigated by molecular dynamics and the Slack’s equation. Chin. Phys. B 2010, 19, 076501. [Google Scholar] [CrossRef]
  35. Sun, Z.; Li, S.; Ahuja, R.; Schneider, J.M. Calculated elastic properties of M2AlC (M = Ti, V, Cr, Nb and Ta). Solid State Commun. 2004, 129, 589. [Google Scholar] [CrossRef]
  36. Mehl, M.J.; Osburn, J.E.; Papaconstantopoulos, D.A.; Klein, B.M. Structural properties of ordered high-melting-temperature intermetallic alloys from first-principles total-energy calculations. Phys. Rev. B 1990, 41, 10311. [Google Scholar] [CrossRef]
  37. Hill, R. The elastic behaviour of a crystalline aggregate. Proc. Phys. Soc. Lond. 1952, 65, 349. [Google Scholar] [CrossRef]
  38. Music, D.; Geyer, R.W.; Keuter, P. Thermomechanical response of thermoelectrics. Appl. Phys. Lett. 2016, 109, 223903. [Google Scholar] [CrossRef]
  39. Evertz, S.; Music, D.; Schnabel, V.; Bednarcik, J.; Schneider, J.M. Thermal expansion of Pd-based metallic glasses by ab initio methods and high energy x-ray diffraction. Sci. Rep. 2017, 7, 15744. [Google Scholar] [CrossRef]
  40. Birch, F. Finite strain isotherm and velocities for single-crystal and polycrystalline NaCl at high pressures and 300 K. J. Geophys. Res. 1978, 83, 1257. [Google Scholar] [CrossRef]
  41. Blanco, M.A.; Pendás, A.M.; Francisco, E.; Recio, J.M.; Franco, R. Thermodynamical properties of solids from microscopic theory: Applications to MgF2 and Al2O3. J. Mol. Struct. 1996, 368, 245. [Google Scholar] [CrossRef]
  42. Rao, K.V.K.; Naidu, S.V.N.; Iyengar, L. Thermal expansion of rutile and anatase. J. Am. Ceram. Soc. 1970, 53, 124. [Google Scholar] [CrossRef]
  43. Kim, D.J.; Kim, D.S.; Cho, S.; Kim, S.W.; Lee, S.H.; Kim, J.C. Measurement of thermal conductivity of TiO2 thin films using 3ω method. Int. J. Thermophys. 2004, 25, 281. [Google Scholar] [CrossRef]
  44. Wu, M.; Liang, Y.; Jiang, J.-Z.; Tse, J.S. Structure and properties of dense silica glass. Sci. Rep. 2012, 2, 398. [Google Scholar] [CrossRef] [PubMed]
  45. Scanlon, D.O.; Kehoe, A.B.; Watson, G.W.; Jones, M.O.; David, W.I.F.; Payne, D.J.; Egdell, R.G.; Edwards, P.P. Nature of the band gap and origin of the conductivity of PbO2 revealed by theory and experiment. Phys. Rev. Lett. 2011, 107, 246402. [Google Scholar] [CrossRef] [PubMed]
  46. Nordling, C.; Österman, J. Physics Handbook for Science and Engineering; Studentlitteratur: Lund, Sweden, 1996. [Google Scholar]
  47. Bodnar, I.V. Thermal expansion and thermal conductivity of In2S3 and CuIn5S8 compounds and (CuIn5S8)1−x(In2S3)x alloys. Semiconductors 2014, 48, 557. [Google Scholar] [CrossRef]
  48. Munro, R.G. Material properties of a sintered α-SiC. J. Phys. Chem. Ref. Data 1997, 26, 1195. [Google Scholar] [CrossRef]
  49. Talwar, D.N.; Sherbondy, J.C. Thermal expansion coefficient of 3C-SiC. Appl. Phys. Lett. 1995, 67, 3301. [Google Scholar] [CrossRef]
  50. Roder, C.; Einfeldt, S.; Figge, S.; Hommel, D. Temperature dependence of the thermal expansion of GaN. Phys. Rev. B 2005, 72, 085218. [Google Scholar] [CrossRef]
  51. Shibata, H.; Waseda, Y.; Ohta, H.; Kiyomi, K.; Shimoyama, K.; Fujito, K.; Nagaoka, H.; Kagamitani, Y.; Simura, R.; Fukuda, T. High thermal conductivity of gallium nitride (GaN) crystals grown by HVPE process. Mater. Trans. 2007, 48, 2782. [Google Scholar] [CrossRef]
  52. Pavlova, L.M.; Shtern, Y.I.; Mironov, R.E. Thermal expansion of bismuth telluride. High Temp. 2011, 49, 369. [Google Scholar] [CrossRef]
  53. Tian, Z.; Garg, J.; Esfarjani, K.; Shiga, T.; Shiomi, J.; Chen, G. Phonon conduction in PbSe, PbTe, and PbTe1-xSex from first-principles calculations. Phys. Rev. B 2012, 85, 184303. [Google Scholar] [CrossRef]
  54. Ouyang, T.; Hu, M. Competing mechanism driving diverse pressure dependence of thermal conductivity of XTe (X = Hg, Cd, and Zn). Phys. Rev. B 2015, 92, 235204. [Google Scholar] [CrossRef]
  55. Albertsson, J.; Abrahms, S.C. Atomic displacement, anharmonic thermal vibration, expansivity and pyroelectric coefficient thermal dependences in ZnO. Acta Cryst. B 1989, 45, 34. [Google Scholar] [CrossRef]
  56. Xu, Y.; Goto, M.; Kato, R.; Tanaka, Y.; Kagawa, Y. Thermal conductivity of ZnO thin film produced by reactive sputtering. J. Appl. Phys. 2012, 111, 084320. [Google Scholar] [CrossRef]
  57. Ligny, D.D.; Richet, P. High-temperature heat capacity and thermal expansion of SrTiO3 and SrZrO3 perovskites. Phys. Rev. B 1996, 53, 3013. [Google Scholar] [CrossRef]
  58. Yu, C.; Scullin, M.L.; Huijben, M.; Ramesh, R.; Majumdar, A. Thermal conductivity reduction in oxygen-deficient strontium titanates. Appl. Phys. Lett. 2008, 92, 191911. [Google Scholar] [CrossRef]
  59. Tong, H.M.; Hsuen, H.K.D.; Saenger, K.L.; Su, G.W. Thickness-direction coefficient of thermal expansion measurement of thin polymer films. Rev. Sci. Instrum. 1991, 62, 422. [Google Scholar] [CrossRef]
  60. Al-Ghamdi, A.A.; Al-Salamy, F.; Al-Hartomy, O.A.; Al-Ghamdi, A.A.; Daiem, A.M.A.; El-Tantawy, F. Thermophysical properties of foliated graphite/nickel reinforced polyvinyl chloride nanocomposites. J. Appl. Polym. Sci. 2012, 124, 1144. [Google Scholar] [CrossRef]
  61. Yue, S.-Y.; Qin, G.; Zhang, X.; Sheng, X.; Su, G.; Hu, M. Thermal transport in novel carbon allotropes with sp2 or sp3 hybridization: An ab initio study. Phys. Rev. B 2017, 95, 085207. [Google Scholar] [CrossRef]
  62. Liu, H.; Qin, G.; Lin, Y.; Hu, M. Disparate strain dependent thermal conductivity of twodimensional penta-structures. Nano Lett. 2016, 16, 3831. [Google Scholar] [CrossRef] [PubMed]
  63. Shojaee, E.; Mohammadizadeh, M.R. First-principles elastic and thermal properties of TiO2: A phonon approach. J. Phys. Condens. Matter 2010, 22, 015401. [Google Scholar] [CrossRef] [PubMed]
  64. Bohnen, K.-P.; Heid, R.; de la Pena Seaman, O.; Renker, B.; Adelmann, P.; Schober, H. Lattice dynamics of RuO2: Theory and experiment. Phys. Rev. B 2007, 75, 092301. [Google Scholar] [CrossRef]
  65. Isaak, D.G.; Carnes, J.D.; Anderson, O.L.; Cynn, H.; Hake, E. Elasticity of TiO2 rutile to 1800 K. Phys. Chem. Minerals 1998, 26, 31. [Google Scholar] [CrossRef]
  66. Haines, J.; Léger, J.M.; Hoyau, S. Second-order rutile-type to CaCl2-type phase transition in β-MnO2 at high pressure. J. Phys. Chem. Solids 1995, 56, 965. [Google Scholar] [CrossRef]
  67. Haines, J.; Léger, J.M.; Pereira, A.S.; Häusermann, D.; Hanfland, M. High-pressure structural phase transitions in semiconducting niobium dioxide. Phys. Rev. B 1999, 59, 13650. [Google Scholar] [CrossRef]
  68. Zheng, J.-C. Superhard hexagonal transition metal and its carbide and nitride: Os, OsC, and OsN. Phys. Rev. B 2005, 72, 052105. [Google Scholar] [CrossRef]
  69. Ono, S.; Kikegawa, T.; Ohishi, Y. High-pressure and high-temperature synthesis of a cubic IrO2 polymorph. Physica B 2005, 363, 140. [Google Scholar] [CrossRef]
  70. Grocholski, B.; Shim, S.-H.; Cottrell, E.; Prakapenka, V.B. Crystal structure and compressibility of lead dioxide up to 140 GPa. Am. Mineral. 2014, 99, 170. [Google Scholar] [CrossRef]
  71. Ross, N.L.; Shu, J.-F.; Hazen, R.M.; Gasparik, T. High-pressure crystal chemistry of stishovite. Am. Mineral. 1990, 75, 739. [Google Scholar]
  72. Paier, J.; Marsman, M.; Hummer, K.; Kresse, G.; Gerber, I.C.; Ángyán, J.G. Screened hybrid density functionals applied to solids. J. Chem. Phys. 2006, 124, 154709. [Google Scholar] [CrossRef] [PubMed] [Green Version]
  73. Burdett, J.K.; Hughbanks, T.; Miller, G.J.; Richardson, J.W., Jr.; Smith, J.V. Structural-electronic relationships in inorganic solids: Powder neutron diffraction studies of the rutile and anatase polymorphs of titanium dioxide at 15 and 295 K. J. Am. Chem. Soc. 1987, 109, 3639. [Google Scholar] [CrossRef]
  74. Zhang, H.B.; Zhou, Y.C.; Bao, Y.W.; Li, M.S. Abnormal thermal shock behavior of Ti3SiC2 and Ti3AlC2. J. Mater. Res. 2006, 21, 2401. [Google Scholar] [CrossRef]
  75. Barsoum, M.W.; Radovic, M. Elastic and mechanical properties of the MAX phases. Annu. Rev. Mater. Res. 2011, 41, 195. [Google Scholar] [CrossRef]
  76. Chen, H.C.; Pfender, E.; Heberlein, J. Plasma-sprayed ZrO2 thermal barrier coatings doped with an appropriate amount of SiO2. Thin Solid Films 1998, 315, 159. [Google Scholar] [CrossRef]
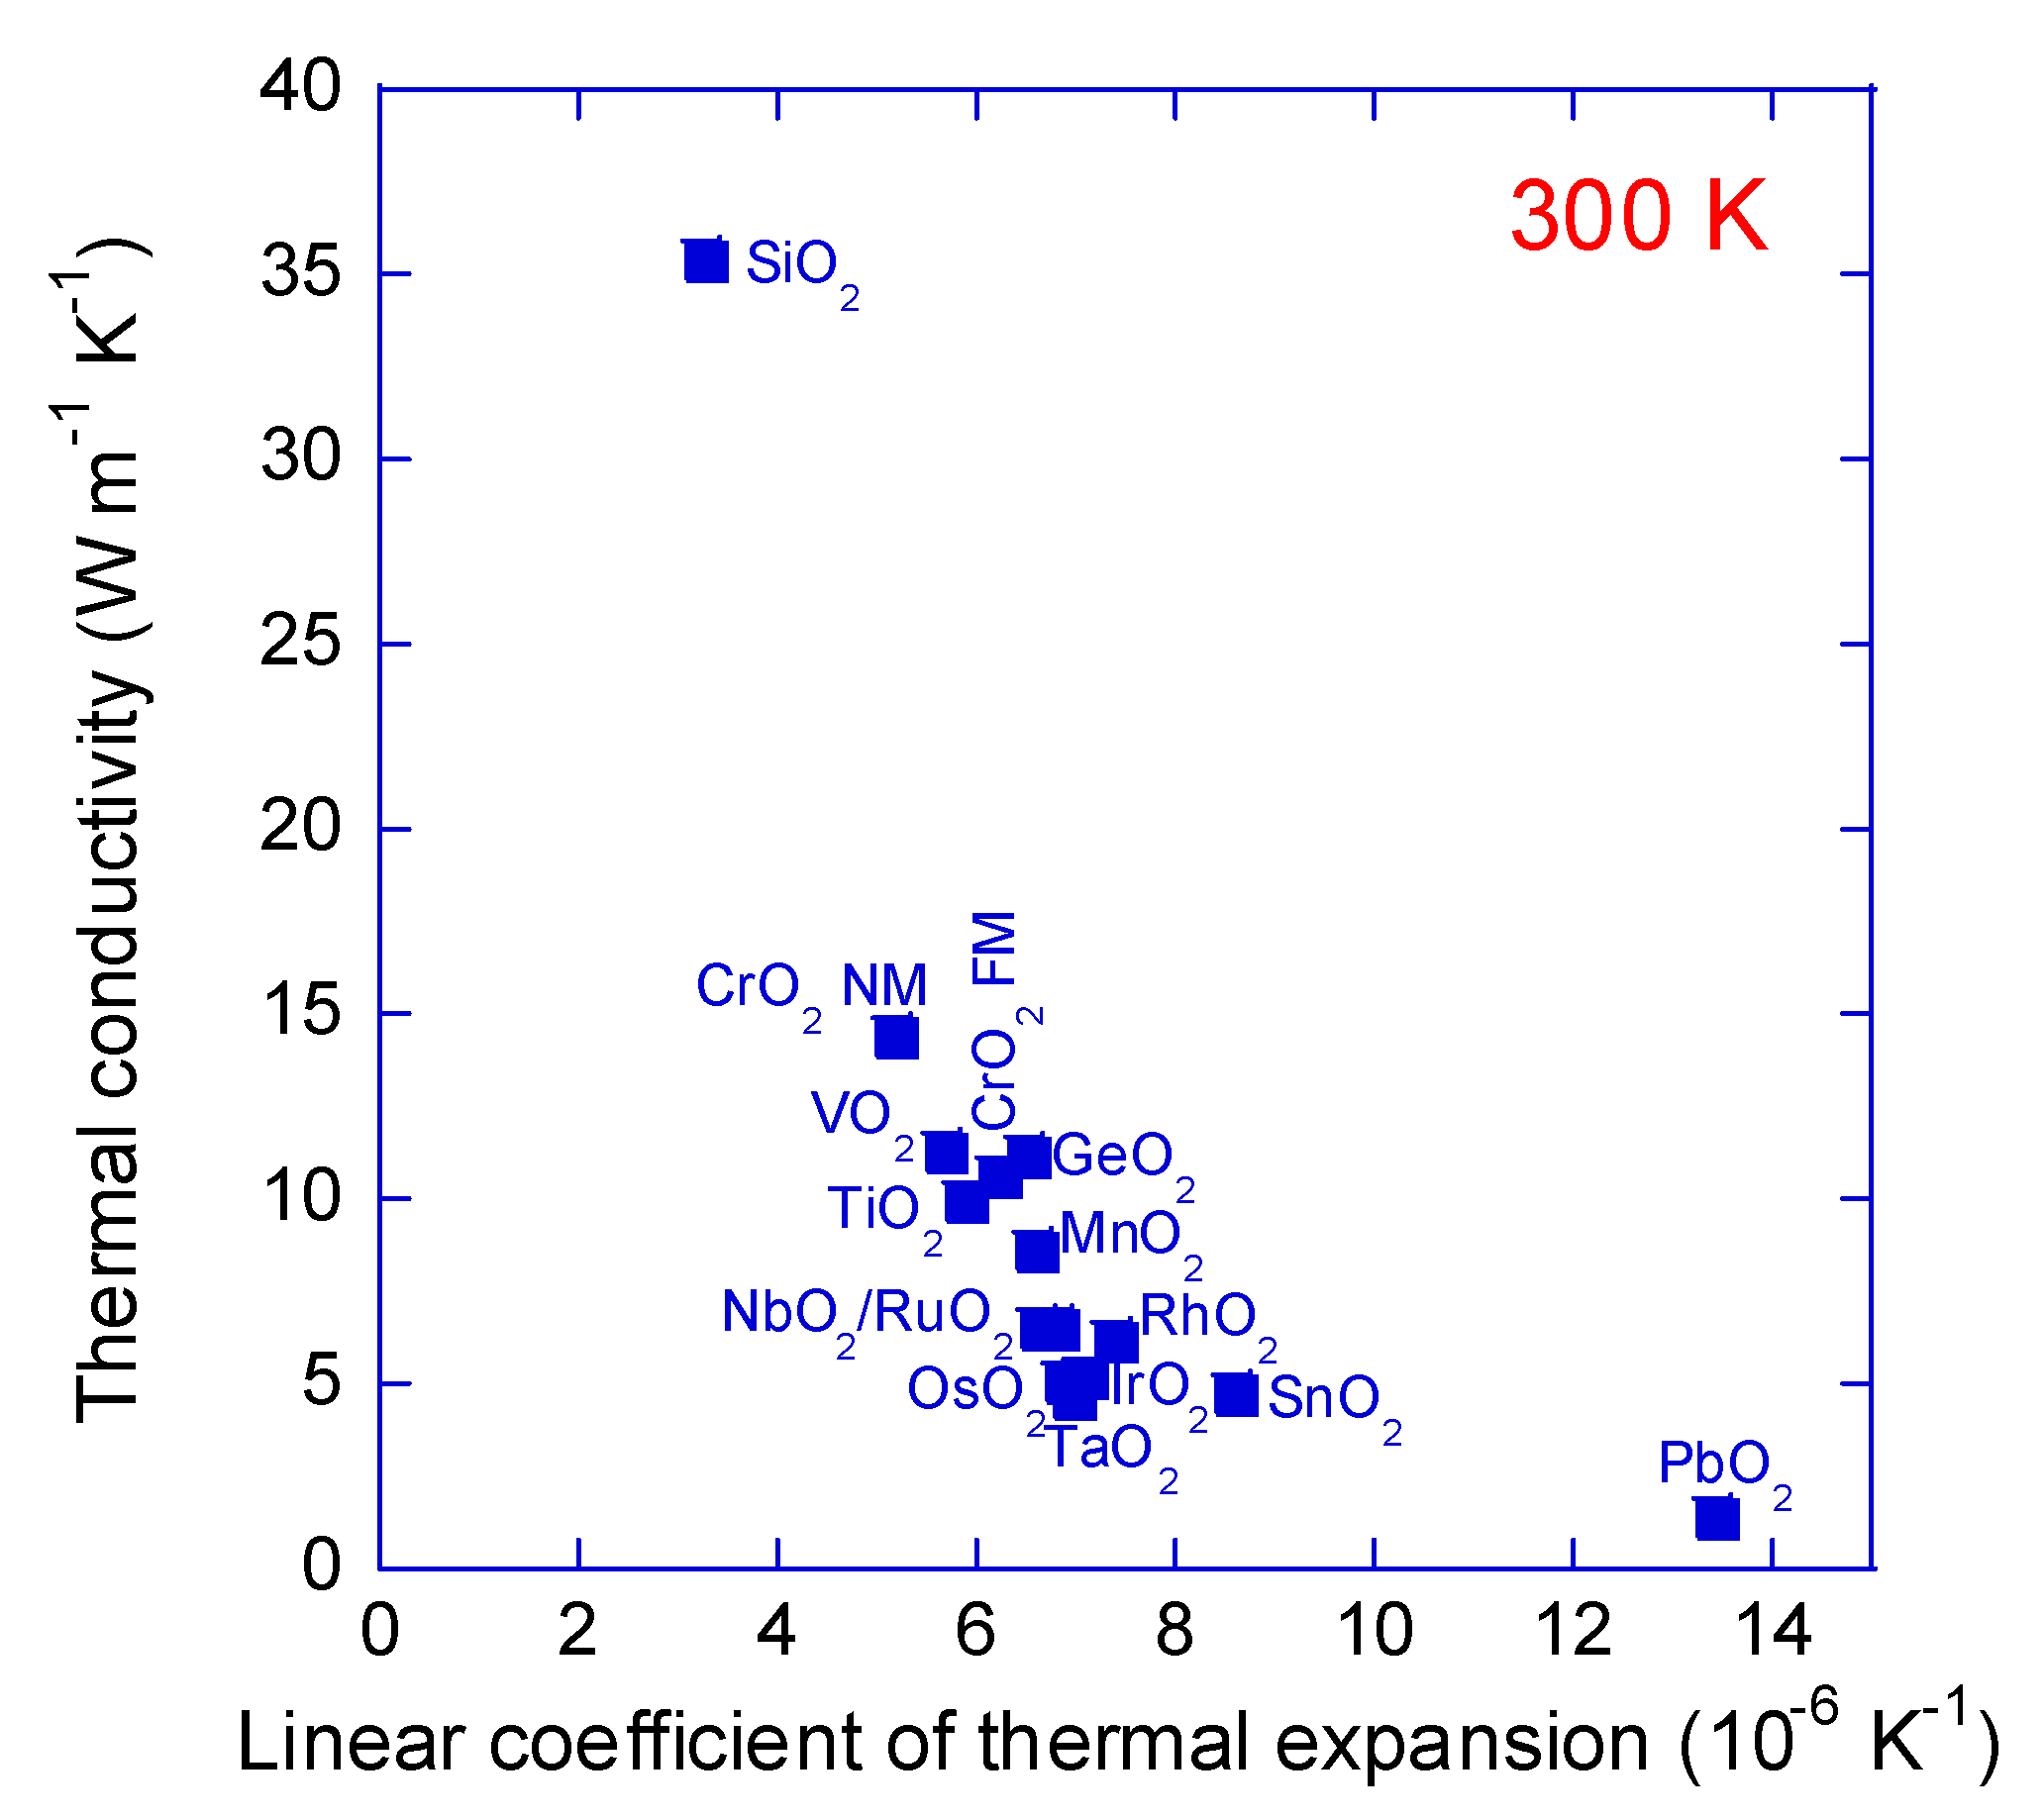
Figure 1. Calculated thermal conductivity as a function of the linear coefficient of thermal expansion for common rutile oxides. The data were obtained at 300 K. In the case of CrO2, nonmagnetic and ferromagnetic (FM) configurations were considered.
Physics 01 00022 g001
Figure 2. Electron density distribution in the (110) plane for rutile SiO2 and PbO2. The distribution scale is identical for these two configurations. The arrows indicate the bond lengths.
Physics 01 00022 g002
Figure 3. Calculated thermal conductivity as a function of the linear coefficient of thermal expansion for common rutile oxides (), as designated in Figure 1. A comparison is made to previously reported values for various systems () [13,42,43,46,47,48,49,50,51,52,53,54,55,56,57,58,59,60]. The solid line corresponds to an inverse square fit (κ = 763 α−2, κ in units of W m−1 K−1, α in units of 10−6 K−1).
Physics 01 00022 g003
Figure 4. Calculated elastic modulus as a function of temperature for common rutile oxides. In the case of CrO2, nonmagnetic and ferromagnetic (FM) configurations were considered. The data points are connected to guide the eye. SiO2 and PbO2 constitute the upper and lower bound, respectively.
Physics 01 00022 g004
Figure 5. Calculated intrinsic thermal shock parameter as a function of temperature for common rutile oxides. No flexural strength values are included. The data points are connected to guide the eye. In the case of CrO2, nonmagnetic and ferromagnetic (FM) configurations were considered. The measured room-temperature data for Ti3SiC2 [74,75] and Al2O3 [14], known thermal shock resistant phases, are also added.
Physics 01 00022 g005