
Hybrid-Pipeline-Based Detection and Classification of HTTP Slow Denial-of-Service Attacks Using Radial Basis Function Neural Networks



Abstract
1. Introduction
- ML-based detection methods: ML has been applied to detect DoS and slow DoS attacks in software-defined networks (SDNs). Although an accuracy of up to 99.8% was achieved by utilizing RF and Dimensionality Reduction (DR), RF exhibited limited scalability [6]. The C4.5 Decision Tree implementation (J48) was found to be efficient for slow DoS detection with a low computational cost; however, the authors also emphasized that careful feature selection is necessary [7]. Using J48, RF, and PART, these methods were further evaluated on publicly available datasets [8]. Despite showing high accuracy, the hazards of overfitting remained a problem to be addressed. K-Nearest Neighbors (KNNs) were demonstrated to be efficient, especially in low-dimensional environments [9]; however, similar to RF, their scalability was also limited. Luong et al. [10] demonstrated that naive Bayes is advantageous for initial detection; however, its accuracy is degraded in complex circumstances.
- DL-based detection methods: The ability of LSTM models to detect slow DoS attacks was investigated based on the CSE-CIC-IDS2018 dataset, achieving up to 99% accuracy by capturing temporal patterns but requiring high computational costs [11]. The hybrid CNN-LSTM model can further enhance spatial and temporal feature extraction, achieving comparable accuracy. However, it also led to a higher complexity, which makes it difficult to deploy real-time applications. A Multilayer Perceptron (MLP)-based method achieved an accuracy level of ~99% across various attack types [12]. Such flexibility is desirable; however, its efficiency and temporal awareness are unsatisfactory in high-dimensional data. Although they were susceptible to parameter adjustment, RBFNN offered 95.78% accuracy with effective nonlinear pattern recognition. With the combination of autoencoders to enhance feature learning, its accuracy was further improved to 98%; however, the multi-stage architecture of such a combined model also posed scalability limitations [13].
- Hybrid and ensemble approaches: Feature engineering is capable of increasing classifier efficiency and accuracy while reducing the computing burden by focusing on pertinent features. Yet manual engineering may make it more difficult to respond to new assaults [11]. Although clustering techniques may yield more false positives for unknown attack types, dimensionality reduction techniques like Principal Component Analysis (PCA), when paired with Density-Based Spatial Clustering of Applications with Noise (DBSCAN), can contribute to effective anomaly detection [14]. To overcome their high processing requirements and tuning complexity, stacked autoencoders combined with RBFNNs enabled accurate classification through dimensionality reduction [5]. Despite the vast preprocessing required, this kind of feature and model optimization strategies resulted in increased processing efficiency and accuracy (up to 99.93%) [4]. Feature ranking, integrated with J48 and RF, also attained equivalent accuracy with reduced costs on complex datasets, albeit with constrained adaptability to emerging threats [15]. A multilayered classification strategy based on SVM and RF demonstrated an enhanced ability to differentiate attack types and reduced false alarms [16]. However, frequent updates were required, resulting in a heavier computational burden.
- Threshold-based and heuristic methods: By applying a heuristic threshold-based technique to selectively disconnect connections lasting longer than a predefined time threshold, its resilience against slow HTTP DoS attacks was confirmed [17]. This lightweight technique is resource-efficient and straightforward, making it suitable for environments with limited resources. However, fixed thresholds may struggle to detect adaptive or complex patterns of slow DoS attacks due to their limited flexibility. By optimizing server parameters, prevention tactics for slow HTTP attacks were investigated and verified to be resource-efficient and feasible against common slow DoS attacks [18]. However, such a static configuration requires more adaptable solutions to manage complex or changing threats due to its limited flexibility [19].
- Recent Research: Researchers are investigating diverse methodologies for identifying slow-rate and low-intensity denial-of-service (DoS) attacks, which are challenging to detect due to their resemblance to legitimate network activity. Kemp et al. [20] developed a machine learning framework for identifying application-layer DoS attacks by utilizing diverse datasets and employing PCA for feature reduction to enhance classification accuracy. Vladov et al. [21] presented a neural network-based methodology for detecting low-intensity DDoS attacks, enhancing detection accuracy. Chen et al. [22] proposed a feature-driven framework for the effective detection of slow HTTP DoS attacks. Recent studies show that low-rate DDoS attacks can evade traditional detection systems that utilize network traffic volume to recognize attacks [23]. Therefore, researchers are employing diverse learning techniques to uncover such kinds of attacks. Abu Al-Haija et al. [24] have developed a resilient intrusion detection framework to counteract adversarial attacks on low-rate DDoS detection systems. This shows that different types of adversarial attacks can get past standard intrusion detection systems. In the same vein, Droos et al. [25] developed a lightweight intrusion detection framework for LR-DDoS attacks in software-defined IoT networks. To evaluate their framework, they employed the LR-DDoS-2022 dataset to test the performance of J48, Naive Bayes, and Logistic Regression algorithms in detecting LR-DDoS attacks. They reported detecting LR-DDoS attacks with a small number of features, achieving very high accuracy [26].Table 1. Summary of related studies on identifying slow DoS attacks.
Reference Method Key
LimitationsIdentified
GapZhang et al. (2022) [3] RF Requirement of heavy feature engineering; limited adaptability Need for automated feature extraction Gogoi et al. (2022) [26] LSTM High computational cost; unsuitable for real-time use Need for lightweight models Kurnaz et al. (2019) [5] Autoencoder + RBFNN Complex multi-stage framework; low scalability Need for simplified hybrid models Butt HA et al. (2026) [4] ML + Ensemble (RF, KNN, XGBoost) with Dynamic Feature Selection Dependence on SDN-specific dataset; evaluation limited to controlled SDN environments Need for cross-domain validation and lightweight deployment in heterogeneous, non-SDNs. Ahmed et al. (2023) [27] MLP DL Parameter sensitivity; limited interpretability Need for explainable and stable models Luong et al. (2020) [10] ML (RF and DT) Limited dataset diversity Need for robust cross-dataset validation Nugraha et al. (2020) [28] DL in SDN Computational overhead Need for efficiency in real-time settings Kemp et al. (2023) [20] ML classifiers + PCA Dependence on handcrafted features Need for automated feature learning Vladov et al. (2025) [21] Hybrid neural network (CNN + Transformer) High model complexity Need for lightweight models Chen et al. (2025) [22] Feature-driven slow HTTP DoS detection Manual feature design Need for automated feature extraction Bocu et al. (2026) [23] ML-based low-rate DDoS detection Focus on general DDoS Need for HTTP slow-attack classification Abu Al-Haija et al. (2025) [24] GAN-based adversarial IDS evaluation Focus on attack evasion Need for robust detection models Droos et al. (2024) [25] ML-based IDS (J48, NB, Logistic Regression) for LR-DDoS in SD-IoT Evaluated on a limited dataset and binary classification only Need for multi-class deep learning detection

1.1. Our Contributions
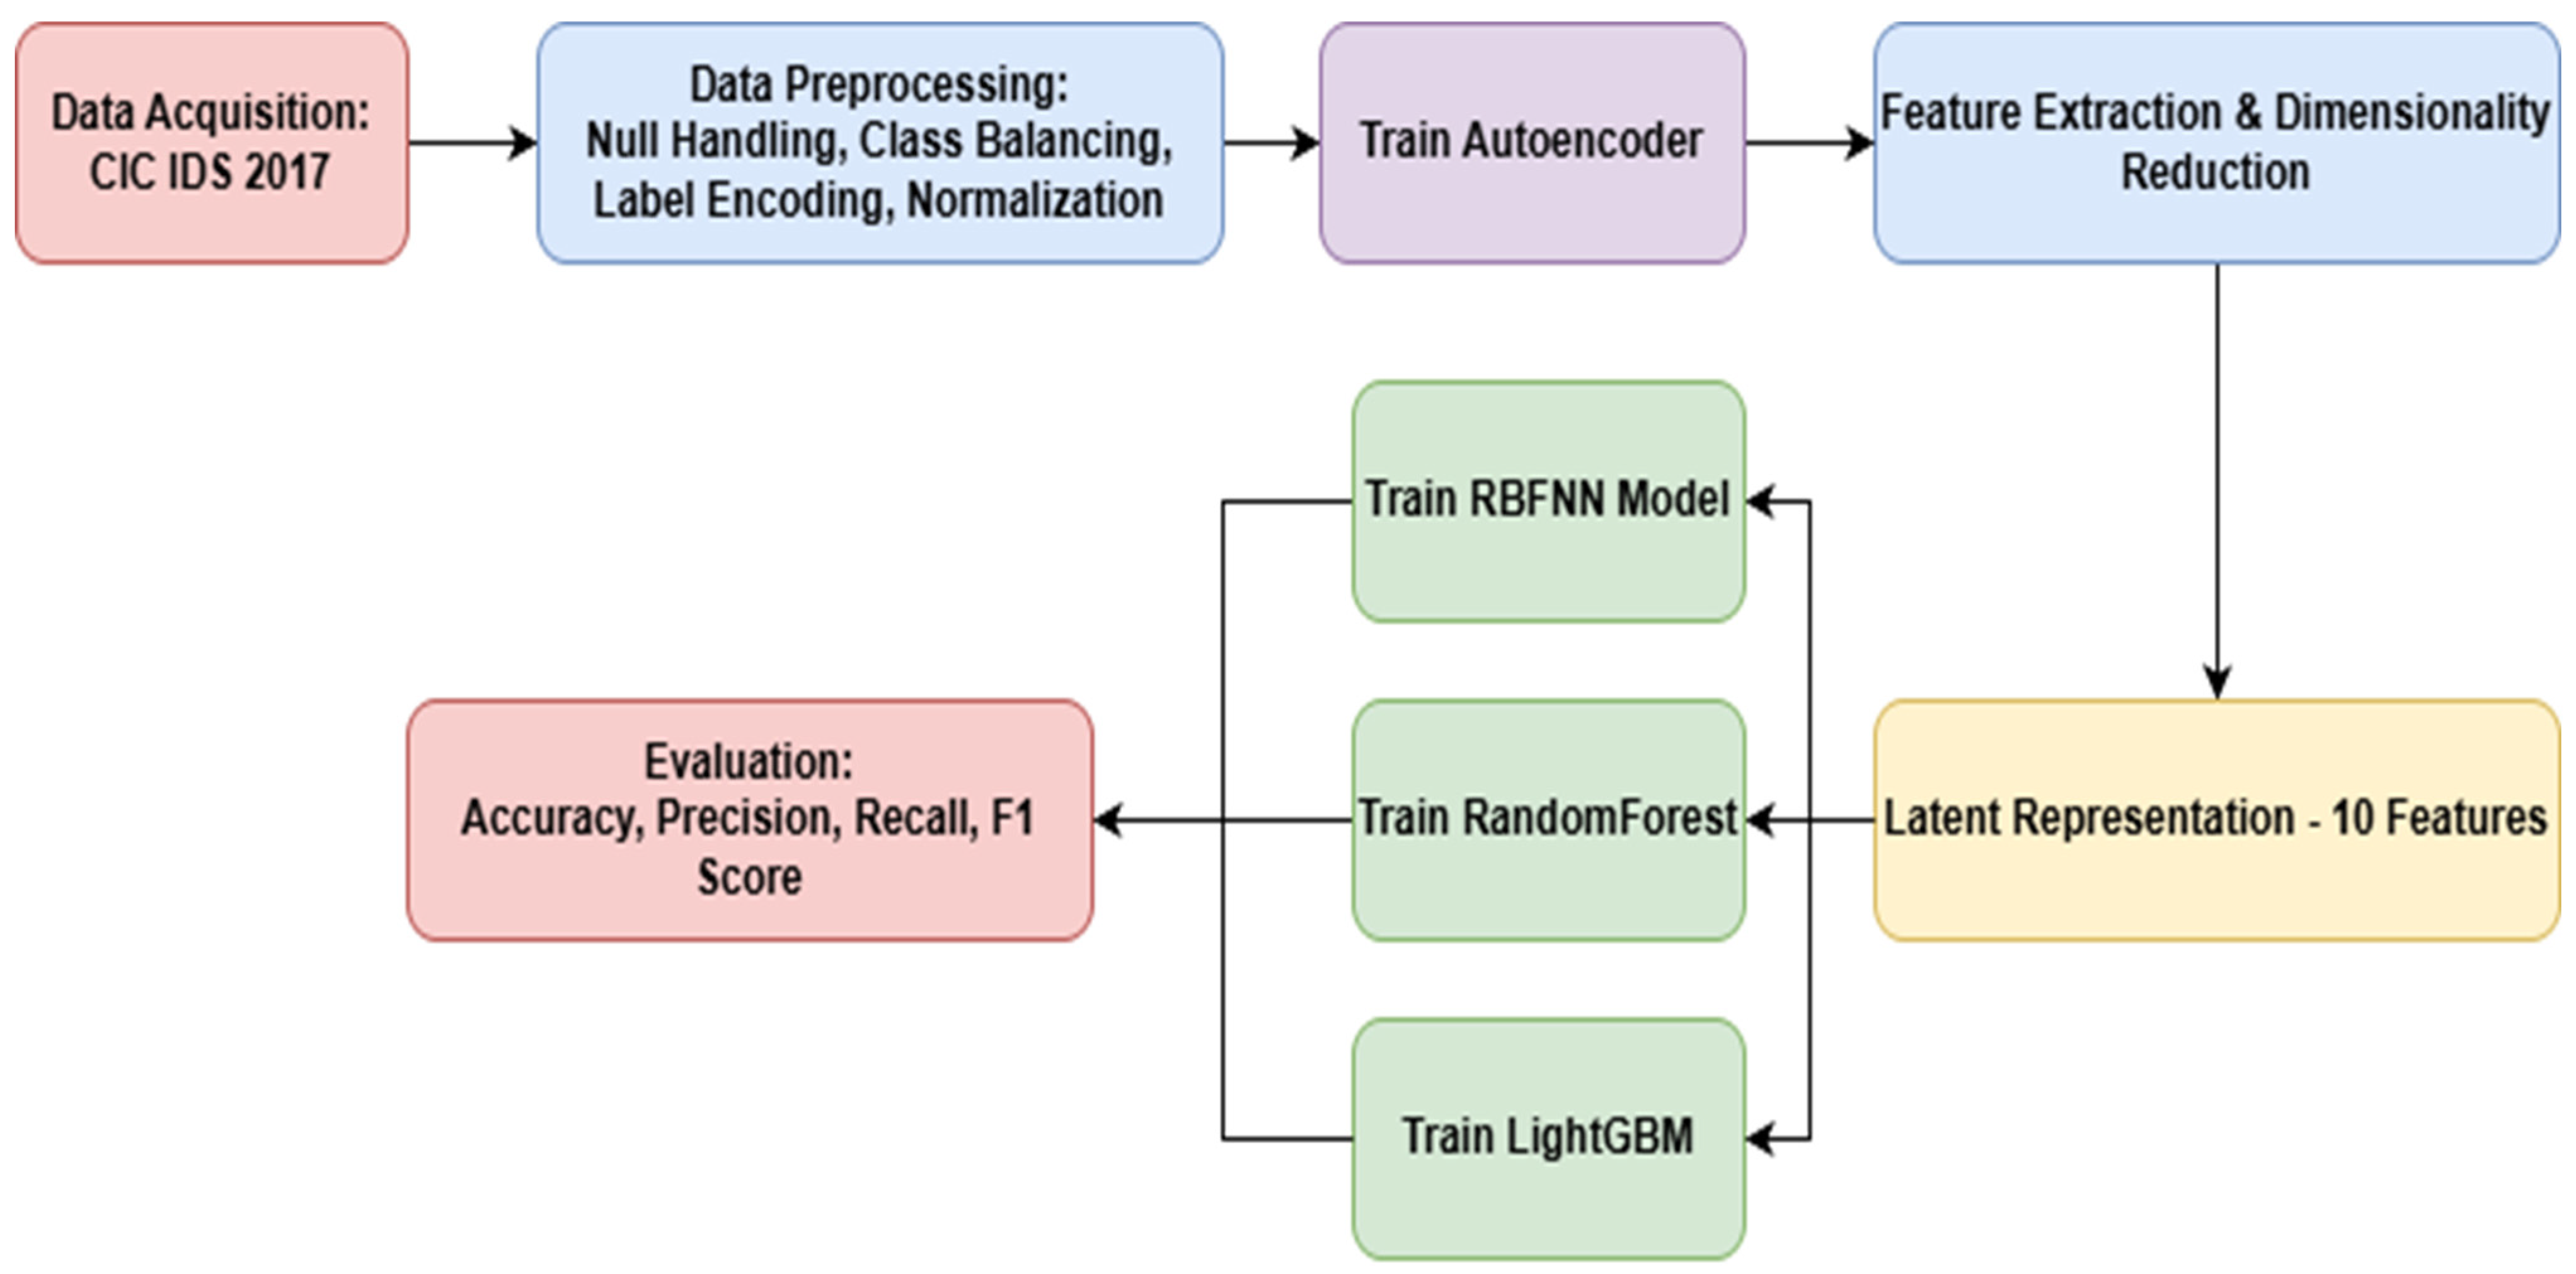
- We propose a lightweight hybrid intrusion detection framework that combines unsupervised feature extraction via autoencoders with powerful classifiers (RBFNN, Random Forest, and LightGBM) to accurately detect and mitigate HTTP slow DoS attacks, while eliminating the need for manual feature engineering.
- We present an extensive experimental evaluation demonstrating that the proposed framework achieves up to 99.39% detection accuracy with reduced computational overhead, validated through cross-validation, per-class accuracy analysis, and multiple performance metrics.
- We provide an efficient and scalable detection pipeline suitable for dynamic and real-time environments, effectively addressing deployment challenges and balancing the trade-offs between accuracy, latency, memory usage, and scalability.
1.2. Paper Structure
2. Low-and-Slow DoS Attacks on HTTP
- i.
- Slowloris attack: This attack targets web servers by sending partial HTTP requests slowly and deliberately, thereby creating many connections. The attacker maintains control of these connections and prevents the server from ending them by sending headers regularly. As the server devotes resources to numerous open connections and eventually hits its connection limit, this extended interaction with the server causes resource depletion [9].
- ii.
- Slow POST attack: In a slow POST attack, the attacker uses a legitimate HTTP POST method by setting a very high value for the “content-length” field in the request. Upon receiving this request, the server allocates the necessary resources to process the specified content-length data. Later, the client sends the data extremely slowly, resulting in a prolonged open connection on the server [27,28,29].
- iii.
- Slow read attack: In a slow read attack, the client sends legitimate HTTP requests to the server and reads the response at a very slow rate. The attacker prevents the server from resetting the connection by setting the zero-window size in the packet. Upon receiving the packet with zero window size, the server considers that the client is reading the data and keeping the connection open [27].
3. Methodology
3.1. Data Preparation
- Cleaning: The dataset was examined for missing or null values. The records with incomplete or missing critical fields were removed to maintain the integrity and reliability of the data used in the experiments. The records containing null values in essential flow features were also removed because they were non-recoverable and closely tied to protocol-level behaviors. Imputing such values would introduce artificial patterns into the traffic distribution, reducing the reliability of the subsequent classification models. Since the proportion of discarded records was very small relative to the total dataset, their removal had no material impact on the class distributions or the statistical representativeness of the experimental data.
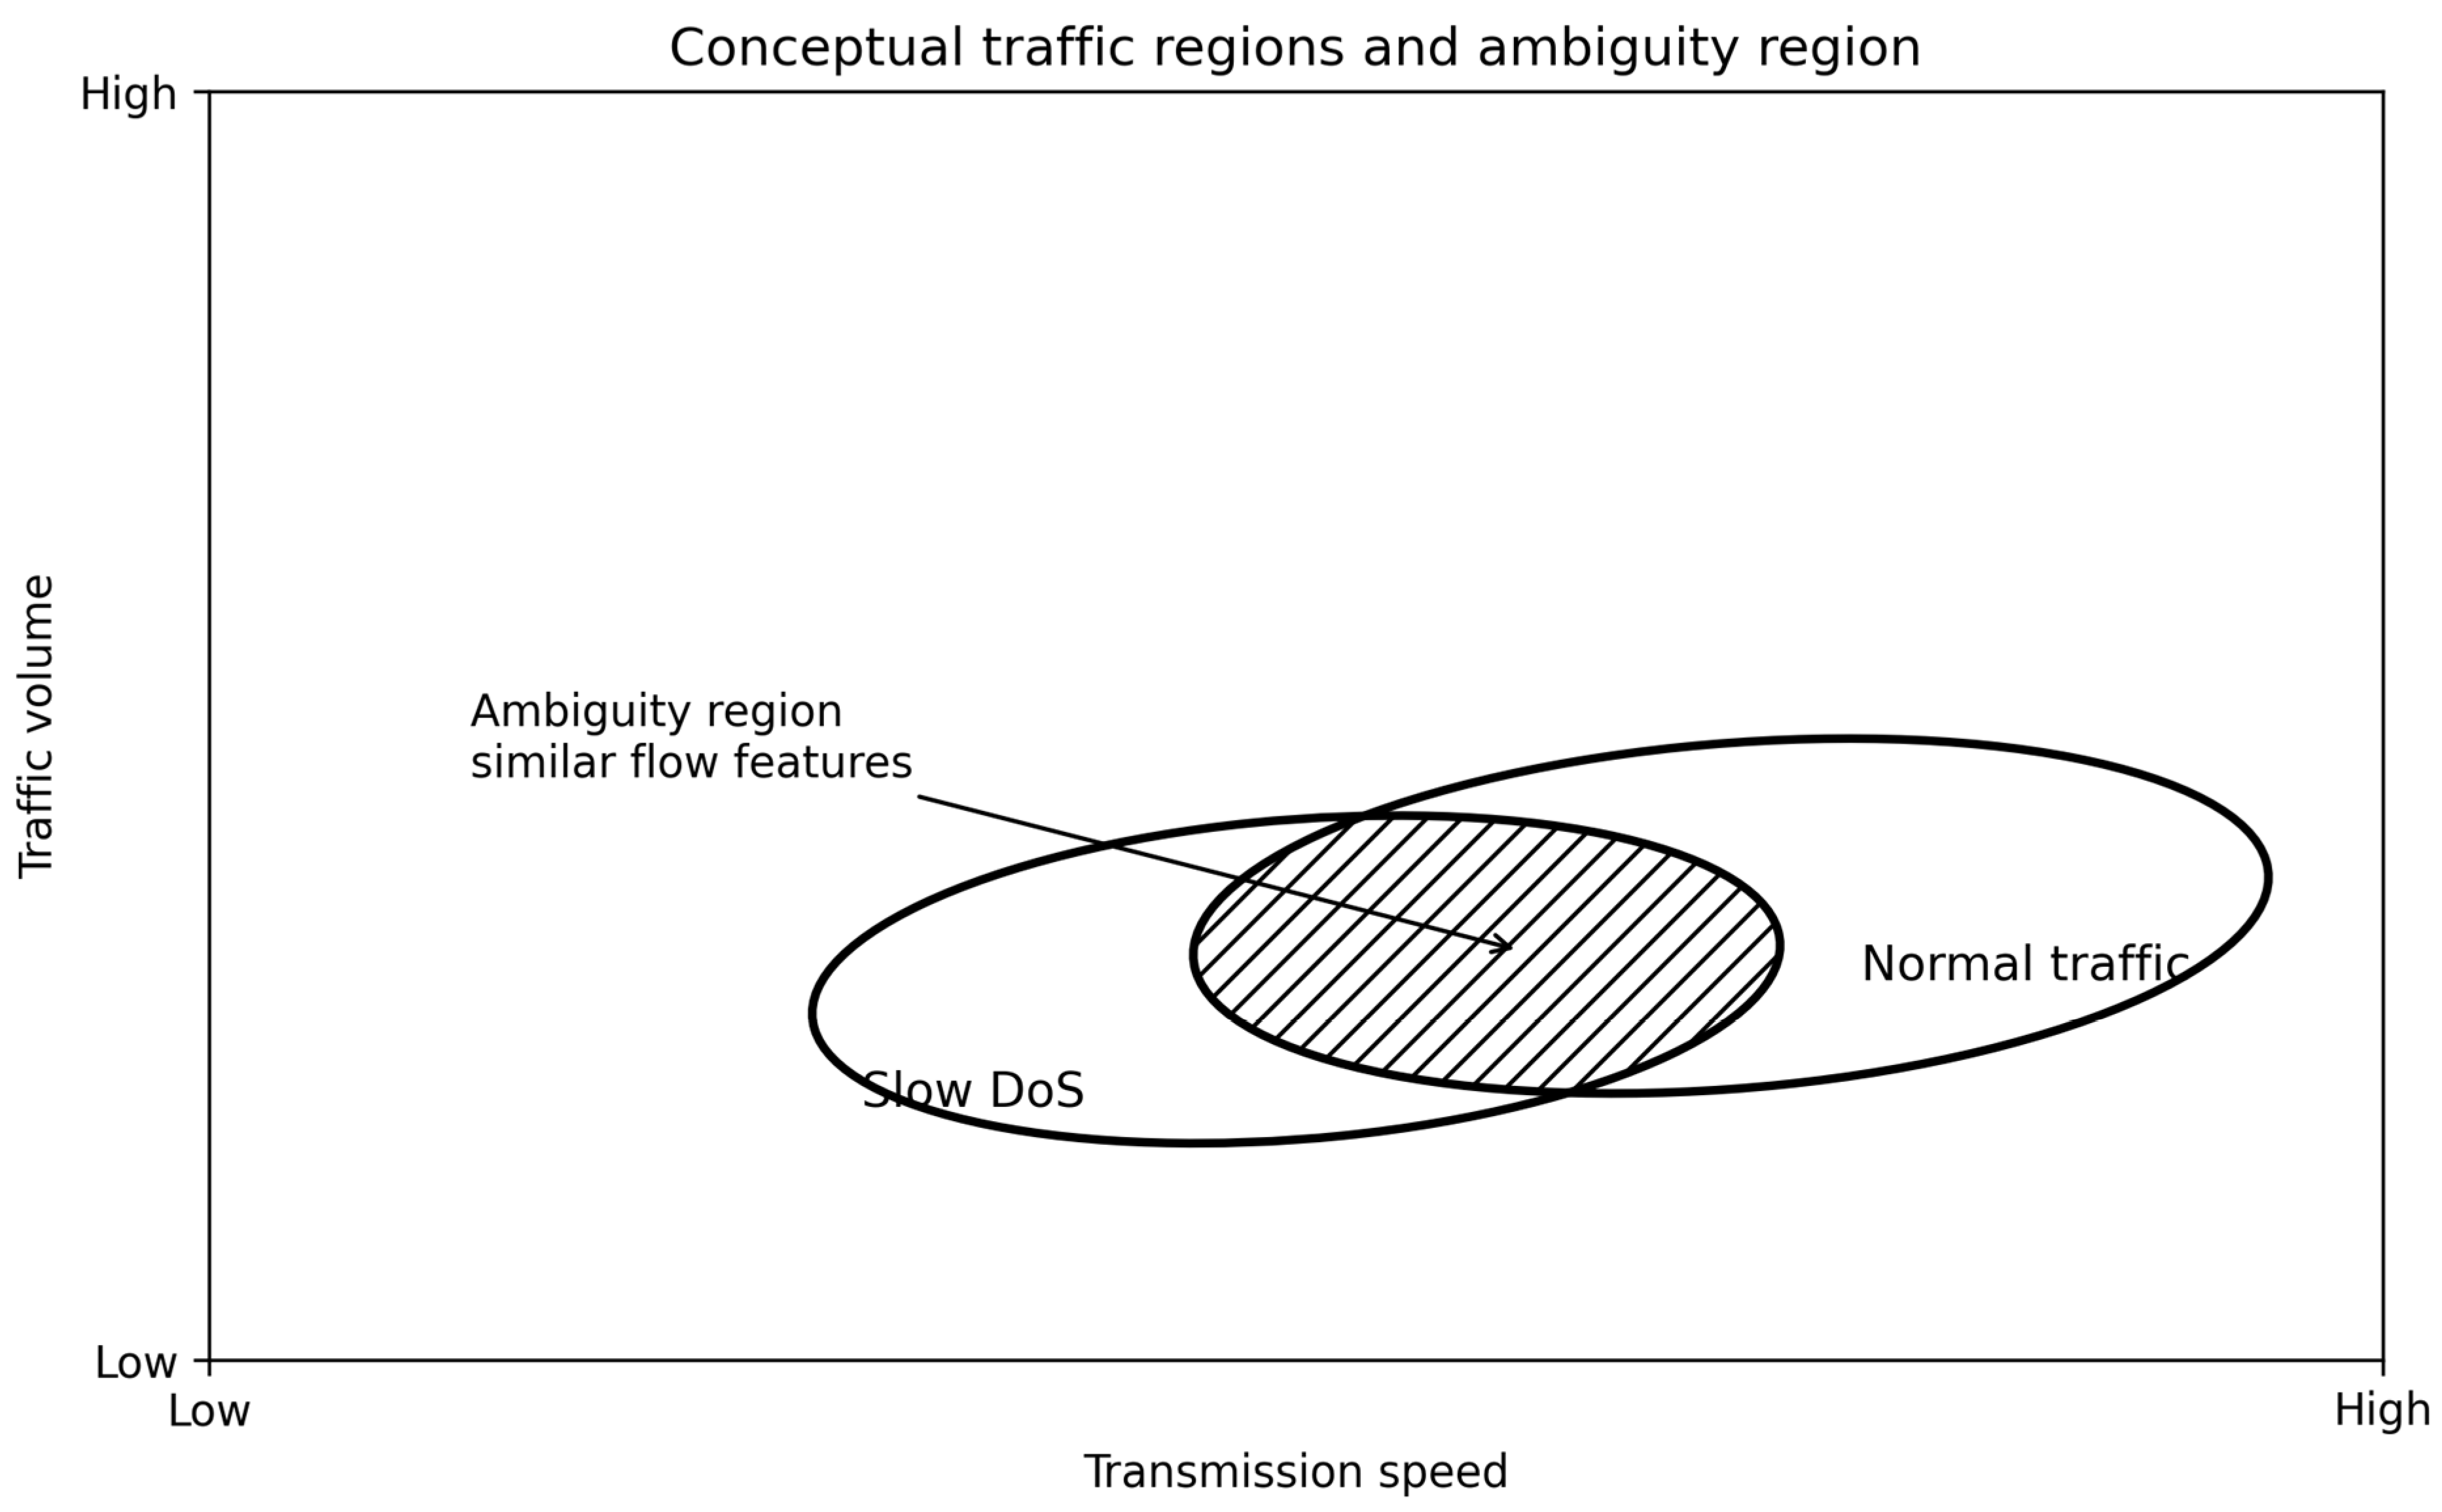
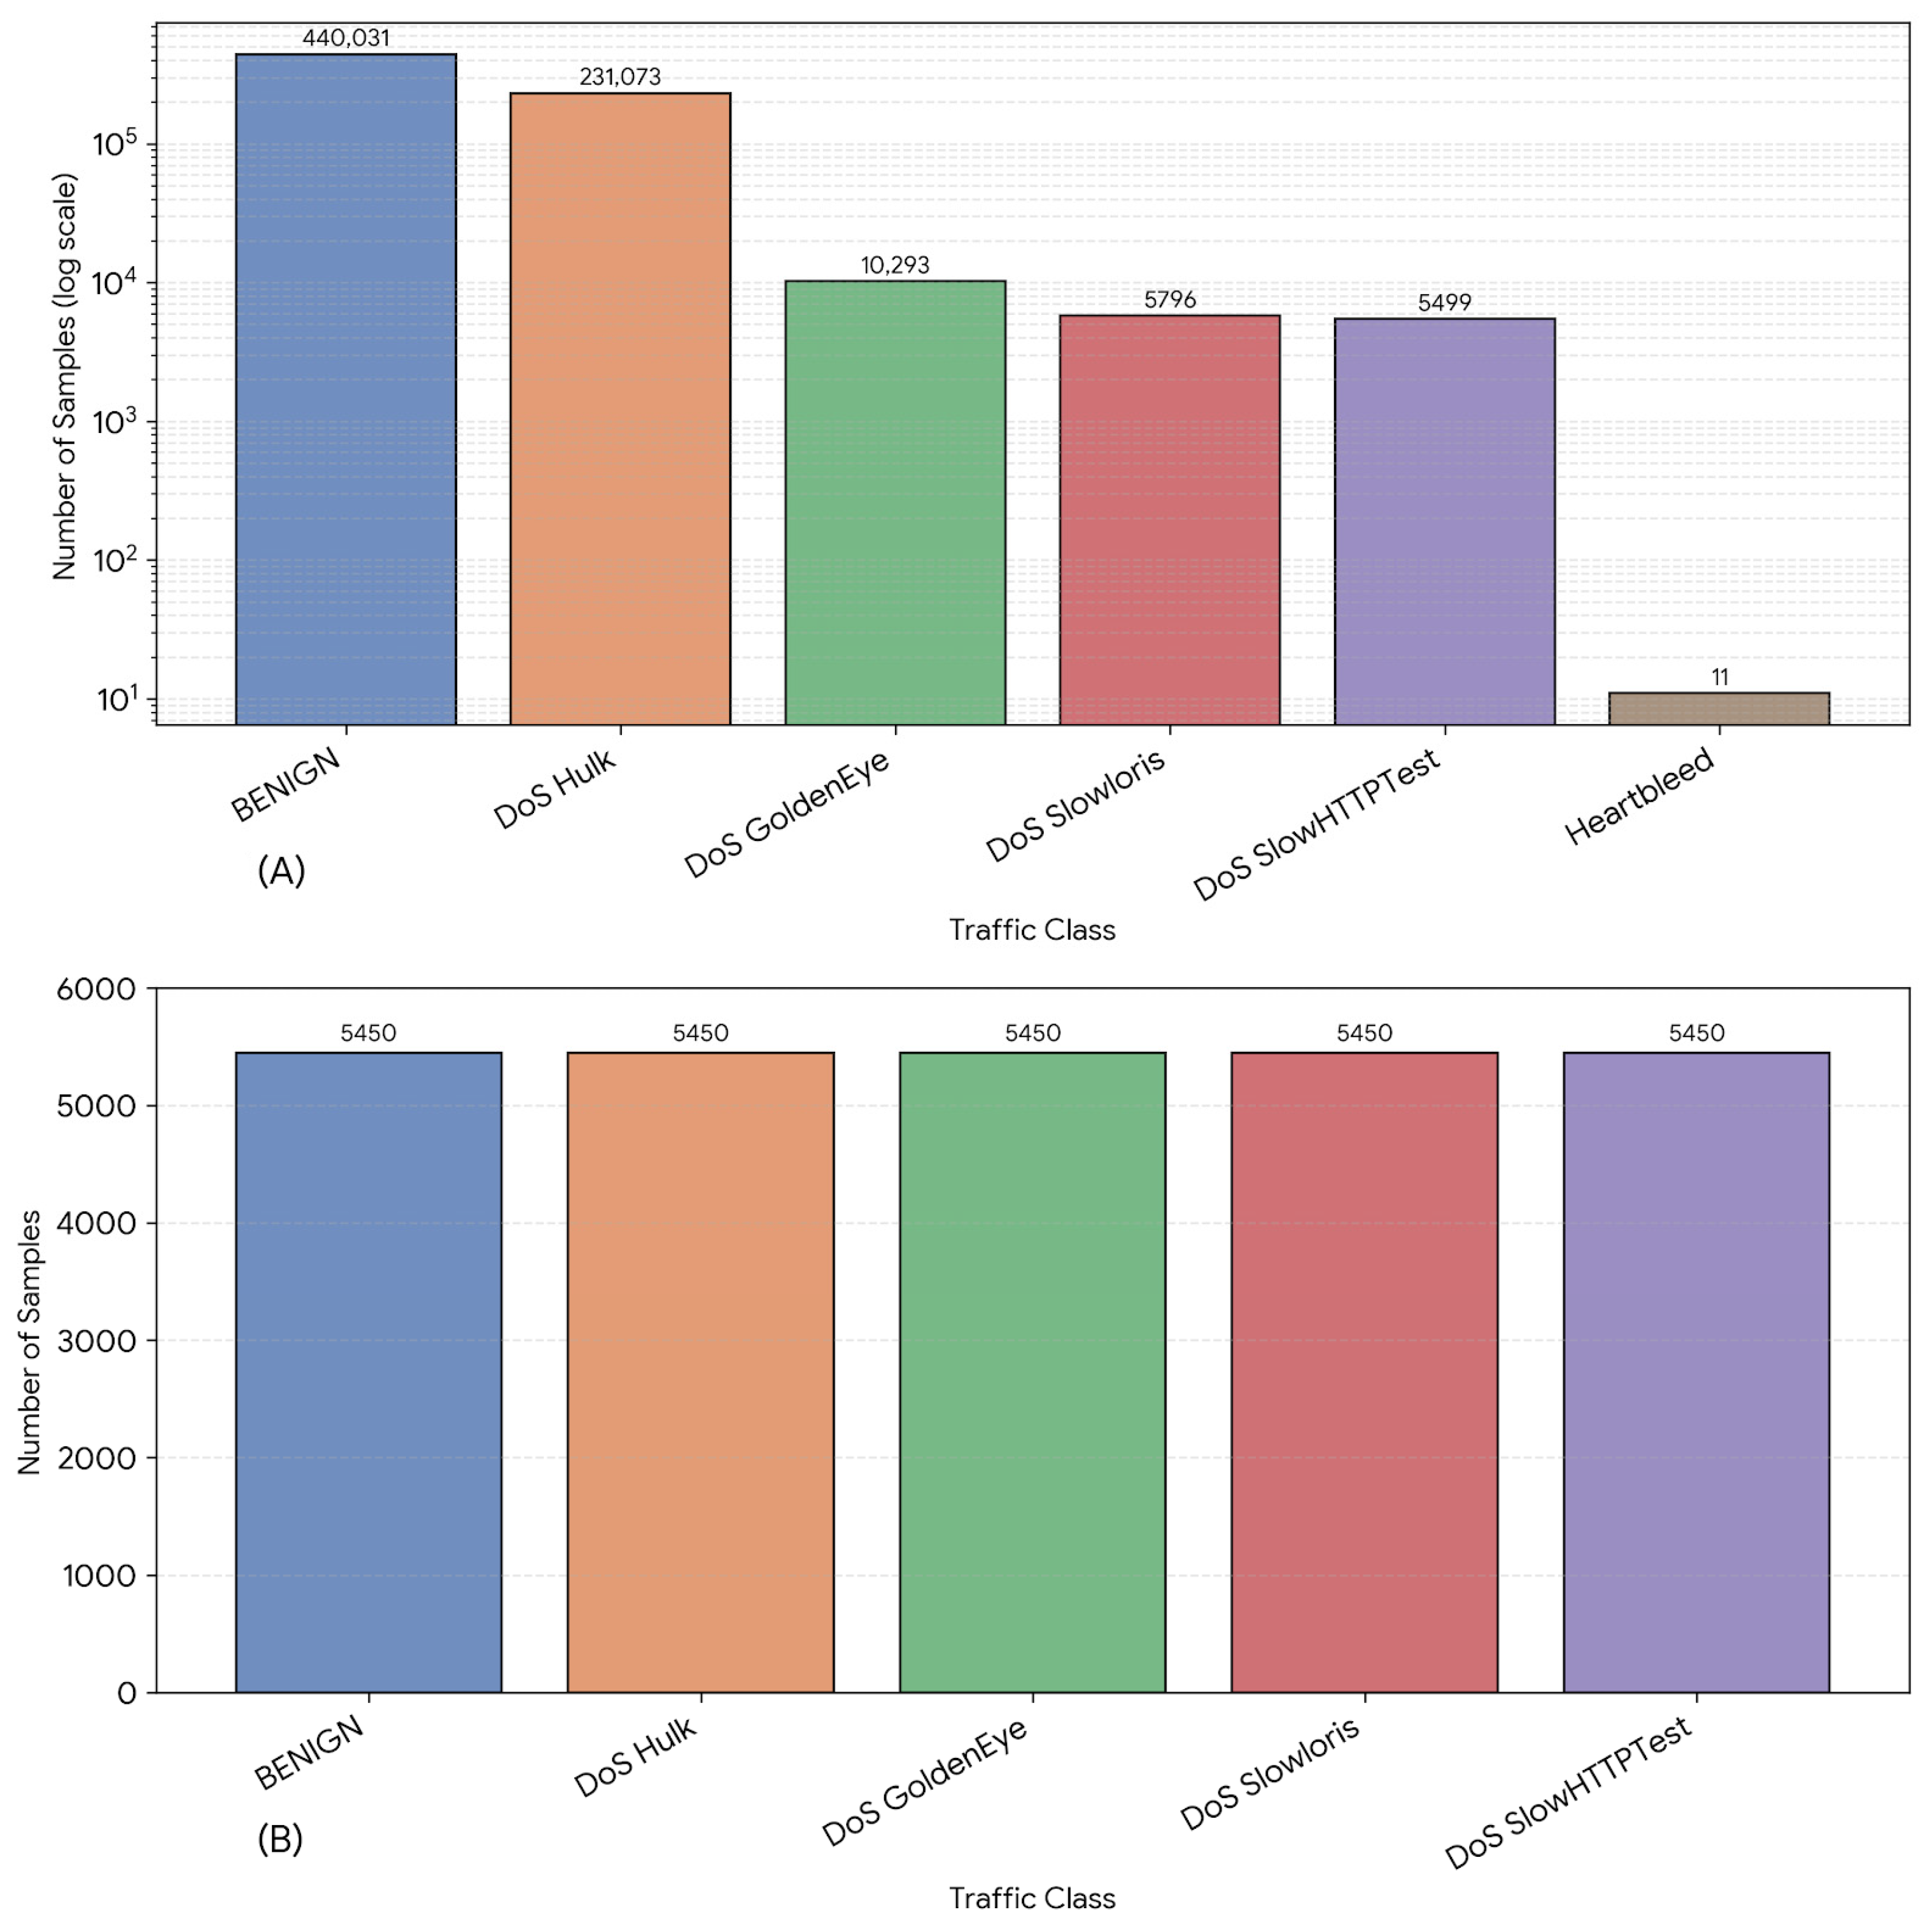
- Class balancing: To balance the dataset, we applied simple random sampling within each class. After the minimum class size was determined, an equal number of instances were randomly selected from each class without replacement. This method ensures unbiased selection, as every record in a given class has an equal probability of being chosen. Oversampling techniques, such as the Synthetic Minority Oversampling Technique (SMOTE), were intentionally avoided because they generate synthetic feature vectors that may distort timing-based and protocol-level characteristics in flow data. Since the autoencoder depends on learning the genuine traffic distribution, the introduction of artificial samples could lead to unstable latent representations or overly optimistic classification results. The number of instances for each class was adjusted based on the minimum class frequency, resulting in a balanced dataset containing 5499 samples. The Heartbleed class was excluded due to its insufficient records (only 11 instances), which would make no valuable contribution to the model’s training or evaluation. We downsample the BENIGN class to mitigate extreme class imbalance and to prevent the classifiers from being dominated by majority class patterns. This choice also reduces training time and allows controlled comparison across models. However, because downsampling can remove legitimate traffic variability, we treat the balanced setting as a controlled evaluation scenario rather than a direct estimate of real-world base rate performance.
- Label encoding: Categorical variables, such as attack categories, were transformed into numerical labels using the LabelEncoder function from scikit-learn, ensuring compatibility with ML algorithms.
- Normalization: Continuous numerical features were scaled to 0 to 1 using min–max normalization. This step mitigated the risk of features with larger numeric ranges dominating the learning process, thereby improving model convergence during training.
- Dataset splitting: The processed dataset was divided into training (80%) and testing (20%) subsets. This partitioning strategy ensured that the model was trained on a substantial portion of the data while reserving an adequate portion for unbiased evaluation, thereby supporting robust performance assessment and minimizing overfitting.
3.2. Feature Extraction and Model Training
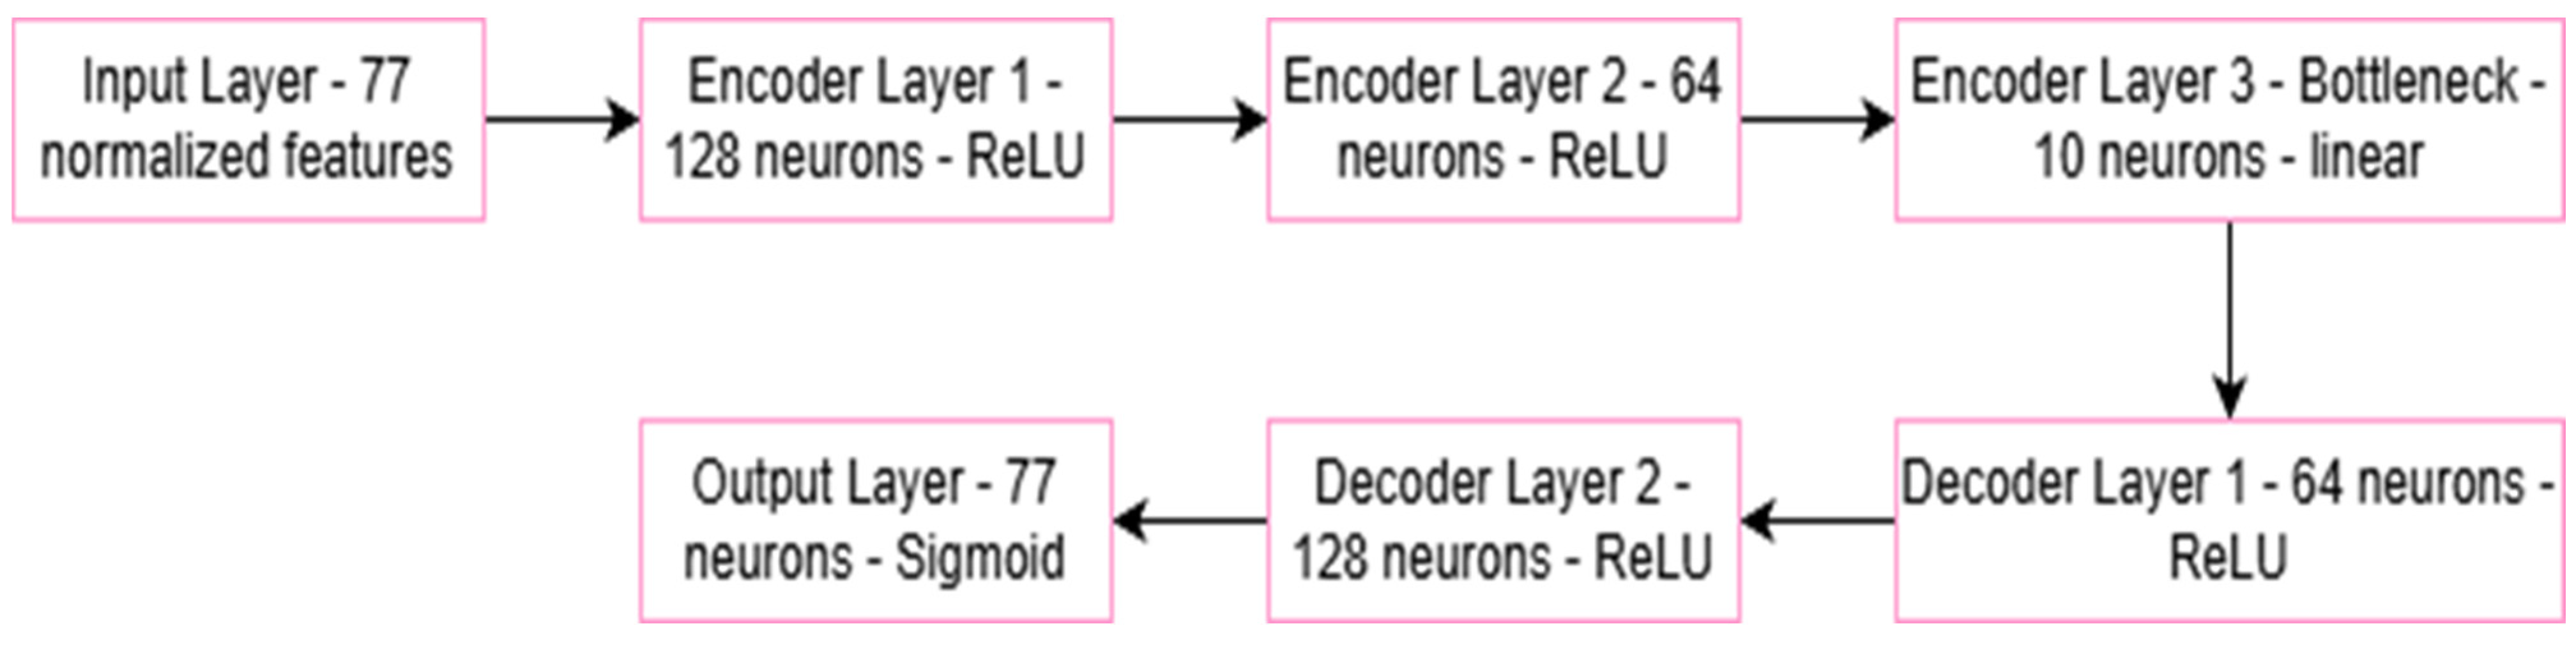
- Out-of-distribution handling: The proposed pipeline is primarily supervised. The autoencoder is used for feature compression, and classification is performed by the downstream classifier. In the current implementation, reconstruction error is not used in the decision rule. Consequently, the system does not provide a dedicated unknown class output for zero-day attacks, and out-of-distribution samples may be assigned to the closest known class.Figure 3. Autoencoder architecture and training configuration.


3.3. Performance Metrics
3.4. Hyperparameter Optimization
- RBFNN: The number of hidden centers, spread (σ), and regularization coefficient (λ) were tuned. The optimal configuration was found at 2000 centers per layer, , and . Achieving the best trade-off between accuracy and training time.
- RF: The number of trees (), maximum depth (), and minimum samples per split () were evaluated. The configuration with 100 estimators achieved high accuracy (99.39%) with low variance and stable performance, making it suitable for highly efficient detection of slow DoS attacks.
- LightGBM: The parameters, including the number of leaves (), learning rate (), and regularization terms () were tuned. The optimal setup with , , , and achieved the best accuracy-to-speed balance.
- The grid search was executed on the training subset (80% of the total data), and the final models were retrained on the entire training set with the selected hyperparameters. This systematic tuning process ensured that each classifier was optimized for accuracy and computational efficiency before evaluation.
4. Results and Analysis
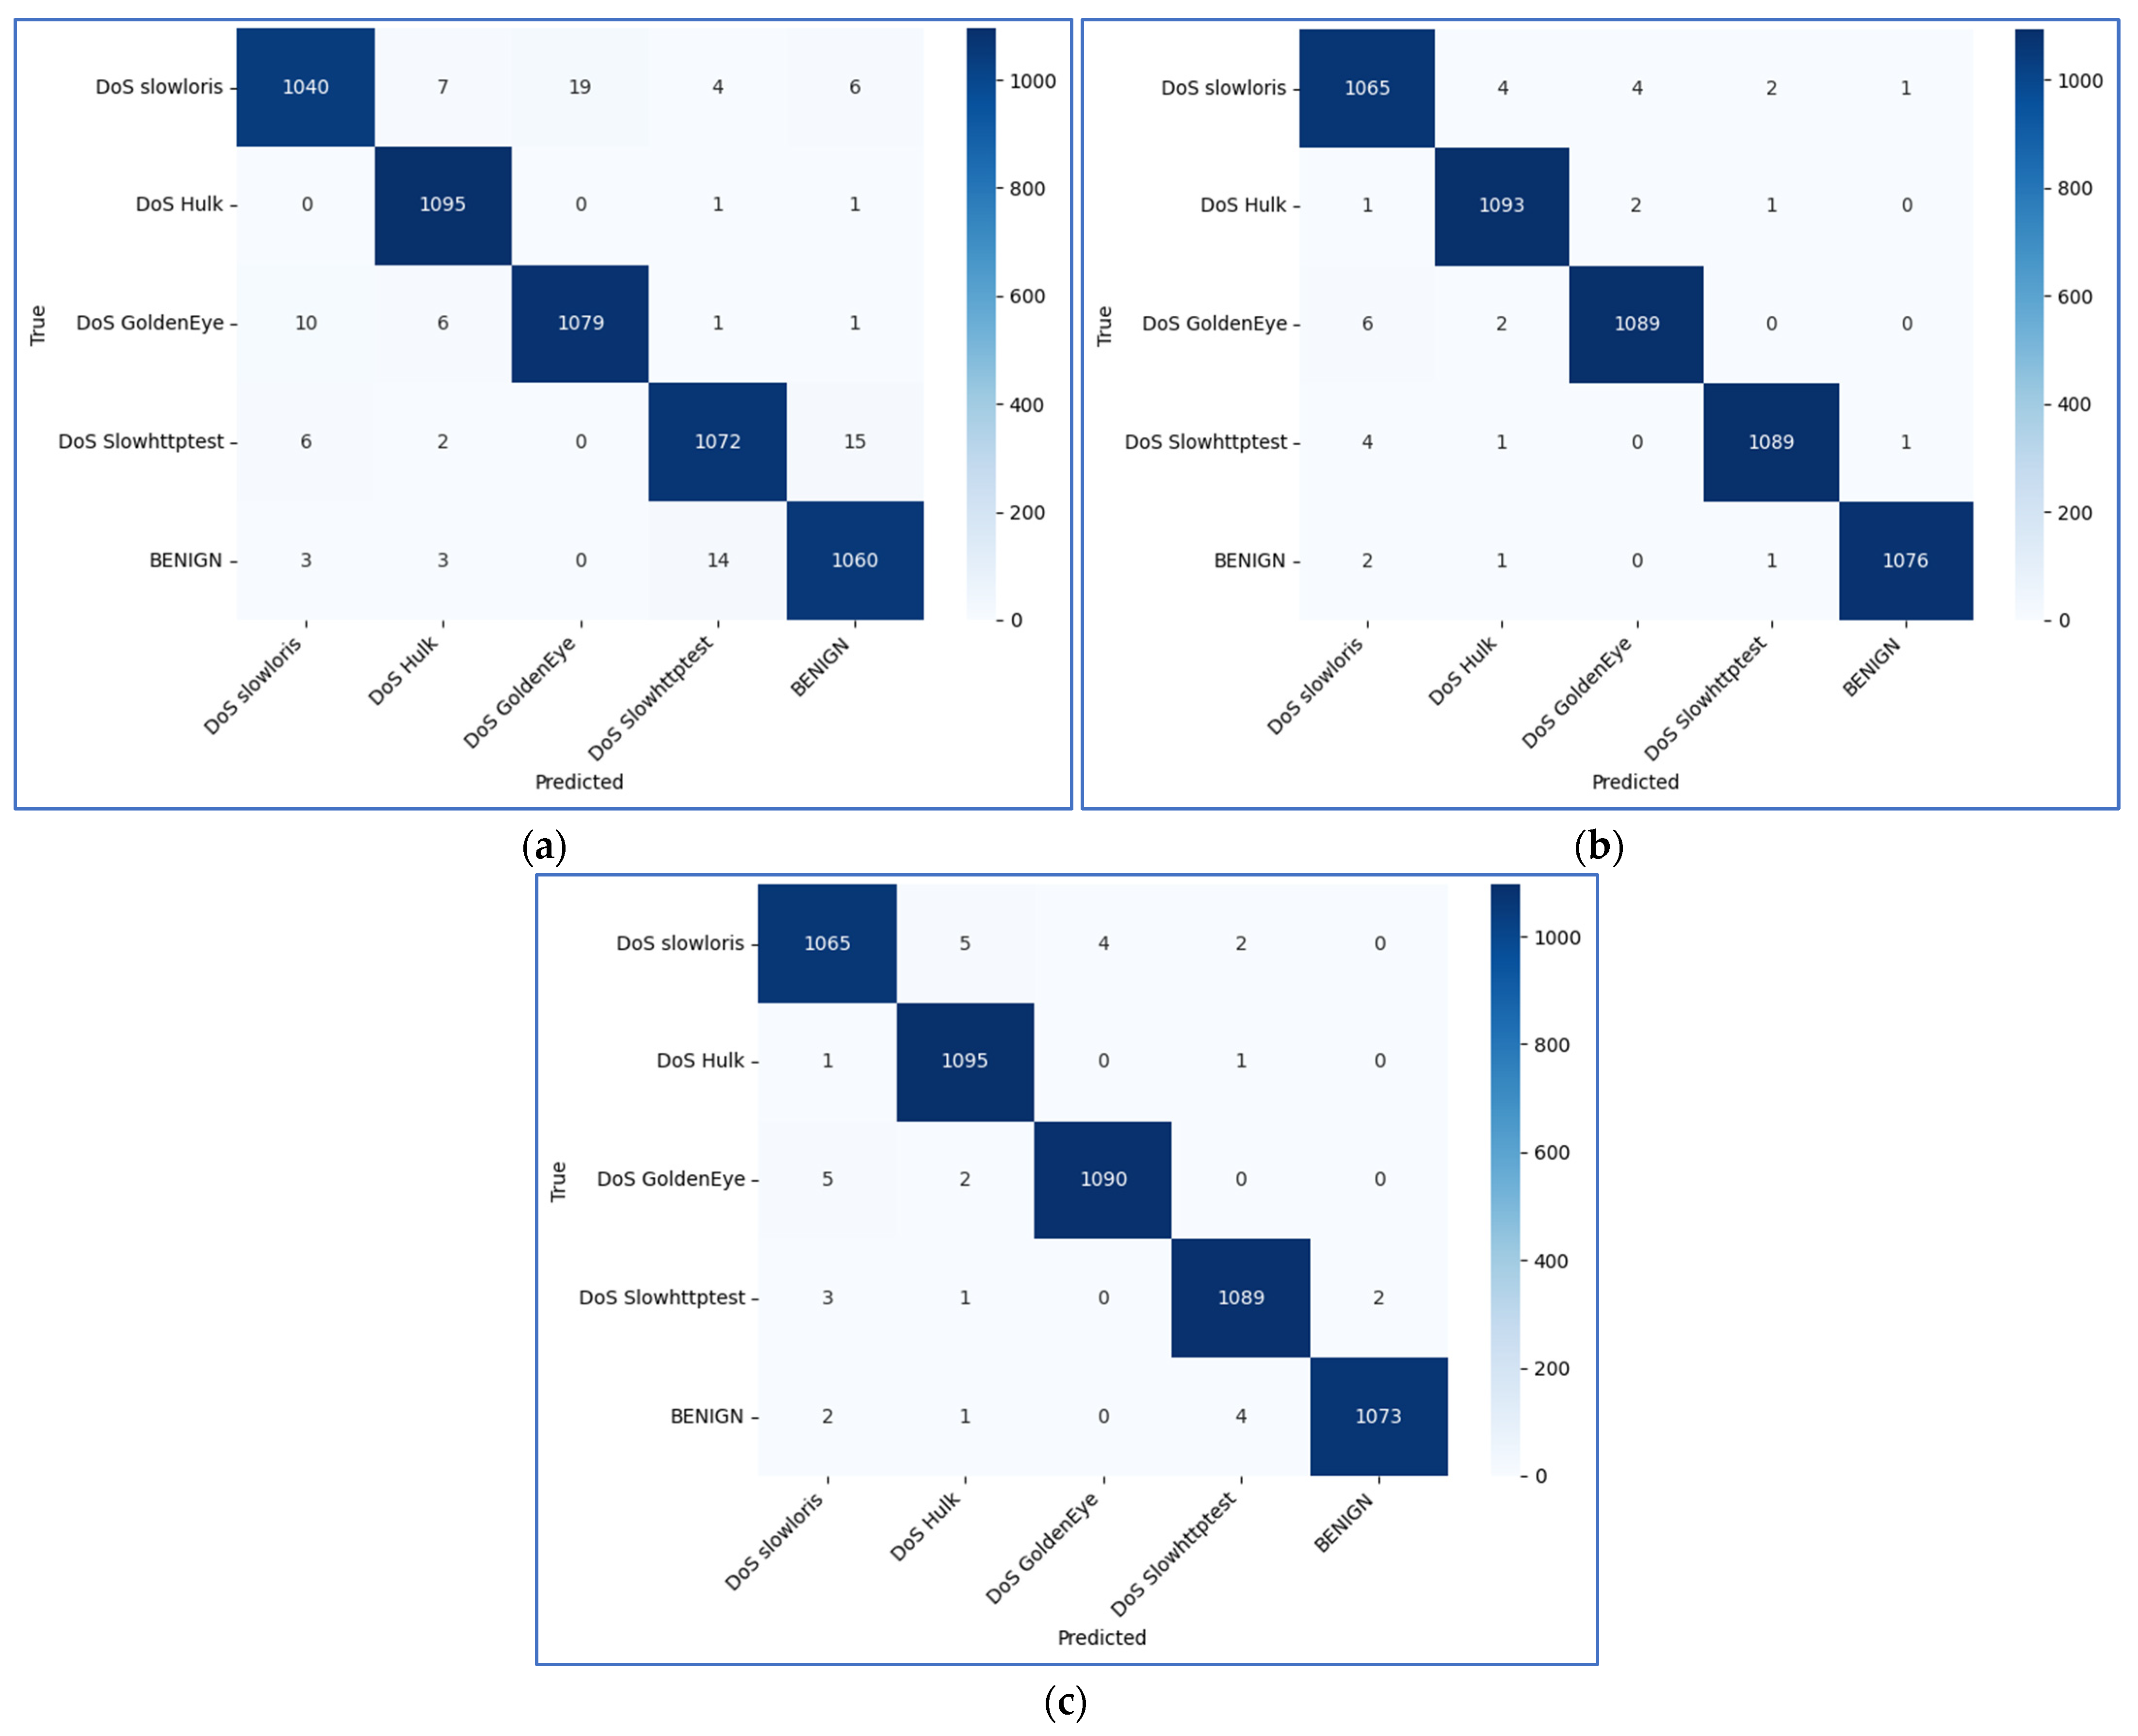
- Confusion matrix: As shown in the confusion matrix of RBFNN Figure 5a, the DoS HULK attack was perfectly identified in almost all instances, with 1095 correct predictions out of 1097 and minimal misclassifications. Similarly, the DoS GoldenEye and DoS slowhttptest attacks were correctly categorized with scores of 1079 and 1072, respectively. Additionally, RBFNN performs well in recognizing innocuous traffic, resulting in 1060 out of 1080 accurate predictions. Figure 5b shows that the RF model correctly identified 1065 instances of “DoS Slowloris”. However, it did make some mistakes, such as classifying five of those as “DoS HULK”, three as “DoS GoldenEye”, two as “DoS slowhttptest”, and three as “benign”. Similar results were also obtained for the other classes. For LightGBM, as shown in Figure 5c, robust performance was exhibited. Notably, it accurately identifies most instances of each class, with minimal misclassifications. This indicates that LightGBM is superior at distinguishing between various network activities, which is essential for effective cybersecurity measures.Figure 5. Confusion matrices of (a) RBFNN, (b) RF, and (c) LightGBM.

- Accuracy: The performance results obtained with RBFNN, RF, and LightGBM are summarized in Table 2. Notably, the RBFNN achieved an overall accuracy of 98.27%. All five classes (labeled as Class 0 to Class 4) consistently exhibited superior performance, as evidenced by the precision, recall, and F1-score for each class, which ranged from 0.97 to 1.00. Class 1 had a perfect recall of 1.00, indicating that no false negatives occurred. The RF model achieved an accuracy of 99.39% using an 80:20 dataset split for training and testing, respectively. For the reported macro avg. and weighted avg. at the bottom of the table, the calculations were performed using the following equations, in which C represents the number of classes, Mi represents the metric computed for class i, N represents the total number of samples, and Ni represents the number of true samples in class i. It can be observed that the RF performance is superior to that of the RBFNN. In terms of LightGBM, it indeed achieved an exciting result but did not generalize well to unseen data.Table 2. Performance results of RBFNN, RF, and LightGBM.
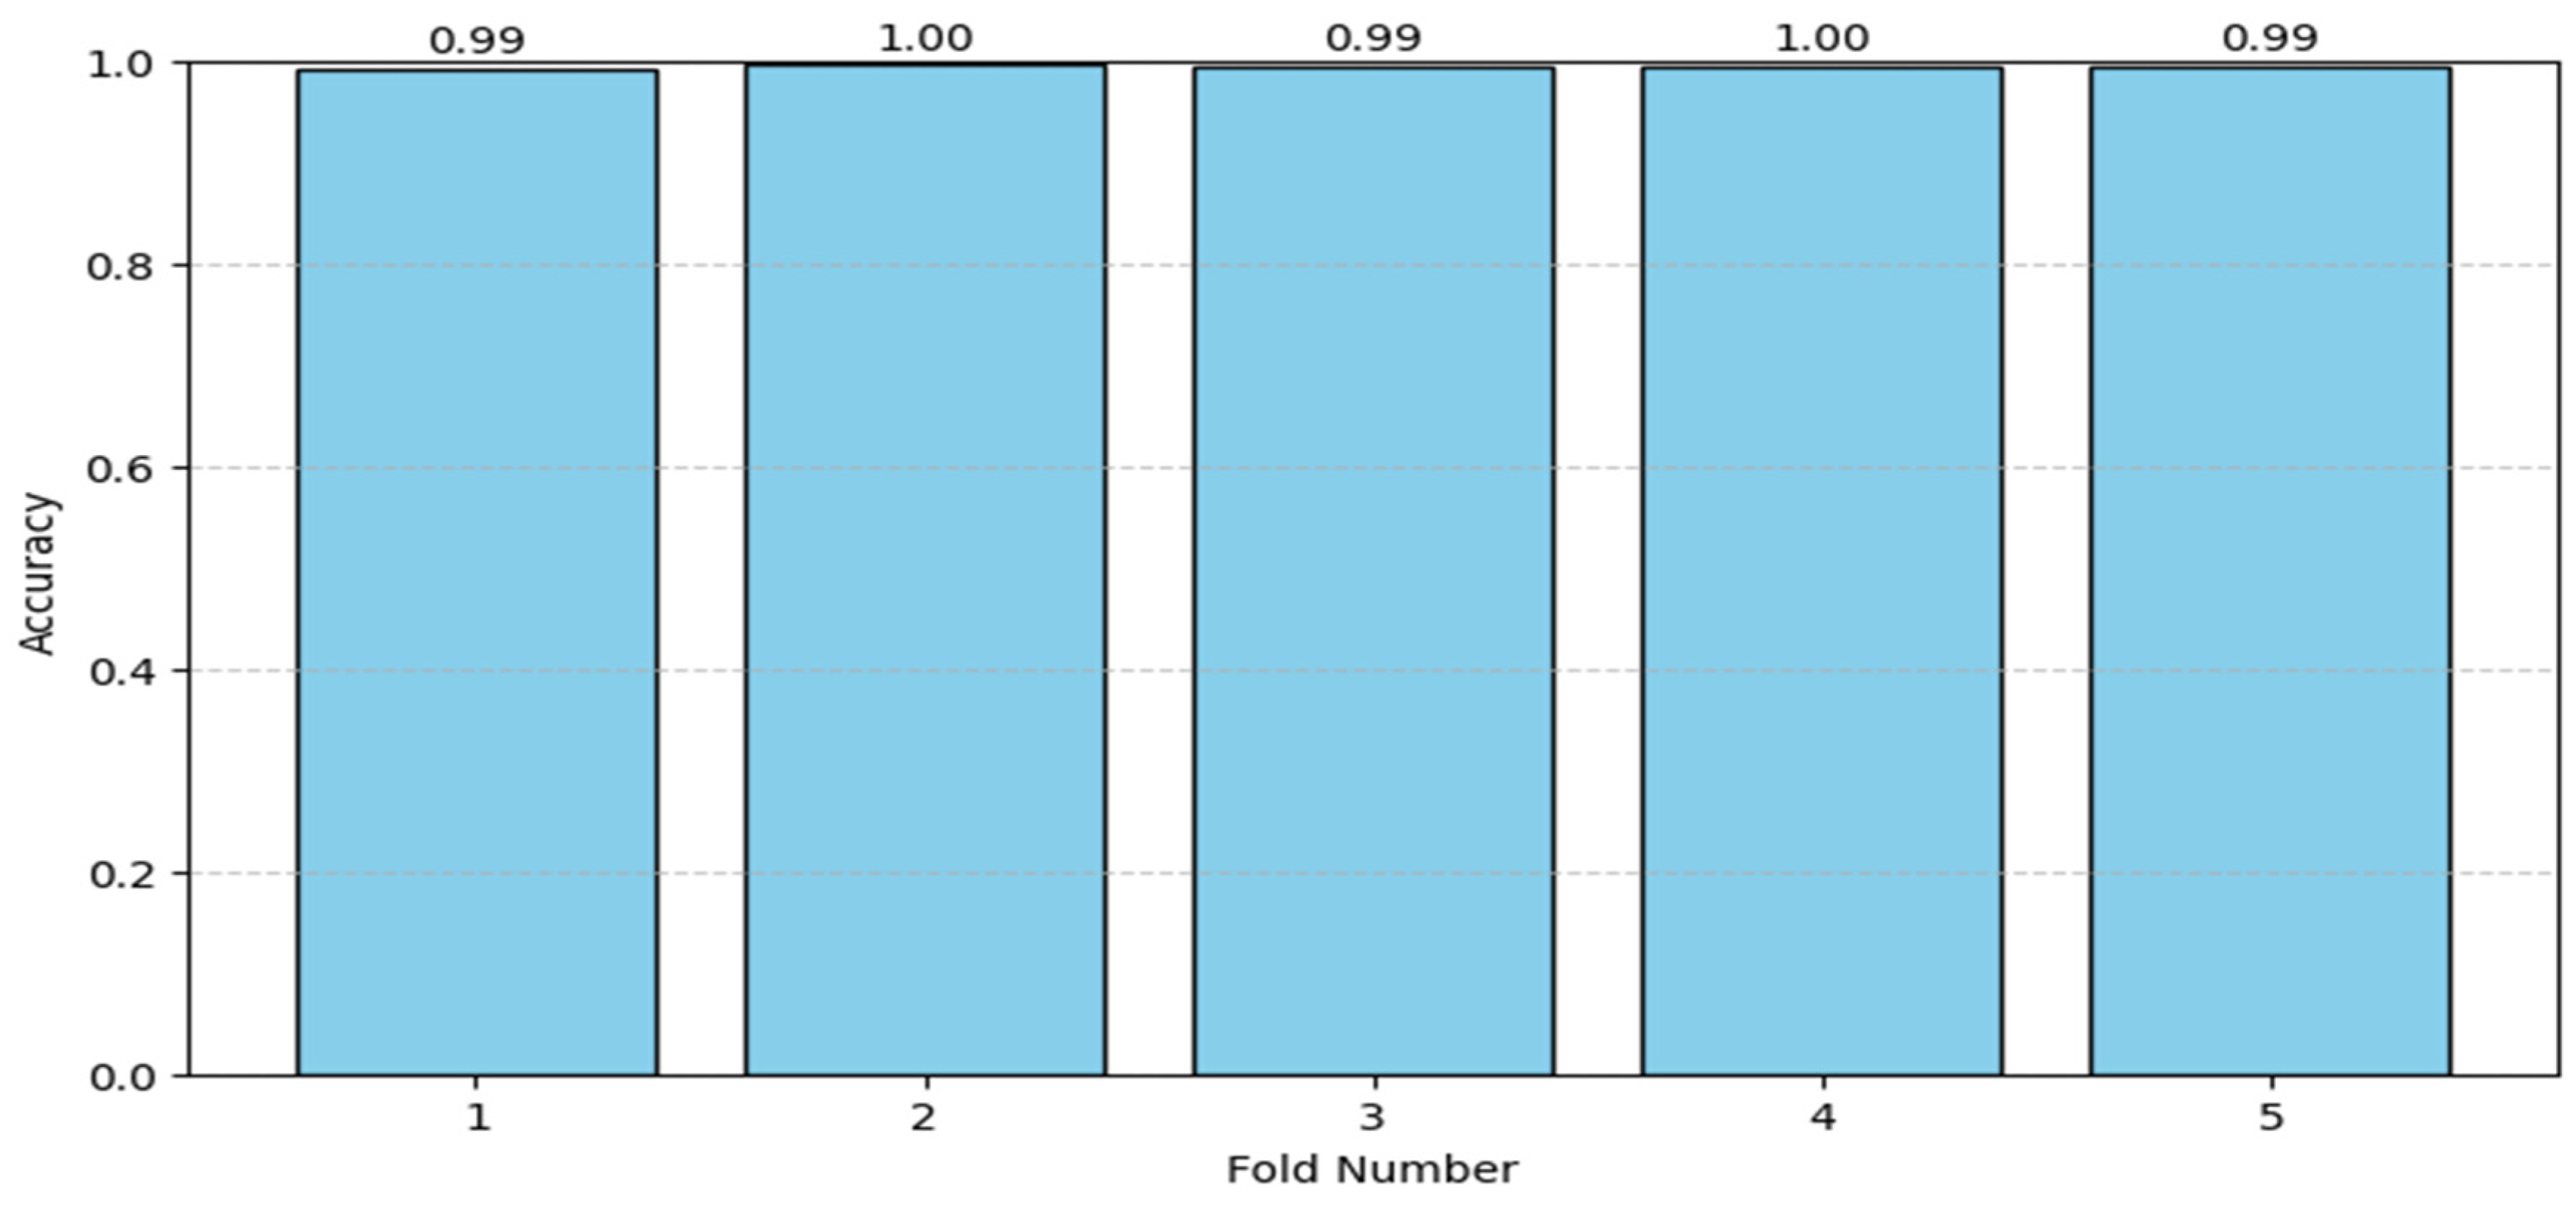
Class RBFNN RF LightGBM Support Precision Recall F1-Score Accuracy Precision Recall F1-Score Accuracy Precision Recall F1-Score Accuracy 0 0.98 0.97 0.98 0.97 0.99 0.99 0.99 0.99 0.99 0.99 0.99 0.99 1076 1 0.98 1.00 0.99 0.99 0.99 1.00 0.99 0.99 0.99 1.00 1.00 0.99 1097 2 0.98 0.98 0.98 0.98 0.99 1.00 1.00 0.99 1.00 0.99 0.99 0.99 1097 3 0.98 0.98 0.98 0.98 1.00 1.00 1.00 0.99 0.99 0.99 0.99 0.99 1095 4 0.98 0.98 0.98 0.98 1.00 1.00 1.00 0.99 1.00 0.99 1.00 0.99 1080 Macro avg. 0.98 0.98 0.98 0.99 0.99 0.99 0.99 0.99 0.99 5445 Weighted avg. 0.98 0.98 0.98 0.99 0.99 0.99 0.99 0.99 0.99 5445 - Cross-validation: Figure 6 shows the K-fold cross-validation accuracy results for the LightGBM model. Its accuracy was consistently high across all folds, with values ranging from 0.99 to 1.00. These findings demonstrate that the LightGBM model is robust and generalizable, indicating that its performance remains consistent and dependable across various dataset subsets. This consistency further supports the model’s feasibility for intrusion detection tasks within the suggested framework. Similar cross-validation was also applied to the RBFNN and RF models, using the same training and testing partitions as LightGBM to ensure a fair and unbiased comparison among classifiers. Each fold used 80% of the data for training and 20% for validation, and the results were averaged to obtain the final performance metrics. The results are summarized in Table 3. All models achieved stable and consistent accuracy across each fold. This confirms the robustness of the results and the absence of overfitting bias. The similarity in fold-to-fold accuracy also demonstrates that all three classifiers generalize well across different dataset splits. Incorporating cross-validation for each model eliminates potential evaluation bias and ensures that the reported performance metrics are directly comparable.Figure 6. K-fold cross-validation results of LightGBM.
 Table 3. Cross-validation results of all three models.
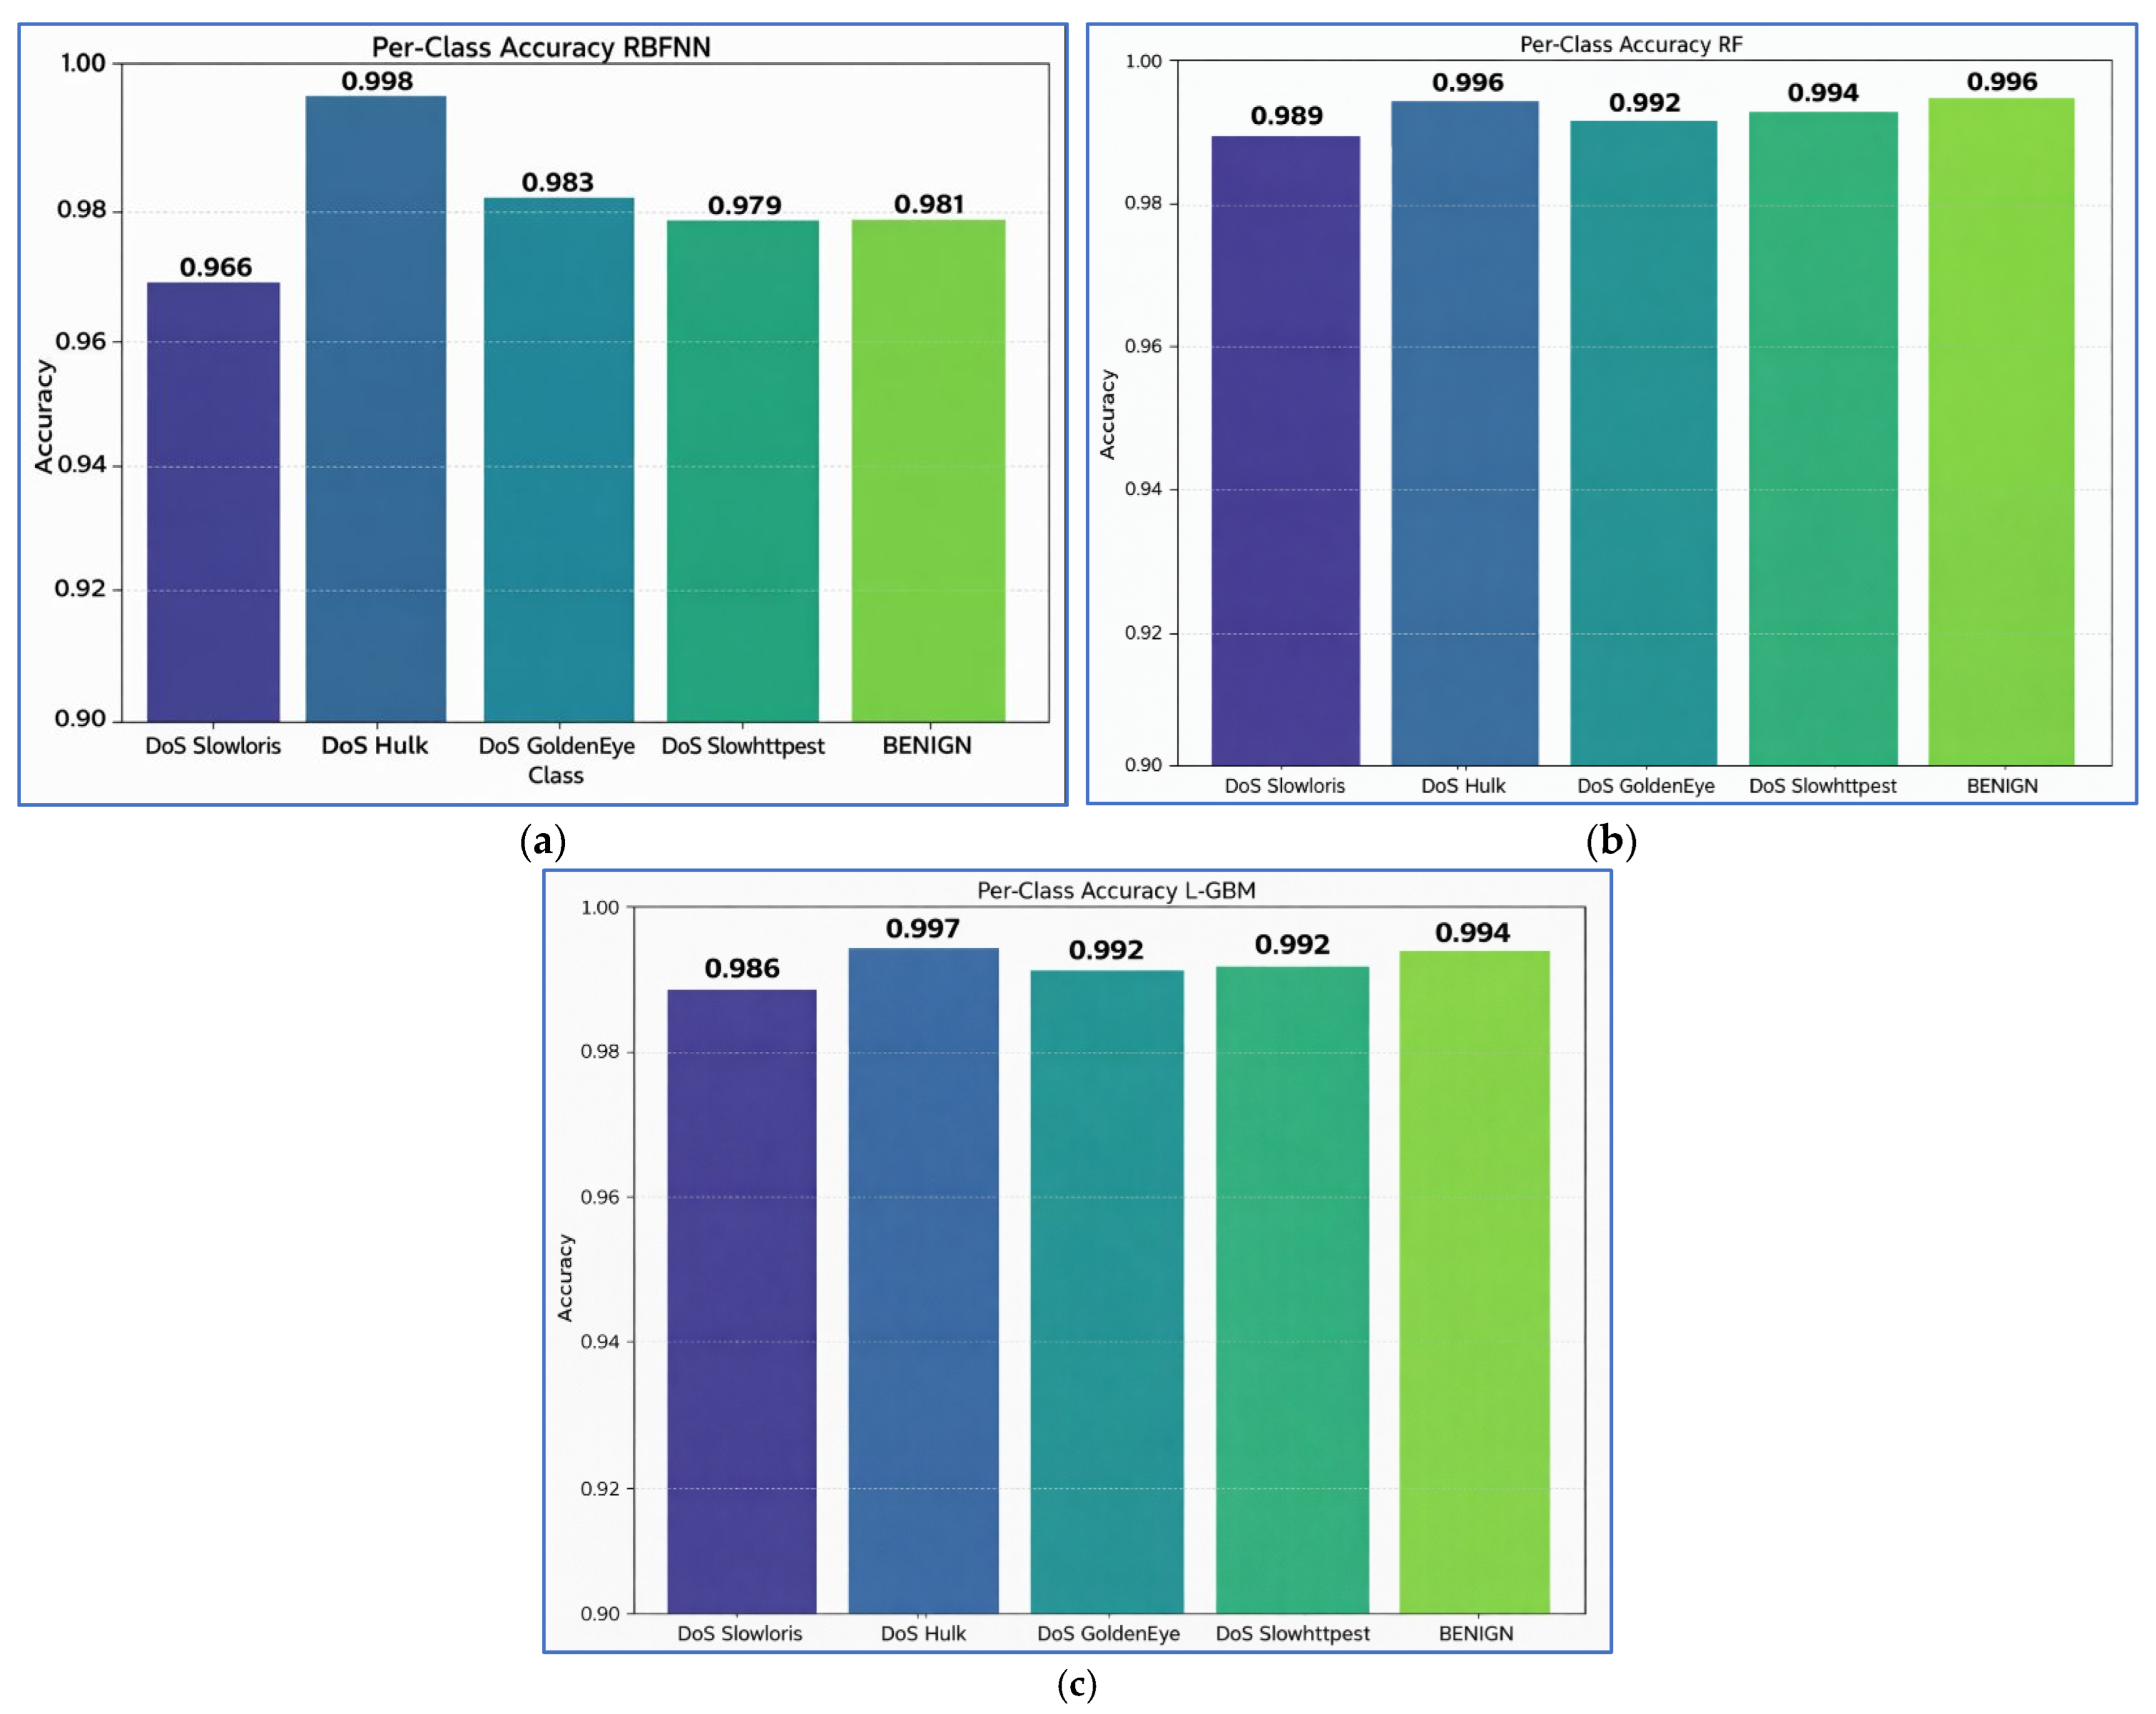
Model Accuracy for Each Fold Mean Accuracy Fold-1 Fold-2 Fold-3 Fold-4 Fold-5 RBFNN 0.98 0.97 0.98 0.98 0.98 0.98 RF 0.99 0.99 0.99 0.99 1.00 0.99 LightGBM 0.99 1.00 0.99 1.00 0.99 0.99 - Per-class accuracy: Figure 7 displays the classification accuracy of each type by using RBFNN, RF, and LightGBM, where each bar represents a different type of attack, the bar height indicates how many instances in that type were correctly classified, and the number above each bar gives the exact accuracy for that type. From Figure 7a, high accuracy exceeding 0.98 is achieved for DoS GoldenEye, DoS slowhttptest, and benign traffic. An accuracy of greater than 0.96 is obtained for DoS Slowloris, and even perfect accuracy (1.00) is demonstrated for DoS HULK. The results demonstrate the viability of the RBFNN model to distinguish between different types of attacks and regular traffic, with low classification errors in each category. Figure 7b shows that RF has an accuracy level of 0.99 for DoS Slowloris, indicating that 99% of instances in this category were correctly identified. Moreover, RF correctly identified every instance in the categories of DoS HULK, DoS GoldenEye, DoS slowhttptest, and benign, with all scoring a perfect value of 1.00. Such excellent accuracy across the board indicates that the RF model performs exceptionally well in identifying and distinguishing these types of attacks. Correspondingly, the per-class accuracy of the LightGBM model is illustrated in Figure 7c for benign and four DoS attacks (Slowloris, HULK, GoldenEye, and slowhttptest). Although slightly inferior to that of RF, they have remarkably high accuracy scores, ranging from 0.99 to 1.00, which are obtained among all classes, with flawless accuracy for DoS HULK.Figure 7. Per-class accuracy of (a) RBFNN, (b) RF, and (c) LightGBM.

- Sensitivity analysis: A sensitivity analysis was performed by altering the regularization parameter (λ) and the number of centers in the hidden layers ( and ) to assess the robustness of the proposed RBFNN-based classifier. Table 4 summarizes the effects of these hyperparameters on computing efficiency and model accuracy. With the number of centers decreasing from 2000 to 300, the training time is significantly reduced, while the accuracy decreases from 98.27% to 95.84%. This means that fewer centers may be unable to capture the intricacy of the data fully. On the other hand, employing bigger networks with 2000 centers per layer contributes to higher accuracy but comes at a higher computational cost, where more than 200 s is required for training. Based on Table 4, we can conclude that increasing the center number benefits improving accuracy but leads to longer training times. Proper tuning of the regularization parameter is crucial for avoiding overfitting while maintaining strong generalization. While simpler models train faster, they compromise on detection accuracy. Considering the trade-off between the computational cost and performance, an ideal balance between accuracy and training efficiency may be achieved with 2000 centers per layer and a regularization parameter of . This hyperparameter combination ensures the model’s robustness for practical applications, demonstrating its suitability for deployment in real-world intrusion detection systems.Table 4. Sensitivity analysis of RBFNN hyperparameters.
, λ) Training Time (s) Accuracy (%) F1-Score 300, 10, ~40 95.84 0.95 400, 100, ~120 96.73 0.96 2000, 2000, ~200 98.27 0.98 - Sensitivity to BENIGN downsampling:Because the CICIDS 2017 traffic is highly imbalanced, we downsampled the BENIGN class in the main experiments to reduce majority class dominance and to enable controlled model comparisons. However, aggressive downsampling can remove legitimate traffic variability and may oversimplify the classification task. To test whether our findings are sensitive to the representation of benign traffic, we reran the full pipeline while keeping the attack class counts fixed and varying only the number of BENIGN instances. Specifically, we evaluated three settings: BENIGN equals 5450, as in the balanced baseline; a moderate setting where BENIGN equals 50,000; and a larger setting where BENIGN equals 100,000.


- Reconstruction Error as an Out of Distribution Trigger:Although the proposed framework is evaluated as a supervised detector for the known CICIDS 2017 classes, the autoencoder component can also provide a simple out-of-distribution proxy signal through reconstruction error. To examine this possibility, we conducted an auxiliary experiment in which reconstruction error was used as a secondary anomaly trigger. The autoencoder was trained on the training split only, and a threshold was selected using the BENIGN portion of a held-out validation split. Specifically, we set the trigger threshold to the 99th percentile of BENIGN validation reconstruction errors, which yielded a threshold of 0.074027. Samples with reconstruction error above this threshold were flagged as out of distribution.Applying this trigger to the test split produced a low overall flag rate of 0.74 percent. The BENIGN flag rate was 1.03 percent, which can be interpreted as a proxy false positive rate under this thresholding rule. However, the non-benign flag rate was 0.23 percent, indicating that reconstruction error alone is not a strong anomaly detector for the majority of attack traffic in this dataset under a BENIGN-calibrated threshold. This is further reflected in the binary confusion matrix, where the trigger yields 116 true positives and 910 false positives, with 50,419 false negatives. These results suggest that many attack flows remain well reconstructed by the autoencoder, likely because their tabular feature patterns overlap with normal traffic in the learned representation.The class level flag rates provide additional insight. Heartbleed is always flagged, which is consistent with the expectation that a rare and underrepresented pattern may fall outside the dominant training distribution. In contrast, the highest flag rate among the included DoS attacks is observed for DoS Slowhttptest at 5.55 percent, whereas other DoS variants are rarely flagged, with rates below 1 percent and as low as 0.06 percent for DoS Hulk. Overall, this analysis indicates that reconstruction error can highlight highly distinct or rare traffic patterns, but it should not be interpreted as a reliable zero-day detector in the current setting. In this work, reconstruction error is therefore treated as an optional auxiliary signal for flagging unusual samples rather than a primary detection mechanism, and comprehensive open set evaluation remains an important direction for future research.
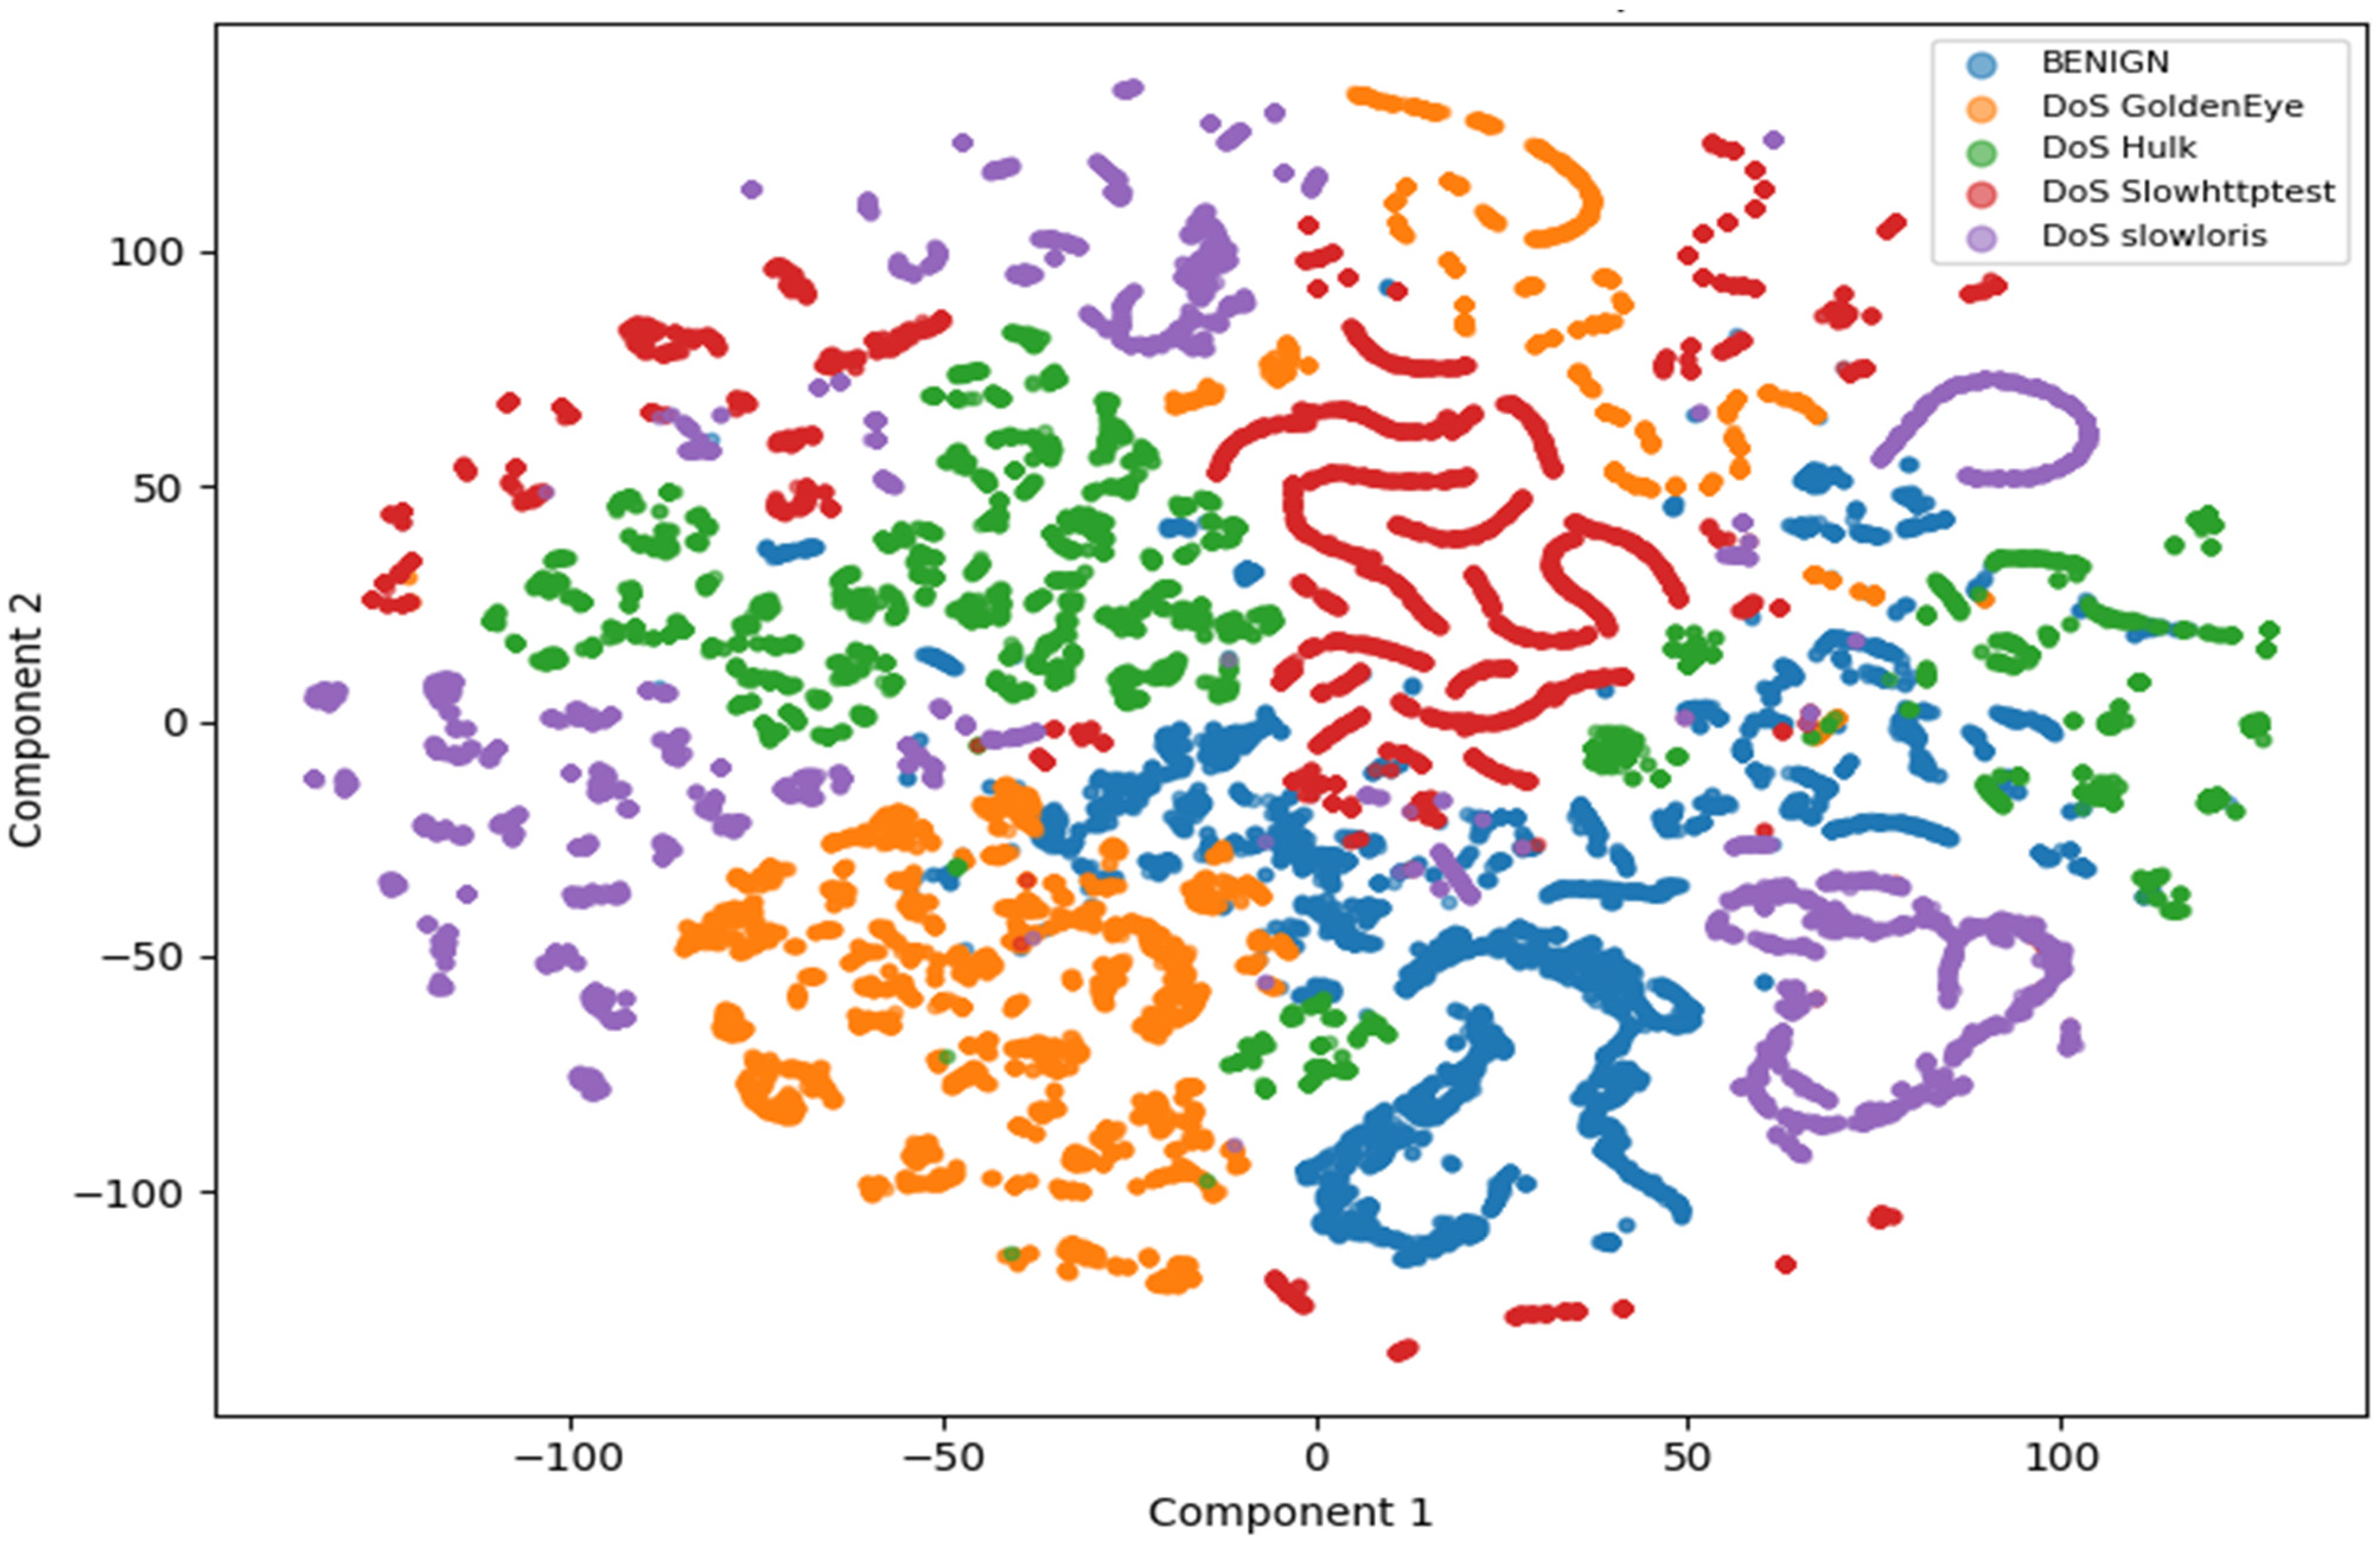
- Analysis of latent features learned by the autoencoder: To explore the dimension influence of the latent features in the autoencoder, different sizes of the bottleneck layer (5, 10, 15, and 20 features) were studied while keeping all other parameters fixed, based on the CIC IDS 2017 dataset with the RBFNN classifier. The results show that the mean square reconstruction changes by 0.0002 when the number of features is varied. On the other hand, the accuracy of the models varies significantly, with the lowest-performing model (i.e., RBFNN) achieving an accuracy range of 88% to 98% and reaching its highest value for 15 features. Table 5 presents a comparative performance analysis of our proposed technique with other related works. While these works did not precisely utilize the autoencoder, they address DoS attacks using the same dataset but with different techniques. To better understand the internal representations produced by the autoencoder, we examined how the original features contribute to the 15-dimensional latent space. Since the latent variables () do not correspond directly to specific input features, they were analyzed through perturbation-based contribution scoring and low-dimensional visualization. First, we assessed the sensitivity of the reconstruction loss to controlled perturbation of individual input features, where features whose alteration produced the largest increase in the reconstruction error are interpreted as having the greatest influence on the latent representation. The results indicate that flow duration, packet timing patterns, and connection-level byte statistics contribute most to the compressed space. This is consistent with the behavioral nature of slow-rate HTTP DoS attacks. Second, we applied t-distributed Stochastic Neighbor Embedding (t-SNE) to visualize the latent space in two dimensions, as shown in Figure 8. The resulting axes of component 1 and component 2 represent nonlinear embeddings of the latent variables, rather than individual traffic attributes. Even so, the projection clearly separates benign traffic from various types of slow-rate DoS attacks. It confirms that the autoencoder successfully captures discriminative structural patterns even in the absence of explicit feature engineering.
- Analysis of runtime and performance cost: We define computational cost using three indicators. Training cost is measured as wall clock training time in seconds. Deployment cost is measured as wall clock inference latency in seconds per 1000 samples and peak memory usage in MB during inference. All measurements are collected on the same machine and reported as averages across repeated runs. We did not use CPU utilization as a primary metric because it varies with background load. We, therefore, rely on latency, throughput, and memory usage, which are more reproducible indicators of deployment cost. The runtime and memory were analyzed to evaluate the feasibility of deploying the proposed models in practical environments, as shown in Table 5. Training time and inference latency were measured on an Intel i7 12,700 CPU with 16 GB RAM. The Autoencoder plus RBFNN pipeline required the longest training time at about 380 s, while Autoencoder plus RF and Autoencoder plus LightGBM trained faster at about 180 s and 155 s, respectively. Inference latency remained low for all pipelines at 0.021 s, 0.018 s, and 0.017 s per 1000 samples, respectively. These results indicate that the proposed pipelines are suitable for low-latency monitoring, with LightGBM providing the best overall balance between speed and memory usage. Table 6 reports the computational cost of the proposed pipeline using four measurable indicators: wall clock training time, inference latency, peak memory usage during inference, and serialized model size. We report inference in two forms to remove ambiguity. End-to-end inference time measures the full deployment path, including the encoder forward pass that generates the latent features and the subsequent classifier prediction, reported as seconds per 1000 samples. Classifier-only inference time measures prediction time when the classifier is applied to pre-extracted latent vectors, isolating the classification step. The results show that training cost varies substantially across classifiers, with Autoencoder plus Random Forest requiring the longest training time, followed by Autoencoder plus LightGBM, while Autoencoder plus RBFNN trains quickly. At inference, all pipelines remain low latency, but the encoder contributes a nontrivial share of end-to-end time, which explains why classifier-only latency is markedly lower than end-to-end latency. LightGBM provides the most favorable overall balance between end-to-end latency, memory footprint, and model size, whereas Random Forest incurs the largest storage cost due to the ensemble size. Together, these measurements support the deployment-oriented motivation of the framework by quantifying the speed and resource trade-offs rather than relying on qualitative scalability claims.Figure 8. Two-dimensional t-SNE projection of the 15-dimensional latent representation learned by the autoencoder.Figure 8. Two-dimensional t-SNE projection of the 15-dimensional latent representation learned by the autoencoder.
 Table 6. Analysis results of runtime and performance cost.
Model Training Time (s)
Mean ± SDEnd-to-End Inference (s per 1000) Mean ± SD Classifier-Only Inference (s per 1000) Mean ± SD Peak Memory Usage (MB) Model Size (MB) Autoencoder training 280.303 ± 19.306 0.092 Autoencoder + RF 334.455 ± 5.247 1.487 ± 0.097 0.627 ± 0.011 1.068 78.589 Autoencoder + LightGBM 46.13 ± 0.688 0.980 ± 0.037 0.153 ± 0.002 0.683 7.207 Autoencoder + RBFNN 2.317 ± 0.403 0.808 ± 0.035 0.006 ± 0.002 1.283 2.121 - Comparison to other related works: Table 7 compares the accuracy performance of our hybrid models against previously reported IDS studies on CIC IDS 2017, which clearly shows that the proposed models achieve competitive performance. More importantly, our models have a lower computational cost in terms of inference latency and memory footprint, measured as wall clock inference time per 1000 samples and peak memory usage in MB. It is worth noting that perfect accuracy has been achieved by applying strong oversampling and extensive feature engineering to specialized subsets of traffic [4]. However, these settings are not suitable for real-time deployment, where class imbalance, evolving attack patterns, and resource constraints are unavoidable. In contrast, our method achieves comparable accuracy by utilizing an autoencoder to automatically distill the most salient signals, thereby eliminating the need for manual feature selection. Moreover, purely supervised neural models, such as [7], may struggle with interpretability or real-time constraints. At the same time, our layered approach provides both fast inference and clear insight into which patterns trigger alarms. All of these indicate that integrating unsupervised feature learning with both sequence-based and ensemble methods provides a balanced, high-performance solution that outperforms specialized, single-technique detectors.Table 7. Comparison of our proposed method with other related works.
Reference Method Accuracy (%) Zhang et al. (2022) [3] RF 94.30% Oyucu et al. (2024) [17] Decision Tree-based Ensemble Learning 95.2% Behal et al. (2016) [7] CNN on log-image representations 96.10% Tang C. et al. (2023) [18] Hybrid ML approach combining K-Means clustering + SVM 98.7% Yungaicela-Naula et al. (2023) [11] Reinforcement Learning (RL) 91.21% Luong et al. (2020) [10] DT 89.50% Butt HA et al. (2026) [4] ML + Ensemble Learning (RF, KNN, XGBoost) with Dynamic Feature Selection in SDN ~99 (RF, KNN),
~98 (XGBoost)This study Autoencoder + RF 99.39% Autoencoder + RBFNN 98.27% Autoencoder + LightGBM 99.39% - Computational cost and scalability comparison with prior work: Many recent studies on slow or low-rate DoS focus on detection accuracy, while practical criticism increasingly emphasizes deployability, throughput, and resource cost. To support the deployment-oriented discussion in this paper, we report explicit computational measurements for our pipeline and contextualize them against representative approaches in the literature.

5. Conclusions
Author Contributions
Funding
Institutional Review Board Statement
Informed Consent Statement
Data Availability Statement
Acknowledgments
Conflicts of Interest
References
- Stallings, W. Network Security Essentials: Applications and Standards, 7th ed.; Pearson: Upper Saddle River, NJ, USA, 2023. [Google Scholar]
- Al-Fayoumi, M.; Al-Haija, Q.A. Capturing low-rate DDoS attacks based on the MQTT protocol in a software-defined IoT environment. Array 2023, 19, 100316. [Google Scholar] [CrossRef]
- Zhang, B.; Zhang, T.; Yu, Z. DDoS detection and prevention based on artificial intelligence techniques. In Proceedings of the 2017 3rd IEEE International Conference on Computer and Communications (ICCC), Chengdu, China, 13–16 December 2017; pp. 1276–1280. [Google Scholar]
- Butt, H.A.; Harthy, K.S.; Shah, M.A.; Hussain, M.; Amin, R.; Rehman, M.U. Enhanced DDoS Detection Using Advanced Machine Learning and Ensemble Techniques in Software Defined Networking. Comput. Mater. Contin. 2024, 81, 3003–3031. [Google Scholar] [CrossRef]
- Kurnaz, S.; Khalid, A. A new distributed denial-of-service attacks detection system combining multistage autoencoders with RBF. Int. J. Comput. Sci. Mob. Comput. 2019, 8, 1–6. [Google Scholar]
- Ashi, Z.S. Multi-Layered Intelligent Cyber-Attack Detection Using One-Class SVM. Ph.D. Dissertation, Princess Sumaya University for Technology, Amman, Jordan, 2022. [Google Scholar]
- Behal, S.; Kumar, K. Trends in validation of DDoS research. Procedia Comput. Sci. 2016, 85, 7–15. [Google Scholar] [CrossRef]
- Bala, B.; Behal, S. AI techniques for IoT-based DDoS attack detection: Taxonomies, comprehensive review, and research challenges. Comput. Sci. Rev. 2024, 52, 100631. [Google Scholar] [CrossRef]
- Inchara, S.; Keerthana, D.; Babu, K.N.; Mabel, J.P. Detection and mitigation of slow DoS attacks using machine learning. In AIP Conference Proceedings; AIP Publishing LLC: Melville, NY, USA, 2023; Volume 2917. [Google Scholar]
- Luong, T.K.; Tran, T.D.; Le, G.T. DDoS attack detection and defense in SDN based on machine learning. In Proceedings of the 2020 7th NAFOSTED Conference on Information and Computer Science (NICS), Ho Chi Minh City, VietnamHo Chi Minh City, Vietnam, 26–27 November 2020; pp. 31–35. [Google Scholar]
- Yungaicela-Naula, N.M.; Vargas-Rosales, C.; Pérez-Díaz, J.A. SDN/NFV-based framework for autonomous defense against slow-rate DDoS attacks by using reinforcement learning. Future Gener. Comput. Syst. 2023, 149, 637–649. [Google Scholar] [CrossRef]
- Slowhttptest. Kali Linux Tools. 2024. Available online: https://www.kali.org/tools/slowhttptest/ (accessed on 1 November 2025).
- Yoachimik, O.; Pacheco, J. DDoS Threat Report for 2023 Q4. Cloudflare Blog. 2024. Available online: https://blog.cloudflare.com/ddos-threat-report-2023-q4 (accessed on 22 December 2025).
- Savvas, I.K.; Chernov, A.V.; Butakova, M.A.; Chaikalis, C. Increasing the quality and performance of n-dimensional point anomaly detection in traffic using PCA and DBSCAN. In 2018 26th Telecommunications Forum (TELFOR); IEEE: Piscataway, NJ, USA, 2018. [Google Scholar]
- Hussein, S.A.; Répás, S.R. A Hybrid Intrusion Detection Framework Using Deep Autoencoder and Machine Learning Models. AI 2026, 7, 39. [Google Scholar] [CrossRef]
- Guéhot, S. Optimized Random Forest Framework for Cybersecurity Anomaly Detection. In Proceedings of the 2025 International Conference on Metaverse and Current Trends in Computing (ICMCTC), Subang Jaya, Malaysia, 10–11 April 2025; pp. 1–6. [Google Scholar] [CrossRef]
- Oyucu, S.; Polat, O.; Türkoğlu, M.; Polat, H.; Aksöz, A.; Ağdaş, M.T. Ensemble Learning Framework for DDoS Detection in SDN-Based SCADA Systems. Sensors 2024, 24, 155. [Google Scholar] [CrossRef] [PubMed]
- Tang, C.; Luktarhan, N.; Zhao, Y. An Efficient Intrusion Detection Method Based on LightGBM and Autoencoder. Symmetry 2020, 12, 1458. [Google Scholar] [CrossRef]
- Singh, C.; Jain, A.K. A comprehensive survey on DDoS attacks detection & mitigation in SDN-IoT network. E-Prime-Adv. Electr. Eng. Electron. Energy 2024, 8, 100543. [Google Scholar]
- Kemp, C.; Calvert, C.; Khoshgoftaar, T.M.; Leevy, J.L. An approach to application-layer DoS detection. J. Big Data 2023, 10, 22. [Google Scholar] [CrossRef]
- Vladov, S.; Mulesa, O.; Vysotska, V.; Horvat, P.; Paziura, N.; Kolobylina, O.; Mieshkov, O.; Ilnytskyi, O.; Koropatov, O. Method for Detecting Low-Intensity DDoS Attacks Based on a Combined Neural Network and Its Application in Law Enforcement Activities. Data 2025, 10, 173. [Google Scholar] [CrossRef]
- Chen, J.; Wu, H.; Wang, X.; Wang, S.; Cheng, G.; Hu, X. IEA-DMS: An Interpretable feature-driven, Efficient and Accurate Detection Method for Slow HTTP DoS in high-speed networks. Comput. Secur. 2025, 150, 104291. [Google Scholar] [CrossRef]
- Bocu, R.; Iavich, M. Generalized detection of DDoS attack patterns using machine learning models. J. Netw. Comput. Appl. 2026, 6, 104441. [Google Scholar] [CrossRef]
- Abu Al-Haija, Q.; Droos, A. Resilient intrusion detection system for adversarial attacks on Low-Rate DDoS. Int. J. Mach. Learn. Cybern. 2025, 16, 8473–8502. [Google Scholar] [CrossRef]
- Droos, A.; Al-Haija, Q.A.; Alnabhan, M. Lightweight detection system for low-rate DDoS attack on software-defined-IoT. In Proceedings of the 6th Smart Cities Symposium (SCS 2022), Hybrid Conference, Bahrain, 6–8 December 2022; pp. 157–162. [Google Scholar] [CrossRef]
- Gogoi, B.; Ahmed, T. HTTP low and slow DoS attack detection using LSTM-based deep learning. In Proceedings of the IEEE 19th India Council International Conference (INDICON); IEEE: Piscataway, NJ, USA, 2022; pp. 1–6. [Google Scholar]
- Ahmed, S.; Khan, Z.A.; Mohsin, S.M.; Latif, S.; Aslam, S.; Mujlid, H.; Adil, M.; Najam, Z. Effective and efficient DDoS attack detection using a deep learning algorithm, a multi-layer perceptron. Future Internet 2023, 15, 76. [Google Scholar] [CrossRef]
- Nugraha, B.; Murthy, R.N. Deep learning-based slow DDoS attack detection in SDN-based networks. In Proceedings of the 2020 IEEE Conference on Network Function Virtualization and Software Defined Networks (NFV-SDN), Leganes, Spain, 10–12 November 2020; pp. 51–56. [Google Scholar]
- Wang, W.; Liu, Y.; Meng, Q.; Chen, Z. DDoS attack detection and defense techniques in software defined networks: A survey. Comput. Sci. Rev. 2026, 60, 100921. [Google Scholar] [CrossRef]

| BENIGN Size | Model | Accuracy | Precision | F1-Score |
|---|---|---|---|---|
| 5450 | Encoder + RF | 99.72 | 99.72 | 99.68 |
| 5450 | Encoder + LightGBM | 99.54 | 99.54 | 99.53 |
| 5450 | Encoder + RBFNN | 99.09 | 98.28 | 98.67 |
| 50,000 | Encoder + RF | 99.94 | 99.92 | 99.92 |
| 50,000 | Encoder + LightGBM | 99.70 | 99.83 | 99.76 |
| 50,000 | Encoder + RBFNN | 99.89 | 99.78 | 99.83 |
| 100,000 | Encoder + RF | 99.97 | 99.95 | 99.95 |
| 100,000 | Encoder + LightGBM | 99.83 | 99.91 | 99.87 |
| 100,000 | Encoder + RBFNN | 99.94 | 99.89 | 99.91 |
| Study and Method | Data Representation and Model Family | Cost Metrics | Hardware Disclosure | Scalability Notes and Main Cost Driver |
|---|---|---|---|---|
| This study: Encoder + RF, LightGBM, RBFNN | Flow features. Autoencoder feature compression plus supervised classifier | Measured training time and inference latency. End-to-end inference per 1000 samples: 1.487 s (Random Forest), 0.980 s (LightGBM), 0.808 s (RBFNN). Classifier only inference per 1000 samples: 0.627 s, 0.153 s, 0.006 s. Peak memory during inference: 1.068 MB, 0.683 MB, 1.283 MB. Model size: 78.589 MB, 7.207 MB, 2.121 MB. | Fully specified in the runtime section of this paper | Inference scales linearly with the number of flows. Encoding adds a fixed per-flow cost and explains the gap between end-to-end and classifier-only timing. Storage differs substantially across classifiers. |
| Chen et al. (IEA DMS) [22] | High-speed monitoring. Sampling-aware sketch plus interpretable features and detector | Reported detection within 2 min under sampling with low memory usage. Reported processing performance of 13.1 million packets per second and ability to process long traffic periods without clearing memory. | NR in a directly comparable table format | Designed for high-speed packet processing. Cost dominated by sketch updates and feature recording rather than heavy model inference. |
| Bocu and Iavich (FLD DDoS) [23] | Packet stream modeling. Federated learning with Bi LSTM and drift handling | Reported sub-second latency and stated linear time complexity for core algorithms | NR in a directly comparable table format | Scalability driven by distributed training and streaming deployment. Cost dominated by recurrent inference and federated coordination. |
| Kemp et al. (PCA plus classical learners) [20] | NetFlow features plus PCA dimensionality reduction plus classical classifiers | NR for timing and memory. Discusses flow level representation as smaller storage and faster parsing than packet captures | NR in a directly comparable table format | Emphasizes scalability benefit of flow records for storage and processing. Cost depends on feature extraction and chosen learner. |
| Vladov et al. (combined neural system) [21] | Statistical filter plus neural modules, including convolution, transformer, autoencoder, and calibrated regressor | NR for timing and memory in the available summary. Focus is on detection metrics, calibration, and forensic artifacts | NR in a directly comparable table format | Multi-stage design. Deep modules typically increase compute needs. Scalability depends on temporal modeling and multi-module inference. |
| Abu Al-Haija et al. (adversarial robustness study) [24] | Deep models plus GAN-generated adversarial examples for low-rate DDoS IDS stress testing | NR for deployment cost. Focus is on evasion success and robustness analysis | NR in a directly comparable table format | Highlights that adversarial testing can add compute cost during evaluation. Not a deployment cost study. |
Disclaimer/Publisher’s Note: The statements, opinions and data contained in all publications are solely those of the individual author(s) and contributor(s) and not of MDPI and/or the editor(s). MDPI and/or the editor(s) disclaim responsibility for any injury to people or property resulting from any ideas, methods, instructions or products referred to in the content. |
© 2026 by the authors. Licensee MDPI, Basel, Switzerland. This article is an open access article distributed under the terms and conditions of the Creative Commons Attribution (CC BY) license.
Share and Cite
Alrashid, B.H.; Alwadi, M.; Al-Haija, Q.A. Hybrid-Pipeline-Based Detection and Classification of HTTP Slow Denial-of-Service Attacks Using Radial Basis Function Neural Networks. J. Cybersecur. Priv. 2026, 6, 64. https://doi.org/10.3390/jcp6020064
Alrashid BH, Alwadi M, Al-Haija QA. Hybrid-Pipeline-Based Detection and Classification of HTTP Slow Denial-of-Service Attacks Using Radial Basis Function Neural Networks. Journal of Cybersecurity and Privacy. 2026; 6(2):64. https://doi.org/10.3390/jcp6020064
Chicago/Turabian StyleAlrashid, Bashaer H., Mazen Alwadi, and Qasem Abu Al-Haija. 2026. "Hybrid-Pipeline-Based Detection and Classification of HTTP Slow Denial-of-Service Attacks Using Radial Basis Function Neural Networks" Journal of Cybersecurity and Privacy 6, no. 2: 64. https://doi.org/10.3390/jcp6020064
APA StyleAlrashid, B. H., Alwadi, M., & Al-Haija, Q. A. (2026). Hybrid-Pipeline-Based Detection and Classification of HTTP Slow Denial-of-Service Attacks Using Radial Basis Function Neural Networks. Journal of Cybersecurity and Privacy, 6(2), 64. https://doi.org/10.3390/jcp6020064