Abstract
Intrusion Detection Systems (IDS) play a vital role in safeguarding networks, yet their effectiveness is often challenged, as cyberattacks evolve in new and unexpected ways. Machine learning models, although very powerful, usually perform well only on data that closely resembles what they were trained on. When faced with unfamiliar traffic, they often misclassify. In this work, we examine this generalization gap by training IDS models on one Denial-of-Service (DoS) variant, DoS Hulk, and testing them against other variants such as Goldeneye, Slowloris, and Slowhttptest. Our approach combines careful preprocessing, dimensionality reduction with Principal Component Analysis (PCA), and model training using Random Forests and Deep Neural Networks. To better understand model behavior, we tuned decision thresholds beyond the default 0.5 and found that small adjustments can significantly affect results. We also applied Shapley Additive Explanations (SHAP) to shed light on which features the models rely on, revealing a tendency to focus on fixed components that do not generalize well. Finally, using Uniform Manifold Approximation and Projection (UMAP), we visualized feature distributions and observed overlaps between training and testing datasets, but these did not translate into improved detection performance. Our findings highlight an important lesson: visual or apparent similarity between datasets does not guarantee generalization, and building robust IDS requires exposure to diverse attack patterns during training.
1. Introduction
With advancements in technologies, the world is becoming digitally connected. All the economic sectors are now interconnected and depend on different applications, tools, devices and services for day-to-day tasks. While these innovations are becoming more ubiquitous, the vulnerabilities in the systems are also increasing, resulting in more adversarial activities. Therefore, it is becoming necessary to maintain trust, security, privacy and operational continuity. Traditional approaches like anti-virus, firewall and signature-based threat identification are relevant for protecting the system and network, but they are not adequate in addressing the evolving attacks. According to a study on network breaches [1] the attackers are achieving record-breaking losses in short dwell times. Therefore, the cybersecurity mechanisms are shifting from strengthening the perimeter to continuously monitoring and protecting the network. This protection is particularly important, especially in Denial of Service (DoS) attacks that overwhelm the network with a huge amount of traffic [2]. Various techniques are being applied to maintain the security of the network where Intrusion Detection Systems (IDS) are fundamental. These systems monitor the incoming traffic continuously and check for abnormal activities, malicious behavior and unauthorized access in real time [3], whereas Network Intrusion Detection Systems (NIDS) are focused on tracking the incoming packets of the data at network-level, analyzing the patterns to identify any exploitation. Therefore, the current need is for a system that can learn in real time, based on the incoming traffic, which can be achieved by integrating machine learning (ML). However, the pipeline should be designed carefully to avoid latencies.
The ML-based NIDS have proven their capabilities on benchmark datasets; however, there are rising concerns about their generalizability and robustness when applied in real-world scenarios [4]. The ML models work well when trained for a specific type of attack, because the feature values in the network traffic are very different in benign and attack cases. However, in real-world situations, the attackers can modify the pattern of the traffic and introduce new types of attack, which will go undetected by the trained models [5]. For instance, a NIDS which is trained with one type of DoS attack, i.e., DoS Hulk, which is fast and high in volume, will not be able to detect the other DoS types, such as Slowloris or Slowhttptest, which are generally slow and stealthy in nature. This non-generalizability of the ML-based NIDS is the key limitation today. The goal of an IDS should not just be achieving good performance with known types of attacks; it should, rather, be able to maintain good performance across different yet, functionality-wise, similar attacks. In this research work, the focus is on understanding how the feature space looks for different DoS attacks and how well ML models trained on one type of attack can identify the others.
ML has emerged as a modern development in the IDS that offers the ability to learn from the historical network traffic and differentiate between the normal and benign traffic. Supervised ML algorithms like Decision Trees (DTs), Support Vector Machines (SVMs), Random Forest (RF) and Deep Neural Networks (DNNs) have performed exceptionally well across different datasets [6,7]. These models work well with high-dimensional data, which captures the features of the traffic that traditional techniques might miss. However, the real-world implementation of these models faces difficulties in predicting new traffic patterns, because they over-rely on the data provided during the training phase. The performance of NIDS based on ML become affected when characteristics of one of the attack types are different from the other variant of the same category. In this paper, we have used SHAP (Shapley Additive exPlanations) as an Explainable AI (XAI) technique to uncover the reliance of ML models on different features of the dataset to exhibit the non-generalizability across different DoS types in the CIC-IDS 2017 [8]. The CIC IDS 2017 dataset was developed by the Canadian Institute of Cybersecurity that contains real network traffic with benign as well as attack patterns. It consists of network traffic data collected on different days. It has network traffic containing attacks like botnets, infiltration, and different variants of DoS. It has around 80 features extracted from the flow, as well as packet-level data.
This work addresses the gap between the ML-based NIDS that give good performances in controlled environments and their effectiveness in real-world scenarios. In the existing works, the dataset is split into train and test, and various performance metrics such as accuracy, recall, precision, F1-score, etc., are calculated [9]. These metrics are sufficient to evaluate the performance of models on the known attack types, but if a slight change is made in the traffic, or a new type of attack is presented, they fail to classify them. In real-world situations, the attackers can use different ways to fool these models and bypass the detection. It means that models trained on one of the types of DoS attacks might not be able to detect the other variant of the same attack, which can be disastrous. This study focuses on evaluating the generalization gap by analyzing the SHAP values. Furthermore, to support the findings of this work, UMAP (Uniform Manifold Approximation and Projection) [10], which is a dimensionality reduction technique that keeps the global and local structure of the features, is applied to see the divergence in behavior. The objective is to go beyond performance metrics and evaluate the reliability and generalizability of the learnings of the model. This paper can serve as a guide for future studies to include the cross-variant testing in their model evaluations. The aim is to see beyond the performance of models in controlled environments. The contributions of this study are as follows:
- Evaluating the two ML models—RF and DNN models on DoS variants: DoS Hulk, Goldeneye, Slowloris and Slowhttptest, and analyzing the performance.
- Assessing the generalization capabilities of the two models, trained on DoS Hulk and Benign samples.
- Comparing the importance of features to understand the behavior of the model using SHAP.
- Applying UMAP visualizations to support the divergence in behavior.
The rest of this article is written as follows: the next section discusses the relevant literature focusing on IDS and ML algorithms, followed by the methodology section describing the details related to data, feature engineering, model training, evaluation and non-generalizability assessment. The implementation section discusses the technical workflow of the proposed framework and has a detailed discussion of the experimental results. The last section concludes with the discussion and summarization of the findings.
2. Literature Review
ML-based NIDS are capable of detecting malicious traffic automatically. These systems are different from the traditional ones that depend on writing rules for detecting the patterns and signatures of the abnormal traffic, which are not proficient in spotting zero-day or complicated patterns [11]. On the other hand, the ML-based NIDS can learn the pattern from the traffic data and use it to identify both seen and unseen attacks. Several ML techniques, like SVM, DNN, RF, etc., have proven their efficiency in IDS [6]. These ML models are apt for handling high-dimensional data, like network traffic, that is complex and nonlinear. Despite being so capable and successful, the ML-based models do not reflect the real time scenarios, as they evaluate performance on static datasets by simply splitting into train–test subsets. Even a very good performing model with higher accuracy cannot assure the attack prediction, even with a slight change in the pattern. This resulted in the exploration of techniques to assure robustness, reliability and generalizability of the ML-based NIDS [4].
The deep learning algorithms perform well with high-dimensional data that shows nonlinearity in relationships with other features. Similarly, ensemble algorithms like bagging and boosting also give improved accuracy and reduce the variance [12]). The ML models trained and tested on the same dataset give results above 98% [13]. Similarly applying unsupervised approaches like autoencoders or other hybrid ones have gained popularity for detecting the anomalies in the traffic [14]. However, most of the work performed in the field focuses on achieving higher rates of accuracy and often neglects the practical implications of real-world requirements, i.e., adaptability and resilience. Several feature selection and reduction techniques were included by the researchers in their work, to reduce the computational complexity and improve the performance, but the results achieved are found to be coupled with the dataset used during training [15]. The datasets used are from some of the works found in the literature, but the approach to evaluate their performance has changed. Some use time-based splits, while some apply attack-types as a filter. The performance has been improved with different algorithms and methodologies, but the concern regarding the generalizability remains under-explored.
Generalizability of ML-based NIDS means the capability of the trained model to perform well, i.e., detect unseen attacks equally as well as seen attacks. Seen attacks mean the type of attacks upon which the model was trained. In real-world situations, when a NIDS is deployed, the traffic it is going to encounter is not always going to be of the same type. The attackers use various patterns, which make the detection of an attack impossible. This problem is faced specially in the case of DoS attacks, where different variants like Hulk, Slowloris, Goldeneye and Slowhttptest shows different patterns [16]. Researchers have raised concerns about the over-optimized performance of ML-based IDS on the known traffic [4]. A framework proposed by [5] fails to achieve generalizability, as the models could not detect the unseen patterns. Another work by [17] focused on using different ways of splitting the dataset and evaluating it using different methods. However, most of the recent studies are still focusing on the performance of the models and reporting the results on the same training and testing datasets. Researchers consider the attacks of one type (DoS) as homogeneous, and at times do not consider the variations in their patterns (among variants). Because of this, the performance of the models reported in the literature overshadows the vulnerabilities in the NIDS [18]. The research on cross-variant evaluations and generalizations is still limited, as the existing works do not test the performance for similar but unseen patterns. If the generalizability is not considered for evaluation purposes, the NIDS will give good results in controlled environments with known data but will fail in real-world deployment.
Having XAI in cybersecurity models for interpretability is a good choice, because models like DNNs do not have any transparency. They are accurate, but the interpretability is limited; therefore, SHAP, which is a tool based on game theory, can be integrated into NIDS to measure the contributions of each of the features in the prediction [19]. This can be used to evaluate the importance of the features by enabling comparisons of the features in a visual manner and identifying overfitting. According to some studies, the SHAP can reveal the correlations among the features that are responsible for non-generalizability. SHAP can provide an interpretation that can help the analysts to understand the logic behind the decisions of the model. Furthermore, it can also help in choosing the right set of features, as it supports both global and local interpretability. SHAP can be used as a component of the implementation pipeline or as a diagnostic tool; either way, it can contribute to better accountability of the model. Other visualization tools like UMAP can be used in NIDS to interpret high-dimensional data, as it reduces the dimensionality while preserving local and global relationships [10]. UMAP makes clusters of the data points, which can be used to see whether the classes are separable or not. UMAP can also be used either during feature engineering or as a post training inspection tool to identify the decision boundaries. Integrating SHAP and UMAP can support the overall comprehensive understanding of the reason behind the decisions made by the ML models. The integration of UMAP in the field of security is still underutilized; mapping the feature space can highlight the reason behind the non-generalizability of the attacks, even when belonging to the same family as DoS. Table 1 below depicts a summary of some of the existing works in ML-based NIDS that focus on different areas. It provides some papers that evaluated their model either cross-dataset or cross-variant, using SHAP or UMAP or other visualization techniques. Most of the research suggests that the performance of the models within the training datasets is very high, but they fail to generalize across variants, which is also the motivation behind this work.

Table 1.
Overview of ML-based IDS research: dataset diversity, generalizability, and explainability.
3. Methodology
The work performed in this research follows a systematic and sequential methodology, including data preprocessing, feature extraction, 2 machine learning models’ training, a performance assessment on the same attack and different variants and finally, understanding feature importance and feature space. The flow of the work performed is explained below, followed by a flowchart depicted in Figure 1:
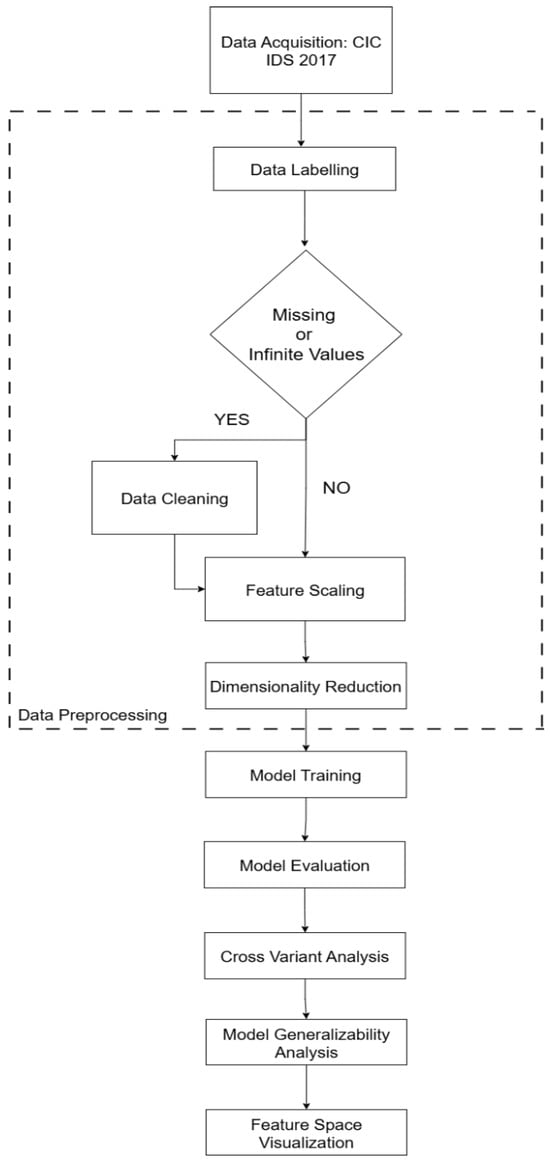
Figure 1.
Proposed NIDS flowchart.
- Data Acquisition: Collect CIC IDS 2017 benchmark dataset and identify the relevant subsets like DoS Hulk, DoS Goldeneye, DoS Slowloris and DoS Slowhttptest.
- Data Labeling: The categorical values are labeled using label encoding.
- Missing Data Decision: The data is checked for missing or null values.
- Infinite Data Decision: The data is checked for infinite values.
- Data Cleaning: If missing or infinite values are found in the dataset, they are deleted.
- Feature Scaling: Standard scaler is used to scale the features.
- Feature Selection: To extract relevant features and reduce the dimensionality of the dataset, PCA is implemented.
- Model Training: ML models are trained on a dataset with 50k benign samples from Monday traffic and 50k DoS Hulk samples from Wednesday traffic. The algorithms used are RF and DNN, with 5-fold cross-validation.
- Performance Evaluation: Accuracy, precision, recall, F1-score and confusion matrix are used to evaluate the performance of the system.
- Cross-Variant Analysis: For cross-variant analysis of ML models, the trained models were used for testing datasets with unseen variants of DoS attacks like Goldeneye, Slowloris and Slowhttptest. Furthermore, threshold tuning is performed for each of the tests, and the one with best accuracy is chosen.
- Model Generalizability Analysis: SHAP is used to understand the importance of features for each of the applied models.
- Feature Space Visualization: UMAP is applied to visually depict how the feature space of different attacks is learned by the models.
3.1. Dataset Overview and Preprocessing
The dataset used in this research work is CIC-IDS 2017 has realistic records representing real-world traffic) [8]. This was developed by the Canadian Institute and has around 80 features for each of the records, providing detailed insights about various types of attacks. The dataset includes both benign and cyberattack records captured during different days of the week. For this research work, we chose 50 k Benign samples from Monday traffic and 50 k DoS Hulk samples from Wednesday traffic. The number of both the target classes was kept the same to maintain balance in the training dataset. Furthermore, subsets of test datasets for generalizability analysis were also maintained: (i) test dataset1 with 10 k samples of Benign and 10 k DoS Goldeneye, (ii) test dataset2 with 5 k samples of Benign and 5 k DoS Slowloris and (iii) test dataset3 with 5 k samples of Benign and 5 k DoS Slowhttptest.
The chosen DoS attack types have distinct characteristics.
DoS Hulk: It is a type of attack that generates huge volume of HTTP requests to consume all the server resources. It can be identified by heavy traffic bursts and connection requests.
DoS Goldeneye: It is a type of attack that sends slow and randomized HTTP requests to the server and aims to keep the connection live for longer, gradually consuming all the server resources, making its detection difficult.
DoS Slowloris: It is a low-bandwidth attack that sends partial HTTP requests to the application layer to keep the connection live, exploiting server connection handling.
DoS Slowhttptest: This attack is similar to Slowloris. It sends HTTP requests at slow and controlled rates, targeting server timeout mechanisms and eventually consuming resources for a longer time.
The datasets were preprocessed before training the ML models. The first step during the preprocessing was to check for null and infinite values; there were some infinite values which were first replaced by Nan and then removed. Then, the StandardScaler was applied for feature scaling. The class distribution after the preprocessing phase is depicted in Figure 2 below:
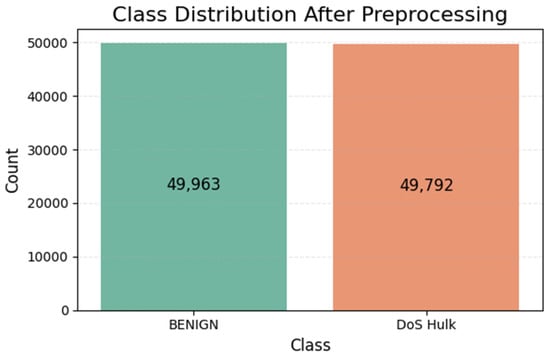
Figure 2.
Class distribution of training dataset after preprocessing.
Furthermore, to reduce the dimensionality of the dataset, PCA was applied. Figure 3 below depicts the cumulative explained variance plot, in which 95% of the variance can be maintained by using just 19 initial components. This will reduce the feature space, while retaining essential characteristics and variance. This approach ensures maximum preservation of the information from the dataset while reducing dimensionality. In our experimentation, PCA was explicitly applied to the training dataset and later applied to transform both training and testing data to avoid data leakage.
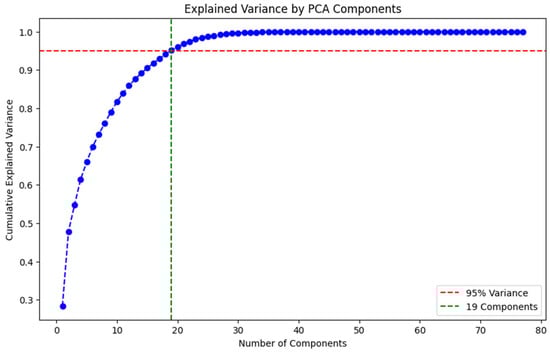
Figure 3.
PCA cumulative explained variance, showing 95% variance captured within 19 components.
3.2. Model Training and Evaluation
Random Forest and Deep Neural Networks were trained for assessing the learning abilities and generalizability of the NIDS. Both models were trained on Benign + DoS Hulk datasets using stratified 5-fold cross-validation. For RF, the number of trees was 100, random state 42, and the criteria used was gini impurity, summarized in Table 2 below, whereas for DNN 2, hidden layers were applied, and an Adam optimizer was used with a 0.001 learning rate. For the loss function, binary cross-entropy was used on a batch size of 256 and a maximum of 50 epochs. For preventing overfitting, early stopping with patience 5 was applied. The details are summarized in Table 3 below. For both the models, the metrics like accuracy, precision, recall, F-1 score, and confusion matrix were computed for each of the 5 folds, and an average is calculated.
Table 2.
RF model training details.
Table 3.
DNN model training details.
3.3. Cross-Variant Analysis
The objective of this work is to evaluate the generalizability of the trained IDS, by examining how a model trained on one type of attack can identify the other unseen attacks from the same family with similar characteristics but different patterns and structures, for which we have applied cross-variant analysis. For this, two ML models are trained on one type of DoS attack, i.e., DoS Hulk, and then the same models are tested on different variants of DoS: namely, DoS Goldeneye, DoS Slowloris and DoS Slowhttptest. The implementation followed all the steps, including preprocessing, dimensionality reduction and model training, across the four test datasets and the performance is measured to draw conclusions about the generalizability.
3.4. Model Generalizability Analysis
SHAP is applied for the analysis of trained models across the variants. The analysis reveals the importance that each of the features plays during the decision-making process. This is used to determine whether the same features are used by the models to make decisions for each of the test datasets. This helped in understanding that some features that were having more impact in DoS Hulk had less impact in identifying other variants, revealing the non-generalizability.
3.5. Feature Space Visualization
UMAP is a nonlinear dimensionality reduction technique that preserves the global and local structure of the data. It was applied to explore the feature space and determine the separability across different variants of the DoS attack. The training and testing datasets were projected into a two-dimensional space, and different colors were used to depict different classes. This visualization further supported the conclusions we made from evaluations and SHAP about non-generalizability.
4. Implementation and Results
The performance of RF and DNN models was evaluated on different variants of DoS attacks on a CIC IDS 2017 dataset. The analysis performed includes accuracy metrics, the confusion matrix, threshold tuning, feature-importance mapping and feature space visualization. In this section, the conducted experiments and the key findings are discussed.
4.1. Model Training
The RF and DNN models were trained on balanced datasets with 50,000 DoS Hulk and 50,000 benign traffic. The attack samples were taken from Wednesday traffic, while the benign samples were taken from Monday of the CIC IDS 2017 dataset. This temporal selection was chosen to simulate a real-world scenario, and to ensure that the models learn more generalized patterns. The evaluation of the models was performed using 5-fold cross-validation and the results are depicted in Table 4 and Figure 4 below. Both models perform well on the seen data; RF outperforms DNN across all the performance metrics.
Table 4.
Confusion matrices for RF and DNN.
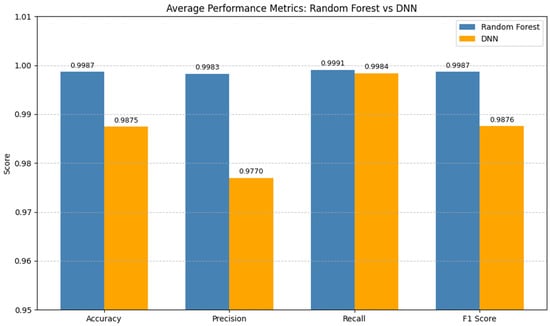
Figure 4.
Confusion matrices and performance metrics for RF and DNN on seen data.
4.2. Cross-Variant Evaluation
The aim of this work is to assess the generalizability of the trained models, and for that, cross-variant evaluations were conducted by testing the models on unseen attack variants of DoS: Goldeneye, Slowloris and Slowhttptest. The goal is to observe how these trained models can use their knowledge of one DoS variant for identifying the other ones. By default, the ML models use a 0.5 threshold to convert the predictions into labels, which means any sample value achieving a predicted probability more than or equal to 0.5 is classified as positive, and less than 0.5 as negative. However, while testing the unseen datasets, 0.5 may not always be the optimal value, as higher thresholds (>0.5) reduce the number of false positives, while smaller thresholds (<0.5) reduce false negatives, affecting recall and precision of the model; therefore, we tried this with different thresholds from 0.1 to 0.9 and evaluated how it affected the performance. This also shows how sensitive ML models are, with respect to threshold selection.
Pretrained RF model on DoS Goldeneye Variant
The pretrained RF model was implemented on the test dataset with 10,000 DoS Goldeneye and 10,000 benign samples. We evaluated the model on the default threshold of 0.5 and the tuned threshold of 0.1 (highest accuracy), chosen based on threshold analysis as depicted in Table 5, and confusion metrics for both thresholds are depicted in Table 6 below.
Table 5.
Threshold tuning for RF on DoS Goldeneye test dataset.
Table 6.
Confusion matrices for pretrained RF on DoS Goldeneye test dataset for default and optimal thresholds.
It can be seen in the table above that with the RF model, when tested on an unseen attack, i.e., DoS Goldeneye, the accuracy achieved is 76.07% after tuning.
Pretrained DNN model on DoS Goldeneye Variant
The pretrained DNN model was implemented on the test dataset with 10,000 DoS Goldeneye and 10,000 benign samples. We evaluated the model on the default threshold of 0.5 and the tuned threshold of 0.1 (highest accuracy), chosen based on threshold analysis, as depicted in Table 7, and confusion metrics for both thresholds are depicted in Table 8 below.
Table 7.
Threshold tuning for DNN on DoS Goldeneye test dataset.
Table 8.
Confusion matrices for pretrained DNN on DoS Goldeneye test dataset for default and optimal thresholds.
The table above shows that with the DNN model, when tested on an unseen attack, i.e., DoS Goldeneye, the accuracy achieved is 71.11% with threshold = 0.1.
Pretrained RF model on DoS Slowloris Variant
The pretrained RF model was implemented on the test dataset with 5000 DoS Slowloris and 5000 benign samples. We evaluated the model on the default threshold of 0.5 and the tuned threshold of 0.1 (highest accuracy), chosen based on threshold analysis, as depicted in Table 9, and confusion metrics for both thresholds are depicted in Table 10, below. The precision reaches 0.000 at higher threshold values because the model cannot predict any positive samples that make scikit learn to report them as a default zero value.
Table 9.
Threshold tuning for RF on DoS Slowloris test dataset.
Table 10.
Confusion matrices for pretrained RF on DoS Slowloris test dataset for default and optimal thresholds.
The table above shows that with the RF model, when tested on an unseen attack, i.e., DoS Slowloris, the accuracy achieved is 60.3% with threshold = 0.1.
Pretrained DNN model on DoS Slowloris Variant
The pretrained DNN model was implemented on test dataset with 5000 DoS Slowloris and 5000 Benign Samples. We evaluated the model on default threshold 0.5 and tuned threshold 0.9 (highest accuracy), chosen based on threshold analysis as depicted in Table 11 and confusion metrics for both thresholds are depicted in Table 12 below.
Table 11.
Threshold Tuning for DNN on DoS Slowloris test dataset.
Table 12.
Confusion Matrices for pretrained DNN on DoS Slowloris test dataset for default and optimal thresholds.
The table above shows that with the DNN model, when tested on an unseen attack, i.e., DoS Slowloris, the accuracy achieved is 49.7% with threshold = 0.9.
Pretrained RF model on DoS Slowhttptest Variant
The pretrained RF model was implemented on the test dataset with 5000 DoS Slowhttptest and 5000 benign samples. We evaluated the model on the default threshold of 0.5 and the tuned threshold of 0.1 (highest accuracy), chosen based on threshold analysis, as depicted in Table 13, and confusion metrics for both thresholds are depicted in Table 14, below. In this case, the precision also reaches 0.000 at higher threshold values, because the model cannot predict any positive samples that make scikit learn to report them as a default zero value.
Table 13.
Threshold tuning for RF on DoS Slowhttptest test dataset.
Table 14.
Confusion matrices for pretrained RF on DoS Slowhttptest test dataset for default and optimal thresholds.
The table above shows that with the RF model, when tested on an unseen attack, i.e., DoS Slowhttptest, the accuracy achieved is 61.20% with threshold = 0.1.
Pretrained DNN model on DoS Slowhttptest Variant
The pretrained DNN model was implemented on the test dataset with 5000 DoS Slowhttptest and 5000 benign samples. We evaluated the model on the default threshold of 0.5 and the tuned threshold of 0.1 (highest accuracy), chosen based on threshold analysis, as depicted in Table 15, and confusion metrics for both thresholds are depicted in Table 16, below.
Table 15.
Threshold tuning for DNN on DoS Slowhttptest test dataset.
Table 16.
Confusion matrices for pretrained DNN on DoS Slowhttptest test dataset for default and optimal thresholds.
The table above shows that with the DNN model, when tested on an unseen attack, i.e., DoS Slowhttptest, the accuracy achieved is 50.3% with threshold = 0.9.
Threshold Tuning Importance
During the implementation, threshold tuning was performed across all the experiments, and it emerged as a crucial aspect in improving the performance of the ML models. The implementation was performed with a default of 0.5 in the beginning; that means that precision and recall are treated with equal importance. However, when we performed the tuning of thresholds by varying the values from 0.1 to 0.9 and recalculated the performance metrics, the results showed consistent improvement. For our evaluation, we chose the thresholds that resulted in maximum accuracy and then compared the results with the default value to highlight the difference in accuracy, which was more than 10% in some cases. With this, it can be concluded that threshold tuning should be considered to be an integral part of the IDS model evaluations, particularly in cross-variant analysis or complex datasets with nonlinear relationships. A summary of the best accuracies achieved for each of the attack types is depicted in Table 17, below.
Table 17.
Best accuracies for each of the attack types after threshold tuning.
4.3. Generalizability Assessment
A subset from the CIC IDS 2017 dataset was trained on DoS Hulk and benign samples with two ML algorithms, and then the generalizability of the IDS was assessed by implementing the trained models on other variants of the DoS attacks, namely, Goldeneye, Slowloris and Slowhttptest, to simulate the real-world scenarios. The results are presented in Figure 5 below, showing RF outperforming DNN consistently for each of the test datasets and for each of the performance metrics. In the cases of Slowloris and Slowhttptest, the DNNs performances show larger margins with respect to RF when compared to Goldeneye because of the stealthy nature of these attacks, thus limiting the generalizability beyond the seen attacks. This concludes that DNN overfits more when compared to RF, which performs comparatively better at demonstrating adaptability.
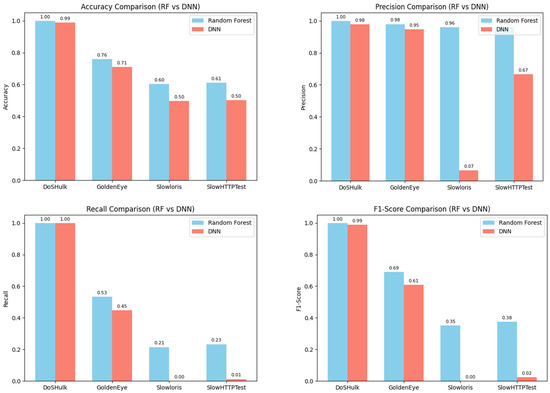
Figure 5.
Summary of all performance metrics across DoS variants.
4.4. SHAP-Based Interpretability
In order to understand the internal logic used by the applied ML models, SHAP was applied to analyze the importance of the features across all the test scenarios. In our setup, SHAP helps with explainability and transparency of the PCA-transformed dataset, reflecting the contributions of each of the components in decision-making. The SHAP summary plot is depicted in Figure 6 below, which shows the top PCs based on importance (top to bottom), where red means high values, while blue means low. Furthermore, the positive and negative values on the X-axis indicate the impact, where positive means the component pushing towards predicting an attack and negative pushing towards predicting benign. To compare the impact of top 10 components in all the four tests, SHAP importance is also plotted as a Heatmap, as shown in Figure 7 below. The darker shades represent more informative components. PC1 turned out to be the most prominent component for all the four variants’ tests. Furthermore, it can also be seen that the components are attack-specific, which shows that different attacks can activate different components for decision-making.
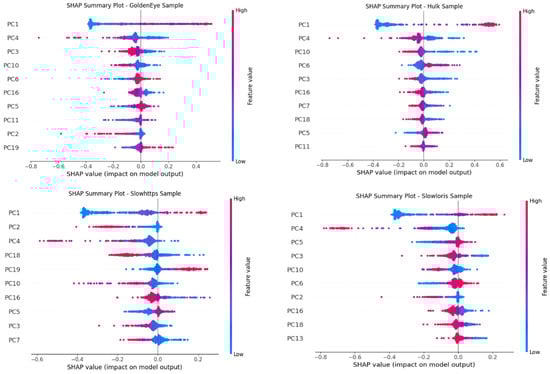
Figure 6.
SHAP summary plot for all test datasets.
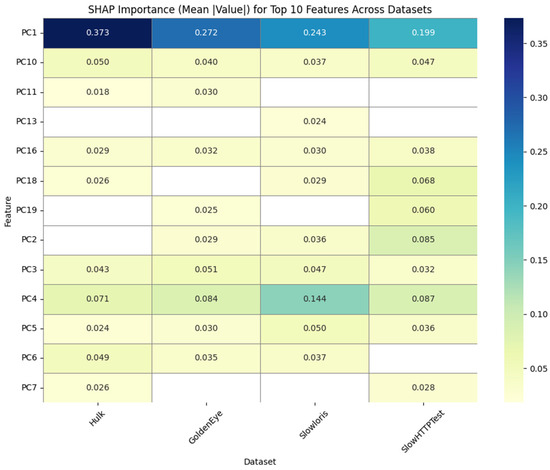
Figure 7.
Heatmap showing the average SHAP value per principal component across different test datasets.
4.5. UMAP-Based Feature Space Mapping
UMAP was plotted to demonstrate the similarity and difference between the training and test datasets. In the plot shown below, in Figure 8, the dimensionality of the dataset was reduced to two dimensions, and the samples are plotted to see how spread out they are. The training of the ML models was performed on benign. DoS Hulk samples are depicted in orange color. Then, the test datasets with other attacks, i.e., Slowhttptest, Slowloris and Goldeneye are depicted in green, purple and red colors, respectively. Since these datasets were not included in the training phase, it was expected that they would be making separate clusters away from the orange points. However, in the plot, some of these points overlap with the orange points, while some are nearby, but the spread is not very prominent. At first, it was expected that the attacks would look like the ones the models are trained on, so the models would be able to classify them. Nevertheless, the findings were different; a counterintuitive pattern was found and the models could not detect these malicious records. This concludes that the models were trained on the DoS Hulk variant and thus learned to identify those specific features associated with the attack. Even the other variants that are similar in nature could not activate the decision boundary learned by the ML models, resulting in misclassifying them. This corresponds to the fact that reduced dimensional visualization cannot necessarily justify the actual behavior or models’ logic to make decisions, thereby limiting the generalization across variants of the same attack.
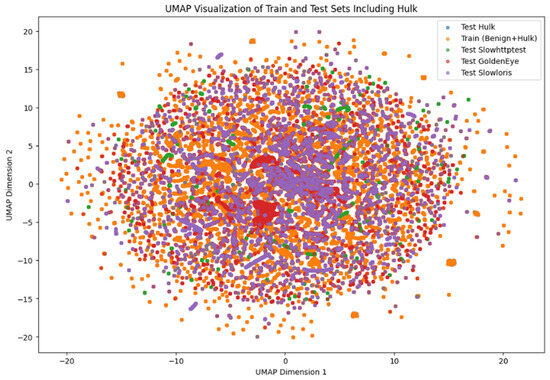
Figure 8.
UMAP Visualization of the Feature space of training and different test datasets.
5. Conclusions and Future Work
Detecting DoS attacks is still a challenging task in cybersecurity, because the attackers keep changing their approach and remain undetected. This research work tries to understand the generalizability of ML-based IDS; the aim is to understand whether a ML model trained on one type of DoS attack, such as DoS Hulk, will be able to detect its other variants, like DoS Goldeneye, Slowloris or Slowhttptest. Prominent ML models RF and DNN were trained using the CIC IDS 2017 dataset and their generalizability was evaluated. This dataset was chosen as it is considered to be a benchmark for IDS studies and is publicly available. First, the dataset was preprocessed, and then PCA was applied for dimensionality reduction, as the raw dataset contains around 80 features, which were reduced to 19 components. Then, the models were trained on benign and DoS Hulk samples and different metrics like accuracy, precision, recall, F1-score and confusion matrix were computed. The evaluations were performed on four different test datasets: one with Hulk samples, and the other three with Goldeneye, Slowloris and Slowhttptest samples, which were unseen to the trained models. Threshold tuning was also performed to improve the results, and the threshold value providing the best accuracy was chosen. The results demonstrated that the models performed very well when tested on seen data, i.e., Hulk, but the performance dropped when other test datasets were used. The models classified the unseen–unknown attacks as benign, which means that the models only learnt Hulk-specific features and could not detect similar behaviors as well. This experiment reveals the limitations of supervised ML-based IDS models that yield good performance with known traffic but fail to identify attacks that are slightly different, which is dangerous for real-time scenarios, as a new variant can go undetected.
SHAP was also applied to explore the reason why these models could not generalize. SHAP values help to identify the contributions of individual components during predictions. A SHAP heatmap was generated to see the importance of different components in predicting different DoS variants. Most of the components were common, which suggests that the data structure is similar; despite these similarities, the models failed to identify the unseen attacks correctly. Furthermore, UMAP dimensionality reduction was also performed to visualize the feature space in 2D, to depict how the variants differ from each other. UMAP also suggested that the features appearing close by in the feature space were still misclassified. It can also be concluded from the UMAP that the benign and attack samples were highly overlapping, which means the features are not very strong when it comes to differentiating among different classes. The ML models fail to generalize, which is a crucial aspect for IDS deployed in the real world. Therefore, it can be concluded that training an IDS on a single attack is not sufficient, no matter how good the ML model is. In future, training on other DoS variants like DoS Goldeneye, Slowloris or Slowhttptest can be performed to evaluate how well they generalize across other attacks. Furthermore, it is recommended that more emphasis should be placed on the generalizability of the IDS. For that, several strategies can be adopted, such as training models with different variants of attacks so that the IDS can learn more generalized features. Another area that can be explored could be employing other advanced optimizers and algorithms like XGBoost, BiGRU, and AdaBelief for enhancing performance. Unsupervised ML algorithms can also be explored in the future, as these models will try to figure out the pattern in the dataset without explicit labels, and will be able to detect new threats. The principal components of the different attacks can also be compared for investigating the generalizability of cross-attacks. Furthermore, SHAP can be integrated into the IDS at raw-data level, rather than after applying PCA, enhancing the explainability of the system. To promote continuous learning of the system, federated learning can also be integrated, in which different organizations can share the IDS and train the models on their local datasets. In conclusion, this paper highlights the limitations upon current IDS and recommends that the researchers work beyond traditional IDS and make systems that are smart, adaptable and generalized.
Author Contributions
Conceptualization, R.J.; methodology, R.J.; software, R.J.; validation, K.M. and S.M.I.; formal analysis, K.M.; investigation, R.J.; resources, M.N.; data curation, R.J.; writing—original draft preparation, R.J.; writing—review and editing, S.M.I. and M.N.; visualization, K.M.; supervision, S.M.I. and M.N.; project administration, S.M.I.; funding acquisition, M.N. All authors have read and agreed to the published version of the manuscript.
Funding
This research received no external funding.
Data Availability Statement
The data that support the findings of this study can be made available from the corresponding author upon reasonable request.
Conflicts of Interest
The authors declare no conflicts of interest.
References
- Mandiant. M-Trends 2024: Our View from the Frontlines. 2024. Available online: https://services.google.com/fh/files/misc/m-trends-2024.pdf (accessed on 2 July 2025).
- Aijaz, I.; Idrees, S.M.; Agarwal, P. An Empirical Study on Analysing DDoS Attacks in Cloud Environment. In Advances in Intelligent Computing and Communication: Proceedings of ICAC 2020; Springer: Singapore, 2021; pp. 295–305. [Google Scholar]
- Bace, R.G.; Mell, P. Intrusion Detection Systems; National Institute of Standards and Technology: Gaithersburg, MD, USA, 2001.
- Sommer, R.; Paxson, V. Outside the closed world: On using machine learning for network intrusion detection. In Proceedings of the 2010 IEEE Symposium on Security and Privacy, Oakland, CA, USA, 16–19 May 2010; IEEE: New York, NY, USA, 2010; pp. 305–316. [Google Scholar]
- Ring, M.; Wunderlich, S.; Scheuring, D.; Landes, D.; Hotho, A. A survey of network-based intrusion detection data sets. Comput. Secur. 2019, 86, 147–167. [Google Scholar] [CrossRef]
- Vinayakumar, R.; Alazab, M.; Soman, K.P.; Poornachandran, P.; Al-Nemrat, A.; Venkatraman, S. Deep learning approach for intelligent intrusion detection system. IEEE Access 2019, 7, 41525–41550. [Google Scholar] [CrossRef]
- Kayode-Ajala, O. Applying Machine Learning Algorithms for Detecting Phishing Websites: Applications of SVM, KNN, Decision Trees, and Random Forests. Int. J. Inf. Cybersecur. 2022, 6, 43–61. [Google Scholar]
- Sharafaldin, I.; Lashkari, A.H.; Ghorbani, A.A. CICIDS 2017 Dataset; Canadian Institute for Cybersecurity, University of New Brunswick: Fredericton, NB, Canada, 2017; Available online: https://www.unb.ca/cic/datasets/ids-2017.html (accessed on 2 July 2025).
- Garcia, S.; Grill, M.; Stiborek, J.; Zunino, A. An empirical comparison of botnet detection methods. Comput. Secur. 2020, 45, 100–123. [Google Scholar] [CrossRef]
- McInnes, L.; Healy, J.; Melville, J. UMAP: Uniform manifold approximation and projection for dimension reduction. arXiv 2018, arXiv:1802.03426. [Google Scholar] [CrossRef]
- Bhuyan, M.H.; Kashyap, H.J.; Bhattacharyya, D.K.; Kalita, J.K. Detecting Distributed Denial of Service Attacks: Methods, Tools and Future Directions. Comput. J. 2013, 57, 537–556. [Google Scholar] [CrossRef]
- Alzubaidi, L.; Zhang, J.; Humaidi, A.J.; Al-Dujaili, A.; Duan, Y.; Al-Shamma, O.; Santamaría, J.; Fadhel, M.A.; Al-Amidie, M.; Farhan, L. Review of deep learning: Concepts, CNN architectures, challenges, applications, future directions. J. Big Data 2021, 8, 53. [Google Scholar] [CrossRef] [PubMed]
- Abbas, A.; Khan, M.A.; Latif, S.; Ajaz, M.; Shah, A.A.; Ahmad, J. A New Ensemble-Based Intrusion Detection System for Internet of Things. Arab. J. Sci. Eng. 2022, 47, 1805–1819. [Google Scholar] [CrossRef]
- Berahmand, K.; Heydari, M.; Nabizadeh, A. A hybrid interpretable model for anomaly detection in high-dimensional cybersecurity data. Expert Syst. Appl. 2024, 235, 120215. [Google Scholar]
- Taher, K.A.; Jisan, B.M.Y.; Rahman, M.M. Network intrusion detection using supervised machine learning technique with feature selection. In Proceedings of the 2019 International Conference on Robotics, Electrical and Signal Processing Techniques (ICREST), Dhaka, Bangladesh, 10–12 January 2019; IEEE: New York, NY, USA, 2019; pp. 643–646. [Google Scholar]
- Dhanabal, L.; Shantharajah, S.P. A study on NSL-KDD dataset for intrusion detection system based on classification algorithms. Int. J. Adv. Res. Comput. Commun. Eng. 2015, 4, 446–452. [Google Scholar]
- Leevy, J.L.; Khoshgoftaar, T.M. A survey and analysis of intrusion detection models based on CSE-CIC-IDS2018 Big Data. J. Big Data 2020, 7, 104. [Google Scholar] [CrossRef]
- Saabith, S.; Thangarajah, V.; Fareez, M. A survey of machine learning techniques for anomaly detection in cybersecurity. Int. J. Res. Eng. Sci. 2023, 11, 183–193. [Google Scholar]
- Lundberg, S.M.; Lee, S.I. A unified approach to interpreting model predictions. Adv. Neural Inf. Process. Syst. 2017, 30, 4765–4774. [Google Scholar]
- Javaid, A.; Niyaz, Q.; Sun, W.; Alam, M. A Deep Learning Approach for Network Intrusion Detection System. In Proceedings of the 9th EAI International Conference on Bio-Inspired Information and Communications Technologies (BICT), New York, NY, USA, 3–5 December 2015; pp. 21–26. [Google Scholar]
- Yin, C.; Zhu, Y.; Fei, J.; He, X. A deep learning approach for intrusion detection using recurrent neural networks. IEEE Access 2017, 5, 21954–21961. [Google Scholar] [CrossRef]
- Al-Turaiki, I.; Altwaijry, N. A convolutional neural network for improved anomaly- and attack-type classification in network intrusion detection systems. Biomed. Inform. Insights 2021, 9, 233–252. [Google Scholar] [PubMed Central]
- Apruzzese, G.; Pajola, L.; Conti, M. The cross-evaluation of machine learning-based network intrusion detection systems. IEEE Trans. Netw. Service Manag. 2022, 19, 5152–5169. [Google Scholar] [CrossRef]
- Layeghy, S.; Portmann, M. Explainable Cross-domain Evaluation of ML-based Network Intrusion Detection Systems. Comput. Electr. Eng. 2022, 100, 108692. [Google Scholar] [CrossRef]
- Alsaffar, A.M.; Nouri-Baygi, M.; Zolbanin, H.M. Shielding networks: Enhancing intrusion detection with hybrid feature selection and stack ensemble learning. J. Big Data 2024, 11, 133. [Google Scholar] [CrossRef]
- Cantone, M.; Marrocco, C.; Bria, A. Machine learning in network intrusion detection: A cross-dataset generalization study. arXiv 2024, arXiv:2402.10974. [Google Scholar] [CrossRef]
- Korniszuk, K.; Sawicki, B. Autoencoder-Based Anomaly Detection in Network Traffic. In Proceedings of the 25th International Conference on Computational Problems of Electrical Engineering (CPEE), Stronie Śląskie, Poland, 10–13 September 2024; pp. 1–4. [Google Scholar]
Disclaimer/Publisher’s Note: The statements, opinions and data contained in all publications are solely those of the individual author(s) and contributor(s) and not of MDPI and/or the editor(s). MDPI and/or the editor(s) disclaim responsibility for any injury to people or property resulting from any ideas, methods, instructions or products referred to in the content. |
© 2025 by the authors. Licensee MDPI, Basel, Switzerland. This article is an open access article distributed under the terms and conditions of the Creative Commons Attribution (CC BY) license (https://creativecommons.org/licenses/by/4.0/).