3. Proposed Framework (Fed-DTB)
Building on the trust-based and adaptive concepts discussed in previous sections, we introduce Fed-DTB, a Federated, Dynamic Trust-Based framework designed to enhance the security, reliability, and efficiency of federated learning in IoV networks. The core idea behind Fed-DTB is to be a first line of defence by integrating multiple trust factors into the vehicular selection process and FL training, ensuring that only the most trustworthy and contextually suitable vehicles influence the global model. Fed-DTB consists of three main components:
A trust management system that evaluates the trustworthiness of each vehicle by integrating a diverse range of factors, including network status, vehicle state, energy consumption, compliance with traffic rules, contributions to the federated learning process, user feedback, and IDS alarms.
Using computed trust scores, our framework implements a trust-based vehicle selection mechanism that identifies and selects the most reliable vehicles for global model updates. Vehicles that do not meet the trustworthiness criteria or trigger IDS alerts are excluded.
A federated learning algorithm that allows the selected set of trusted vehicles to participate in training the shared global model [
44,
45].
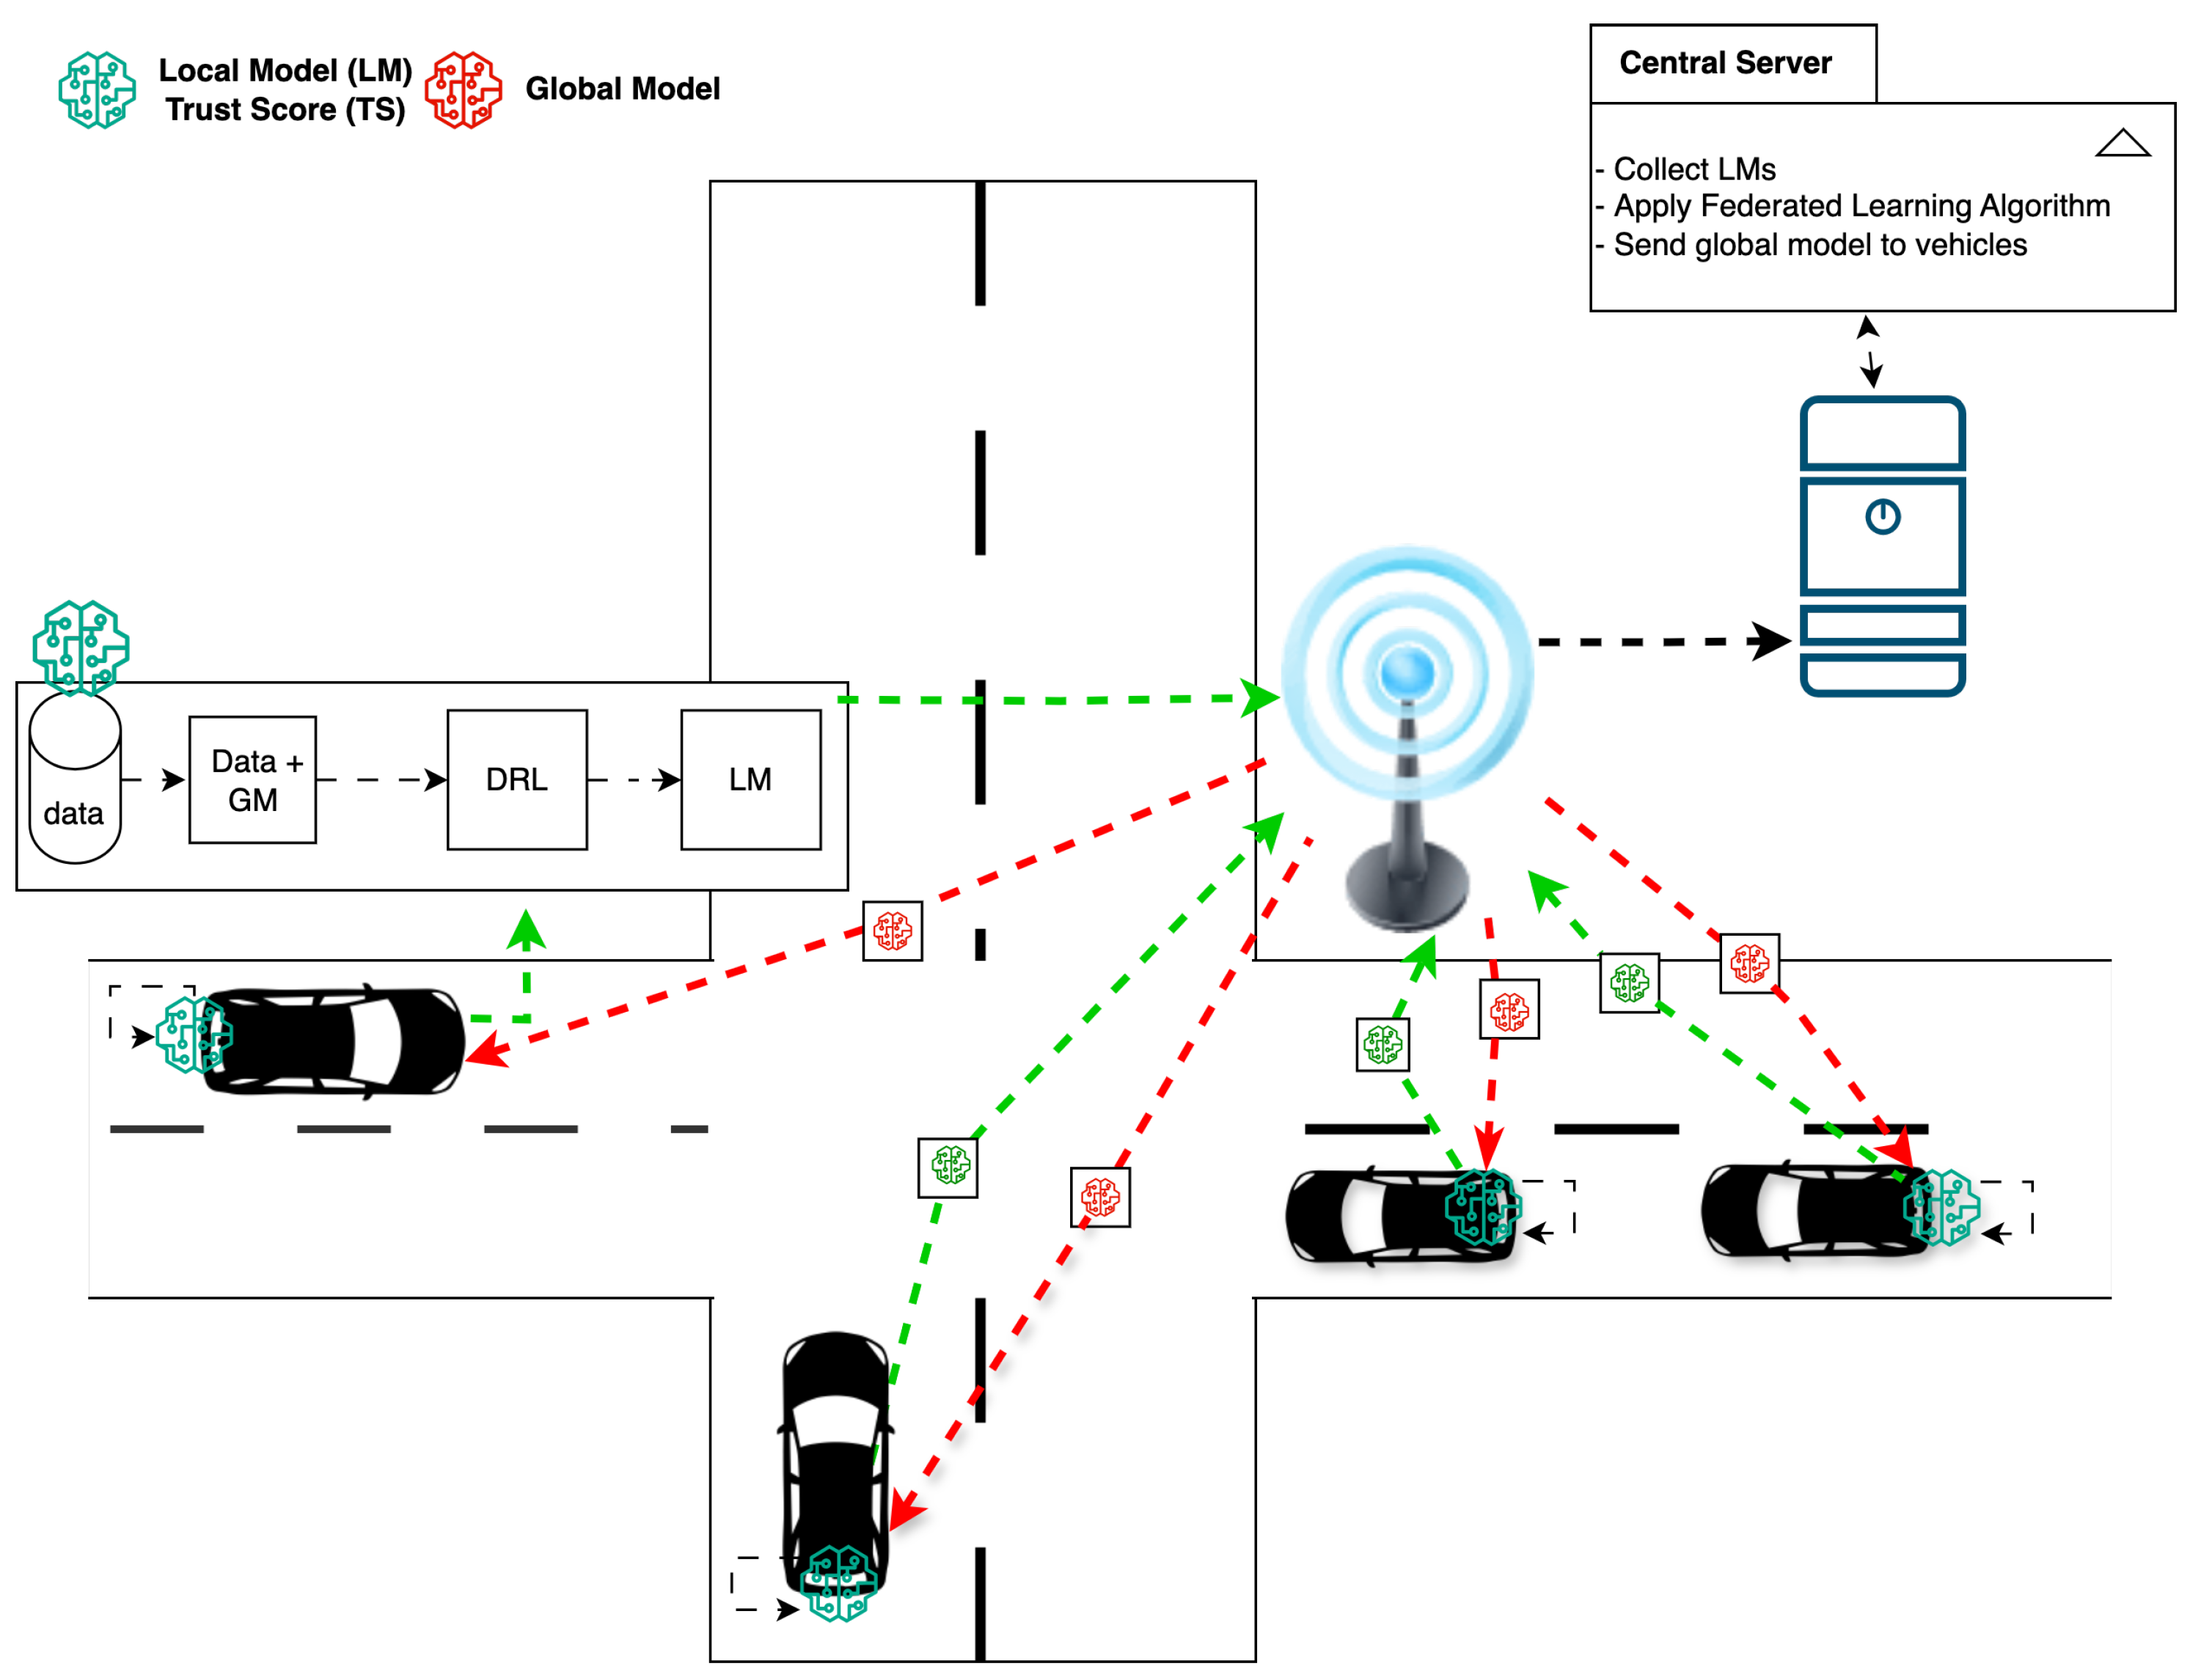
The architecture of the Fed-DTB is depicted in
Figure 2. Each vehicle gathers data from its sensors and trains an LM locally without disclosing raw data, thus preserving privacy. The trust management system for each vehicle calculates the overall trust score by evaluating various factors that capture the IoV’s complexity and dynamism. This overall trust score, along with LM, is transmitted to the central server. The central server aggregates all trust scores, selects the most trustworthy vehicles for federated learning, and then integrates their contributions into the GM. The optimised GM is then shared back with all vehicles for subsequent rounds of local training and trust assessment [
3]. This process allows the global model to adapt regularly to the evolving IoV scenario.
3.1. Trust Management System
The trust management system determines the trustworthiness of each vehicle by considering various parameters that represent its behaviour and performance within the IoV network. Rather than treating vehicles as static participants, the system adapts to continuously changing conditions in network reliability, vehicle states, and operational environments. Trust scores are computed locally for each vehicle using collected data and IDS alerts and are updated over time to adapt to dynamic changes in vehicle behaviour and the network environment [
19].
3.1.1. Trust Score Application
As introduced in
Section 2, each vehicle
calculates an overall trust score
at each time step
t. The trust score integrates seven carefully selected factors, each normalised to a value between 0 and 1, where 0 indicates completely untrustworthy behaviour and 1 represents fully trustworthy conduct.
Trust Factor Selection Rationale and Operational Feasibility
The selection of our seven-factor trust evaluation framework is systematically grounded in established IoV operational requirements, security standards, and practical deployment considerations. Each factor addresses specific challenges in vehicular federated learning while utilising data readily available through existing vehicular infrastructure:
IDS Alert Score (): Serves as the primary security indicator mandated by connected vehicle cybersecurity standards (ISO/SAE 21434) [
46]. Indicates whether IDS has detected suspicious or malicious activity from
. Available through onboard intrusion detection systems. IDS alerts are critical; if triggered, they can nullify the entire trust score, ensuring that vehicles suspected of malicious intent are excluded from FL participation.
Network Status Score (): Essential for V2X communication reliability, directly impacting the quality and timeliness of model parameter exchanges. Reflects the stability and reliability of the vehicle’s network connection, as IoV networks are susceptible to varying signal strengths, bandwidth limitations, and intermittent connectivity. Obtained via standard V2X communication modules (DSRC/C-V2X) already deployed in connected vehicles for safety applications.
Vehicle Status Score (): Determines the computational reliability and sustained participation capability. Evaluates the operational health of the vehicle’s components (e.g., engine, brakes, sensors), as a well-maintained and reliable vehicle is more likely to produce accurate and trustworthy data. Accessible through OBD-II diagnostic ports mandated in all vehicles manufactured after 1996.
Energy Efficiency Score (): Ensures sustainable long-term participation in resource-constrained vehicular environments. Measures how efficiently a vehicle manages its energy resources, as vehicles that risk running low on energy may fail to complete their local training or share timely updates, reducing their reliability. Provided by existing battery management systems and fuel monitoring systems accessible through CAN bus interfaces.
Compliance Score (): Addresses regulatory requirements and safety assurance, increasingly important for autonomous vehicle operations. Assesses traffic rules and regulations adherence, as non-compliant vehicles may engage in risky behaviours that contaminate data quality or introduce unusual patterns into the learning process. Compliance with traffic regulations is evaluated through onboard telemetry data sourced from vehicular control systems and GPS navigation systems already present in modern vehicles.
Federated Learning Participation Score (): Measures collaborative reliability and commitment to the federated learning process through historical participation patterns. Quantifies the vehicle’s contribution to the FL process, considering factors like the volume and quality of its local data and the magnitude of its model updates. More substantial and useful contributions raise a vehicle’s trustworthiness. Maintained by FL infrastructure logs as part of standard protocol operations.
User Feedback Score (): Captures real-world operational assessment and behavioural patterns from vehicle occupants. Incorporates community or user-based feedback regarding the vehicle’s reliability, performance, or user satisfaction levels, thereby adding a human-centric dimension to trust evaluation. Collected through standard vehicle human–machine interfaces (touchscreens, voice commands, mobile applications) commonly available in contemporary vehicles.
This comprehensive approach ensures that trust evaluation captures both technical performance and behavioural reliability across multiple operational dimensions while ensuring immediate deployability in existing connected vehicle fleets without requiring additional hardware investments or infrastructure modifications.
The trust score computation model described in
Section 2.3.1 (Equation (
1)) is applied here to evaluate and select trustworthy vehicles for participation in the federated learning process.
Detailed Factor Calculations
The trust score for each factor is computed using specific metrics that measure the vehicle’s performance in that factor. These factors include the IDS alert score
, network status score
, vehicle status score
, energy efficiency score
, compliance score
, federated learning participation score
, and user feedback score
[
19,
45]. In the following, we provide detailed explanations for calculating each factor score.
The IDS alert score indicates the level of trustworthiness of the vehicle based on the alerts provided by the IDS after analysing in-vehicle network traffic and identifying abnormalities and possible attacks. A high IDS alert score implies that the vehicle has not exhibited any malicious behaviour or been compromised.
indicates whether an alert of type k is generated for vehicle at time t.
is the weight of alert type k, reflecting its severity and importance.
is the number of alert types.
The IDS alert score is computed as
where
is a predefined IDS alert score threshold.
Unlike traditional binary IDS-based exclusion mechanisms, our IDS component provides a continuous probabilistic threat score. While Equation (
12) applies a threshold for exclusion in extreme cases, the underlying IDS analysis outputs a risk likelihood score, which can also be integrated into the trust computation as a continuous value. This supports more nuanced trust modulation and allows the trust framework to react proportionally to different classes and severities of detected anomalies.
Impact on Trust Score: If the vehicle triggers IDS alerts exceeding the threshold , it is treated as compromised and excluded by setting its trust score to zero. Otherwise, its contribution is weighted based on the trust score, which indirectly includes the probabilistic confidence output of the IDS.
The network status score, , quantifies the availability and stability of the network connections established by vehicle at time t. Reliable network connectivity is critical for ensuring timely communication and effective participation in the federated learning process.
Let
denote a set of normalised network status indicators, such as signal strength, connection stability, and bandwidth usage. Each indicator
is assigned a weight
, reflecting its relative importance. The network status score is computed as a weighted average:
Impact on Trust Score: A lower network status score indicates unreliable connectivity, leading to potential delays or failures in transmitting model updates. Such circumstances reduce the vehicle’s reliability in the federated learning process, resulting in a corresponding adjustment to its trust score. Conversely, vehicles with stable and strong network connections are more likely to be selected for participation due to their dependability.
The vehicle status score assesses vehicle ’s operational status and health at time t. Factors such as engine health and brake system functionality impact the safety and predictability of the vehicle.
Using normalised health indicators
(e.g., engine health status, brake system status, sensor functionality) and their weights
, the score is
Impact on Trust Score: A vehicle with poor operational status may behave unpredictably or be at higher risk of accidents, which can compromise data quality and reliability. Therefore, the trust score decreases with lower vehicle status scores, discouraging participation of vehicles that may not contribute reliable data.
The energy efficiency score quantifies the overall energy efficiency of vehicle at time t. Energy-efficient vehicles can handle computational tasks required for federated learning without consuming resources.
With normalised energy indicators
(e.g., battery level, energy consumption rate) and weights
, it is computed as
Impact on Trust Score: Vehicles with low energy efficiency may not sustain the computational and communication demands of federated learning, leading to incomplete model updates or communication failures. Consequently, their trust scores are reduced to reflect their limited capability, ensuring that only vehicles capable of contributing effectively are selected.
The compliance score measures how vehicle complies with traffic rules and regulations at time t. Compliance indicates responsible behaviour and reliability.
Using compliance ratios
(e.g., adherence to speed limits, stop sign compliance) and weights
:
Impact on Trust Score: Non-compliant vehicles may engage in risky behaviours, affecting the validity of the data they collect and potentially introducing bias or anomalies into the learning process. A lower compliance score reduces the trust score, discouraging the inclusion of such vehicles.
The participation score for federated learning evaluates the contribution of the vehicle to the federated learning process. It reflects both the quality and quantity of the vehicle’s data and model updates.
It is calculated as
where
is the local model update vector of vehicle .
is the size of the local dataset.
is the set of vehicles selected for federated learning at time t.
Impact on Trust Score: Vehicles that contribute more significantly to the model updates and have larger datasets are considered more valuable to the learning process. A higher participation score increases trust, incentivising vehicles to contribute effectively.
The user feedback score assesses feedback provided by users regarding vehicle . Positive feedback indicates satisfaction and reliability.
With normalised feedback indicators
(e.g., user ratings, satisfaction scores) and weights
:
Impact on Trust Score: Vehicles receiving positive user feedback are likely to be reliable and perform well, increasing their trust scores. Conversely, negative feedback reduces the trust score, reflecting potential issues in reliability or performance.
3.1.2. Trustworthiness Threshold
To determine whether a vehicle is considered trustworthy, a threshold is defined. If the overall trust score is greater than or equal to , the vehicle is deemed trustworthy; otherwise, it is considered untrustworthy.
If , the vehicle is trusted.
If , the vehicle is untrusted.
3.1.3. Algorithm for Trust Management
The algorithm 1 formalises the trust management process, describing the steps to calculate the trust scores for each vehicle over time.
| Algorithm 1 Trust Management System |
- Require:
Set of vehicles V, time period T, t time step, factor weights w, IDS alert threshold - Ensure:
Trust scores for all , - 1:
for each do - 2:
for each vehicle do - 3:
Collect data and IDS alerts from vehicle - 4:
Compute IDS alert score using Equations (11) and (12) - 5:
if then - 6:
Set - 7:
Continue to next vehicle - 8:
end if - 9:
Compute network status score using Equation ( 13) - 10:
Compute vehicle status score using Equation ( 14) - 11:
Compute energy efficiency score using Equation ( 15) - 12:
Compute compliance score using Equation ( 16) - 13:
Compute federated learning participation score using Equation ( 17) - 14:
Compute user feedback score using Equation ( 18) - 15:
Compute overall trust score using Equation ( 1) - 16:
if then - 17:
Vehicle is considered untrusted - 18:
else - 19:
Vehicle is considered trusted - 20:
end if - 21:
end for - 22:
end for - 23:
return Trust scores
|
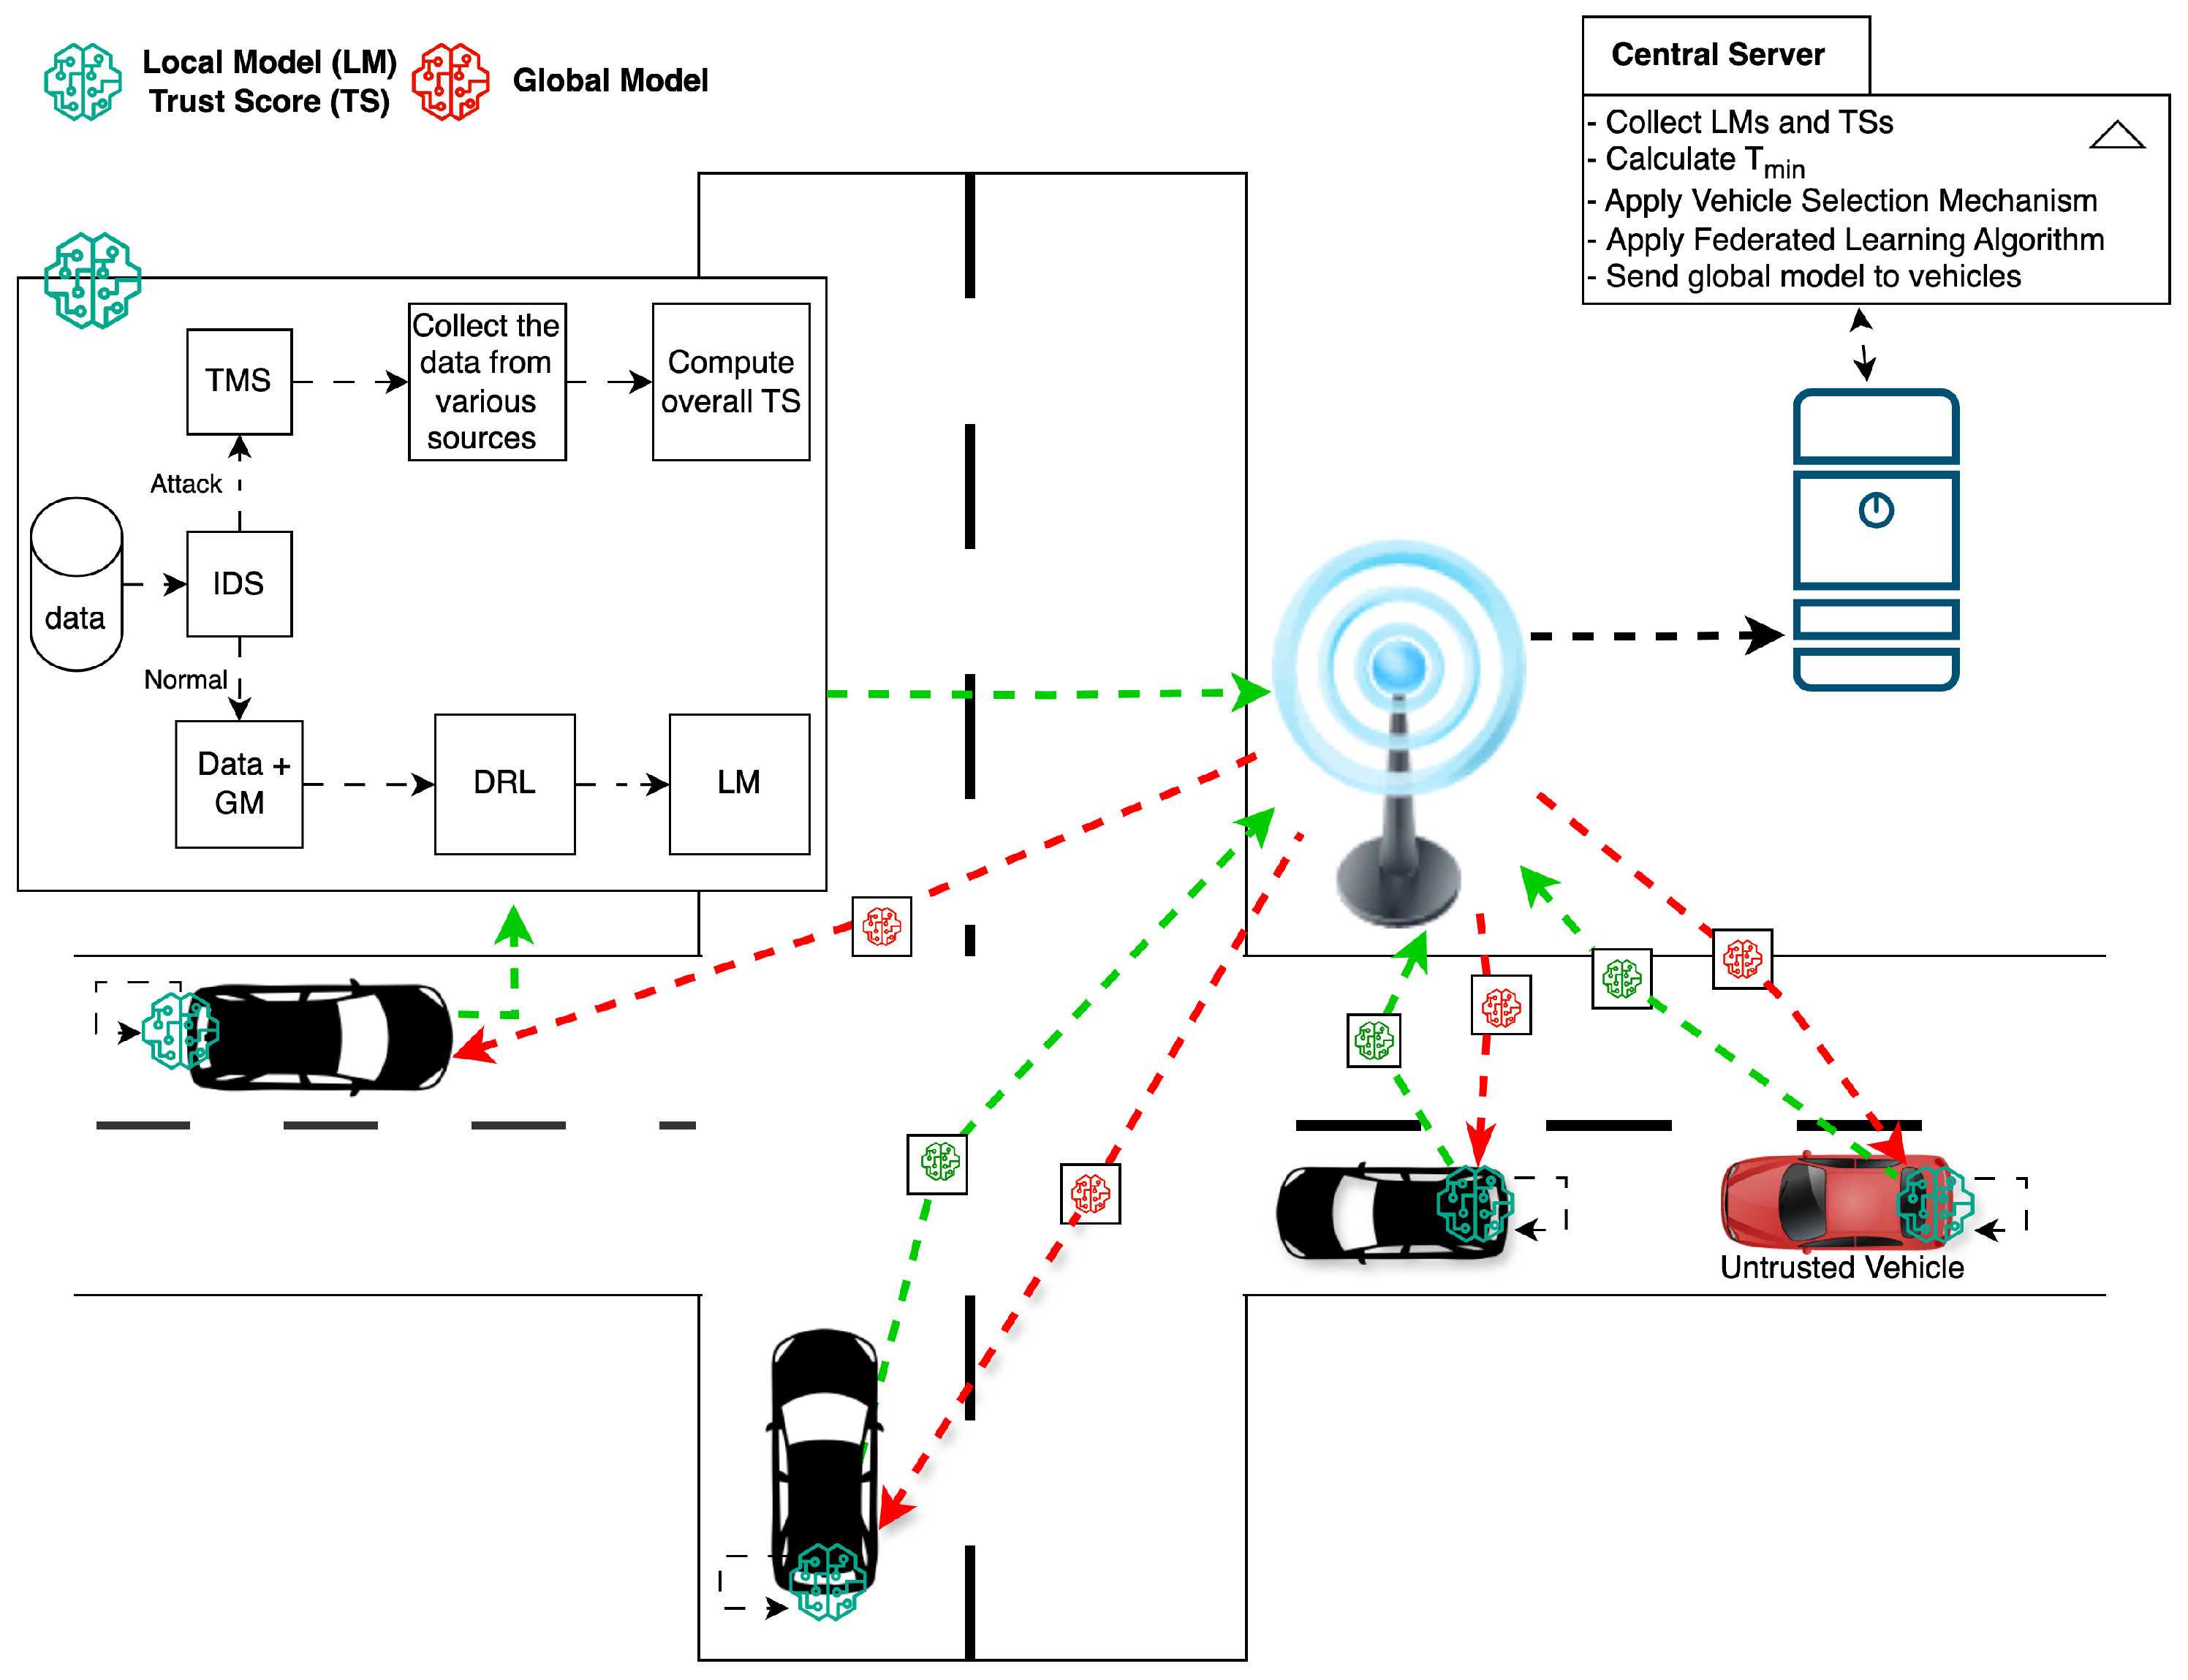
3.1.4. Trust Score Model Architecture
Figure 3 illustrates the architecture of the trust score model, showing how each factor contributes to the overall trust score.
In summary, the proposed mathematical trust score model provides a comprehensive and flexible framework for evaluating the trustworthiness of vehicles in IoV networks based on multiple criteria, as shown in Algorithm 1. By normalising scores between 0 and 1 and carefully selecting factor weights, the model can be tailored to specific application requirements, balancing security, performance, and user satisfaction.
3.2. Implementation of Vehicle Selection Mechanism
The vehicle selection mechanism, described in
Section 2.3.2, selects the most trustworthy vehicles using trust scores and IDS alerts to maximise the total trust score while excluding those with low scores or IDS alerts. This process solves the optimisation problem defined in Equation (
5), subject to the constraints in Equations (
6)–(
9). This optimisation problem is solved using a threshold approach, Equation (
10), as presented in Algorithm 2.
Formulating the selection as an optimisation problem ensures that the chosen subset of vehicles reflects the current environment, balancing factors such as network stability, energy efficiency, and compliance.
| Algorithm 2 Vehicle Selection Mechanism |
- Require:
Set of vehicles V, trust scores , IDS alert scores , maximum number of selected vehicles K, minimum trust score threshold - Ensure:
Set of selected vehicles - 1:
for each vehicle do - 2:
if then - 3:
Set - 4:
end if - 5:
end for - 6:
Sort vehicles in descending order of - 7:
Top K vehicles with - 8:
return
|
3.3. Federated Learning Algorithm
The federated learning algorithm enables selected vehicles to train a global model together without compromising their local data. It builds upon the FedAvg algorithm [
47] with security and efficiency improvements for IoV networks.
Algorithm 3 takes as input the set of selected vehicles
, the current global model
, the local datasets
, the trust scores
at the current time step
t, the learning rate
, the number of local training epochs
E, and the privacy parameters
and
. It ensures that each step is performed securely and efficiently, as described below:
| Algorithm 3 Federated Learning Algorithm |
- Require:
Selected vehicles , global model , local datasets , trust scores , learning rate , number of local epochs E, privacy parameters - Ensure:
Updated global model - 1:
for each vehicle do - 2:
Train local model - 3:
Compute local model update - 4:
Apply differential privacy - 5:
Send to the central server - 6:
end for - 7:
Server performs secure aggregation of differentially private updates - 8:
- 8:
return
|
Each selected vehicle uses its local data to train a local model , starting from the current global model . The training is performed for E epochs. The local model update is computed as the difference between the local model and the global model . To ensure privacy, differential privacy is applied to the local model update . This involves adding noise to the update using the privacy parameters and , resulting in . This step masks individual contributions and ensures that the model update does not reveal sensitive information about the local data.
The differentially private model updates from all selected vehicles and sends them to the central server. The server aggregates these updates securely to compute an overall model update. This step ensures that the individual updates remain private and are only combined in an aggregated form. The global model is updated by adding the weighted average of the differentially private model updates. The weights are the trust scores of the respective vehicles. This weighted update ensures that more trustworthy vehicles have a greater influence on the global model, improving its overall quality and robustness. The updated global model is returned as the final output of the algorithm.
This approach improves security and efficiency by incorporating trust scores in the global model update, adding differential privacy to local updates, and using secure aggregation to protect individual vehicles’ data privacy [
5]. It is important to note that privacy mechanisms (such as differential privacy) are applied exclusively to protect communication integrity and model confidentiality. They are not involved in the trust evaluation process. This modularity ensures that the trust computation remains unaffected by noise injection, maintaining the accuracy and interpretability of reliability assessments. The Fed-DTB offers a comprehensive solution for secure and efficient FL in IoV networks, capable of detecting and eliminating malicious or low-quality participants while allowing legitimate vehicles to contribute to the shared global model without compromising sensitive information.
4. Experimental Results and Analysis
The experimental evaluation of the proposed Fed-DTB framework aims to demonstrate its effectiveness in addressing the unique challenges of FL in IoV networks. We investigate the framework’s robustness, adaptability, and efficiency through extensive simulations under realistic and adversarial conditions. This section presents the experimental setup, dataset distribution, evaluation metrics, and analysis of the obtained results.
4.1. Experimental Setup
To evaluate the effectiveness and robustness of the proposed Fed-DTB framework, we implemented it in Google Colab, leveraging its cloud-based GPU resources to simulate a distributed IoV environment. The implementation utilised TensorFlow 2.7.0, along with the Keras API for model construction, to ensure efficient distributed training. A custom TensorFlow federated aggregator was used to represent the central server, while individual TensorFlow clients represented vehicles in the IoV environment. This setup closely mimics the dynamics of federated learning in vehicular networks.
Figure 4 illustrates the experimental setup, showing the data preparation phase, adversarial data injection into a subset of clients, and the federated learning process, including trust computation and model aggregation at the central server.
4.2. Dataset Distribution
Our experiments rely on three datasets to capture the heterogeneity, dimensionality, and adversarial conditions characteristic of real-world IoV systems: MNIST Dataset: A well-known benchmark in machine learning [
47] comprising 60,000 training images. We partitioned MNIST into clients using a non-IID scheme to reflect the uneven data distributions often encountered in IoV networks [
45]. To approximate a fleet-scale workload while respecting practical memory limits, the MNIST training set is first expanded by systematic replication in proportion to the number of simulated clients; with fifty clients, this yields roughly
images. In raw-pixel terms (≈
grayscale pixels), this is of the same computational order as the CIFAR-100 training set (50,000 colour images, ≈
RGB pixels). The resulting memory footprint proved tractable on the desktop simulation workstation used in this study (single 8 GB GPU) and would also fall within the 2 GB VRAM envelope typical of an in-vehicle ECU. The enlarged MNIST set is then partitioned with a Dirichlet allocation (concentration 0.4), producing intentionally unbalanced label mixes that mirror the skew observed in operational IoV fleets. This procedure supplies both volume and heterogeneity without additional data collection overhead. CIFAR-10 Dataset: This dataset introduces additional complexity and higher-dimensional images, simulating scenarios where vehicles collect more diverse visual data [
48].
Synthetic IoV Dataset: Inspired by empirical observations and prior vehicular studies [
49,
50,
51,
52], we generated this dataset to mimic factors unique to connected vehicles, including signal strength, connection stability, vehicle health, and user feedback metrics. The generation process follows statistical models consistent with wireless communication theory, where the signal strength degrades with distance; mechanical engineering principles, as the engine health deteriorates over time; and trust scores that evolve based on operational conditions and user experience rooted in human–computer interaction and adaptive systems theory.
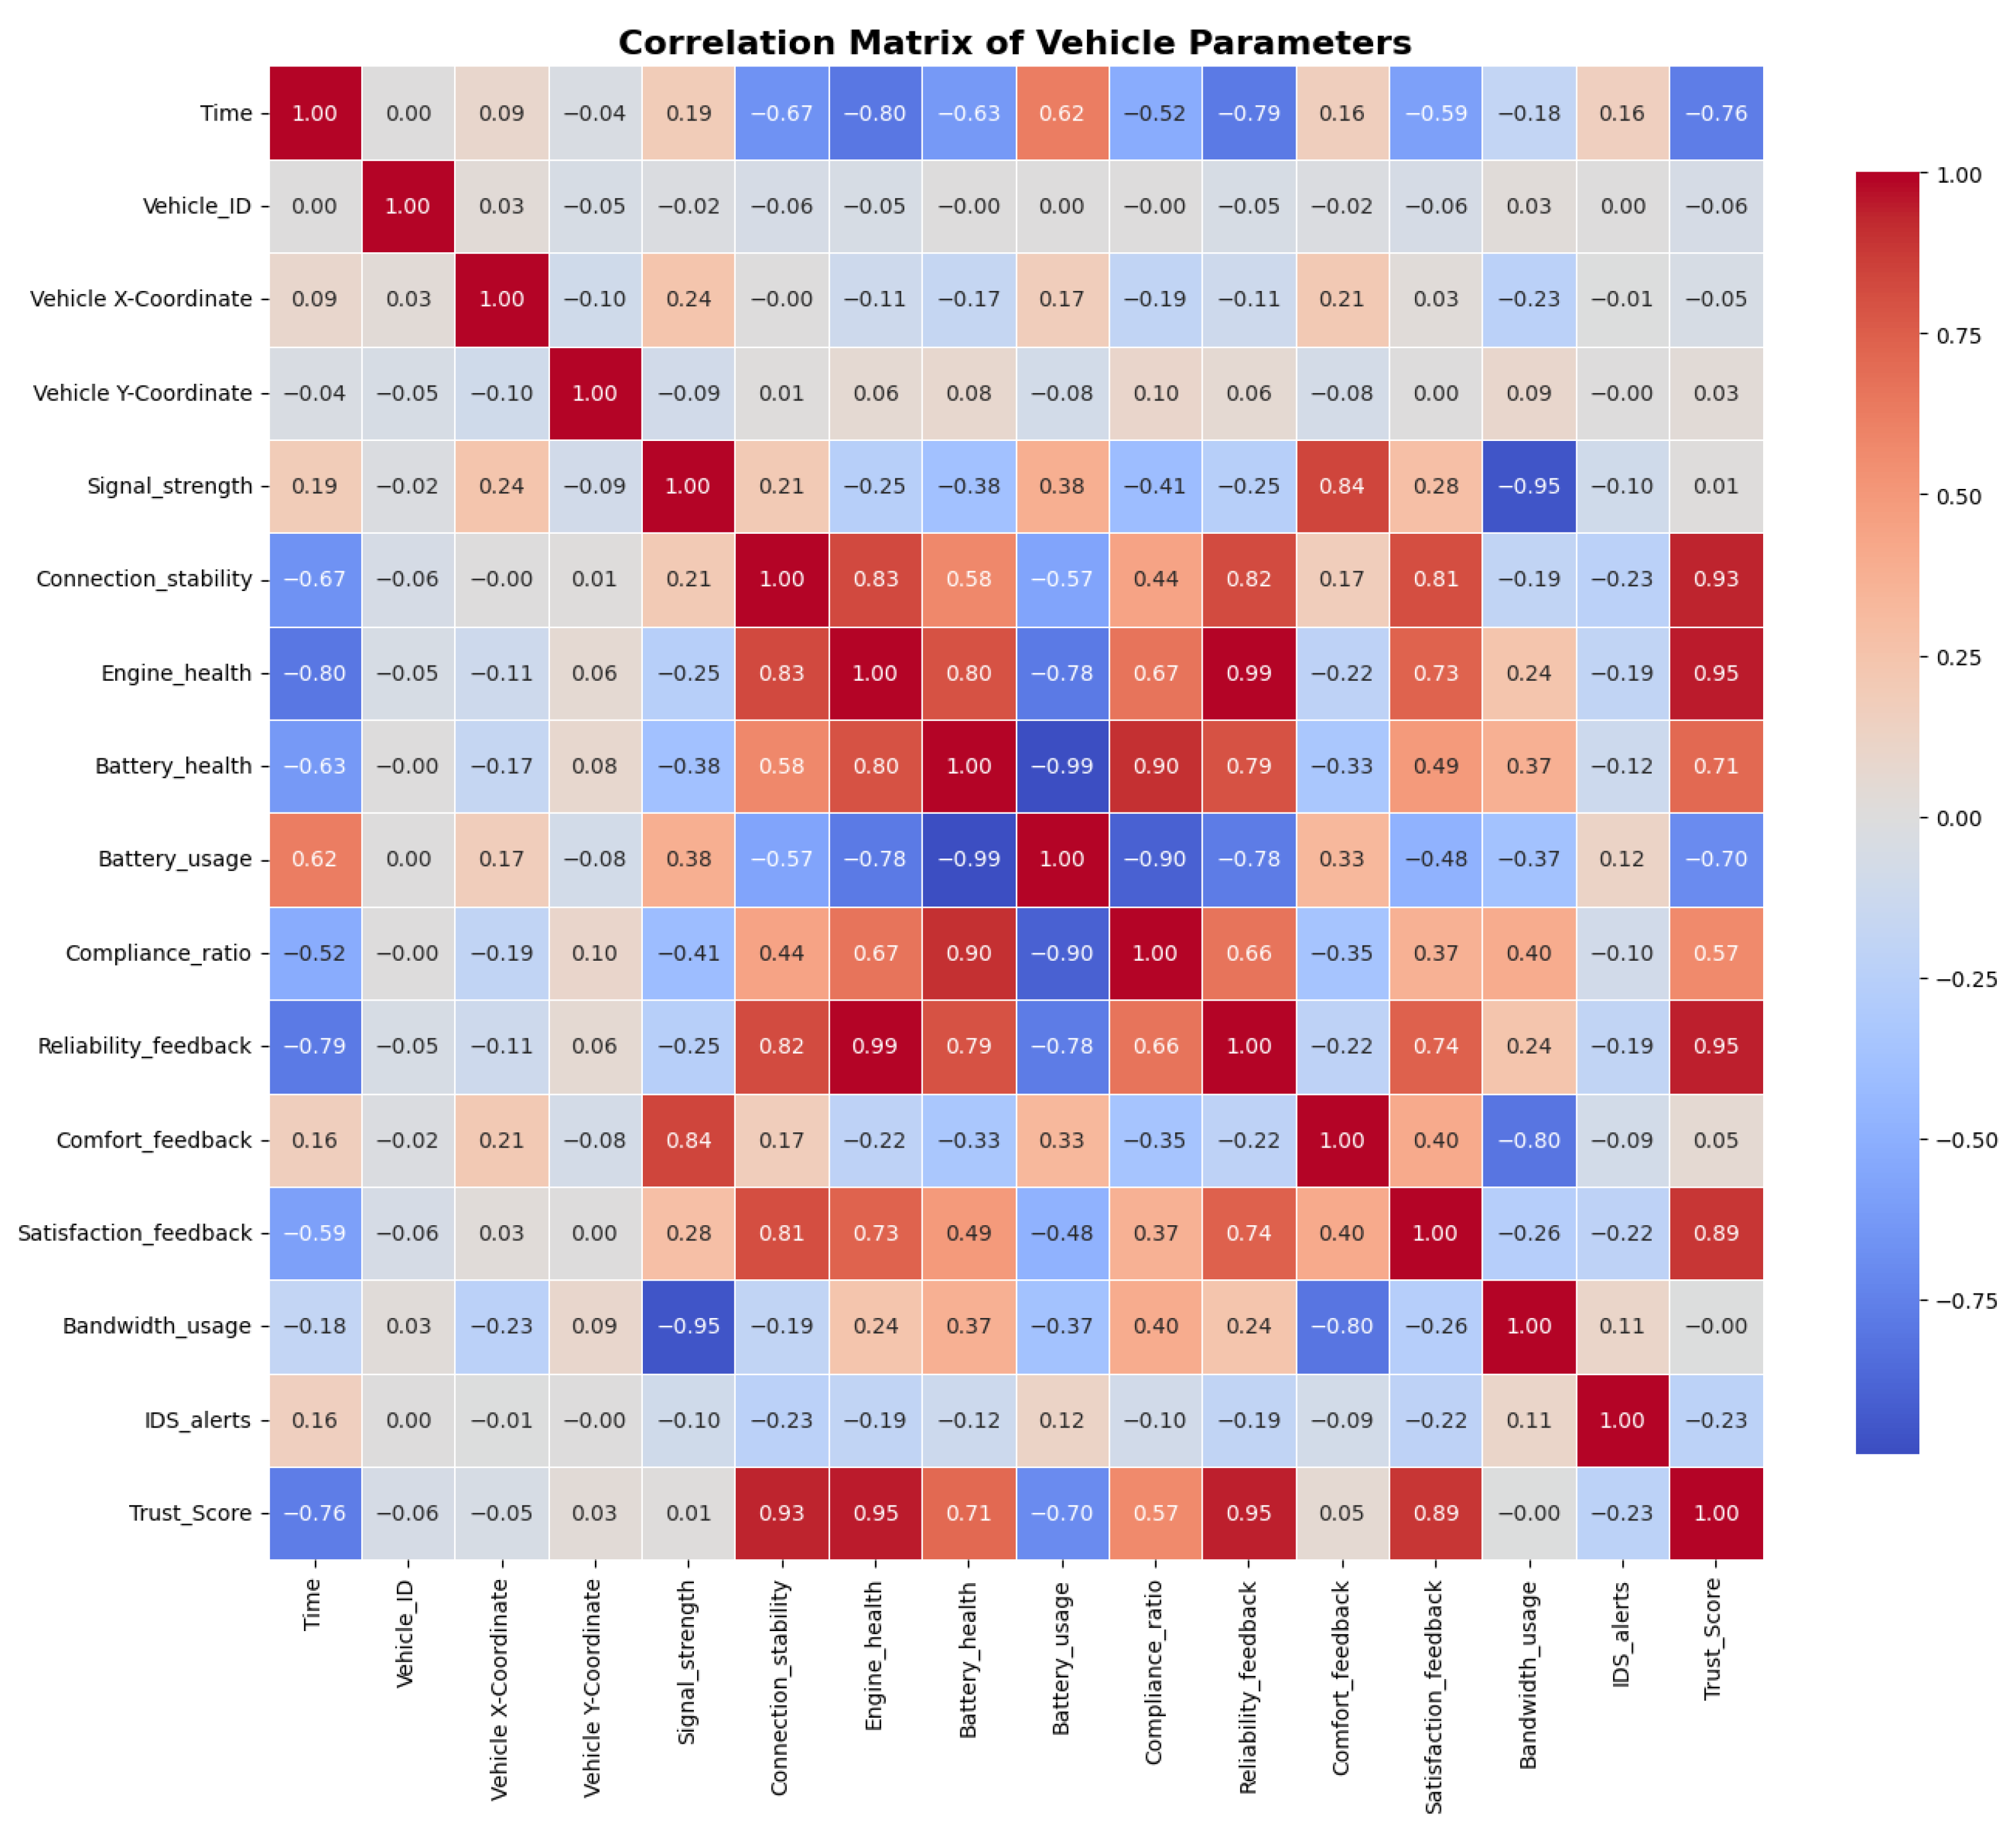
We performed a correlation analysis between key parameters to validate the realism and relevance of the dataset. The results, shown in
Figure 5, confirm that the relationships among metrics such as connection stability, engine health, and trust score align with the expected behaviour of real-world IoV systems. Specifically, connection stability correlates with geographic proximity and traffic density, engine health impacts computational reliability for FL participation, and trust scores reflect historical performance consistency. These patterns align with studies of the established vehicular network [
49,
50,
51,
52]. For instance, higher connection stability strongly correlates with trust scores (
Figure 6), reflecting the system’s robustness under reliable communication conditions. Similarly, satisfaction feedback is closely tied to trust scores, as
Figure 7 shows the importance of user-centric parameters in evaluating vehicular reliability.
By injecting controlled anomalies (e.g., increased bandwidth usage, sporadic IDS alerts), the dataset provides a systematic and controlled foundation to mirror realistic adversarial scenarios frequently reported in IoV research. For example, urban-route simulations produce more interference, while rural conditions produce stronger average signal strength, as the correlation matrix supports. This approach enables a detailed and structured exploration of relationships and behaviours that might be difficult to isolate in real-world conditions.
While these validations confirm the dataset’s reliability and relevance for benchmarking federated learning models, it is important to acknowledge the inherent limitations of synthetic datasets. Despite being designed to reflect typical IoV environments, synthetic data may not fully capture the variability and complexity of real-world conditions. Future work will focus on validating the proposed solution using field-collected data, further demonstrating its robustness and applicability in diverse and dynamic environments.
We have established a heterogeneous federated environment by combining MNIST, CIFAR-10, and the synthetic IoV dataset. This diversity of data types and adversarial scenarios highlights Fed-DTB’s resilience and ability to maintain robust performance and secure collaboration under realistic IoV conditions.
4.3. Adversarial Data Injection and IDS Performance
To simulate adversarial behaviour, we injected false data into 20% of the clients following the approach of Sun et al. [
53]. The data injection function, implemented in Python version 3.9.19, added Gaussian noise (
) to 20% of these clients’ data and randomised their labels to simulate label-flipping attacks.
Figure 8 illustrates the impact of adversarial data injection on the MNIST dataset, highlighting the differences between normal data and adversarially altered data. The IDS was pre-trained on a mix of normal MNIST data and poisoned anomalies, achieving a validation accuracy of 99.86%. These results highlight the IDS’s capability to detect subtle adversarial manipulations, even in scenarios with varying degrees of data injection. The IDS plays a critical role in maintaining the integrity of the federated learning process by identifying anomalous clients.
4.4. Evaluation Metrics
To evaluate the performance of the Fed-DTB framework, we utilised several key metrics to assess model accuracy, robustness, efficiency, and adaptability. Accuracy reflects the proportion of correctly classified instances, providing an overall performance measure. Precision, recall, and F1 Score capture the model’s ability to accurately classify positive instances and balance false positives and negatives. ROC-AUC evaluates the system’s capability to distinguish between positive and negative classes. Loss measures the error during optimisation, with lower values indicating better model performance. Timing metrics were employed to measure computational efficiency, including the time required for local training, communication between clients and the central server, and trust management operations. Trust scores were tracked across rounds to monitor the framework’s ability to adapt to client behaviour dynamically and maintain reliability. Client exclusion metrics quantified the number of excluded clients in each round, highlighting the system’s robustness against adversarial behaviours and its capacity to preserve overall performance despite the presence of untrustworthy participants. Finally, we confirmed that the framework is not overly sensitive to the local-epoch count E; varying E between 1, 3, and 5 changed final accuracy by less than 0.8 percentage points and altered convergence by no more than two global rounds.
4.5. Results Analysis
In this section, we present the experimental results to evaluate the performance of the proposed Fed-DTB framework under various configurations and scenarios. The performance is analysed using key metrics. Furthermore, a comparative analysis is conducted to position the proposed framework against existing solutions in the literature, highlighting its strengths and areas for improvement.
4.5.1. Fed-DTB Performance Under Low-Complexity Conditions
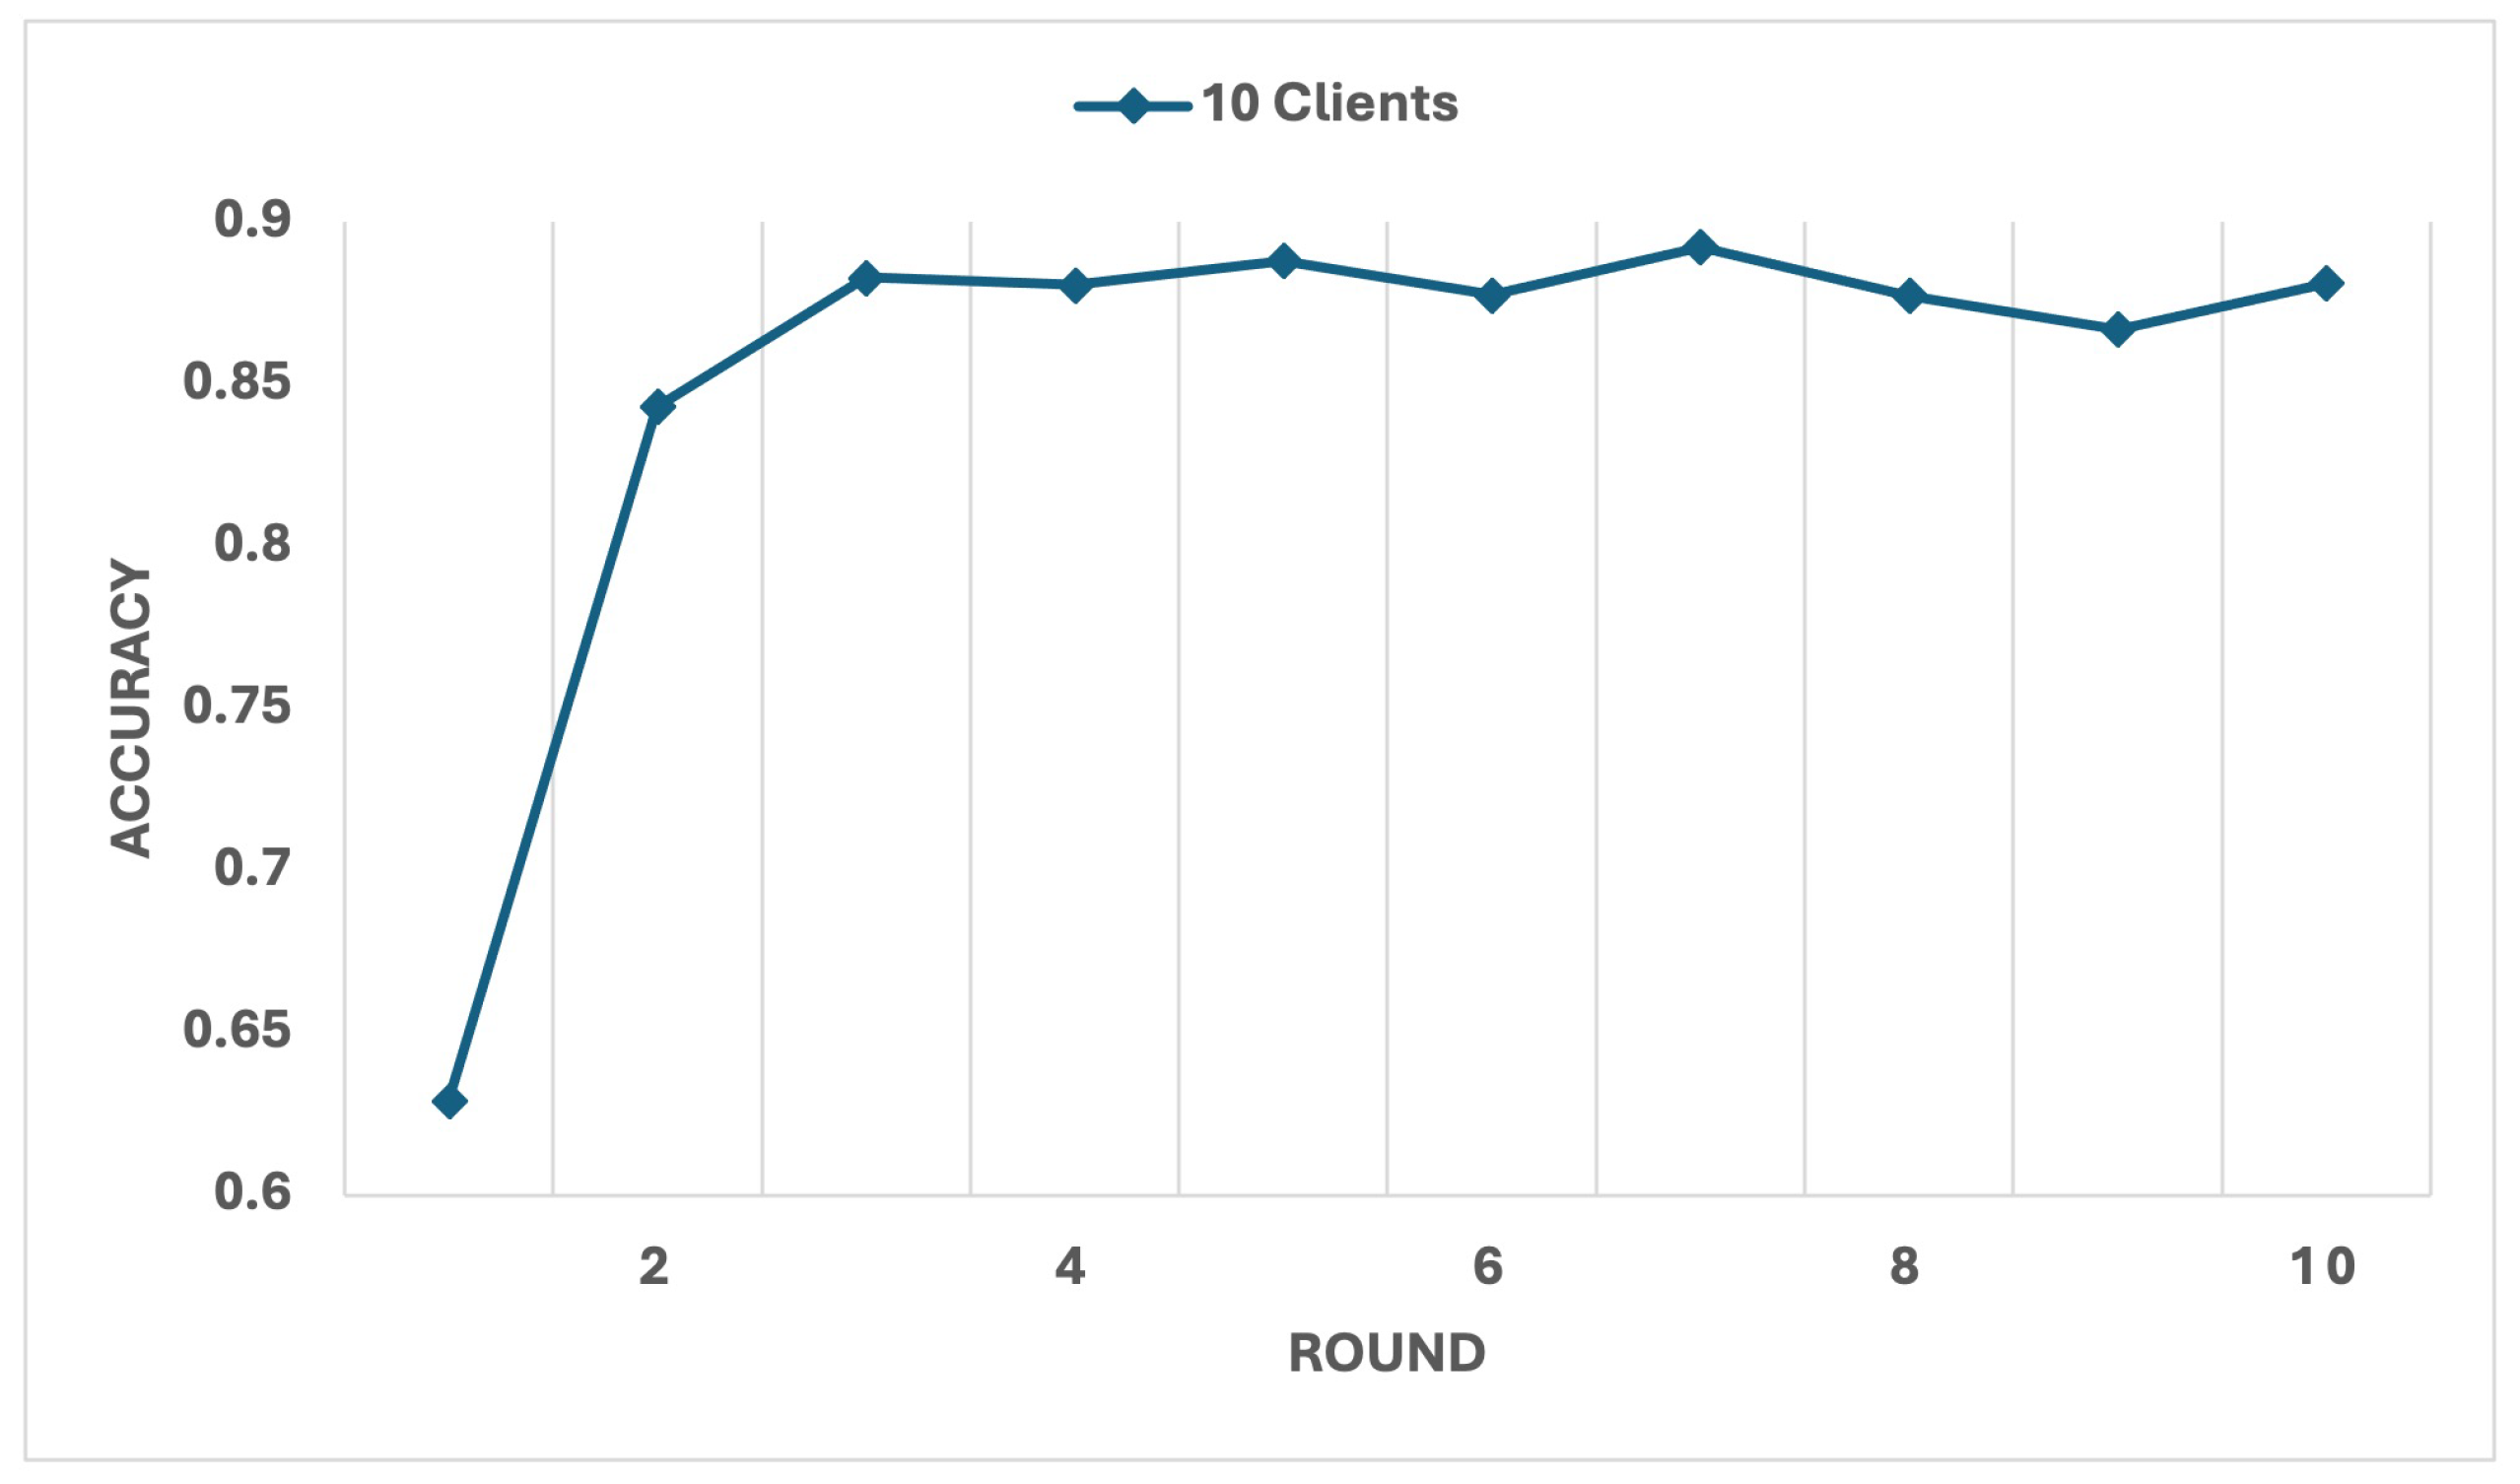
The results for the configuration with 10 clients provide an in-depth analysis of the system’s performance under low-complexity conditions. This setup was essential to evaluate the framework’s ability to detect and exclude untrustworthy clients while maintaining robust performance.
Figure 9 and
Figure 10 illustrate the evolution of accuracy and loss over 10 rounds. Initially, the accuracy was moderate at 62.91%, affected by the presence of malicious clients, while the loss was high at 1.8026. Over successive rounds, as malicious and low performance clients were identified and excluded, accuracy steadily improved, stabilising at 88.09% by round 7, while loss decreased sharply to 0.7225. These results highlight the system’s rapid convergence and effectiveness in enhancing its performance through iterative rounds.
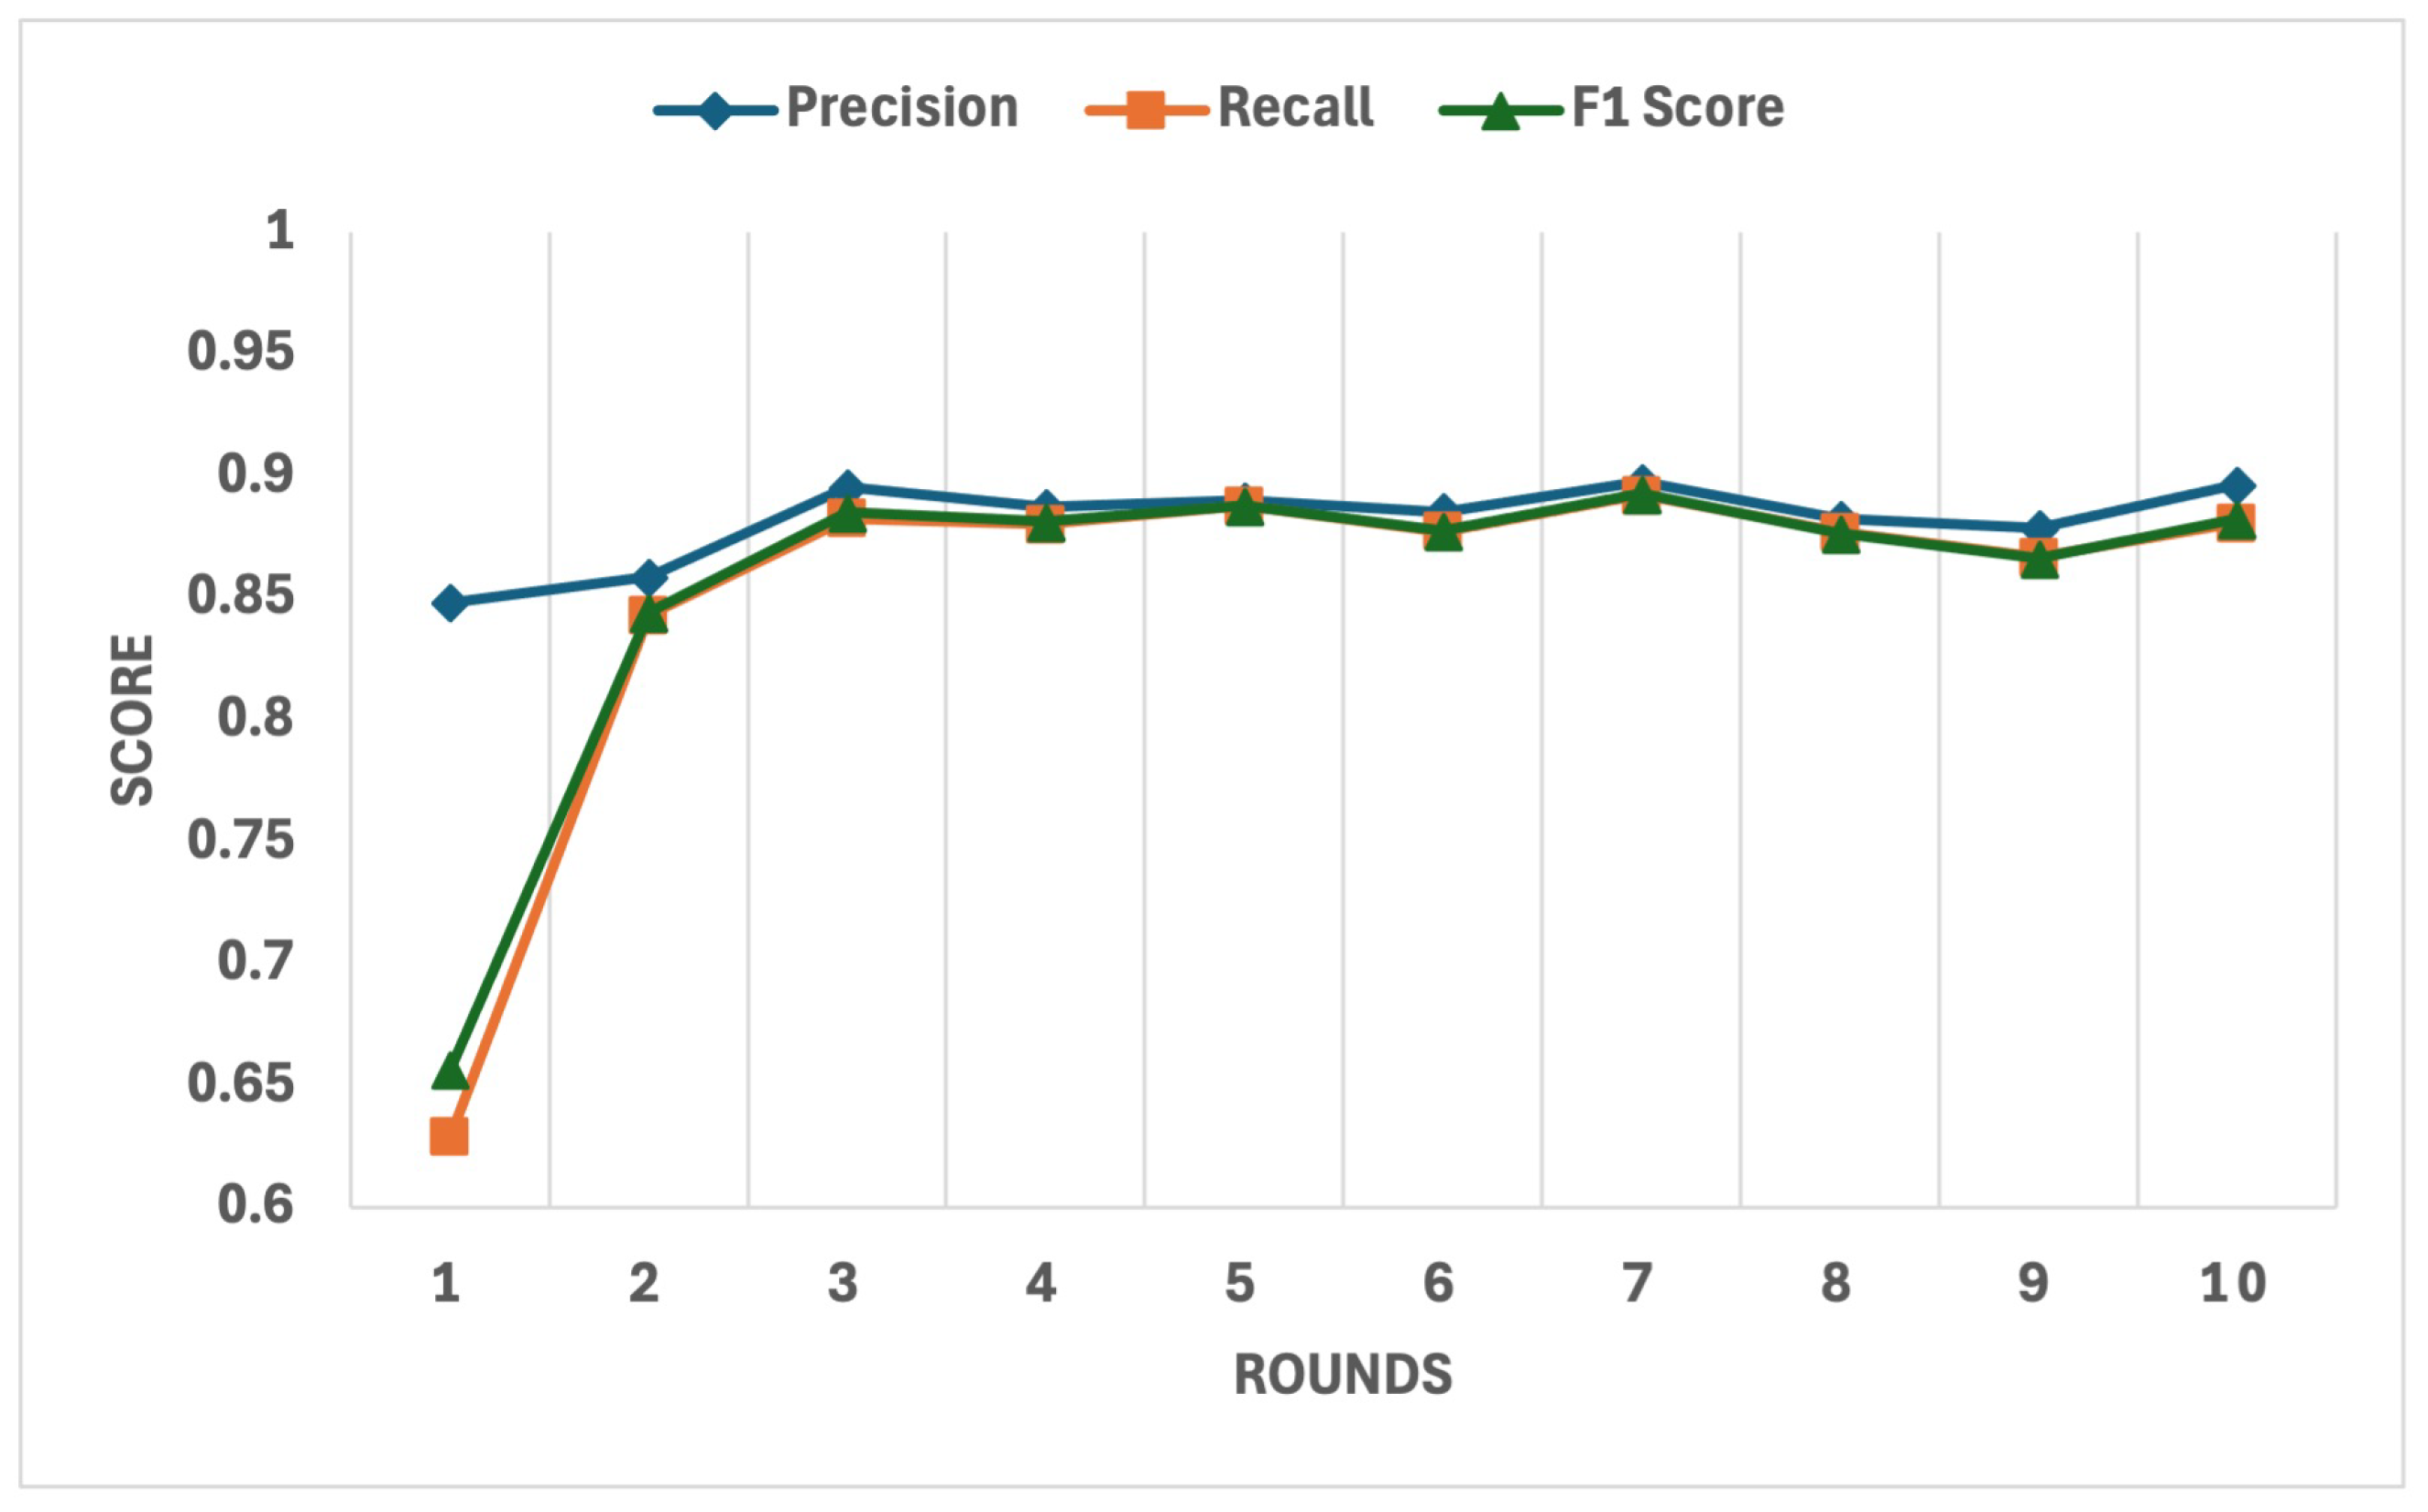
The detailed behaviour of key performance metrics, including precision, recall, and F1 Score, is depicted in
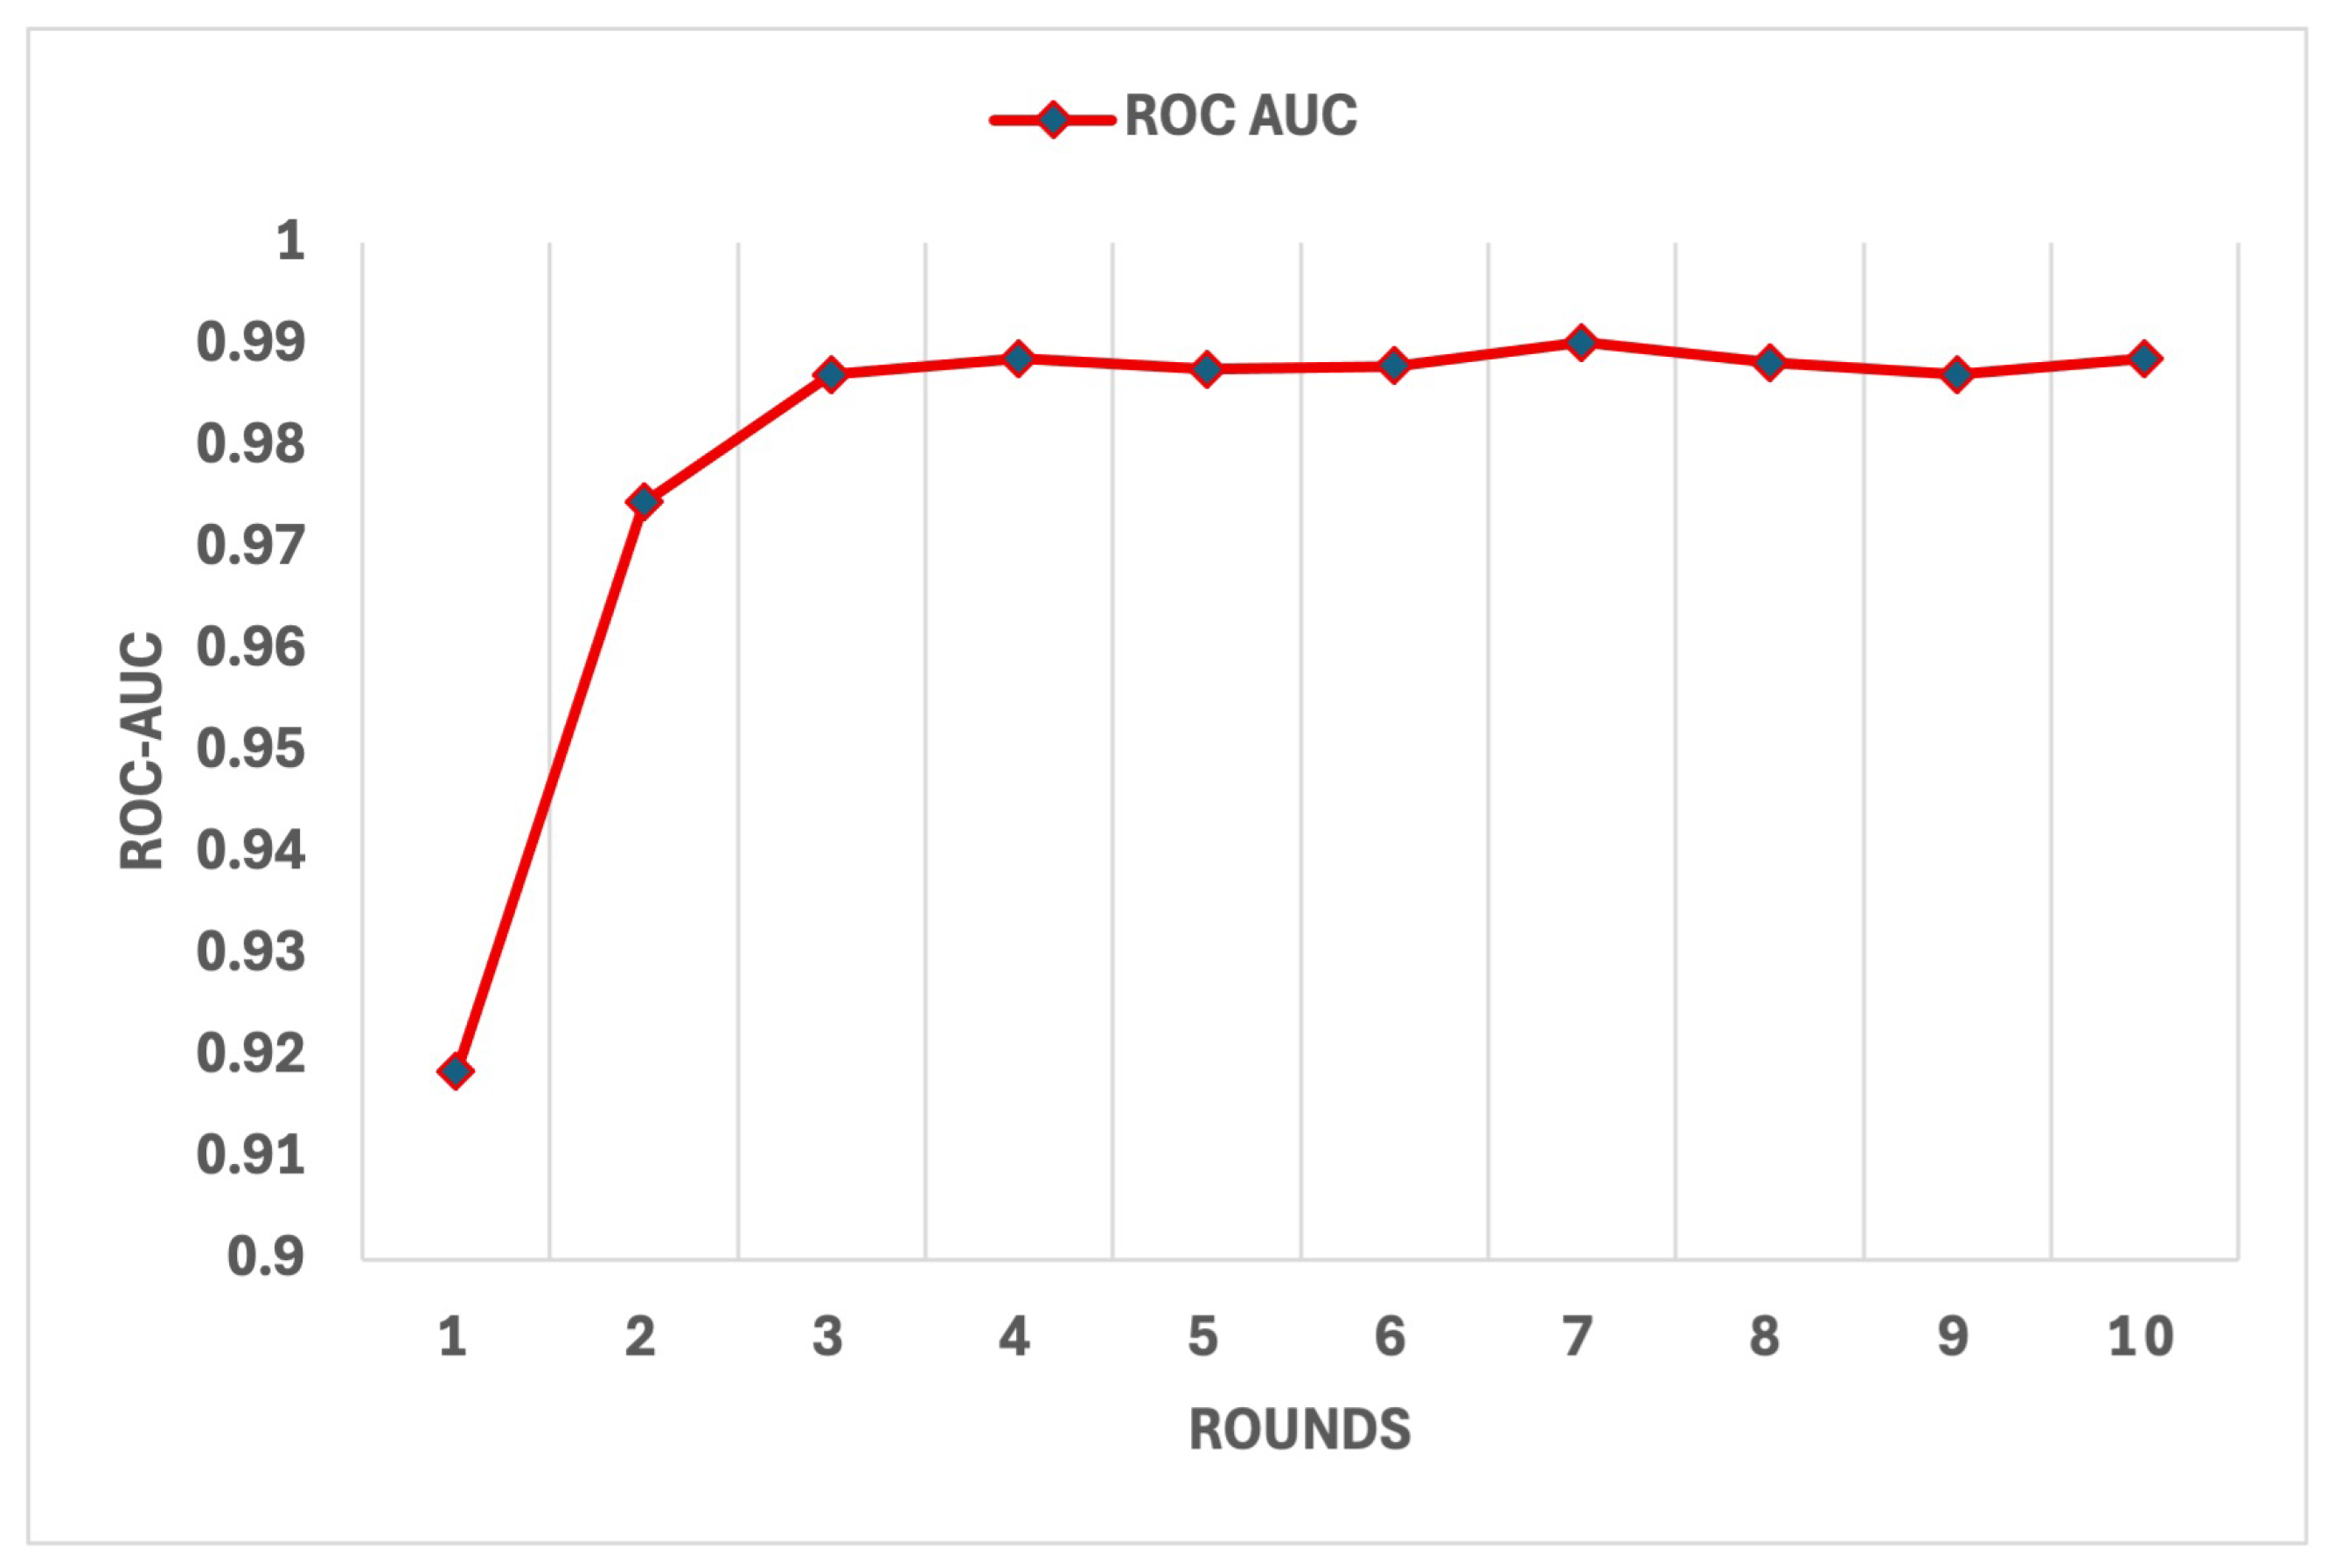
Figure 11. These metrics demonstrated significant improvement after the exclusion of low-trust clients in the early rounds. By round 10, the precision reached 89.65%, recall stabilised at 88.09%, and the F1 Score achieved 88.24%, indicating the system’s ability to strike a balance between false positives and false negatives. Furthermore, the ROC-AUC metric, shown in
Figure 12, exhibited consistently high values, culminating at 0.9886 in the final round, reflecting the model’s exceptional discriminatory ability between benign and malicious data sources.
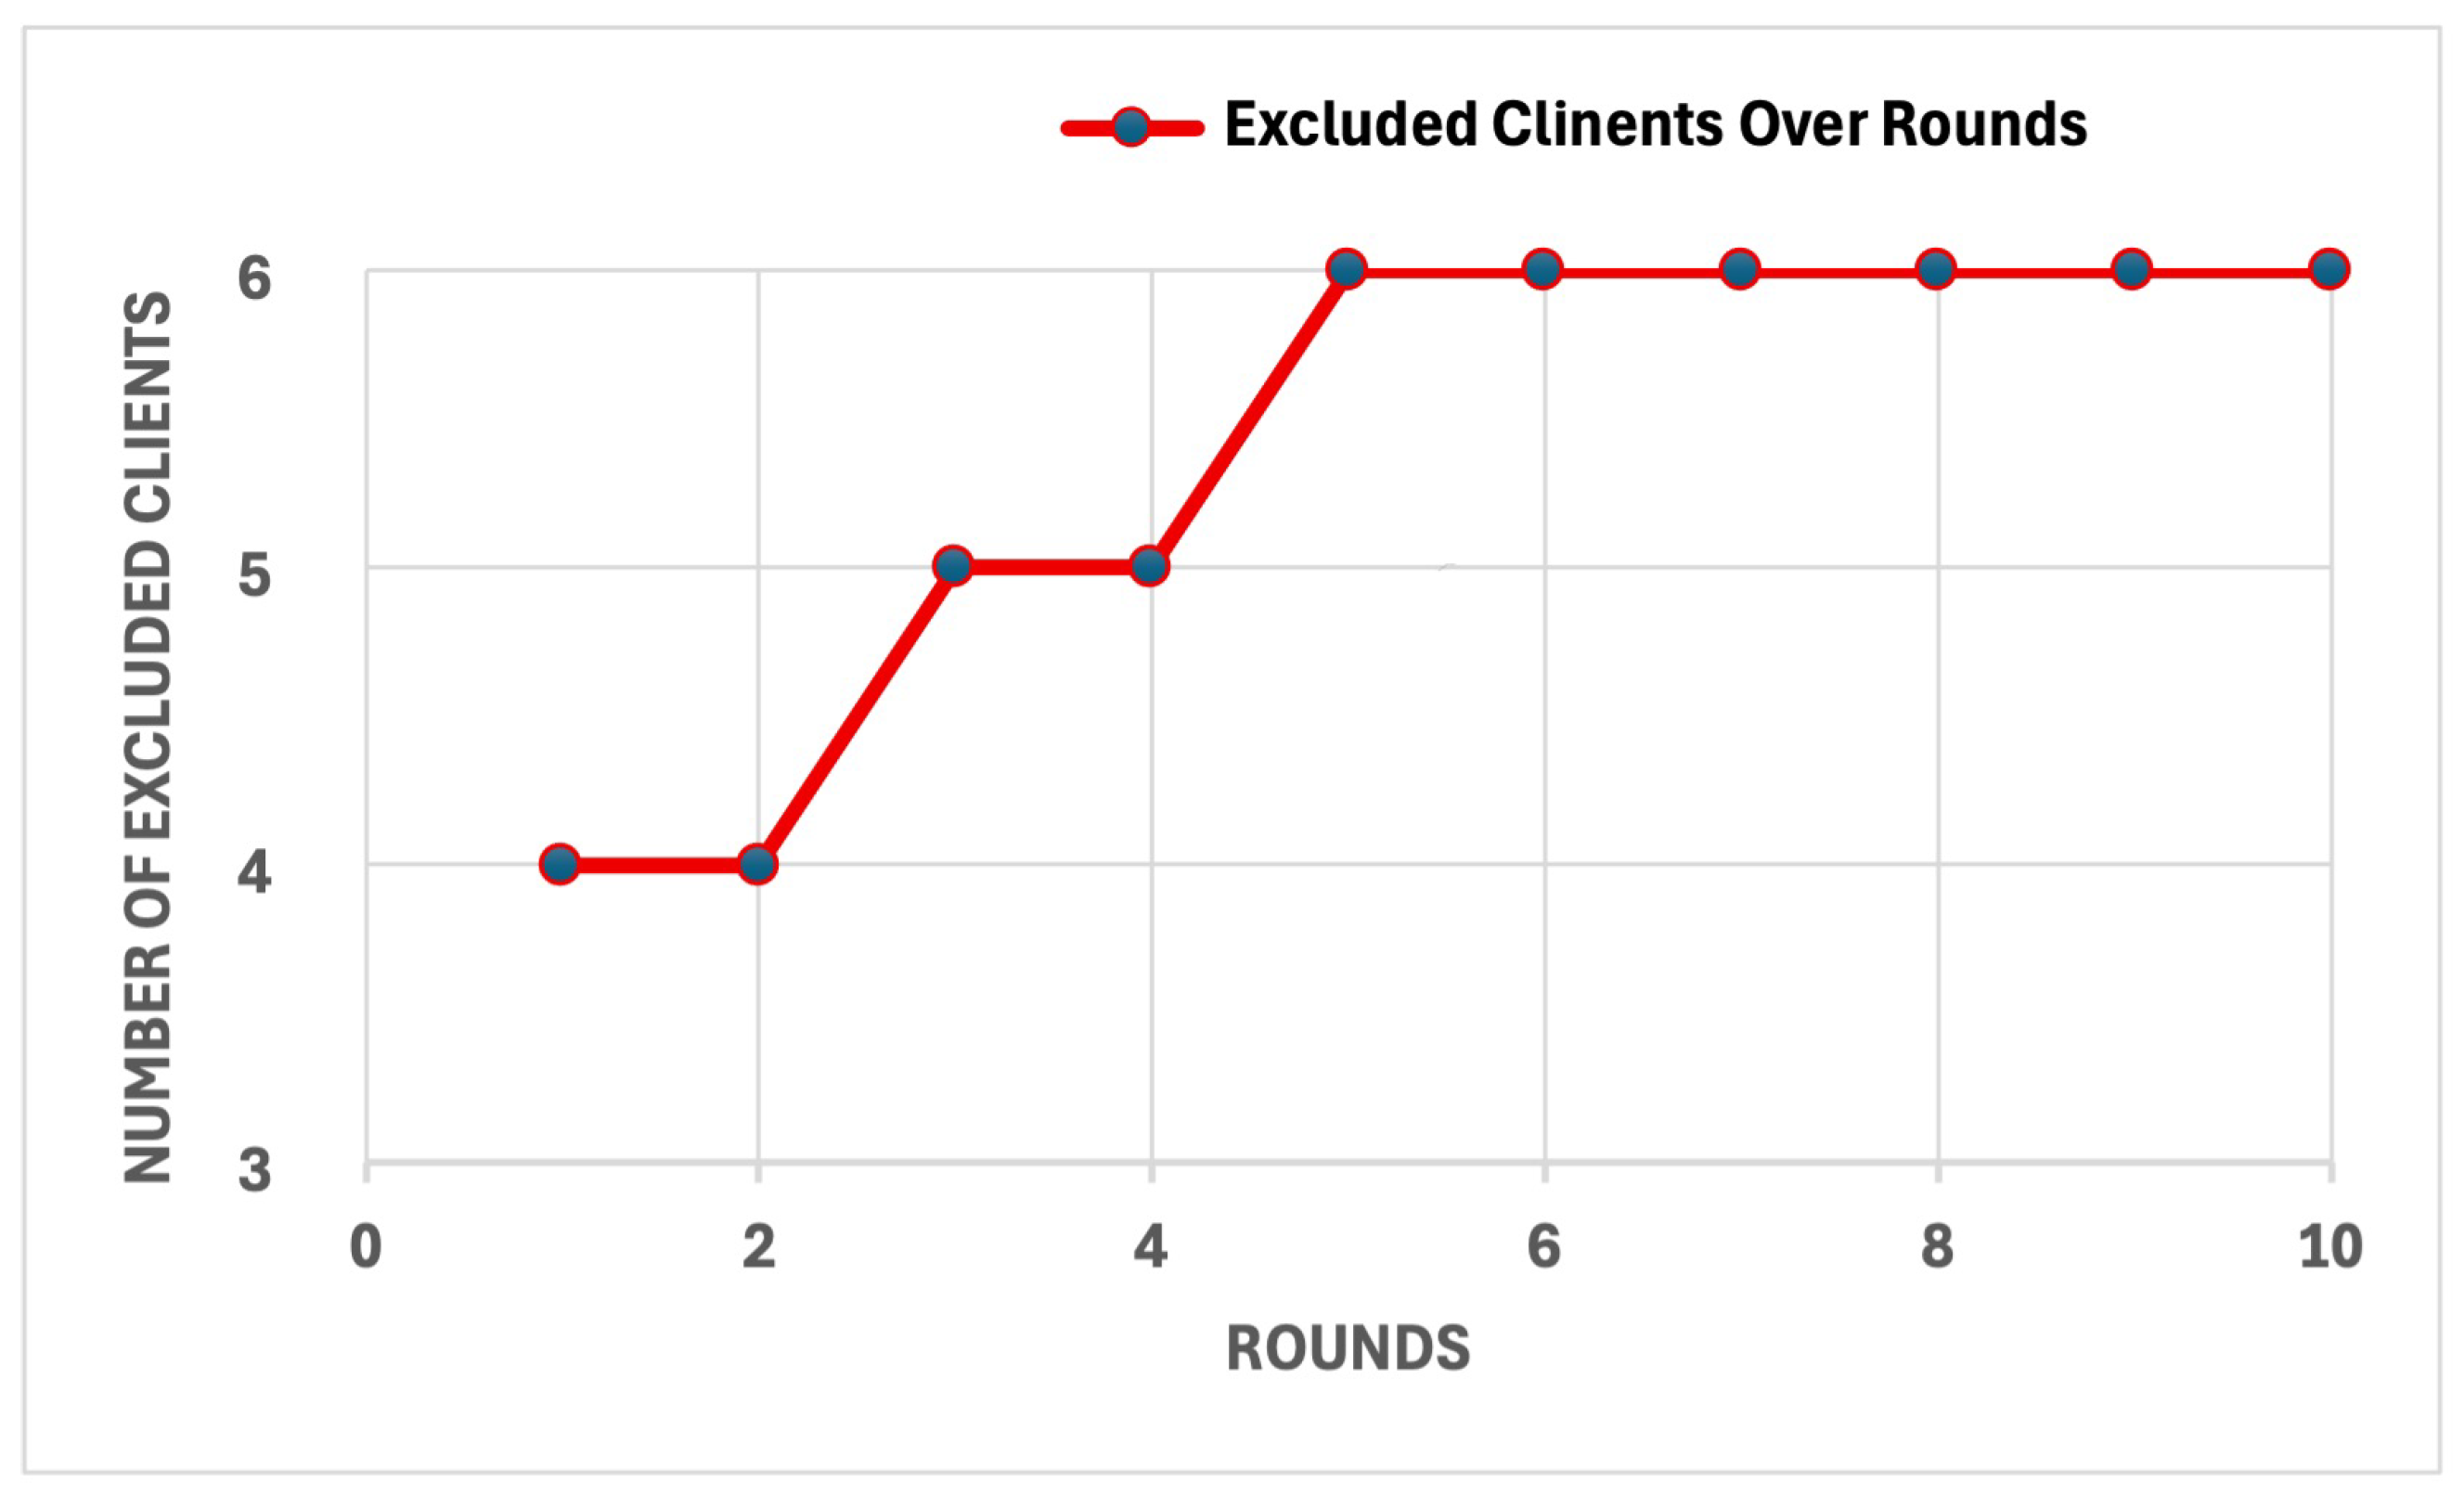
The effectiveness of the trust mechanism in identifying and excluding untrustworthy clients is demonstrated in
Figure 13. Four malicious clients were excluded by round 2 due to their misleading information, while two low-performance clients were excluded in rounds 3 and 5, leading to a marked improvement in the trustworthiness of the remaining clients. This exclusion process directly contributed to the observed enhancements in model performance. The corresponding computational efficiency is demonstrated in
Figure 14, where the training time decreased from 32.1 s in the first round to 3.2 s in the final round, reflecting the reduced computational overhead as untrustworthy clients were excluded and the data quality improved.
Finally, the performance metrics for each round are summarised in
Table 1. This table provides a detailed breakdown of metrics such as accuracy, loss, F1 Score, the number of excluded clients, and total round time, showing the stabilisation of the system’s performance after round 7. These results confirm the system’s capability to deliver robust and efficient performance in a low-complexity setup with 10 clients.
4.5.2. Fed-DTB Performance Under High-Complexity Conditions
The results from configurations with 25, 50, and 100 clients clearly analyse the system’s performance under high-complexity conditions. The 25-client setup tested scalability with moderate complexity, while the 50-client configuration introduced higher demands and risks from malicious clients. The 100-client evaluation further assessed performance in a large-scale, heterogeneous environment, demonstrating the system’s robustness and effectiveness.
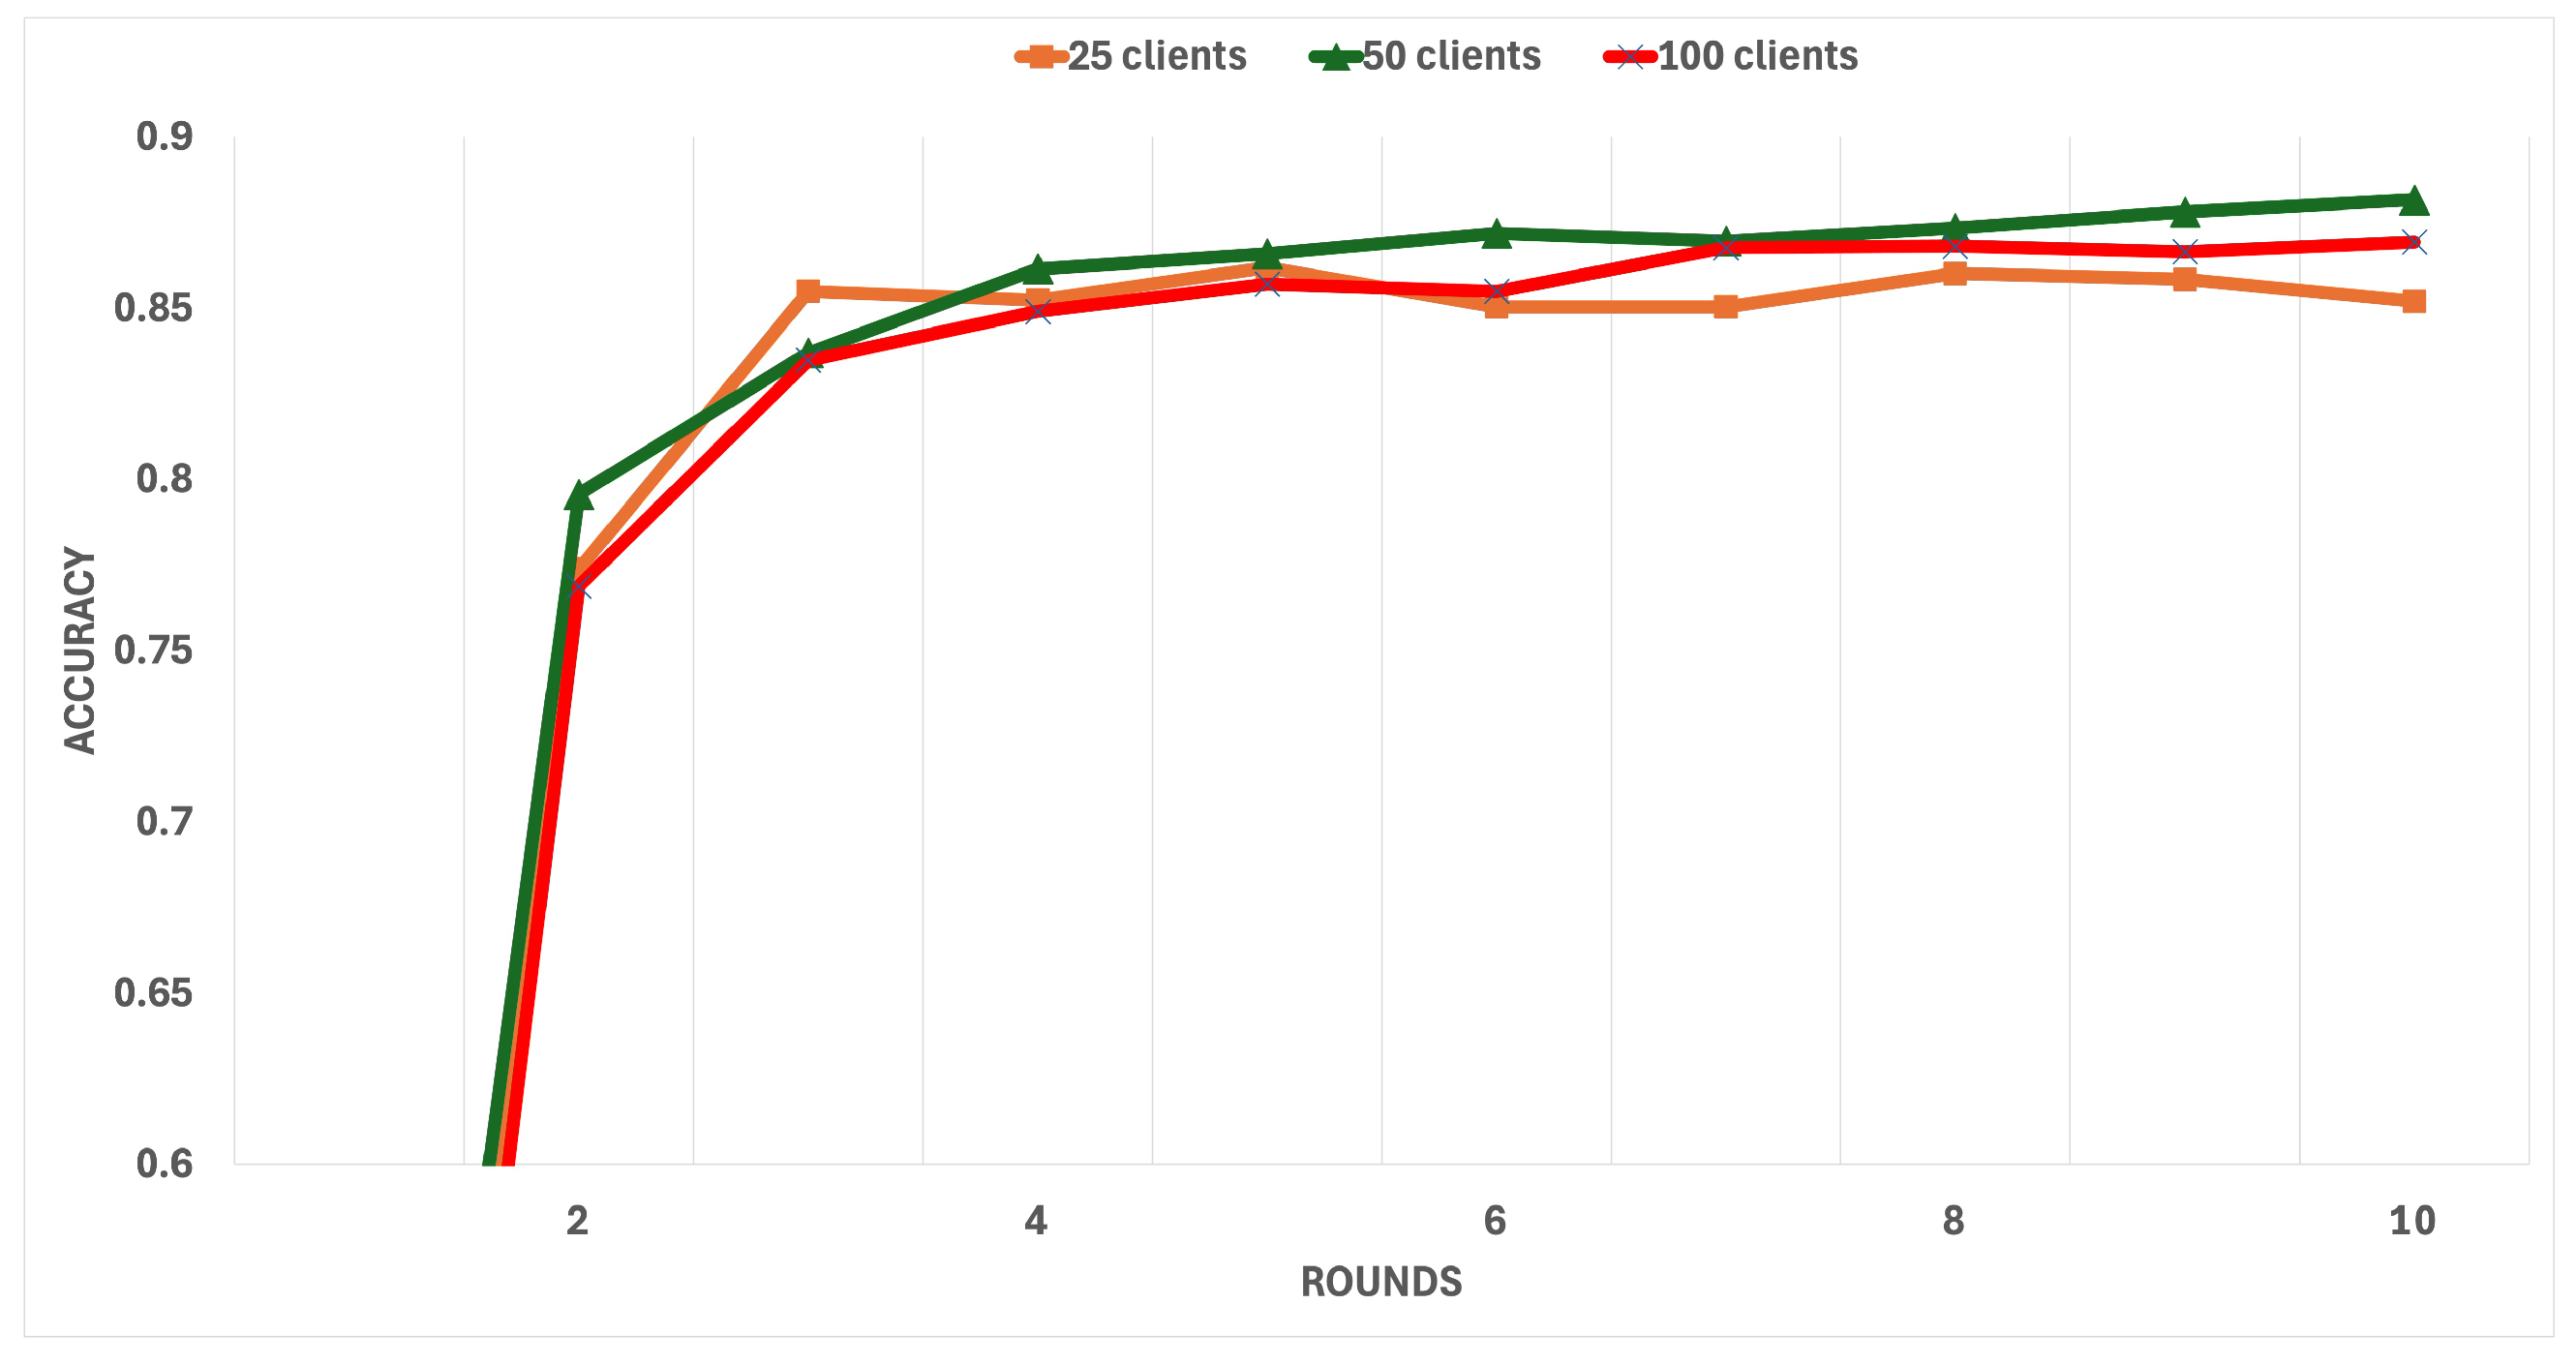
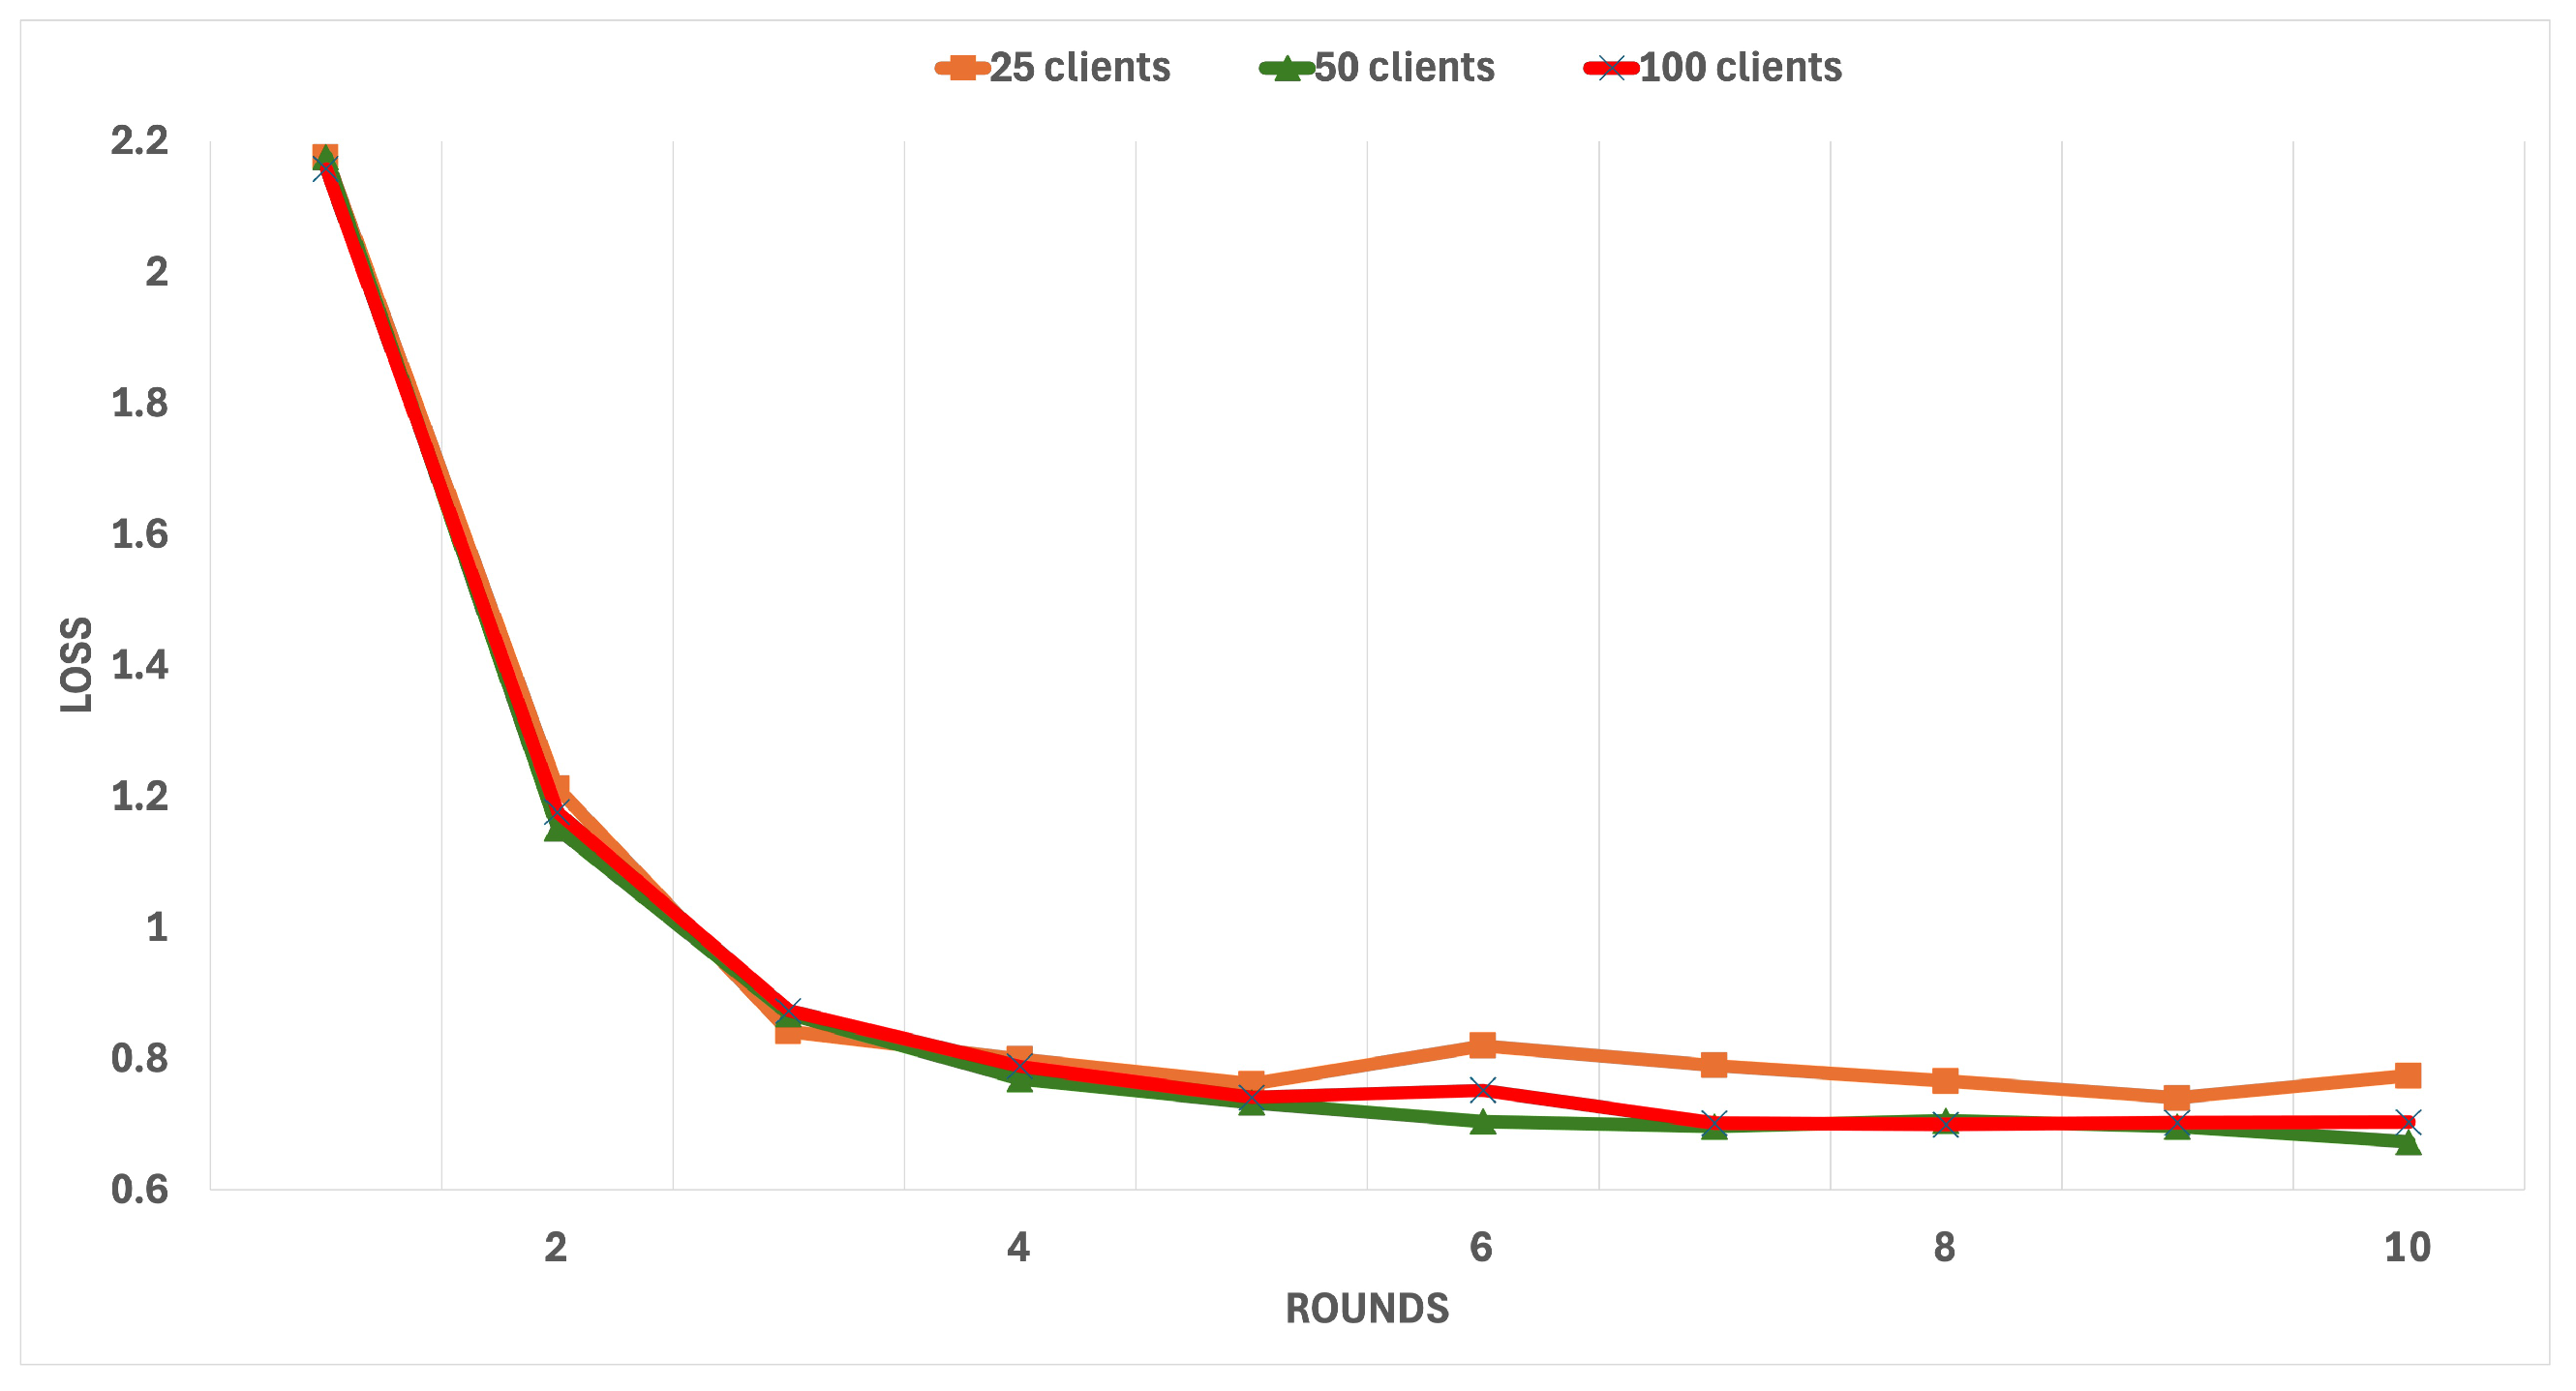
Figure 15 and
Figure 16 show the accuracy and loss over 10 rounds for 25, 50, and 100 clients’ configurations.
Figure 15 (Accuracy Evaluation): The x-axis represents the rounds (1–10), while the y-axis shows accuracy values from 0.6 to 0.9 (60–90%). The y-axis range has been optimised for readability, focusing on the relevant performance range rather than starting from zero.
Figure 16 (Loss Evaluation): The x-axis represents the rounds (1–10), while the y-axis shows loss values from 0.6 to 2.2. This range captures the complete loss trajectory from initial high values to final convergence. The client groups are distinguished by specific markers: 25 clients with an orange line (square markers), 50 clients with a green line (triangular markers), and 100 clients with a light red line (light blue “X” markers).
The results indicate a clear progression in performance. Initially, the accuracy was low, ranging from 18.3% to 25.41% (though the figure’s y-axis is scaled from 60 to 90% for enhanced readability), with high loss values between 2.1 and 2.2, reflecting the presence of malicious clients and noise in the dataset. As the system’s trust-based exclusion mechanism operated, accuracy sharply improved, reaching values between 84.7% and 87.9% by the final round. Concurrently, loss values decreased significantly, stabilising between 0.6895 and 0.8092. These trends highlight the system’s ability to adapt, exclude untrustworthy clients, and achieve consistent performance improvements across all client configurations.
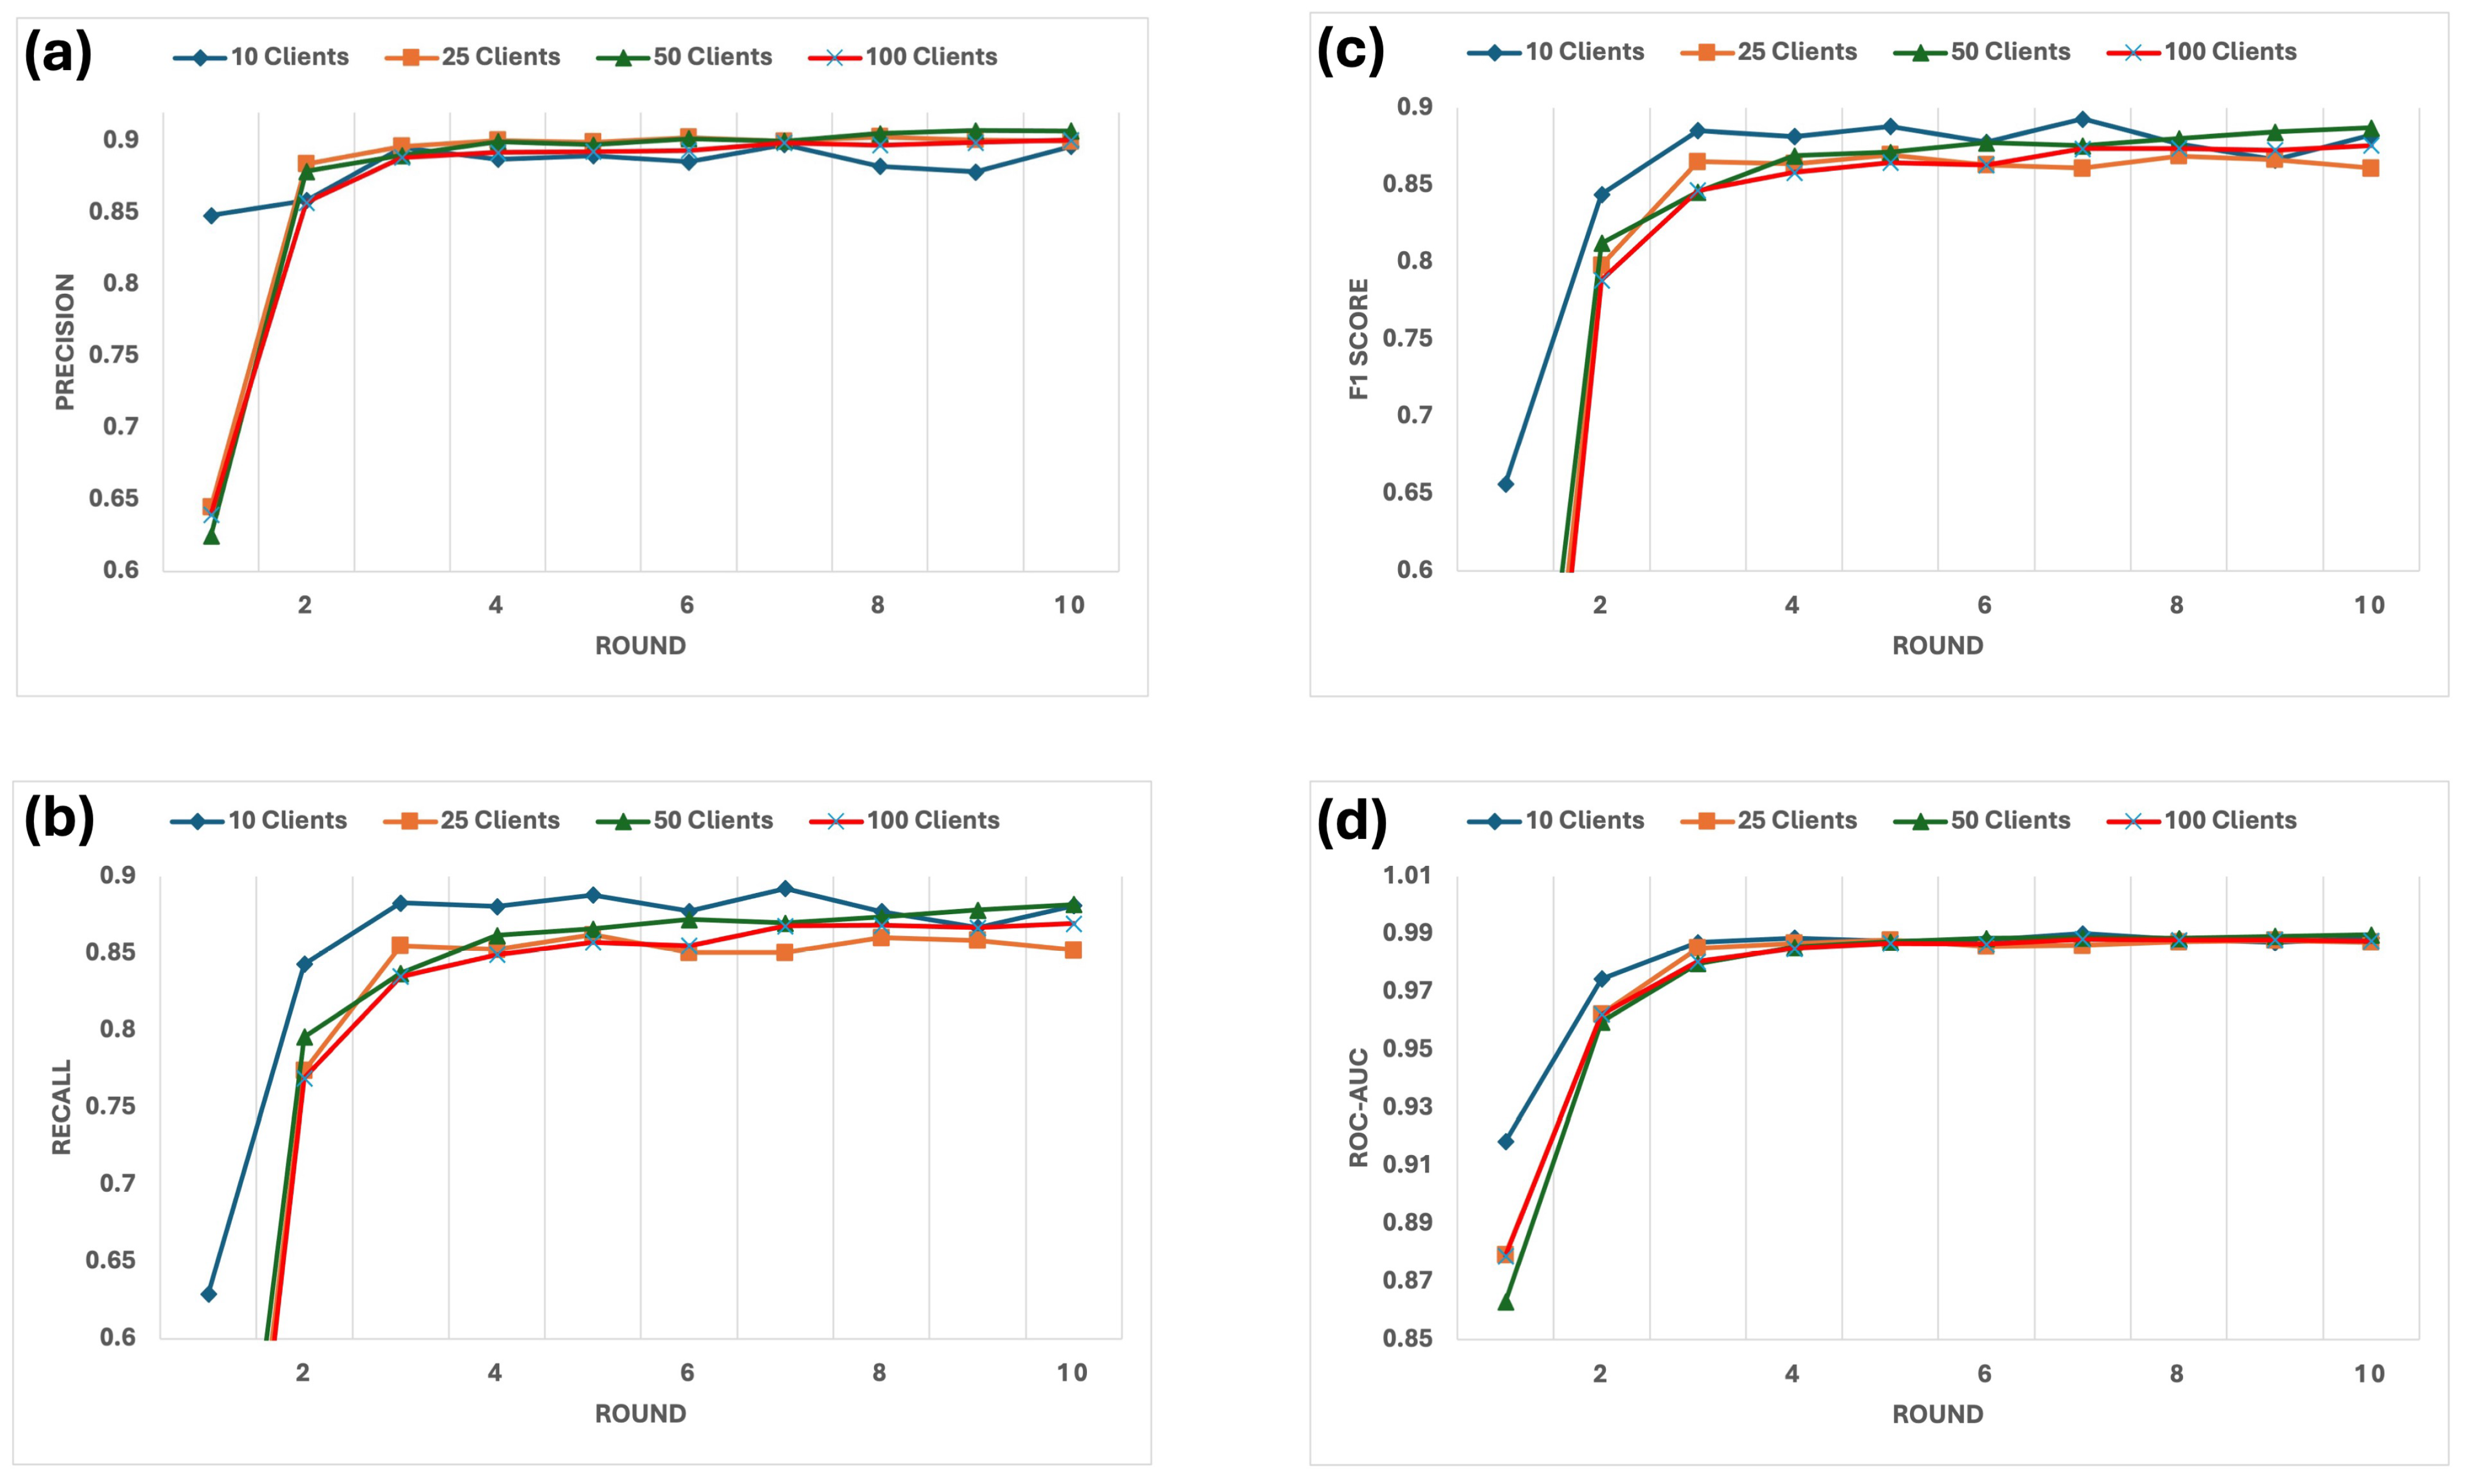
Evaluation of key metrics, as shown in
Figure 17, including (a) precision, (b) recall, (c) F1 Score, and (d) ROC-AUC, revealed consistent improvements across configurations with 25, 50, and 100 clients.
For the 25-client setup, the precision increased steadily, stabilising at 90.0%, while recall reached 85.2%, and the F1 Score achieved 86.09%. The ROC-AUC score remained consistently high, gaining 0.9872, reflecting the reliability of the system under moderate complexity. These metrics demonstrate the model’s ability to classify malicious and non-malicious clients while maintaining robust performance accurately.
In the 50-client configuration, the system handled increased complexity effectively, with precision stabilising at 91.2%, recall reaching 87.9%, and the F1 Score improving to 89.5%. The ROC-AUC score peaked at 0.9913, further highlighting the improved ability of the system to distinguish between benign and malicious clients under higher demands.
For the 100-client configuration, which posed the highest complexity due to its larger and more diverse client pool, precision stabilised at 89.8%, recall reached 84.7%, and the F1 score achieved 87.1%. The ROC-AUC score reached 0.9859, highlighting the robustness and adaptability of the system even under challenging conditions.
The evolution of the trust score for 10 rounds, as shown in
Figure 18, highlights the system’s ability to exclude malicious clients while maintaining robust performance steadily. In the 100-client configuration, the system excluded 56 clients by round 10, showcasing its effectiveness in managing large-scale conditions. For the 50-client setup, 31 clients were excluded, reflecting the model’s strong capacity to stabilise performance under moderate complexity. In the 25-client configuration, 16 clients were excluded by round 10, further confirming the system’s ability to improve dataset quality. In all configurations, the mean trust scores of the remaining clients increased steadily, demonstrating the effectiveness of the trust-based selection strategy.
The computational efficiency of the system, as illustrated in
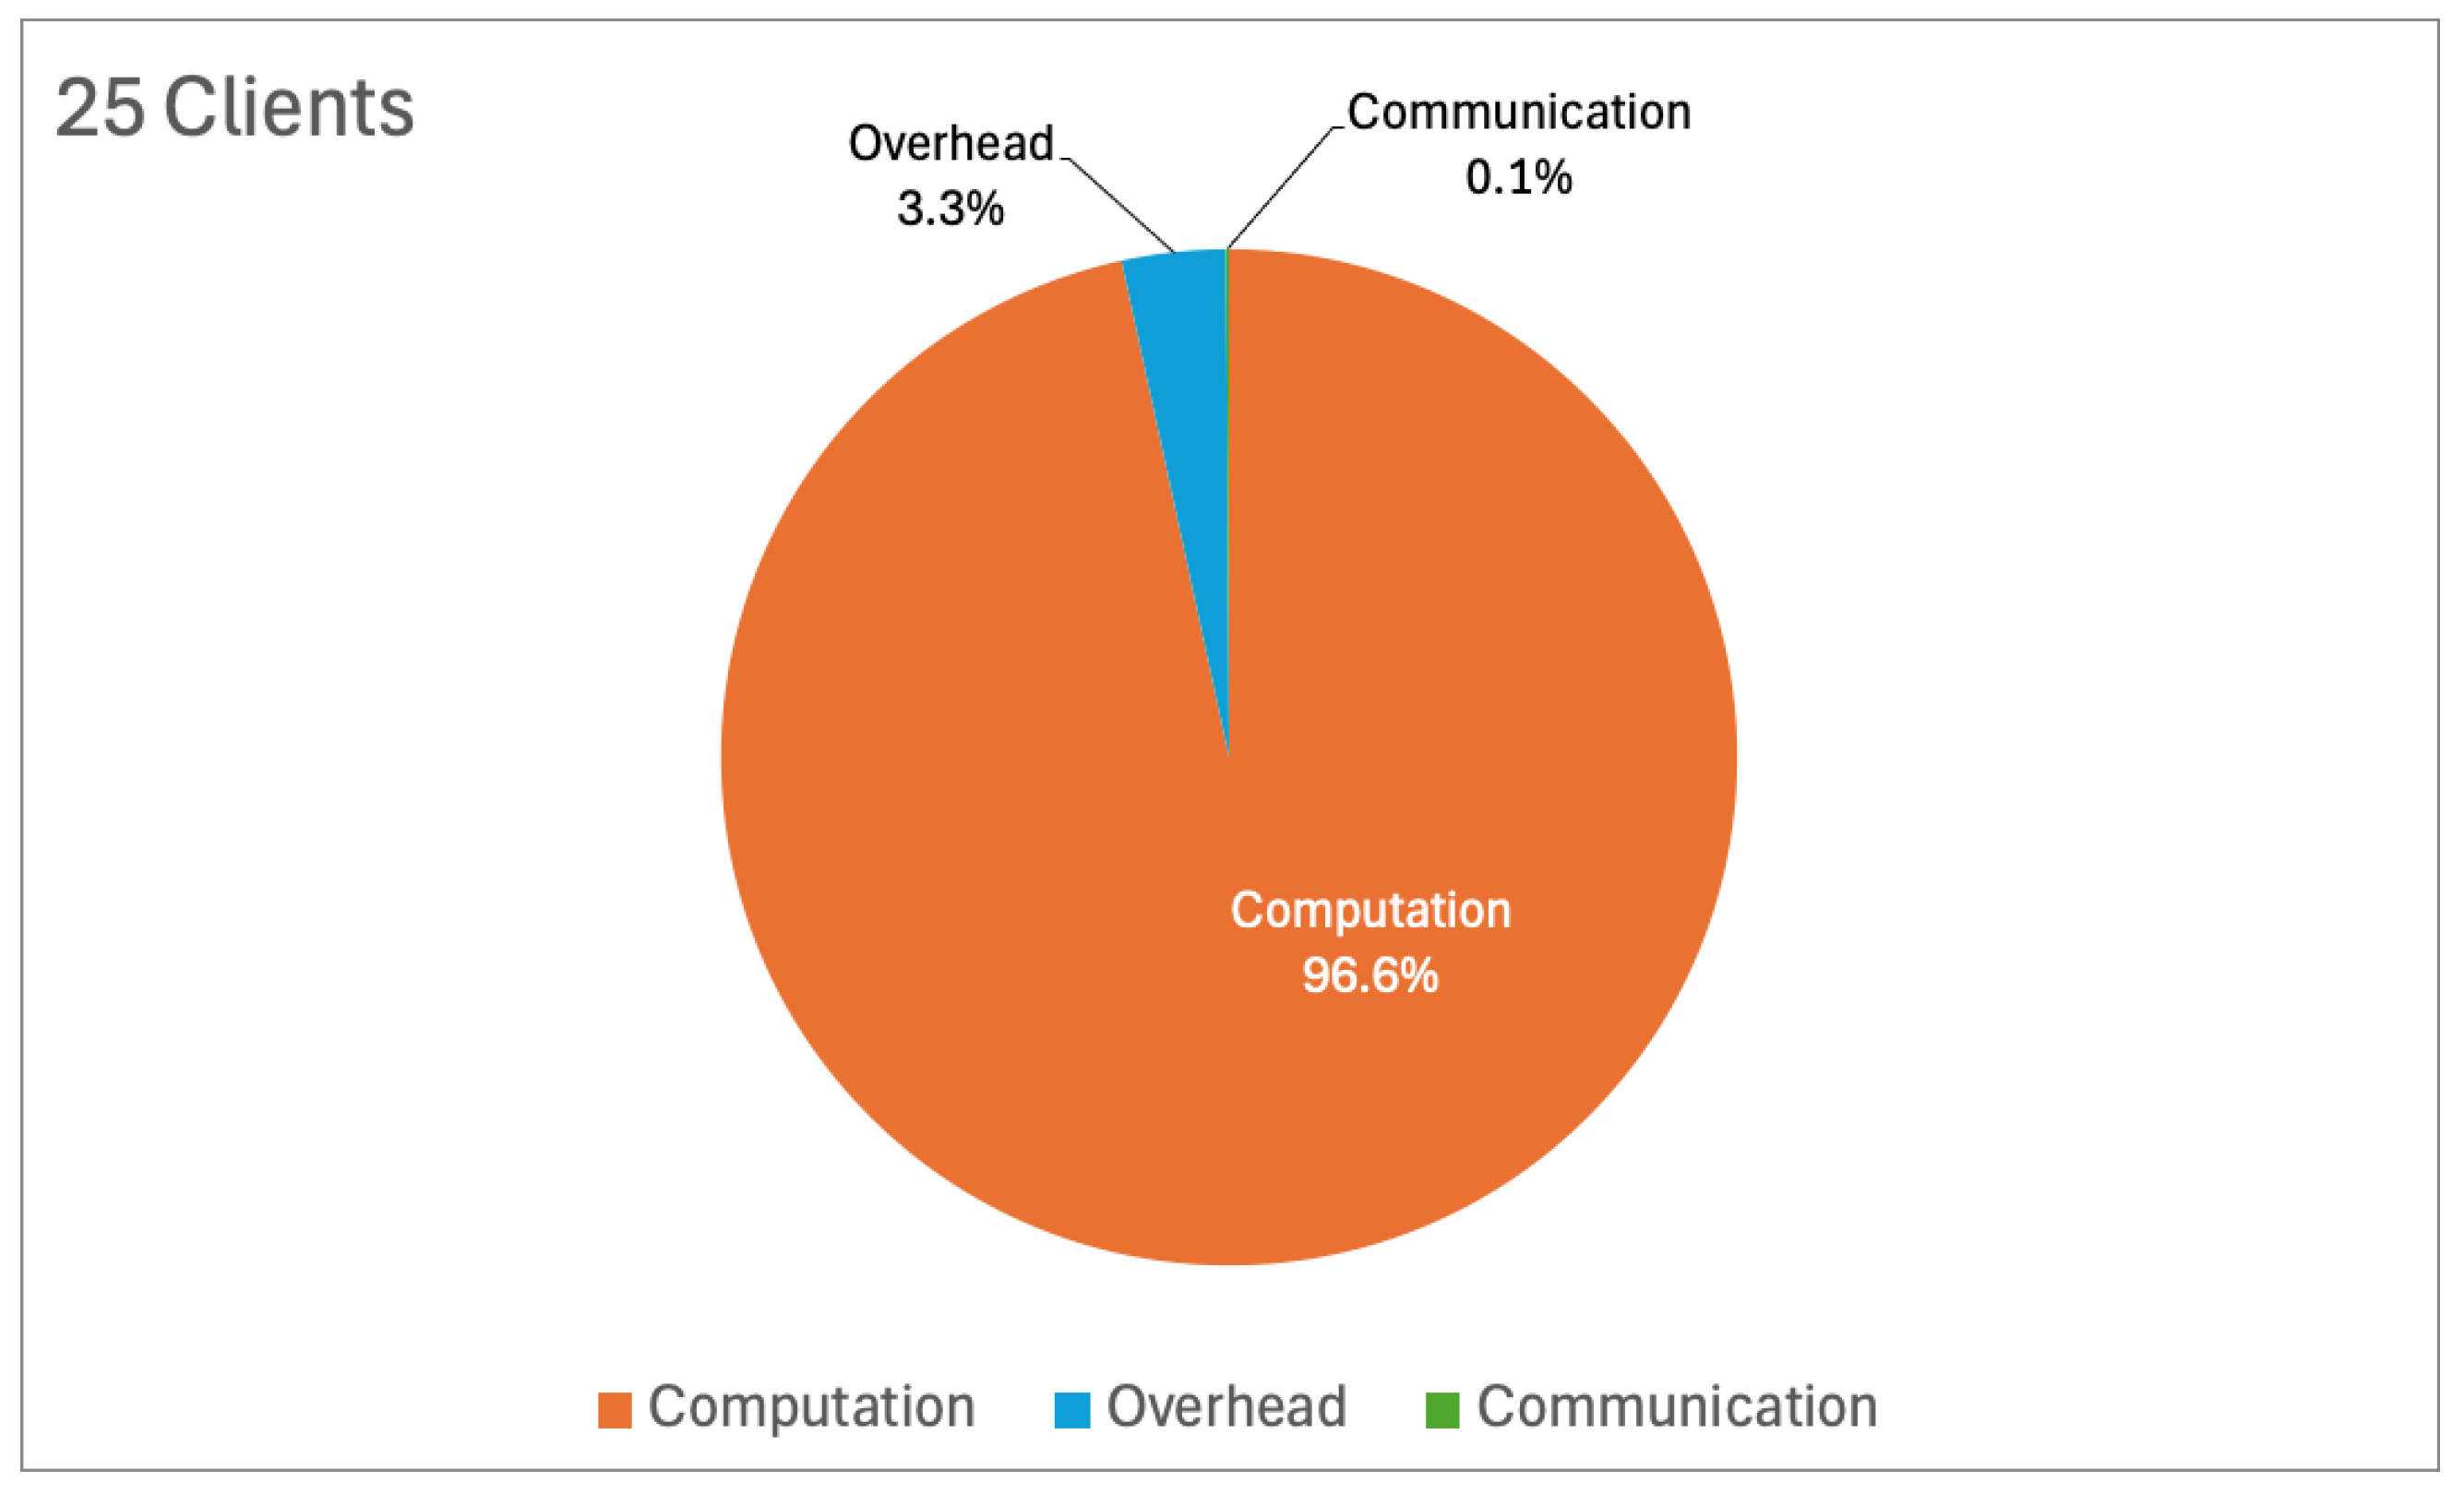
Figure 19, demonstrates significant improvements across all configurations. In the 25-client configuration, the training time per round stabilised at 36.74 s after initial reductions, reflecting optimised training processes enabled by trust-based exclusions. The breakdown of computational components (
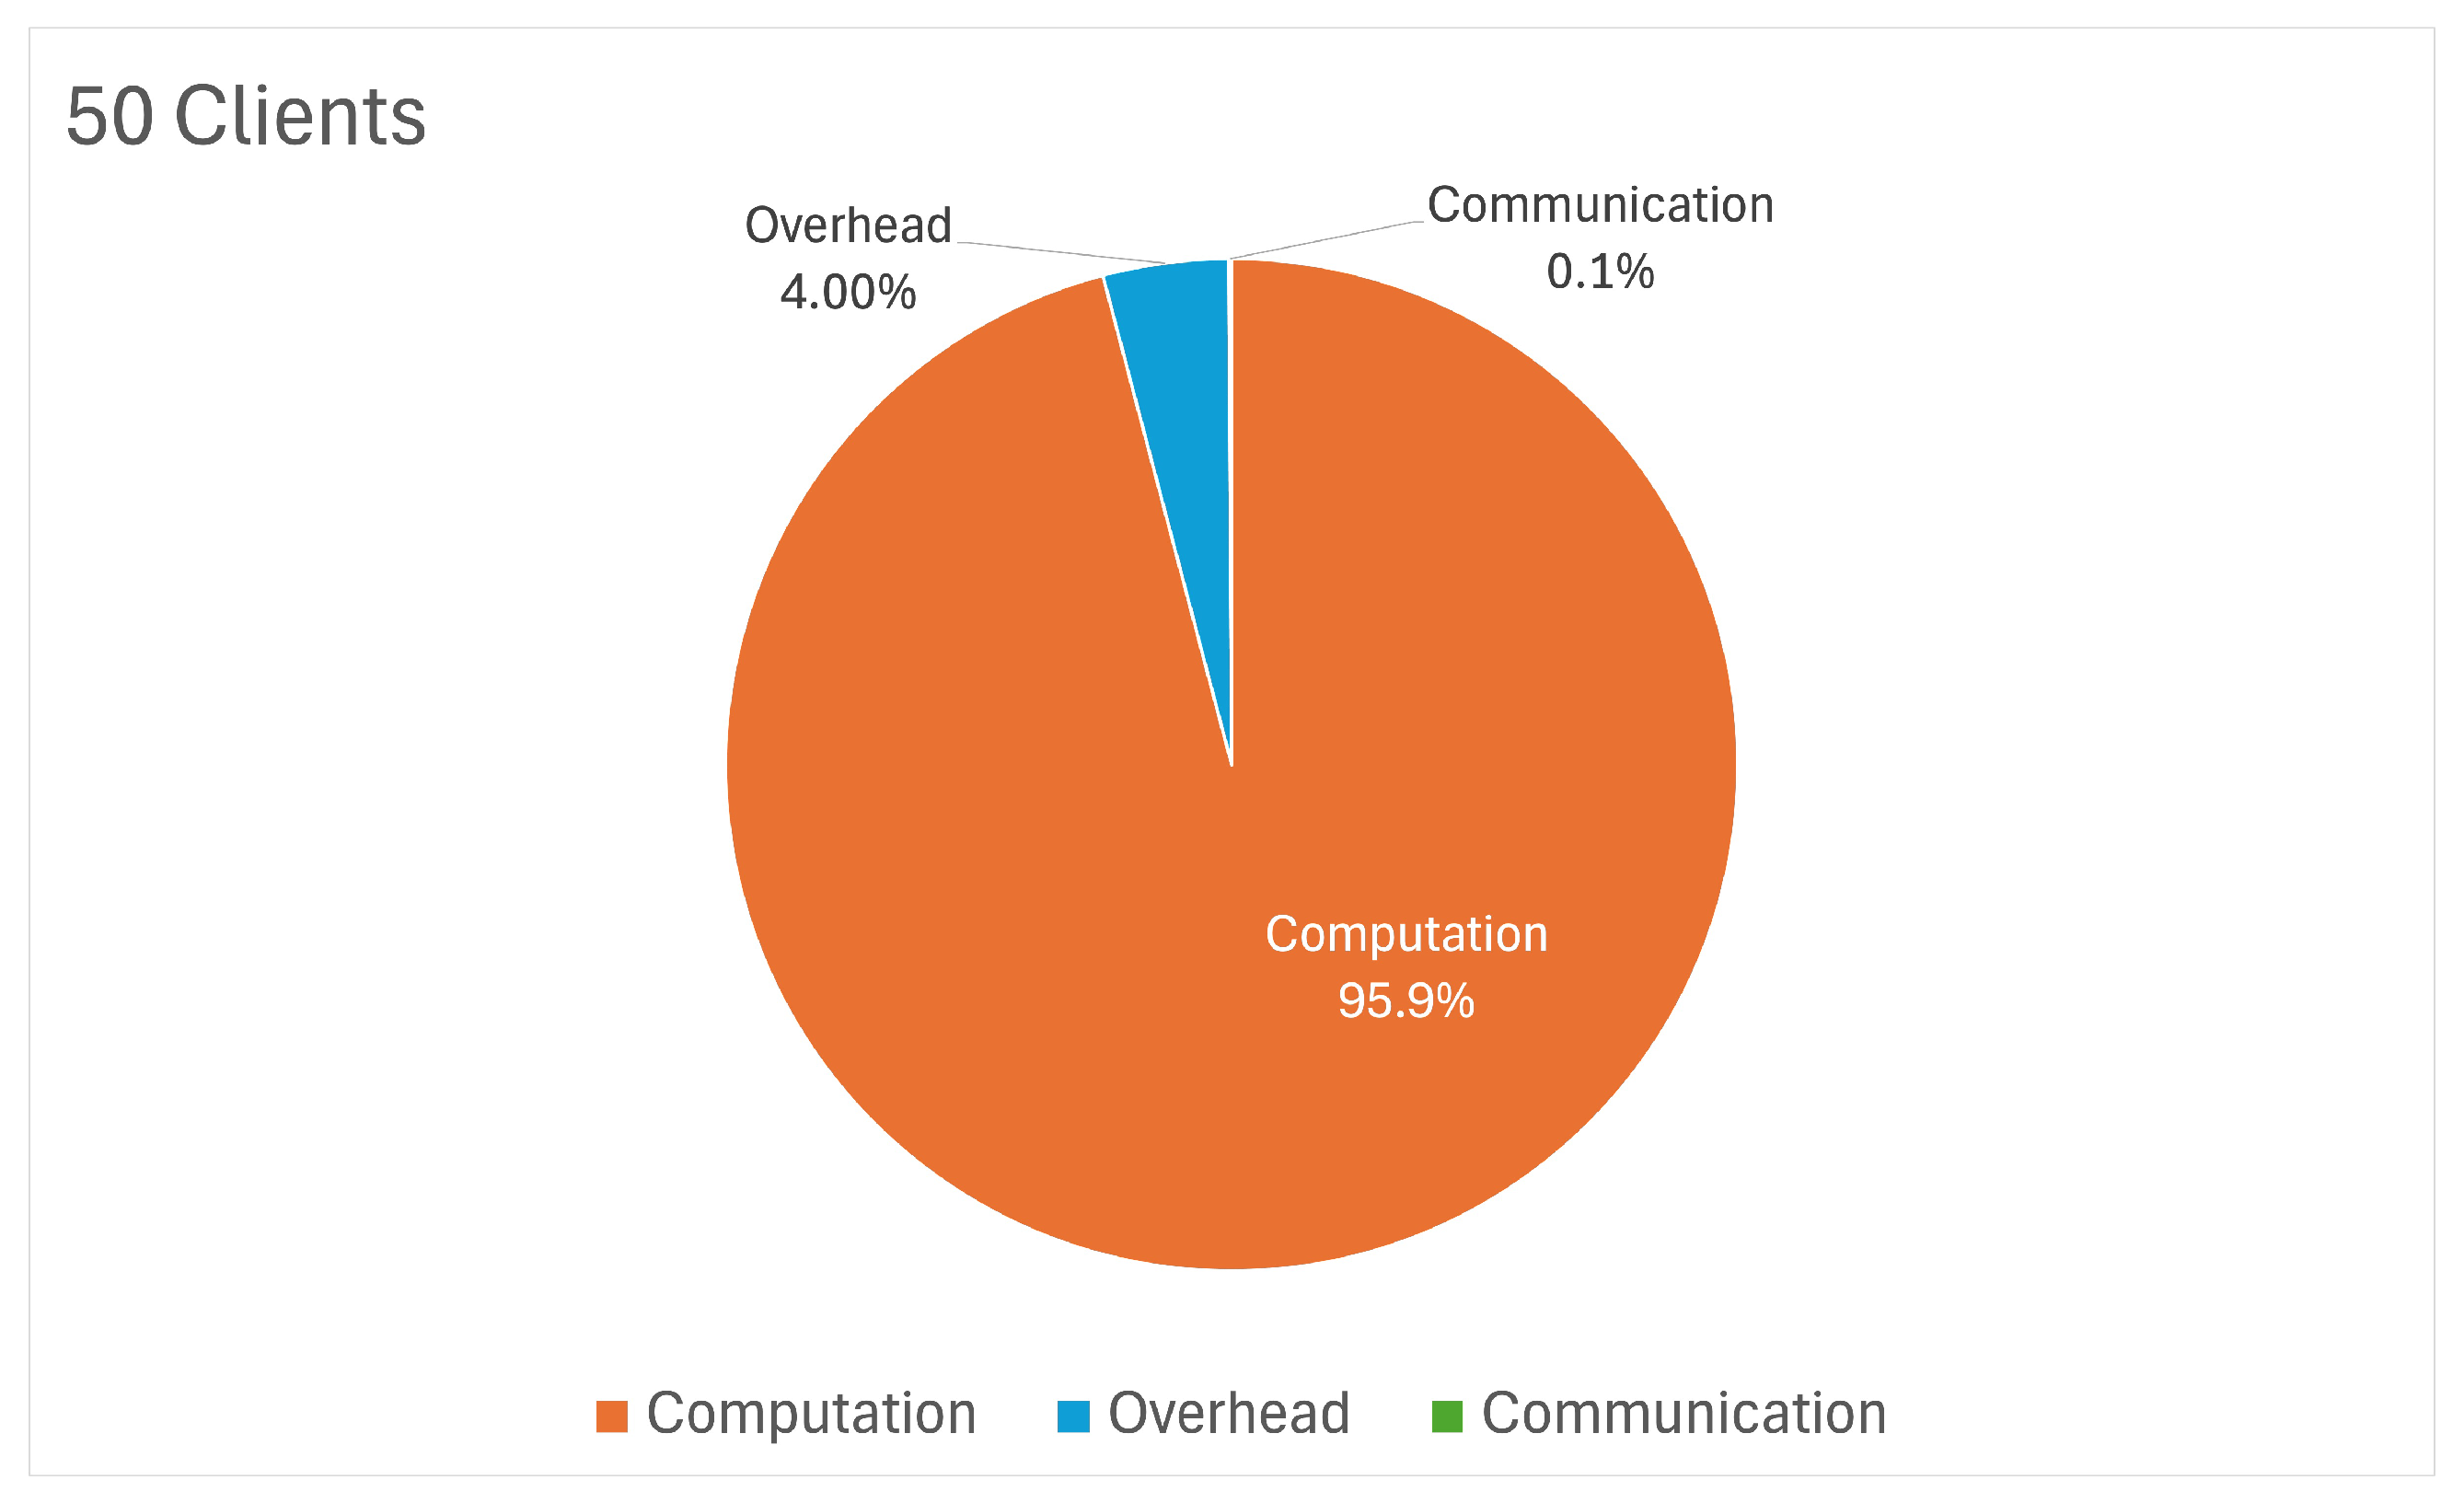
Figure 20) shows that 96.6% of the time was allocated to computation, with minimal contributions from communication (0.1%) and overhead (3.3%), confirming the efficiency of the system’s use of resources. For the 50-client setup, the training time stabilised around 57.03 s, following an initial peak of over 200 s. The breakdown (
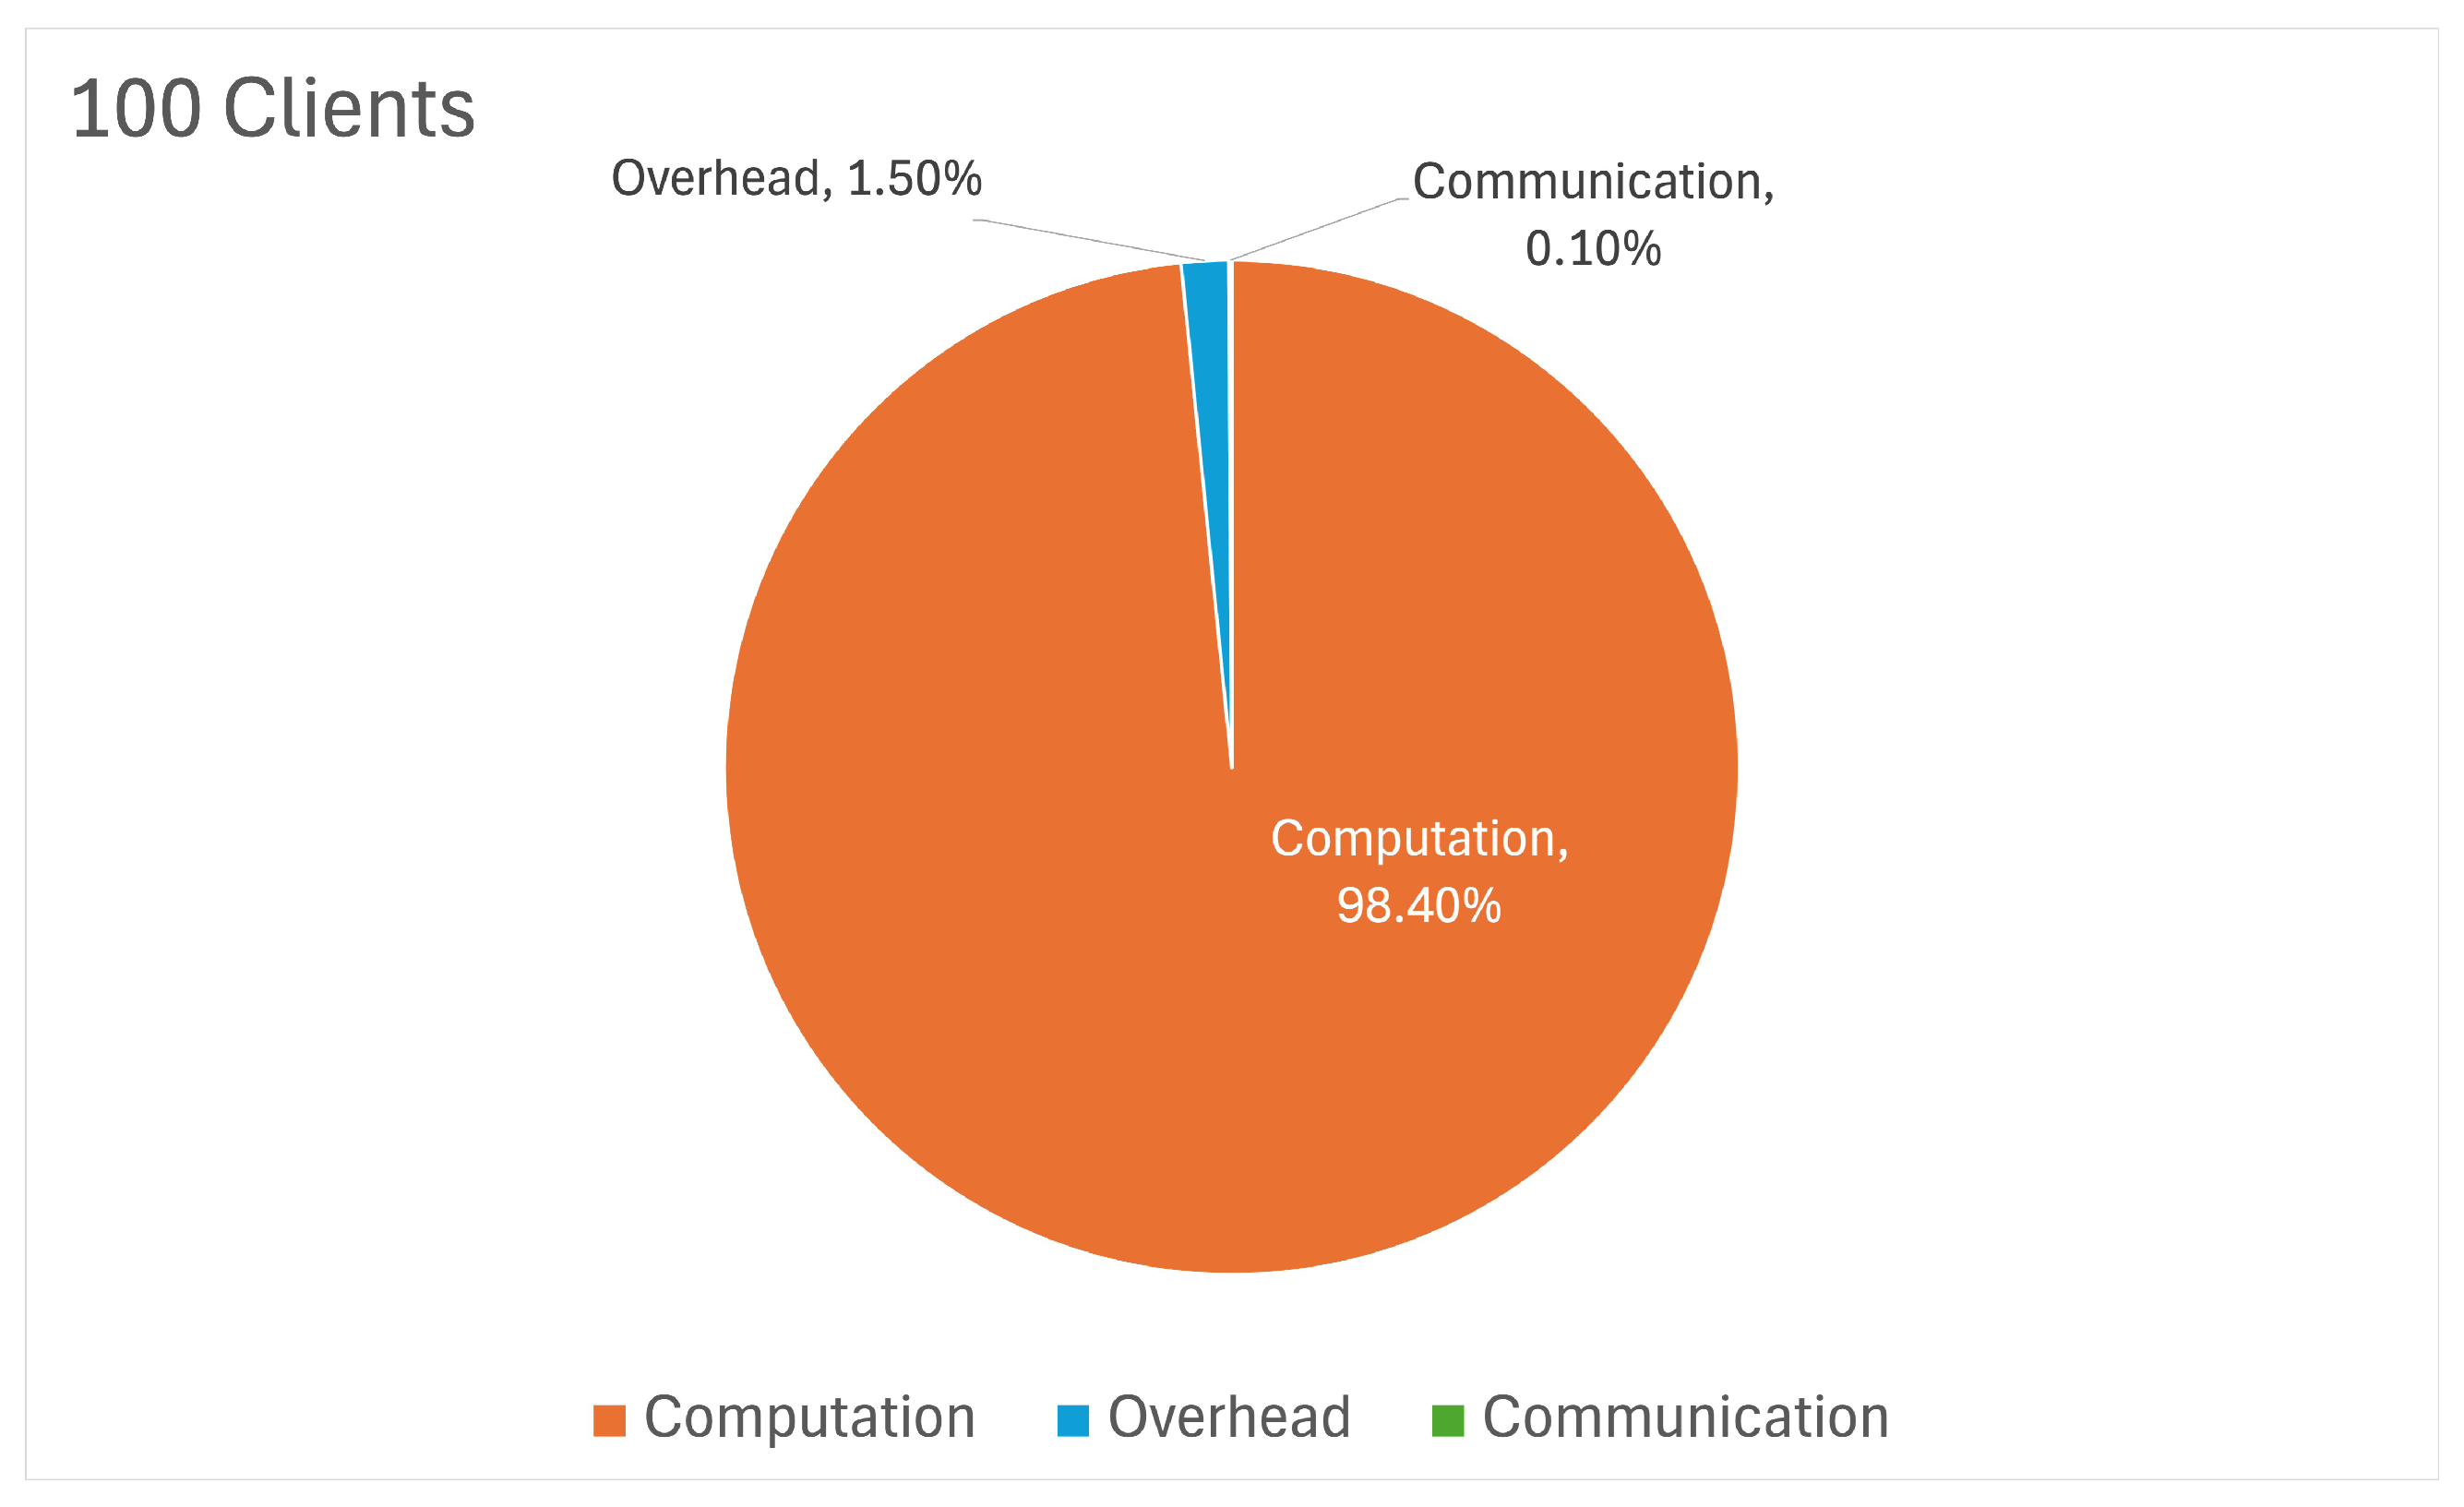
Figure 21) indicates that computation remained the dominant factor at 95.9%, with communication and overhead accounting for only 0.1% and 3.35%, respectively. This underscores the system’s ability to handle increased client pools without sacrificing efficiency. In the 100-client configuration, the training time stabilised at approximately 95.6 s after peaking above 391 s in the early rounds.
Figure 22 highlights that computation dominated at 98.4%, with overhead contributing 1.4% and communication only 0.1%. This demonstrates the system’s scalability and effective management of computational resources, even in high-complexity scenarios.
Finally,
Table 2 comprehensively summarises the system’s performance metrics across all configurations (25, 50, and 100 clients) for each round. The metrics include accuracy, loss, F1 Score, precision, the number of excluded clients, and total round time. This consolidated table demonstrates the system’s ability to adapt to varying client loads, maintaining robust performance, strong classification metrics, and efficient processing times across different levels of complexity. The results validate the proposed framework’s scalability, resilience, and adaptability, effectively handling moderate to highly complex federated learning scenarios.
Table 2 also delineates the operating envelope we explored. Within each fleet size, the accuracy rises sharply in the first two rounds, once malicious clients are excluded, and then stabilises. When comparing final figures across configurations, the accuracy stays essentially flat (0.881 for ten clients, 0.872 for fifty, and 0.862 for one hundred), while the mean round-time extends from 13.97 s to 160.72 s. This exposes a clear throughput-latency trade-off; beyond about fifty vehicles, additional participants add less than one percentage point of reliability but more than double the turnaround time. The same numbers serve as a stress test. Even under the heaviest load examined (100 clients), the global model settles at 0.862 accuracy; the price is roughly 2.7 min of latency, acceptable for fleet-level analytics but restrictive for sub-second safety loops.
4.5.3. Comparison with State-of-the-Art
For fairness, each baseline is quoted on its native dataset exactly as reported in the originating paper; re-training all methods on a unified dataset is left to future replication studies.
Table 3 offers a comparative summary of several Federated Learning (FL) approaches, spanning diverse datasets and highlighting each method’s achieved accuracy as well as its computational or security implications. TrustBandit, for instance, demonstrates moderate accuracy (75.64% with 40% malicious clients) but suffers from elevated cost when data is highly heterogeneous. In contrast, CONTRA and Client Selection in FL obtain higher accuracies on standard benchmarks like MNIST or CIFAR-10 (up to 87.4% and 87%, respectively), yet they exhibit increased overhead and remain sensitive to adversarial behaviours. Approaches such as FSL and FedCS focus on performance improvements (e.g., 76.83% on CIFAR-FS and 79% on CIFAR-10) but have not explicitly addressed adversarial robustness or efficient scalability.
Meanwhile, RCFL balances accuracy in the 75–82% range across MNIST and CIFAR-10 but lacks rigorous security threat evaluations. Although it improves accuracy to approximately 87% in CIFAR-10, it introduces an overhead of approximately 1.3× while also raising concerns about the readiness for real-world deployment. By comparison, our proposed Fed-DTB achieves 86-88% accuracy under varying client configurations (10–100 clients) and demonstrates resilient performance in the face of malicious or low-performance clients. Despite a minor overhead increase, Fed-DTB uniquely integrates robust aggregation and adaptive weighting, thereby offering stronger protection against poisoning attacks. Fed-DTB is dataset-agnostic. Any researcher can retrain it on further benchmarks by using the same configuration template provided in our experiment files. Detailed instructions will be released once the paper is accepted.
5. Discussion and Implications
The FL within IoV networks has attracted much interest as it takes advantage of data privacy, improves real-time decision-making, and minimises communications overhead in large-scale vehicular environments. Despite the increasing progress of decentralised intelligence, current approaches have highly restricted applicability in real-world IoV scenarios due to their key deficiencies. Many modern approaches fall short when it comes to testing with varying adversarial threats, use static or single-factor trust mechanisms, utilise centralised cloud aggregation, and ignore the high heterogeneity and high dynamic conditions within IoV. These challenges may obstruct FL’s applicability, scalability, and effectiveness in IoV networks due to the safety-critical and resource constraints.
A prominent shortcoming in vehicular data-sharing schemes lies in the inadequate evaluation of adversarial attacks, such as model poisoning and inference threats. Even when certain blockchain-based FL architectures are proposed, they typically overlook the substantial computational and communication overhead introduced by consensus protocols, particularly in large-scale IoV networks, where the number of vehicles can surge exponentially. Our proposed framework, Fed-DTB, recognises the high stakes of IoV security and makes adversarial resilience a central design principle. By explicitly testing the model under various poisoning scenarios and measuring trust indicators (e.g., IDS alerts, energy usage, suspicious feedback), Fed-DTB identifies malicious participants and adapts its trust thresholds accordingly. This adaptability is crucial in preventing computational blowouts: once malicious clients are flagged and excluded, the subsequent training rounds become more efficient, thereby balancing security with system overhead.
Numerous existing approaches rely on single-factor or static trust metrics, focusing solely on user feedback, IDS logs, or model performance in isolation. Such static solutions struggle to cope with dynamic IoV conditions, where network latency, node mobility, and adversarial strategies may evolve rapidly. By contrast, Fed-DTB introduces multi-factor trust evaluation, combining internal and external indicators like vehicle mobility, compliance with traffic rules, FL participation history, and real-time network stability. Moreover, the adaptive weighting mechanism within Fed-DTB recalibrates the priority of each factor based on the prevailing vehicular context. For instance, if an IoV environment is under active attack, IDS alerts are given higher weight, whereas scenarios with fluctuating connectivity might prioritise energy or network reliability metrics. This adaptability significantly enhances the framework’s robustness to ever-shifting adversarial techniques and heterogeneous data conditions, bridging a core limitation of previously rigid trust approaches.
Although privacy-preserving FL frameworks generally rely on secure aggregation or homomorphic encryption, many still involve centralised cloud servers that induce latency bottlenecks, especially problematic in fast-moving vehicular scenarios. Prolonged or unpredictable round times can delay model updates, compromising real-time decision-making in safety-critical use cases such as collision avoidance and traffic flow optimisations. Fed-DTB alleviates these bottlenecks by integrating client selection with an efficient, trust-driven coordination mechanism. Instead of indiscriminately waiting for all nodes to communicate with a centralised aggregator, the system focuses on high-trust vehicles that are both reliable and timely. This approach reduces round communication overhead and permits partial but higher-quality updates, mitigating latency concerns in an environment where connectivity may be transient or unstable.
Another barrier to IoV-centric FL research is the lack of public datasets representing realistic adversarial behaviours, diverse network topologies, and resource constraints. Many published benchmarks either simulate homogeneous traffic or omit malicious client scenarios altogether, rendering them less applicable to real-world vehicular contexts. Recognising this, Fed-DTB includes a custom synthetic dataset that captures adversarial attacks, dynamic vehicular states, and energy fluctuations. By incorporating these diverse conditions, the experiments more faithfully replicate the environment of a smart city or complex ITS deployment. Moreover, the results presented (including performance metrics in different client scale configurations) offer valuable scalability insights that many existing FL frameworks do not provide. Such analyses underscore the model’s capacity to adapt across small- to medium-scale IoV networks and pave the way for larger-scale adoption.
Resource allocation and scheduling in IoV-FL lean on advanced algorithms such as DRL. However, untested learning latency and incomplete privacy simulations erode confidence in their operational viability. More critically, these approaches often assume fixed adversarial conditions or ignore the overhead of trust evaluations. In contrast, Fed-DTB embraces context-aware resource management: the trust-driven client selection process naturally accommodates the dynamic availability of computing and communication resources. By prioritising resource-limited but high-trust vehicles, the framework ensures minimal training disruption and fosters more reliable convergence in scenarios with shifting vehicular populations or intermittent power constraints. Moreover, real-time performance is bolstered by the early exclusion of untrustworthy nodes; rather than expending cycles on suspicious updates, Fed-DTB swiftly channels resources towards genuinely contributingclients. This strategy addresses a core shortcoming in existing DRL-based resource schedulers, where slow or inconclusive trust checks can hamper real-time responsiveness.
Finally, verifying the convergence behaviour of FL models in non-IID vehicular networks remains an unresolved question in much of the literature. The ephemeral and mobile nature of vehicles, combined with adversarial data injection, raises doubts about whether global models can stabilise within practical round limits. The Fed-DTB multi-factor trust approach tackles this by filtering out outlier contributions early in each round, preservingthe integrity of global updates. Empirical findings indicate that convergence can be achieved consistently despite widely varying data distributions and malicious interference.
The Fed-DTB remains explicable because every trust decision is the weighted sum of seven observable factors, and those weights are logged in each round. Operators can trace, for instance, how the IDS weight dominates during an attack and recedes once the threat is cleared. Preliminary counts of client selection in ten random seeds yield a coefficient of variation below 0.25, indicating that no benign subgroup is systematically excluded. These properties suggest that the framework offers transparent reasoning while treating participants evenhandedly.
By systematically addressing the core limitations of current FL solutions for IoV adversarial threats, static trust mechanisms, scalability bottlenecks, and the lack of realistic vehicular datasets, Fed-DTB presents a holistic design that moves the field towards more robust, context-aware deployments. Its adversarial resilience stems from active detection and the rapid exclusion of poisoned clients via multi-factor trust checks, ensuring compromised updates do not linger in the global model. Meanwhile, the adaptive trust mechanism employs a context-aware weighting strategy that dynamically reconfigures the focus of trust factors (e.g., IDS alerts, energy usage, or network stability) in response to evolving vehicular conditions. These improvements not only improve efficiency and scalability by allocating resources to reliable, high-quality updates and reducing overall latency but also maintain realistic testing scenarios through a custom dataset that simulates adversarial and heterogeneous states typical of large-scale IoV environments. Ultimately, Fed-DTB stands as a significant step forward in deploying robust federated intelligence, enabling intelligent transportation systems to manage data integrity, performance, and security in tandem, even under dynamic and potentially adversarial conditions.










.png)


