Article

GIS-Based Flood Susceptibility Assessment Using the Analytical Hierarchy Process: A Case Study of the Sebeya Catchment, Rwanda

by
Assiel Mugabe
1,2,*,
Telesphore Kabera
1,
Felicien Majoro
1,
Leopold Mbereyaho
1 and
Ma-Lyse Nema
3
1
Department of Civil, Environmental and Geomatic Engineering, School of Engineering, College of Science and Technology, University of Rwanda, Kigali P.O. Box 3900, Rwanda
2
Department of Civil Engineering, Kigali College, Rwanda Polytechnic, Kigali P.O. Box 164, Rwanda
3
Africa Centre of Excellence for Climate Change, Biodiversity and Agriculture (CEA-CCBAD), University of Felix Houphouet Boigny, Abidjan 22 BP 463, Côte d’Ivoire
*
Author to whom correspondence should be addressed.
GeoHazards 2026, 7(3), 95; https://doi.org/10.3390/geohazards7030095
Submission received: 17 June 2026 / Revised: 24 July 2026 / Accepted: 29 July 2026 / Published: 4 August 2026

Abstract

Flood susceptibility mapping is crucial for understanding flood-prone areas and mitigating the associated risks in vulnerable regions like the Sebeya Catchment. This study adopted a GIS-based Analytical Hierarchy Process (GIS-AHP) integrated with local community knowledge to evaluate flood susceptibility using 10 conditioning factors: Topographic Wetness Index (TWI), Elevation, Rainfall, Slope, Land use/Land cover (LULC), Soil types, Normalized Difference Vegetative Index (NDVI), Distance to roads, Distance to rivers, and drainage density. These factors were selected based on their established influence on flood susceptibility as identified through literature review, expert consultation, and local community experience in the flood-affected zones. Spatial datasets were gathered from remote sensing platforms, Digital Elevation Models, Meteorological records, and existing geospatial databases, and were processed within a GIS environment. The pairwise comparison matrix of the AHP was used to derive weighting coefficients representing the relative contribution of each factor in inducing flood, with Rainfall (0.23), Slope (0.15), Distance to river (0.12), drainage density (0.12), and Elevation (0.11) as the most influential criteria. The findings revealed that 88.4% of the study area falls within a moderate flood-susceptible zone, whereas 6.4% and 5.2% fall within high and low susceptible zones, respectively. The current study indicates that damage to infrastructure, loss of livelihoods, displacement of communities, and increased costs of disaster response are key consequences observed in affected regions. A confusion matrix approach was employed to validate the flood susceptibility map, and the results indicate 0.97 as an overall accuracy, confirming strong model performance and reliability. The proposed adaptive strategies for enhancing flood resilience include improvement in land use planning, use of early warning systems, and sustainable catchment management.

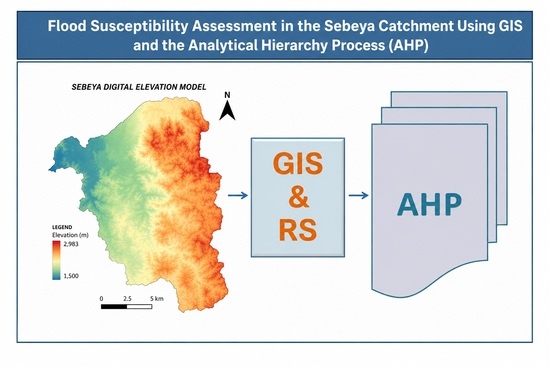
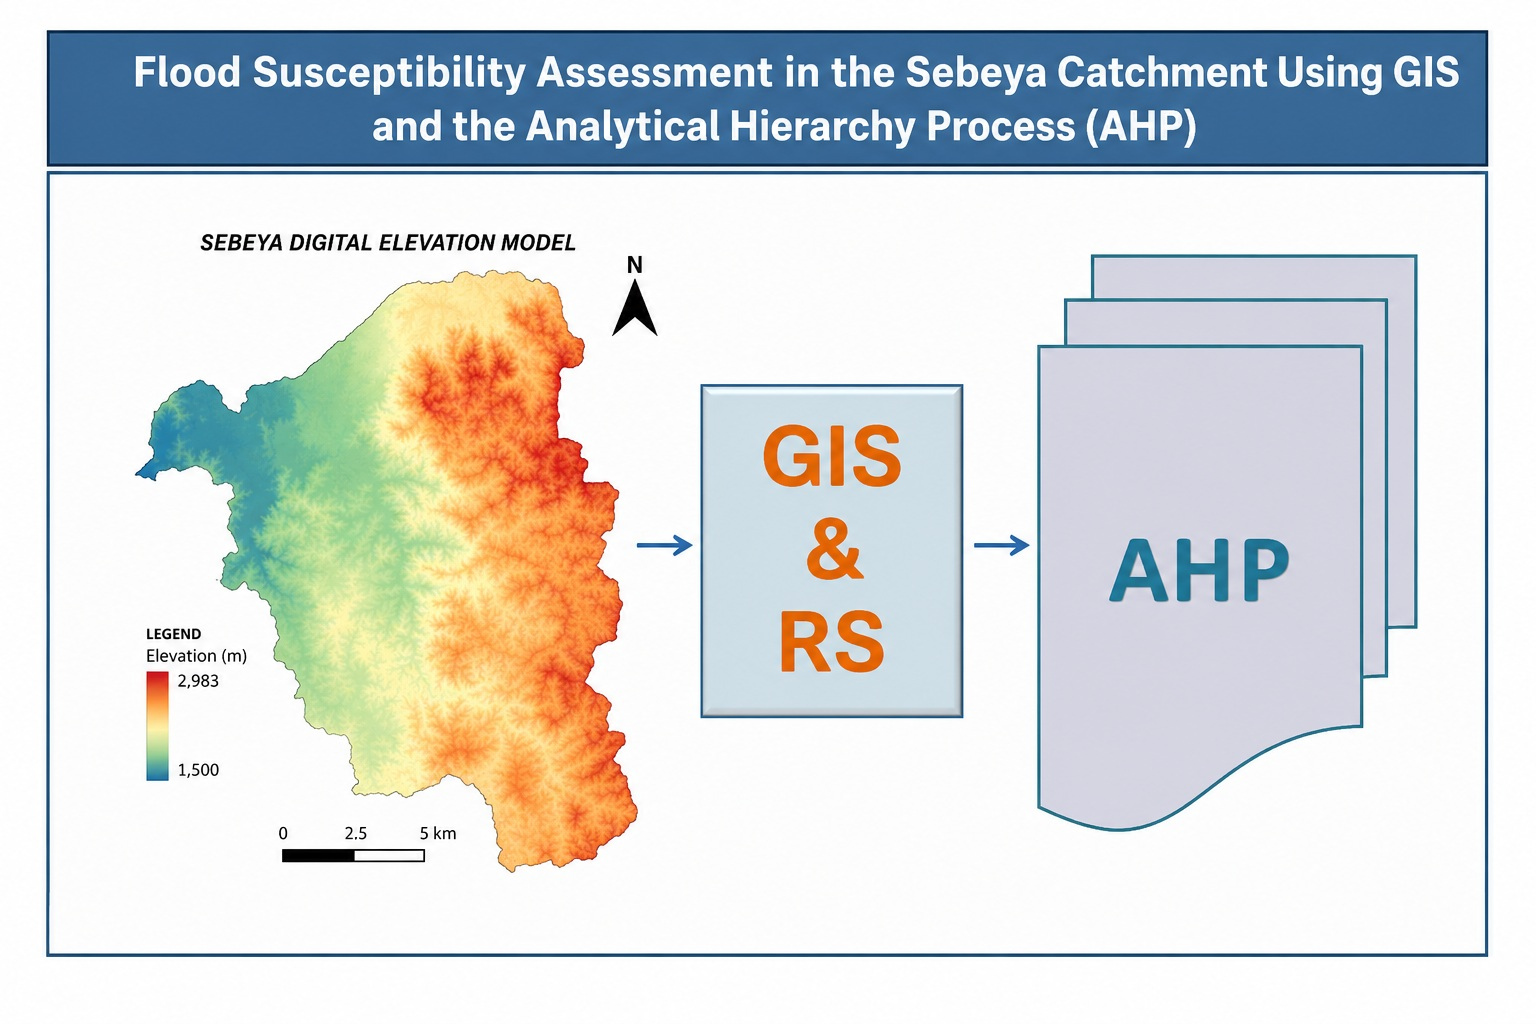
Graphical Abstract

1. Introduction

Flooding is one of the most devastating natural disasters, causing significant loss of life, property damage, and economic disruptions worldwide [1]. From a global perspective, the majority of people exposed to flood risk live in areas prone to 1-in-100-year flooding events [2]. Floods are often caused by various factors, such as intense rainfall, tsunamis in coastal zones, and other processes [3,4]. Aside from these factors, a number of other causes have contributed to floods in recent years, including severe weather, inadequate planning for land use and development, deforestation, and improper management of river flows [5]. Floods have far-reached socioeconomic consequences, affecting livelihoods, infrastructure, and economies at both local and national levels [6,7]. Beyond economic losses, floods pose serious health risks, including water-related diseases due to water sources contaminated during these events [8,9,10].
The Sebeya Catchment, which is situated in the western part of Rwanda, is particularly prone to flooding due to its steep topography, high rainfall intensity, and human-induced land use changes [11]. This region experiences both flash floods and riverine floods due to its diverse topography and hydrological characteristics. Flash floods commonly occur in the steep upstream and hilly sections, where intense rainfall, steep slope, and rapid runoff induce short-duration and high-velocity flood events. Conversely, the downstream lowlands are predominantly affected by riverine flooding, resulting from accumulation and overflow of runoff conveyed through the river network. Frequent floods in the region have led to infrastructure and human settlements damage, and agricultural land loss in both rural and urbanized areas of the catchment [12,13]. Given the escalating flood frequency and intensity, there is an imperative need for an effective flood susceptibility mapping method to identify high-risk areas and attenuate the flood’s socioeconomic impacts in the Sebeya Catchment.
Flood susceptibility has been assessed using numerous methods, which can be broadly categorized into statistical models, machine learning algorithms, physically based hydrological and hydraulic models, and Multi-criteria Decision Analysis (MCDA) techniques combined with Geographic Information Systems (GIS). Hydrological and hydraulic principles are used by physically based models like HEC-HMS, HEC-RAS, MIKE FLOOD, and LISFLOOD to simulate flood processes and produce extremely accurate flood inundation predictions [14,15]. However, these models require hydraulic calibration, high-resolution digital elevation data, river cross-sectional surveys, and comprehensive hydro-meteorological observations, all of which are often unavailable in areas with limited data [15,16]. Statistical approaches, including Logistic Regression, Frequency Ratio, and Weight of Evidence, estimate flood susceptibility based on observed correlations between historical flood occurrences and environmental factors [17].
More recently, Machine Learning techniques such as Random Forest, Support Vector Machine, Artificial Neural Networks, Gradient Boosting, and Extreme Gradient Boosting (XGBoost) have shown exceptional predictive performance by capturing complex nonlinear interactions among flood-conditioning factors [16]. Nevertheless, these approaches generally rely on large, reliable, and representative flood inventory datasets for model training and validation, which remain scarce in many developing countries.
On the other hand, GIS-based Analytical Hierarchy Process (AHP) offers a transparent and useful framework for combining several flood-conditioning parameters through organized expert judgment [18,19,20,21,22,23]. The method is particularly appropriate in regions where hydrological observations and historical flood inventories are limited because it combines spatial analysis with expert knowledge while requiring relatively small data inputs [24,25]. Furthermore, the Consistency Ratio used in AHP provides a systematic mechanism for evaluating the reliability of factor weighting, thereby enhancing methodological transparency and reproducibility [26,27,28,29,30,31].
Even though multi-criteria decision-making techniques for GIS-based flood susceptibility assessment have been widely used globally, significant knowledge gaps remain in Rwanda, particularly in the Sebeya catchment, where frequent flooding continues to cause substantial environmental and socioeconomic losses. Prior research has mostly concentrated on hydrological analyses or hazard mapping without integrating a complete set of flood-conditioning factors, incorporating community and local expert knowledge into the weighting process, or connecting observed socioeconomic impacts to spatial flood susceptibility. Consequently, there remains a need for a locally validated flood susceptibility assessment that integrates geospatial data and stakeholder knowledge to generate decision-support information for flood risk reduction. Therefore, this study aims to develop a GIS-based flood susceptibility map of the Sebeya catchment using the Analytical Hierarchy Process (AHP), integrating ten flood-conditioning factors with expert-informed weighting and socioeconomic evidence to support sustainable land use planning, disaster preparedness, and flood risk management.

2. Materials and Methods

2.1. Study Area

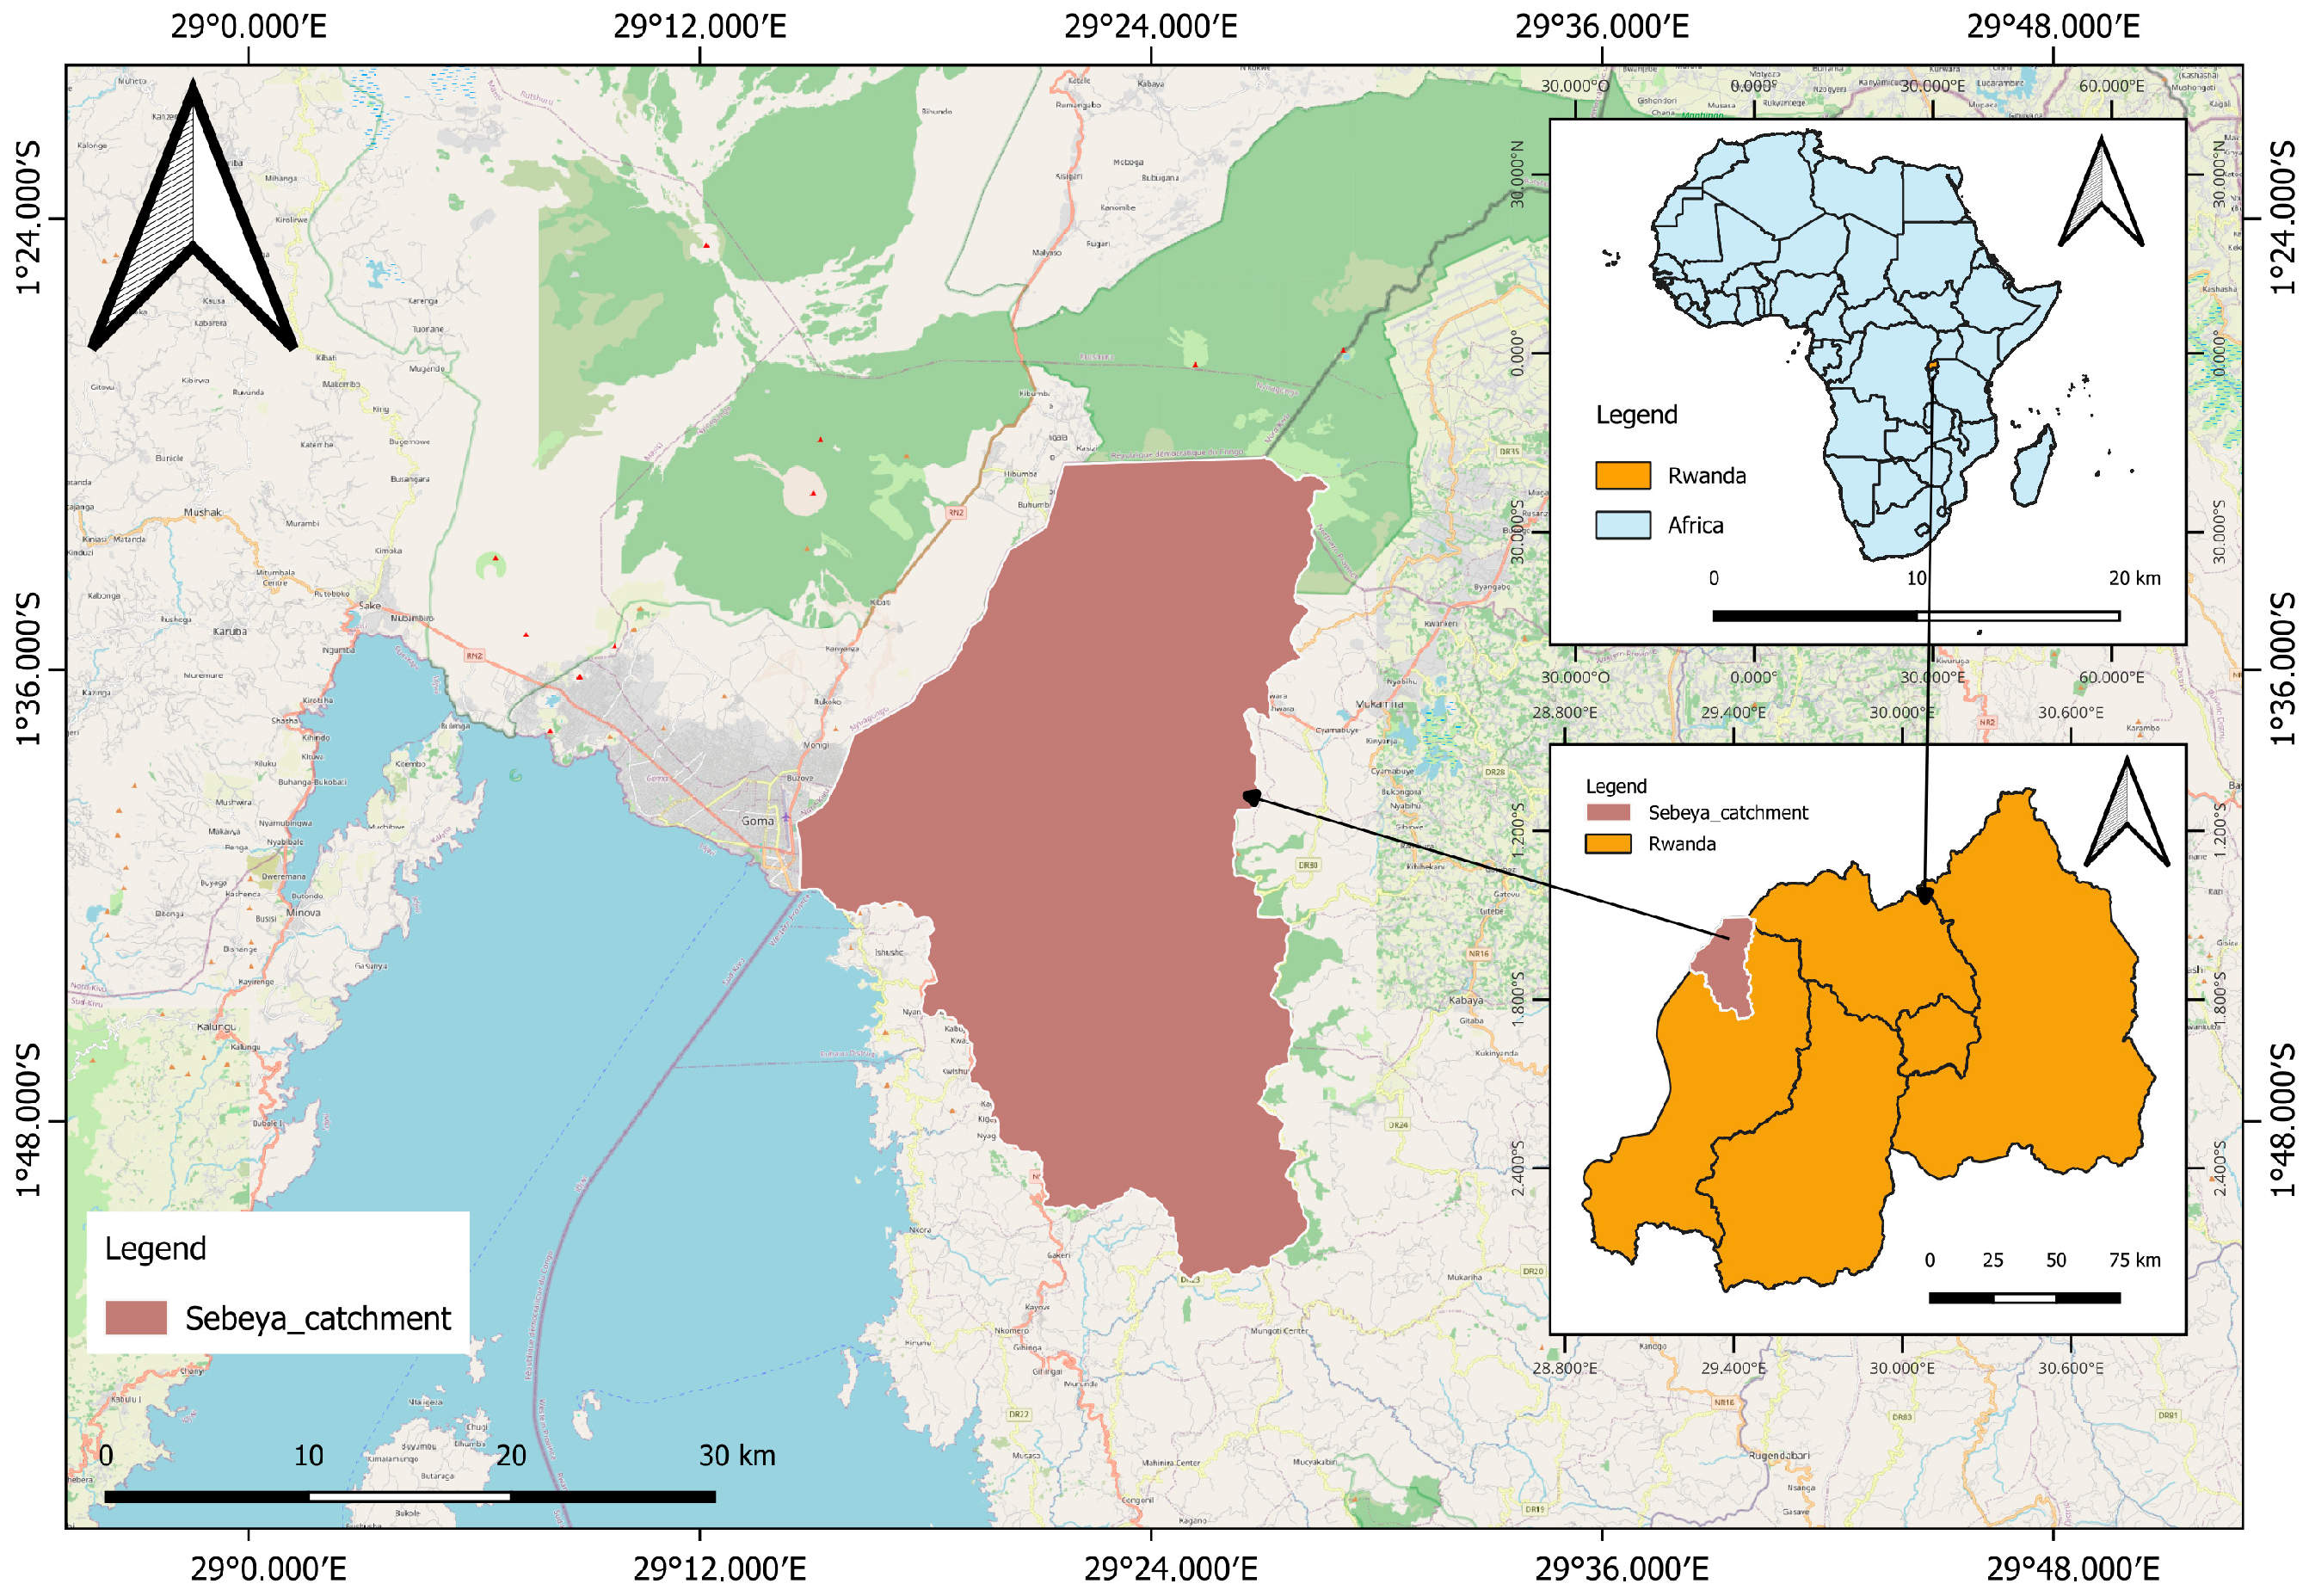
The Sebeya catchment, located in western Rwanda (Figure 1), is characterized by steep terrain, heavy rainfall, and dense populations. The catchment is part of the Kivu basin, covering 610 km2, with the Sebeya River flowing 48.4 km from the Nile–Congo divide (2660 m asl) to Lake Kivu (1470 m asl). The catchment is characterized by rugged mountainous terrain in the upstream areas and valleys in the downstream part. Its geology is dominated by Precambrian metamorphic and igneous rocks, with localized volcanic formations, while weathered soils of varying permeability influence infiltration and runoff. Geomorphological features, including steep slopes and deeply incised valleys, promote quick surface runoff and sediment transport during periods of heavy rainfall. The Sebeya catchment experiences a humid tropical highland climate with two rainy seasons (March–May and September–December) and receives more than 1200 mm of annual rainfall, particularly in the parts with higher elevation. Runoff is quickly transported from headwaters to downstream reaches by the thick drainage network, creating a hydrological regime that is extremely sensitive to heavy rainfall.
As a result, the catchment is vulnerable to both flash and riverine floods. Flash floods often occur in the steep upstream and mountainous areas where rainfall quickly causes overland flow, while riverine flooding mostly impacts the downstream valleys owing to channel overflow and floodplain inundation. The catchment supports diverse ecosystems within the Albertine Rift, including forests, wetlands, riparian vegetation, and agricultural landscapes. However, increasing agricultural expansion, settlement growth, and infrastructure development have altered land cover, reducing infiltration capacity and increasing runoff and soil erosion. The interaction of complex topography, heavy rainfall, dense drainage, and land use change makes the Sebeya catchment vulnerable to flooding and an appropriate case study for GIS-based flood susceptibility assessment.

2.2. Collection of Data

The combination of topographic, hydrological, climatic, remote sensing, infrastructural, and field survey datasets from reliable national and international sources served as the foundation for data collection in this study (Table 1). A 10 m Copernicus Digital Elevation Model (DEM) obtained from the Alaska Satellite Facility (ASF) served as the main topographic dataset. The DEM was employed to extract slope and Topographic Wetness Index (TWI) layers through terrain analysis in a GIS environment. Hydrological parameters, such as drainage density and distance to rivers, were generated from the river network retrieved from the UNESCO World Rivers Database, while the distance to roads layer was derived from the Global Roads Inventory Project (GRIP) road network using Euclidean distance analysis. Long-term daily rainfall data (1981–2021) obtained from the Rwanda Meteorological Agency were interpolated to produce a continuous precipitation surface representing the spatial distribution of rainfall throughout the catchment.
Land cover information was extracted from Sentinel-2 imagery obtained from the ESRI Living Atlas, while vegetation conditions were represented using the Normalized Difference Vegetation Index (NDVI) derived from Landsat-8 imagery retrieved from the USGS Earth Explorer. The flood susceptibility model was validated using historical flood inventory points that were gathered from field surveys and records of flood-prone areas. In addition, administrative boundary data obtained from the University of Rwanda Centre for GIS (CGIS) were used as reference layers during spatial analysis and map production. Field verification was carried out in the study area, where GPS coordinates, ground observations, interviews, and questionnaire data were gathered to validate different types of information, including flood-conditioning factors, historical flood locations, and socioeconomic impacts of floods in the study area. To ensure compatibility during spatial analysis, all datasets were projected to a common coordinate system, converted to raster format where necessary, and standardized to a 10 m spatial resolution before reclassification, weighting, and subsequent GIS- based flood susceptibility modeling.

2.3. Weighting of Flood-Conditioning Factors

This study has chosen 10 factors influencing floods based on the literature and their significance to flood susceptibility. These factors include slope, precipitation, Topographic Wetness Index (TWI), elevation, distance to rivers, distance to roads, drainage density, Soil type, Normalized Difference Vegetation Index (NDVI), and land use/land cover (LULC). Each factor was reclassified into five susceptibility classes ranging from 1 (very low susceptibility) to 5 (very high susceptibility) according to published thresholds and local environmental conditions [32]. An interdisciplinary panel of six (6) experts from academia and public institutions participated in the weighting procedure. The team’s experts were chosen based on their professional experience and knowledge of flooding (at least five years). Two hydrologists, a Lecturer in GIS and remote sensing, an environmental scientist, a specialist in watershed management, and a practitioner of disaster risk management comprised the team. The Analytical Hierarchy Process (AHP) weighting process was carried out in two rounds. During the first round, the experts independently evaluated the flood-conditioning factors and their pairwise comparisons. After consultation in the review process, they agreed that soil type, an important factor influencing surface runoff and infiltration, had been omitted from the initial list of conditioning factors. The experts also identified that several conditioning factors had been assigned weights that did not adequately reflect their relative importance in flood susceptibility assessment. Based on these observations, the factor set was revised to include soil type, and the pairwise comparison matrix was updated accordingly. In the second round, the revised set of ten conditioning factors was re-evaluated by the experts. Differences in judgments were discussed collectively until a consensus was reached, resulting in the final pairwise comparison matrix and factor weights. Finally, the consistency of the judgments was assessed using AHP Consistency Ratio (CR), and only matrices satisfying the recommended threshold (CR < 0.10) were accepted.
In order to enhance the model’s local relevance, 75 households in the Sebeya catchment’s flood-prone zones participated in a survey that included community knowledge. Two local coordinators of relief efforts in the model village, where flood-affected households were relocated for permanent residence, were among the primary informants considered. A field technician who monitors flood control infrastructure was also interviewed for this study as a significant informant. Respondents participated in the assessment of the environmental factors they perceive affected flooding and took part in identifying areas that were frequently flooded.
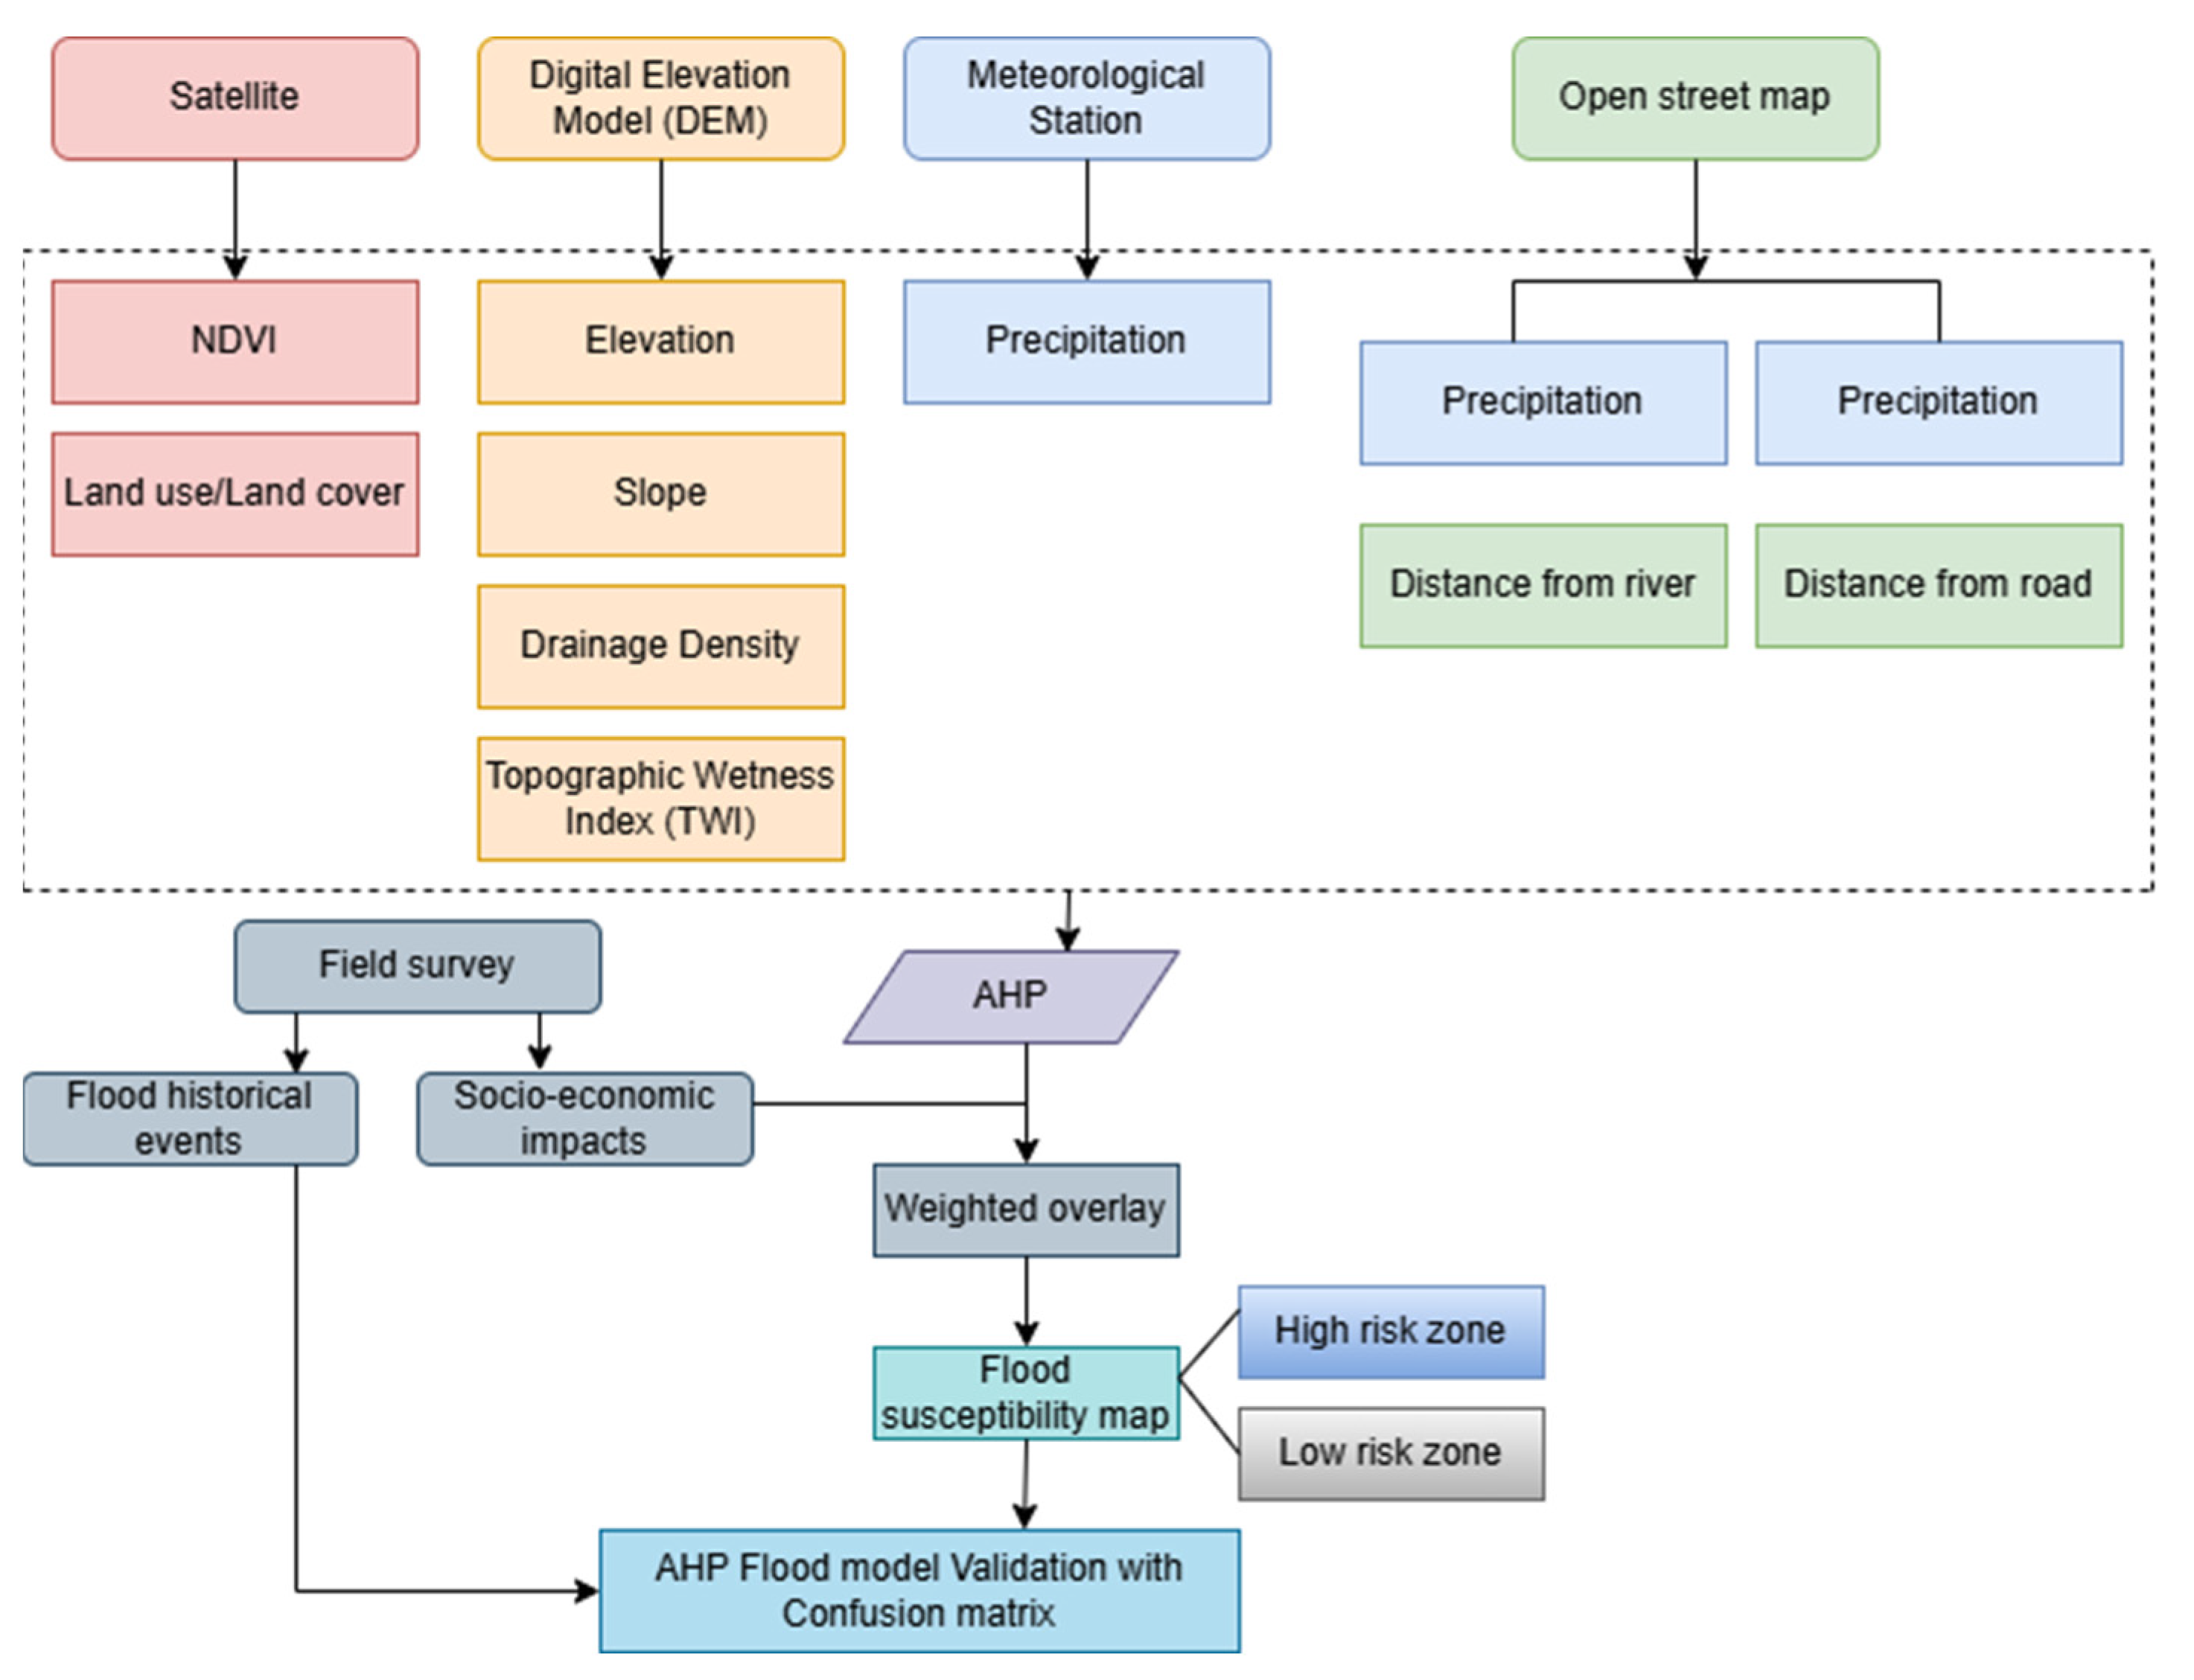
Rather than being used directly in the AHP computations, this local information was utilized to validate and improve the classification of the flood-conditioning factors, especially for land use, distance to rivers, vegetation cover, and topographic characteristics. The flood susceptibility map was then created using a GIS-based weighted overlay analysis using the final AHP weights. Figure 2 illustrates the methodology used in generating the flood susceptibility map of the catchment under this study.
Natural break (jenk) is an algorithm used to reassign values to raster or vector data based on specific criteria, helping to categorize data into meaningful or homogeneous classes [33]. It is one of the most widely used and precise algorithms for geographical environmental unit division. Since field verification cannot define the range of each class, we classified each geographical data layer into five categories using Jenks’ natural break algorithm [34]. In assigning weight to the ten factors of flood susceptibility in this study, precipitation, slope, drainage density, distance to river, and elevation have been given the highest weight since they are directly related to flooding in this area (Table 2). Historical floods demonstrate that rainfall in the short-rainy season causes the maximum discharges of rivers; locations close to the rivers and the highest drainage density are the most vulnerable to flooding. Land use/land cover and TWI were given a medium weight because they are important characteristics for floods that have less impact. They have a medium influence on floods and are mostly found in lowland parts with less slope and wetlands. Similar to this, road distance, soil type, and NDVI are given less weight because other criteria have overshadowed their significance.
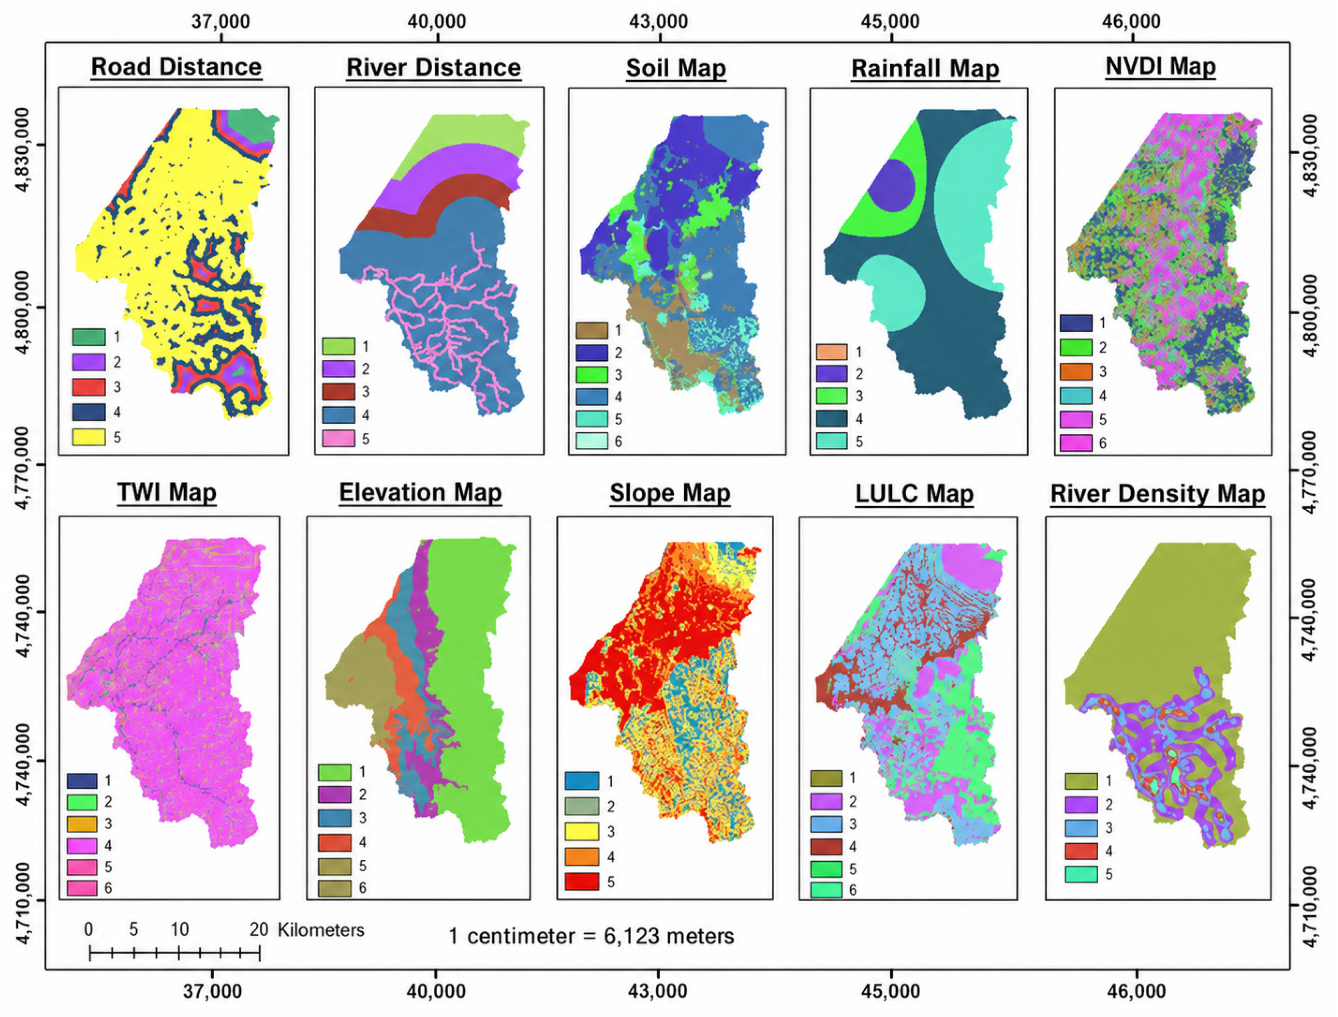
The ten flood susceptibility factors were mapped in this study (Figure 3). The TWI in this study was derived from the Digital Elevation Model (DEM) using ArcGIS Pro 3.5 [35]. Precipitation is among the primary causes of river flooding. Precipitation falling in the area determines the runoff that could be, and the area becomes more vulnerable to flooding as the runoff increases [36]. Rainfall data obtained from the meteorological stations near the Sebeya catchment were analyzed using the Kriging method, and the mean annual rainfall of these stations was calculated using yearly rainfall data from 1981 to 2021. Land use/land cover (LULC) is one of the key determinants of flood-prone areas. Urban areas with impermeable surfaces, such as roads and buildings, are particularly vulnerable to flooding, whereas places covered with vegetation have a higher rate of infiltration and are hence less vulnerable [37,38]. This study used supervised classification on Sentinel-2 imagery to categorize the land into five classes: bare land, agriculture, vegetation, water bodies, and settlement. The Normalized Difference Vegetation Index (NDVI) was determined to measure the difference between red light, which vegetation absorbs, and near-infrared light, which plants strongly reflect, to quantify the vegetation characteristics in a given area [39]. The range between −1 and +1, with a number close to +1, denotes vegetation that serves as flood protection [40].
Distance to the river (DR) is another factor that contributes to flooding because the river and its surrounding lands are the primary flood channel, making them extremely vulnerable [36]. The river network used in this investigation was derived from DEM data. The Euclidean function in the ArcGIS platform was used to determine the distance to each river. The distance to a road (DRO) influences the likelihood of flooding because the impervious surface grows close to the road, increasing the risk of flooding [41]. The Overpass-turbo was also used to retrieve the road network from Open-Street Map. The ArcGIS’s Euclidean function was used to calculate the distance from each road.
The ratio of the basin’s area to the entire drainage channel is known as the drainage density. A high drainage density (DD) increases the amount of water that accumulates in a given area, making it more vulnerable to flooding [42]. A drainage network was established in the study area by using the DEM and the Raster calculator tool in ArcGIS to create flow accumulation. The drainage density was then determined using the Line Density tool on this drainage network. The soil map was generated from a digital soil dataset for the study area and clipped to the Sebeya catchment boundary in ArcGIS to convert into a raster format using the Raster tool, with a spatial resolution of 10 m to match the other flood-conditioning factors. Finally, the soil classes were reclassified according to their relative susceptibility to flooding, producing the soil type raster used in the AHP analysis.

2.4. Analytical Hierarchy Process (AHP)

AHP is a multi-criteria decision-making approach that was created by Saaty in 1990 [24], with the goal of streamlining and enhancing the decision-making process. This approach allows planners and users to quantitatively determine a scale of preference derived from a collection of options [40]. The AHP applies the pairwise comparison approach to determine each criterion’s weight or priority vector [31]. The use of a pairwise comparison matrix (PCM) enables evaluating the relative weights of several criteria according to the expert’s assessment [27]. The flood-conditioning factor is prepared as a pairwise comparison matrix with n × n dimensions. Each of these separate flooding factors is given a value on a scale from 1 to 9, where a lower number of 1 indicates that both variables are equally important and a higher number of 9 indicates that the row factor in PCM is more essential than the column factor according to the Saaty scale [24] in Table 3.
This methodology created a pairwise comparison matrix of selected flood-conditioning factors of dimension 9 × 9 based on a variety of literature reviews. Each row is compared with each column element to determine the relative relevance for producing the rating score, and the diagonal elements are always equal to 1 in the pairwise comparison matrix displayed in Table 4 [43]. The normalized pairwise matrix and final weights, as indicated in Table 5, were calculated using the importance of each factor to the flood, the data from prior studies, and the expert’s judgment of those who have worked in floods in the past [44].
When calculating the value for a pairwise comparison matrix, there may be numerous discrepancies; therefore, the Consistency Ratio (CR) must be calculated as a consistency check [45]. The Consistency Ratio, which is the ratio of a matrix of the same size’s Consistency Index (CI) to Random Inconsistency Index (RI), must always be less than 0.1 in order to be considered acceptable for weighting [40].
Equation (1) was used to calculate the Consistency Index (CI).
C I = ( λ m a x n ) ( n 1 )
where n expresses the number of factors, and λ expresses the average value of the consistency vector. While calculating the CI, we determine the consistency vector (CV) by multiplying the original pairwise matrix (A) by the weight vector (w), and then divide each element of the consistency vector by the corresponding element in the weight vector (w) (Table 5). The λmax (Lambda Max) is calculated by considering the average of these values.
According to Formula (1), the Consistency Index (CI) measures the deviation from consistency, where n is the number of criteria (n = 10).
CI = (10.76 − 10)/(10 − 1) = 0.085
The Random Index (RI) is an empirically computed baseline value of inconsistency for completely random pairwise-comparison matrices of a given size (Table 6). It is used to normalize the consistency of a real decision maker’s matrix to verify whether the judgments made are acceptably consistent or inconsistent with random guessing. It is a constant that depends on the randomly sampled pairwise matrix (n).
For our example, n = 10, and therefore RI = 1.49.
Finally, the CR is calculated by comparing CI to the RI.
CR = 0.085/1.49 = 0.057. Since 0.057 ≤ 0.10, the consistency of our pairwise comparison matrix is acceptable. We can confidently use the derived weights for the rest of our AHP analysis.
In this study, ten factors were processed in ArcGIS software to discover flood risk susceptible zones. Table 2 states that each of the factor maps has been categorized into five different classes and transformed to a raster format of size. Using the weighted overlay technique, the sum of these outcomes was multiplied by the factor weight of each reclassified map layer. The overall map of flood susceptibility in the study area was produced by Equation (2).
F S = W i x i
where FS expresses flood susceptibility, w i as a factor weight, and x i represents the class of flood susceptibility for each factor i.
Each flood-conditioning factor was initially reclassified into five susceptibility classes (very low, low, moderate, high, and very high) using the Jenks natural breaks classification approach. The five-class scheme was selected because it preserves the natural distribution of each environmental variable while maintaining consistency with previous GIS-based flood susceptibility studies. After applying the AHP-derived weights through the weighted overlay analysis, a continuous flood susceptibility index was generated. For practical interpretation and decision-making, the resulting index was subsequently grouped into three operational susceptibility classes (low, moderate, and high) representing areas with relatively low, intermediate, and high flood susceptibility. This simplified classification facilitates communication of results to planners and disaster management authorities while retaining the essential spatial patterns of flood susceptibility.

2.5. Evaluation of Socioeconomic Impacts of Floods

The study used both quantitative and qualitative methodologies to evaluate the socioeconomic effects of flooding. The survey used a random sampling method on 75 households affected by recent floods in May 2023. The researcher obtained a recommendation letter from the district authority to use questionnaires and interviews with the affected communities relocated to a safe site. The questions mainly focused on assessing the impacts of flooding on livelihoods, the impacts of flooding on agricultural activities, the impacts of flooding on essential services, and the impacts of flooding on infrastructure. The data were processed and analyzed using SPSS v.30. Since the socioeconomic data were chosen to be part of the AHP methodology as well as pertinent information on flood impacts in the study area, the analysis did not consider advanced statistical tests such as Chi-square and logistic regression analysis.

2.6. Validation of Flood Susceptibility Map

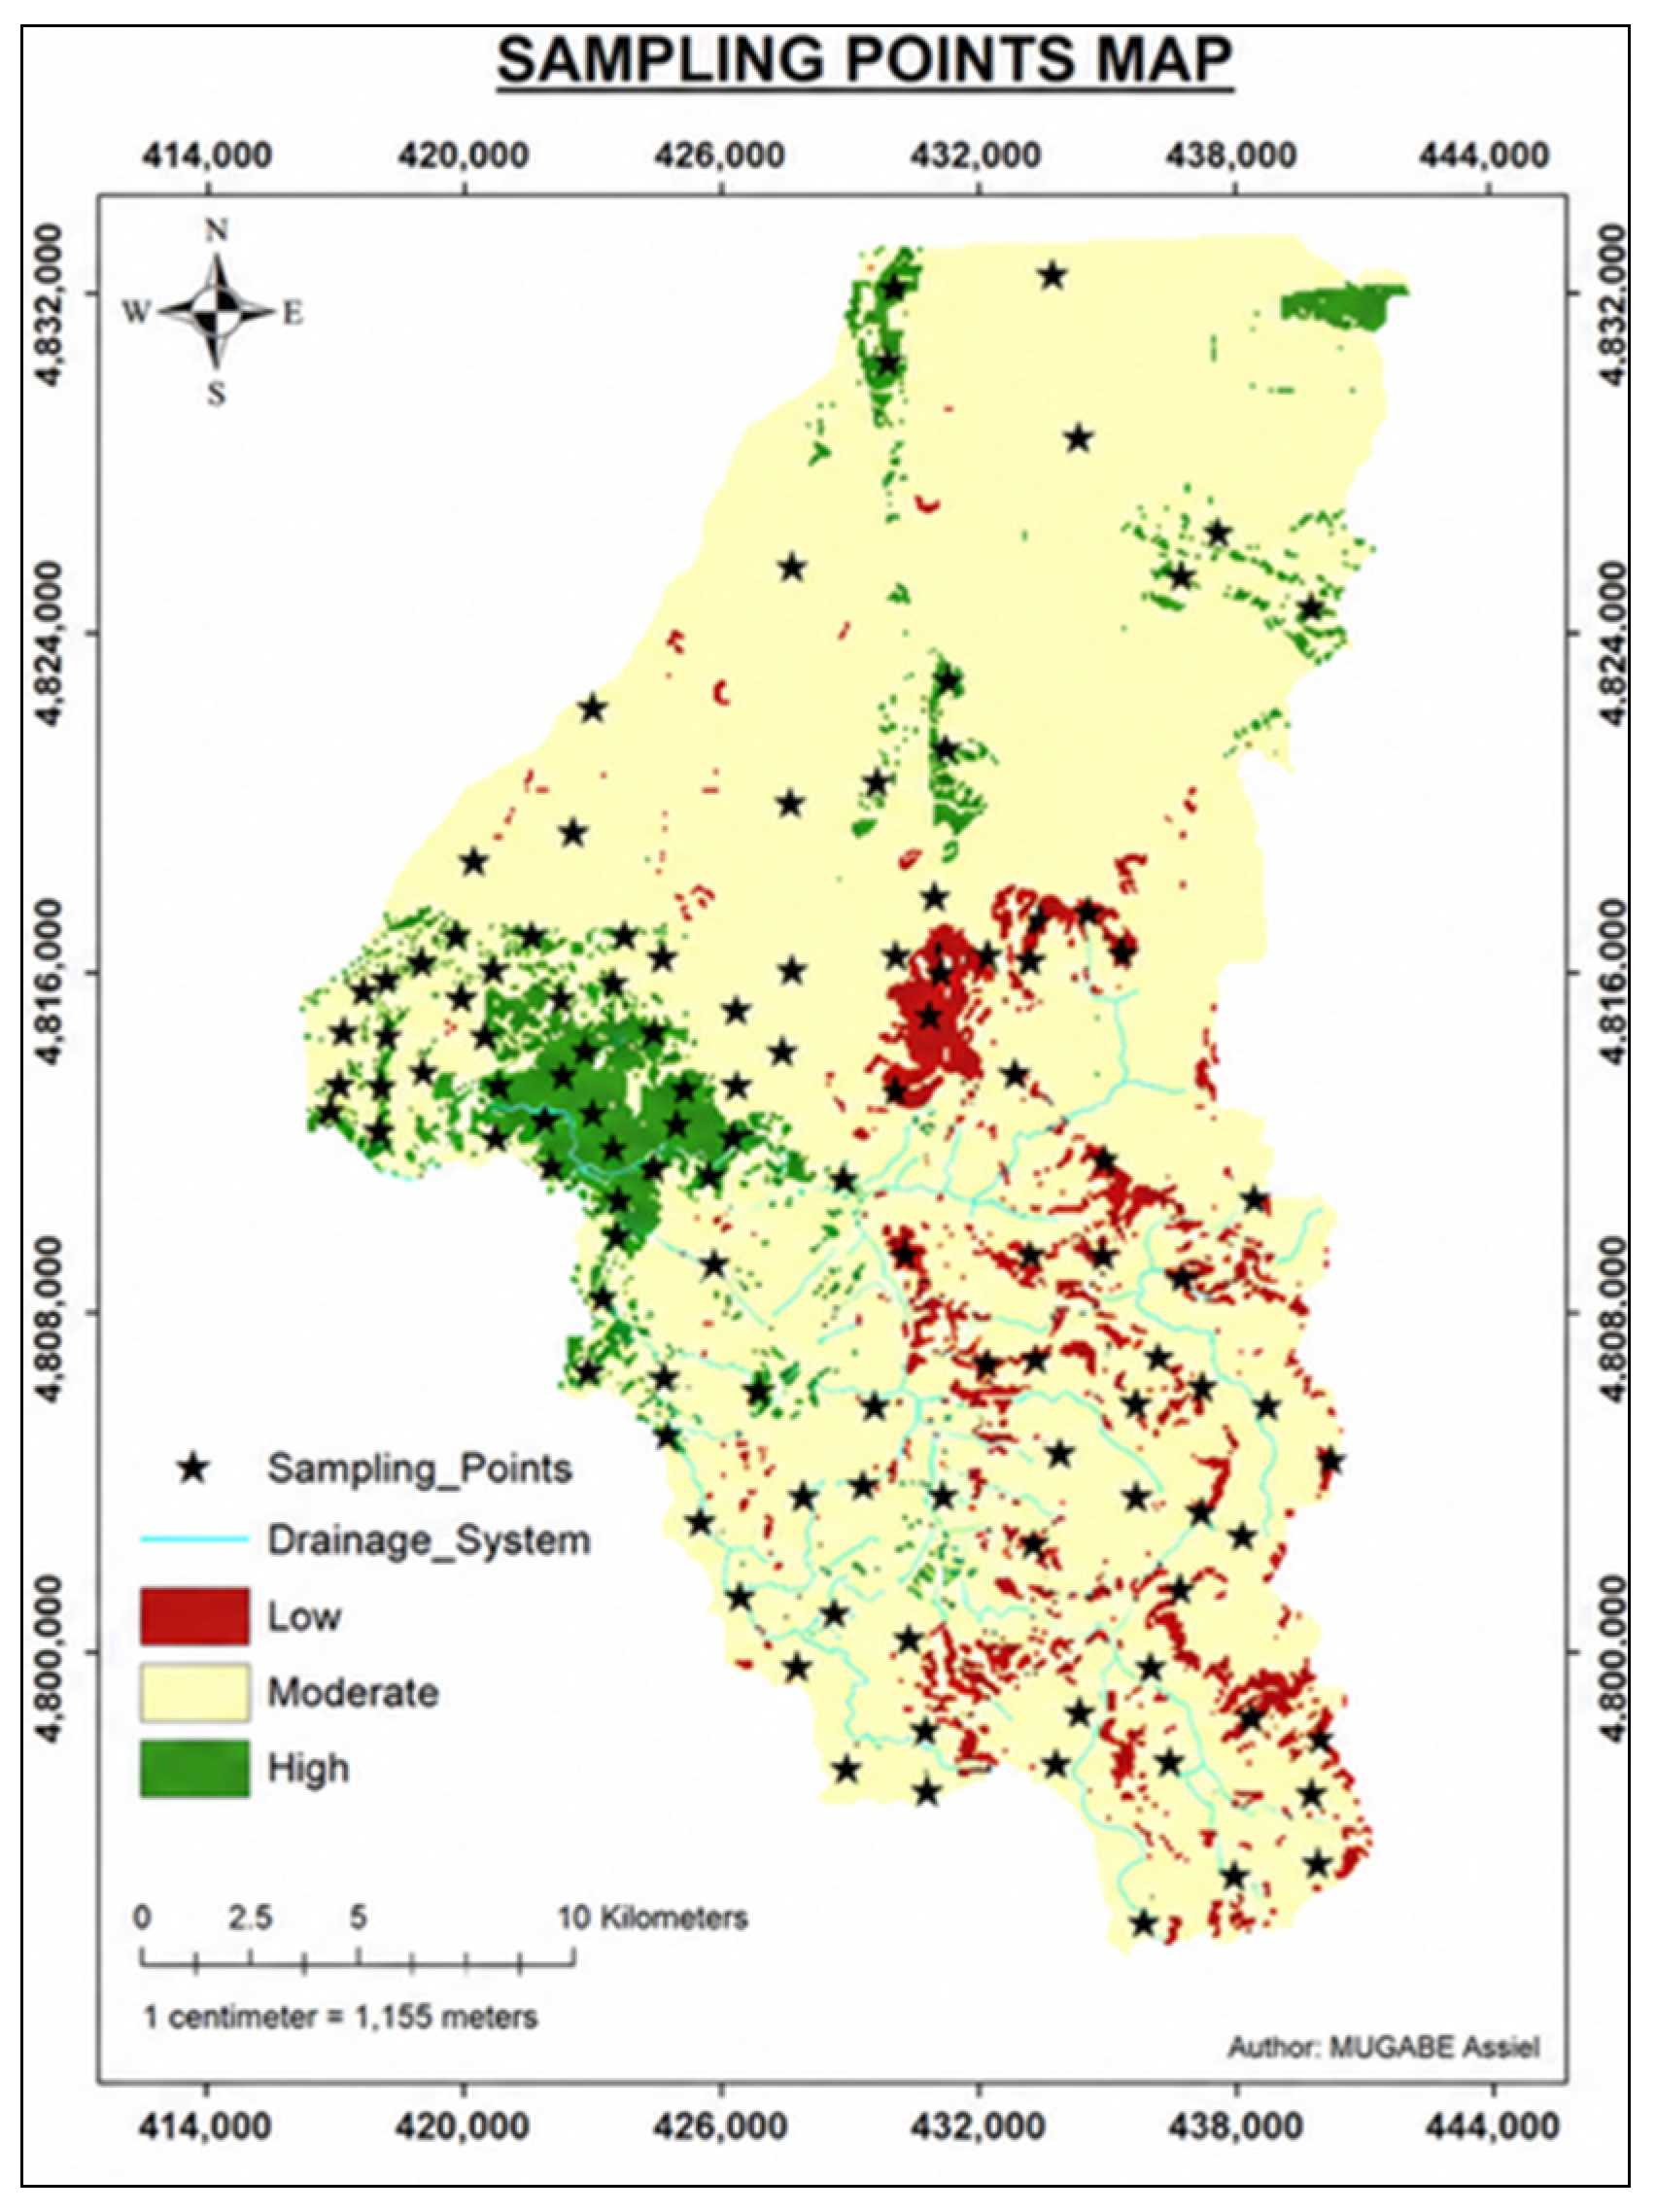
The flood susceptibility map was validated using the confusion matrix approach to quantitatively analyze the agreement between the predicted flood-prone areas and observed flood occurrence data [46]. The validation dataset consisted of an independent flood inventory gathered from field visit surveys, historical flood records, and reports from relevant local authorities. These flood occurrence points were not used during the model development, including the expert-based weighting of the flood-conditioning factors or the generation of the flood susceptibility map. Instead, they were reserved exclusively for model validation, ensuring an independent assessment of predictive performance. The validation points were selected based on verified flood events to represent documented flood locations distributed throughout the Sebeya catchment rather than being concentrated within a single location. Their spatial distribution encompasses the upstream, middle, and downstream zones of the catchment, reflecting the variety of features (topography, hydrology, and land use conditions) found in the study area. This spatial coverage reduces the possibility of spatial bias and offers a more accurate assessment of the model’s predictive capacity.
The flood inventory points were overlaid on the final flood susceptibility map in the GIS environment, and their predicted susceptibility classes were compared with the observed flood occurrences to construct a confusion matrix. From this matrix, the Overall Accuracy and Cohen’s Kappa coefficient were computed to quantify the agreement between the predicted susceptibility classes and the observed flood events. Together, these indices offer a strong statistical assessment of the reliability and predictive capabilities of flood susceptibility, supporting its use in flood susceptibility assessment and spatial planning.


3. Results

3.1. Flood Susceptibility Mapping

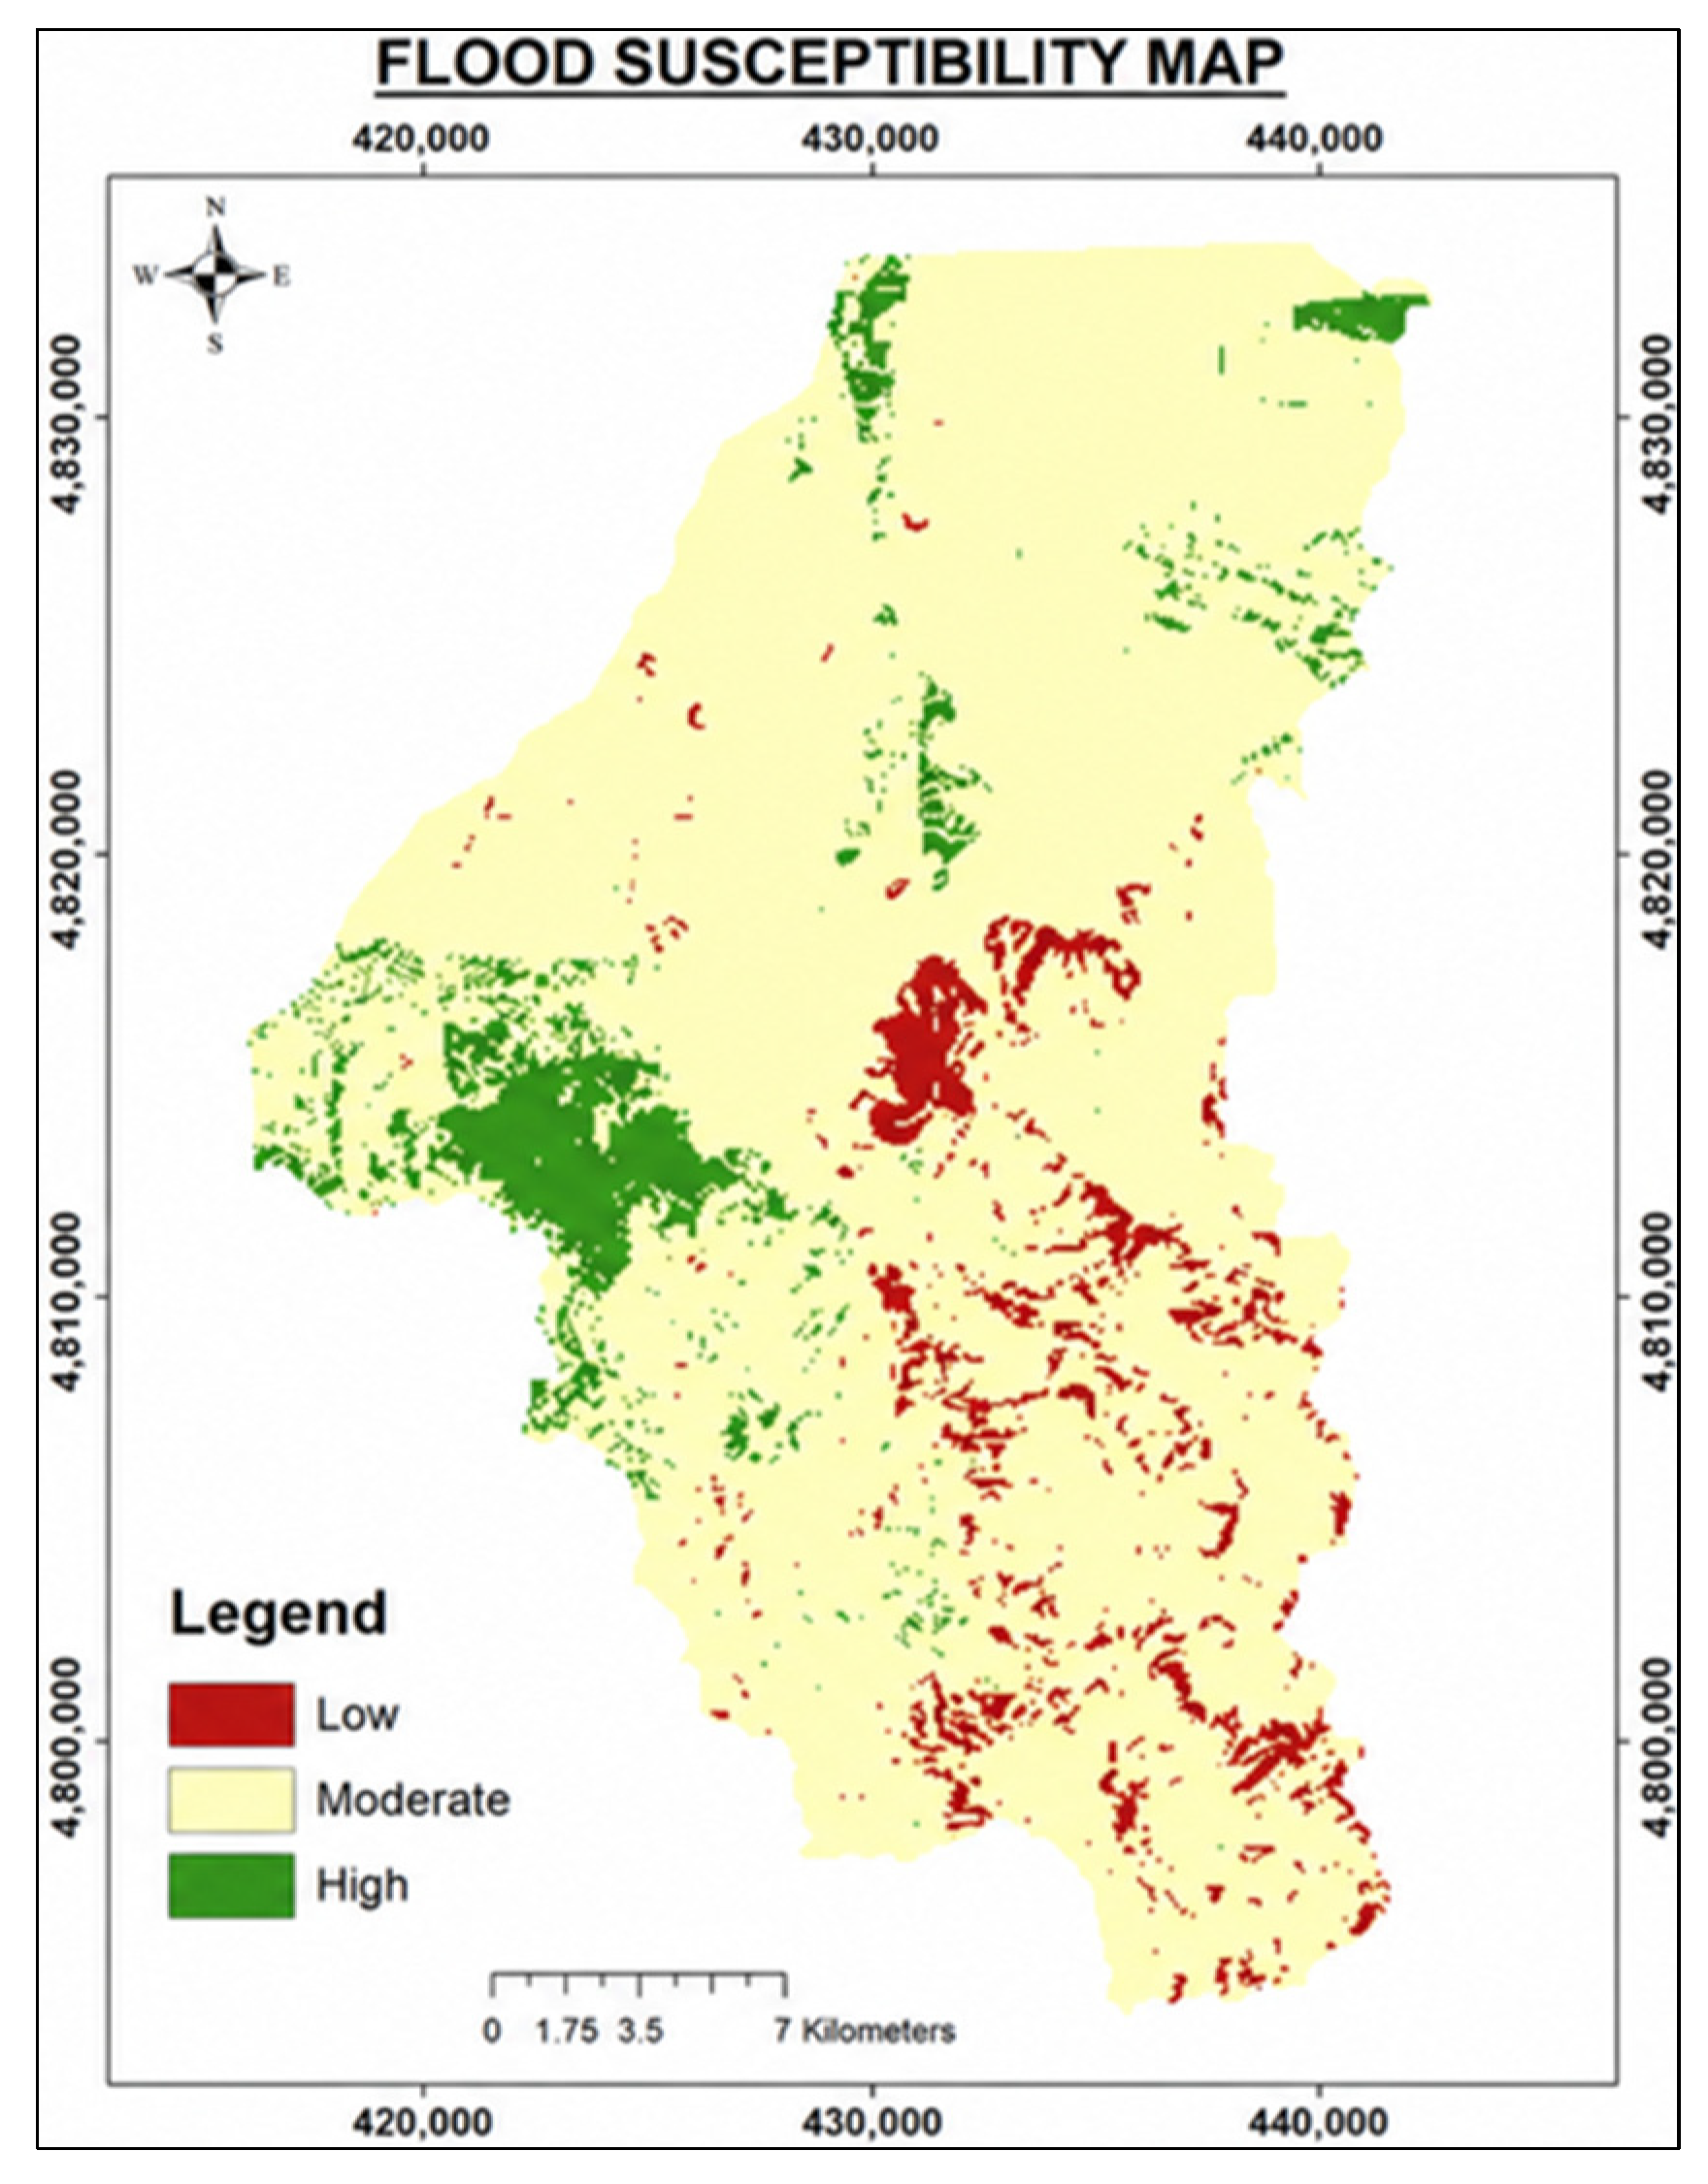
The flood susceptibility map generated using GIS-based Analytical Hierarchy Process (AHP) revealed that the Sebeya Catchment exhibits varying degrees of flood risk, ranging from low to high susceptibility (Table 7). The high-risk zones were predominantly concentrated along the Sebeya River and its tributaries, where the terrain is low-lying and characterized by high drainage density. These areas also coincide with regions experiencing high population density and intense agricultural activity, increasing their vulnerability to flood-related damages. Conversely, the least susceptible areas were found in the upper catchment, characterized by steep slopes, dense vegetation cover, and well-drained soils.
The flood susceptibility distribution highlights that the majority of the study area falls within the “Moderate” susceptibility category, covering 88.4% (539.15 km2) of the total area. It suggests that while a significant portion of the region faces some degree of flood risk, it is generally manageable. However, a substantial area (6.4% or 39.18 km2) is classified under “High” susceptibility, indicating that a considerable part of the land is at significant risk of flooding. The “Low” susceptibility category covers 5.2% (31.73 km2), meaning that a tiny portion of the area is relatively safe from floods. These high-risk locations are mostly found in the Sebeya river corridor and its tributary drainage network, especially in low-lying areas with high drainage density, gentle slopes, and a higher potential for surface water buildup. Geographically, these zones are mostly found in valley-bottom and downstream locations of sectors like Kanama, Nyundo, and Rugerero, where the proximity to the river system increases flood exposure. Additionally, the highly sensitive zones align with areas of increased human activity, such as agricultural fields, primarily in the Kanama sector’s valleys, and significant commercial hubs, such as Mahoko, Nyundo, and some trading areas that surround Rubavu town. The overlap between high flood susceptibility zones and populated/commercial areas increases potential impacts on livelihoods, infrastructure, businesses, and public services.
In particular, settlements and commercial activities located close to the Sebeya River are highly exposed because of their limited distance from the flood pathways (for example, buildings located between 0 and 50 m from the river bank in the Mahoko center). Therefore, although the high susceptibility zones represent a relatively small proportion of the catchment, their strategic importance is considerable due to their concentration of population, economic activities, and infrastructure. These findings highlight the need for targeted flood risk reduction measures, including improved urban drainage systems, protection and restoration of river buffers, enforcement of flood-sensitive land use planning, and early warning systems in the most exposed sectors and commercial areas.

3.2. Flood Susceptibility Validation with Standard Error Matrix

The flood susceptibility classification model performed remarkably well in differentiating between low, moderate, and high susceptibility groups, according to the accuracy evaluation results (Table 8). With an overall classification accuracy of 99% and a Kappa statistical value of 0.972, the model indicates a level of agreement that is much higher than what would be predicted by chance. Both user and producer accuracy rates surpassing 90% across all classes suggest that the mapped susceptibility patterns strongly agree with field observations and historical flood data (Figure 4). These accuracy indicators confirm that the generated flood susceptibility map (Figure 5) is reliable and suitable for practical applications in risk mitigation, spatial planning, and policy decision-making.

3.3. Socioeconomic Impacts of Flood in the Sebeya Catchment

To complement the spatial flood susceptibility assessment, this study evaluates the socioeconomic impacts of flood events on affected communities in the Sebeya catchment. The household survey was conducted among communities located within highly susceptible areas, particularly those affected by the recent 2023 flood events. These floods caused substantial impacts on livelihoods, agricultural activities, businesses, and residential properties.
The surveyed 75 households represent communities with direct experiences of flood hazards, including residents who remained in their original flood-prone locations and those who were relocated to a model village established for permanent resettlement after flood impacts. Therefore, the socioeconomic findings provide a crucial ground-based perspective for validating and interpreting the spatial patterns of flood susceptibility identified in the study area.

3.3.1. Impact of Flood on Livelihood

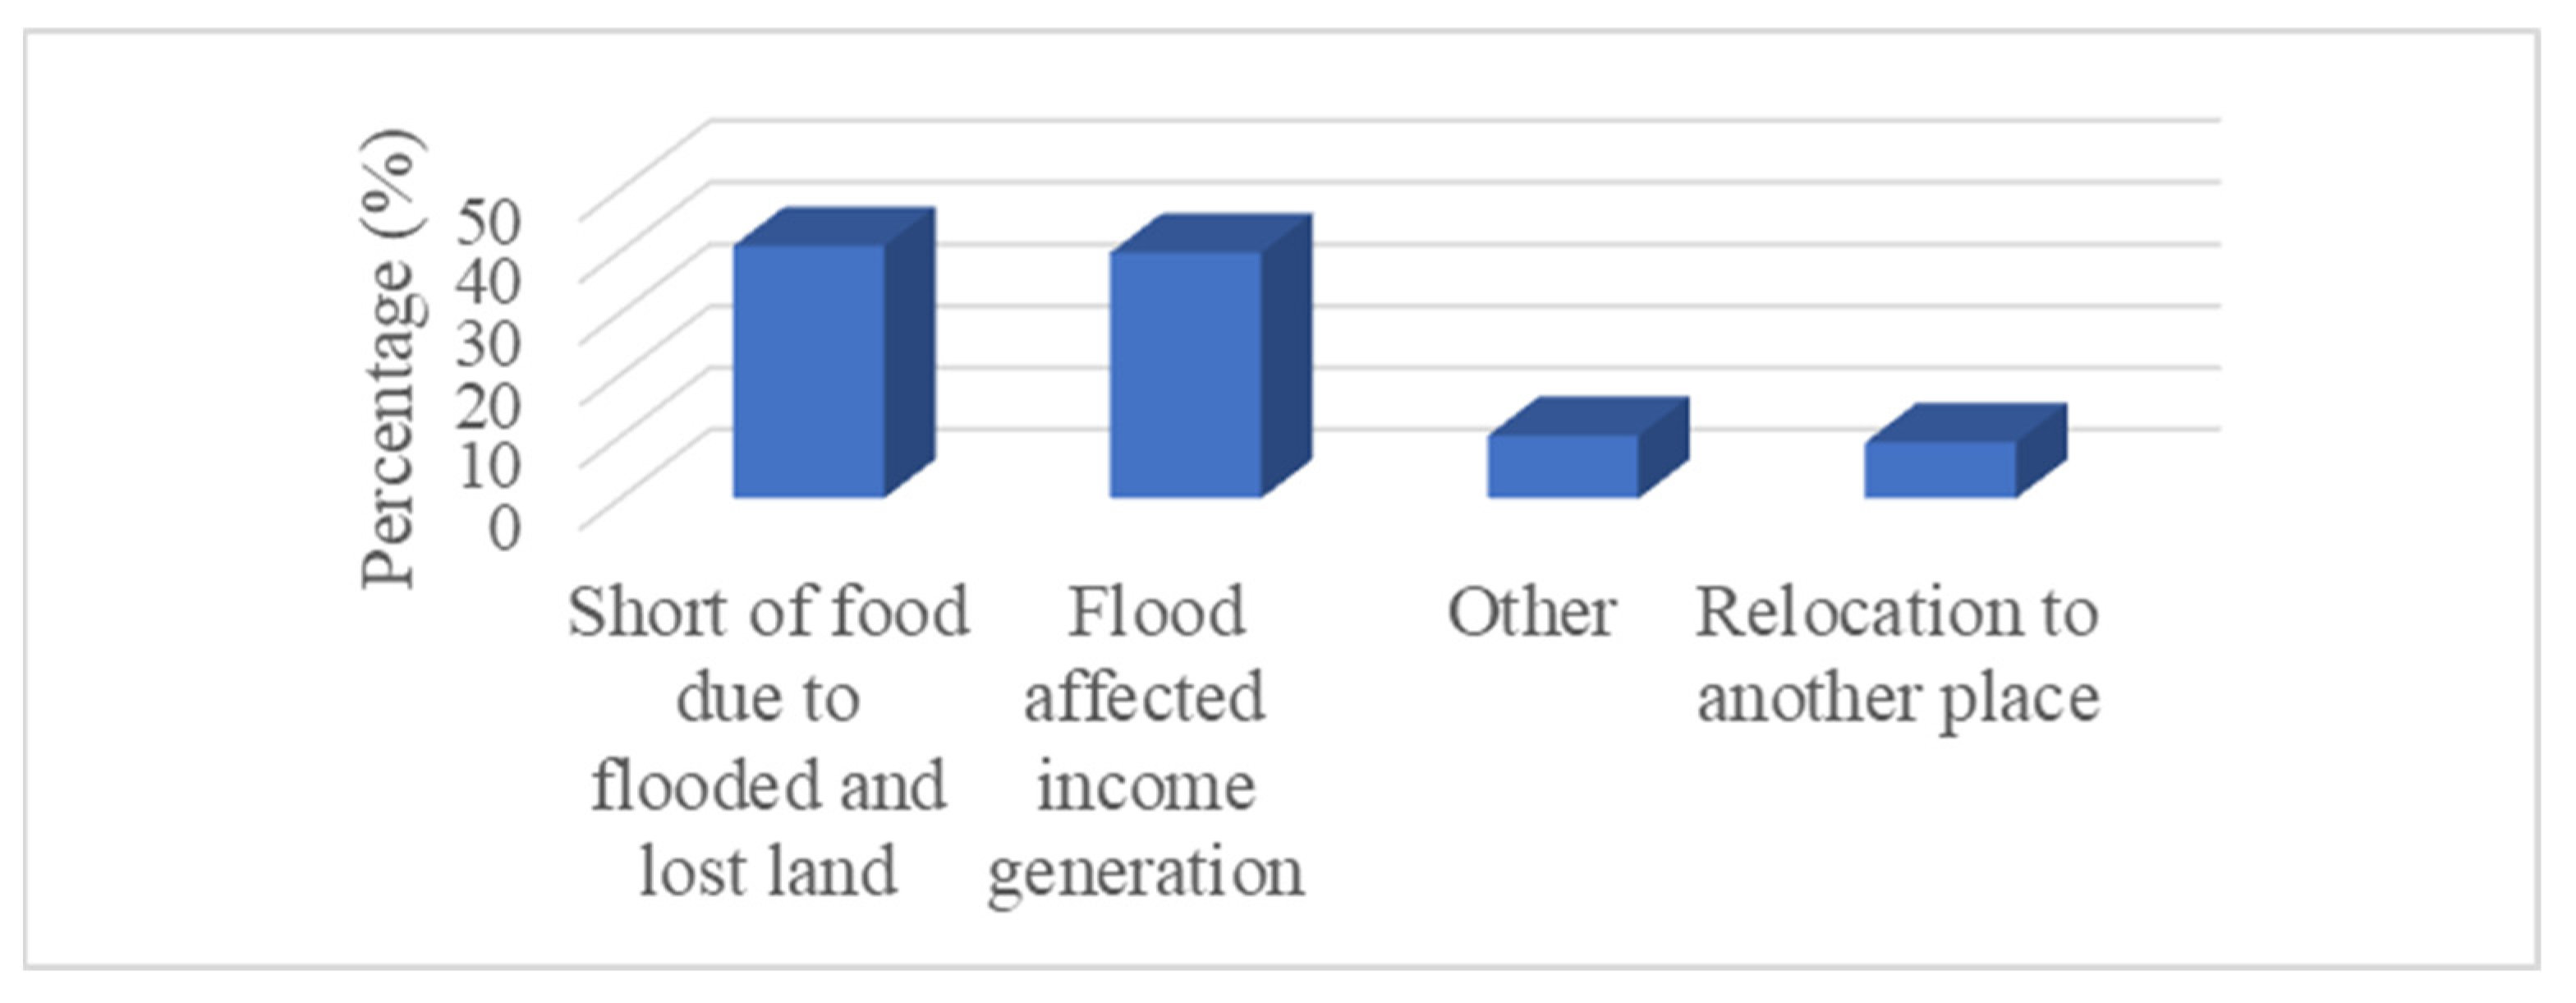
In the current study, we assessed the respondents’ views on the impacts of flood on their health; Figure 6 highlights the significant flood impact on livelihoods within the affected region. The most prominent consequence is food shortages due to flooded and lost agricultural land, affecting 40.9% of people. It indicates that agriculture, a significant source of food and income, is highly vulnerable to flooding, leading to food insecurity. Additionally, 39.8% of respondents reported that flooding affected their income generation, showing that not only farmers but also other workers relying on local businesses, trade, and services are financially impacted. 10.2% of the population experienced other effects, which could include health issues, infrastructure damage, and disrupted education. Lastly, 9.1% of the affected individuals had to relocate due to severe flood conditions, indicating displacement and loss of homes. These findings underscore the urgent need for flood mitigation measures to protect livelihoods, ensure food security, and support economic resilience in flood-susceptible areas.

3.3.2. Flood Impact on Livelihoods

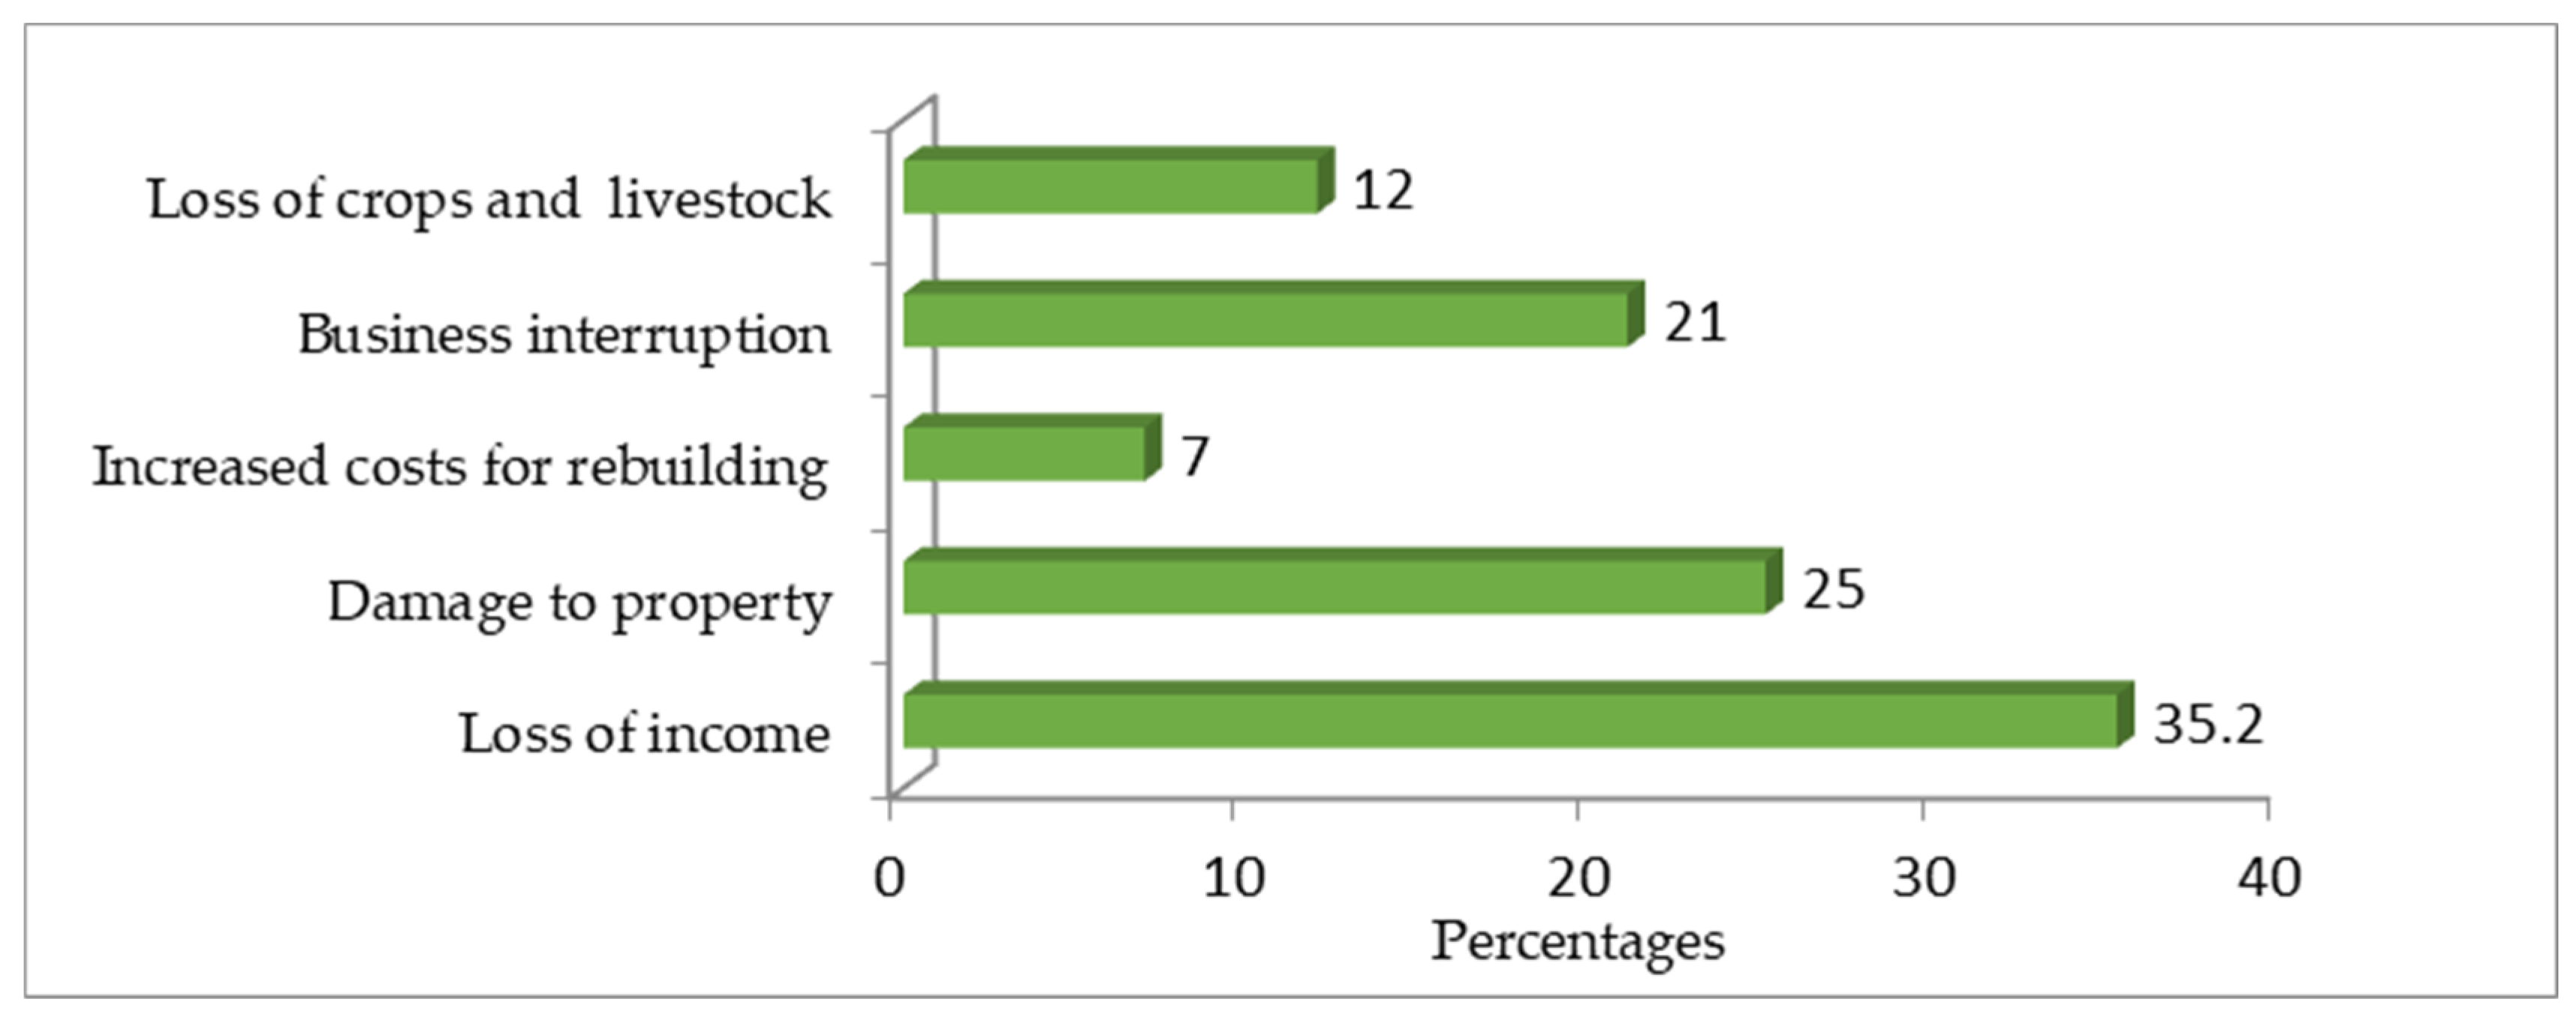
Figure 7 indicates that the economic flood impacts within the Sebeya catchment are severe, affecting multiple sectors, with loss of income (35.2%) being the most significant consequence. It highlights how floods disrupt livelihoods, especially for those dependent on agriculture, small businesses, and daily wages. Many people lose employment opportunities due to damaged workplaces and infrastructure, reducing household earnings and increasing financial insecurity. Additionally, business interruption (21.0%) further worsens the situation, as markets, shops, and enterprises are forced to close temporarily or permanently due to water damage, supply chain disruptions, and reduced customer access. These economic setbacks create long-term challenges, delaying recovery and limiting community resilience against future floods.
Besides direct income loss, flooding leads to property damage (25.3%), increased costs for repairs and rebuilding (6.8%), as well as placing a heavy financial burden on affected households and businesses. Homes, shops, roads, and other infrastructure suffered extensive destruction, requiring significant investments for reconstruction. Furthermore, the destruction of crops and loss of livestock (11.7%) weakens food security and the agricultural economy, reducing farm productivity and escalating food prices. These combined economic impacts underscore the urgent need for proactive flood mitigation strategies, such as flood-resistant infrastructure, improved drainage systems, and financial support mechanisms like insurance and emergency relief programs to help communities recover and build resilience. Various studies have demonstrated the economic impacts of flooding in different regions around the world [47,48].

3.3.3. Impacts of Flooding on Agricultural Activities

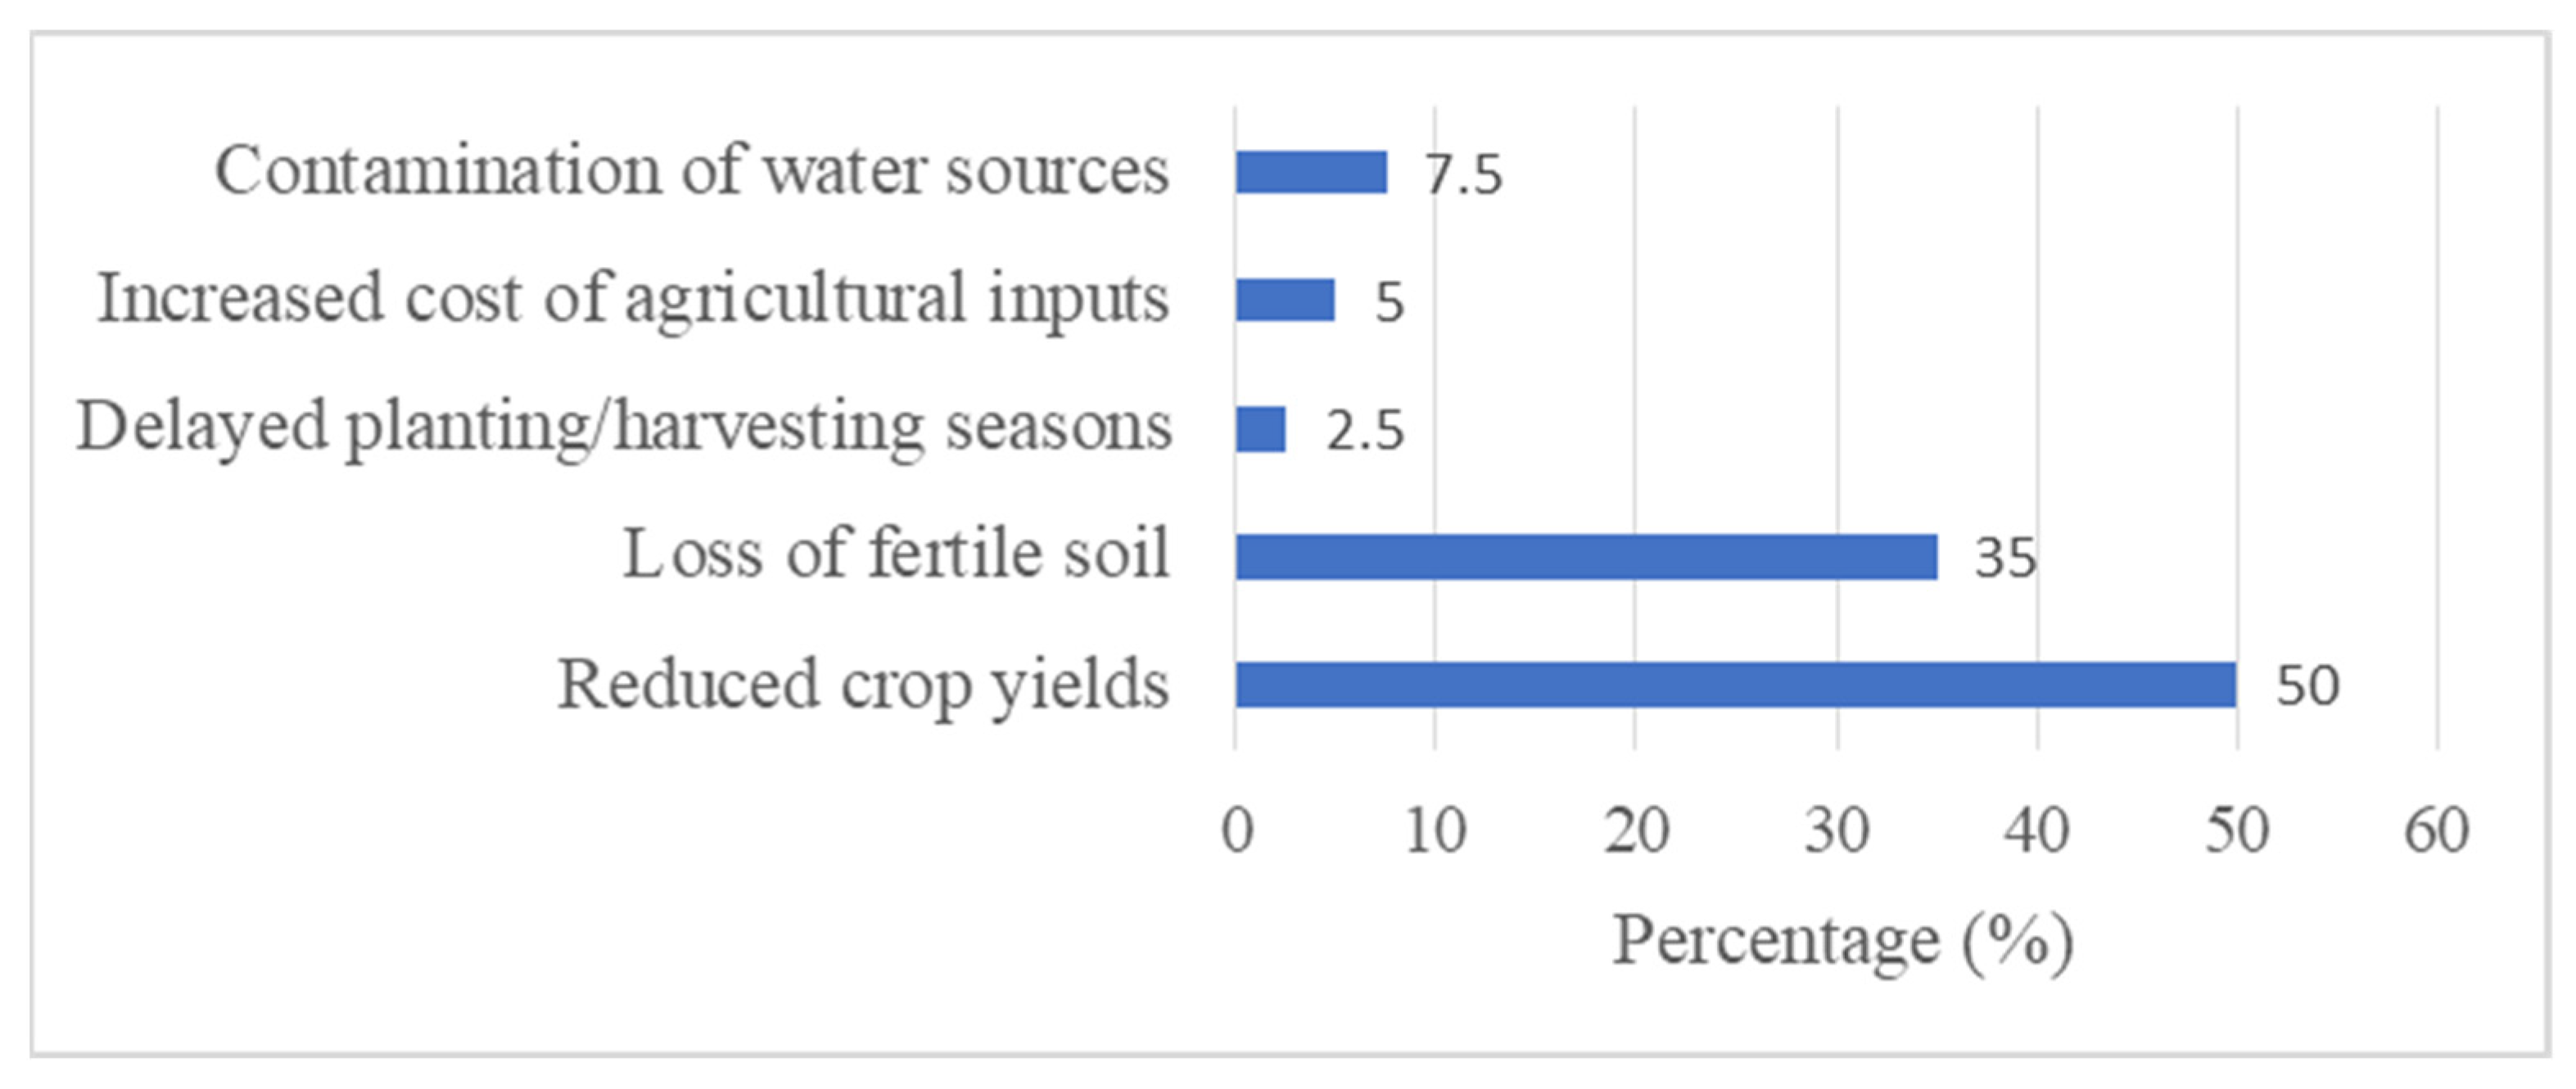
Figure 8 highlights that flooding has a devastating impact on agricultural activities in the Sebeya Catchment, with reduced crop yields (50.0%) being the most significant consequence. It indicates that prolonged waterlogging, soil erosion, and crop destruction severely affect food production, leading to food insecurity and economic instability for farmers. Additionally, the loss of fertile soil (35.0%) further worsens agricultural productivity, as floods wash away nutrient-rich topsoil essential for crop growth. Without proper soil conservation measures, the long-term viability of farming in the region is threatened, requiring farmers to invest in soil restoration efforts such as terracing and reforestation to mitigate further losses.
Other impacts of flooding on agriculture, though less prominent, still contribute to production challenges. Contamination of water sources (7.5%) poses a serious risk, as polluted irrigation water can damage crops and spread plant diseases, reducing overall yields. Additionally, increased cost of agricultural inputs (5.0%) burdens farmers to purchase fertilizers, pesticides, and improved seeds to restore productivity. Delayed planting and harvesting seasons (2.5%) also contribute to instability, as unpredictable weather patterns disrupt traditional farming cycles. These findings highlight the urgent need for improved flood mitigation measures, such as sustainable land use planning, better drainage infrastructure, and farmer support programs, to protect agricultural livelihoods in the Sebeya Catchment.

3.3.4. Impacts of Flooding on Access to Essential Services

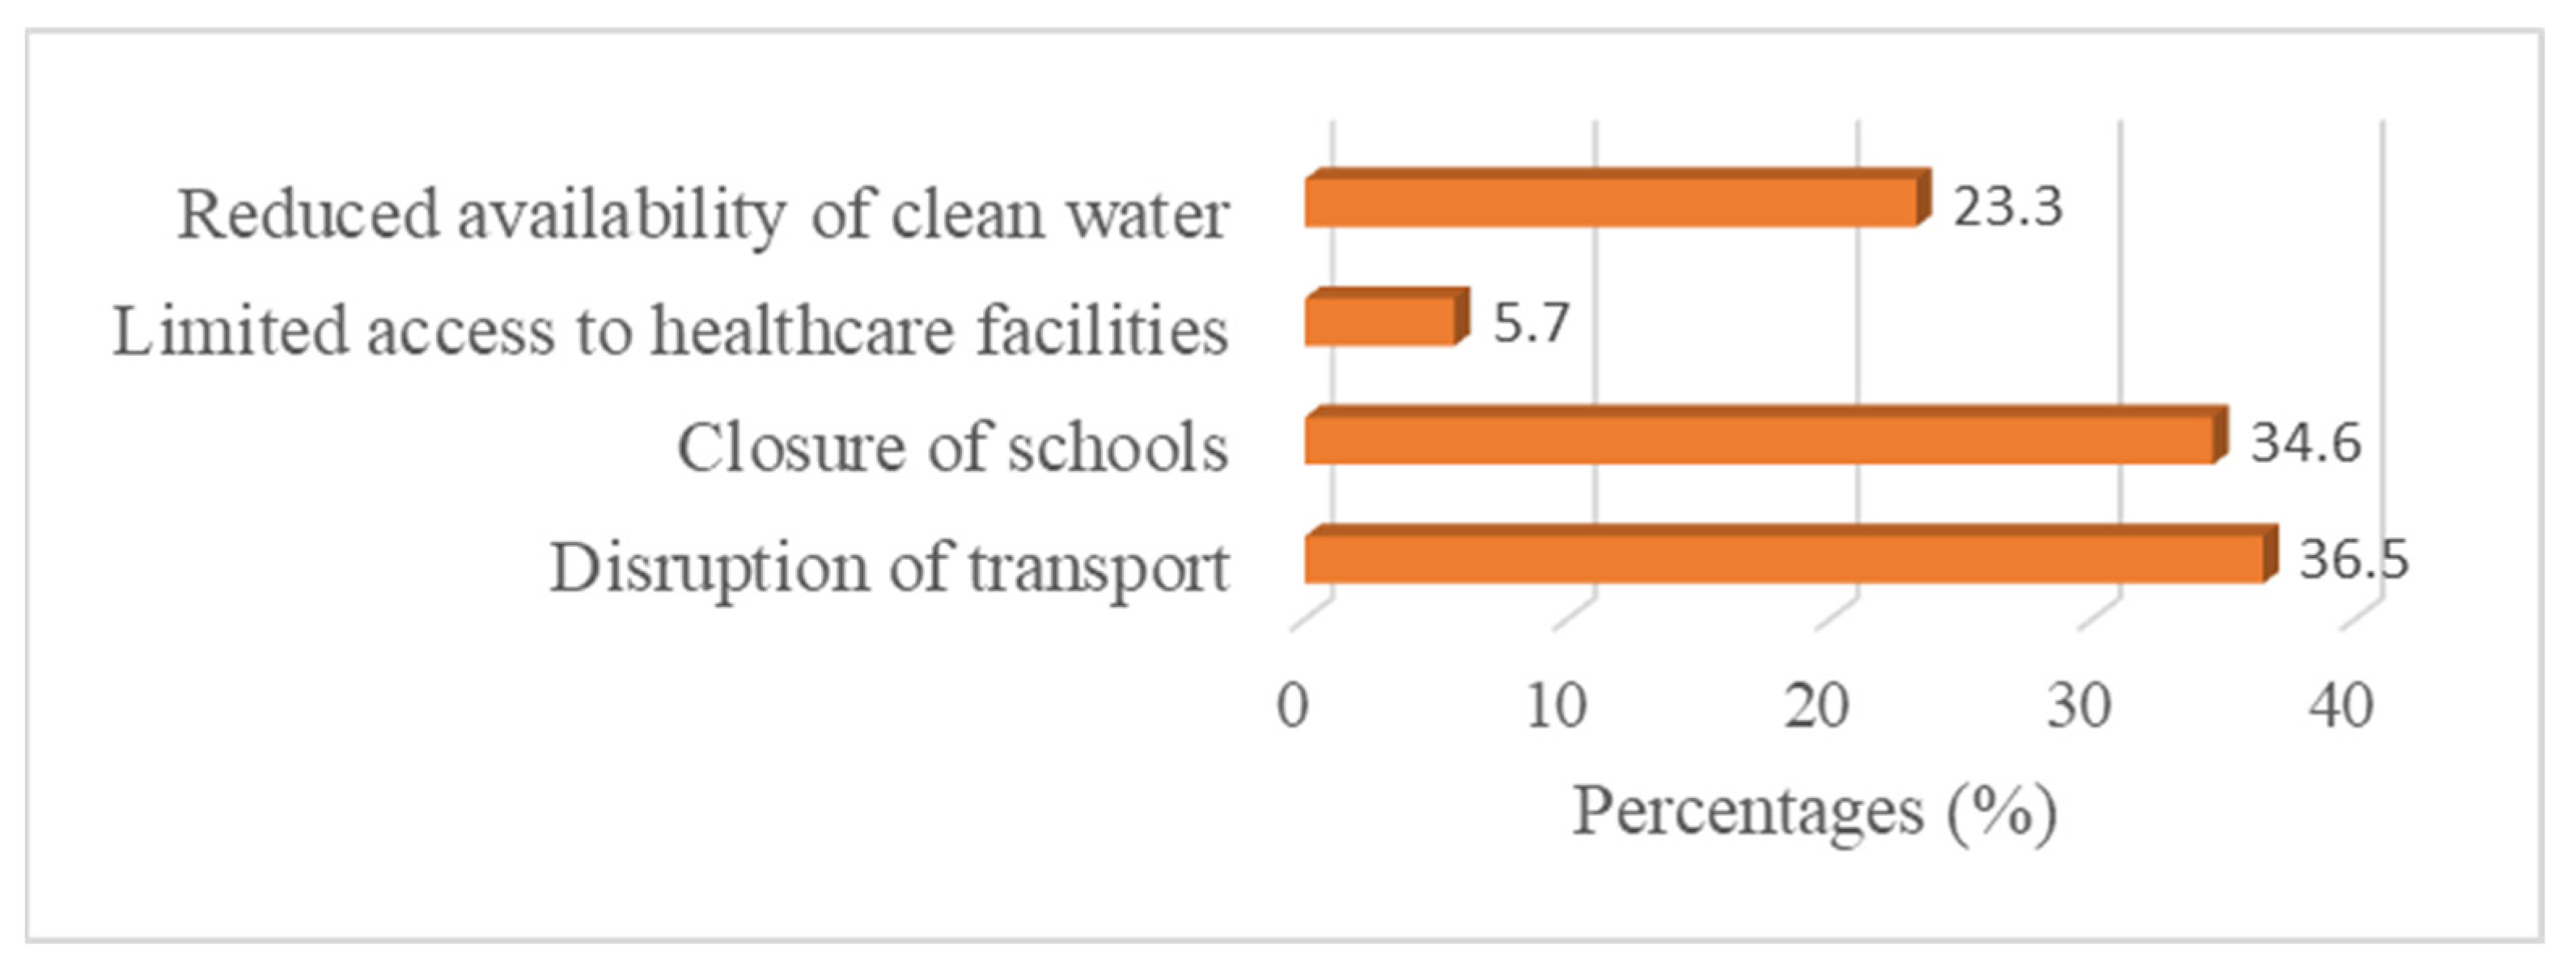
Flooding significantly disrupts access to essential services in the Sebeya Catchment (Figure 9), with transportation disruptions (36.5%) being the most affected sector. Flooded roads and damaged bridges hinder movement, temporarily preventing residents from reaching markets, workplaces, and emergency assistance. Similarly, school closures (34.6%) pose a significant challenge, as flooded schools and impassable roads prevent students from attending classes, leading to learning disruptions. Additionally, the reduced availability of clean water (23.3%) highlights a critical health risk, as floods contaminate water sources, increasing the spread of waterborne diseases. Limited access to healthcare facilities (5.7%) further exacerbates the situation, as damaged infrastructure and transportation barriers prevent timely medical assistance. These impacts emphasize the need for resilient infrastructure, emergency response systems, and long-term flood mitigation measures to ensure continuous access to essential services.

3.3.5. Impacts of Flooding on Infrastructure

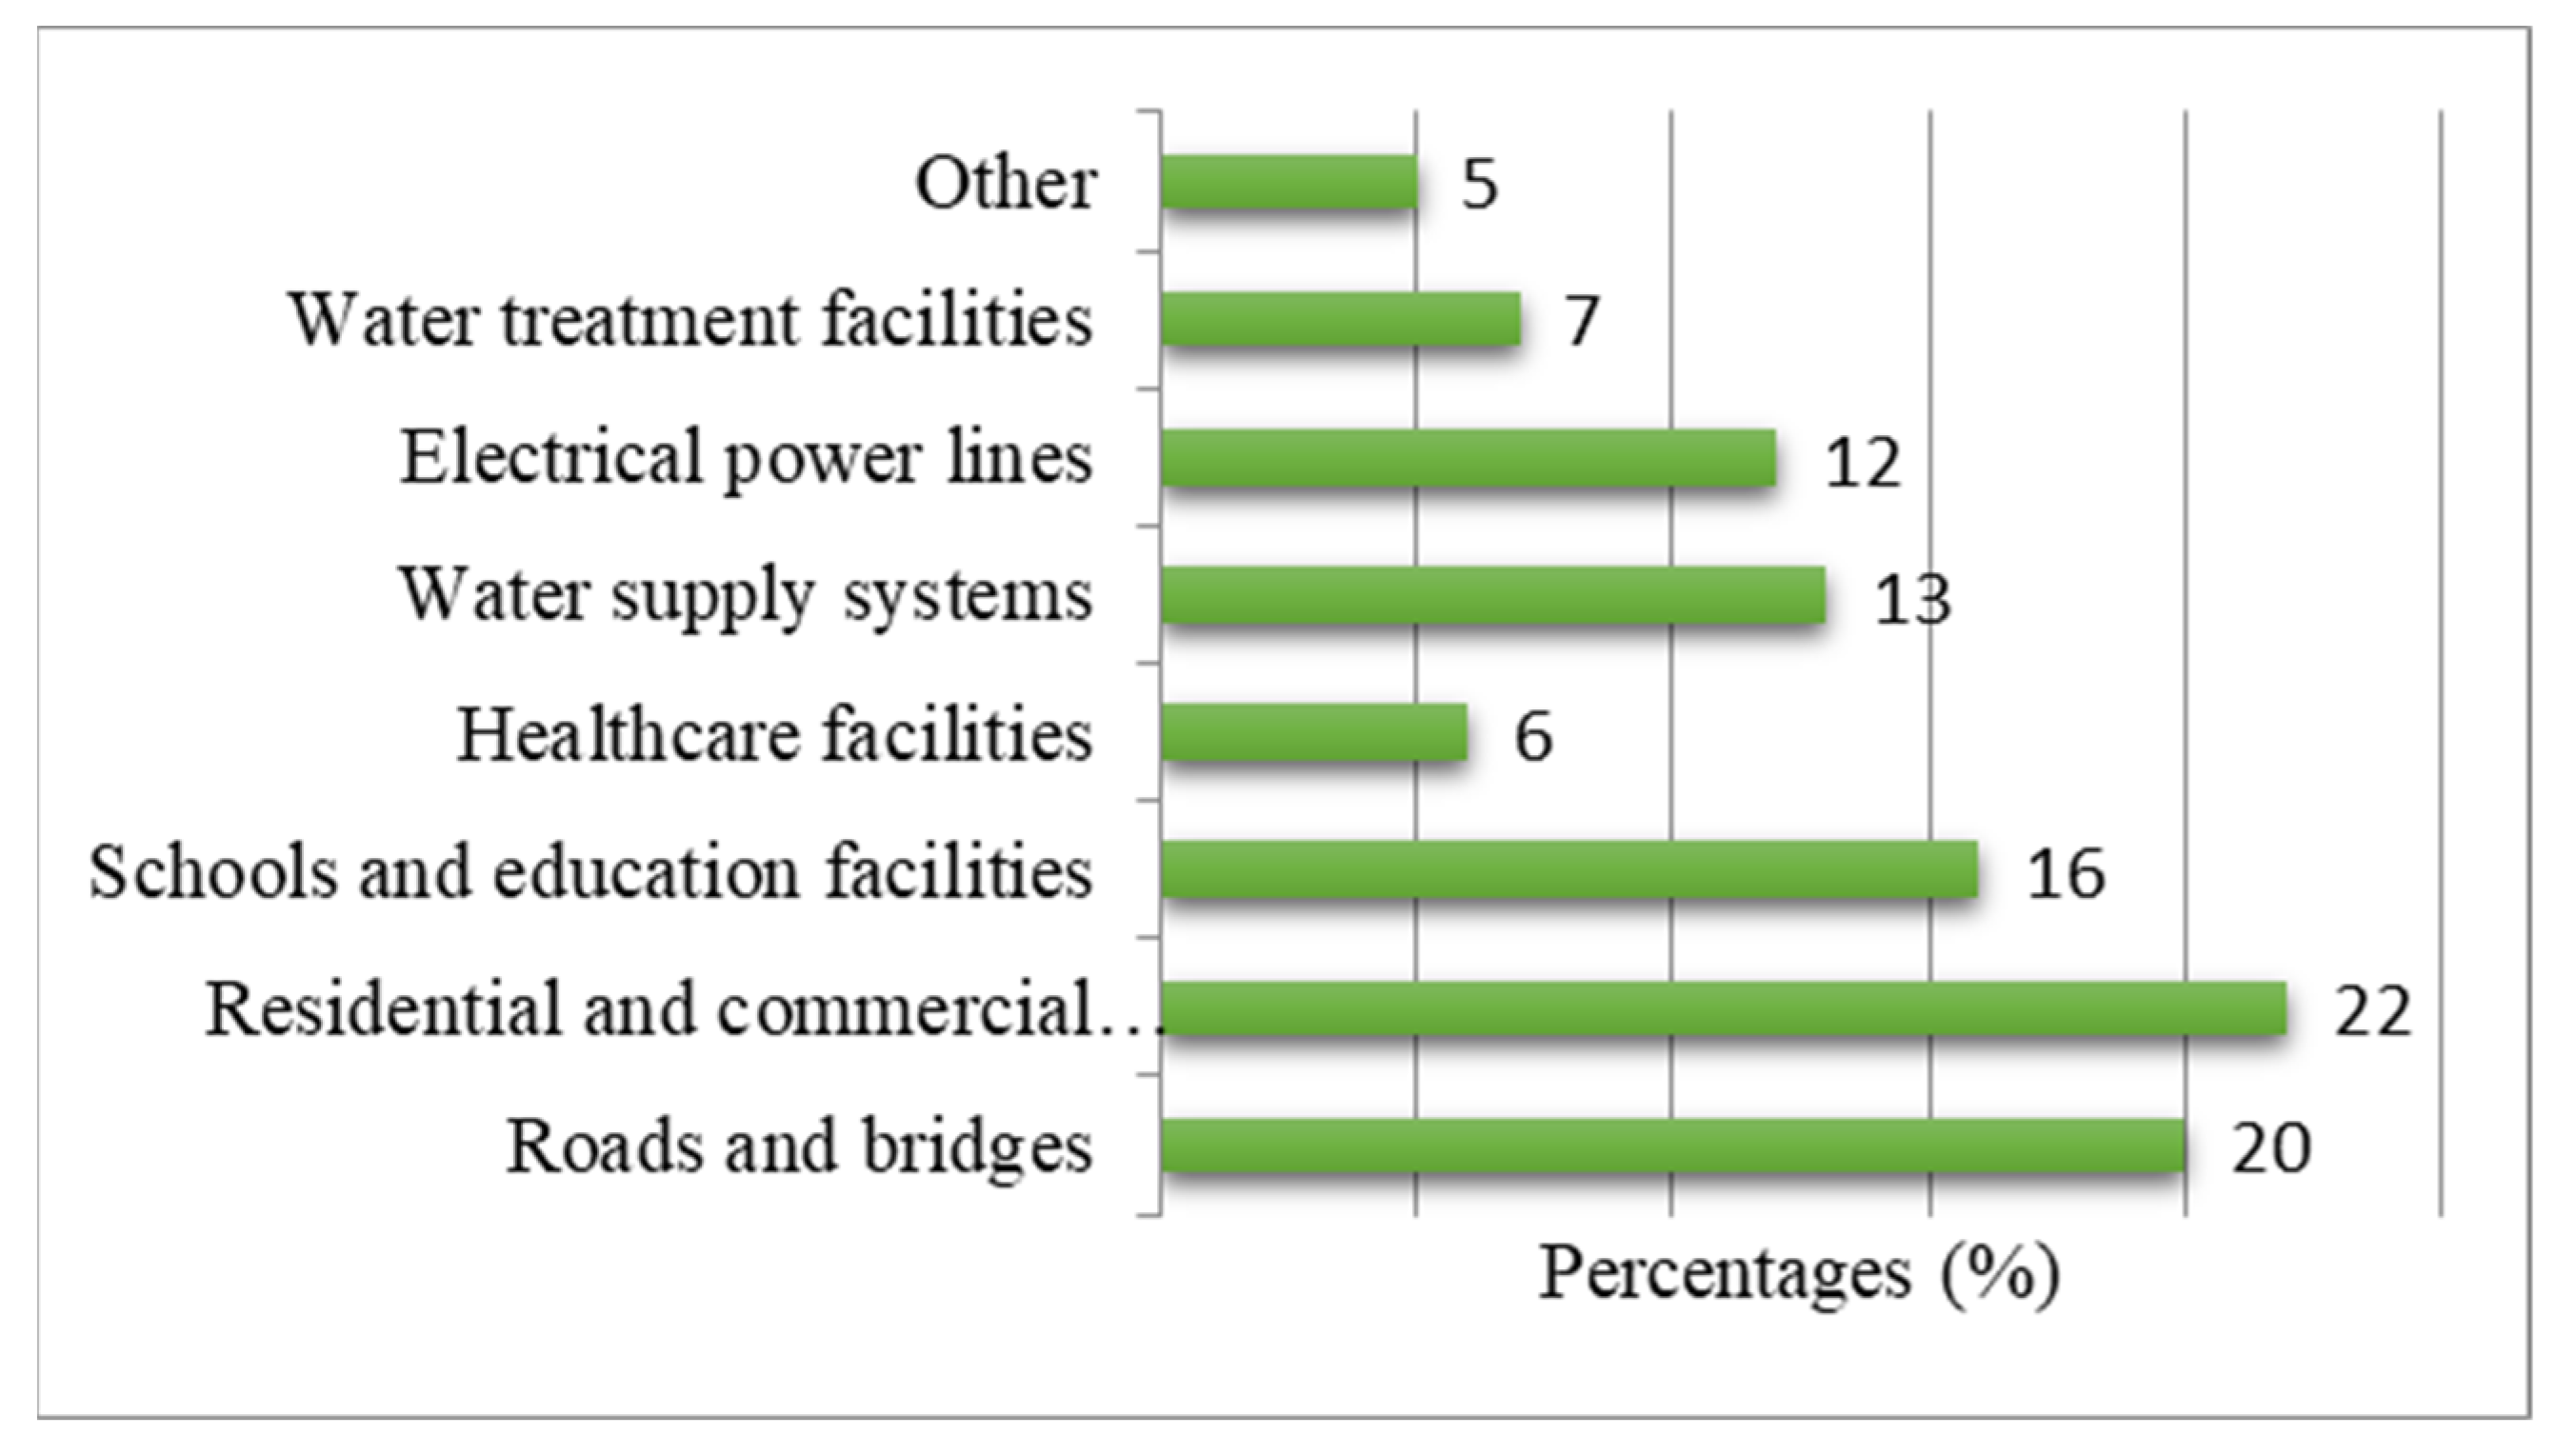
As mentioned in Figure 10, the results showed that flooding has a widespread impact on infrastructure in the Sebeya Catchment, with residential and commercial buildings (21.6%) and roads and bridges (20.4%) being the most affected. Floodwaters weaken the foundations of buildings, causing structural damage and, in some cases, destruction, leaving families and businesses displaced. The disruption of roads and bridges severely affects transportation, hindering the movement of people, goods, and emergency response teams. It not only isolates communities but also slows economic activities, making recovery efforts more difficult.
Similarly, schools and education facilities (15.5%) suffer damage, leading to prolonged closures and negatively affecting students’ learning opportunities.
Other essential infrastructure systems are also significantly impacted. Water supply systems (12.8%) and electrical power lines (12.0%) are highly vulnerable, with floods contaminating clean water sources and damaging power networks, resulting in water shortages and electricity blackouts. Water treatment facilities (7.0%) also face operational challenges, increasing the risk of waterborne diseases. The damage to healthcare facilities (5.8%) further compounds the crisis, as limited medical services reduce the community’s ability to respond to injuries and disease outbreaks. These impacts highlight the urgent need for climate-resilient infrastructure, improved drainage systems, and investment in flood-resistant building designs to minimize future flood-related disruptions.

4. Discussion

4.1. Relative Importance of Flood-Conditioning Factors

The GIS-AHP analysis conducted in this study identified rainfall as the most influential conditioning factor controlling flood susceptibility in the Sebeya catchment, accounting for 23% of the overall weight. This finding is consistent with the hydrological processes governing flood generation in steep tropical catchments, where intense precipitation represents the primary trigger of runoff generation and subsequent flooding [49]. Unlike lowland basins in which flood occurrence may be strongly influenced by river hydraulics or prolonged water storage, flood events in the Sebeya catchment are predominantly initiated by short-duration, high-intensity rainfall that rapidly exceeds infiltration capacity, producing overland flow and channel discharge. Previous studies have similarly reported rainfall as the dominant predictor of flood susceptibility in mountainous watersheds because it directly controls runoff production, peak discharge, and flood frequency [50].
The dominance of rainfall in the present study is further supported by the climatological characteristics of the western region of Rwanda. The Sebeya catchment experiences abundant annual rainfall that frequently exceeds 1400 mm, with seasonal storms capable of producing exceptionally high rainfall intensities. Recent flood disasters within the catchment have repeatedly been associated with extreme rainfall events that generated rapid rises in river discharge and widespread flooding. Consequently, assigning the highest weight to rainfall reflects both the physical hydrological processes operating within the catchment and the documented history of flood occurrence.
The second-most influential factor was slope (15%). Although steeper slopes generally facilitate rapid drainage and may reduce local water accumulation, in mountainous environments such as the Sebeya catchment they substantially increase runoff velocity and shorten the concentration time of rainfall-generated flow [51].The upper parts of the catchment are characterized by steep terrain where rainfall is rapidly converted into surface runoff before infiltration occurs. This process accelerates downstream flow accumulation and contributes to flash flooding along the main river channel. Similar findings have been reported in mountainous catchments across East Africa and South Asia, where slope has consistently emerged as one of the principal flood-conditioning factors [52]. The relatively high importance assigned to slope therefore reflects the geomorphological setting of the Sebeya catchment rather than a universal characteristic applicable to all flood-prone regions.
Distance to rivers (12%) was ranked as the third-most influential factor, followed closely by drainage density (12%). The high importance of river proximity indicates that flood susceptibility is strongly concentrated along the Sebeya River and its tributaries, where overbank flooding is most likely to occur during periods of high discharge. This finding is consistent with previous studies showing that flood susceptibility generally increases with decreasing distance from river channels [53,54]. In the Sebeya catchment, settlements, agricultural land, and infrastructure are frequently located within valley bottoms and near river corridors, which increases their exposure to inundation. The importance of drainage density (12.2%) further highlights the role of the drainage network in concentrating runoff. High drainage density indicates a well-developed channel network capable of rapidly conveying water from hillslopes to the main river system. In combination with steep slopes and intense rainfall, this characteristic contributes to rapid runoff accumulation and increased flood peaks. Similar relationships between drainage density and flood susceptibility have been documented in several GIS-based flood assessment studies [55,56].
Elevation (11%) also received a substantial weight, indicating that topography position plays an important role in determining flood-prone areas. Lower elevations within the catchment generally correspond to valley floors and floodplains where runoff accumulates after flowing from high terrain. Conversely, higher elevations primarily function as runoff source areas [57]. The moderate-to-high ranking of elevation suggests that flood susceptibility in the Sebeya catchment is influenced not only by runoff generation processes but also by the spatial redistribution and storage of water within the landscape. Land use/land cover (8%) was identified as another important factor. Although its weight is lower than that of rainfall and terrain-related variables, land cover has an important role in flood susceptibility by affecting how water is absorbed, stored, and drained across different surfaces.
Natural vegetation, such as forests and wetlands, helps mitigate flooding by enhancing infiltration, reducing surface runoff, and promoting groundwater recharge [58]. In contrast, impervious surfaces like concrete, asphalt, and compacted soil in urban areas prevent water from being absorbed into the ground, leading to increased runoff and a higher risk of urban flooding [59]. In this study, barren soil was assigned a low susceptibility score (2) because of the unique environmental conditions of the Sebeya catchment, not because of the hydrological behavior of barren surfaces in general. Even though barren land can contribute to increased surface runoff due to decreased infiltration, the extent of barren areas within the Sebeya catchment has been significantly decreased by ongoing catchment restoration initiatives, such as reforestation, afforestation, slope stabilization, terracing, and other land management interventions. Because of this, the amount of remaining barren land is small, dispersed, and typically found in regions where restoration efforts have already enhanced soil stability and vegetation recovery, reducing its contribution to flood susceptibility.
Topographic Wetness Index (TWI) (7%) received a moderate weight, indicating its significant contribution to flood susceptibility. TWI is a key geomorphological parameter influencing flood susceptibility by indicating areas prone to water accumulation based on local topography [60]. Areas exhibiting high TWI values are generally associated with saturated soils, reduced infiltration capacity, and increased potential for surface ponding during rainfall events [61]. The relatively moderate ranking of TWI observed in this study confirms that local topographic controls play a role in determining flood-prone locations within the Sebeya catchment. Similar observations have been reported and identified TWI as one of the most reliable terrain-derived predictors in flood susceptibility modeling [62].
The remaining factors, including distance to roads (4%), soil type (4%), and NDVI (3%), received comparatively lower weights. Distance to roads may influence local drainage patterns through road embankments, culverts, and surface runoff concentration, but its effect appears secondary at the catchment scale [63]. Soil type affects infiltration capacity; however, its low weight suggests that soil variability within the Sebeya catchment may be less influential than rainfall and terrain characteristics. NDVI receives the lowest weight, which may reflect the relatively widespread vegetation cover resulting from ongoing watershed restoration and reforestation efforts.

4.2. Comparison with Previous Studies

The overall ranking of flood-conditioning factors in this study is broadly consistent with previous GIS-based flood susceptibility assessments conducted in mountainous and tropical environments. Rainfall, slope, drainage density, and river proximity have frequently been identified as dominant predictors of flood occurrence [49,52,54,64]. The agreement between the present findings and previous studies increases confidence that the weighting scheme adequately reflects the principal hydrological controls operating within the Sebeya catchment.
However, some differences are also evident. In several studies conducted in highly urbanized watersheds, land use/land cover has been reported as one of the most influential factors because impervious surfaces substantially reduce infiltration and increase runoff generation [65]. In the present study, land use/land cover received a moderate weight of 8%. This difference is likely attributable to the predominantly rural character of the Sebeya catchment, where agricultural land and vegetation cover remain more extensive than densely built-up urban surfaces. Similarly, soil type received a relatively low weight (4%). While soil permeability is recognized as an important control on infiltration and runoff generation, its influence appears less pronounced in the Sebeya catchment than rainfall intensity, slope, and drainage characteristics. Comparable findings have been reported in other mountainous catchments where terrain-derived variables exert stronger control over flood occurrence than soil properties [66]. The moderate weight assigned to TWI (7%) differs from some studies in which TWI was ranked among the most influential predictors [67]. This discrepancy may be explained by the steep topography of the Sebeya catchment, where rapid runoff generation and channel concentration processes may dominate over localized water accumulation processes. Nevertheless, TWI remains an important supplementary factor because it identifies areas prone to saturation and surface water retention.

4.3. Implications for Flood Risk Management in the Sebeya Catchment

The findings of this study have important implications for flood risk management in the Sebeya catchment. First, the dominance of rainfall highlights the need for improved rainfall monitoring and early warning systems capable of detecting extreme precipitation events. Because intense rainfall is the primary flood-triggering factor, timely warnings could significantly reduce loss of life and property. Second, the importance of slope and drainage density suggests that upstream watershed management interventions are essential. Measures such as reforestation, terracing, soil conservation, and erosion control can reduce runoff generation and slow the movement of water toward downstream areas. Third, the strong influence of distance to rivers indicates that land use planning should carefully regulate development within flood-prone river corridors and valley bottoms. Settlements and infrastructure located in these areas are particularly exposed to inundation during high-flow events. Finally, the moderate contribution of land use/land cover suggests that maintaining and enhancing vegetation cover remains an important non-structural flood mitigation strategy. Continued watershed restoration efforts may help reduce runoff generation and improve the resilience of the catchment to future flood events.

4.4. Integrating Socioeconomic Vulnerability with Flood Susceptibility Assessment

The socioeconomic findings demonstrate that the consequences of flooding in the Sebeya catchment extend well beyond the physical occurrence of flood events, highlighting the importance of integrating socioeconomic vulnerability with flood susceptibility assessment. Although the GIS–AHP model identifies areas with high probability of flooding based on environmental and topographic conditions, the household survey reveals how flooding translates into significant livelihood disruptions for communities residing within these susceptible zones.
The high proportion of respondents reporting food shortage (40.9%) and loss of income-generating activities (39.8%) indicates that agriculture and small-scale businesses constitute the most vulnerable livelihood sectors. These findings are consistent with the predominantly agrarian economy of the Sebeya catchment, where household income is closely linked to agricultural production and local trade. Consequently, flood impacts extend beyond the immediate destruction of physical assets to include reduced food security, declining household income, and increased economic vulnerability. Similar observations have been reported in other flood-prone regions of sub-Saharan Africa, where recurrent flooding undermines rural livelihoods and slows socioeconomic development [68].
The socioeconomic assessment further demonstrates that flooding generates cascading effects across multiple sectors of the local economy. The predominance of income loss (35.2%), property damage (25.3%), and business interruption (21%) suggests that flood events reduce household resilience by simultaneously affecting employment, productive assets, and commercial activities. These findings indicate that flood susceptibility should not be interpreted solely in terms of inundation probability but also in terms of the capacity of affected communities to withstand and recover from flood-induced shocks. Particularly, the observed disruption of small businesses and agricultural production illustrates how physical flood hazards can trigger prolonged socioeconomic consequences that persist long after the flood. This reinforces the need for flood risk assessments to incorporate both hazard and vulnerability components, consistent with internationally recognized disaster risk frameworks [68].
The impacts on agriculture further illustrate the interaction between physical flood processes and socioeconomic vulnerability. The finding that reduced crop yield (50%) and loss of fertile soil (35%) were the most frequently reported agricultural impacts demonstrates that flooding threatens the long-term sustainability of agricultural production in the Sebeya catchment. Because agriculture remains the primary livelihood for most households, repeated flood events not only reduce annual production but also degrade the natural resource base through soil erosion and nutrient depletion. These results support the relatively high weight assigned to rainfall, slope, distance to rivers, and drainage density in the GIS-AHP analysis, as these factors collectively accelerate runoff generation, river overflow, and soil erosion within the catchment. The agreement between the spatial susceptibility patterns and the reported agricultural impacts provides additional confidence that the flood susceptibility map accurately reflects the dominant flood-generating processes operating within the study area.
Beyond the livelihood losses, the survey demonstrates that flooding substantially disrupts access to essential services and critical infrastructure. Transportation disruption and school closures were the most frequently reported service-related impacts, while damage to residential and commercial buildings and roads and bridges represented the most significant infrastructure losses. These findings indicate that the communities located within highly flood-susceptible zones experienced reduced accessibility to markets, healthcare facilities, educational institutions, and emergency response services during flood events. Such disruptions increase the indirect socioeconomic cost of flooding and delay post-disaster recovery. Similar patterns have been documented in flood-prone regions worldwide, where damage to transport and public infrastructure amplifies the long-term socioeconomic consequences of disasters by interrupting economic activities and limiting access to essential services.
Integrating these socioeconomic findings with the GIS-AHP flood susceptibility assessment substantially enhances the practical value of the study. While the susceptibility map identifies where flooding is most likely to occur, the socioeconomic analysis identifies which communities are most vulnerable and which sectors are likely to experience the greatest impacts. This integrated perspective enables decision-makers to prioritize interventions in areas where high flood susceptibility coincides with high socioeconomic vulnerability. For example, communities located within highly susceptible river corridors and whose livelihoods depend primarily on agriculture may require priority investment in riverbank stabilization, flood-resilient agricultural practices, early warning systems, livelihood diversification programs, and social protection mechanisms. Similarly, areas characterized by both high flood susceptibility and critical infrastructure can be prioritized for climate-resilient road construction, bridge reinforcement, improved drainage systems, and protection of water supply facilities. Therefore, combining spatial flood susceptibility with household-level socioeconomic information transforms the proposed framework from a hazard mapping exercise into a more comprehensive flood risk assessment tool capable of supporting evidence-based land use planning, disaster preparedness, and sustainable watershed management in the Sebeya catchment.

4.5. Strengths and Limitations

A major strength of this study is the integration of ten flood-conditioning factors within a GIS-AHP framework tailored to the hydro-geomorphological characteristics of the Sebeya catchment. The weighting scheme reflects both expert judgment and local environmental conditions, and the resulting susceptibility map was validated using an independent flood inventory dataset. Nevertheless, several limitations should be acknowledged. The AHP method relies on expert judgment, which introduces a degree of subjectivity despite the satisfactory Consistency Ratio. In addition, a formal sensitivity analysis was not conducted to evaluate the effect of varying factor weights on the resulting susceptibility map. Future research should therefore compare the present weighting scheme with alternative approaches such as the Best-Worst Method (BWM), Fuzzy AHP, entropy-based weighting, and machine learning techniques. Such comparisons would provide further insight into the robustness of flood susceptibility assessment in the Sebeya catchment.

5. Conclusions

This study developed a GIS-based flood susceptibility assessment for the Sebeya catchment by integrating the Analytical Hierarchy Process (AHP) with Geographic Information Systems (GIS). Ten flood-conditioning factors representing topographic, hydrological, climatic, land-cover, and environmental characteristics were incorporated into the model to identify areas susceptible to flooding. The resulting susceptibility map demonstrated high predictive performance when validated against independent flood inventory using a confusion matrix, confirming the reliability of the proposed methodology for flood susceptibility assessment in data-scarce mountainous catchments. The findings further identified rainfall, slope, distance to rivers, drainage density, and elevation as the dominant controls governing flood susceptibility, reflecting the hydro-geomorphological characteristics of the Sebeya catchment.
The spatial analysis showed that flood-prone areas are concentrated along the Sebeya River and its tributaries, where low elevations, high drainage density, and intensive human activities increase exposure to flooding. The complementary socioeconomic assessment demonstrated that communities located within susceptible zones experience substantial impacts on livelihoods, agriculture, infrastructure, and access to essential services during flood occurrence. Integrating socioeconomic evidence with spatial susceptibility mapping therefore provides a more comprehensive understanding of flood risk by identifying not only where floods are likely to occur but also where their consequences are likely to be more severe. This integration enhances the practical relevance of the study for disaster risk reduction and climate change adaptation planning.
The findings provide decision-support information for watershed management and flood risk governance in Rwanda. The susceptibility map can support land use planning, protection of floodplain corridors, prioritization of watershed restoration measures, and the implementation of flood early warning systems in the most vulnerable areas. These results also provide a scientific basis for improving community resilience through targeted investments in climate-resilient infrastructure and sustainable catchment management.
Although the proposed GIS-AHP framework performed well under limited data availability, the study has some limitations. The weighting process relies on expert judgment, and the susceptibility assessment does not explicitly simulate flood depth, flow velocity, or inundation extent. Future research should integrate physically based hydrological and hydraulic models or advanced machine learning approaches with higher- resolution hydro-meteorological data and climate change projections to improve flood hazard prediction and support more comprehensive flood risk assessments in the Sebeya Catchment and other mountainous watersheds.

Author Contributions

A.M., T.K., F.M., L.M. and M.-L.N. contributed to the conception. Conceptualization, supervision, and review were contributed by T.K., F.M. and L.M. Data collection and analysis were contributed by A.M. and M.-L.N. Original draft writing was performed by A.M. All authors have read and agreed to the published version of the manuscript.

Funding

This research received no external funding.

Data Availability Statement

The data supporting the findings of this study are available from the corresponding author upon request.

Acknowledgments

We thank the Rubavu district for facilitating researchers during the community survey.

Conflicts of Interest

The authors declare no conflicts of interest.

References

  1. Tanoue, M.; Taguchi, R.; Alifu, H.; Hirabayashi, Y. Residual flood damage under intensive adaptation. Nat. Clim. Chang. 2021, 11, 823–826. [Google Scholar]
  2. McDermott, T.K.J. Global exposure to flood risk and poverty. Nat. Commun. 2022, 13, 3529. [Google Scholar] [CrossRef] [Scilit] [PubMed]
  3. Aziz, F.; Wang, X.; Mahmood, M.Q.; Awais, M.; Trenouth, B. Coastal urban flood risk management: Challenges and opportunities—A systematic review. J. Hydrol. 2024, 645, 132271. [Google Scholar] [CrossRef] [Scilit]
  4. Kurata, Y.B.; Ong, A.K.S.; Ang, R.Y.B.; Angeles, J.K.F.; Bornilla, B.D.C.; Fabia, J.L.P. Factors Affecting Flood Disaster Preparedness and Mitigation in Flood-Prone Areas in the Philippines: An Integration of Protection Motivation Theory and Theory of Planned Behavior. Sustainability 2023, 15, 6657. [Google Scholar]
  5. Aryal, D.; Wang, L.; Adhikari, T.R.; Zhou, J.; Li, X.; Shrestha, M.; Wang, Y.; Chen, D. A model-based flood hazard mapping on the southern slope of Himalaya. Water 2020, 12, 540. [Google Scholar] [CrossRef] [Scilit]
  6. Mohammadi, N.K. Floods Impacts on the Socio-Economic of Livelihoods in Paktia Afghanistan. Int. J. Res. Appl. Sci. Biotechnol. 2021, 8, 38–48. [Google Scholar] [CrossRef] [Scilit]
  7. UNISDR. Words into Action Guidelines—Disaster Displacement: How to Reduce Risk, Address Impacts and Strengthen Resilience; United Nations Office for Disaster Risk Reduction (UNISDR): Geneva, Switzerland, 2018; p. 70. [Google Scholar]
  8. Yeboah, S.I.I.K.; Antwi-Agyei, P.; Kabo-Bah, A.T.; Ackerson, N.O.B. Water, environment, and health nexus: Understanding the risk factors for waterborne diseases in communities along the Tano River Basin, Ghana. J. Water Health 2024, 22, 1556–1577. [Google Scholar] [PubMed]
  9. Acosta-España, J.D.; Romero-Alvarez, D.; Luna, C.; Rodriguez-Morales, A.J. Infectious disease outbreaks in the wake of natural flood disasters: Global patterns and local implications. Infez. Med. 2024, 32, 451–462. [Google Scholar] [PubMed]
  10. Suhr, F.; Steinert, J.I. Epidemiology of floods in sub-Saharan Africa: A systematic review of health outcomes. BMC Public Health 2022, 22, 268. [Google Scholar] [PubMed]
  11. Hahirwabasenga, J.; Nilsson, E.; Larson, M.; Bizimana, H.; Wali, U.G.; Persson, M. Flooding in Sebeya catchment, Rwanda—A review of causes, impacts, and management. Int. J. Disaster Risk Reduct. 2024, 114, 105012. [Google Scholar]
  12. Ministry in Charge of Emergency Management (MINEMA). Disaster Effects Situation 2024; Annual Disaster Effects Report; MINEMA: Kigali, Rwanda, 2024. [Google Scholar]
  13. International Federation of Red Cross and Red Crescent Societies (IFRC). Operational Update: Rwanda—Floods and Landslides; IFRC: Geneva, Switzerland, 2023; pp. 1–12. [Google Scholar]
  14. Kim, D.; Chung, E.G.; Kim, K.; Kim, Y. Impact of riverbed topography on hydrology in small watersheds using Soil and Water Assessment Tool. Environ. Model. Softw. 2022, 152, 105383. [Google Scholar] [CrossRef] [Scilit]
  15. Eidmann, J.S.; Gallen, S. New remote method to systematically extract bedrock channel width of small catchments across large spatial scales using high-resolution digital elevation models. Earth Surf. Process. Landf. 2023, 48, 1470–1483. [Google Scholar] [CrossRef] [Scilit]
  16. Delchiaro, M.; Ruscitto, V.; Schwanghart, W.; Brignone, E.; Piacentini, D.; Troiani, F. BankfullMapper: A semi-automated MATLAB tool on high-resolution digital terrain models for spatio-temporal monitoring of bankfull geometry and discharge. Comput. Geosci. 2025, 205, 106001. [Google Scholar]
  17. Coles, S. An Introduction to Statistical Modeling of Extreme Values; Springer: London, UK, 2001; pp. 1–208. [Google Scholar]
  18. Shah, S.A.; Ai, S. Flood susceptibility mapping contributes to disaster risk reduction: A case study in Sindh, Pakistan. Int. J. Disaster Risk Reduct. 2024, 108, 104503. [Google Scholar]
  19. Kaya, C.M.; Derin, L. Parameters and methods used in flood susceptibility mapping: A review. J. Water Clim. Chang. 2023, 14, 1935–1960. [Google Scholar]
  20. Bedada, B.A.; Dibaba, W.T. Geoinformatics and AHP multi criteria decision making integrated flood hazard zone mapping over Modjo catchment, Awash river basin, central Ethiopia. Discov. Appl. Sci. 2025, 7, 644. [Google Scholar] [CrossRef] [Scilit]
  21. Yılmaz, M.; Alemdar, K.D. Mapping and assessment of flood risk based on vulnerability and hazard factors in urban areas through the integration of multi-criteria techniques and GIS: A case study in Yakutiye, Erzurum, Türkiye. Environ. Earth Sci. 2025, 84, 368. [Google Scholar]
  22. Mudashiru, R.B.; Sabtu, N.; Abdullah, R.; Saleh, A.; Abustan, I. Optimality of flood influencing factors for flood hazard mapping: An evaluation of two multi-criteria decision-making methods. J. Hydrol. 2022, 612, 128055. [Google Scholar]
  23. Shrestha, S.; Dahal, D.; Poudel, B.; Banjara, M.; Kalra, A. Flood Susceptibility Analysis with Integrated Geographic Information System and Analytical Hierarchy Process: A Multi-Criteria Framework for Risk Assessment and Mitigation. Water 2025, 17, 937. [Google Scholar]
  24. Saaty, R.W. The analytic hierarchy process—What it is and how it is used. Math. Model. 1987, 9, 161–176. [Google Scholar]
  25. Gacu, J.G.; Monjardin, C.E.F.; Senoro, D.B.; Tan, F.J. Flood Risk Assessment Using GIS-Based Analytical Hierarchy Process in the Municipality of Odiongan, Romblon, Philippines. Appl. Sci. 2022, 12, 9456. [Google Scholar]
  26. Vujović, F.; Valjarević, A.; Durlević, U.; Morar, C.; Grama, V.; Spalević, V.; Milanović, M.; Filipović, D.; Ćulafić, G.; Gazdić, M.; et al. A Comparison of the AHP and BWM Models for the Flash Flood Susceptibility Assessment: A Case Study of the Ibar River Basin in Montenegro. Water 2025, 17, 844. [Google Scholar] [CrossRef] [Scilit]
  27. Ayele, A.B.; Legesse, A.; Uncha, A.; Gelaw, A. Flood hazard vulnerability assessment in the Sile-Sago watershed, Rift Valley Basin, Ethiopia. Sci. Afr. 2025, 29, e02846. [Google Scholar] [CrossRef] [Scilit]
  28. Mulu, A.; Kassa, S.B.; Lakew, M.; Meshesha, T.M. Flood susceptibility mapping using integrated geospatial and analytical hierarchy process analysis in highly expansive Debre Markos Town, Amhara Region, Ethiopia. Discov. Appl. Sci. 2025, 7, 308. [Google Scholar] [CrossRef] [Scilit]
  29. Zhran, M.; Ghanem, K.; Tariq, A.; Alshehri, F.; Jin, S.; Das, J.; Pande, C.B.; Pramanik, M.; Ben Hasher, F.F.; Mousa, A. Exploring a GIS-based analytic hierarchy process for spatial flood risk assessment in Egypt: A case study of the Damietta branch. Environ. Sci. Eur. 2024, 36, 124. [Google Scholar] [CrossRef] [Scilit]
  30. Diriba, D.; Takele, T.; Karuppannan, S.; Husein, M. Flood hazard analysis and risk assessment using remote sensing, GIS, and AHP techniques: A case study of the Gidabo Watershed, main Ethiopian Rift, Ethiopia. Geomat. Nat. Hazards Risk 2024, 15, 2361813. [Google Scholar]
  31. Aichi, A.; Ikirri, M.; Ait Haddou, M.; Quesada-Román, A.; Sahoo, S.; Singha, C.; Sajinkumar, K.S.; Abioui, M. Integrated GIS and analytic hierarchy process for flood risk assessment in the Dades Wadi watershed (Central High Atlas, Morocco). Results Earth Sci. 2024, 2, 100019. [Google Scholar]
  32. Ashfaq, S.; Tufail, M.; Niaz, A.; Muhammad, S.; Alzahrani, H.; Tariq, A. Flood susceptibility assessment and mapping using GIS-based analytical hierarchy process and frequency ratio models. Glob. Planet. Change 2025, 251, 104831. [Google Scholar] [CrossRef] [Scilit]
  33. Saleh, M. Evaluation of Jenks Natural Breaks Clustering Algorithm for Changepoint Identification in Streaming Sensor Data. IEEE Sens. Lett. 2024, 8, 3501704. [Google Scholar]
  34. Gui, R.; Song, W.; Lv, J.; Lu, Y.; Liu, H.; Feng, T.; Linghu, S. Digital Elevation Model-Driven River Channel Boundary Monitoring Using the Natural Breaks (Jenks) Method. Remote Sens. 2025, 17, 1092. [Google Scholar]
  35. Beven, K.J.; Kirkby, M.J. A physically based, variable contributing area model of basin hydrology. Hydrol. Sci. J. 1979, 24, 43–69. [Google Scholar]
  36. Nsangou, D.; Kpoumié, A.; Mfonka, Z.; Ngouh, A.N.; Fossi, D.H.; Jourdan, C.; Mbele, H.Z.; Mouncherou, O.F.; Vandervaere, J.-P.; Ngoupayou, J.R.N. Urban flood susceptibility modelling using AHP and GIS approach: Case of the Mfoundi watershed at Yaoundé in the South-Cameroon plateau. Sci. Afr. 2022, 15, e01043. [Google Scholar] [CrossRef] [Scilit]
  37. Weday, M.A.; Tabor, K.W.; Gemeda, D.O. Flood hazards and risk mapping using geospatial technologies in Jimma City, southwestern Ethiopia. Heliyon 2023, 9, e14617. [Google Scholar] [CrossRef] [Scilit] [PubMed]
  38. Siddik, M.S.; Tulip, S.S.; Rahman, A.; Islam, M.N.; Haghighi, A.T.; Mustafa, S.M.T. The impact of land use and land cover change on groundwater recharge in northwestern Bangladesh. J. Environ. Manag. 2022, 315, 115130. [Google Scholar] [CrossRef] [Scilit] [PubMed]
  39. Abdusamea, R.M.M. The Importance of the Normalized Difference Vegetation Index (NDVI) and the Use of the ArcGIS to create NDVI Maps. J. Sci. Humanit. Sci. 2020, 57, 1–7. [Google Scholar]
  40. Swain, K.C.; Singha, C.; Nayak, L. Flood susceptibility mapping through the GIS-AHP technique using the cloud. ISPRS Int. J. Geo-Inf. 2020, 9, 720. [Google Scholar] [CrossRef] [Scilit]
  41. Zuo, C.; Wang, R.; Hong, Y.; Zhou, Y.; He, Y.; Gronewold, A.D. The influence of road network topology on street flooding in New York City—A social media data approach. J. Hydrol. 2024, 638, 131471. [Google Scholar] [CrossRef] [Scilit]
  42. Yang, S.Y.; Chang, C.H.; Hsu, C.T.; Wu, S.J. Variation of uncertainty of drainage density in flood hazard mapping assessment with coupled 1D–2D hydrodynamics model. Nat. Hazards 2022, 111, 2297–2315. [Google Scholar] [CrossRef] [Scilit]
  43. Seejata, K.; Yodying, A.; Wongthadam, T.; Mahavik, N.; Tantanee, S. Assessment of flood hazard areas using Analytical Hierarchy Process over the Lower Yom Basin, Sukhothai Province. Procedia Eng. 2018, 212, 340–347. [Google Scholar] [CrossRef] [Scilit]
  44. Mazarakis, V.; Tsanakas, K.; Greenbaum, N.; Batzakis, D.-V.; Sorrentino, A.; Tsodoulos, I.; Valkanou, K.; Karymbalis, E. Flood-Hazard Assessment in the Messapios River Catchment (Central Evia Island, Greece) by Integrating GIS-Based Multi-Criteria Decision Analysis and Analytic Hierarchy Process. Land 2025, 14, 658. [Google Scholar] [CrossRef] [Scilit]
  45. Shrestha, M.S.; Gurung, M.B.; Khadgi, V.R.; Wagle, N.; Banarjee, S.; Sherchan, U.; Parajuli, B.; Mishra, A. The last mile: Flood risk communication for better preparedness in Nepal. Int. J. Disaster Risk Reduct. 2021, 56, 102118. [Google Scholar] [CrossRef] [Scilit]
  46. Singha, C.; Chakraborty, N.; Sahoo, S.; Pham, Q.B.; Xuan, Y. A novel framework for flood susceptibility assessment using hybrid analytic hierarchy process-based machine learning methods. Nat. Hazards 2025, 121, 104443. [Google Scholar] [CrossRef] [Scilit]
  47. Svetlana, D.; Radovan, D.; Ján, D. The Economic Impact of Floods and their Importance in Different Regions of the World with Emphasis on Europe. Procedia Econ. Financ. 2015, 34, 649–655. [Google Scholar] [CrossRef] [Scilit]
  48. Manzoor, Z.; Ehsan, S.; Shrestha, S.; Ahmad, I.; Arshad, M.; Sarafati, A. Floods and flood management and its socio-economic impact on Pakistan: A review of the empirical literature. Front. Environ. Sci. 2022, 10, 1021862. [Google Scholar] [CrossRef] [Scilit]
  49. Aryee, J.N.A.; Afrifa, F.O.T.; Agyapong, K.; Frimpong, N.A.G.; Quagraine, K.T.; Davies, P. Quantifying climatic heavy-precipitation-induced floods in West Africa using multiple precipitation indices. Sci. Afr. 2024, 25, e02309. [Google Scholar] [CrossRef] [Scilit]
  50. Hategekimana, Y.; Mukanyandwi, V.; Kwizera, G.; Karamage, F.; Ntawukuriryayo, E.; Manzi, F.; Rwanyiziri, G.; Busogi, M. Modeling Flood Susceptibility in Rwanda Using an AI-Enabled Risk Mapping Tool. Earth 2026, 7, 53. [Google Scholar] [CrossRef] [Scilit]
  51. Ramesh, V.; Iqbal, S.S. Urban flood susceptibility zonation mapping using evidential belief function, frequency ratio and fuzzy gamma operator models in GIS: A case study of Greater Mumbai, Maharashtra, India. Geocarto Int. 2022, 37, 581–606. [Google Scholar] [CrossRef] [Scilit]
  52. Munyai, R.B.; Nenwiini, S.C.; Mohomi, T.; Singo, M.V.; Chikoore, H. Flood vulnerability assessment in Mopani District Municipality, South Africa. Part 1: Physical factors and adaptation framework. Nat. Hazards 2026, 122, 534. [Google Scholar] [CrossRef] [Scilit]
  53. Costache, R.; Pham, Q.B.; Sharifi, E.; Linh, N.T.T.; Abba, S.; Vojtek, M.; Vojteková, J.; Nhi, P.T.T.; Khoi, D.N. Flash-Flood Susceptibility Assessment Using Multi-Criteria Decision Making and Machine Learning Supported by Remote Sensing and GIS Techniques. Remote Sens. 2020, 12, 106. [Google Scholar] [CrossRef] [Scilit]
  54. Dutta, M.; Saha, S.; Saikh, N.I.; Sarkar, D.; Mondal, P. Application of bivariate approaches for flood susceptibility mapping: A district level study in Eastern India. HydroResearch 2023, 6, 108–121. [Google Scholar] [CrossRef] [Scilit]
  55. Sewa, R.; Poudel, B.; Shrestha, S.; Dahal, D.; Kalra, A. Assessing Flood Susceptibility Using a Data-Driven, GIS-Based Frequency Ratio Model. Atmosphere 2026, 17, 231. [Google Scholar] [CrossRef] [Scilit]
  56. Dana, E.; Tesfamariam, S.; Govindu, V. River flood risk modeling by applying random forest and support vector machine: The case of Sago-Sile river catchments, Southern Ethiopia. Sci. Afr. 2026, 32, e03312. [Google Scholar] [CrossRef] [Scilit]
  57. Sugianto, S.; Deli, A.; Miswar, E.; Rusdi, M.; Irham, M. The Effect of Land Use and Land Cover Changes on Flood Occurrence in Teunom Watershed, Aceh Jaya. Land 2022, 11, 1271. [Google Scholar] [CrossRef] [Scilit]
  58. Sohn, W.; Kim, J.H.; Li, M.H.; Brown, R.D.; Jaber, F.H. How does increasing impervious surfaces affect urban flooding in response to climate variability? Ecol. Indic. 2020, 118, 106774. [Google Scholar] [CrossRef] [Scilit]
  59. Khumaeroh, D.N.F.; Sari, D.N. Application of Analytical Hierarchy Process (AHP) and Geographic Information System (GIS) in flood hazard analysis in the Rawa Pening Sub-Watershed, Indonesia. IOP Conf. Ser. Earth Environ. Sci. 2024, 1314, 012114. [Google Scholar] [CrossRef] [Scilit]
  60. Meles, M.B.; Younger, S.E.; Jackson, C.R.; Du, E.; Drover, D. Wetness index based on landscape position and topography (WILT): Modifying TWI to reflect landscape position. J. Environ. Manag. 2020, 255, 109863. [Google Scholar] [CrossRef] [Scilit] [PubMed]
  61. Hassanvand, M.; Zecchin, A.C.; Dandy, G.C. Enhancing flood susceptibility mapping through integration of nature-inspired metaheuristic algorithms and machine learning. Environ. Chall. 2026, 23, 101479. [Google Scholar] [CrossRef] [Scilit]
  62. Islam, T.; Zeleke, E.B.; Afroz, M.; Melesse, A.M. A Systematic Review of Urban Flood Susceptibility Mapping: Remote Sensing, Machine Learning, and Other Modeling Approaches. Remote Sens. 2025, 17, 524. [Google Scholar] [CrossRef] [Scilit]
  63. Roohi, M.; Dehghani, J.; Irani, M.; Mina, P. A comprehensive review of flood damage in mountainous regions: Challenges, solutions, and advanced management technologies. Discov. Geosci. 2025, 3, 59. [Google Scholar] [CrossRef] [Scilit]
  64. Rahmati, O.; Pourghasemi, H.R.; Zeinivand, H. Flood susceptibility mapping using frequency ratio and weights-of-evidence models in the Golastan Province, Iran. Geocarto Int. 2016, 31, 42–70. [Google Scholar] [CrossRef] [Scilit]
  65. IPCC. Climate Change 2022: Impacts, Adaptation and Vulnerability; Contribution of Working Group II to the Sixth Assessment Report of the Intergovernmental Panel on Climate Change; Pörtner, H.-O., Roberts, D.C., Tignor, M., Poloczanska, E.S., Mintenbeck, K., Alegría, A., Craig, M., Langsdorf, S., Löschke, S., Möller, V., et al., Eds.; Cambridge University Press: Cambridge, UK; New York, NY, USA, 2022; pp. 1–3056. [Google Scholar]
  66. Addison, S.; Bharadwaj, R.; Carthy, A.; Gallagher, C.; More, C.; Nisi, N.; Shakya, C. Addressing Loss and Damage: Practical Insights for Tackling Multidimensional Risks in LDCs and SIDS; Working Paper; International Institute for Environment and Development (IIED): London, UK, 2022; pp. 1–114. ISBN 978-1-78431-985-4. [Google Scholar]
  67. Akinkuolie, T.A.; Ogunbode, T.O.; Adekiya, A.O.; Agun, O.F. Strengthening climate vulnerability governance toward inclusive development in Nigeria. Discov. Environ. 2026, 1, 816. [Google Scholar] [CrossRef] [Scilit]
  68. Hamidi, A.R.; Ford, J.D.; Novo, P.; Paavola, J.; Malik, I.H. Rethinking flood resilience: Systemic risk, governance failures, and the social production of vulnerability in the Himalayan–Indus region. J. Disaster Sci. Manag. 2026, 2, 8. [Google Scholar] [CrossRef] [Scilit] [PubMed]
Figure 1. Location of Sebeya catchment.
Geohazards 07 00095 g001
Figure 2. Flow chart of flood susceptibility mapping in this study.
Geohazards 07 00095 g002
Figure 3. Maps of flood susceptibility factors.
Geohazards 07 00095 g003
Figure 4. Flood inventory map.
Geohazards 07 00095 g004
Figure 5. Validated flood susceptibility map.
Geohazards 07 00095 g005
Figure 6. Impacts of flooding on livelihoods in the Sebeya catchment.
Geohazards 07 00095 g006
Figure 7. Economic impacts of flooding on livelihoods in the Sebeya catchment.
Geohazards 07 00095 g007
Figure 8. Impacts of flooding on agricultural activities in the Sebeya catchment.
Geohazards 07 00095 g008
Figure 9. Impacts of flooding on access to essential services in the Sebeya catchment.
Geohazards 07 00095 g009
Figure 10. Impacts of flooding on infrastructure in the Sebeya catchment.
Geohazards 07 00095 g010
Table 1. Key characteristics of selected data sources.
Flood Susceptibility CriteriaOriginal DatasetOriginal FormatAcquisition PeriodSourceRasterized OutputSpatial Resolution
Digital Elevation Model (DEM)Copernicus DEMRaster16/12/2024Alaska Satellite Facility (ASF)Elevation raster10 m
SlopeDerived from DEMRasterDerivedDEM processingSlope raster (degrees)10 m
Topographic Wetness Index (TWI)Derived from DEMRasterDerivedDEM processingTWI raster10 m
Drainage densityRiver networkVector (Shp)05/3/2025UNESCO World Rivers DatabaseDrainage density raster10 m
Distance to riversRiver networkVector (Shp)05/3/2025UNESCO World Rivers DatabaseEuclidean distance raster10 m
Distance to roadsRoad networkVector (Shp)05/3/2025Global Roads Inventory Project (GRIP)Euclidean distance raster10 m
PrecipitationDaily rainfall (1981–2021)Point observation1981–2021Rwanda Meteorological AgencyInterpolated rainfall raster10 m
Land Use/Land Cover (LULC)Sentinel-2 imageryRaster02/3/2025Esri Living AtlasClassified LULC raster10 m
Normalized Difference Vegetation Index (NDVI)Landsat-8 imageryRaster12/6/2023USG Earth ExplorerNDVI raster30 m
Soil typeDigital soil map of RwandaVector (Shp)2021RLMUASoil type10 m
Flood inventoryHistorical flood locationsPoints21/6/2024Field survey and flood-prone areasValidation point layer10 m reference grid
Socioeconomic dataAdministrative boundaries Vector (Shp)17/10/2021University of Rwanda CGISReference layer10 m reference grid
Field surveyGround truth observation and questionnaireGPS points and field notes21–24/6/2024Sebeya catchmentValidation datasetNot applicable
Table 2. Criteria and sub-criteria range for flood susceptibility assessment.
Causal FactorsUnits RangesClasses RatingsWeight (%)
TWILevel−6.86–−4.91very low17
−4.91–−3.23low2
−3.23–−0.87moderate3
−0.87–2.36high4
2.36–10.30very high5
Elevation (EL)m1486–1831very high511
1831–2071high4
2071–2306moderate3
2306–2551low2
2551–2979very low1
Slope (SL)%0–11very high515
11–22high4
22–33moderate3
33–46low2
46–87very low1
Rainfall/Precipitation (PP)mm/yr1188–1286very low123
1286–1333low2
1333–1378moderate3
1378–1438high4
1438–1537very high5
Land use/Landcover (LULC)level Water bodyvery high58
Settlementhigh4
Agriculturemoderate3
Barren Landlow2
Vegetationvery low1
NDVIlevel 0.007–0.192very high53
0.192–0.256high4
0.256–0.309moderate3
0.309–0.364low2
0.364–0.713very low1
Distance to river (DRI)meter0–573very high512
573–1369high4
1369–2465moderate3
2465–3934low2
3934–6350very low1
Distance to road (DRO)meter0–327very high54
327–854high4
854–1453moderate3
1453–2151low2
2151–3632very low1
Drainage density (DD)km/km20–47very low112
47–143low2
143–265moderate3
265–418high4
418–795very high5
Soil typelevelsandsvery low14
Sandy loamlow2
Clay loammoderate3
loamhigh4
clayvery high5
Total 100
Table 3. Saaty’s 1.0–9.0 scale AHP.
ScalesImportanceReciprocals
1.0Equally important1
3.0Moderately important1/3
5.0strongly important1/5
7.0Very strongly important1/7
9.0Extremely important1/9
2.0, 4.0, 6.0, 8.0Intermediate values between two factors1/2, 1/4, 1/6, 1/8
Table 4. Pairwise comparison matrix.
FactorsDRSlopeRainfallDROElevationSoil TypeTWINDVIDDLULC
DR1.00
Slope2.001.00
Rainfall3.003.001.00
DRO0.200.330.201.00
Elevation3.000.330.203.001.00
Soil types0.330.330.330.500.501.00
TWI0.330.330.205.000.333.001.00
NDVI0.200.330.200.500.330.330.331.00
DD0.330.500.335.003.003.001.005.001.00
LULC0.500.330.331.000.332.005.003.000.331.00
Table 5. Normalized pairwise comparison matrix in this study.
FactorsDRSlopeRainfallDROElevationSoil TypeTWINDVIDDLULCWeighting%Eigenvectors
DR0.080.110.120.110.140.110.130.120.110.100.1211.5110.77
Slope0.180.140.140.160.160.150.130.150.160.160.1515.1610.87
Rainfall0.250.230.210.240.260.230.190.220.260.220.2323.1310.86
DRO0.040.050.050.030.040.040.060.040.040.040.044.4010.63
Elevation0.110.100.110.100.070.120.150.120.140.130.1111.3910.71
Soil type0.050.050.050.040.050.040.050.040.040.040.044.4510.71
TWI0.050.080.080.060.060.080.050.080.060.070.076.8110.78
NDVI0.030.030.030.030.030.020.030.020.030.020.032.7610.75
DD0.150.120.120.110.120.120.110.120.090.150.1211.9810.82
LULC0.070.090.090.120.070.100.100.090.070.060.088.4010.76
λmax 10.77
Table 6. Random Index.
n12345678910
RI000.580.91.121.241.321.411.451.49
Table 7. Flood susceptibility area coverage.
ClassificationArea Covered (Km2)Percentage (%)
low31.735.2
Moderate539.1588.4
High39.186.4
Total area610100
Table 8. Classification accuracy of the flood susceptibility model.
ClassValueC_0C_2C_3C_4TotalU_AccuracyKappa
C_01000110
C_2010001010
C_30018111820.9950
C_40008810
Total110181920100
P_Accuracy1110.88900.9950
Kappa0000000.972
Disclaimer/Publisher’s Note: The statements, opinions and data contained in all publications are solely those of the individual author(s) and contributor(s) and not of MDPI and/or the editor(s). MDPI and/or the editor(s) disclaim responsibility for any injury to people or property resulting from any ideas, methods, instructions or products referred to in the content.