2.1. Study Area
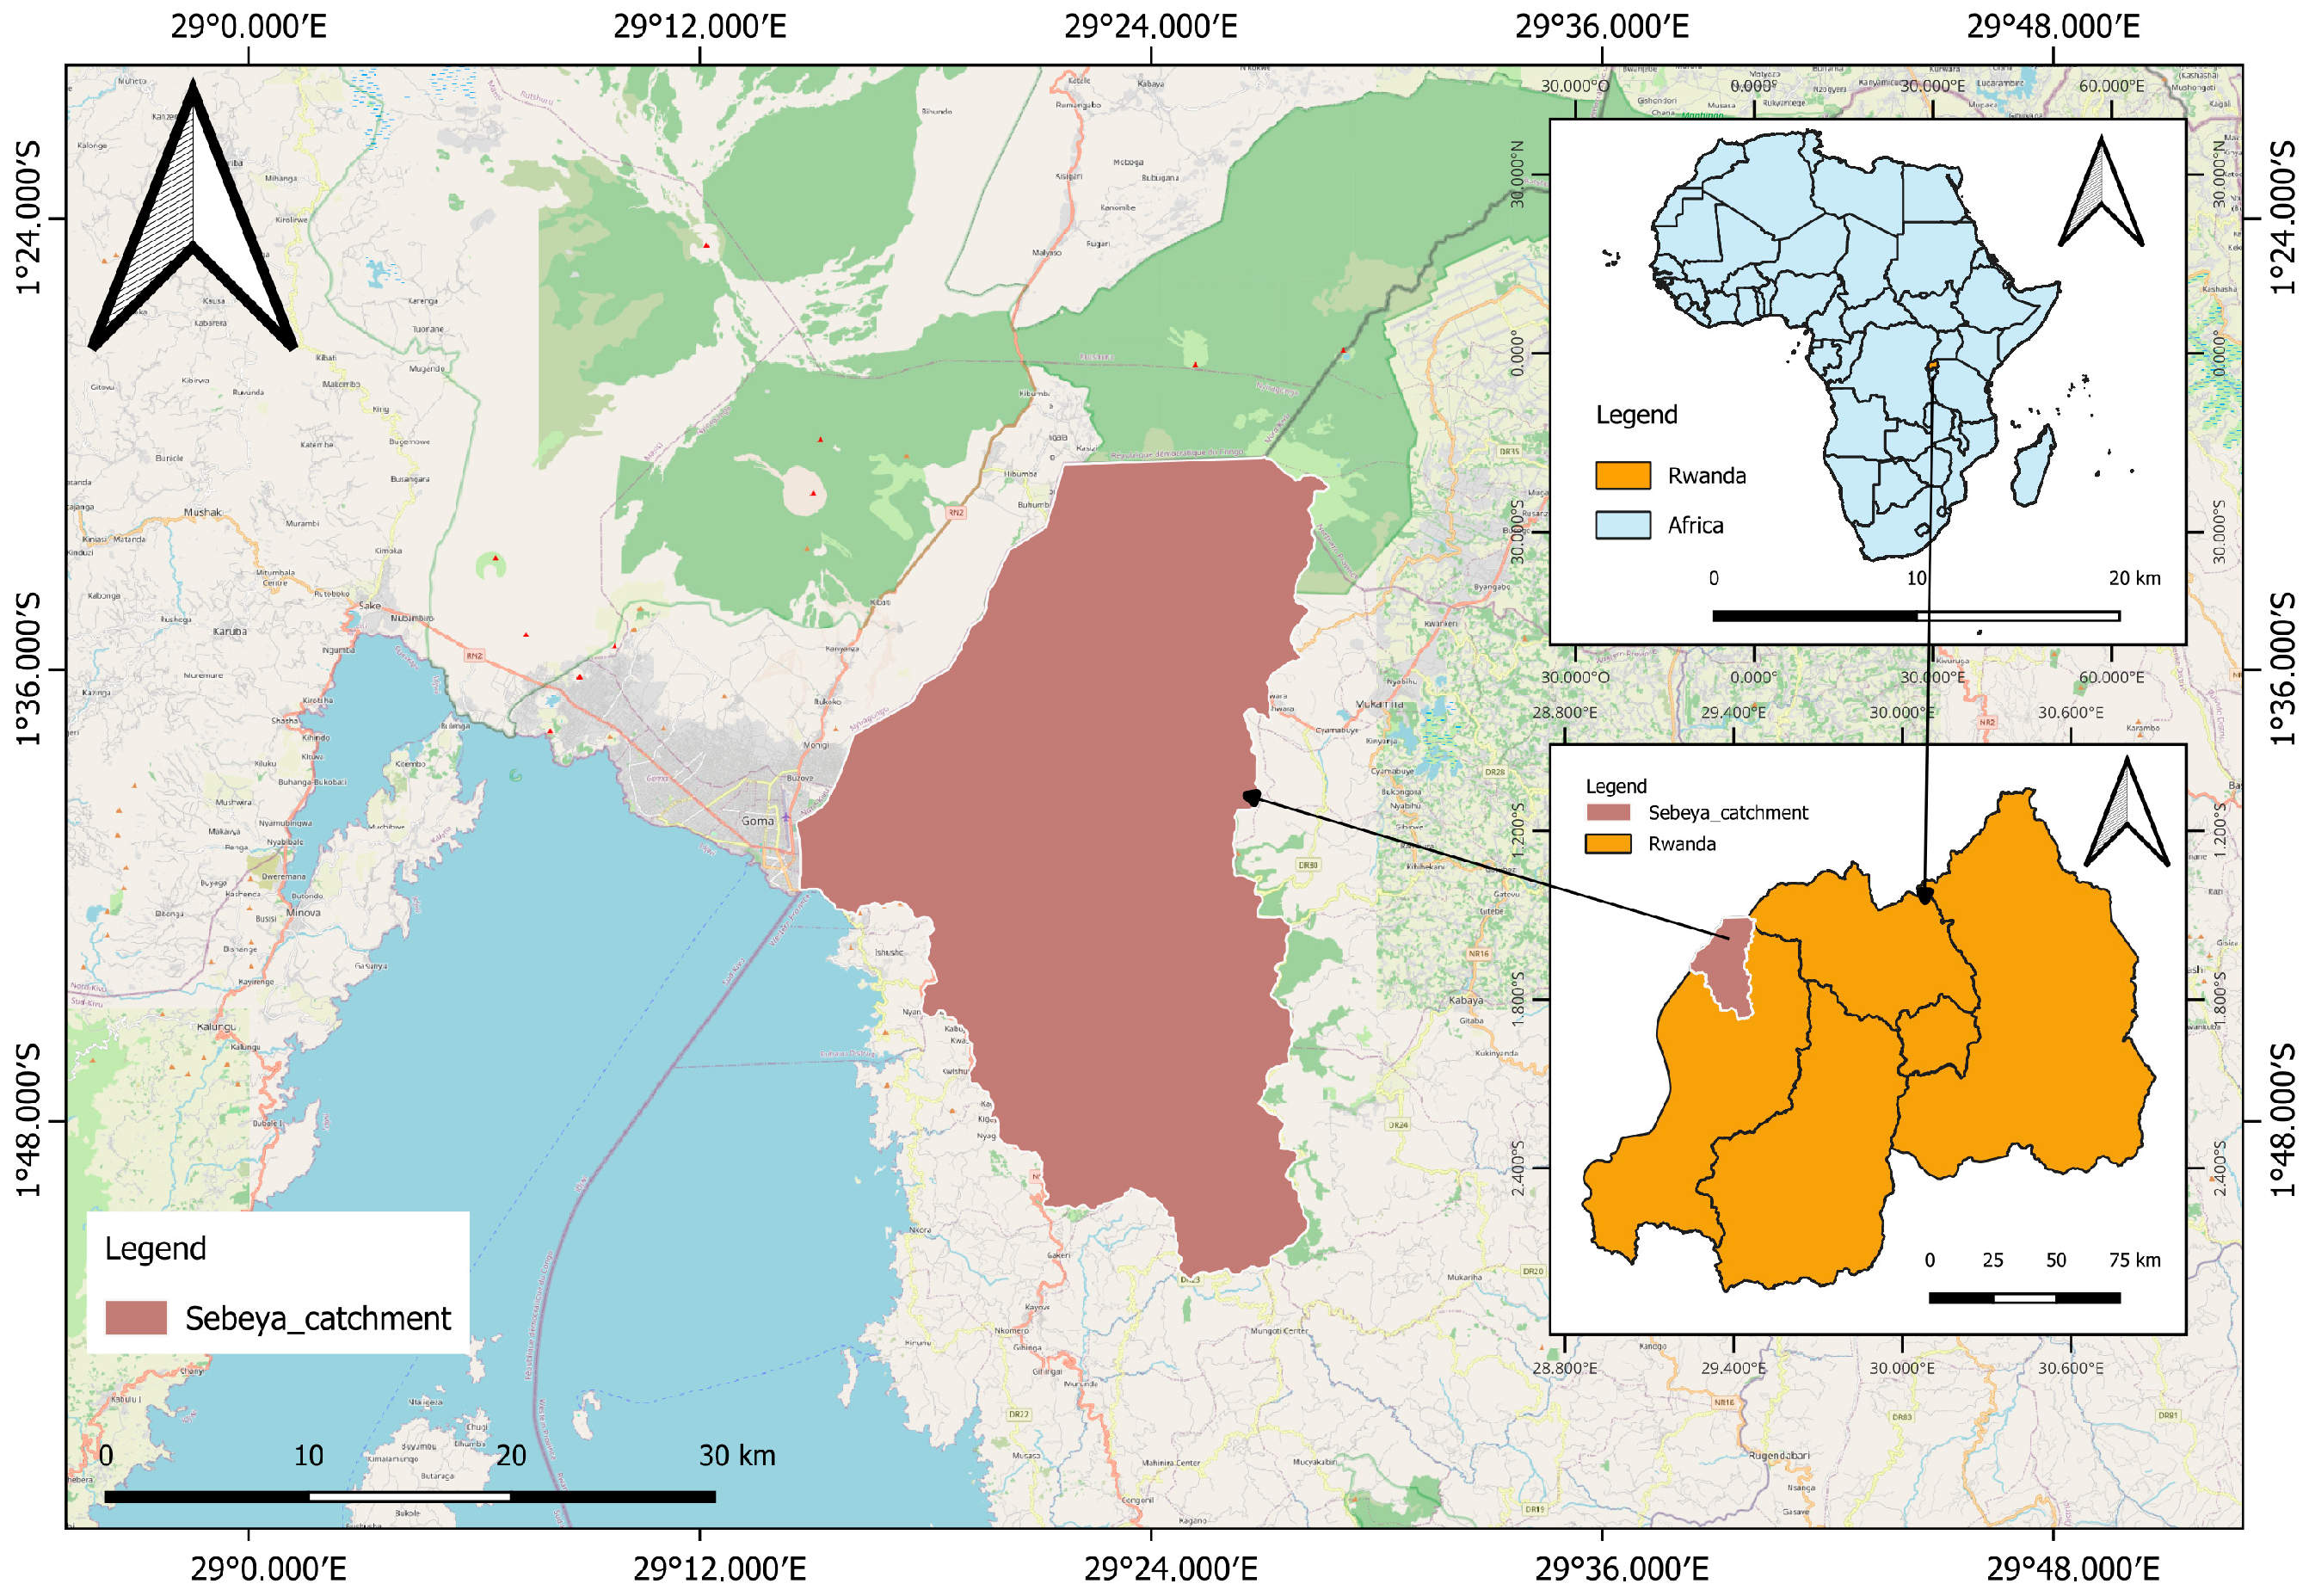
The Sebeya catchment, located in western Rwanda (
Figure 1), is characterized by steep terrain, heavy rainfall, and dense populations. The catchment is part of the Kivu basin, covering 610 km
2, with the Sebeya River flowing 48.4 km from the Nile–Congo divide (2660 m asl) to Lake Kivu (1470 m asl). The catchment is characterized by rugged mountainous terrain in the upstream areas and valleys in the downstream part. Its geology is dominated by Precambrian metamorphic and igneous rocks, with localized volcanic formations, while weathered soils of varying permeability influence infiltration and runoff. Geomorphological features, including steep slopes and deeply incised valleys, promote quick surface runoff and sediment transport during periods of heavy rainfall. The Sebeya catchment experiences a humid tropical highland climate with two rainy seasons (March–May and September–December) and receives more than 1200 mm of annual rainfall, particularly in the parts with higher elevation. Runoff is quickly transported from headwaters to downstream reaches by the thick drainage network, creating a hydrological regime that is extremely sensitive to heavy rainfall.
As a result, the catchment is vulnerable to both flash and riverine floods. Flash floods often occur in the steep upstream and mountainous areas where rainfall quickly causes overland flow, while riverine flooding mostly impacts the downstream valleys owing to channel overflow and floodplain inundation. The catchment supports diverse ecosystems within the Albertine Rift, including forests, wetlands, riparian vegetation, and agricultural landscapes. However, increasing agricultural expansion, settlement growth, and infrastructure development have altered land cover, reducing infiltration capacity and increasing runoff and soil erosion. The interaction of complex topography, heavy rainfall, dense drainage, and land use change makes the Sebeya catchment vulnerable to flooding and an appropriate case study for GIS-based flood susceptibility assessment.
2.2. Collection of Data
The combination of topographic, hydrological, climatic, remote sensing, infrastructural, and field survey datasets from reliable national and international sources served as the foundation for data collection in this study (
Table 1). A 10 m Copernicus Digital Elevation Model (DEM) obtained from the Alaska Satellite Facility (ASF) served as the main topographic dataset. The DEM was employed to extract slope and Topographic Wetness Index (TWI) layers through terrain analysis in a GIS environment. Hydrological parameters, such as drainage density and distance to rivers, were generated from the river network retrieved from the UNESCO World Rivers Database, while the distance to roads layer was derived from the Global Roads Inventory Project (GRIP) road network using Euclidean distance analysis. Long-term daily rainfall data (1981–2021) obtained from the Rwanda Meteorological Agency were interpolated to produce a continuous precipitation surface representing the spatial distribution of rainfall throughout the catchment.
Land cover information was extracted from Sentinel-2 imagery obtained from the ESRI Living Atlas, while vegetation conditions were represented using the Normalized Difference Vegetation Index (NDVI) derived from Landsat-8 imagery retrieved from the USGS Earth Explorer. The flood susceptibility model was validated using historical flood inventory points that were gathered from field surveys and records of flood-prone areas. In addition, administrative boundary data obtained from the University of Rwanda Centre for GIS (CGIS) were used as reference layers during spatial analysis and map production. Field verification was carried out in the study area, where GPS coordinates, ground observations, interviews, and questionnaire data were gathered to validate different types of information, including flood-conditioning factors, historical flood locations, and socioeconomic impacts of floods in the study area. To ensure compatibility during spatial analysis, all datasets were projected to a common coordinate system, converted to raster format where necessary, and standardized to a 10 m spatial resolution before reclassification, weighting, and subsequent GIS- based flood susceptibility modeling.
2.3. Weighting of Flood-Conditioning Factors
This study has chosen 10 factors influencing floods based on the literature and their significance to flood susceptibility. These factors include slope, precipitation, Topographic Wetness Index (TWI), elevation, distance to rivers, distance to roads, drainage density, Soil type, Normalized Difference Vegetation Index (NDVI), and land use/land cover (LULC). Each factor was reclassified into five susceptibility classes ranging from 1 (very low susceptibility) to 5 (very high susceptibility) according to published thresholds and local environmental conditions [
32]. An interdisciplinary panel of six (6) experts from academia and public institutions participated in the weighting procedure. The team’s experts were chosen based on their professional experience and knowledge of flooding (at least five years). Two hydrologists, a Lecturer in GIS and remote sensing, an environmental scientist, a specialist in watershed management, and a practitioner of disaster risk management comprised the team. The Analytical Hierarchy Process (AHP) weighting process was carried out in two rounds. During the first round, the experts independently evaluated the flood-conditioning factors and their pairwise comparisons. After consultation in the review process, they agreed that soil type, an important factor influencing surface runoff and infiltration, had been omitted from the initial list of conditioning factors. The experts also identified that several conditioning factors had been assigned weights that did not adequately reflect their relative importance in flood susceptibility assessment. Based on these observations, the factor set was revised to include soil type, and the pairwise comparison matrix was updated accordingly. In the second round, the revised set of ten conditioning factors was re-evaluated by the experts. Differences in judgments were discussed collectively until a consensus was reached, resulting in the final pairwise comparison matrix and factor weights. Finally, the consistency of the judgments was assessed using AHP Consistency Ratio (CR), and only matrices satisfying the recommended threshold (CR < 0.10) were accepted.
In order to enhance the model’s local relevance, 75 households in the Sebeya catchment’s flood-prone zones participated in a survey that included community knowledge. Two local coordinators of relief efforts in the model village, where flood-affected households were relocated for permanent residence, were among the primary informants considered. A field technician who monitors flood control infrastructure was also interviewed for this study as a significant informant. Respondents participated in the assessment of the environmental factors they perceive affected flooding and took part in identifying areas that were frequently flooded.
Rather than being used directly in the AHP computations, this local information was utilized to validate and improve the classification of the flood-conditioning factors, especially for land use, distance to rivers, vegetation cover, and topographic characteristics. The flood susceptibility map was then created using a GIS-based weighted overlay analysis using the final AHP weights.
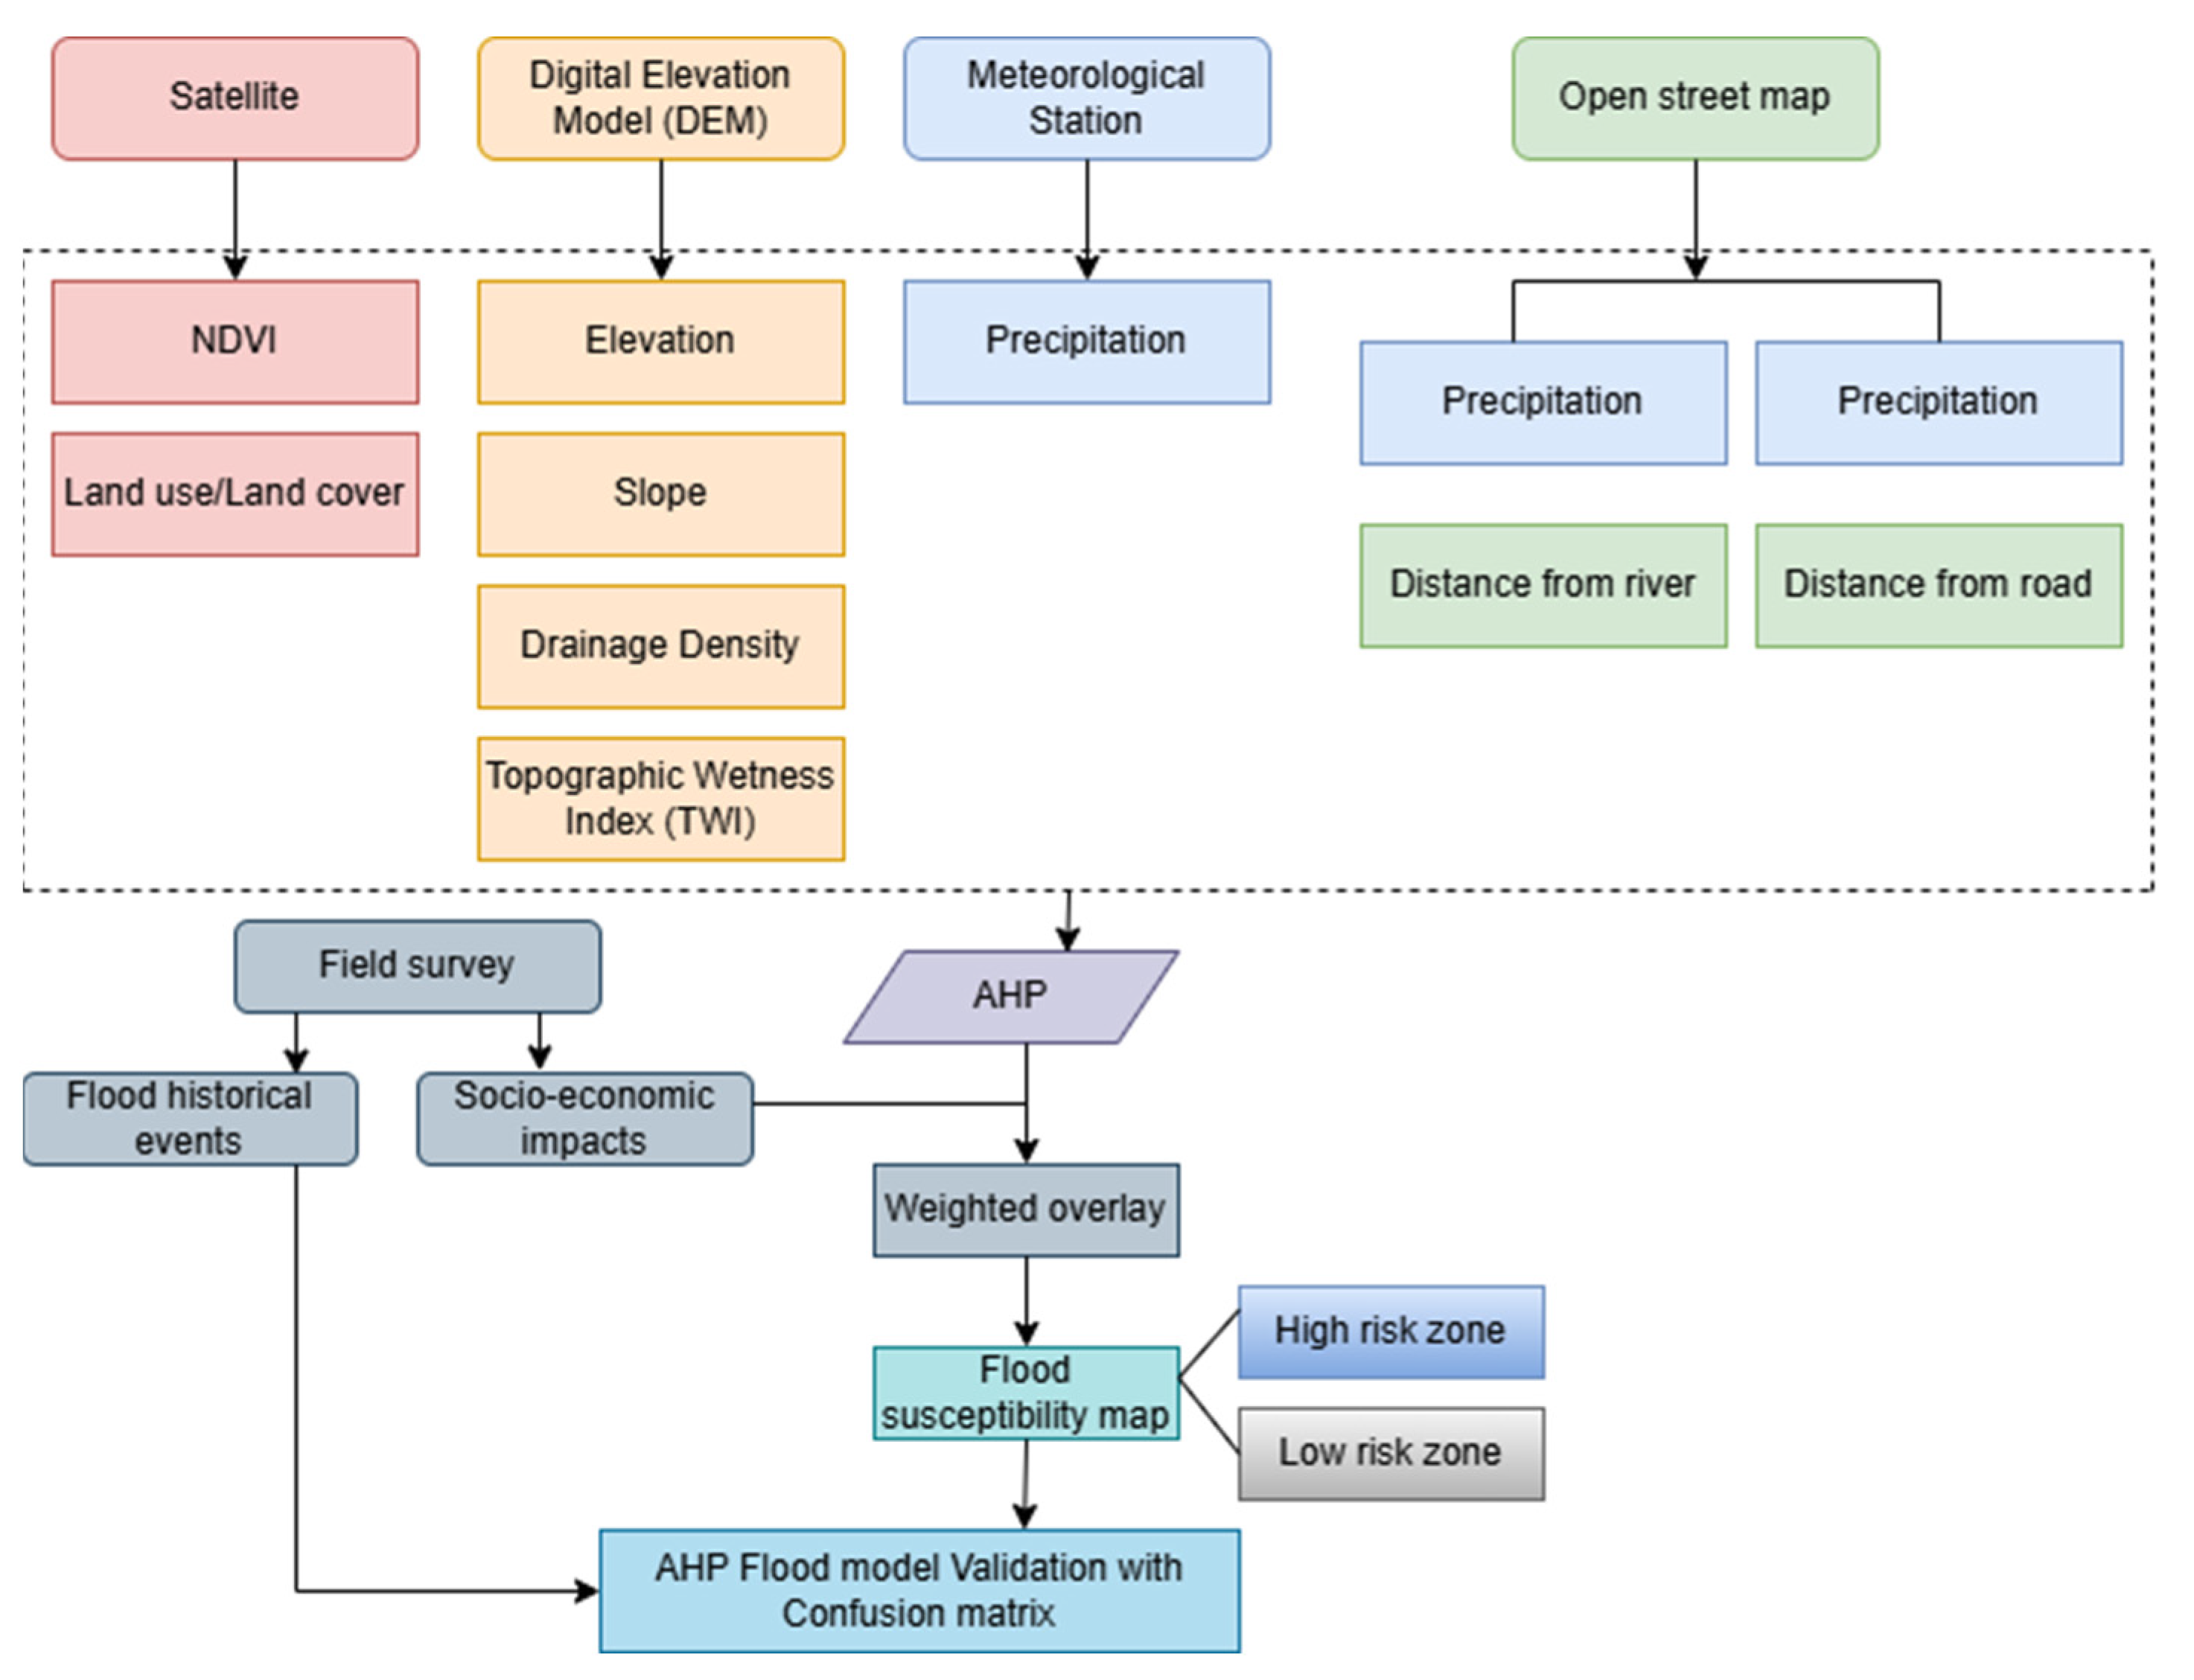
Figure 2 illustrates the methodology used in generating the flood susceptibility map of the catchment under this study.
Natural break (jenk) is an algorithm used to reassign values to raster or vector data based on specific criteria, helping to categorize data into meaningful or homogeneous classes [
33]. It is one of the most widely used and precise algorithms for geographical environmental unit division. Since field verification cannot define the range of each class, we classified each geographical data layer into five categories using Jenks’ natural break algorithm [
34]. In assigning weight to the ten factors of flood susceptibility in this study, precipitation, slope, drainage density, distance to river, and elevation have been given the highest weight since they are directly related to flooding in this area (
Table 2). Historical floods demonstrate that rainfall in the short-rainy season causes the maximum discharges of rivers; locations close to the rivers and the highest drainage density are the most vulnerable to flooding. Land use/land cover and TWI were given a medium weight because they are important characteristics for floods that have less impact. They have a medium influence on floods and are mostly found in lowland parts with less slope and wetlands. Similar to this, road distance, soil type, and NDVI are given less weight because other criteria have overshadowed their significance.
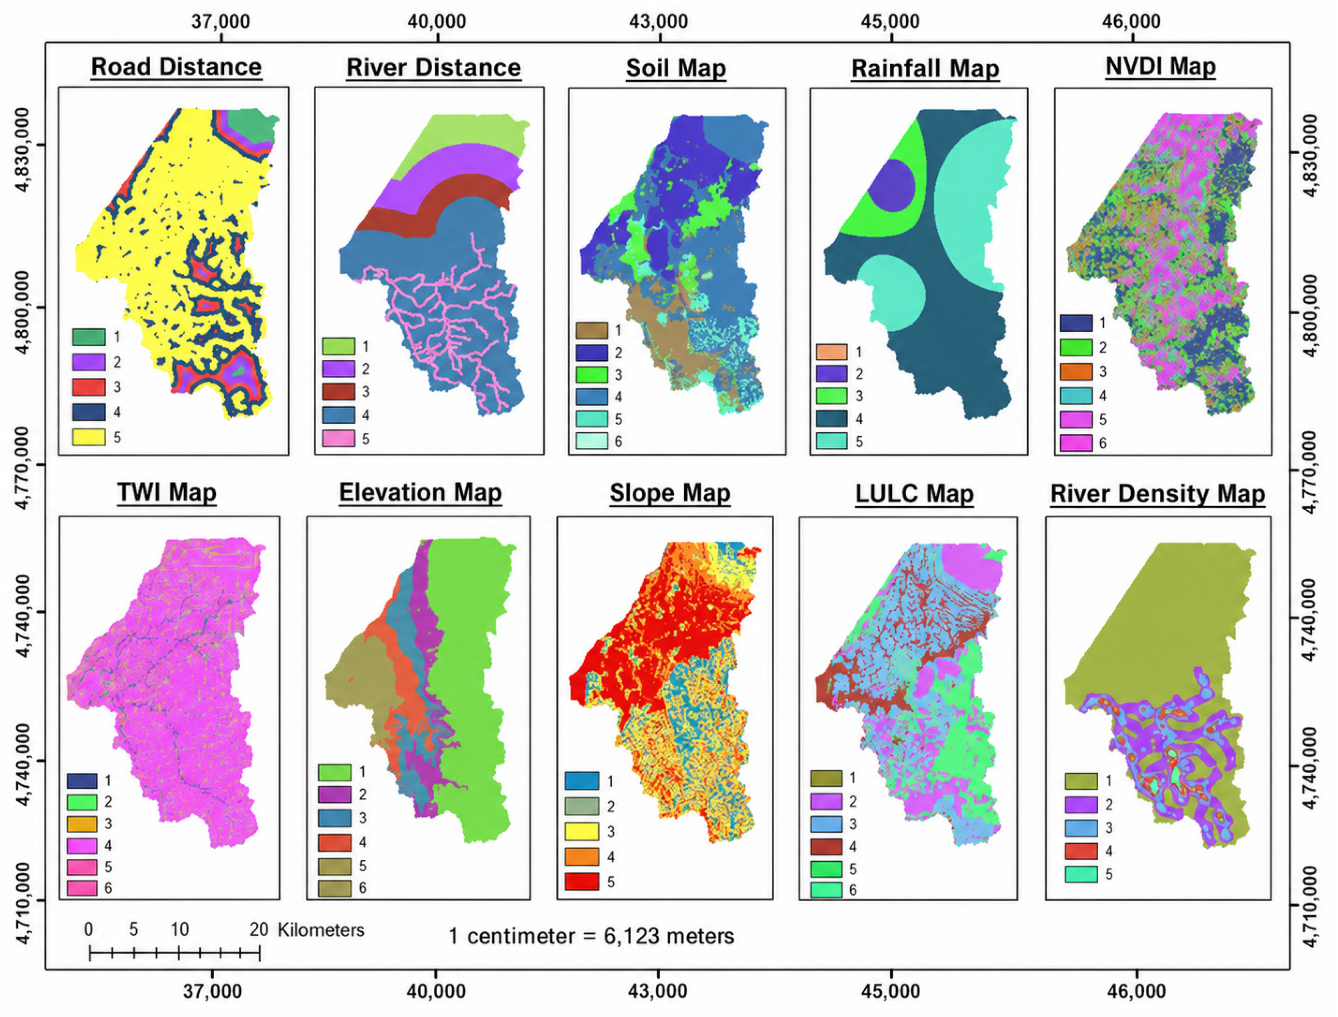
The ten flood susceptibility factors were mapped in this study (
Figure 3). The TWI in this study was derived from the Digital Elevation Model (DEM) using ArcGIS Pro 3.5 [
35]. Precipitation is among the primary causes of river flooding. Precipitation falling in the area determines the runoff that could be, and the area becomes more vulnerable to flooding as the runoff increases [
36]. Rainfall data obtained from the meteorological stations near the Sebeya catchment were analyzed using the Kriging method, and the mean annual rainfall of these stations was calculated using yearly rainfall data from 1981 to 2021. Land use/land cover (LULC) is one of the key determinants of flood-prone areas. Urban areas with impermeable surfaces, such as roads and buildings, are particularly vulnerable to flooding, whereas places covered with vegetation have a higher rate of infiltration and are hence less vulnerable [
37,
38]. This study used supervised classification on Sentinel-2 imagery to categorize the land into five classes: bare land, agriculture, vegetation, water bodies, and settlement. The Normalized Difference Vegetation Index (NDVI) was determined to measure the difference between red light, which vegetation absorbs, and near-infrared light, which plants strongly reflect, to quantify the vegetation characteristics in a given area [
39]. The range between −1 and +1, with a number close to +1, denotes vegetation that serves as flood protection [
40].
Distance to the river (DR) is another factor that contributes to flooding because the river and its surrounding lands are the primary flood channel, making them extremely vulnerable [
36]. The river network used in this investigation was derived from DEM data. The Euclidean function in the ArcGIS platform was used to determine the distance to each river. The distance to a road (DRO) influences the likelihood of flooding because the impervious surface grows close to the road, increasing the risk of flooding [
41]. The Overpass-turbo was also used to retrieve the road network from Open-Street Map. The ArcGIS’s Euclidean function was used to calculate the distance from each road.
The ratio of the basin’s area to the entire drainage channel is known as the drainage density. A high drainage density (DD) increases the amount of water that accumulates in a given area, making it more vulnerable to flooding [
42]. A drainage network was established in the study area by using the DEM and the Raster calculator tool in ArcGIS to create flow accumulation. The drainage density was then determined using the Line Density tool on this drainage network. The soil map was generated from a digital soil dataset for the study area and clipped to the Sebeya catchment boundary in ArcGIS to convert into a raster format using the Raster tool, with a spatial resolution of 10 m to match the other flood-conditioning factors. Finally, the soil classes were reclassified according to their relative susceptibility to flooding, producing the soil type raster used in the AHP analysis.
2.4. Analytical Hierarchy Process (AHP)
AHP is a multi-criteria decision-making approach that was created by Saaty in 1990 [
24], with the goal of streamlining and enhancing the decision-making process. This approach allows planners and users to quantitatively determine a scale of preference derived from a collection of options [
40]. The AHP applies the pairwise comparison approach to determine each criterion’s weight or priority vector [
31]. The use of a pairwise comparison matrix (PCM) enables evaluating the relative weights of several criteria according to the expert’s assessment [
27]. The flood-conditioning factor is prepared as a pairwise comparison matrix with n × n dimensions. Each of these separate flooding factors is given a value on a scale from 1 to 9, where a lower number of 1 indicates that both variables are equally important and a higher number of 9 indicates that the row factor in PCM is more essential than the column factor according to the Saaty scale [
24] in
Table 3.
This methodology created a pairwise comparison matrix of selected flood-conditioning factors of dimension 9 × 9 based on a variety of literature reviews. Each row is compared with each column element to determine the relative relevance for producing the rating score, and the diagonal elements are always equal to 1 in the pairwise comparison matrix displayed in
Table 4 [
43]. The normalized pairwise matrix and final weights, as indicated in
Table 5, were calculated using the importance of each factor to the flood, the data from prior studies, and the expert’s judgment of those who have worked in floods in the past [
44].
When calculating the value for a pairwise comparison matrix, there may be numerous discrepancies; therefore, the Consistency Ratio (CR) must be calculated as a consistency check [
45]. The Consistency Ratio, which is the ratio of a matrix of the same size’s Consistency Index (CI) to Random Inconsistency Index (RI), must always be less than 0.1 in order to be considered acceptable for weighting [
40].
Equation (1) was used to calculate the Consistency Index (CI).
where n expresses the number of factors, and λ expresses the average value of the consistency vector. While calculating the CI, we determine the consistency vector (CV) by multiplying the original pairwise matrix (A) by the weight vector (w), and then divide each element of the consistency vector by the corresponding element in the weight vector (w) (
Table 5). The λmax (Lambda Max) is calculated by considering the average of these values.
According to Formula (1), the Consistency Index (CI) measures the deviation from consistency, where n is the number of criteria (n = 10).
The Random Index (RI) is an empirically computed baseline value of inconsistency for completely random pairwise-comparison matrices of a given size (
Table 6). It is used to normalize the consistency of a real decision maker’s matrix to verify whether the judgments made are acceptably consistent or inconsistent with random guessing. It is a constant that depends on the randomly sampled pairwise matrix (n).
For our example, n = 10, and therefore RI = 1.49.
Finally, the CR is calculated by comparing CI to the RI.
CR = 0.085/1.49 = 0.057. Since 0.057 ≤ 0.10, the consistency of our pairwise comparison matrix is acceptable. We can confidently use the derived weights for the rest of our AHP analysis.
In this study, ten factors were processed in ArcGIS software to discover flood risk susceptible zones.
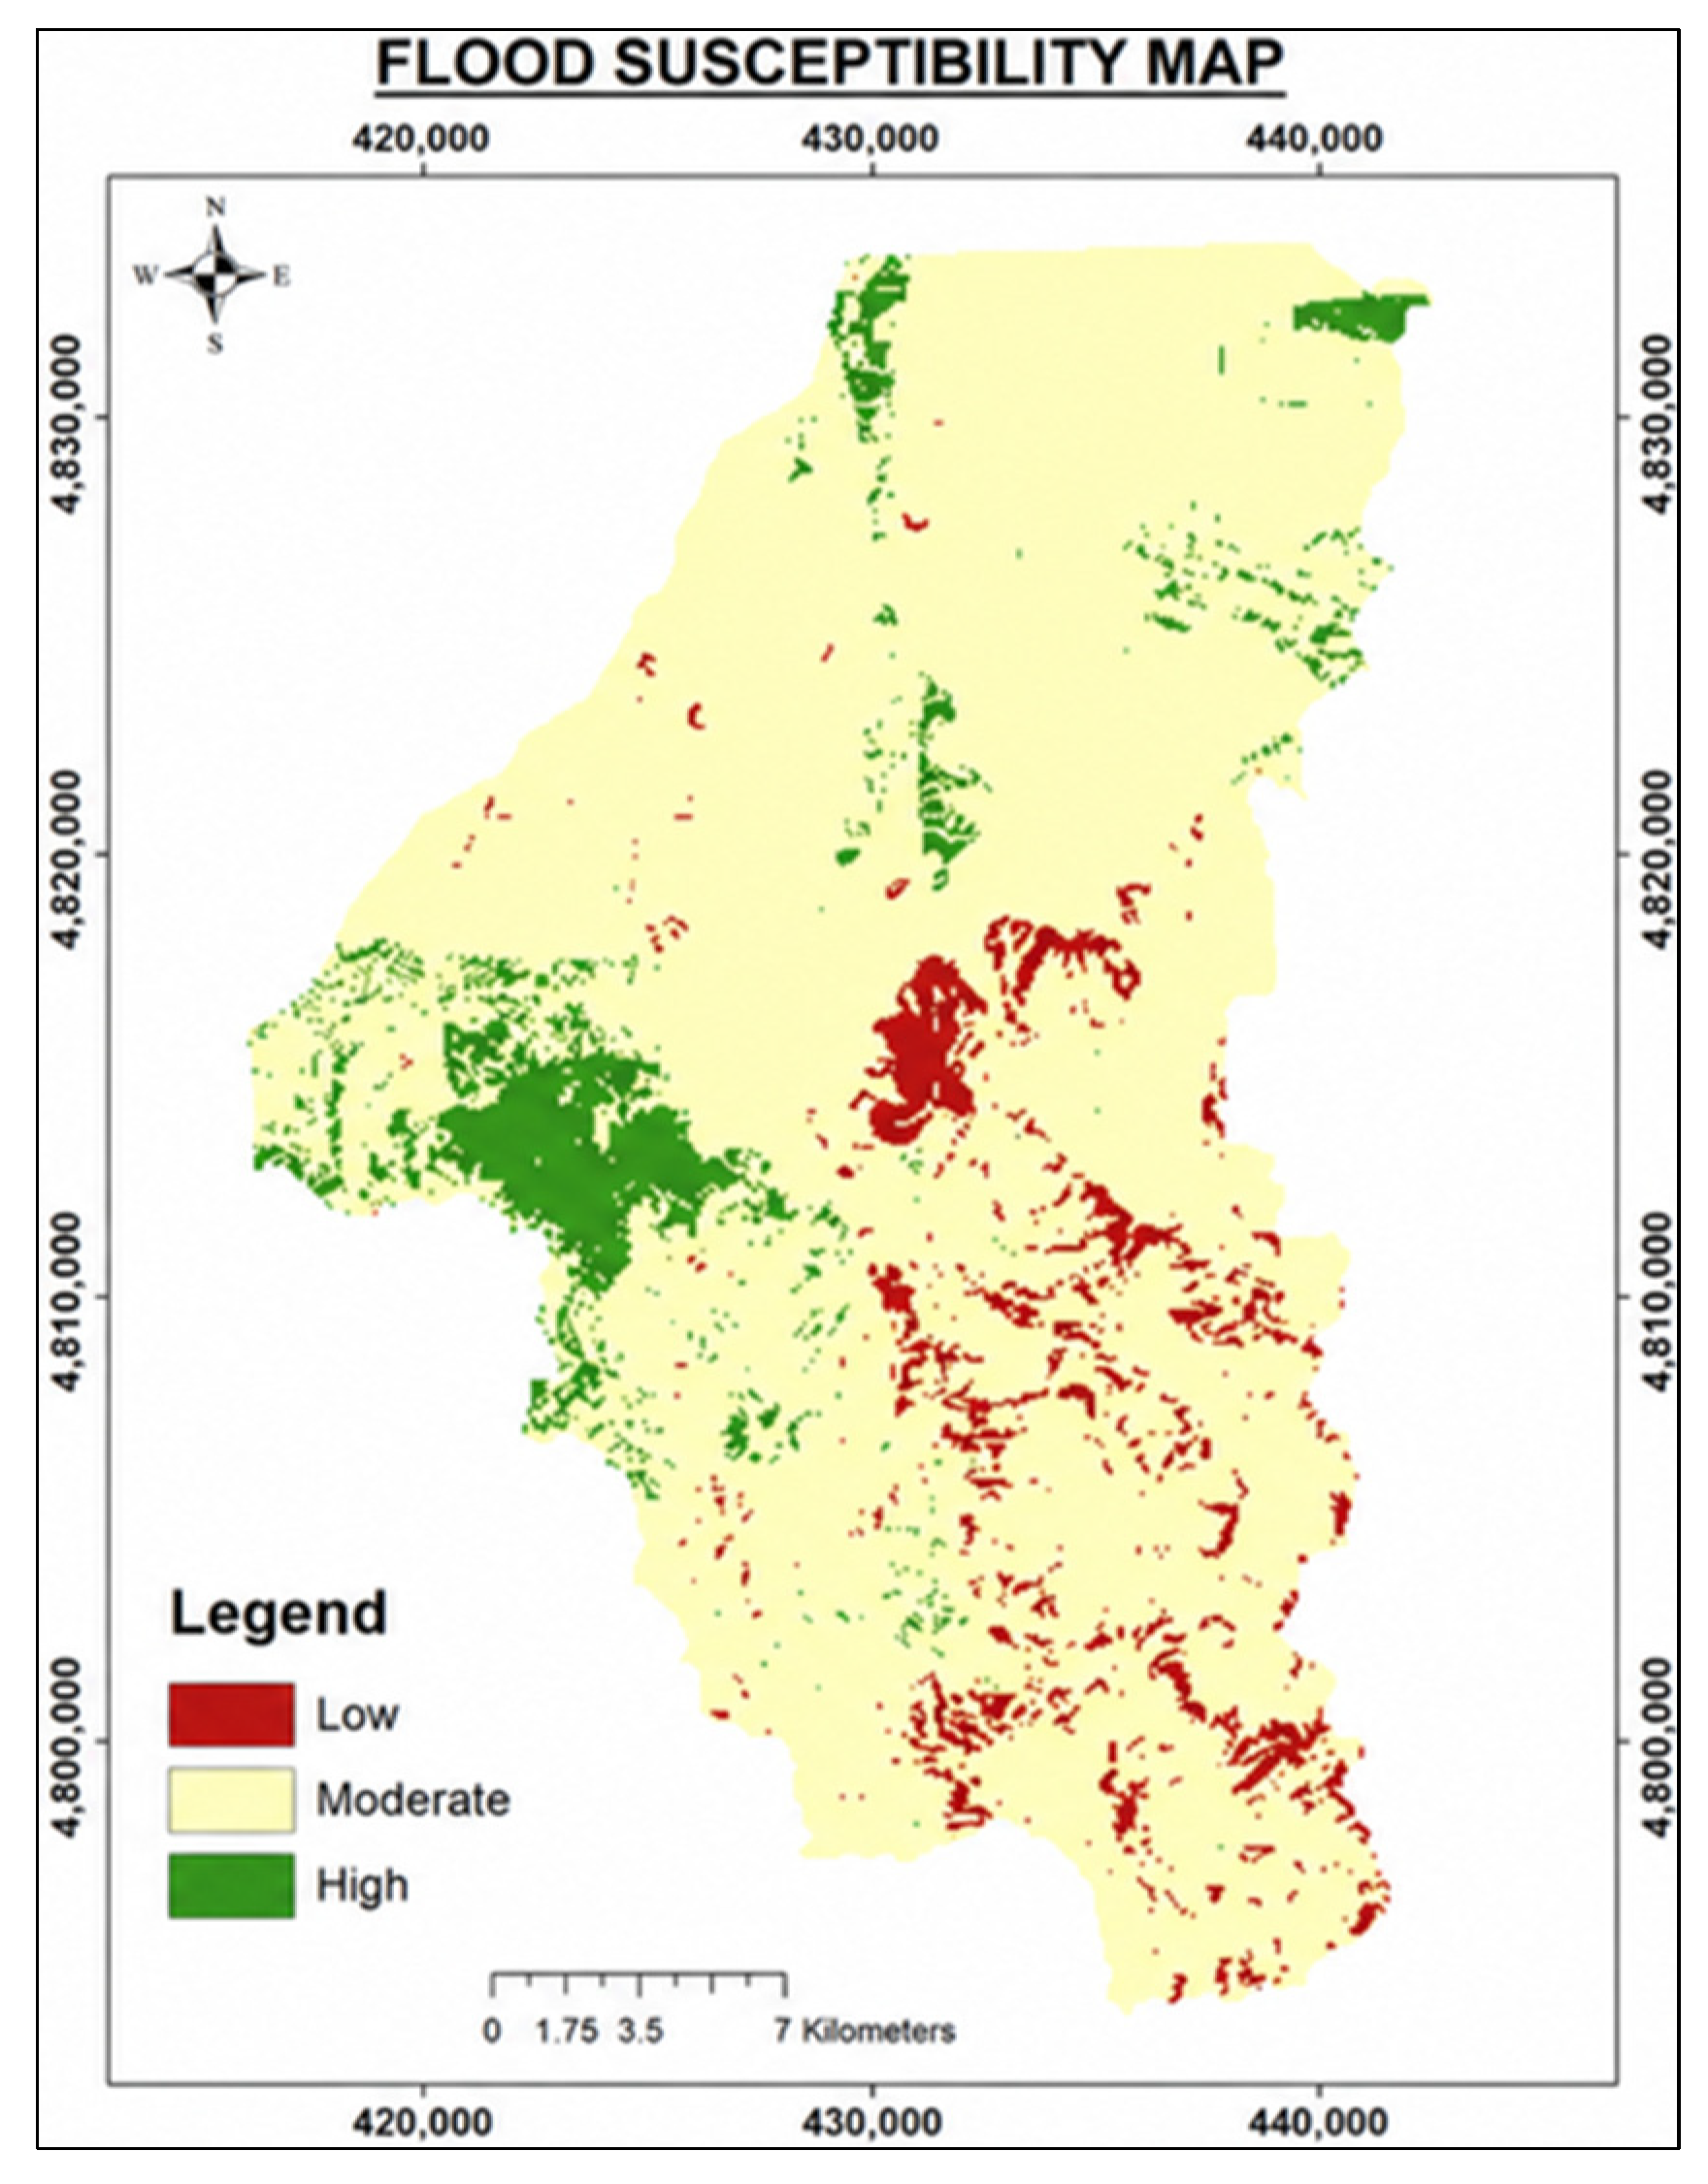
Table 2 states that each of the factor maps has been categorized into five different classes and transformed to a raster format of size. Using the weighted overlay technique, the sum of these outcomes was multiplied by the factor weight of each reclassified map layer. The overall map of flood susceptibility in the study area was produced by Equation (2).
where FS expresses flood susceptibility,
as
a factor weight, and
represents the class of flood susceptibility for each factor
i.
Each flood-conditioning factor was initially reclassified into five susceptibility classes (very low, low, moderate, high, and very high) using the Jenks natural breaks classification approach. The five-class scheme was selected because it preserves the natural distribution of each environmental variable while maintaining consistency with previous GIS-based flood susceptibility studies. After applying the AHP-derived weights through the weighted overlay analysis, a continuous flood susceptibility index was generated. For practical interpretation and decision-making, the resulting index was subsequently grouped into three operational susceptibility classes (low, moderate, and high) representing areas with relatively low, intermediate, and high flood susceptibility. This simplified classification facilitates communication of results to planners and disaster management authorities while retaining the essential spatial patterns of flood susceptibility.
2.6. Validation of Flood Susceptibility Map
The flood susceptibility map was validated using the confusion matrix approach to quantitatively analyze the agreement between the predicted flood-prone areas and observed flood occurrence data [
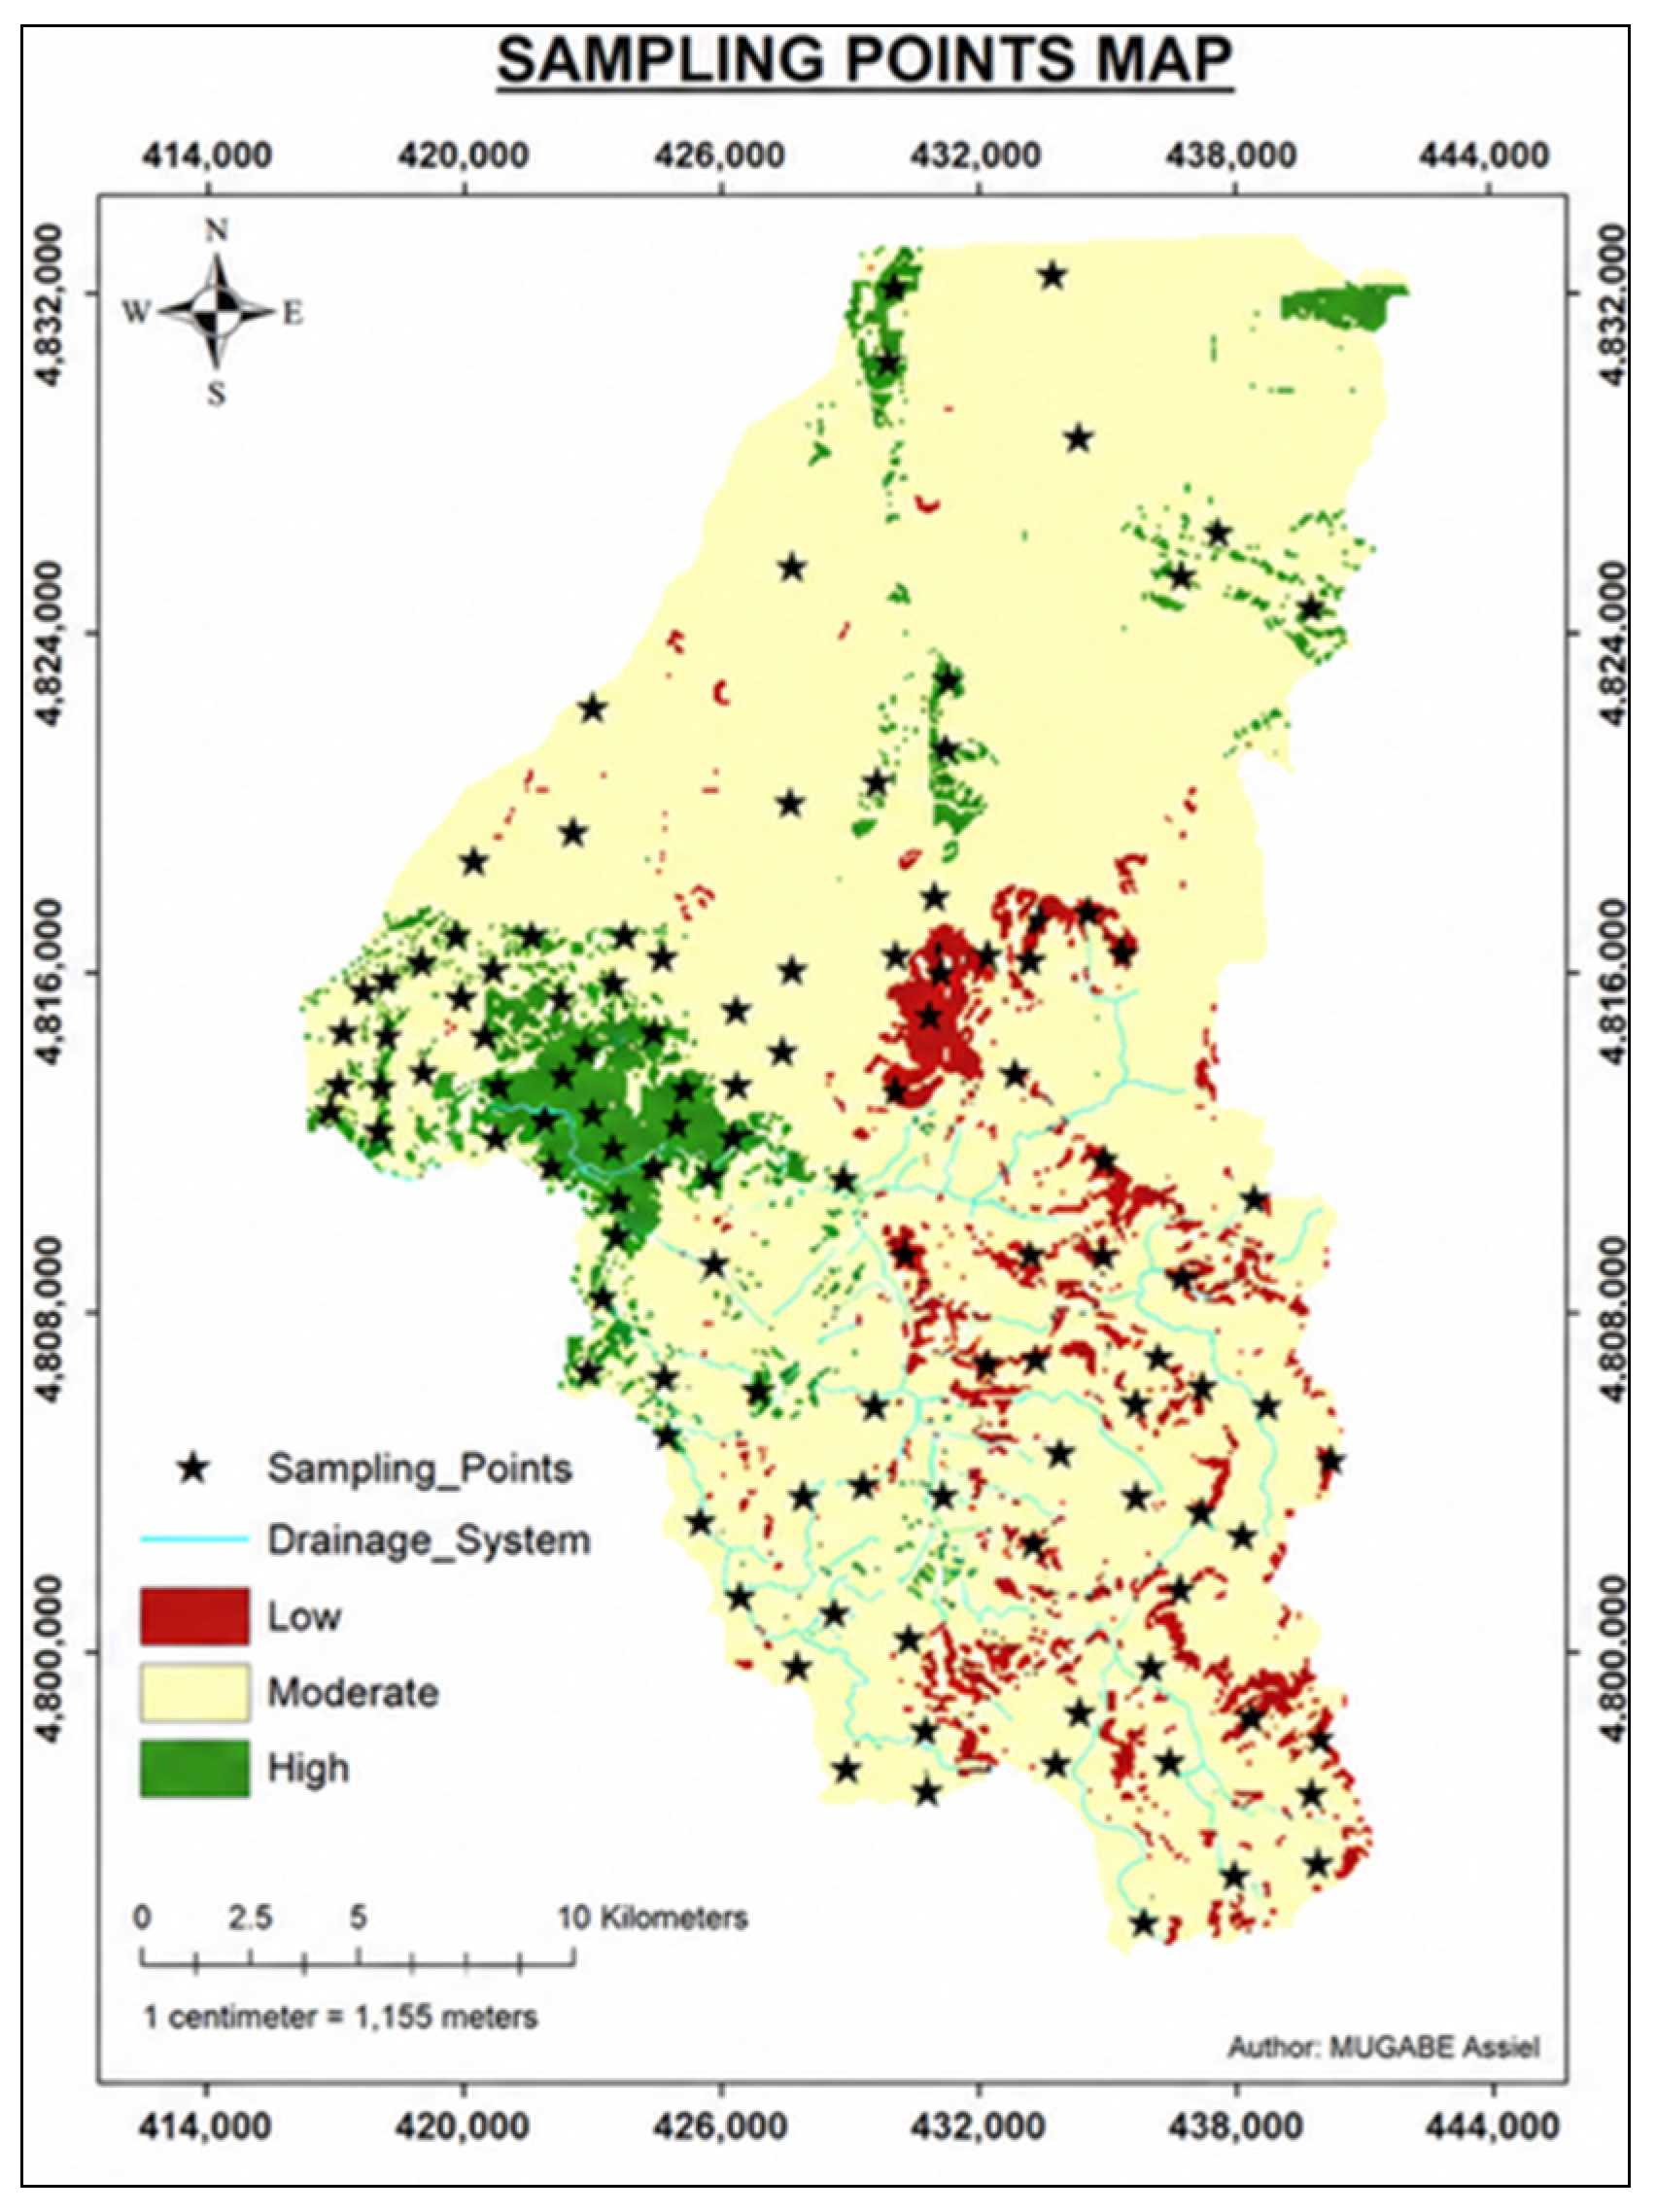
46]. The validation dataset consisted of an independent flood inventory gathered from field visit surveys, historical flood records, and reports from relevant local authorities. These flood occurrence points were not used during the model development, including the expert-based weighting of the flood-conditioning factors or the generation of the flood susceptibility map. Instead, they were reserved exclusively for model validation, ensuring an independent assessment of predictive performance. The validation points were selected based on verified flood events to represent documented flood locations distributed throughout the Sebeya catchment rather than being concentrated within a single location. Their spatial distribution encompasses the upstream, middle, and downstream zones of the catchment, reflecting the variety of features (topography, hydrology, and land use conditions) found in the study area. This spatial coverage reduces the possibility of spatial bias and offers a more accurate assessment of the model’s predictive capacity.
The flood inventory points were overlaid on the final flood susceptibility map in the GIS environment, and their predicted susceptibility classes were compared with the observed flood occurrences to construct a confusion matrix. From this matrix, the Overall Accuracy and Cohen’s Kappa coefficient were computed to quantify the agreement between the predicted susceptibility classes and the observed flood events. Together, these indices offer a strong statistical assessment of the reliability and predictive capabilities of flood susceptibility, supporting its use in flood susceptibility assessment and spatial planning.



 ,
,