Figure 1.
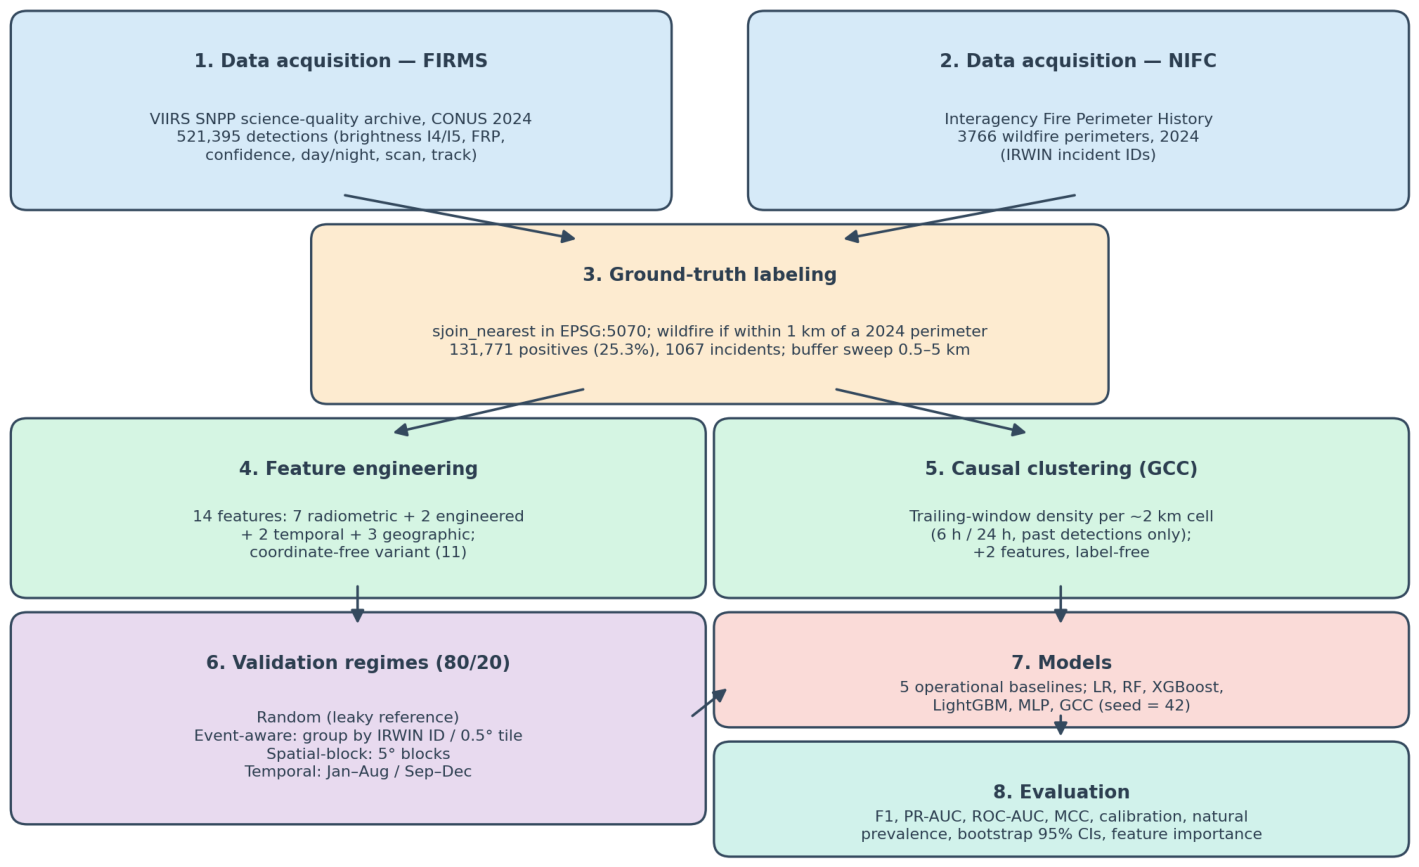
Overview of the study workflow: data acquisition (FIRMS VIIRS SNPP detections and NIFC wildfire perimeters), ground-truth labeling with a 1 km buffer, feature engineering (14 features; 11-feature coordinate-free variant; +2 causal-clustering features for the GCC), four validation regimes, model training, and evaluation.
Figure 1.
Overview of the study workflow: data acquisition (FIRMS VIIRS SNPP detections and NIFC wildfire perimeters), ground-truth labeling with a 1 km buffer, feature engineering (14 features; 11-feature coordinate-free variant; +2 causal-clustering features for the GCC), four validation regimes, model training, and evaluation.
Figure 2.
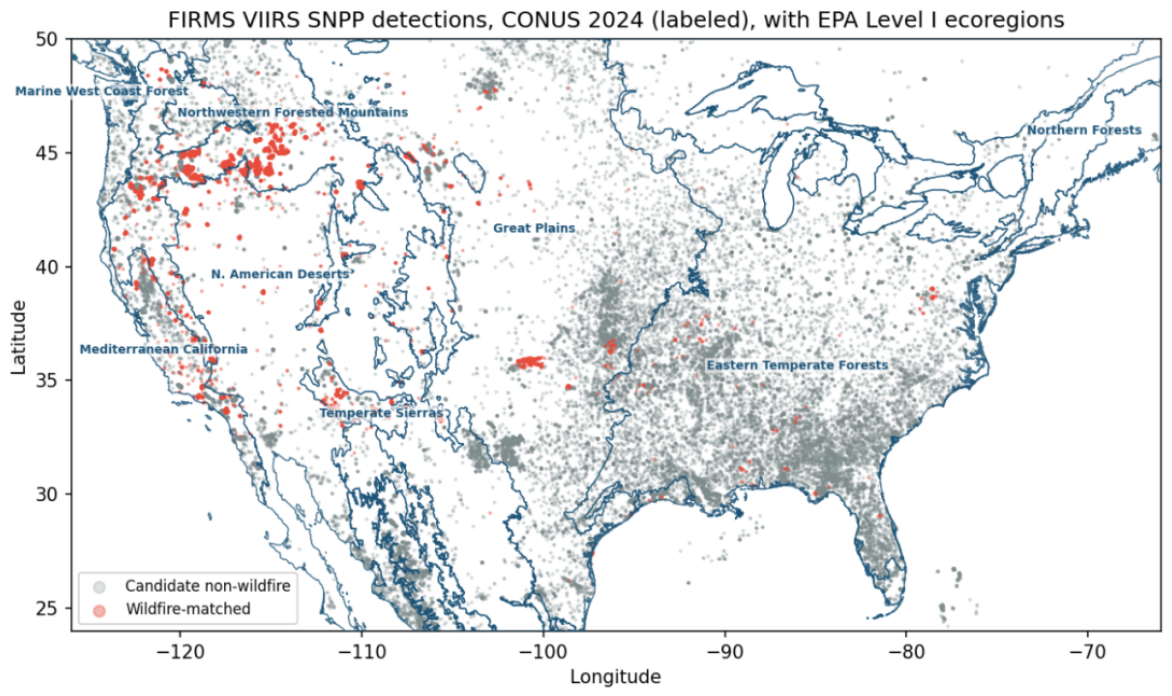
Labeled FIRMS VIIRS SNPP detections, CONUS 2024, with EPA Level I ecoregion boundaries (dark blue) overlaid; plotted sample of 521,395 detections. Wildfire-matched (red) concentrate in the western U.S.; candidate non-wildfire (gray) dominate the agricultural East. This spatial structure makes raw longitude highly predictive in-sample but non-transferable.
Figure 2.
Labeled FIRMS VIIRS SNPP detections, CONUS 2024, with EPA Level I ecoregion boundaries (dark blue) overlaid; plotted sample of 521,395 detections. Wildfire-matched (red) concentrate in the western U.S.; candidate non-wildfire (gray) dominate the agricultural East. This spatial structure makes raw longitude highly predictive in-sample but non-transferable.
Figure 3.
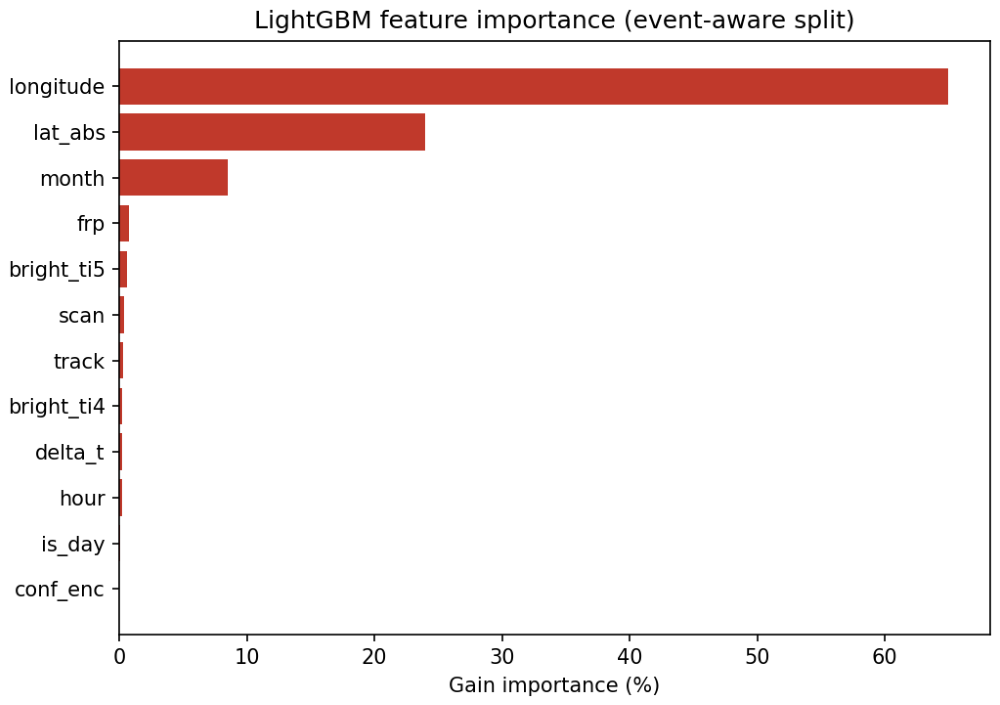
LightGBM gain importance (event-aware split; test ). Geographic and temporal features dominate; radiometric features contribute little.
Figure 3.
LightGBM gain importance (event-aware split; test ). Geographic and temporal features dominate; radiometric features contribute little.
Figure 4.
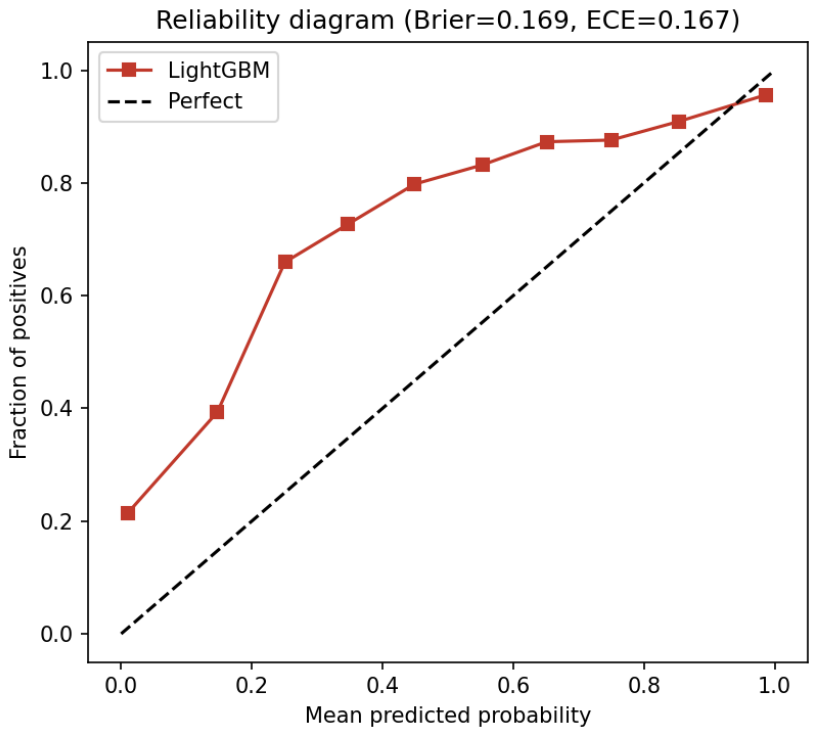
Reliability diagram (LightGBM, event-aware test, ). Deviation from the diagonal reflects miscalibration under spatial distribution shift.
Figure 4.
Reliability diagram (LightGBM, event-aware test, ). Deviation from the diagonal reflects miscalibration under spatial distribution shift.
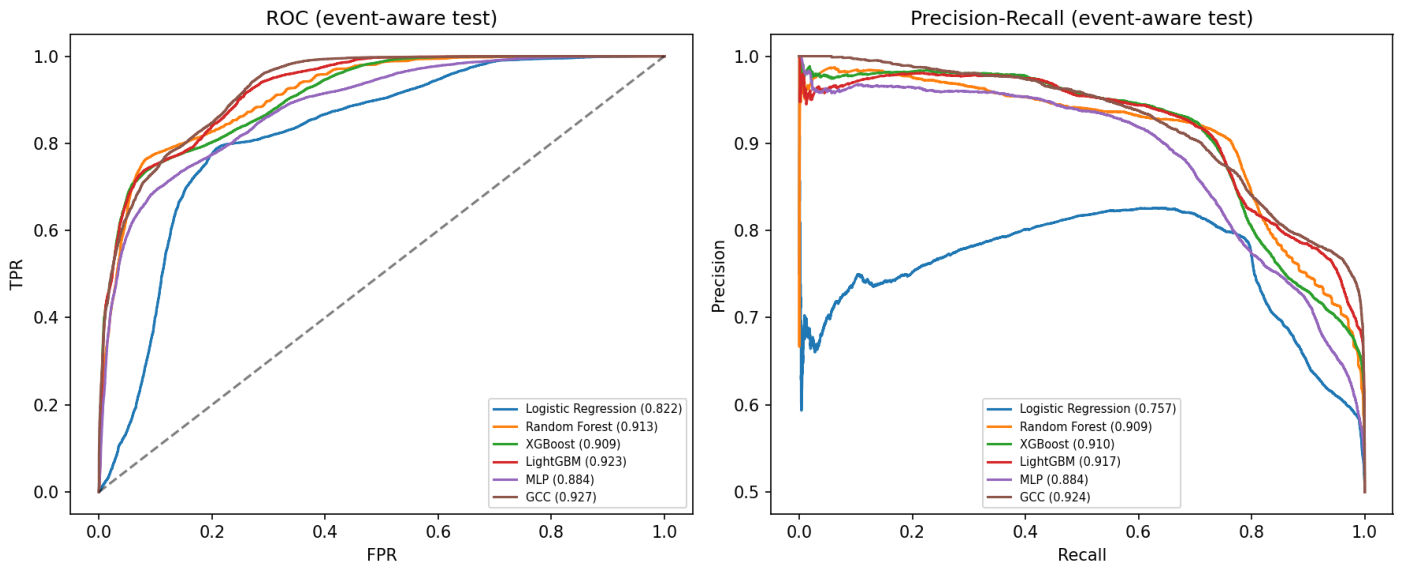
Figure 5.
ROC (left) and precision–recall (right) curves on the event-aware test set (). The gradient-boosted models (LightGBM, causal GCC) attain the highest AUCs, closely followed by Random Forest.
Figure 5.
ROC (left) and precision–recall (right) curves on the event-aware test set (). The gradient-boosted models (LightGBM, causal GCC) attain the highest AUCs, closely followed by Random Forest.
Table 1.
Data sources
used in this evaluation. Additional layers (weather, land cover, terrain, infrastructure) are part of the planned multi-source design but are not used here; they are listed separately in
Appendix A to avoid any implication that they contribute to the reported results.
Table 1.
Data sources
used in this evaluation. Additional layers (weather, land cover, terrain, infrastructure) are part of the planned multi-source design but are not used here; they are listed separately in
Appendix A to avoid any implication that they contribute to the reported results.
| Source | Variables | Res. | Period | Records |
|---|
| FIRMS VIIRS SNPP | Brightness (I4/I5), FRP, confidence, day/night, scan/track | 375 m | 2024 | 521,395 |
| NIFC Perimeters | Fire perimeters, IRWIN ID, dates, acres, type | Polygon | 2020–2024 | 18,484 |
Table 2.
Candidate-negative composition (). Categories are mutually exclusive in the order listed.
Table 2.
Candidate-negative composition (). Categories are mutually exclusive in the order listed.
| Source | Count | % |
|---|
| Persistent hot source (>30 d span, <100 m cell) | 91,046 | 23.4 |
| Spatially isolated (>50 km from any 2024 wildfire) | 157,064 | 40.3 |
| Other unmatched (<50 km, non-persistent) | 141,514 | 36.3 |
| Total candidate negatives | 389,624 | 100.0 |
Table 3.
Feature groups used in this evaluation (14 features). The GCC variant appends two causal trailing-window cluster features.
Table 3.
Feature groups used in this evaluation (14 features). The GCC variant appends two causal trailing-window cluster features.
| Group | Features |
|---|
| Satellite (7) | bright_ti4, bright_ti5, FRP, confidence, day/night, scan, track |
| Engineered (2) | , |
| Temporal (2) | month, hour |
| Geographic (3) | latitude, longitude, |
| Cluster (GCC, +2) | dens_6h, dens_24h (causal trailing-window density) |
Table 4.
Classification performance on the held-out
event-aware test set (balanced,
). Best ML F1 in
bold. Square brackets give bootstrap 95% CIs for F1 (1000 resamples); differences among the top tree models are statistically resolvable but practically minor (see text). AUC/Brier undefined for hard-threshold baselines. GCC uses
causal trailing-window clustering (
Section 3.4).
Table 4.
Classification performance on the held-out
event-aware test set (balanced,
). Best ML F1 in
bold. Square brackets give bootstrap 95% CIs for F1 (1000 resamples); differences among the top tree models are statistically resolvable but practically minor (see text). AUC/Brier undefined for hard-threshold baselines. GCC uses
causal trailing-window clustering (
Section 3.4).
| Model | Prec | Rec | F1 | F1 95% CI | PR-AUC | ROC-AUC | MCC |
|---|
| Baselines |
| FIRMS confidence (high) | 0.622 | 0.071 | 0.128 | [0.120, 0.135] | — | — | 0.060 |
| FIRMS confidence (≥nominal) | 0.492 | 0.929 | 0.643 | [0.637, 0.649] | — | — | −0.066 |
| FRP threshold (>10 MW) | 0.636 | 0.320 | 0.426 | [0.417, 0.434] | — | — | 0.158 |
| Brightness (>320 K) | 0.508 | 0.625 | 0.561 | [0.554, 0.568] | — | — | 0.021 |
| Confidence + FRP rule | 0.570 | 0.446 | 0.501 | [0.493, 0.508] | — | — | 0.112 |
| ML Classifiers |
| Logistic Regression | 0.811 | 0.723 | 0.765 | [0.759, 0.770] | 0.757 | 0.822 | 0.558 |
| Random Forest | 0.927 | 0.670 | 0.777 | [0.772, 0.783] | 0.909 | 0.913 | 0.642 |
| XGBoost | 0.940 | 0.635 | 0.758 | [0.751, 0.764] | 0.910 | 0.909 | 0.628 |
| LightGBM | 0.935 | 0.650 | 0.767 | [0.761, 0.773] | 0.917 | 0.923 | 0.635 |
| MLP | 0.912 | 0.621 | 0.739 | [0.732, 0.745] | 0.884 | 0.884 | 0.592 |
| GCC (causal clustering) | 0.921 | 0.650 | 0.762 | [0.756, 0.769] | 0.924 | 0.927 | 0.622 |
Table 5.
Geographic feature sensitivity across validation regimes (LightGBM, balanced test; : random 16,000, event-aware 27,444, spatial-block 28,434, temporal 80,000). The naive random split is dramatically optimistic; coordinates help in-distribution but hurt spatial transfer.
Table 5.
Geographic feature sensitivity across validation regimes (LightGBM, balanced test; : random 16,000, event-aware 27,444, spatial-block 28,434, temporal 80,000). The naive random split is dramatically optimistic; coordinates help in-distribution but hurt spatial transfer.
| Validation Regime | Features | Prec | Rec | F1 | PR-AUC |
|---|
| Random (stratified) | with lat/lon | 0.988 | 0.983 | 0.985 | 0.998 |
| coordinate-free | 0.855 | 0.935 | 0.893 | 0.936 |
| Event-aware (primary) | with lat/lon | 0.935 | 0.650 | 0.767 | 0.917 |
| coordinate-free | 0.815 | 0.692 | 0.748 | 0.818 |
| Spatial-block (5°) | with lat/lon | 0.878 | 0.488 | 0.627 | 0.833 |
| coordinate-free | 0.847 | 0.791 | 0.818 | 0.889 |
| Temporal (train January–August) | with lat/lon | 0.891 | 0.821 | 0.855 | 0.950 |
| coordinate-free | 0.716 | 0.918 | 0.805 | 0.783 |
Table 6.
F1 by model and validation regime (balanced test; : event-aware 27,444, spatial-block 28,434, temporal 80,000); square brackets give bootstrap 95% CIs (1000 resamples), PR-AUC in parentheses. The best F1 in each validation regime (column) is shown in bold. Coordinate-free GCC generalizes best to unseen regions (spatial-block).
Table 6.
F1 by model and validation regime (balanced test; : event-aware 27,444, spatial-block 28,434, temporal 80,000); square brackets give bootstrap 95% CIs (1000 resamples), PR-AUC in parentheses. The best F1 in each validation regime (column) is shown in bold. Coordinate-free GCC generalizes best to unseen regions (spatial-block).
| Model | Event-Aware | Spatial-Block | Temporal |
|---|
| LightGBM, with lat/lon | 0.767 [0.761, 0.773] (0.92) | 0.627 [0.619, 0.634] (0.83) | 0.855 [0.852, 0.857] (0.95) |
| LightGBM, coordinate-free | 0.748 [0.742, 0.755] (0.82) | 0.818 [0.813, 0.823] (0.89) | 0.805 [0.802, 0.807] (0.78) |
| GCC, with lat/lon | 0.762 [0.756, 0.769] (0.92) | 0.805 [0.800, 0.810] (0.93) | 0.876 [0.873, 0.878] (0.95) |
| GCC, coordinate-free | 0.772 [0.766, 0.777] (0.84) | 0.868 [0.864, 0.873] (0.93) | 0.829 [0.826, 0.832] (0.84) |
Table 7.
Spatial-block-size sensitivity (LightGBM, balanced test). “Primary split” is the seed-42 assignment used elsewhere in the paper, with bootstrap 95% CIs; “5 splits” reports mean ± SD of F1 over five random block-to-fold assignments. (primary split): 35,884 (2.5°), 28,434 (5°), 24,672 (10°).
Table 7.
Spatial-block-size sensitivity (LightGBM, balanced test). “Primary split” is the seed-42 assignment used elsewhere in the paper, with bootstrap 95% CIs; “5 splits” reports mean ± SD of F1 over five random block-to-fold assignments. (primary split): 35,884 (2.5°), 28,434 (5°), 24,672 (10°).
| Block Size | Blocks | Features | F1, Primary Split | F1, 5 Splits | Worst Split |
|---|
| 2.5° | 218 | with lat/lon | 0.926 [0.923, 0.929] | 0.73 ± 0.14 | 0.531 |
| | | coordinate-free | 0.852 [0.848, 0.856] | 0.81 ± 0.04 | 0.758 |
| 5° | 65 | with lat/lon | 0.627 [0.619, 0.634] | 0.81 ± 0.10 | 0.627 |
| | | coordinate-free | 0.818 [0.813, 0.823] | 0.85 ± 0.05 | 0.772 |
| 10° | 20 | with lat/lon | 0.874 [0.870, 0.879] | 0.38 ± 0.39 | 0.004 |
| | | coordinate-free | 0.873 [0.869, 0.877] | 0.56 ± 0.29 | 0.091 |
Table 8.
Clustering-window sensitivity for the coordinate-free GCC (balanced test; : event-aware 27,444, spatial-block 28,434). Cells show F1 with bootstrap 95% CIs and PR-AUC in parentheses.
Table 8.
Clustering-window sensitivity for the coordinate-free GCC (balanced test; : event-aware 27,444, spatial-block 28,434). Cells show F1 with bootstrap 95% CIs and PR-AUC in parentheses.
| Trailing Windows | Event-Aware | Spatial-Block |
|---|
| 3 h/12 h | 0.764 [0.758, 0.770] (0.83) | 0.867 [0.863, 0.871] (0.92) |
| 6 h/24 h (default) | 0.772 [0.766, 0.777] (0.84) | 0.868 [0.864, 0.873] (0.93) |
| 12 h/48 h | 0.770 [0.764, 0.776] (0.84) | 0.873 [0.869, 0.877] (0.93) |
Table 9.
Confusion matrix: LightGBM (full features), event-aware test, (balanced, 13,722 per class; ).
Table 9.
Confusion matrix: LightGBM (full features), event-aware test, (balanced, 13,722 per class; ).
| | Predicted Non-Wildfire | Predicted Wildfire |
|---|
| True Non-Wildfire | 13,107 | 615 |
| True Wildfire | 4807 | 8915 |
Table 10.
Cumulative threshold analysis (LightGBM, event-aware test, ). Each row applies a single threshold .
Table 10.
Cumulative threshold analysis (LightGBM, event-aware test, ). Each row applies a single threshold .
| Alerts | TP | FP | Prec | Rec | FPR |
|---|
| 0.90 | 6957 | 6652 | 305 | 0.956 | 0.485 | 0.022 |
| 0.80 | 7892 | 7502 | 390 | 0.951 | 0.547 | 0.028 |
| 0.70 | 8481 | 8018 | 463 | 0.945 | 0.584 | 0.034 |
| 0.50 | 9530 | 8915 | 615 | 0.935 | 0.650 | 0.045 |
| 0.40 | 9995 | 9286 | 709 | 0.929 | 0.677 | 0.052 |
Table 11.
Mutually exclusive priority tiers (LightGBM, event-aware test, ). “% of all WF” is the share of all true wildfires captured by the tier; “% of all non-WF” the share of all negatives.
Table 11.
Mutually exclusive priority tiers (LightGBM, event-aware test, ). “% of all WF” is the share of all true wildfires captured by the tier; “% of all non-WF” the share of all negatives.
| Tier | Det. | True WF | Prec | % of All WF | % of All Non-WF |
|---|
| High () | 7892 | 7502 | 0.951 | 54.7 | 2.8 |
| Review () | 1638 | 1413 | 0.863 | 10.3 | 1.6 |
| Low () | 17,914 | 4807 | 0.268 | 35.0 | 95.5 |
Table 12.
Incremental ablation (LightGBM, event-aware test, ).
Table 12.
Incremental ablation (LightGBM, event-aware test, ).
| Features (Cumulative) | Prec | Rec | F1 | PR-AUC |
|---|
| Satellite radiometric | 0.676 | 0.615 | 0.644 | 0.712 |
| +Engineered (, logFRP) | 0.674 | 0.614 | 0.643 | 0.713 |
| +Temporal (month, hour) | 0.815 | 0.692 | 0.748 | 0.818 |
| +Geographic (lat, lon) | 0.935 | 0.650 | 0.767 | 0.917 |
Table 13.
Top features (LightGBM, event-aware; permutation importance computed on the test set, ). Gain % is each feature’s share of the model’s total split-gain, normalized to sum to 100% over all 14 features (remaining low-gain features are omitted from the table). Group totals, obtained by summing member-feature shares: geographic 88.9% (longitude 65.0 + |latitude| 23.9 + latitude 0.0), temporal 8.7%, satellite 2.2%, engineered 0.2%.
Table 13.
Top features (LightGBM, event-aware; permutation importance computed on the test set, ). Gain % is each feature’s share of the model’s total split-gain, normalized to sum to 100% over all 14 features (remaining low-gain features are omitted from the table). Group totals, obtained by summing member-feature shares: geographic 88.9% (longitude 65.0 + |latitude| 23.9 + latitude 0.0), temporal 8.7%, satellite 2.2%, engineered 0.2%.
| Feature | Gain % | Permutation F1 |
|---|
| longitude | 65.0 | 0.324 |
| |latitude| | 23.9 | 0.220 |
| month | 8.5 | 0.147 |
| FRP | 0.7 | 0.016 |
| bright_ti5 | 0.6 | 0.010 |
| scan | 0.4 | −0.001 |
| bright_ti4 | 0.2 | 0.003 |
Table 14.
Label-buffer sensitivity (event-aware split; balanced test at each buffer, –); cells show F1 (PR-AUC). LightGBM uses full features; GCC is coordinate-free. Positives and prevalence shift modestly; metrics shift substantially.
Table 14.
Label-buffer sensitivity (event-aware split; balanced test at each buffer, –); cells show F1 (PR-AUC). LightGBM uses full features; GCC is coordinate-free. Positives and prevalence shift modestly; metrics shift substantially.
| Buffer | Positives | Prevalence | LightGBM (Full) | GCC (Coordinate-Free) |
|---|
| 500 m | 130,501 | 25.0% | 0.598 (0.91) | 0.845 (0.90) |
| 1 km | 131,771 | 25.3% | 0.767 (0.92) | 0.772 (0.84) |
| 2 km | 134,411 | 25.8% | 0.850 (0.96) | 0.871 (0.90) |
| 5 km | 146,414 | 28.1% | 0.812 (0.86) | 0.776 (0.82) |
Table 15.
Error rates (LightGBM, event-aware test, ; total ; per-category N in the last column).
Table 15.
Error rates (LightGBM, event-aware test, ; total ; per-category N in the last column).
| Category | FP Rate | FN Rate | N |
|---|
| Conf: Low | 0.046 | 0.556 | 1540 |
| Conf: Nominal | 0.044 | 0.343 | 24,334 |
| Conf: High | 0.056 | 0.236 | 1570 |
| Day | 0.032 | 0.457 | 13,717 |
| Night | 0.059 | 0.258 | 13,727 |
Table 16.
Representative errors (LightGBM, event-aware test; examples, the three highest-confidence false positives and three lowest-probability false negatives). Coordinates rounded to 0.1°. “Dist” is distance to nearest 2024 wildfire perimeter.
Table 16.
Representative errors (LightGBM, event-aware test; examples, the three highest-confidence false positives and three lowest-probability false negatives). Coordinates rounded to 0.1°. “Dist” is distance to nearest 2024 wildfire perimeter.
| Type | Region | Lat, Lon | Date | FRP | Conf | D/N | p | Dist (km) |
|---|
| FP | N. Mountain West | 44.4, −113.9 | 2 October 2024 | 2.4 | nominal | night | 1.00 | 10.2 |
| FP | N. Mountain West | 44.3, −113.9 | 30 September 2024 | 1.9 | nominal | night | 1.00 | 6.6 |
| FP | N. Mountain West | 44.4, −113.9 | 29 September 2024 | 2.1 | nominal | night | 1.00 | 9.2 |
| FN | N. Eastern U.S. | 40.8, −75.6 | 2 November 2024 | 6.2 | nominal | day | 0.00 | 0.0 |
| FN | S. Eastern U.S. | 30.7, −82.1 | 3 February 2024 | 8.1 | nominal | day | 0.00 | 1.0 |
| FN | S. Eastern U.S. | 35.8, −82.1 | 6 December 2024 | 1.5 | nominal | night | 0.00 | 0.0 |