1. Introduction
There are substantial coal resources buried in western China, of which more than 60% of mines are located in loess gully areas, which are mainly distributed in Shaanxi, Shanxi, Gansu, Ningxia, Inner Mongolia, etc. Gully areas, a transition between plain and plateau, are characterized by narrow and steep channels and complex engineering geological conditions [
1,
2]. A series of mining damages and geological disasters as well as ecological problems appear in different forms, such as surface cracks, step subsidence, slope slide, local collapse, vegetation dry-up, land desertification, etc. [
3]. The slope deformation induced by coal mining not only occurs during the extraction period but also may experience residual subsidence or reverse movement after mining ceases or even after the mine is closed. At the same time, the mining of a shallow-buried coal seam would easily cause sliding fissures due to the combined effect of the geological mining environment and gully topography in loess gully areas [
4,
5]. Because of the mining-induced loess slopes’ gentle tensile strength, loess slopes subside severely when their stable internal structure is damaged, caused by underground coal mining [
1]. Therefore, over the past 20 years, in connection with the specific mining engineering practice, some experts, scholars and engineers have done a certain amount of research work on loess slope deformation and failure under underground mining; slope deformation and failure laws were studied mostly by numerical simulation and by model experiment, field monitoring and a combined method partly [
6,
7,
8]. Therein, Zhang [
9] presents details of highway slopes affected by a mining subsidence event that occurred in the Yangquan coal mining area of China in 2016. Prof. Sun Shiguo did great and groundbreaking work. He explored the influence law of slope stability induced by underground mining areas and the relative position and space and geometry size changes of slope body [
10]. He also studied the influence of underground mining on the outer region on slope stability characteristics [
11].
Wen [
12] took the Hongyu Coal Mine as the engineering background; the volume and slope of the gully landform above the goaf were included in the influence factors of dynamic pressure characteristics, and the analysis framework of topography and geomorphology was constructed. Liu [
4] used FLAC
3D numerical simulation software to establish the model of a concave slope, convex slope, mixed slope and uniform slope to simulate the influence of underground coal mining on surface morphology. Zhang [
7] studied gully slope movements, subject to underground mining, with physical simulation and theoretical analysis. The rules disclose that the slope rock slides horizontally in response to mining in the direction of gullies and rotates reversely with the appearance of a polygon block in mining away from gullies. Li [
8] proposes an intelligent slope stability prediction method based on the improved pelican optimization algorithm (IPOA) and the optimization random forest (RF) algorithm to reduce disasters and accidents caused by slope instability. A set of intelligent slope stability prediction systems is created using MATLAB tools and applied to Lala Copper Mine in Sichuan Province. Xu Dongjing [
13] proposed a conceptual model, which includes the broken patterns of the overburden strata and the fracture space induced by it. The authors proposed three types of trapezoidal broken models considering the top-down varying pattern of the lateral and longitudinal volume expansion coefficients. Lv [
14] analyzed the effects of the fault in controlling the deformation features of the destabilized slope during underground mining by adopting the method of numerical simulation from these perspectives, including displacement, stress, and strain, among others.
Previous research has made great progress in areas such as the overall response of coal seam mining, the evolution of mining-induced slope deformation, and the integration of monitoring and simulation. However, systematic research on mining-affected slope deformation under complex terrain conditions in loess gully regions remains relatively scarce; in particular, there is still a lack of in-depth understanding regarding the differential responses of different slopes, the spatiotemporal evolution patterns, and their corresponding relationships with ground surface deformation. As is well known, the deformation of mining-affected slopes in loess gully regions is jointly controlled by multiple factors such as topographic conditions, mining methods, and overburden structure, leading to complex patterns. Therefore, it is necessary to integrate topographic conditions and comprehensively apply field investigation and numerical simulation methods to conduct systematic research on the deformation laws of mining-affected slopes in loess gully regions.
The purpose of this paper is to study deformation laws on different types of slopes located on the coal working face in the loess gully regions in order to better answer questions such as how they change over time, where they change in space, and what factors drive their change. This will enable a more comprehensive revelation of the spatiotemporal evolution mechanisms of mining-induced slope deformation, which is crucial for the prevention and control of geological disasters in the loess gully regions.
2. Coal Mine Summary
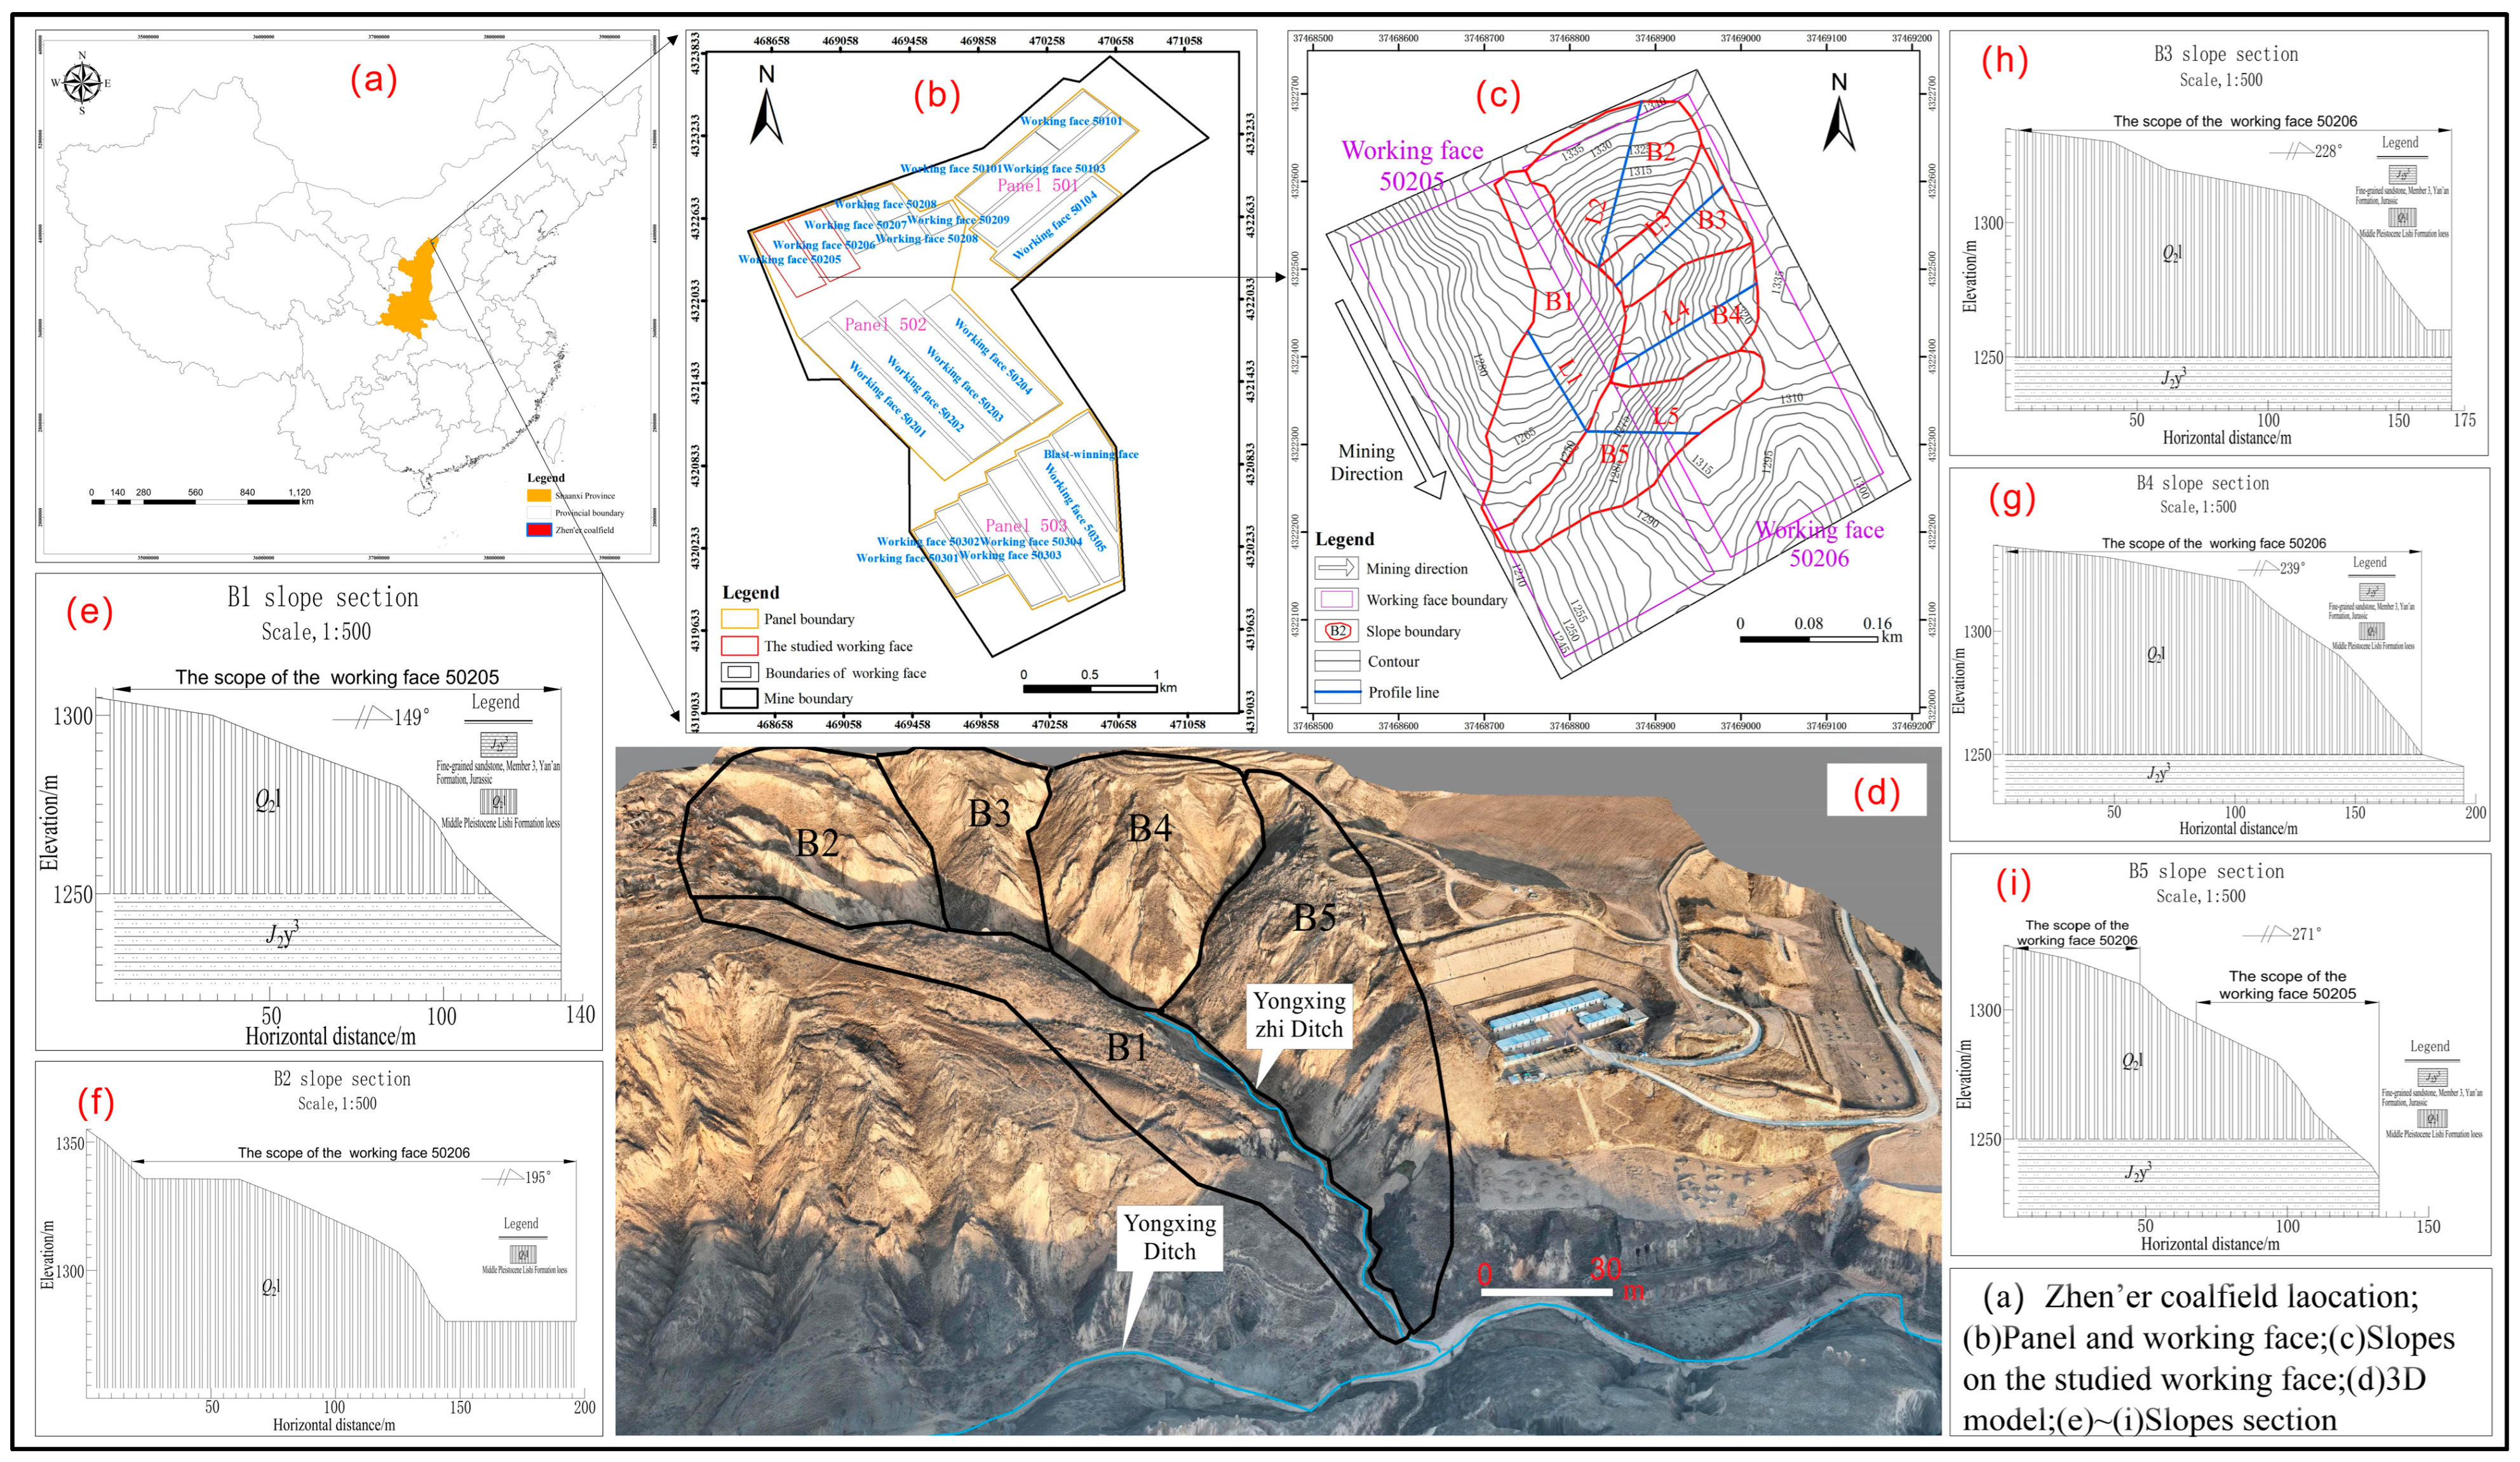
The Zhen’er Coal Mine is located in FuGu County, ShaanXi Province, China (
Figure 1a). The mining area features crisscrossing gullies, with relatively gentle ridge tops sloping toward the valleys at gradients of 10° to 20°. The gullies are generally 80 to 100 m deep. Below the gully edge lines, the valley slopes are steeper, ranging from about 60° to 80°. The gully bottoms are relatively flat, flanked by steep sides that locally form cliffs. This area is characterized by typical loess hilly-gully topography. The surface of the mining area is largely covered by Quaternary sediments. The strata, from oldest to youngest, are as follows: the Lower Jurassic Fuxian Formation (J
1f), the Middle Jurassic Yan’an Formation (J
2y), the Pliocene Jingle Formation (N
2j), the Middle Pleistocene Lishi Formation (Q
2l), and the Holocene alluvial-proluvial deposits (Q
42al+pl).
The Zhen’er Coal Mine is located in the southeastern part of the Northern Shaanxi Slope, a secondary tectonic unit of the Ordos Basin. The geological structure is simple, with no evidence of magmatic activity in the area. The overall structural form is a gently north-dipping monocline, with a dip direction of 5° and a dip angle of less than 1°. Locally, very small-scale nose-shaped uplifts are developed. The regional crust is stable, and historically no major destructive earthquakes have ever occurred in the area. The characteristic period of the ground motion response spectrum in this region is 0.35 s, the peak ground acceleration is 0.05 g, and the seismic fortification intensity is VI.
The Zhen’er Coal Mine was mined from 2008 to December 2021 and is now closed. The main minable coal seam within its mining rights is the No. 5
−2 coal seam, with thickness varying from 1.45 m to 3.58 m (average 2.82 m), burial depth ranging from 74.37 m to 176.86 m (typically 90~130 m), and floor elevation varying between 1138.25 m and 1164.90 m. The coal seam dips northward with a dip direction of 5° and an average dip angle of 0.5°. The mining of the No. 5
−2 coal seam is divided into three panels: 501, 502, and 503. Panel 501 is located in the northern part of the mining area, Panel 502 in the central part, and Panel 503 in the southern part (
Figure 1b). The working faces 50205 and 50206 studied in this research are located within Panel 502 (
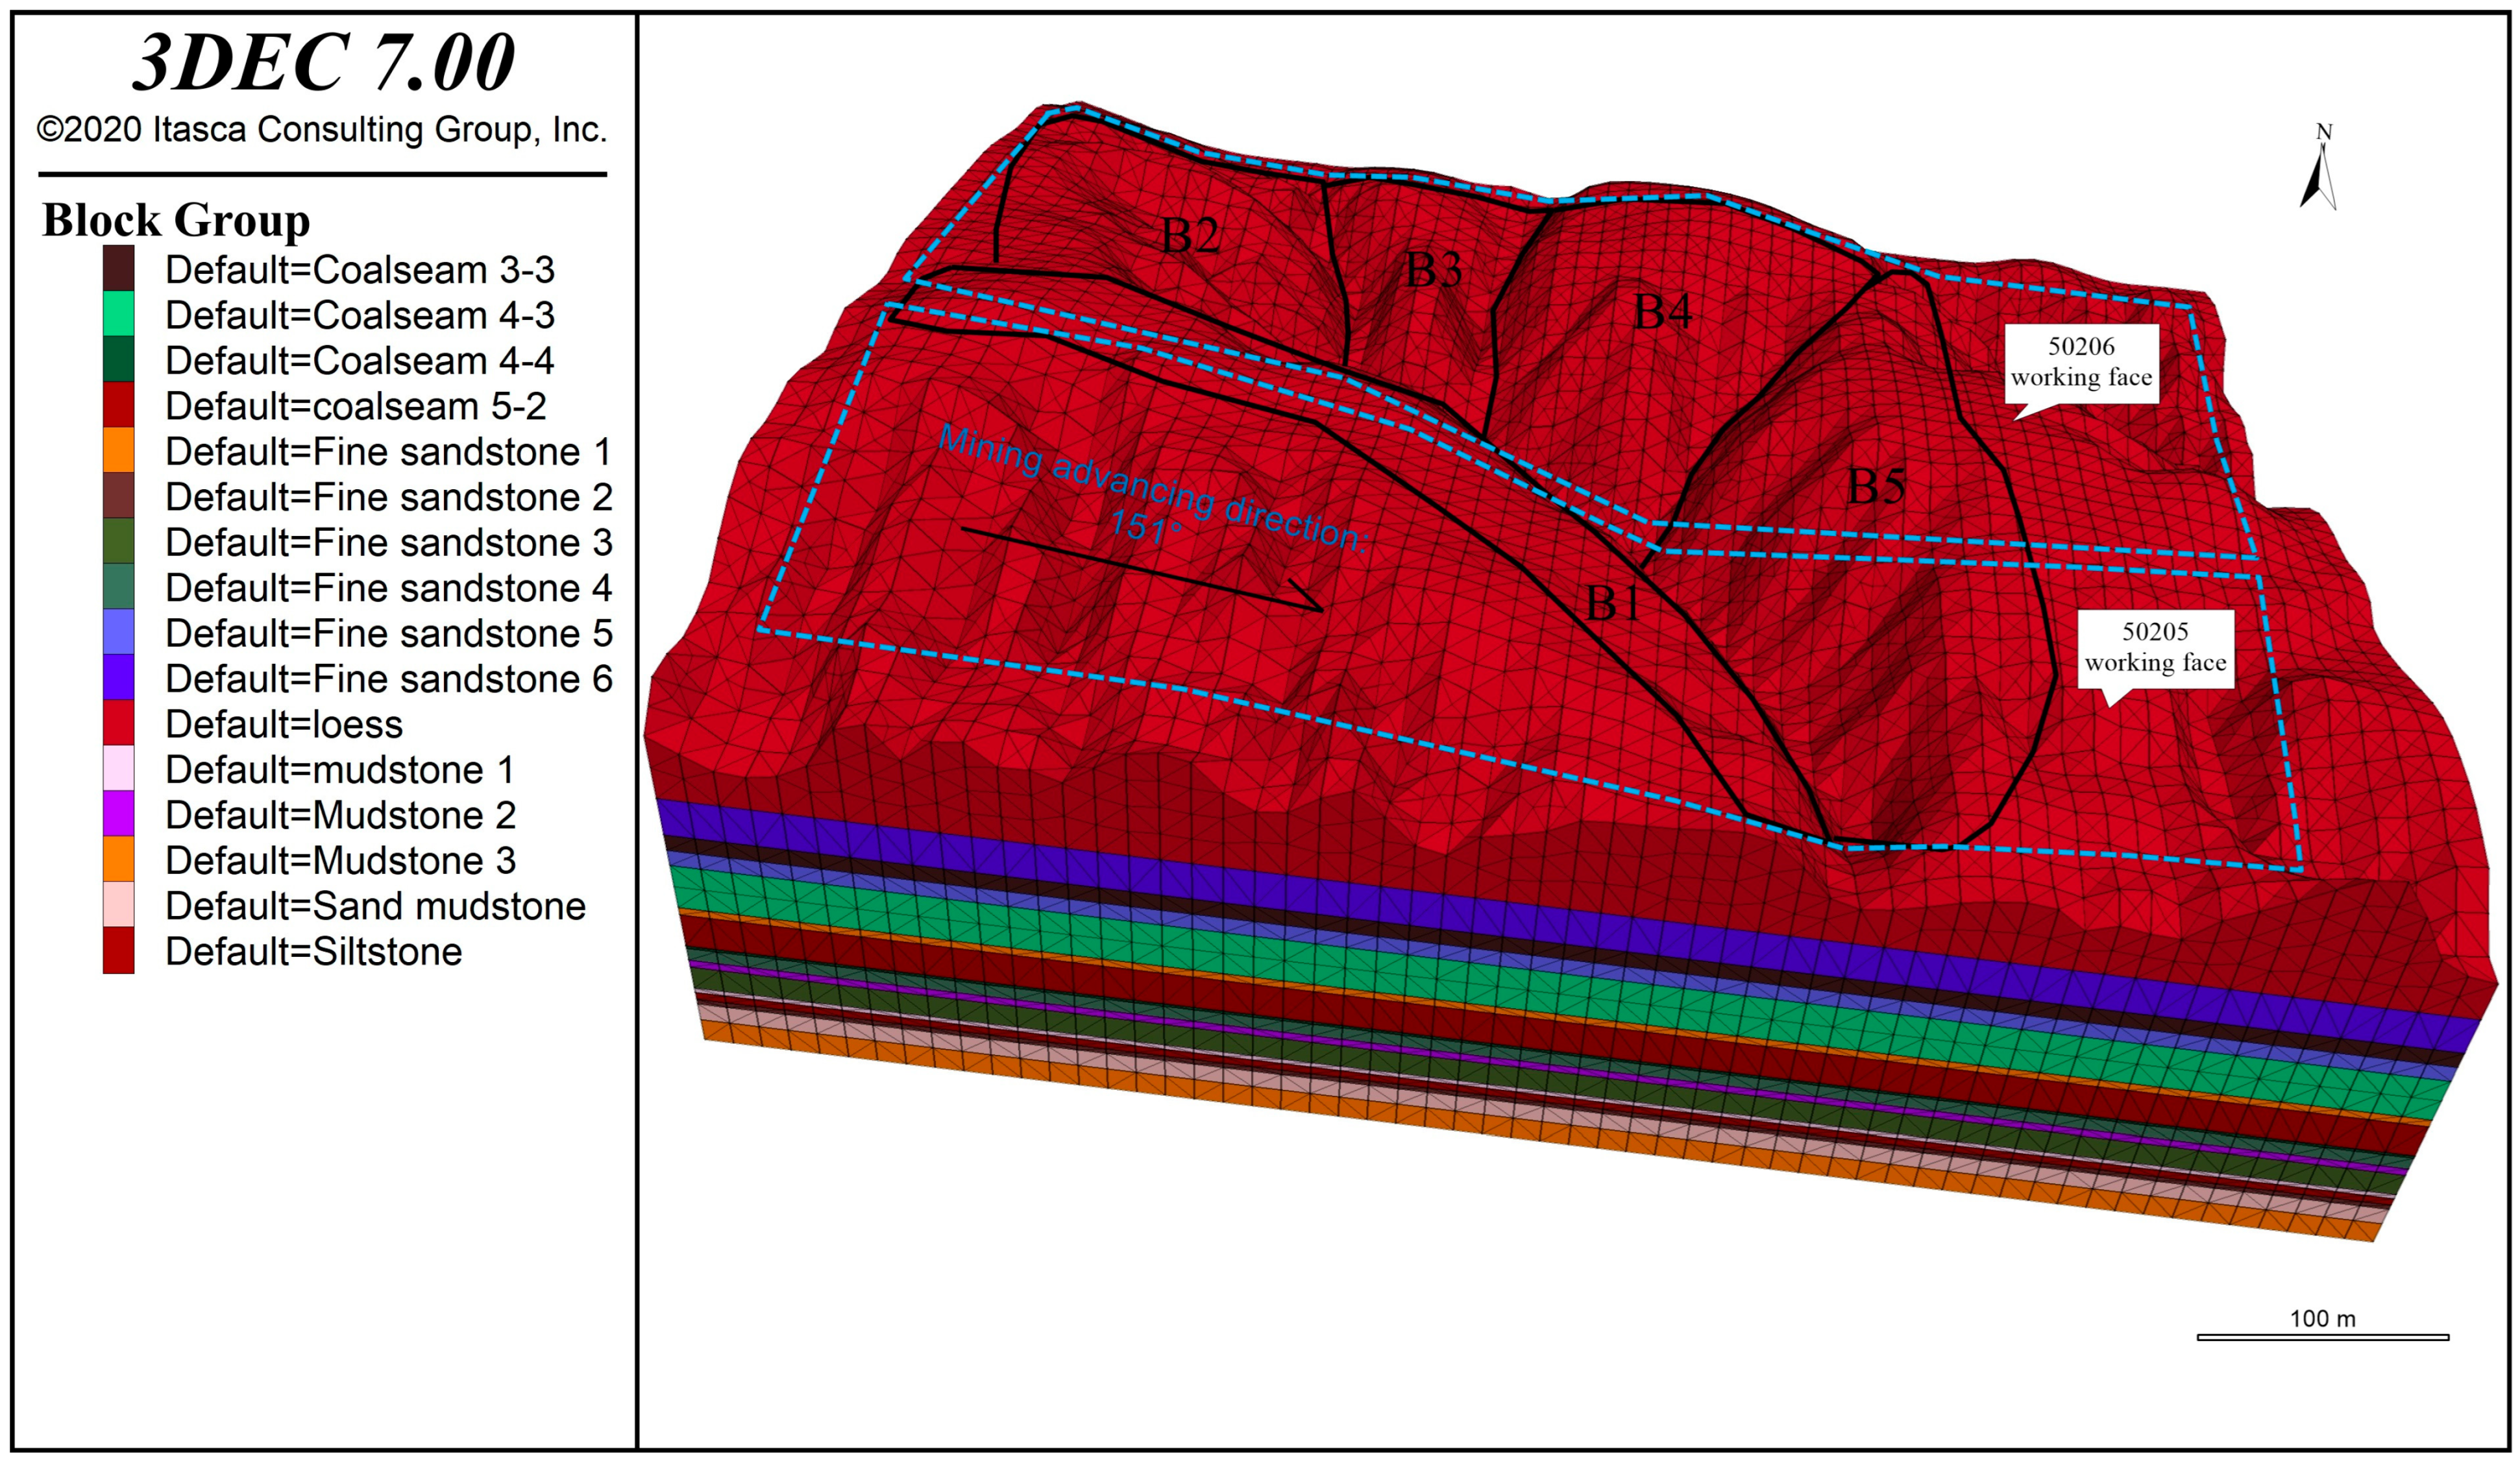
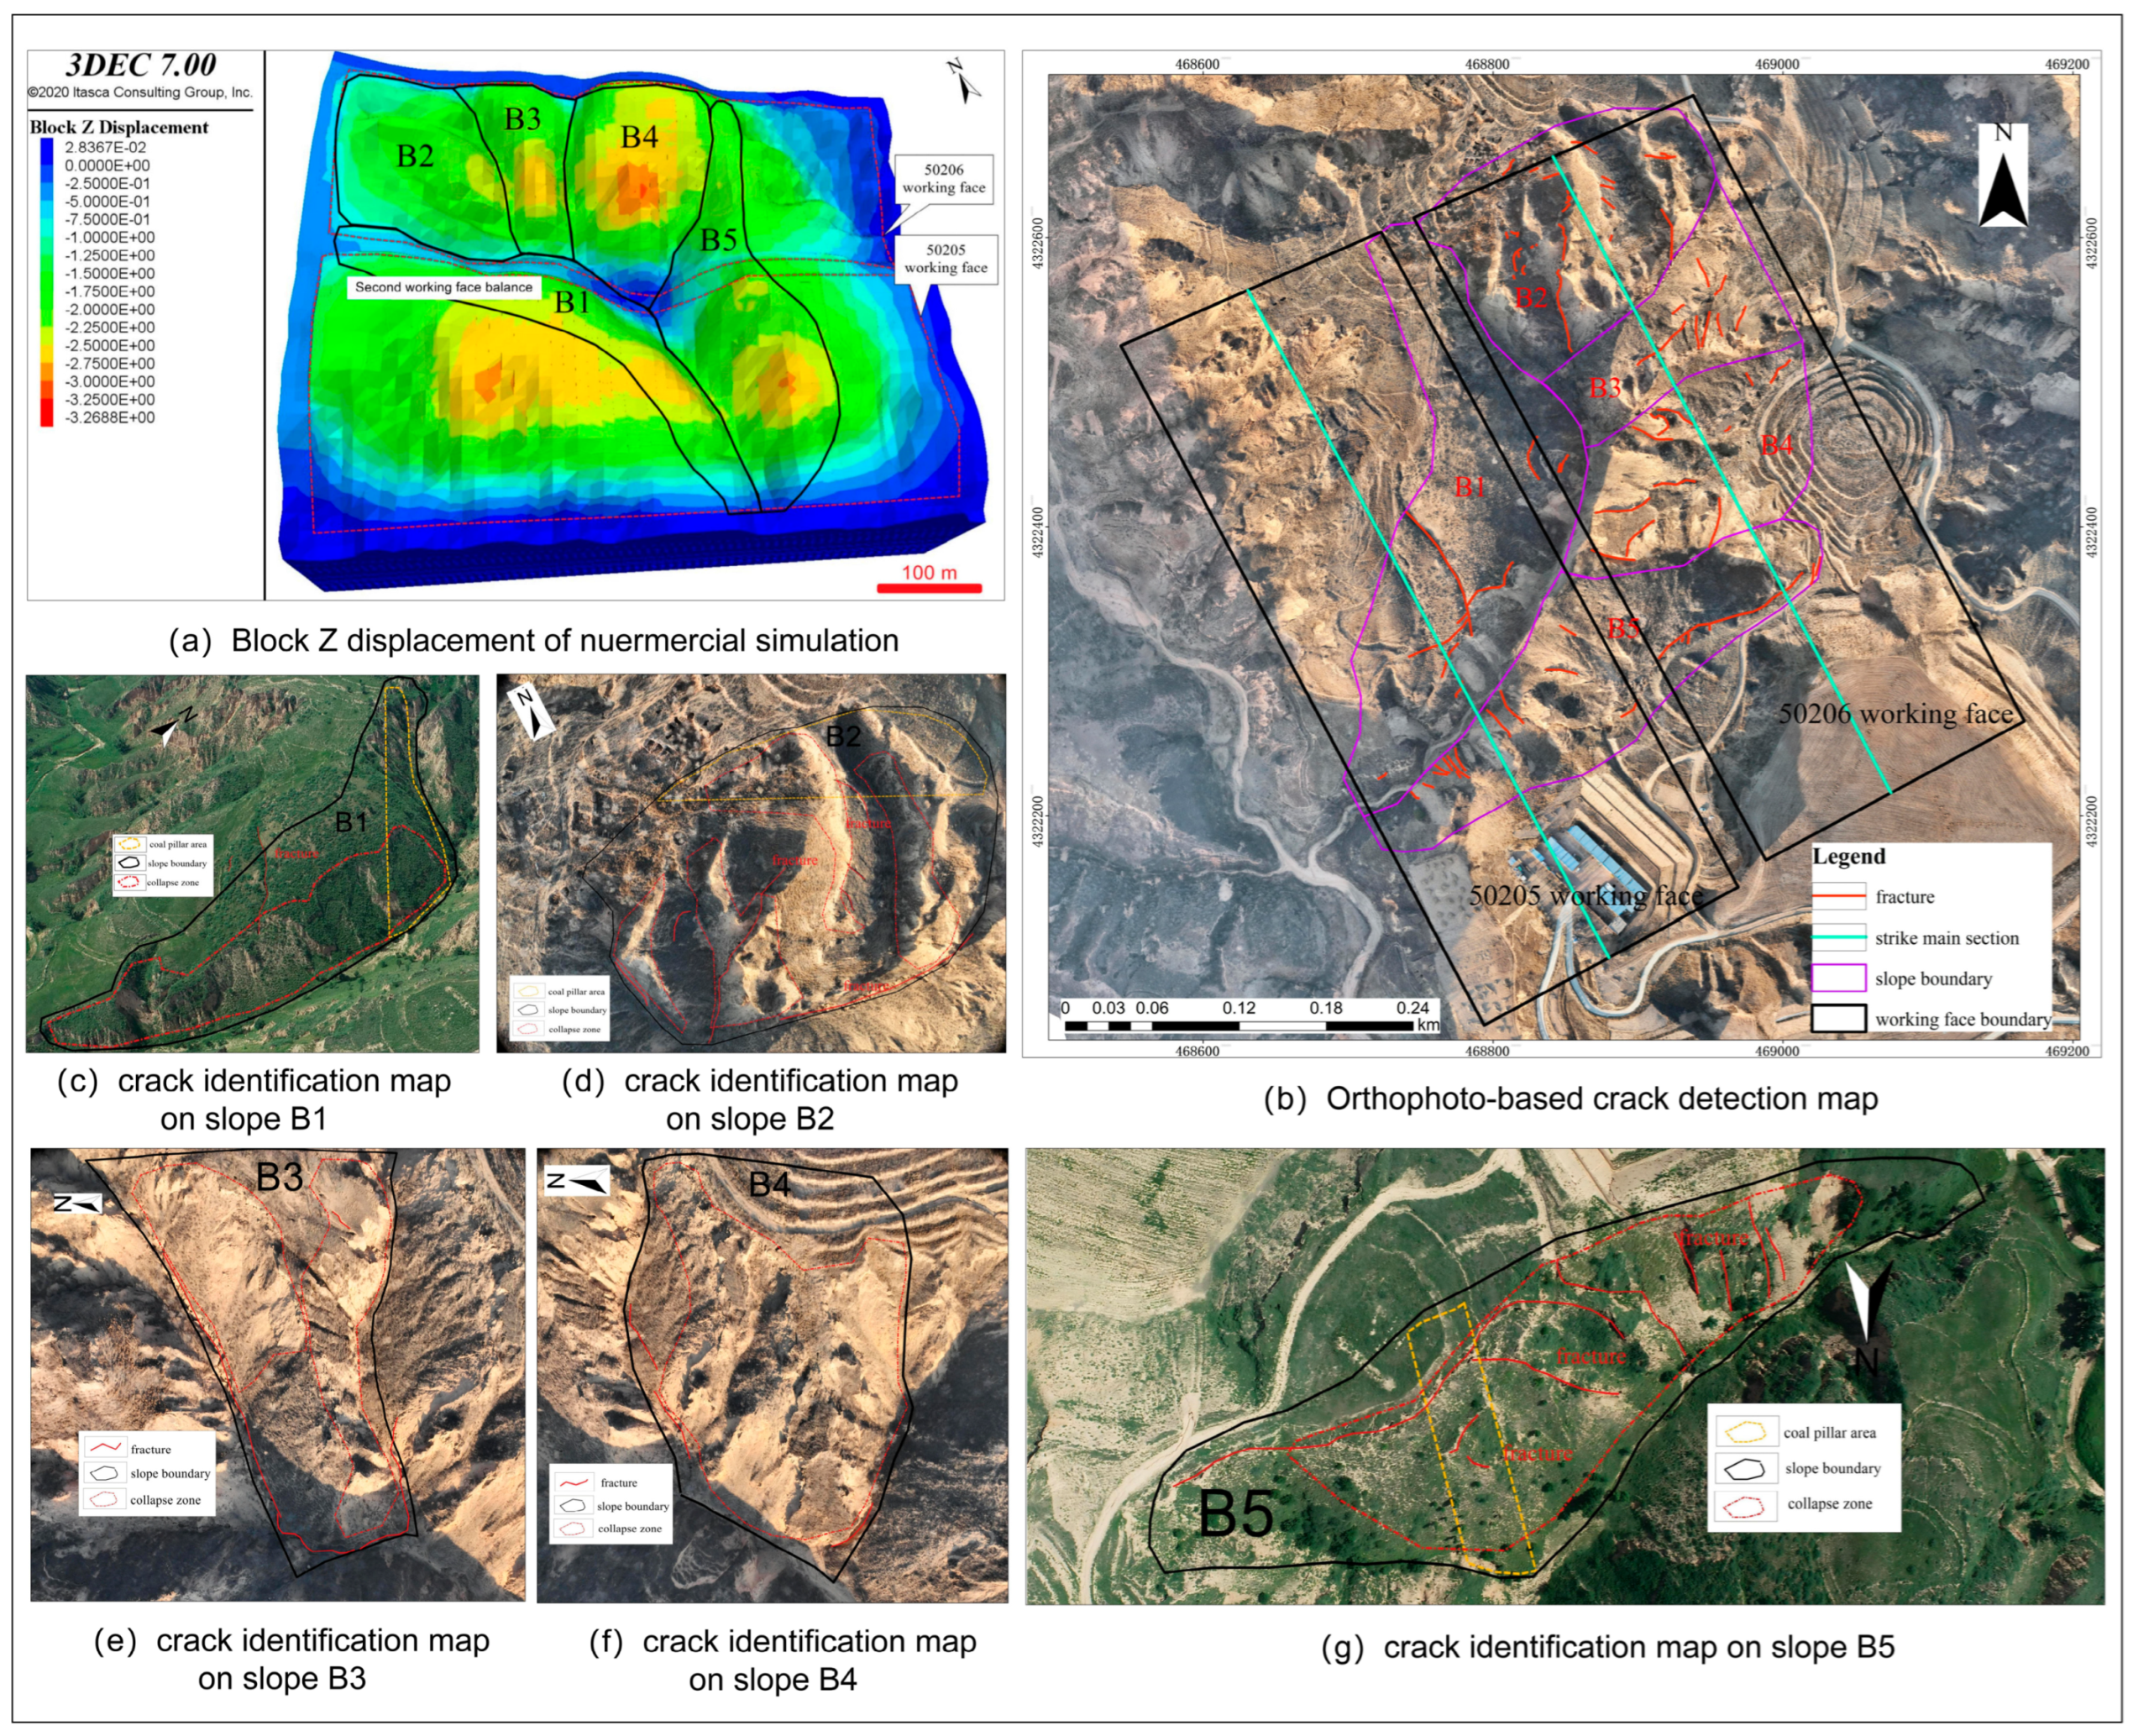
Figure 1b), mined from January to June 2017 (50205) and July to December 2019 (50206). The mining height of the coal seam is 3 m, with an average burial depth of 138 m. The advancing direction azimuth is 151°. Each working face has a length of 540 m and a width of 200 m. The mining method is longwall retreating with full-seam one-pass mining, using fully mechanized mining technology and a full caving method for roof management. Based on high-resolution orthophoto images of the study area, through manual identification, taking the main gullies (ignoring smaller secondary gullies) as the main line, combined with ridge lines and slope morphology characteristics, the boundaries of slopes within working faces 50205 and 50206 were delineated. A total of five slopes (B1 to B5) were identified (
Figure 1c,d), with unit areas ranging from 0.125 to 0.352 km
2. The material composition of B2 and B3 slopes is loess (Q
2l). The material composition of B1, B4, B5 slopes is loess (Q
2l) and fine-grained sandstone (J
2y
3). The main characteristics of each slope are shown in
Table 1 and
Figure 1e–i.
5. Discussion
5.1. Deformation Evolution Law of Mining-Affected Slopes
(1) Slope B1
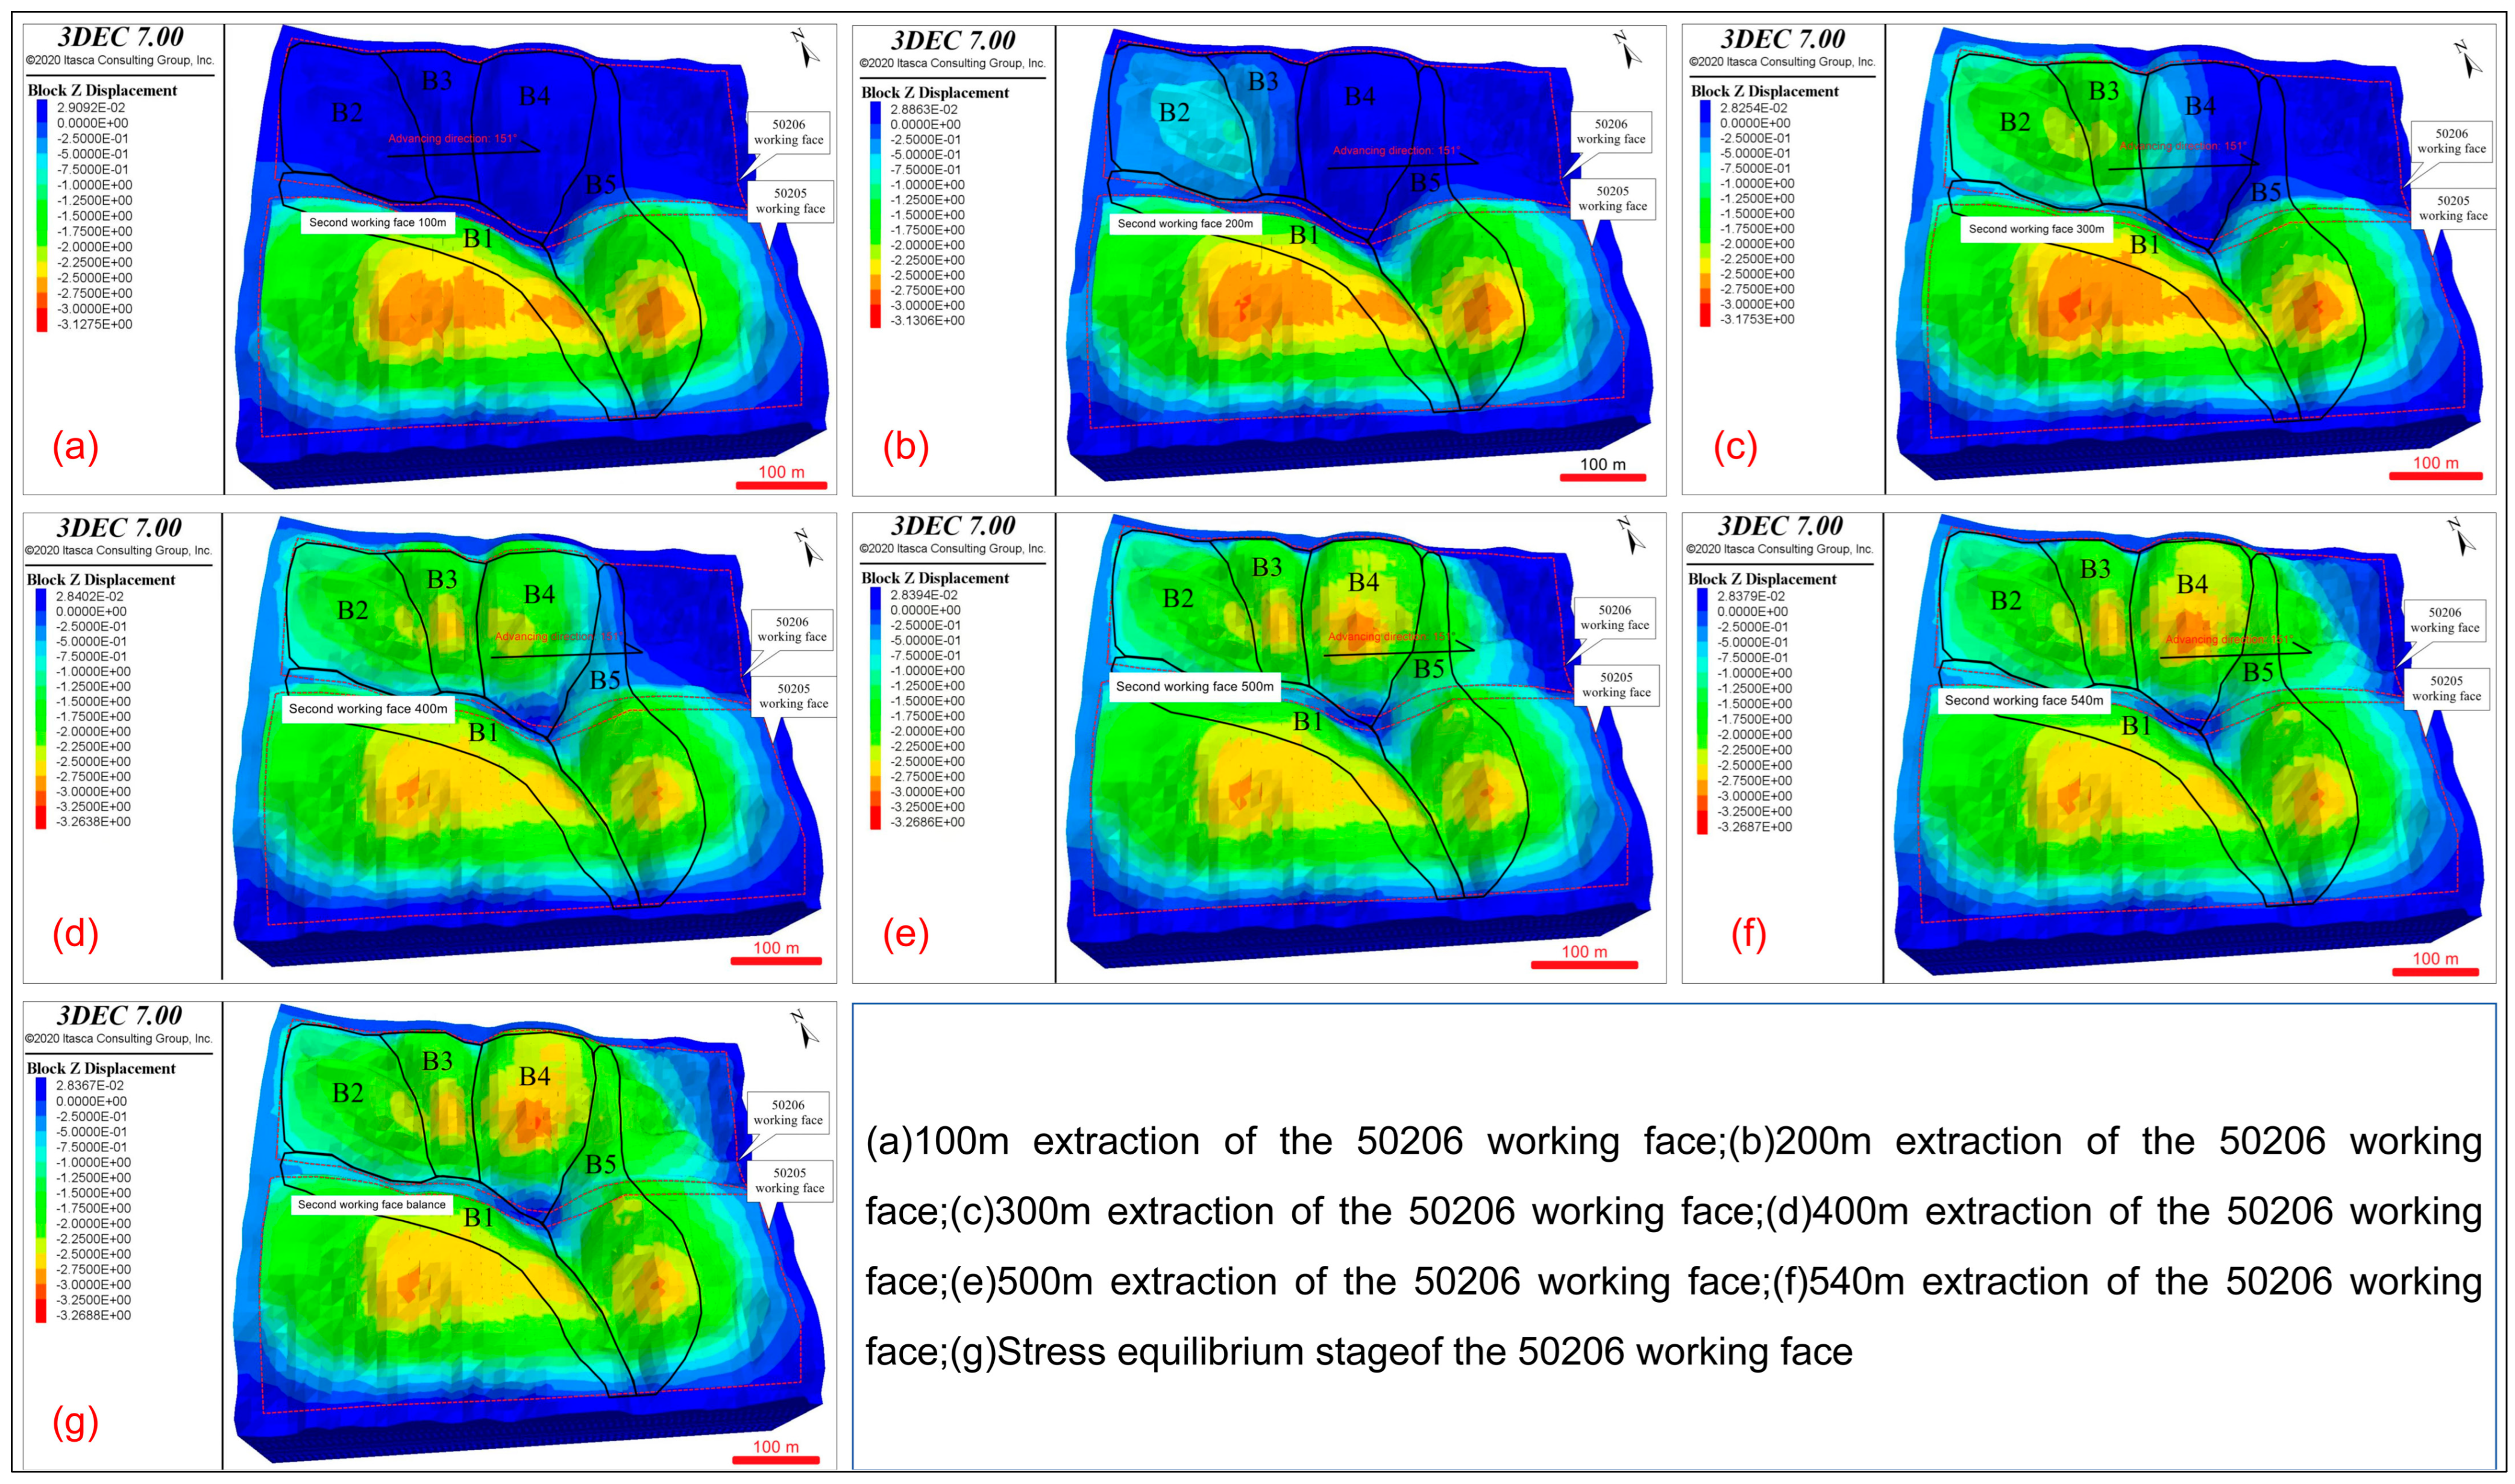
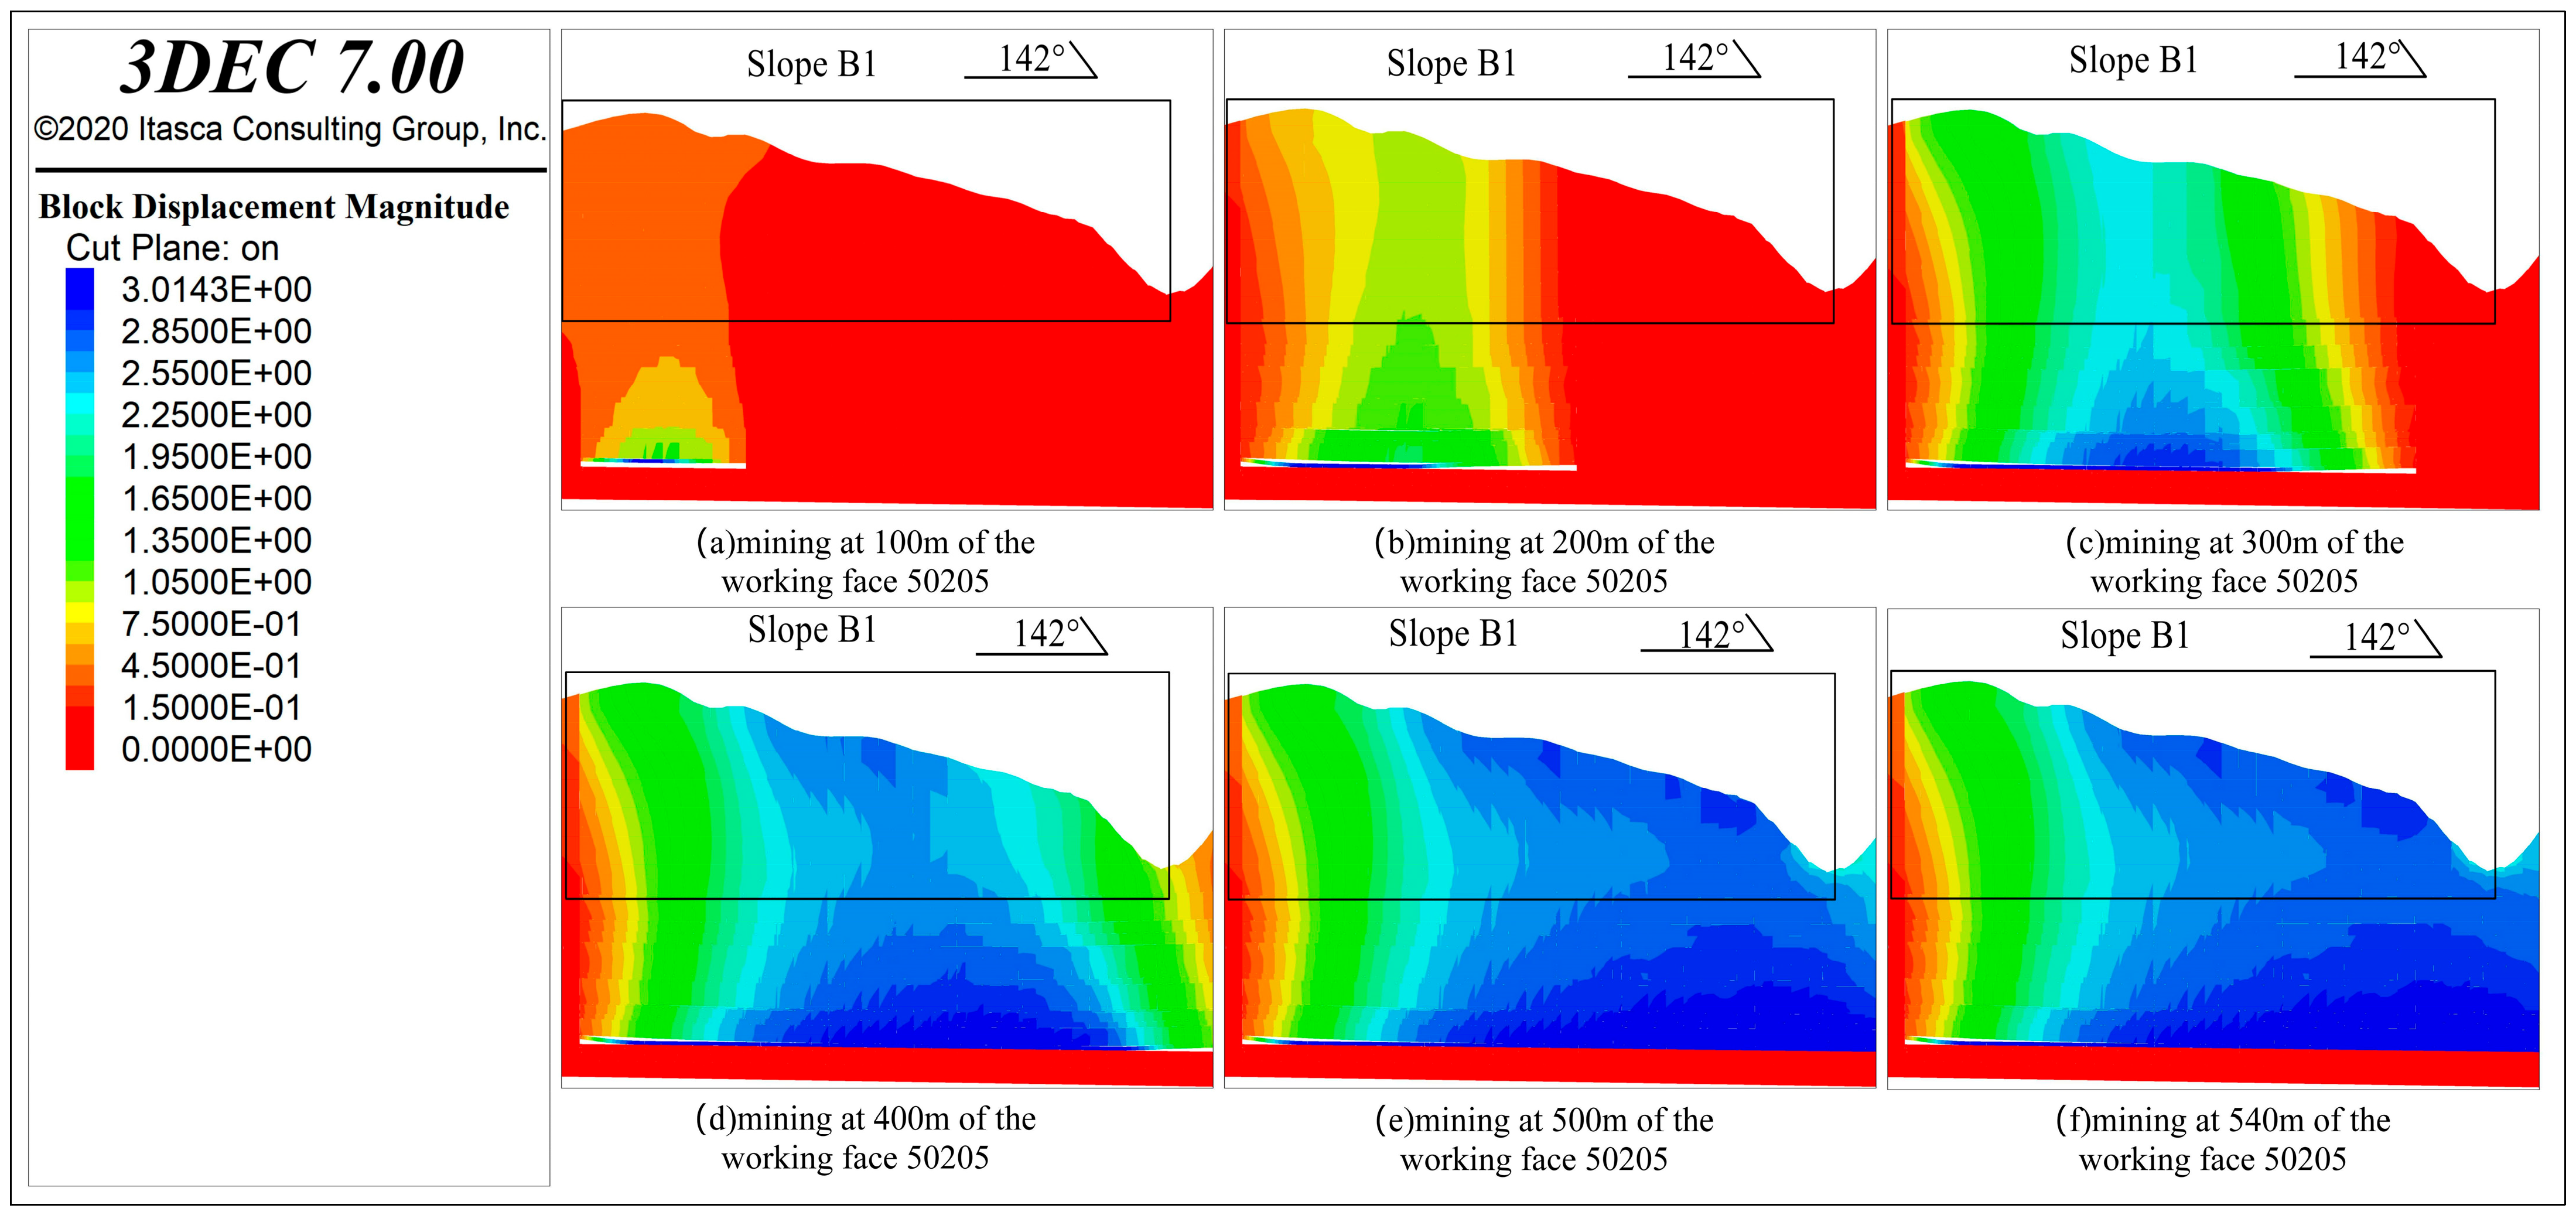
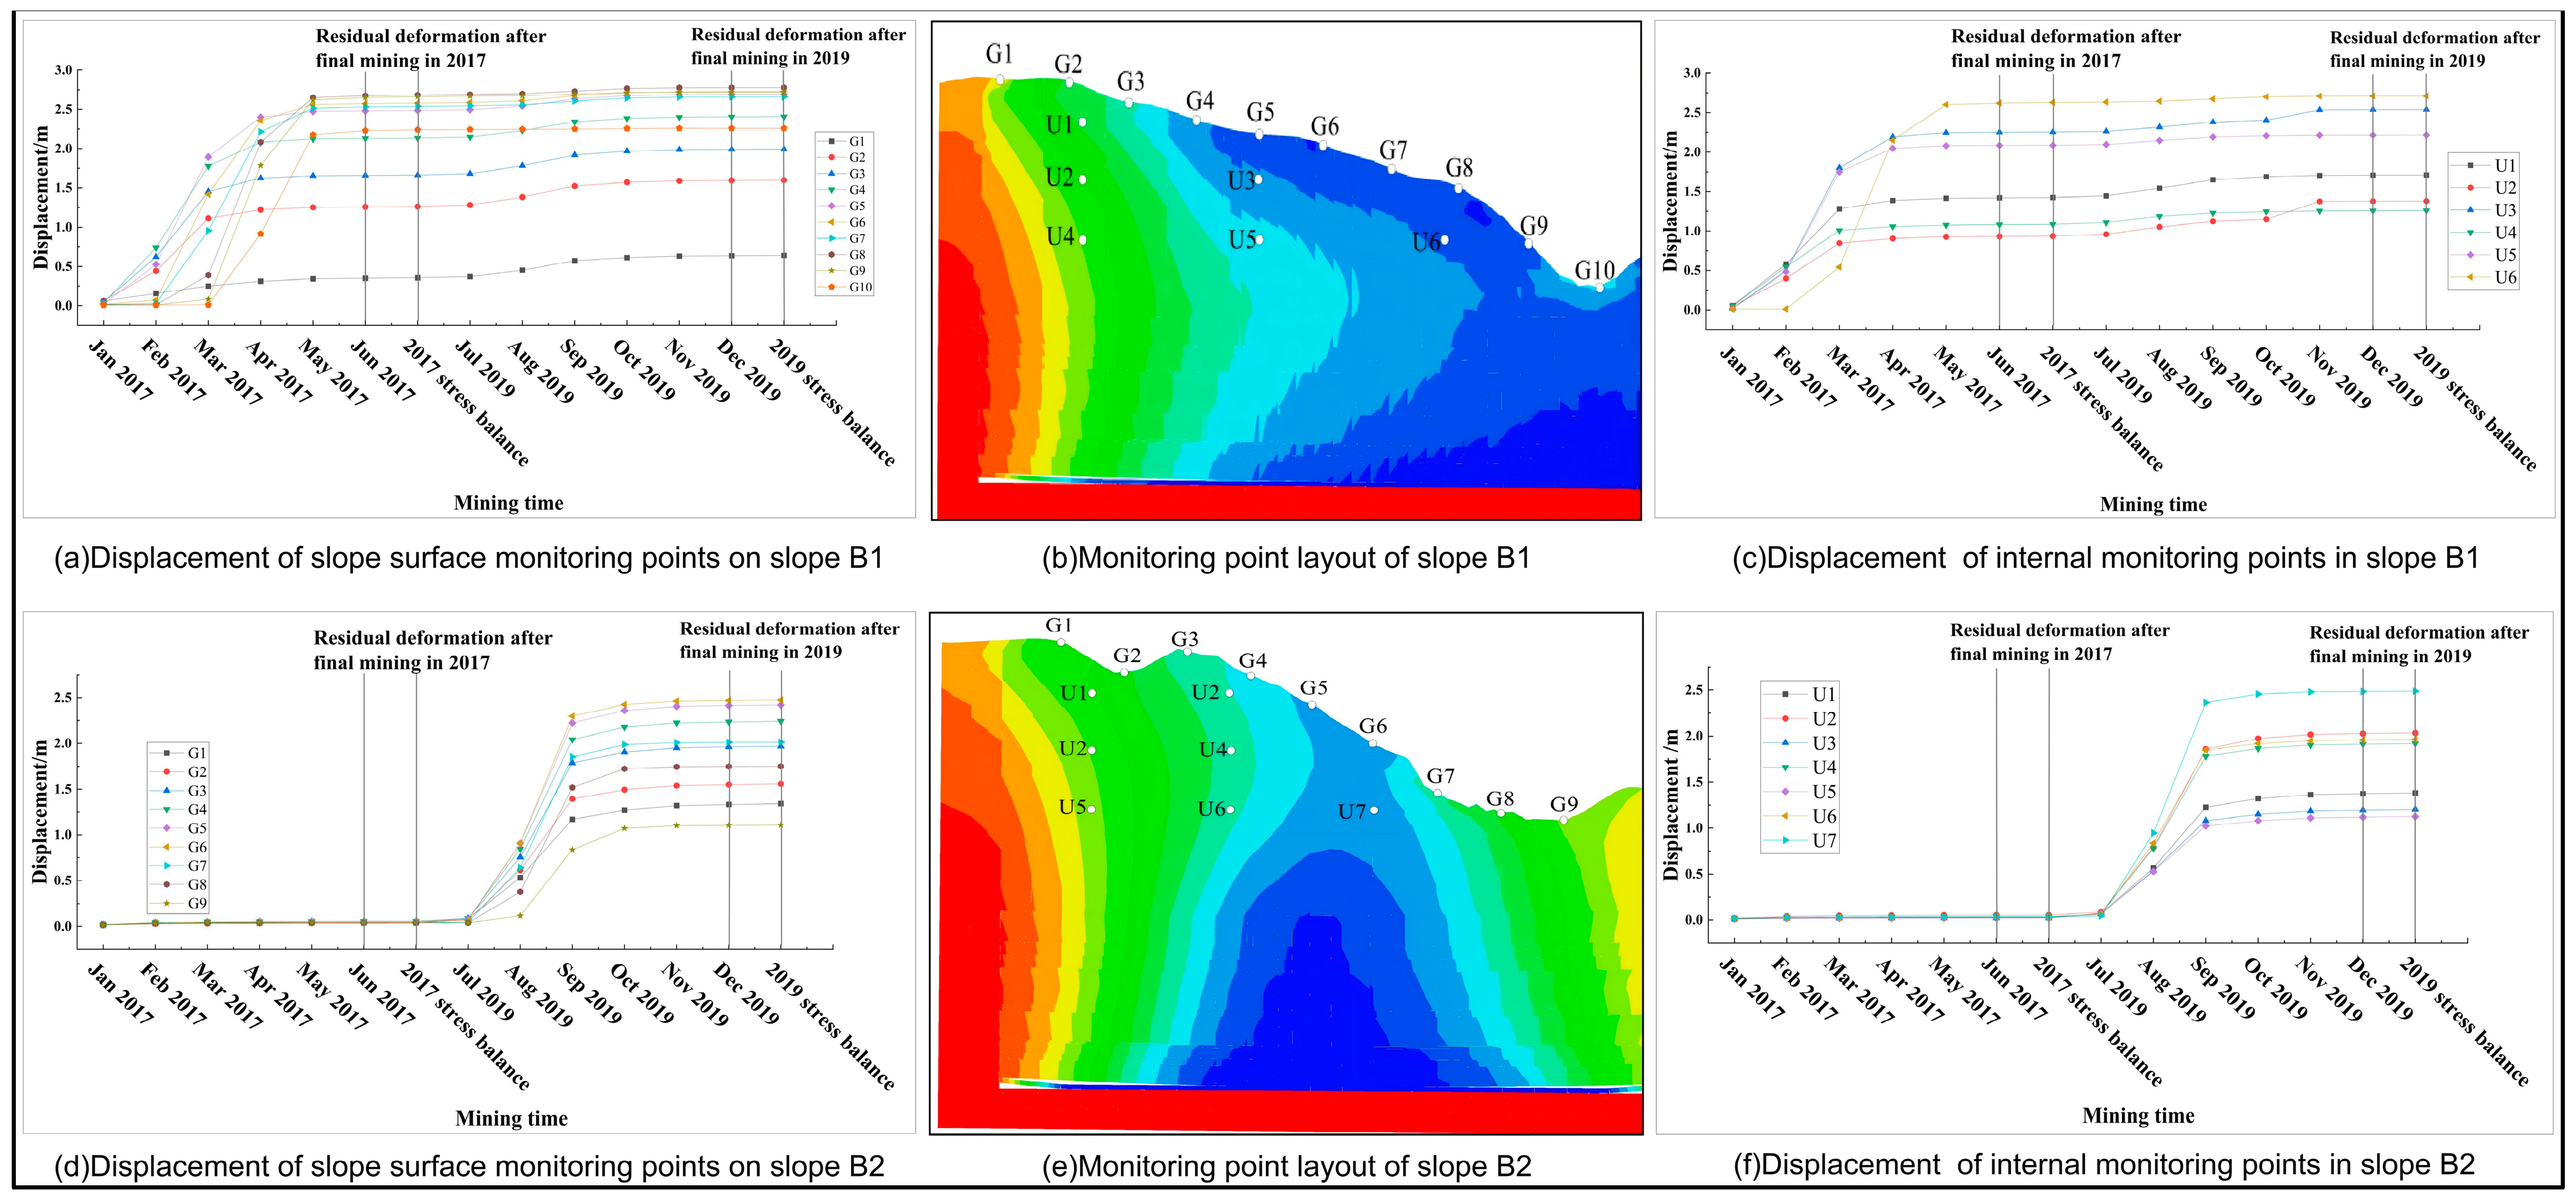
On Slope B1, the slope surface deformation first appeared near the slope crest, then gradually extended to the middle and middle-lower parts as the working face advanced and continuously intensified around the subsidence center. After entering the significant deformation stage, the middle-lower part of the slope surface became the primary zone of deformation development, while the gully at the slope toe exhibited a certain lagging response. The internal deformation of the slope displayed a distribution pattern in which the upper part responded first, and the deformation gradually increased in the middle-lower part and transferred toward the slope surface. The high-value deformation zone was mainly located inside the slope above the center of the working face subsidence basin and migrated as the center of the subsidence basin moved.
The temporal evolution pattern of deformation on Slope B1 was characterized by no obvious response in the early stage, rapid development in the middle stage, a tendency to stabilize in the late stage, and re-disturbance by the adjacent working face. The mining of the adjacent working face still had a certain influence on the slope above the old goaf.
Analysis of displacement–time curves (
Figure 11) shows that, even after accounting for the spatial offset between the working face and the slope, a distinct temporal lag persists at the slope toe: the deformation there continues to increase for a period after the face has passed, reflecting the time-dependent compaction of caved rocks and stress redistribution. This lagging behavior is consistent with published time-settlement observations under similar mining and geological conditions [
2,
3] (Guo, 2015 and Yu, 2012).
(2) Slope B2
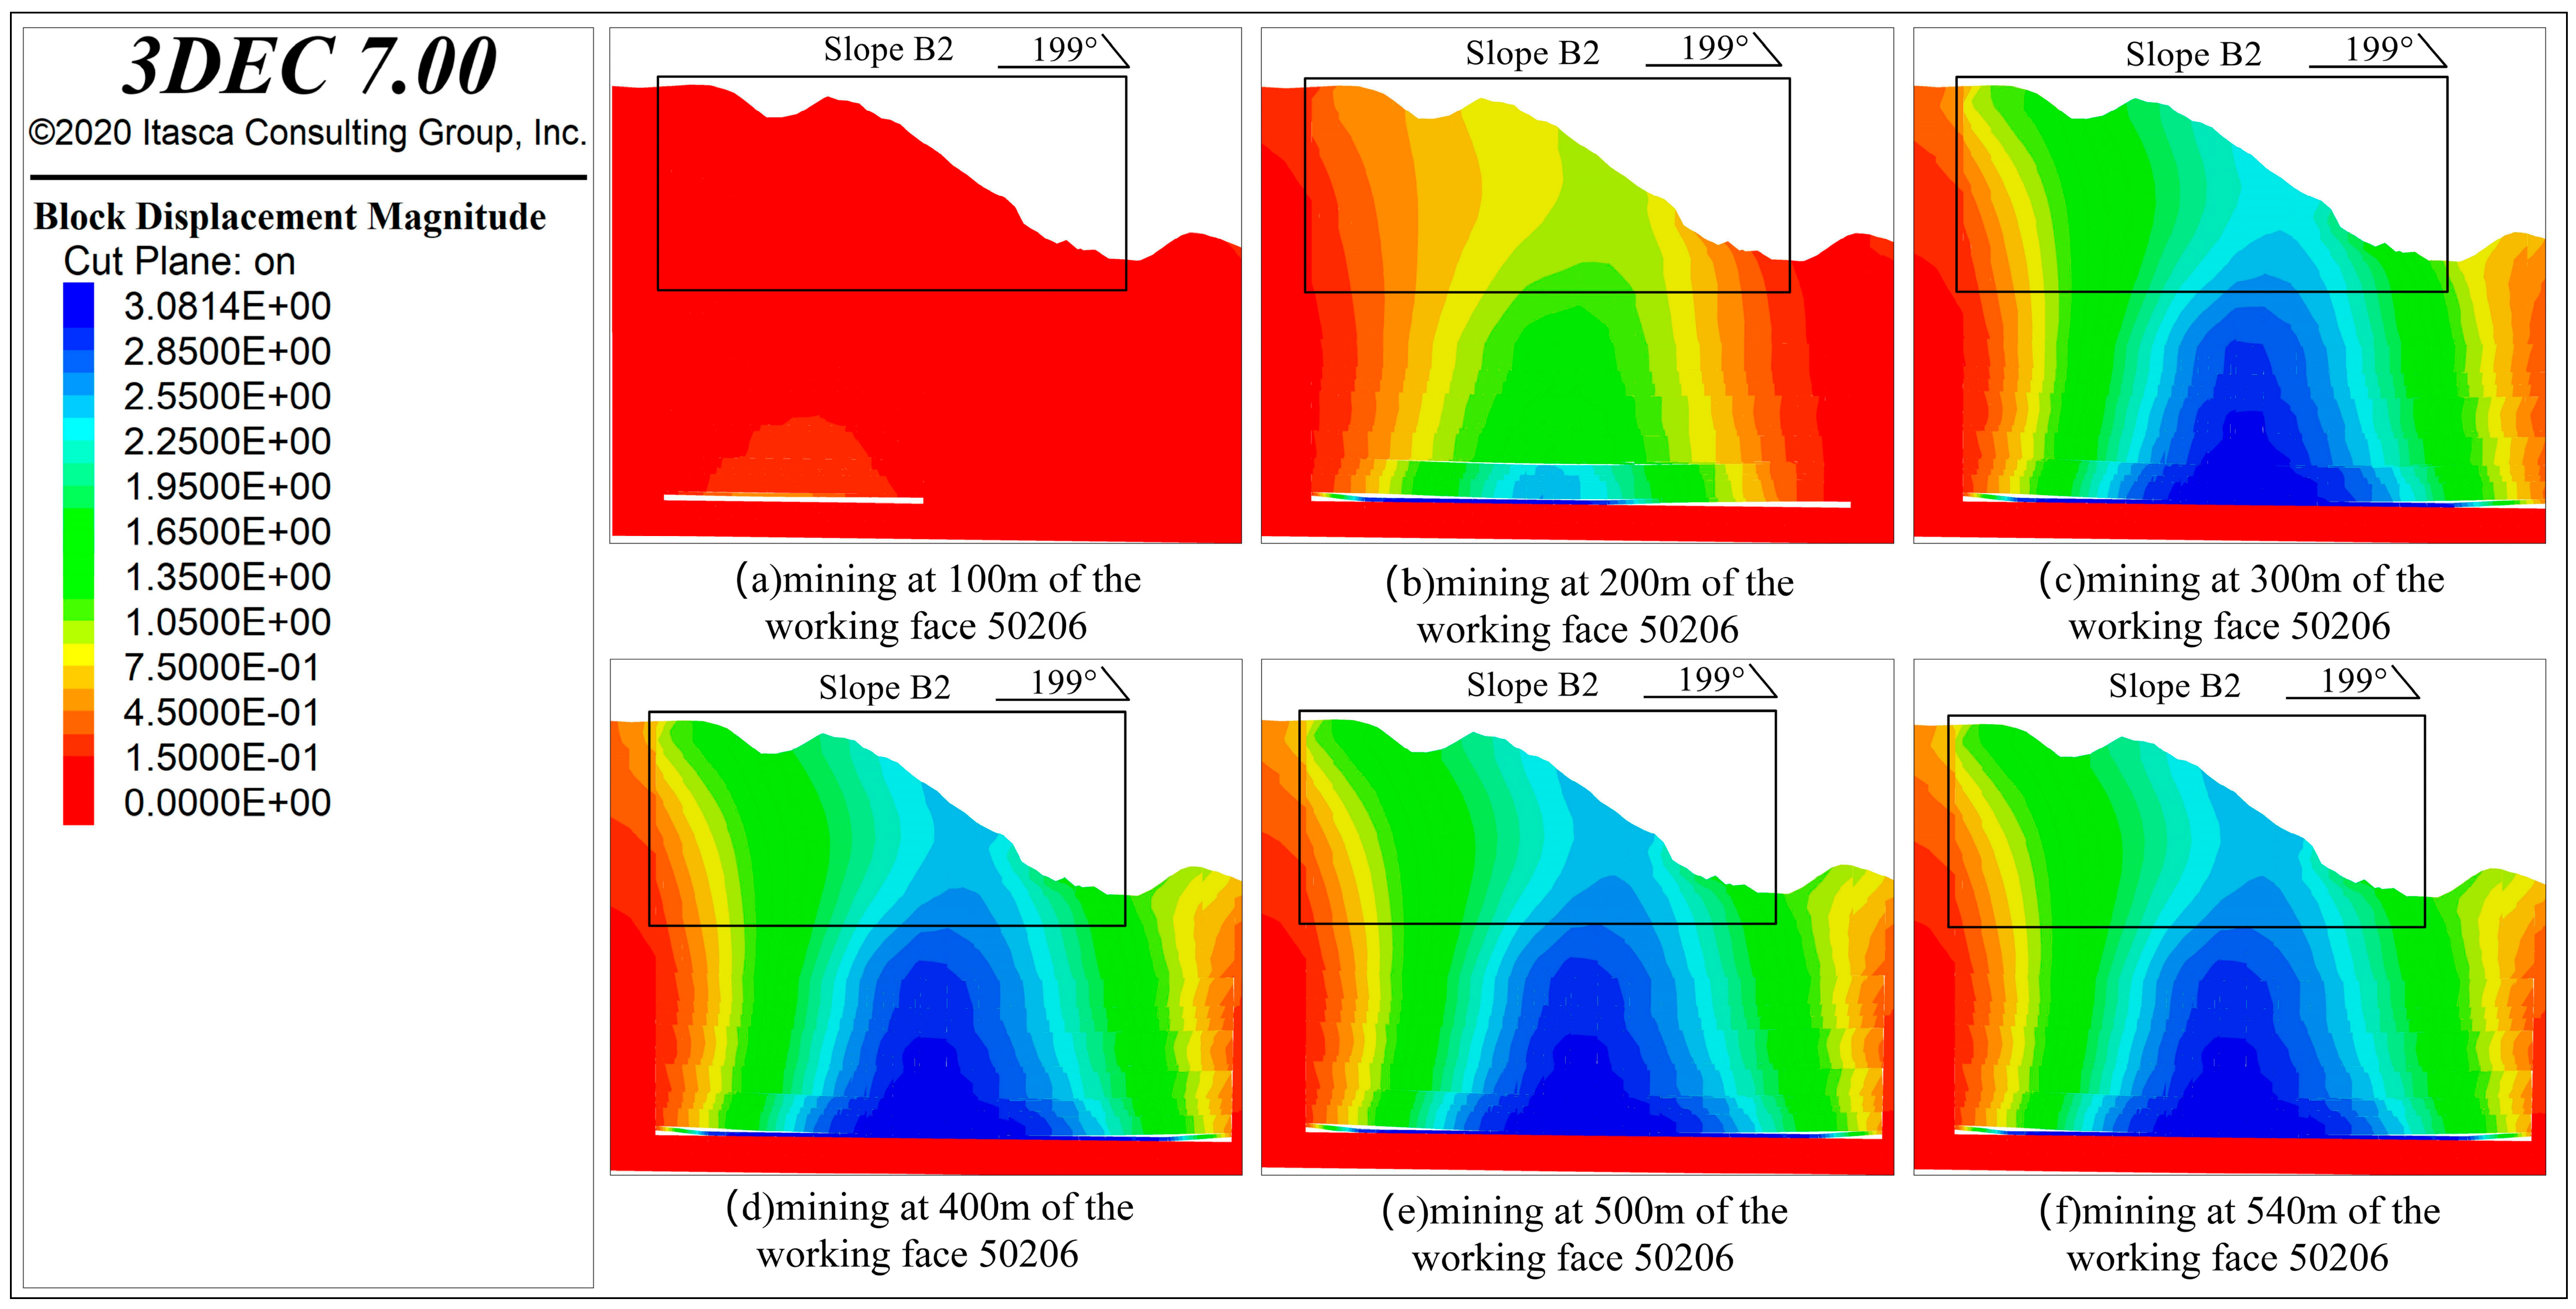
Slope B2 is located above the open-off cut. The slope surface deformation exhibited a spatial distribution pattern characterized by rapid initiation, development first in the middle part, followed by expansion to the entire slope surface and migration toward the slope toe. The internal deformation characteristics of Slope B2 were as follows: controlled by the subsidence center, deformation first developed in the middle part and gradually expanded toward the slope toe along the interior of the slope. After the working face advanced beneath the slope, the internal deformation responded rapidly in the middle part of the slope, and the existing high-value zone slowly migrated toward the slope toe as mining advanced.
The temporal evolution pattern of slope surface deformation on Slope B2 was characterized by small deformation in the early stage of mining, rapid increase in the middle stage, and slow stabilization in the late stage, controlled by the development process of the subsidence basin. The temporal evolution pattern of internal deformation on Slope B2 can be summarized as follows: mining influence was transmitted to the interior of the slope through overburden collapse, generating relatively large displacement within a short period, with the characteristics of rapid transmission and concentrated expansion. Although the internal deformation initiates rapidly, the displacement–time curves (
Figure 11) reveal that the surface deformation near the slope toe exhibits a time lag relative to the face position. This delay is primarily attributed to the progressive compaction of the caved zone and the time-dependent transfer of stress from the collapsed strata to the slope mass, rather than solely to the mining geometry.
(3) Slope B3
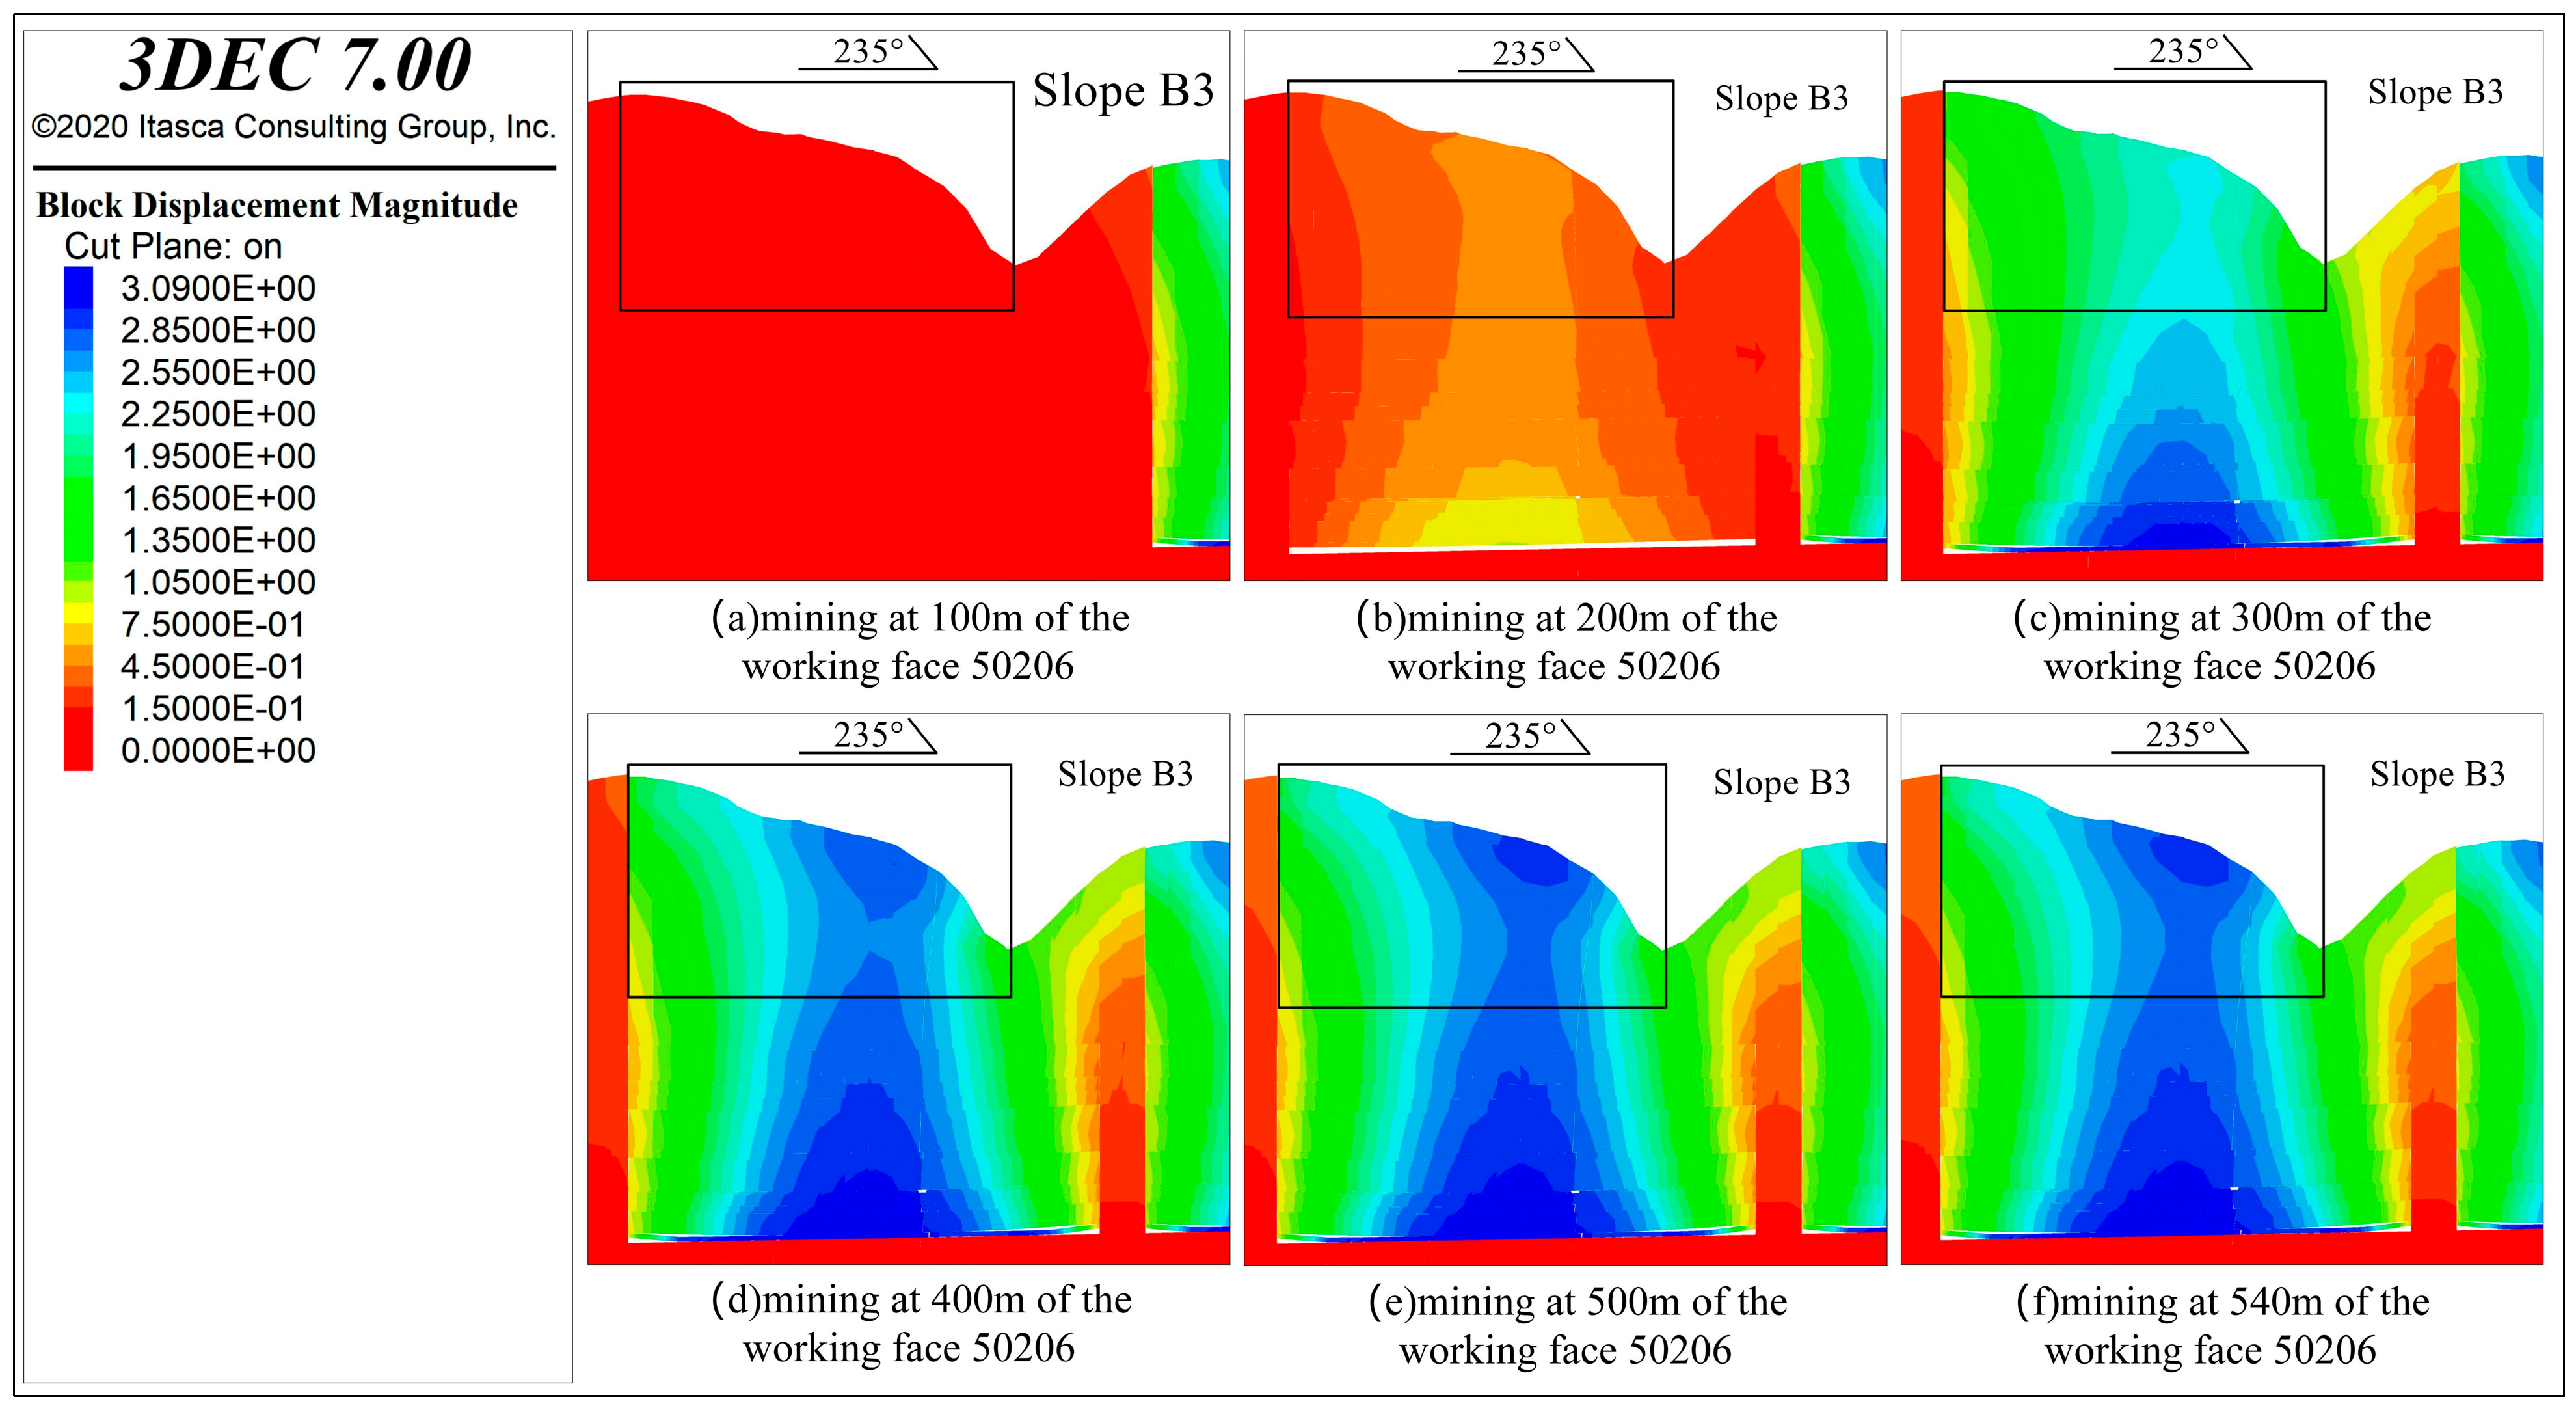
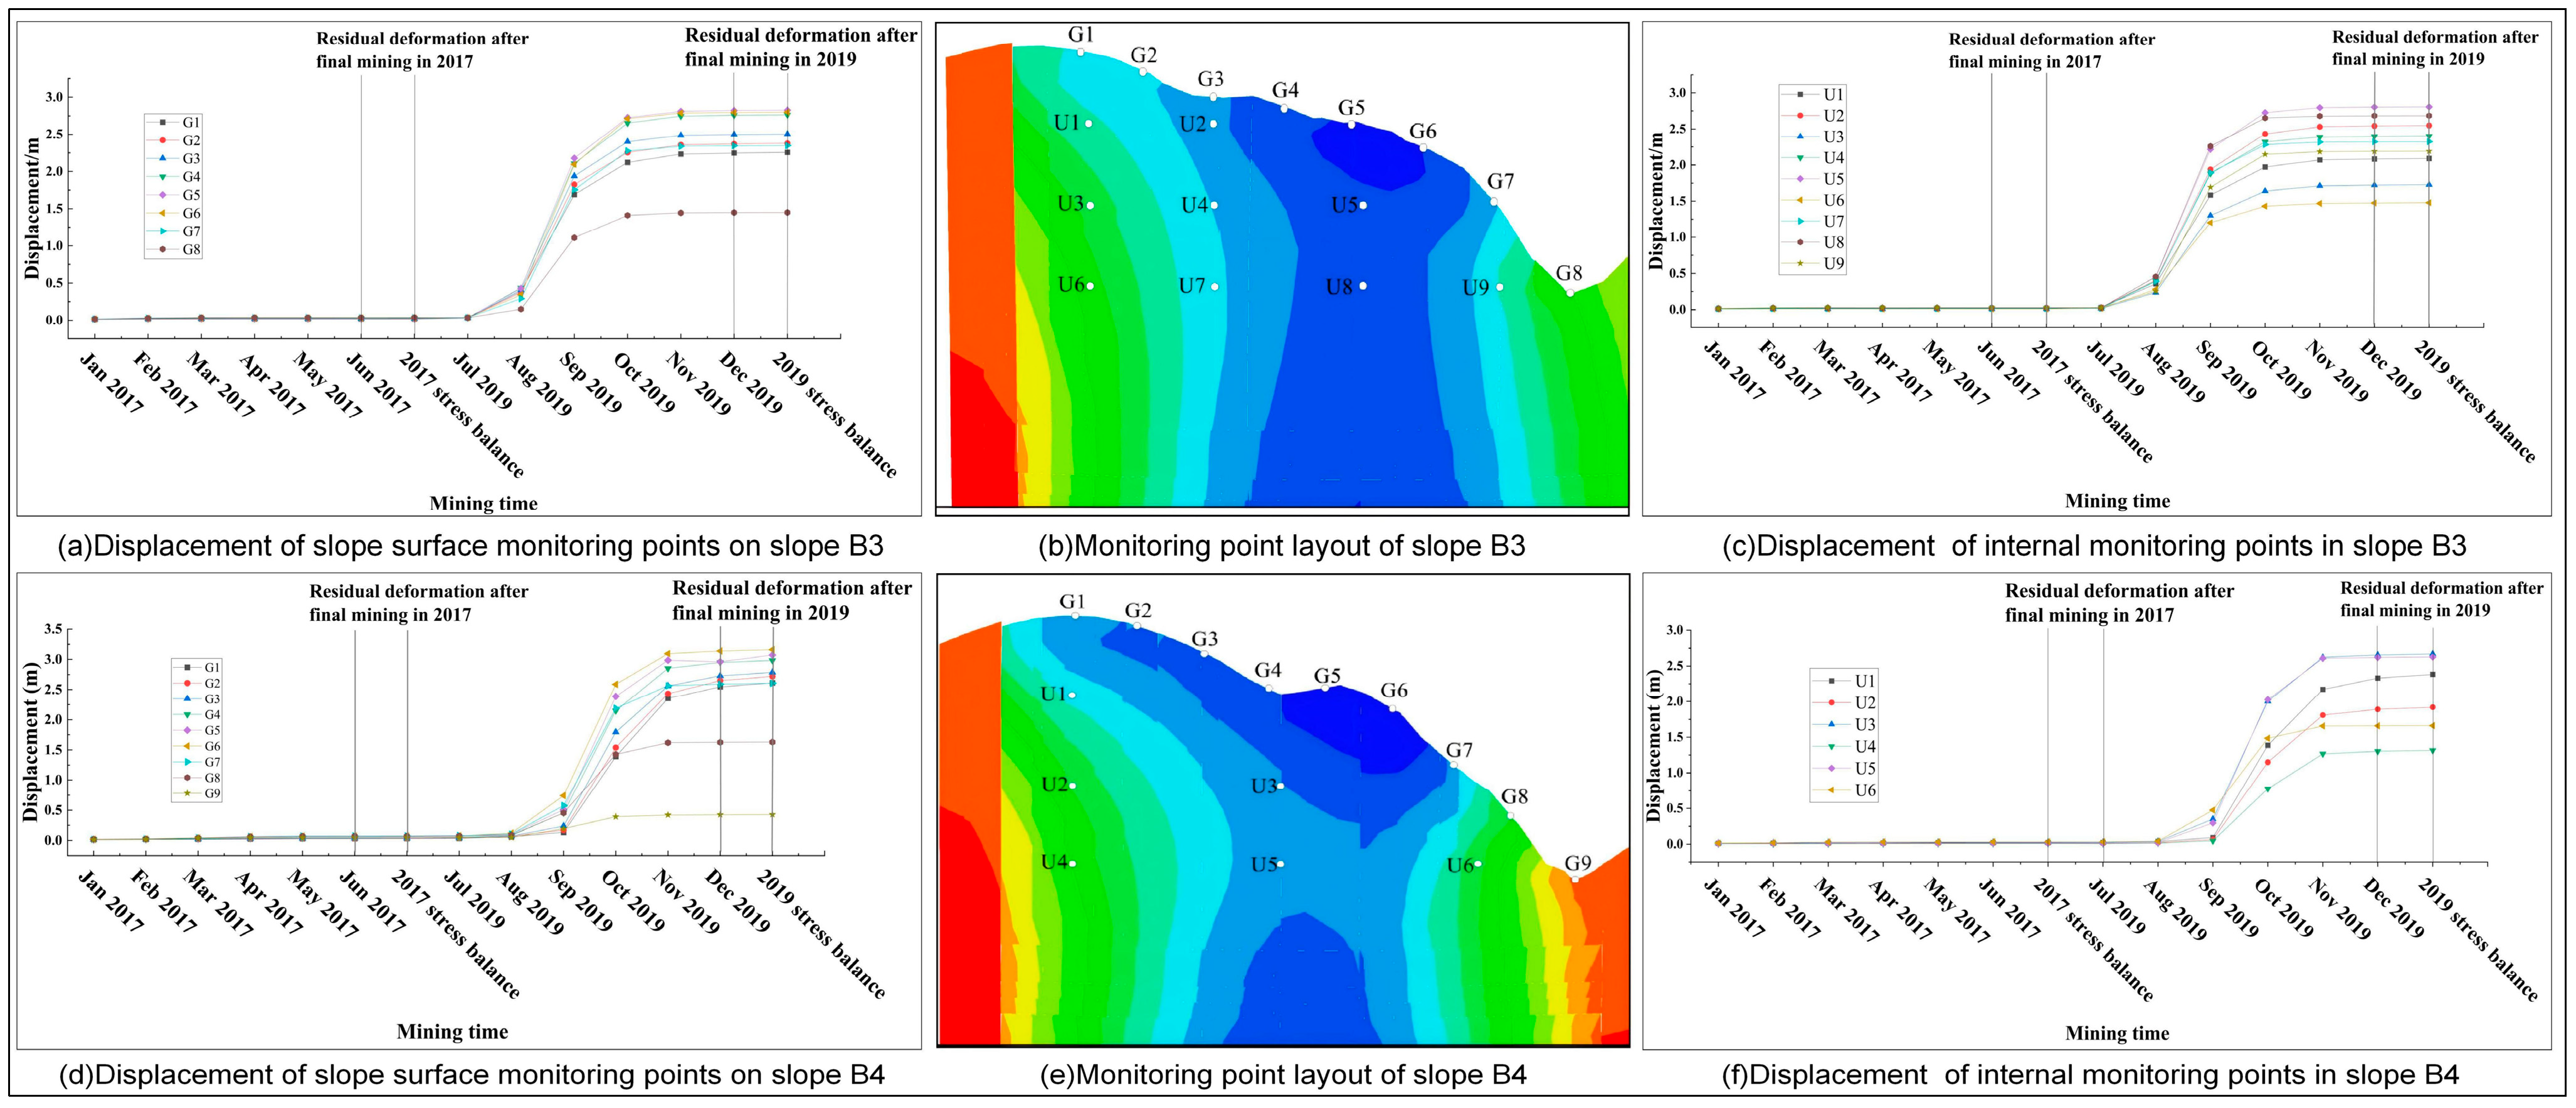
The slope surface deformation of Slope B3 generally showed that deformation occurred first at the gully at the slope toe and then expanded toward the middle part and the ridge, with the high-value zone mainly appearing in the middle region. Since Slope B3 is located in the middle part of the 50206 working face, the internal deformation of the slope was small in the early stage of mining, exhibiting a pattern of relatively weak early response, initial development in the middle part, and rapid intensification after the overburden collapse.
The rapid expansion of slope surface displacement on Slope B3 mainly occurred in the middle stage of mining. In the late stage of mining, the increase in deformation was significantly weakened. The internal deformation was characterized by a sharp increase within a relatively short period. Based on the displacement–time curves (
Figure 12), the lag phenomenon on Slope B3 is less pronounced than on some other slopes because of its location above the central part of the working face. Nevertheless, a careful examination of the curves indicates that the deformation continues to develop for a short period after the face has passed beneath the slope, which confirms the contribution of time-dependent caved rock compaction to the overall deformation pattern. The comparison with documented time-settlement data from central regions of the working face supports this interpretation.
(4) Slope B4
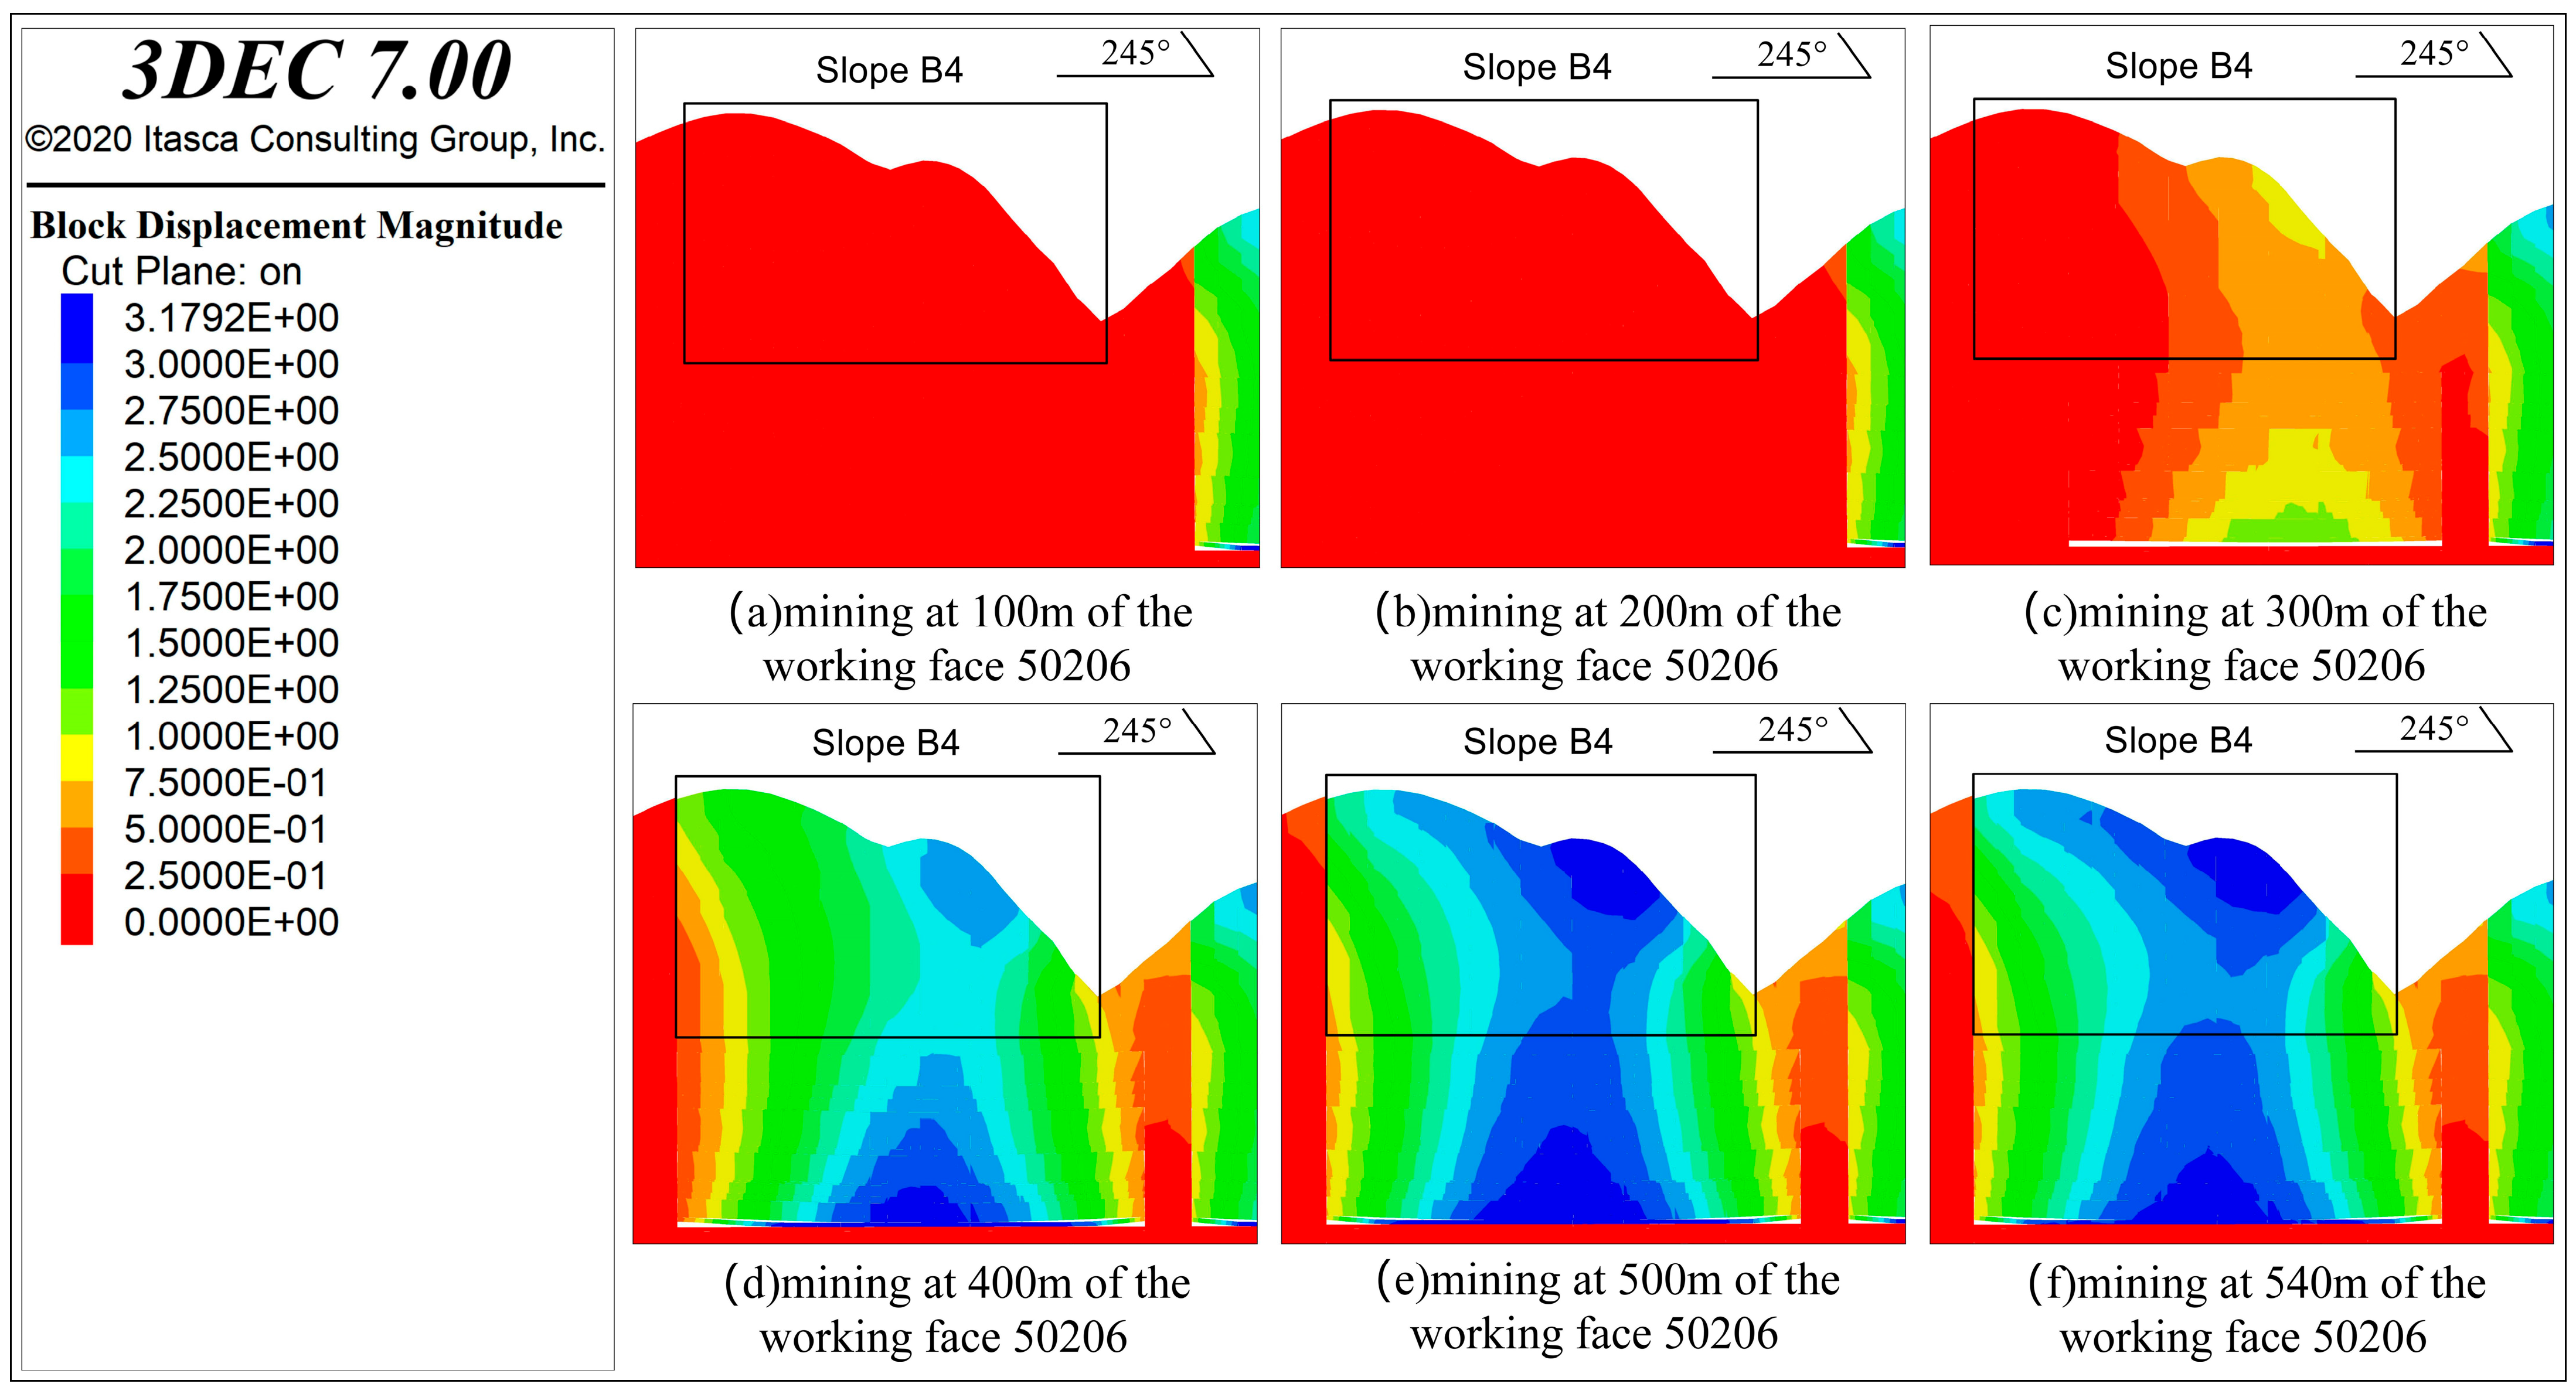
The slope surface deformation of Slope B4 generally showed that the gully at the slope toe responded first and formed a high-value zone, which then shifted to the middle part and expanded toward the slope crest. The internal deformation of the slope generally exhibited a pattern of weak early response, initial development in the middle part, and subsequent expansion toward the upper and lower parts of the slope. During the early to middle stage of the working face advance, the response was weak; in the middle stage, the displacement increased rapidly, and then gradually transitioned into a state of slow increase. The displacement–time curves (
Figure 12) demonstrate that the slope toe initially responds, yet the full development of deformation in the middle and upper parts follows with a certain time lag. This sequence supports the interpretation that the lag is influenced not only by the direction of face advance but also by the time required for the caved rocks to compact and transmit sufficient support loss to the overlying slope.
(5) Slope B5
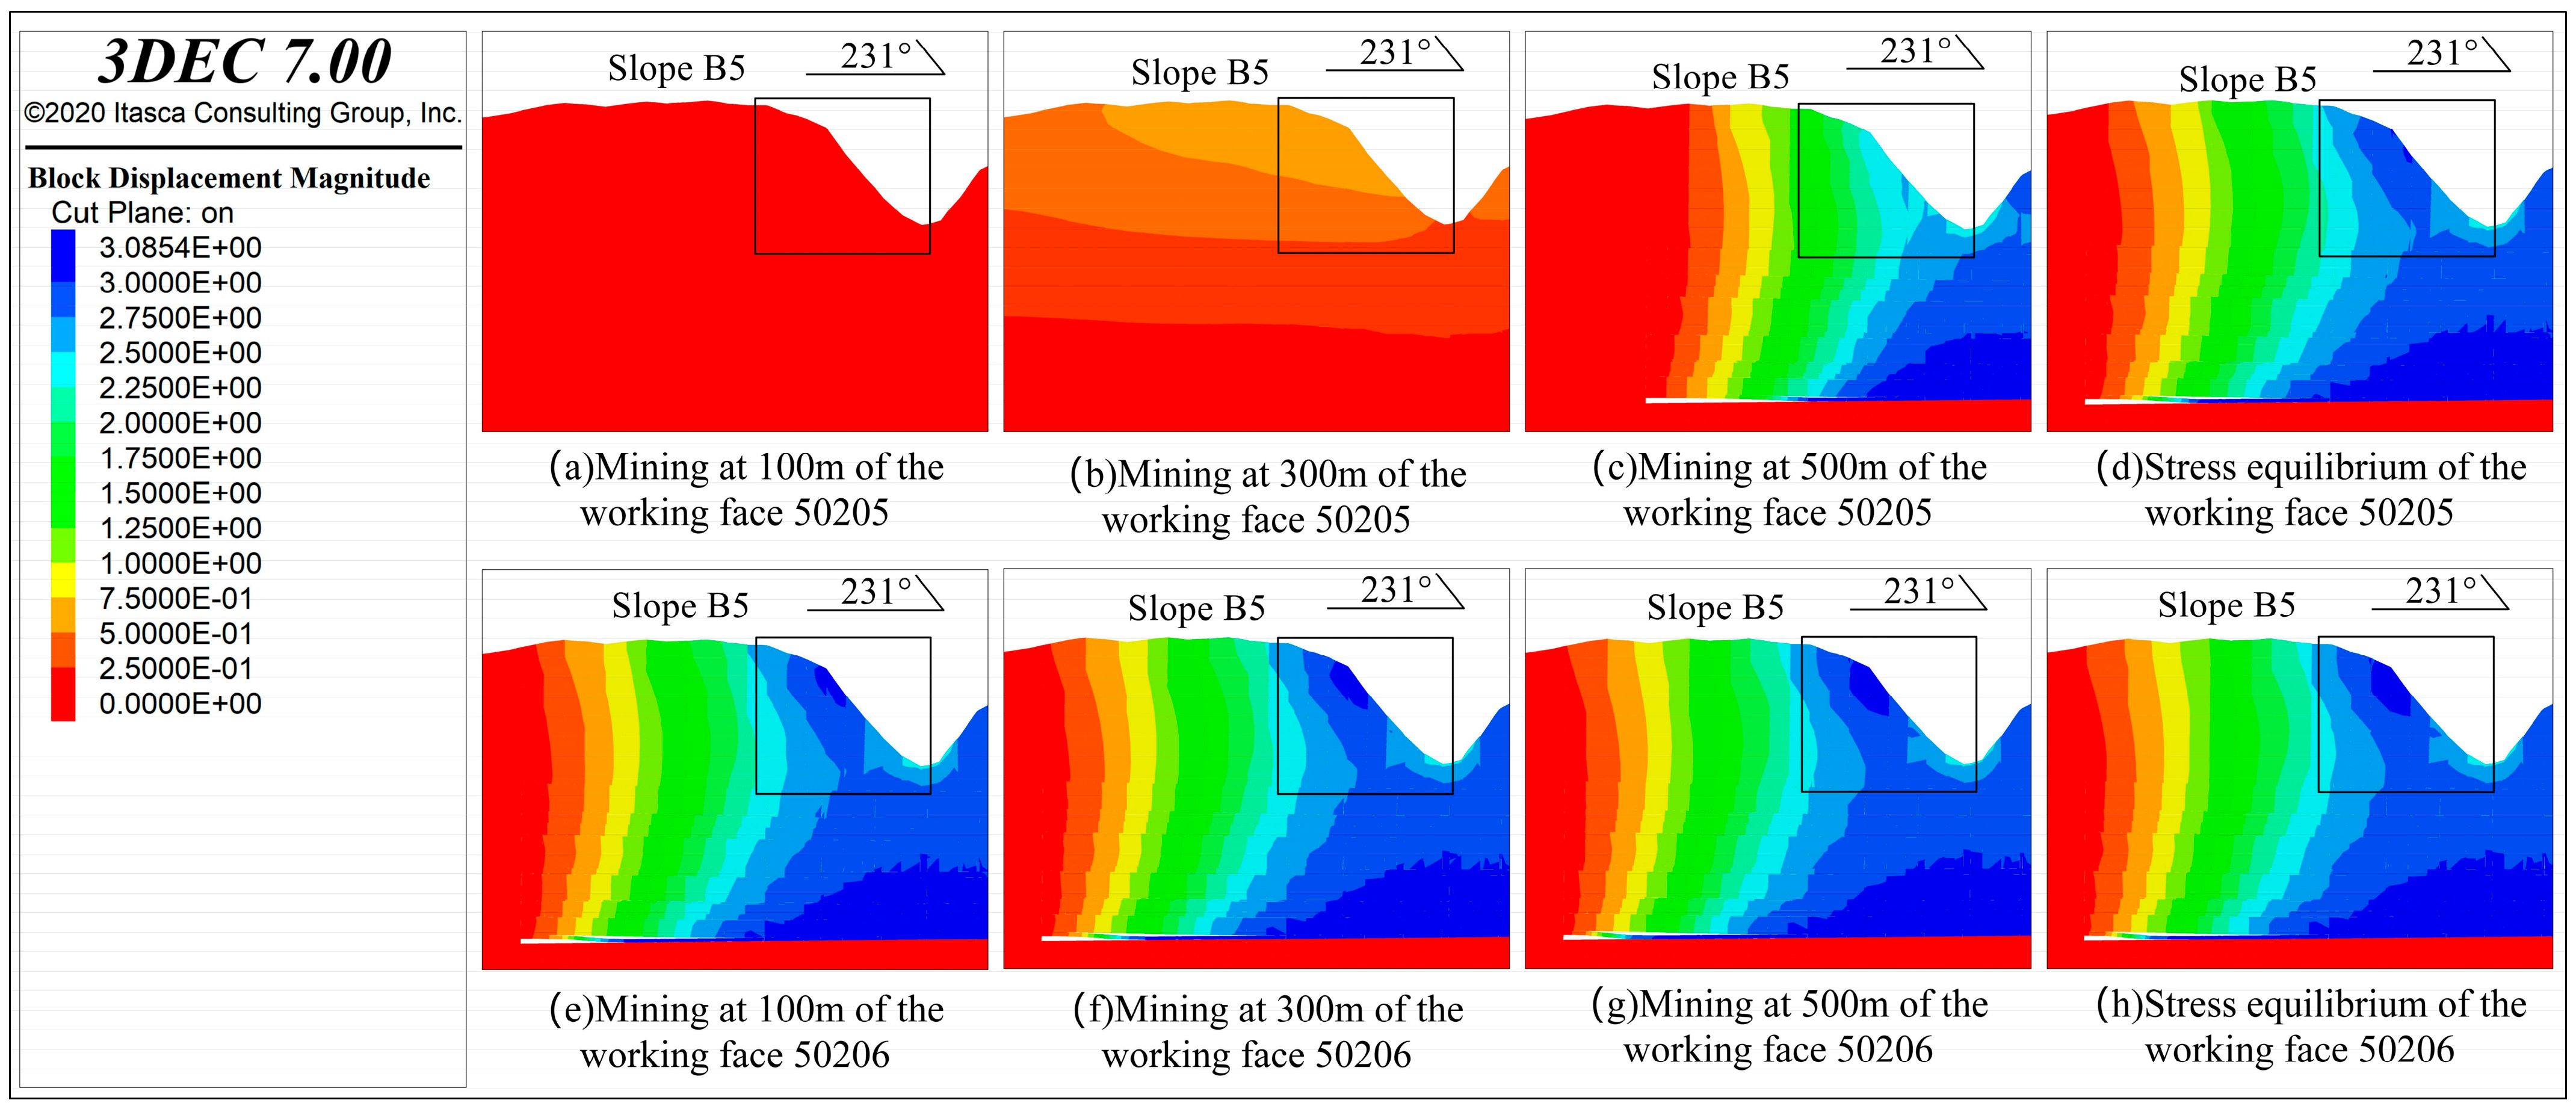
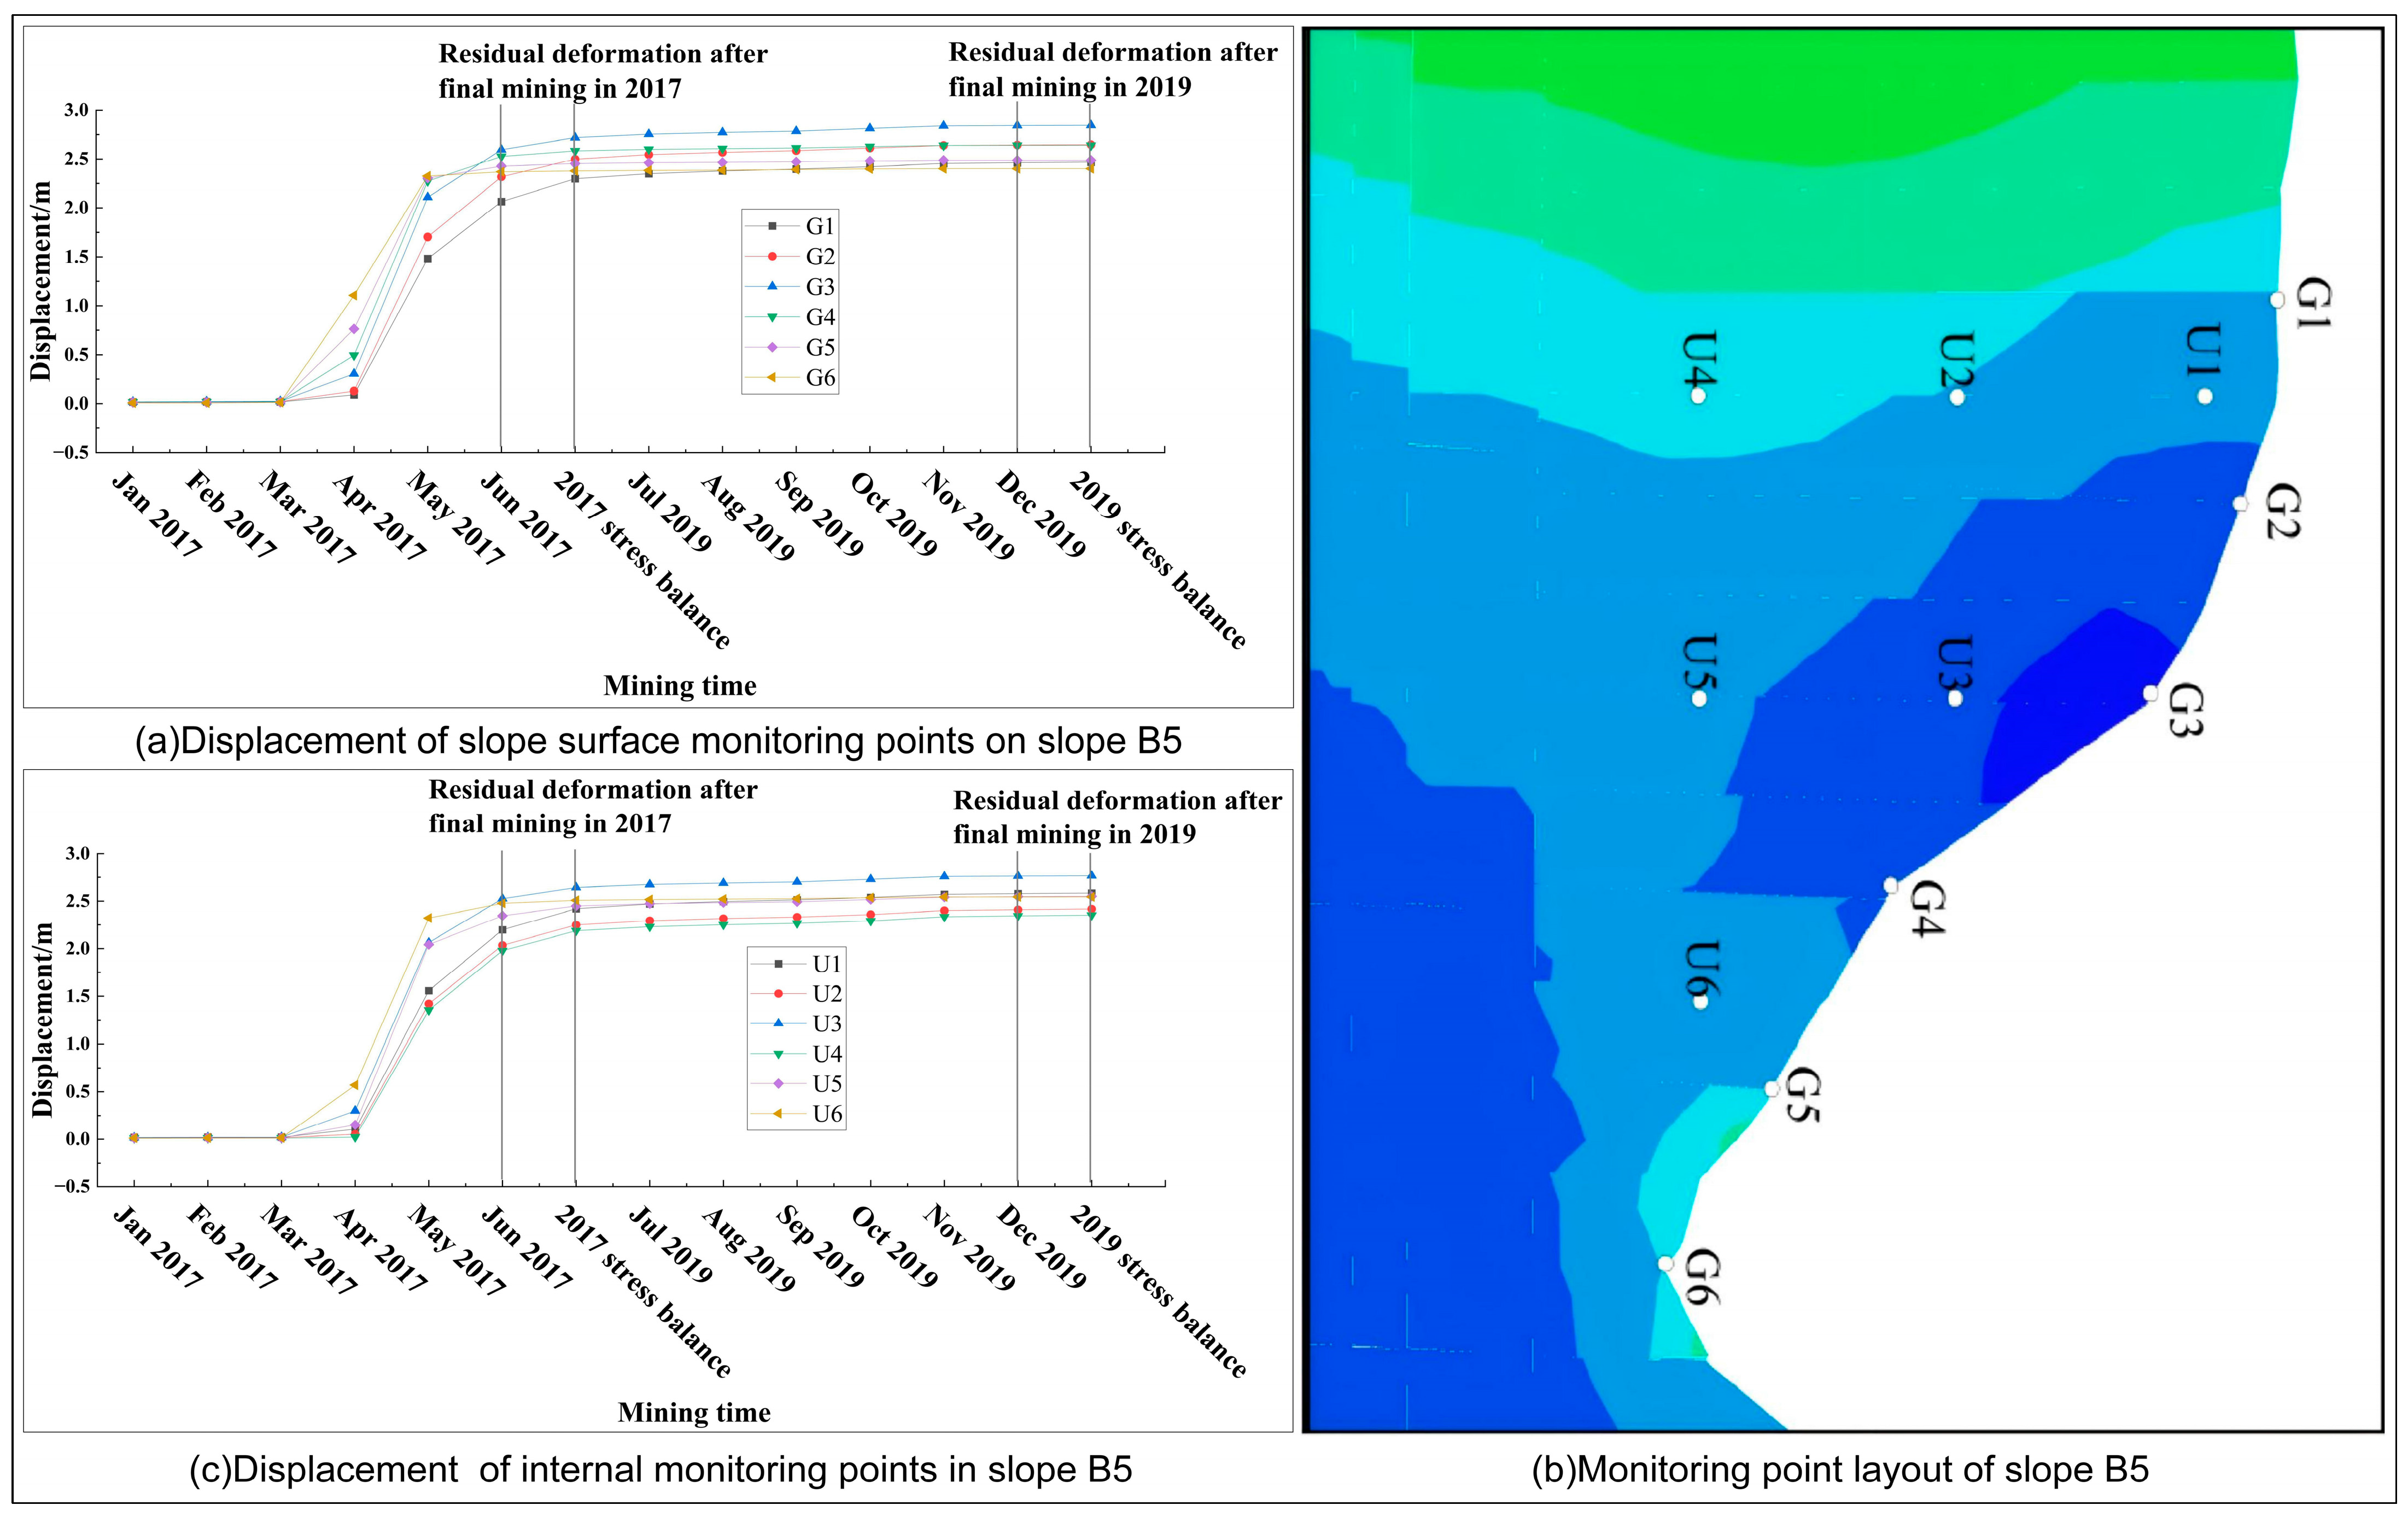
Slope B5 spans two working faces and is located at the tail end of their advance direction. The deformation overall showed a lagging response in the early stage, gradually increased with the sequential mining of the two working faces, and converged toward the subsidence center of the working faces. In the initial stage, the deformation was mainly controlled by the 50205 working face, with high-value deformation zones concentrated near the subsidence center of the 50205 working face and at the topographic turning parts of the slope surface. With the mining of the 50206 working face, the mining influences of the two working faces gradually superimposed, and the slope surface deformation expanded from a previously relatively independent distribution state to the middle region.
The rapid increase in slope surface deformation on Slope B5 occurred in the middle to late stages of mining of the 50205 and 50206 working faces, while the deformation was slow in the early to middle stages. After the 50205 face had passed, the deformation continued to accumulate for a notable period, and a second stage of delayed acceleration occurred after the 50206 face advanced. This phased lag is attributed to the superimposed effects of time-dependent compaction in both goaf areas and the gradual redistribution of stress toward the slope mass. The observed behavior agrees well with published time-settlement records (
Figure 13) from double working face districts, lending further credibility to the modeled time-lag characteristics.
5.2. Influencing Factors of Deformation of Mining-Affected Slopes
The underground goaf created by mining is the core driving force for slope deformation and instability, and it is also influenced by factors such as the spatial position relationship between the working face and the slope (the angle with the mining direction), slope gradient, slope aspect, slope height, and slope shape. Concave slopes (B2) are dominated by toppling failure and subsidence, and their maximum deformation is greater than that of convex and linear slopes. On convex slopes (B1, B3, B4), the high-value deformation zones are distributed in the areas of maximum curvature.
The deformation of mining-affected slopes that span working faces is more complex (Slope B5). For example, on slopes located at the open-off cut (Slope B2), deformation initiates rapidly, while the farther from the open-off cut, the slower the initiation.
The angle between the slope aspect of Slope B3 and the mining direction is 80°, close to 90°, which corresponds to a cross-slope mining condition. The slope is subjected to a “sandwich”-type compressive state, resulting in a more complex deformation mechanism, with both tensile deformation and thrust-type deformation occurring simultaneously and a faster deformation rate. The angle between the slope aspect of Slope B4 and the mining direction is 100°, also close to 90°, and its deformation mechanism is basically similar to that of Slope B3. For Slope B5, the angle between the slope aspect and the mining direction is 170°, representing an up-slope mining condition, where tensile fractures develop and toppling collapse may occur toward the gully at the slope toe. The slope aspects of Slopes B1 and B2 intersect obliquely with the mining direction, falling between down-slope mining (angle close to 0°) and cross-slope mining; tensile fractures dominate, and the deformation is mainly characterized by toppling toward the goaf.
The larger the slope gradient, the greater the mining-induced deformation amount and the larger the proportion of the slope area experiencing deformation. For instance, the maximum deformation of Slopes B1 and B2 is greater than that of Slopes B3, B4, and B5.
The sunny slopes (B1/B2) have relatively well-developed vegetation. Their plant roots provide anchoring and reinforcement effects, effectively increasing the shear strength of the slope’s rock and soil mass. Consequently, the maximum slope surface deformation on the sunny slopes is slightly smaller than that on the shady slopes (B3/B4/B5). Therefore, slope aspect has a certain influence on the magnitude of surface deformation of mining-affected slopes.
5.3. Deformation and Failure Mechanism of Mining-Affected Slopes
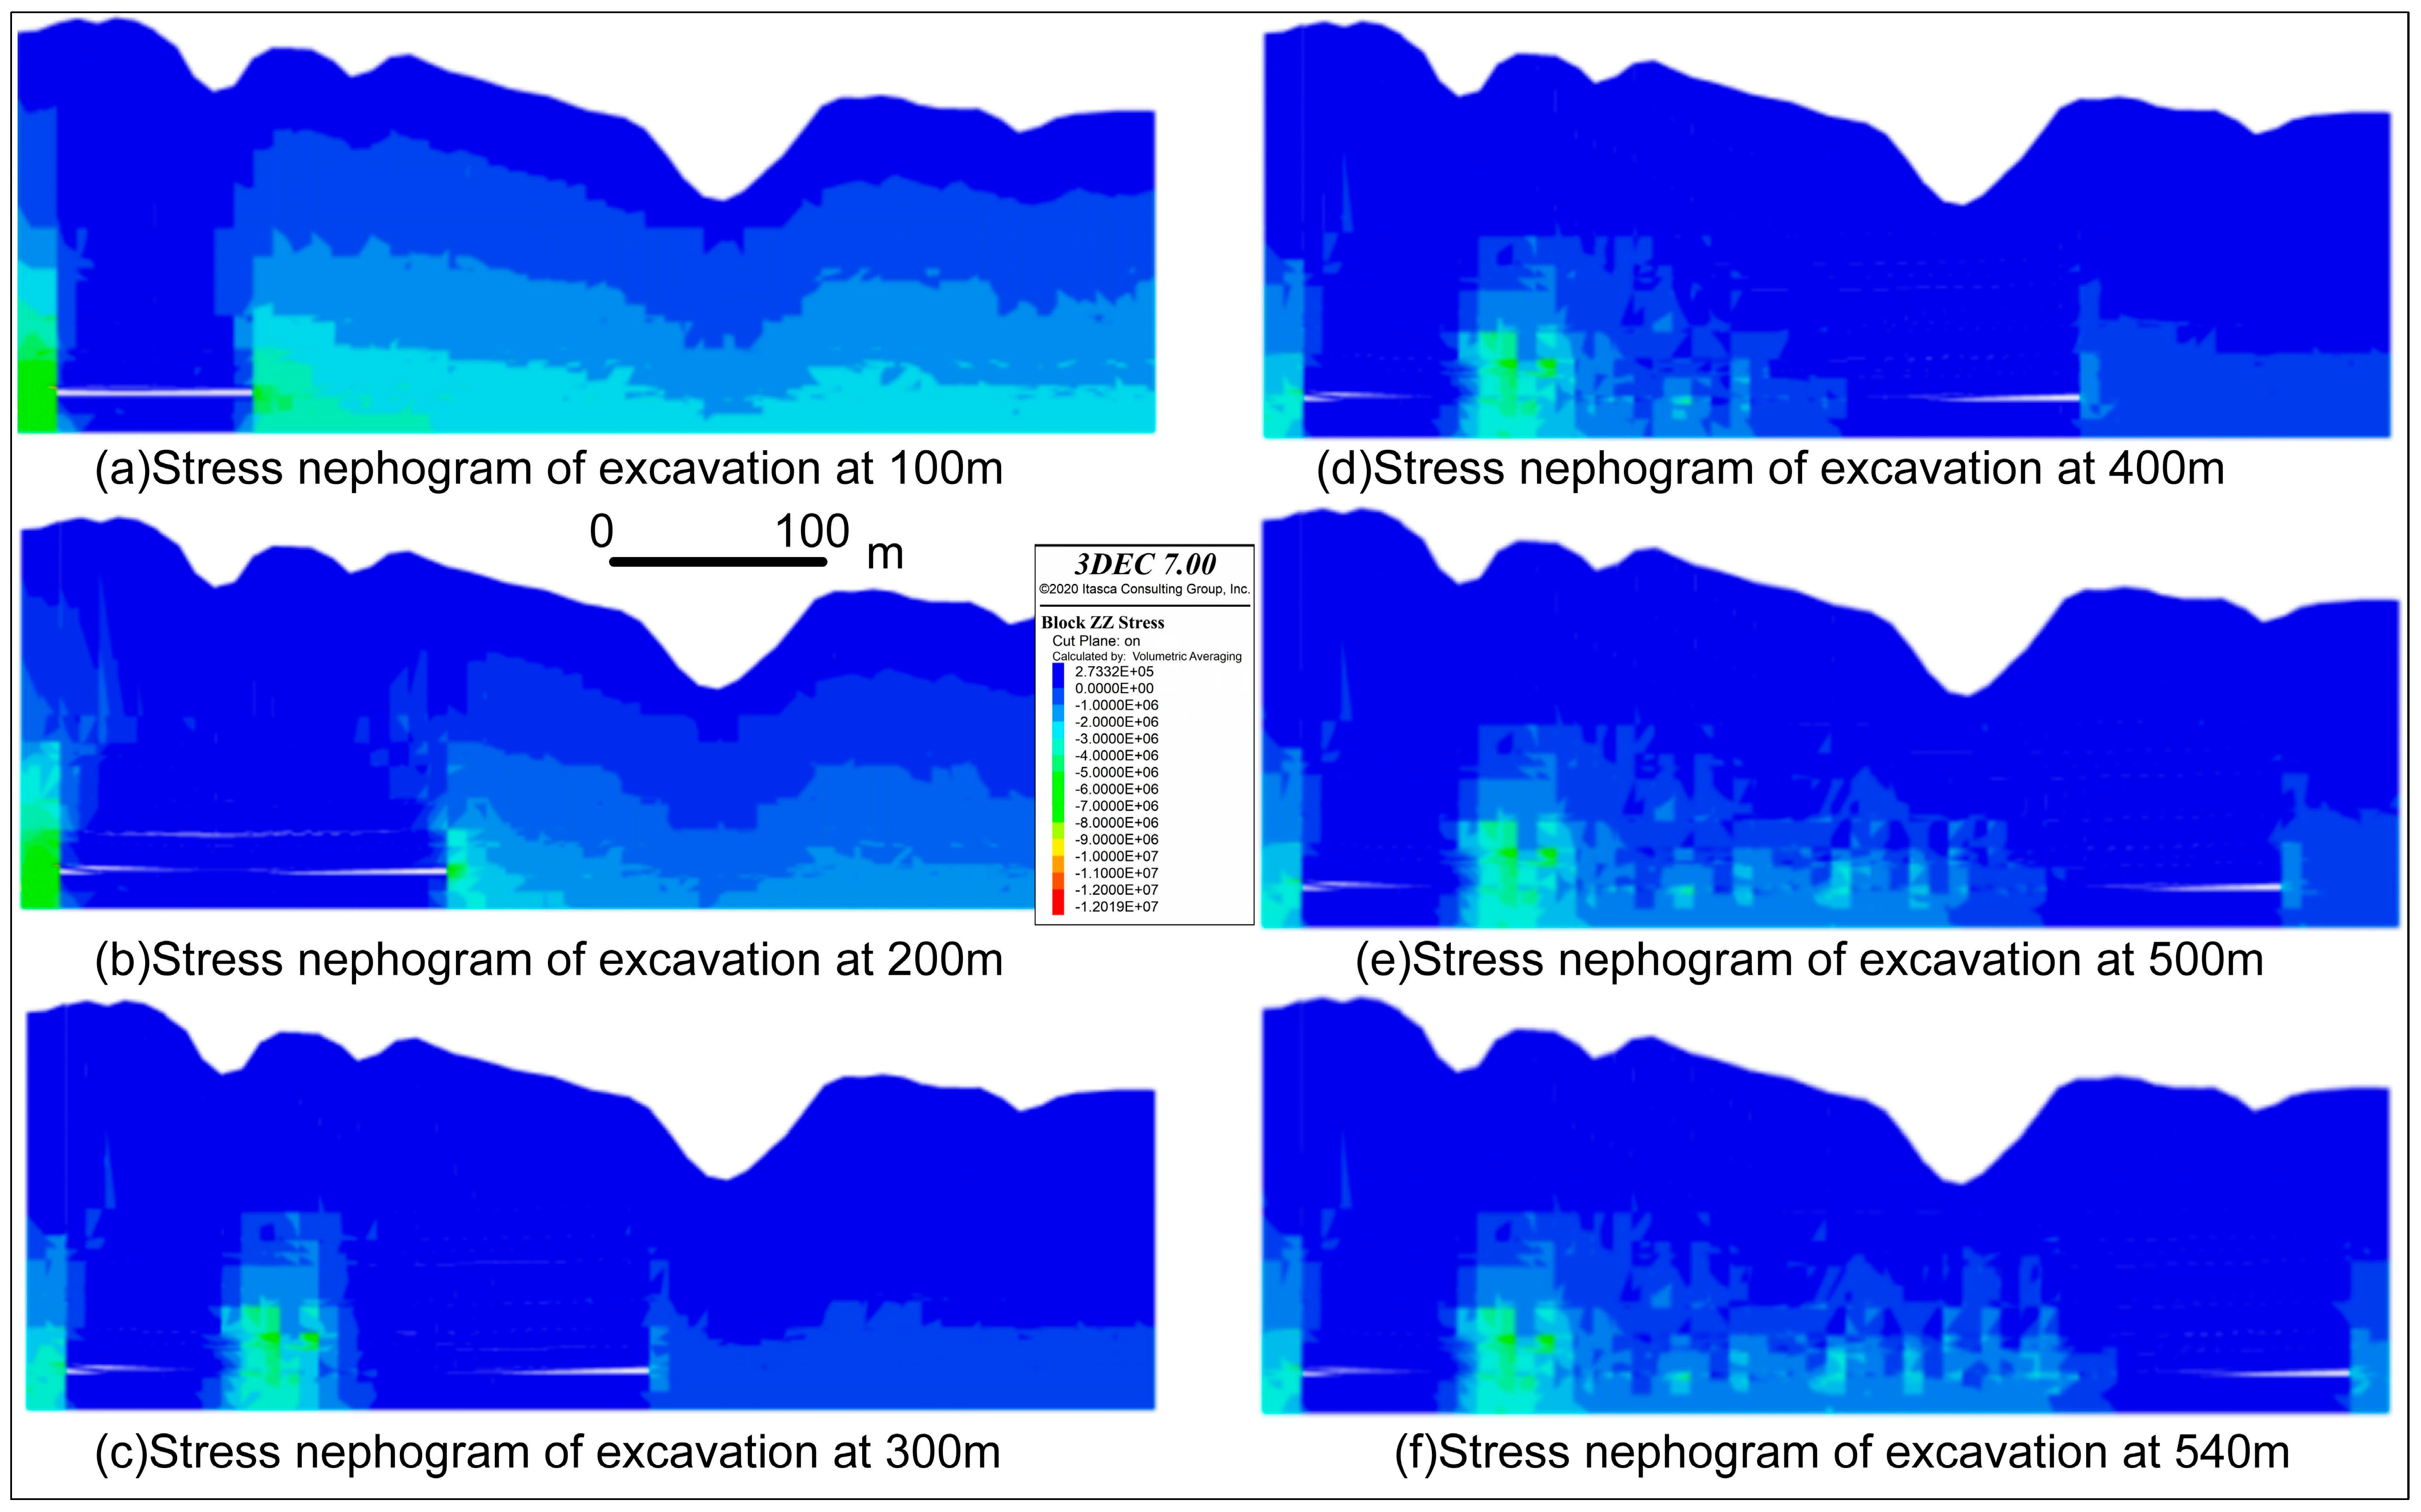
Based on a systematic analysis of the deformation evolution patterns of five typical mining-affected slopes (B1–B5) above working faces 50205 and 50206 in the Zhen’er coalfield, the deformation and failure mechanism can be summarized as a progressive, time-dependent process driven by the coupling of overburden movement and slope topography. As the coal seam is extracted, sequential caving, fracturing and sagging of the strata initiate stress redistribution (
Figure 15), with deformation first appearing inside the slope above the subsidence centre and then propagating toward the surface and the toe. As can be seen from
Figure 15, the ZZ stress field of the rock mass surrounding the goaf undergoes significant changes, forming distinct zones: a stress-reduced zone (the goaf area) and a stress-concentrated zone (in front of the coal wall and on both sides). As observed from
Figure 15c–f, with the expansion of the excavation range, the original stress equilibrium of the overlying strata is disrupted. Under the combined effects of gravity and concentrated stress, the rock layers fracture, separate (bed separation), and gradually cave downward to fill the goaf. This process gives rise to the development of the classic ‘three zones’ (the caving zone, the fractured zone, and the continuous bending subsidence zone), eventually resulting in the formation of a surface subsidence basin and the deformation and failure of the overlying slope above the working face.
Spatially, the initiation point and propagation path vary with the slope’s position relative to the working face: slope B2 above the open-off cut responds rapidly from its middle part; slope B3 above the central panel first deforms at the gully toe; and slope B5 spanning two panels experiences superimposed deformation that converges toward the middle. Temporally, all slopes exhibit a three-stage pattern of weak early response, rapid mid-stage development and late slow stabilization, often with renewed disturbance by adjacent panels. Most critically, a pronounced time lag is observed: even after the face has passed, deformation at the toe or middle-lower part continues to increase, driven by the time-dependent compaction of caved rocks and the delayed transfer of mining-induced stress into the slope mass. This progressive accumulation ultimately manifests as a combination of tension cracks at the crest, shear sliding within the slope, and compressive heaving at the toe.
The magnitude and mode of failure are further controlled by the slope-mining geometry, slope shape, gradient and aspect. The angle between the slope aspect and the mining direction dictates the stress regime: near 90°cross-slope mining (B3, B4) subjects the slope to a ‘sandwich’ compression, producing simultaneous tension and thrust with rapid deformation rates; up-slope mining (~170°, B5) promotes tension cracks and toppling toward the gully; and oblique intersections (B1, B2) are dominated by tension-induced toppling into the goaf. Concave slopes (B2) exhibit larger subsidence and toppling failure than convex or linear slopes, while on convex slopes high deformation concentrates in zones of maximum curvature. Steeper slopes consistently suffer greater deformation and larger affected areas. Additionally, slope aspect exerts an indirect influence through vegetation: sunny slopes (B1/B2) with well-developed root systems show slightly smaller maximum deformation than shady slopes (B3/B4/B5), owing to the reinforcement of shear strength by roots. Together, these factors govern the progressive, time-dependent failure of mining-affected slopes.
6. Conclusions
(1) No matter what type of slope, coal mining will increase the amount of slope deformation. How mining-induced slope deformation evolves over time, which parts of the slope are deforming spatially, and what factors drive the deformation are the most fundamental questions that need to be answered in research on mining-induced slope deformation.
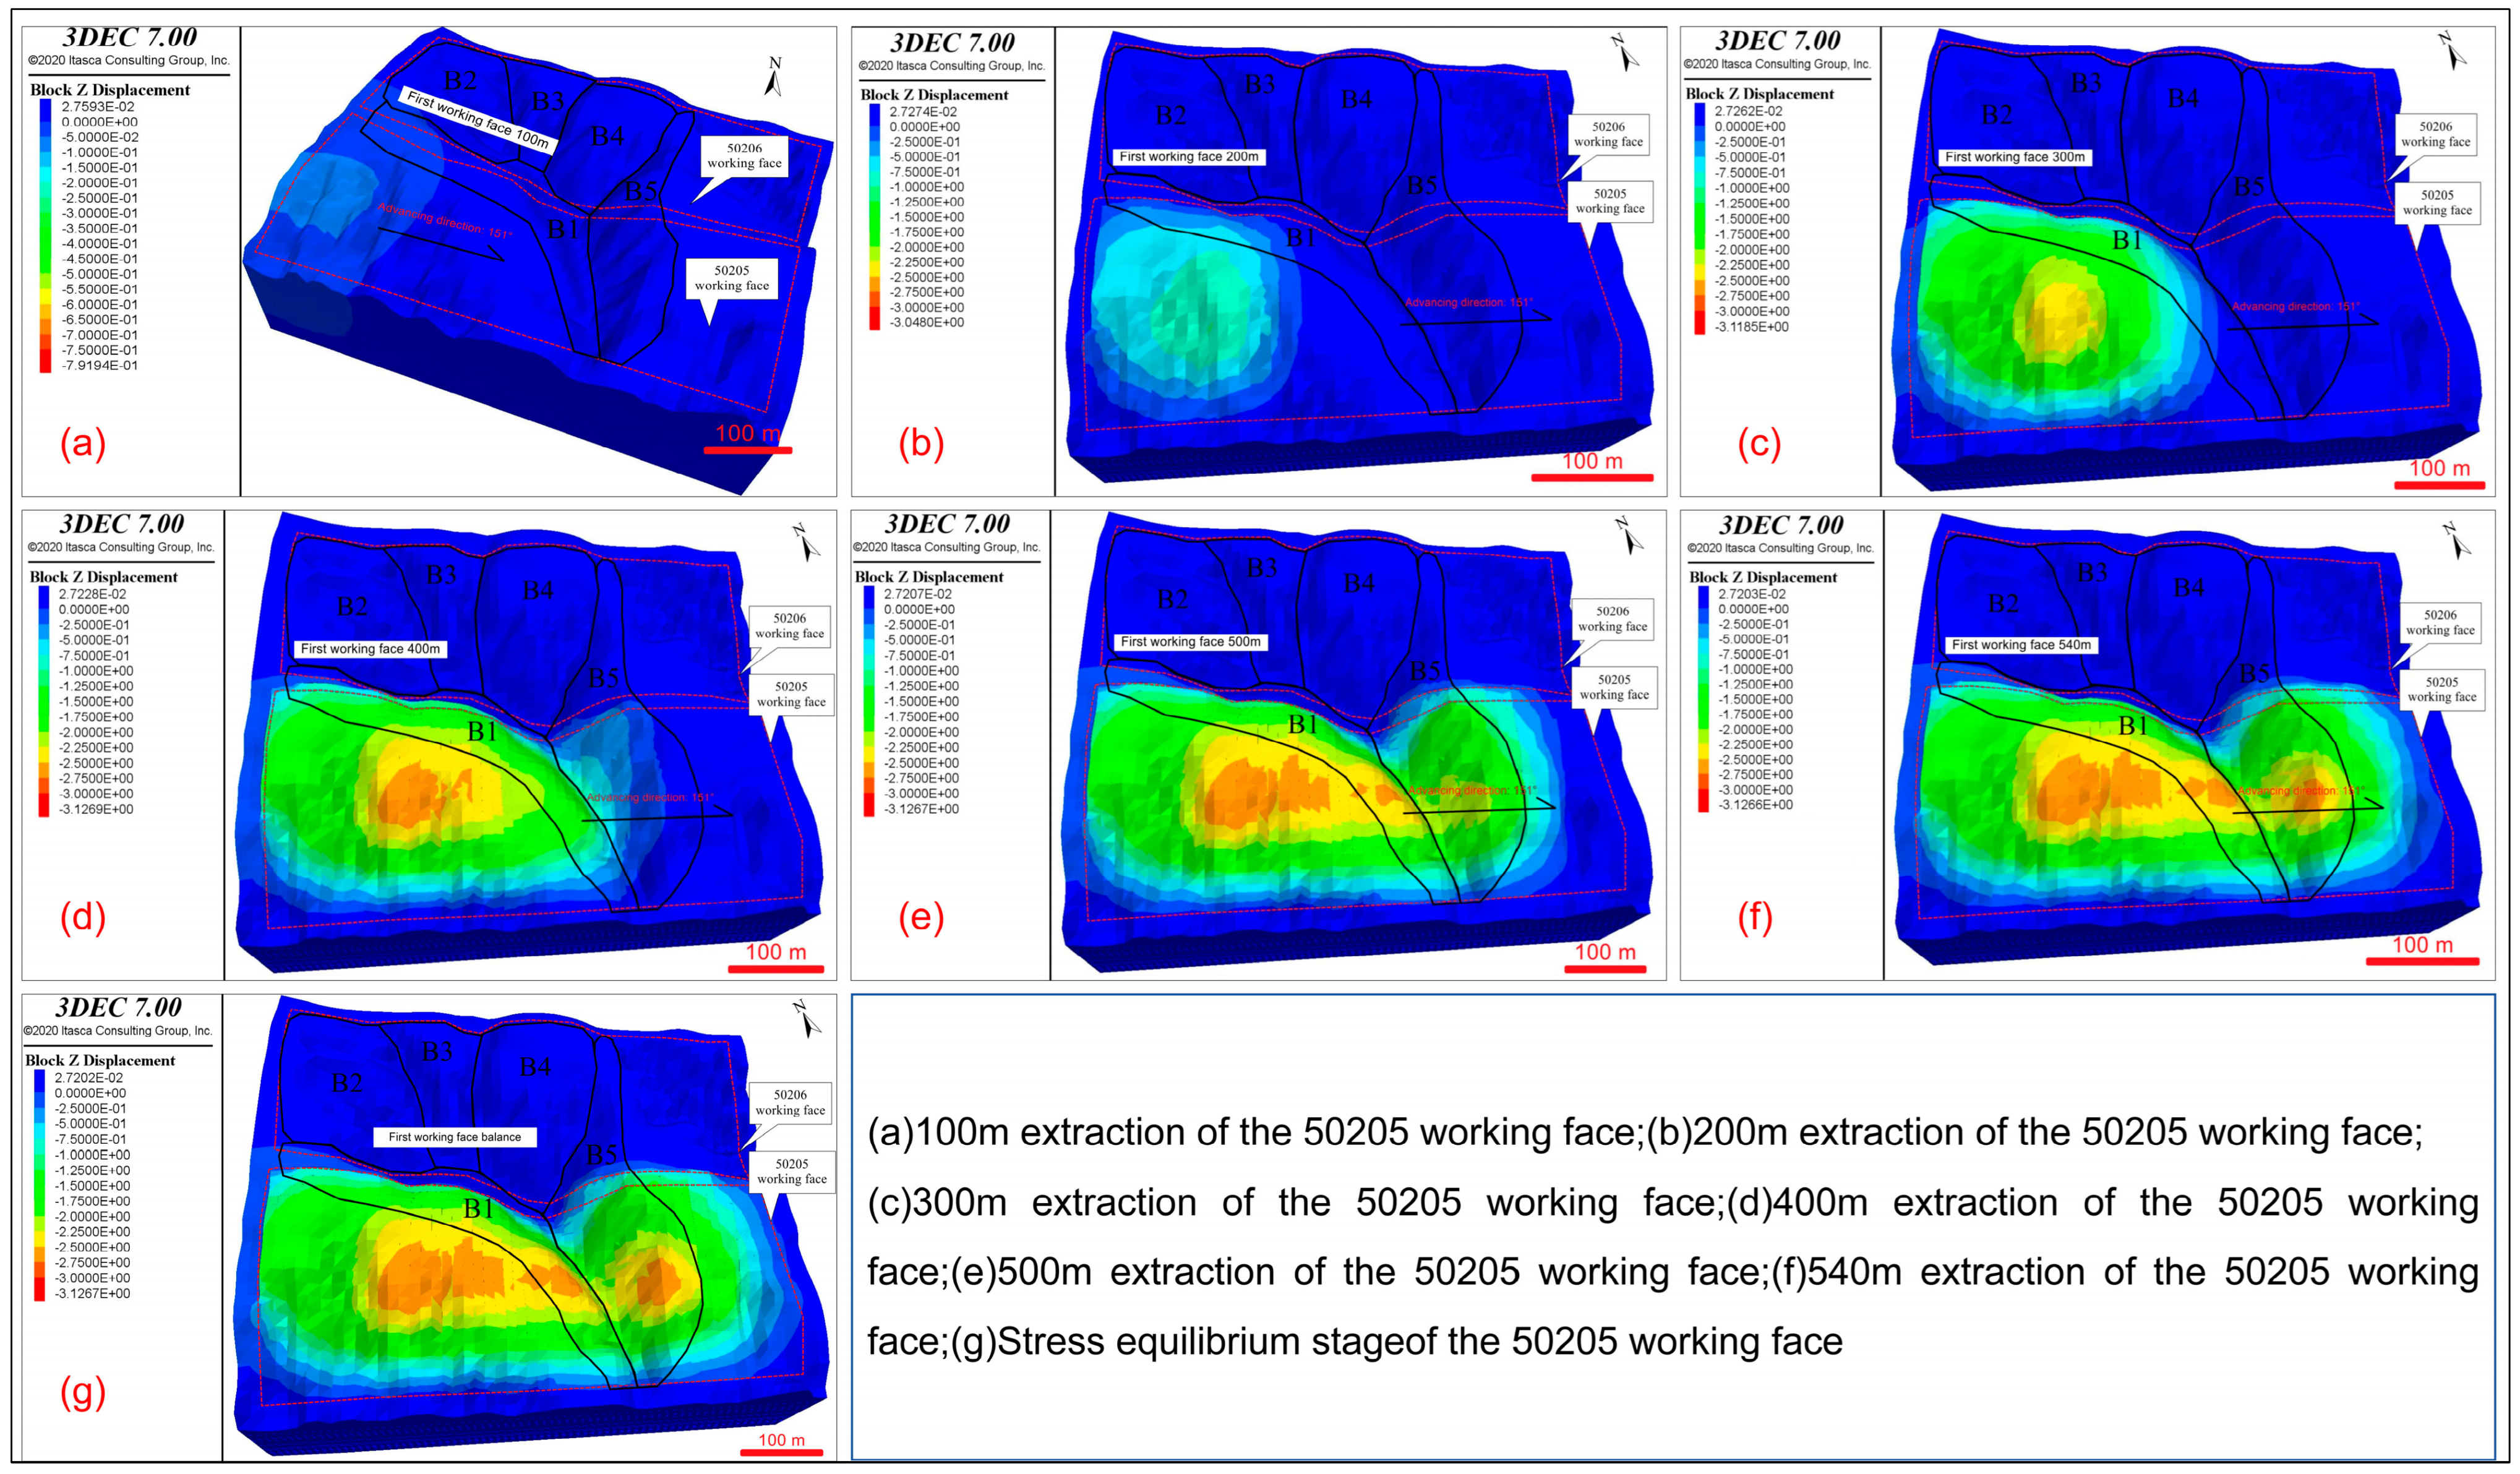
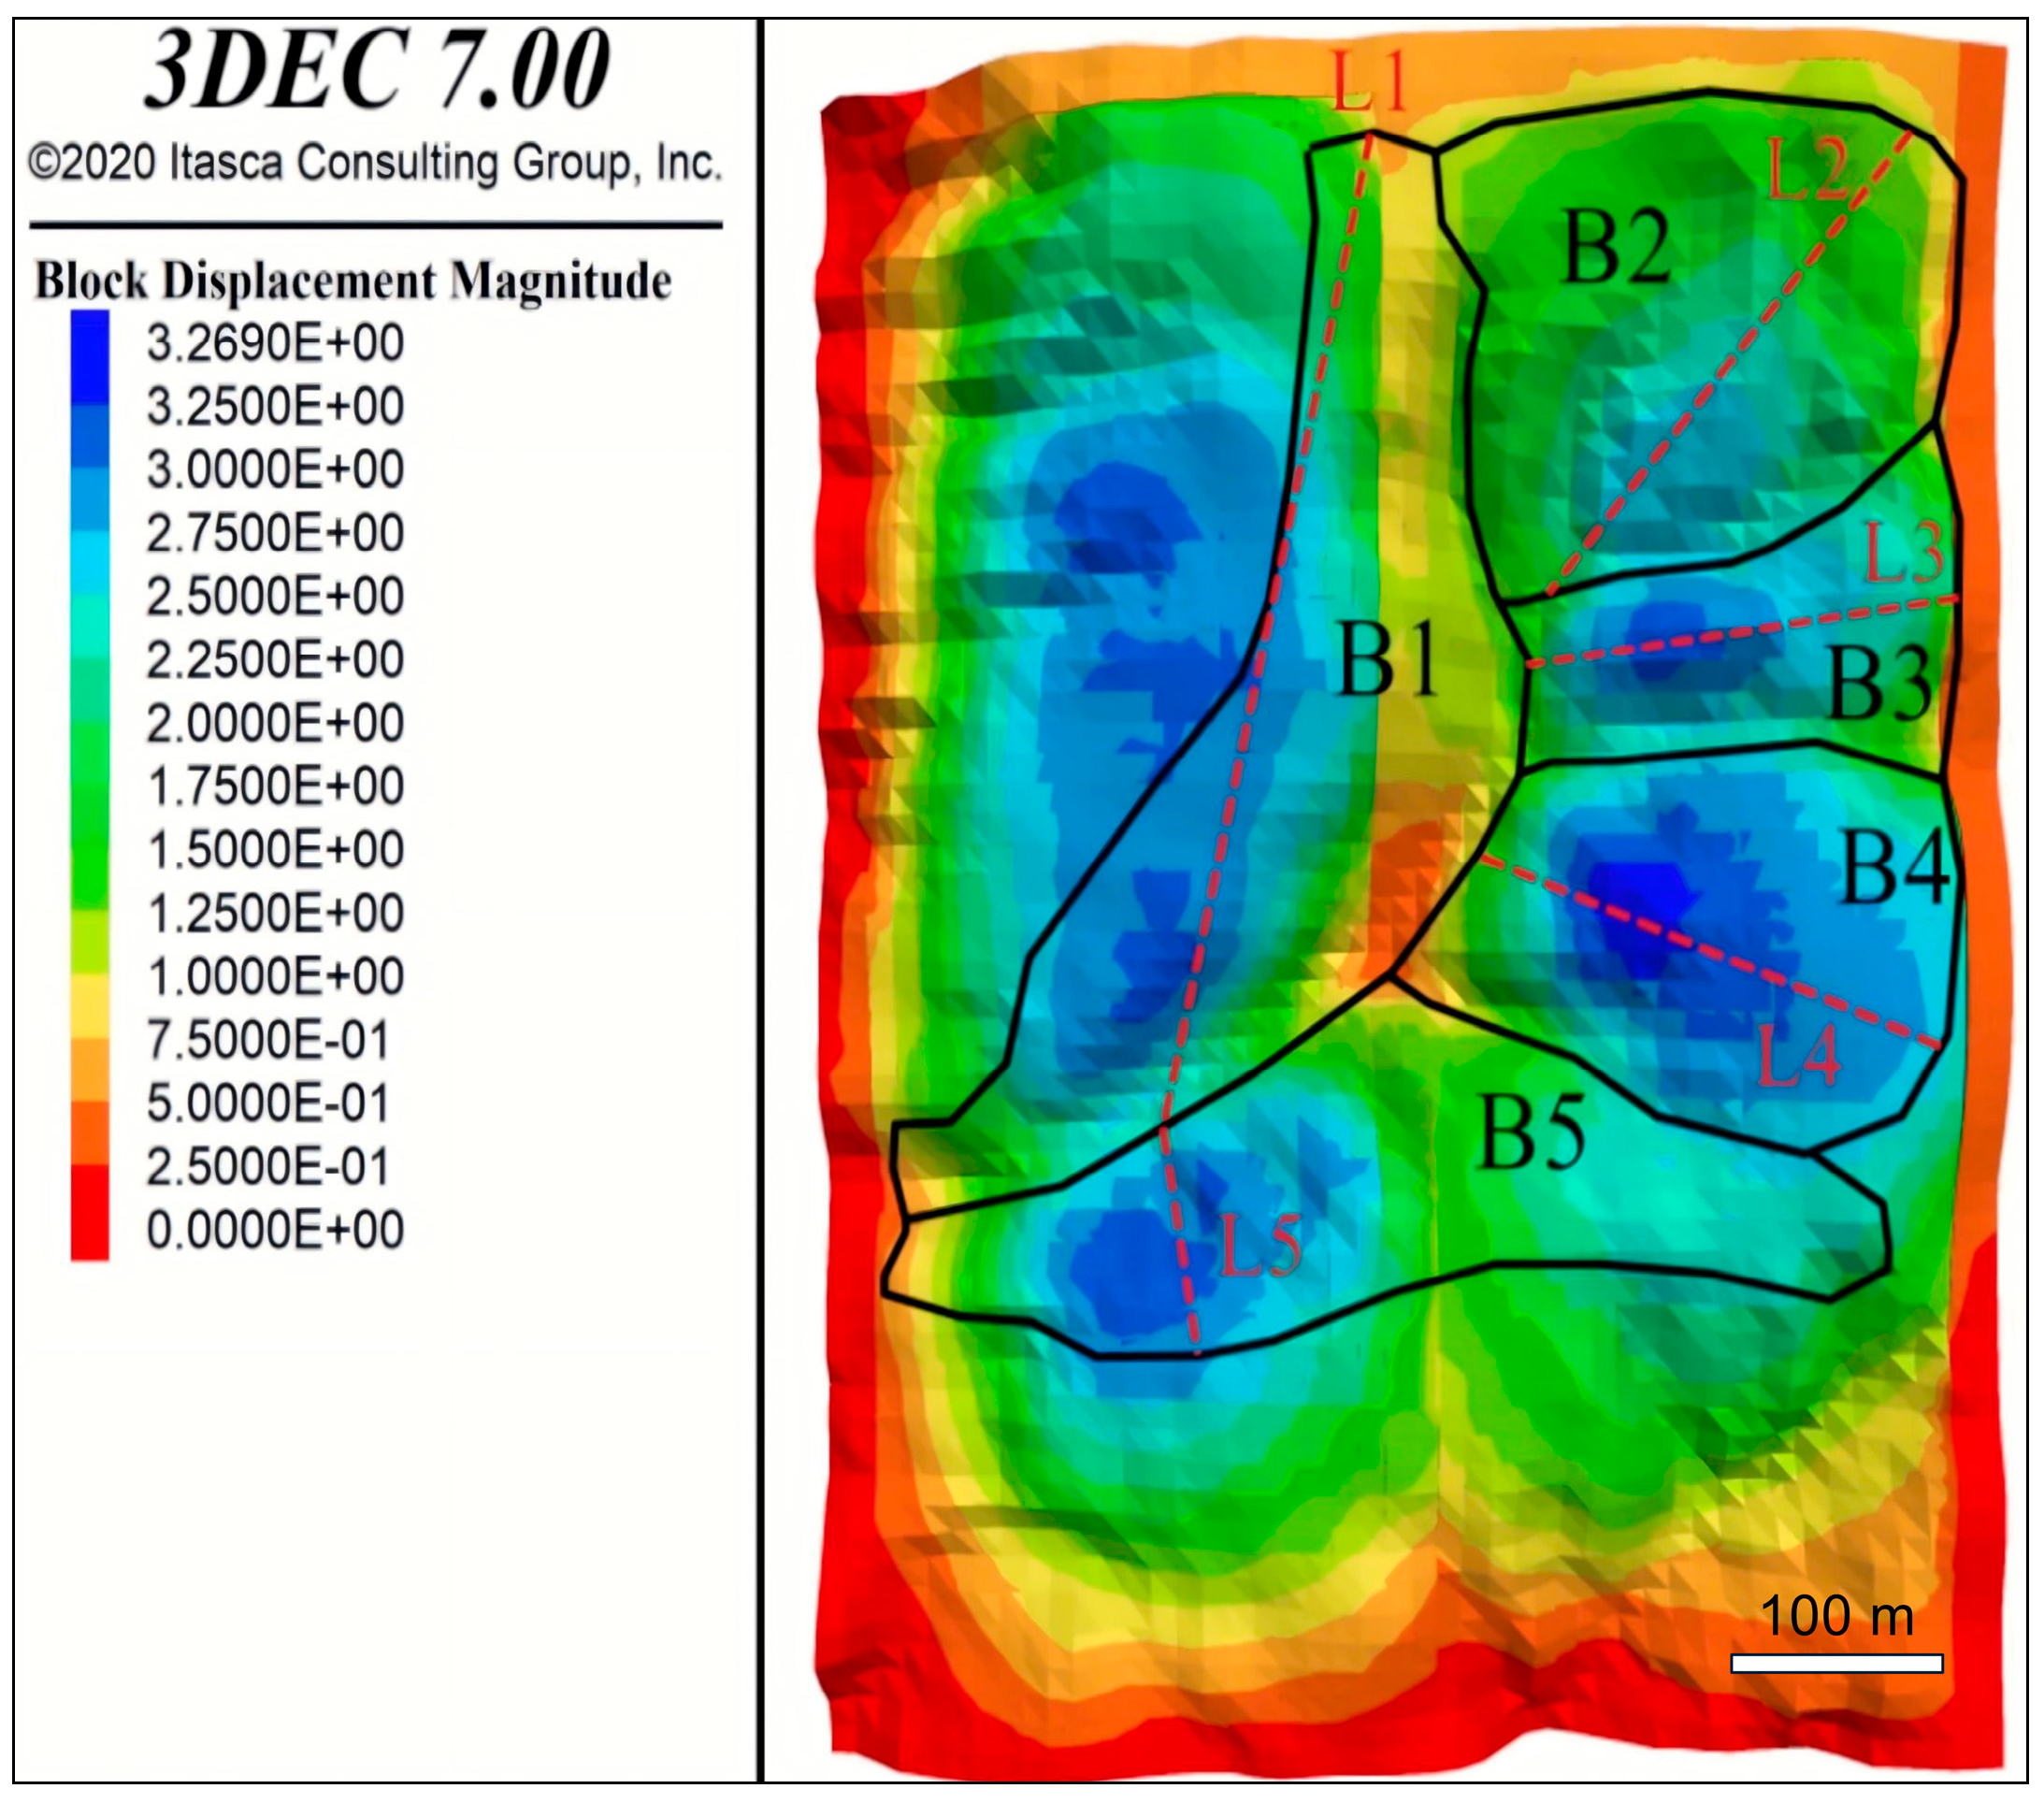
(2) On slope B1, surface deformation first peaked at 0.75 m at the crest (advance 100–200 m), later increased to 2.75 m at the crest, and reached 3.128 m near the toe when the working face reached 500 m. The northern gully remained <0.25 m during the working face 50205 extraction, then increased to 0.50 m (working face 50206 at 200 m) and stabilized at ~1 m above the coal pillar through the end of mining. Slope B2 experienced almost no deformation during mining of the working face 50205. During the working face 50206 extraction, significant deformation initiated early above the open-off cut, with 0.50–0.75 m at the northwest corner; at 200 m advance, central slope surface displacements reached 0.50–1.00 m; as mining progressed to 300–400 m, deformation spread to the entire slope and toward the toe, reaching 0.75–2.48 m; and in the later stage (500–540 m), the pattern stabilized with slow increases along existing high-value zones, giving final displacements of 0.75–2.70 m. As mining advanced, surface deformation on slope B3 gradually intensified: at 100 m advance, no obvious displacement was observed on the slope surface; at 200 m, deformation first appeared at the gully at the slope toe with a maximum displacement of 0.75 m; at 300–400 m, deformation covered the entire slope, reaching 3.00 m at the western ridge; at 500–540 m, the maximum at the western ridge reached 3.27 m, while that at the north and south gullies was relatively smaller but still reached 1.50 m. At 100–200 m advance of the working face, no obvious surface displacement was observed on slope B4. At 300 m, deformation began to appear in the northern part of the slope surface, with a maximum displacement of 1.50 m. At 400 m, a high-deformation zone formed in the northern area, reaching a maximum of 3.00 m at protruding parts and gully incision zones; in the later stage (500–540 m), deformation covered the entire slope, with displacements ranging from 0.5 m to 3.27 m, and the high-deformation zone gradually shifted toward the central part, mainly concentrated in areas with significant topographic relief. During the working face 50205 extraction, surface deformation in the west of slope B5 reached 3.13 m at the gentle-steep transition. During early mining of the working face 50206, the west had residual deformation up to 3.18 m, while the east had none. In the middle-late stages, the east deformed 0–2.25 m (small on coal pillar, max in south) and the west increased to 3.27 m.
(3) Along the L1 profile, the internal deformation of the slope B1 gradually intensified with mining advance. At an advance of 100 m of the working face 50205, only slight subsidence (0.15 m) occurred above the open-off cut. During 200–400 m, displacement concentrated toward the central part and extended upward to the slope surface, with the maximum displacement increasing from 1.35 m to 3.01 m. After 500 m, the maximum displacement remained largely stable, but deformation at the slope toe and the lower part increased notably. Along the L2 profile, slope B2 internal deformation: none at 100 m; 1.05 m at the central part at 200 m; 1.05–2.55 m over the whole slope at 300 m; basically stable at 400–540 m, with slight expansion of the high-value zone. Along the L3 profile: no deformation at 100 m advance; weak response in the central part at 200 m with a maximum of 0.75 m; at 300–400 m, a high-value zone (2.85 m) formed in the central part and migrated upward; at 500–540 m, the high-value zone increased to 3.09 m, with no significant change of the slope B3 internal deformation. Along the L4 profile: no deformation at 100–200 m advance of the working face 50206; at 300 m, internal displacement of 1.00 m appeared in the middle-lower part; at 400–540 m, the central part increased to 3.17 m and extended toward the slope toe and upper part, while displacement on the lower steep slope did not increase significantly. Along L5, B5 slope: no notable deformation (0.02 m) at 100–300 m (working face 50205); 2.75 m at 500 m; and continuous 3.08 m at 540 m in the middle-lower part. During face 50206 mining, the internal deformation zone expanded northward, but the maximum did not increase significantly.
(4) From January 2017 to December 2019, deformation rates on slope B1 during the working face 50205 mining were higher than in 50206, with early high rates then slowing. Surface peak: rate 14.858 mm/d, residual 10.37 mm, and final 2.78 m (toe/mid-lower). Internal peak: rate 1.239 mm/d, residual 7.45 mm, and final 2.71 m. Deformation decreased with depth, due to mining and gravity. In early 2017, displacements on slope B2 were small (max 0.055 m at G3, rate 0.305 mm/d) due to residual effects from face 50205. In late 2019, peak rates occurred at U7 (2.483 m, 13.606 mm/d) and G6 (2.476 m, 13.438 mm/d); the residual deformation maximum was 10.44 mm at G1, and the final maximum was 2.486 m at U7. Surface deformation was consistently larger than internal deformation. In early 2017, small displacements (max 0.037 m at G7, max rate 0.209 mm/d at G8) on B3. In late 2019, rapid increases occurred, with peak surface displacement 2.821 m and rate 15.492 mm/d at G5, and internal maximum 2.804 m at U5. Residual max was 8.97 mm at G1, and final max was 2.826 m at G5. Surface deformation exceeded internal deformation and decreased with depth. In early 2017, displacements were small (max 0.075 m at G7, rate 0.416 mm/d) on B4. In late 2019, rapid increases occurred, with a surface peak at G6 (3.140 m, 17.038 mm/d) and an internal peak at U3 (2.655 m, 14.606 mm/d). Residual max was 112.59 mm at G5, final max 3.072 m at G5, and surface deformation exceeded internal deformation and decreased with depth. During working face 50205 mining (January–June 2017), maximum surface deformation on slope B5 was 2.596 m at G3 (rate 17.308 mm/d), maximum internal deformation was 2.526 m at U3 (rate 16.837 mm/d), with U5 also large. During working face 50206 mining (July–December 2019), surface max remained at G3 (2.845 m), but maximum rate was 0.905 mm/d at G1; internal maximum at U3 (2.763 m) and maximum rate at U2 (0.895 mm/d). Residual max was 7.62 mm at U4, and final maximum was 2.845 m at G3. Surface deformation exceeded internal deformation and decreased with depth.
(4) The deformation of a mining slope is essentially the result of the coupling between overburden movement above the mined-out area and the slope topography. Mining-affected slope deformation is controlled not only by mining activities but also by factors such as slope shape, slope aspect, slope gradient, and slope height. Mining-affected slope deformation exhibits a time lag. The temporal evolution of slope deformation (B1, B5) above working face 50205 can be described as: initiation lag, slow accumulation, a brief period of stabilization, and then renewed intensification after the adjacent working face 50206 is mined. In contrast, the slopes (B2, B3, B4) above working face 50206 show rapid initiation, fast development, and continuous accumulation in the later stage, albeit with a decreasing rate of increase.