Review

Assessing Coastal Exposure Index to Sea Level Rise Along North Java’s Coastline with the InVEST Model: A Critical Case Study from Regency of Jepara to Semarang City, Indonesia


by
Muhammad Rizki Nandika
1,*,
Herlambang Aulia Rachman
2,
Martiwi Diah Setiawati
3,4,*,
Abd. Rahman As-syakur
5,
Atika Kumala Dewi
6,
La Ode Alifatri
4,
Tri Atmaja
7,8,
Takahiro Osawa
9 and
A. A. Md. Ananda Putra Suardana
1
1
Research Center for Ecology (RCE), National Research and Innovation Agency (BRIN), Indonesia, Kawasan Sains dan Teknologi Dr. (H.C) Ir. H. Soekarno, Jalan Raya Jakarta-Bogor Km. 46, Cibinong, Bogor 16911, West Java, Indonesia
2
Department of Marine Sciences and Fisheries, Faculty of Agriculture, University of Trunodjoyo Madura, Jalan Raya Telang No. 02, Kamal-Bangkalan 69162, East Java, Indonesia
3
Institute for the Advanced Study of Sustainability (UNU-IAS), United Nations University, Jingumae 5-53-70, Shibuya-ku, Tokyo 150-8925, Japan
4
Research Center for Oceanology, National Research and Innovation Agency (BRIN), Jalan Pasir Putih I, Ancol Timur 14430, Jakarta, Indonesia
5
Marine Science Department, Faculty of Marine and Fisheries, Udayana University, Bukit Jimbaran Campus, Badung 80361, Bali, Indonesia
6
Directorate of Marine and Coastal Topographic Mapping, Geospatial Information Agency, Jalan Raya Jakarta-Bogor Km. 46, Cibinong, Bogor 16911, West Java, Indonesia
7
Department of Mechanical Engineering, City University of Hong Kong, Kowloon Tong, Hong Kong SAR 999077, China
8
Research Center for Climate and Atmosphere, National Research and Innovation Agency (BRIN), Menteng 10340, Jakarta, Indonesia
9
Center for Research and Application of Satellite Remote Sensing (YUCARS), Yamaguchi University, Ube 755-8611, Yamaguchi, Japan
*
Authors to whom correspondence should be addressed.
GeoHazards 2026, 7(2), 37; https://doi.org/10.3390/geohazards7020037
Submission received: 25 January 2026 / Revised: 16 March 2026 / Accepted: 23 March 2026 / Published: 26 March 2026

Abstract

Utilizing the InVEST coastal exposure model and multi-source geospatial data, this study evaluates coastal vulnerability to sea-level rise along a critical stretch of the North Coast of Central Java, Indonesia, specifically focusing on the Semarang, Demak, and Jepara regions. A Coastal Exposure Index (CEI) was constructed for 256.63 km of shoreline by integrating key environmental variables, including wave climate, high-resolution coastal topography, shoreline geomorphology, bathymetry, coastal habitat distribution, and observed sea-level rise trends-based satellite altimetry from AVISO. The CEI classified coastal segments into five risk categories from Very Low to Very High exposure. A comparative analysis was performed between a scenario incorporating coastal habitats and a scenario without habitats to determine the protective role of natural ecosystems. The results of the analysis show that the average sea-level rise in the study area is 4.3 mm/year. Moreover, the findings also show that the inclusion of coastal habitats significantly reduces extreme exposure levels. Without accounting for habitats, 22.8% of the coastline was classified as Very High exposure, whereas with habitats included this portion dropped to 1.8%. For example, in Jepara Regency the length of shoreline in Very High exposure class decreased from 53.7% (no habitat scenario) to 5.5% when habitats were considered. Overall, the presence of coastal ecosystems shifted large stretches of the coast to lower exposure classes. This study demonstrates that natural habitats have a critical influence on coastal exposure, substantially mitigating the vulnerability of North Java’s coastline to sea-level rise.

1. Introduction

Sea level rise is widely recognized as a major challenge for coastal regions around the world. Observations over recent decades show that the global mean sea level is rising faster than before, mainly due to ocean warming and the melting of land ice [1,2]. At the same time, many studies also highlight that the impacts of sea level rise are not uniform but vary depending on local physical and environmental conditions. Local physical conditions often determine whether a coastline is strongly affected or relatively stable [3,4]. Several parameters, including wave conditions, coastal geomorphology, and nearshore bathymetry, strongly influence how sea-level rise affects coastal systems. The extent of these impacts, however, is often mediated by coastline configuration and protection structures, including seawalls, revetments, breakwaters, as well as soft protection measures such as dunes and artificial reefs, which can substantially reduce coastal exposure by attenuating wave energy and limiting shoreline retreat [5,6]. While effective, hard structures often involve high construction and maintenance costs and may alter sediment transport processes or generate downstream erosion [7,8], whereas soft protection measures may require sufficient spatial extent and periodic maintenance to remain effective under rising sea levels and extreme events [5]. To complement or provide alternatives to these measures, natural ecosystems, including mangroves, coral reefs, and seagrass meadows, offer a critical line of defense by reducing wave energy and mitigating erosion through natural processes [9,10].
To translate these multi-factor controls into spatially comparable information for planning, coastal studies widely utilize index-based approaches, such as the Coastal Vulnerability Index (CVI), Coastal Exposure Index (CEI), and Coastal Risk Index (CRI). These methodologies synthesize hazards and shoreline characteristics into relative rankings [11,12,13], serving as essential tools to quantify the degree to which coastal areas, communities, and infrastructure are exposed to these natural hazards [14]. Understanding coastal exposure to sea level rise is therefore essential for coastal risk assessment and management. In these studies, “coastal exposure” is treated as a relative index reflecting the combined influence of offshore thrust (e.g., waves), coastal conditions (geomorphology, nearshore bathymetry, and topography), and the presence of natural habitats that can dampen wave energy. Thus, the index is intended to support spatial priorities and ecosystem-based coastal planning, rather than to generate deterministic predictions of inundation extent.
Although CVI, CEI and CRI are often cited interchangeably in applied studies, they reflect distinct emphases and methodological choices. The CVI tradition focuses primarily on physical susceptibility by combining ranked physical variables (geomorphology, elevation, shoreline change, etc.) into a composite score that highlights relative physical vulnerability alongshore [11,12]. The CEI emphasizes exposure by integrating offshore forcing (waves, surge), nearshore physical conditions (bathymetry, geomorphology) and the presence or absence of protective habitats within a spatially explicit alongshore routine, making it especially useful for evaluating habitat protective capacity [15,16,17,18]. The CRI and related risk frameworks extend these concepts by coupling hazard/exposure metrics with social or economic vulnerability and adaptive capacity indicators to better inform risk management and prioritization [13]. Across these index families, methodological choices, such as the number and definition of input variables, ranking/threshold rules, and weighting schemes, drive differences in outputs and interpretability. Index approaches therefore provide complementary tools: CVI/CEI are effective screening tools for spatial prioritization and ecosystem-service evaluation, while CRI is more suited when linking exposure to societal impacts and decision making. Importantly, all index methods are sensitive to input data quality and scale and do not replace process-based (dynamic) modeling when absolute forecasts of inundation or temporal evolution are required.
Indonesia is considered highly exposed to sea level rise due to its long coastline and the concentration of population and activities in low-lying coastal areas [19,20]. Java Island, especially along its northern coast, hosts several major urban centers, industrial zones, and ports. Over the past two decades, this area has experienced frequent coastal flooding, shoreline erosion, and land loss [21,22]. These impacts are intensified by local land subsidence, which exceeds the rate of global sea-level rise in several cities. Semarang is often mentioned as one of the most affected cities, where tidal flooding, locally known as rob, has become a regular event [23]. Similar conditions are also found in Demak and Jepara Regencies. This Jepara–Demak–Semarang corridor represents a critical case because it combines (i) dense coastal population and strategic economic functions (ports, industry, and aquaculture), (ii) recurrent tidal flooding and erosion hotspots, and (iii) strong alongshore contrasts in geomorphological setting and coastal habitat condition, making it a natural “test bed” for evaluating spatial variability in exposure under comparable sea-level forcing. Together, these conditions show the need for spatially detailed assessments of coastal vulnerability along the north coast of Java.
Coastal vulnerability along the north coast of Java is shaped by a combination of oceanographic, geomorphological, and ecological factors. The region is characterized by relatively shallow waters, muddy to sandy coastlines, and extensive river inputs that shape coastal morphology [24,25]. Although wave energy in the Java Sea is generally moderate, seasonal monsoon patterns can still generate significant coastal impacts, especially in unprotected shoreline segments [26]. At the same time, large areas of mangroves and other coastal habitats have been degraded due to aquaculture expansion and coastal development [27,28]. This degradation reduces the natural buffering capacity of the coast. As a result, coastal segments with similar sea-level rise rates may experience very different levels of risk. This makes an integrated coastal vulnerability assessment necessary.
The InVEST (Integrated Valuation of Ecosystem Services and Trade-offs) Coastal Vulnerability model has been increasingly used to assess coastal conditions in different parts of the world. Previous studies have used InVEST to evaluate coastal vulnerability in the United States, Europe, and small island states [16,29,30,31]. Several studies demonstrated that the model is effective in integrating wave climate, coastal geomorphology, bathymetry, and coastal habitats into a single index [17]. In many cases, the role of coastal ecosystems is discussed in general terms rather than tested through different scenarios. To address this limitation, scenario-based implementations that explicitly compare “habitat” versus “no-habitat” conditions are needed to quantify how and where ecosystems shift exposure classes and reduce index values alongshore, rather than only describing their benefits qualitatively. This suggests that further application and refinement of the model are still needed.
Although the number of coastal vulnerability studies is increasing worldwide [16,29,30,31], a critical knowledge gap remains in measuring coastal exposure in tropical regions that face interacting extreme drivers, particularly those occurring on the North Coast of Java [32,33]. This is particularly true regarding the combined effects of global sea-level rise [2], severe local land subsidence [21,23,34], and rapid loss of natural coastal buffers [27,28]. While several studies have addressed individual aspects of coastal vulnerability or ecosystem protection at local or regional scales, few have integrated these interacting drivers within a single spatial framework applied consistently across long tropical coastlines. However, most existing literature focuses primarily on climate-induced drivers within relatively stable geological settings, leaving several critical gaps unaddressed. First, few studies have conducted continuous, alongshore assessments covering long coastal stretches using a consistent methodological framework. Second, the integration of satellite-based sea-level rise trends with high-resolution coastal datasets is still limited in regional-scale studies. Third, the protective role of coastal habitats is often discussed qualitatively rather than evaluated through explicit habitat and no-habitat scenarios [9,16,17]. As a result, the spatial contribution of ecosystems in reducing coastal vulnerability remains unclear. There is also a limited comparison between coastal segments with different geomorphological characteristics under the same sea-level rise conditions [33,35]. Bridging these knowledge gaps is essential for advancing coastal planning and refining ecosystem-based management strategies. To this end, this study establishes an integrated framework for quantifying the protective capacity of critical coastal habitats, namely mangroves, seagrasses, and corals, against the escalating threats of multi-hazard conditions through the application of the InVEST model.
This study aims to address these limitations by applying the InVEST Coastal Vulnerability model along the north coast of Java, with a focus on Jepara–Demak–Semarang. A Coastal Exposure Index (CEI) is constructed using multi-source geospatial data, including wave conditions, coastal topography, geomorphology, bathymetry, coastal habitats, and satellite-based sea level rise trends. Two scenarios are examined, one considering coastal habitats vs. excluding coastal habitats, in order to evaluate their protective role. Specifically, the study (1) produces a continuous alongshore exposure map for the Jepara–Demak–Semarang coastline, (2) quantifies the spatial change in exposure levels between habitat and no-habitat scenarios, and (3) identifies segments where exposure is most sensitive to habitat condition versus physical coastal setting. This approach allows a direct comparison of vulnerability levels under different ecosystem conditions. The results provide spatially detailed information on vulnerability patterns along the north coast of Java.

2. Materials and Methods

2.1. Study Area

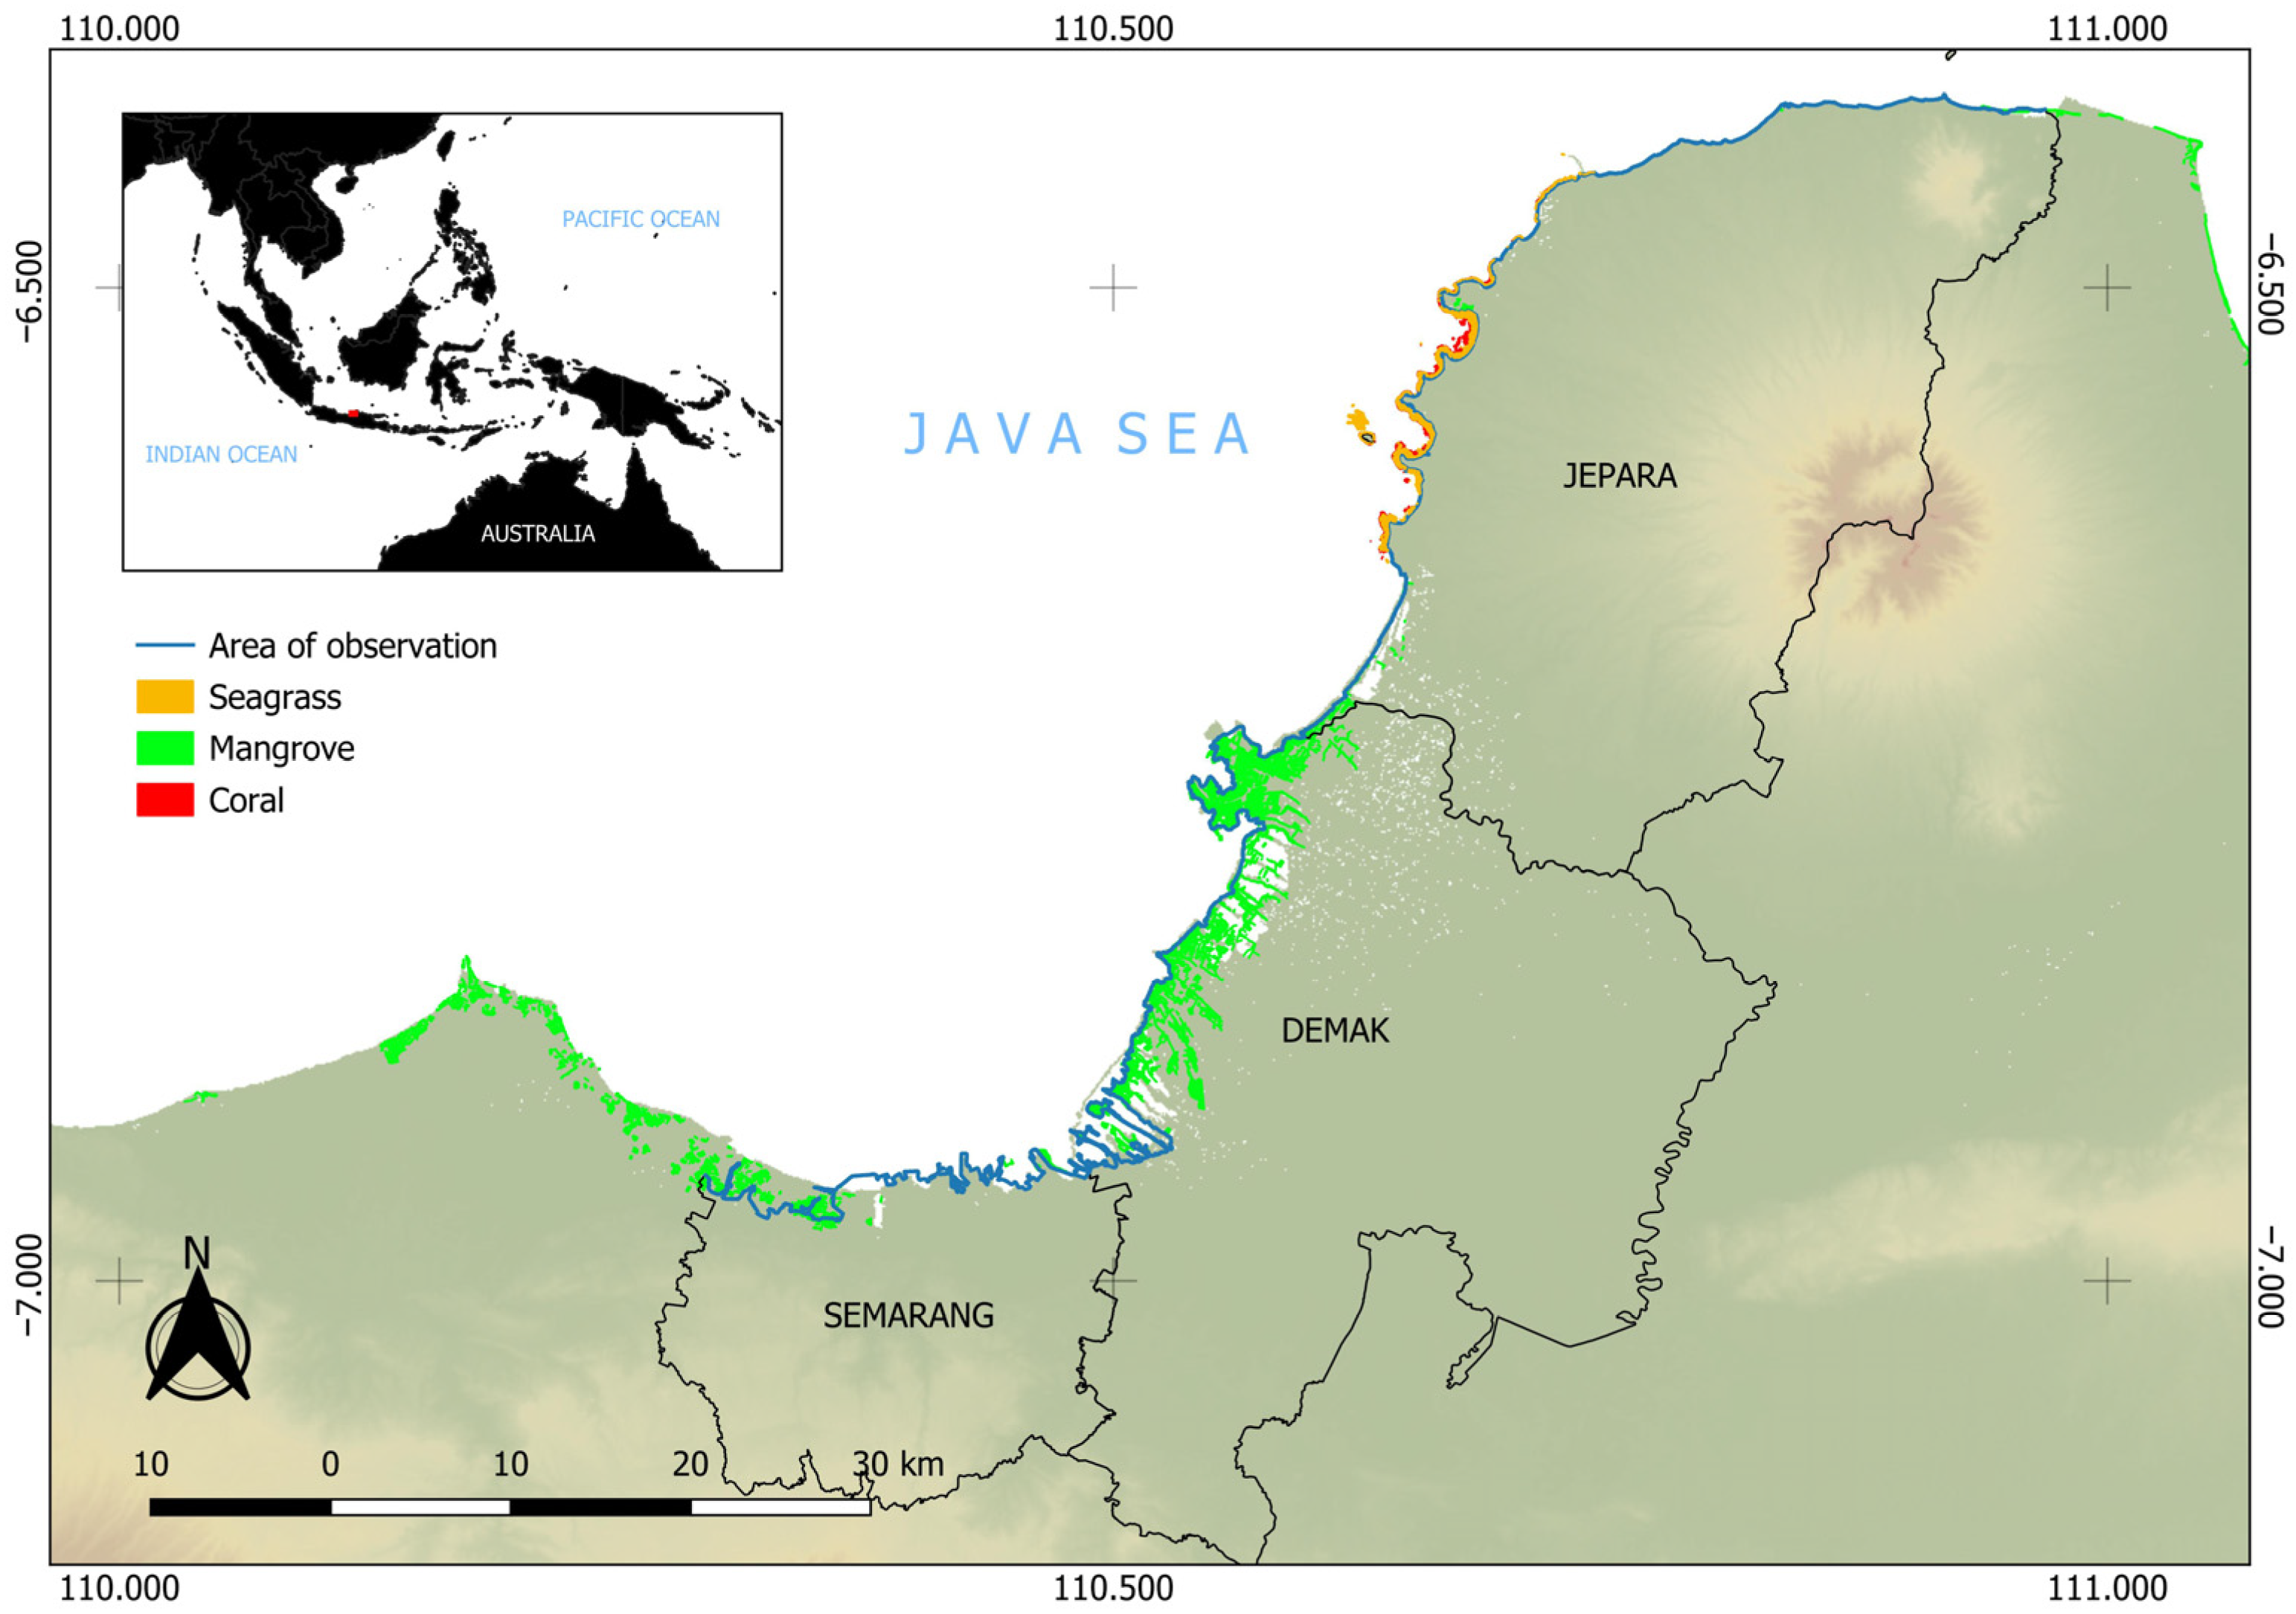
This study was conducted along the northern coast of Java Island, Indonesia, with a focus on Semarang City, Demak, and Jepara Regency (Figure 1). This region was selected because it represents one of the most dynamic and vulnerable coastal areas in Indonesia, influenced by both climate-related processes and intensive human activities. The coastline is characterized by low elevation, shallow nearshore waters, and a wide range of coastal landforms. Rapid urban expansion, port development, aquaculture, and population growth have increased pressure on coastal systems in this area. In addition, the region has experienced recurring tidal flooding, shoreline erosion, and land loss, which have been linked to sea-level rise and land subsidence, as discussed in the Introduction. These conditions make the north coast of Java a relevant case for assessing coastal vulnerability using a spatially explicit approach.

2.2. Data Source

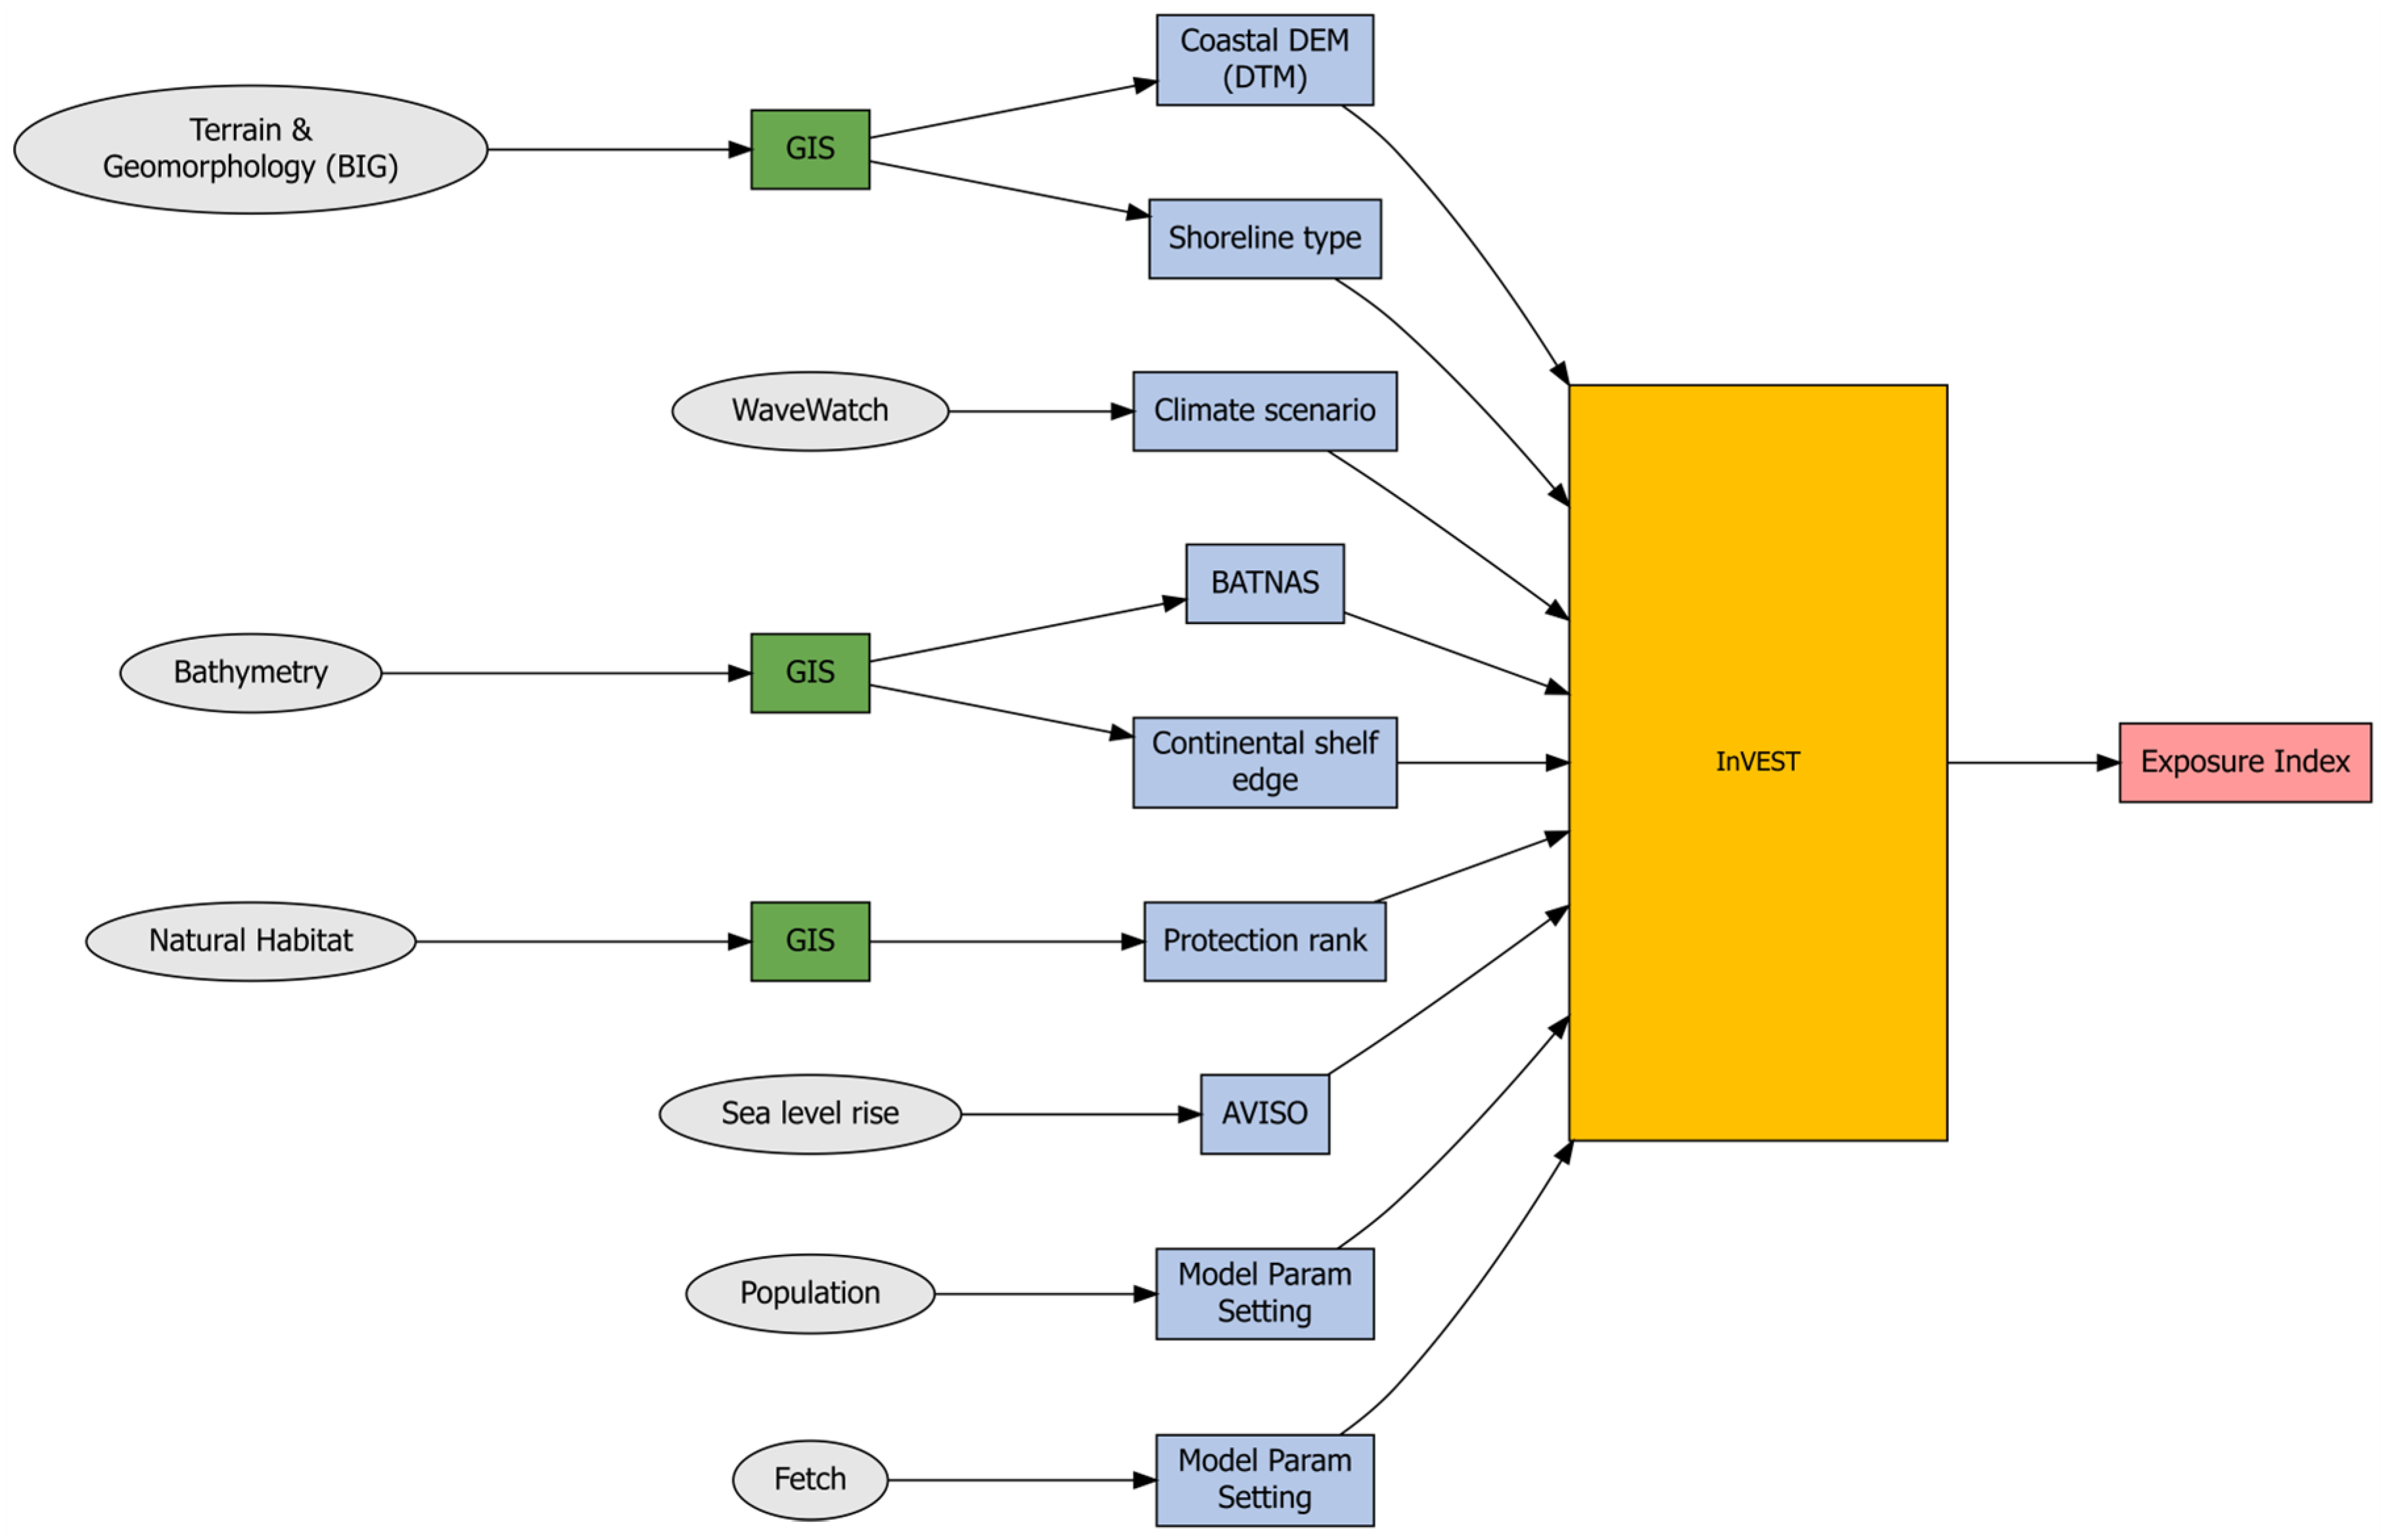
This study used multi-source geospatial datasets to represent key physical, environmental, and human-related factors influencing coastal exposure (Figure 2). Atmospheric and wave conditions were obtained from the WaveWatch dataset, which provides information on wind speed and wave energy. These variables are important for understanding wave-driven coastal processes and are commonly used in coastal vulnerability assessments [36,37]. To capture the potential build-up of wave energy, fetch data with a maximum distance of 200 km were derived and combined with wind parameters to approximate wave exposure along the shoreline. Topographic information was derived from DeltaDTM (Delta Digital Terrain Model), which provides a high-resolution digital elevation model suitable for low-lying coastal areas [38]. Coastal geomorphology data were obtained from the Indonesian Geospatial Information Agency (Badan Informasi Geospasial, BIG) and then reviewed with Google Street View imagery to check local shoreline conditions. Bathymetry was taken from BATNAS (Batimetri Nasional) provided by BIG to describe nearshore depth and the shelf edge, while coastal habitats (mangrove, coral reef, and seagrass) were mapped using the Allen Coral Atlas [39]. These habitats play an important role in reducing wave energy and shoreline erosion, as highlighted in previous studies [9,10]. Long-term sea-level trends were taken from AVISO (Archiving, Validation and Interpretation of Satellite Oceanographic data) satellite altimetry [40], and human population density was taken from LandScan [41] via Google Earth Engine to provide a measure of anthropogenic exposure. A complete summary of datasets, spatial resolution and years is given in Table 1.

2.3. Wind & Wave Exposure and Fetch Calculation

Wind and wave conditions are key drivers of coastal erosion and flooding. In this model, wind and wave exposure were estimated using a parametric approach adapted from the InVEST Coastal Vulnerability Model. Fetch length was calculated by casting 16 radial rays (22.5° intervals) from each shoreline segment and measuring the maximum uninterrupted over-water distance until intersecting land. A maximum fetch distance of 20,000 m was applied to constrain ray extension and to avoid overestimation of open-ocean influence. This threshold represents the regional scale of wind and wave processes in the semi-enclosed shallow shelf conditions of the study area. Wind exposure was calculated using a Relative Exposure Index (REI) that combines the average of the highest 10% wind speed in each sector, their directional frequency and fetch length [42]. Wave exposure was defined as the maximum between oceanic wave power and locally wind-generated wave power. Oceanic wave influence was accumulated in sectors where fetch reached the predefined maximum distance, while locally generated wave characteristics were estimated under fetch-limited conditions using wind speed, fetch distance, and average nearshore bathymetric depth extracted along each ray [43].

2.4. Topography, Geomorphology, and Surge Potential

Coastal relief was computed as the mean elevation of land within a user-defined landward buffer from each shoreline point, using DeltaDTM as the primary elevation source. Lower elevation areas received higher exposure ranks because they are more prone to inundation. Coastal geomorphology represents physical resistance to erosion. It represents shoreline characteristics and engineered hard structures (e.g., seawalls, revetments, and breakwaters), as shown in Table 2. Natural sedimentary types such as sand and mud are also included; however, soft engineering measures (e.g., dune reinforcement, beach nourishment, or artificial reefs) were not available as distinct classes in the dataset. The ranking scheme follows the classification proposed by [12], where rocky coastlines are assigned lower exposure ranks, and unconsolidated shorelines, such as mudflats or sandy beaches, receive higher ranks. Distance to the continental shelf edge was calculated from the BATNAS to estimate surge potential; points farther from the shelf edge over shallow waters receive higher surge-potential ranks. Together, these parameters describe how shoreline forms and nearshore profiles modify hazard impacts.

2.5. Natural Habitat Representation

For each shoreline point, we assessed the presence of protective habitats within the model’s specified buffer distances. Natural habitats such as mangroves, seagrass meadows, coral reefs, and coastal wetlands can reduce coastal exposure by attenuating wave energy [9,10]. The model evaluates the presence of these habitats within a specified distance from each shoreline point. Habitat ranking is calculated using the habitat protection formula ( R H a b ), where habitats with lower exposure ranks receive higher weighting, following Arkema et al. [17].
To compute R H a b for a given shoreline point the model follows the InVEST formulation of the Natural Capital Project. When N habitats are found within the user-defined search radius, let R k be the exposure rank (1 = most protective, 5 = least protective) assigned to habitat k from the habitat ranking table (Table 2). Each rank is converted to a protection score by ( 5 R k ) so that more-protective habitats have larger scores. The final habitat protection value is then computed as:
R H a b   = 4.8 0.5 1.5   max k = 1 . . N ( 5 R k ) 2 +   k = 1 N 5 R k 2 max k = 1 . . N ( 5 R k ) 2
In this formulation the most-protective habitat (i.e., the lowest R k ) is weighted 1.5× relative to the others, and the Euclidean combination of all habitat scores accounts for cumulative protection from multiple habitat types. The outer linear transformation rescales the result back onto the model’s 1–5 exposure rank scale so that shoreline points fronted by multiple protective habitats receive lower (more protective) R H a b values than points with a single habitat or no habitat. This follows the approach in Arkema et al. [17].
To test the role of habitats explicitly, we ran two main scenarios: (1) with habitats, using the observed Allen Coral Atlas extents, and (2) without habitats, where habitat layers were masked out. Comparing these scenarios shows how habitat presence changes index classes and shoreline-length statistics.

2.6. Exposure Index Calculation

Coastal vulnerability was assessed using the InVEST Coastal Vulnerability model developed by the Natural Capital Project [18]. The model evaluates coastal vulnerability by integrating multiple physical and biological variables along shoreline points; in this study, seven bio-geophysical variables were used as model inputs, which are wind exposure, wave exposure, geomorphology, coastal relief/elevation/DEM, surge potential, natural habitats, and sea-level rise. This approach follows the framework proposed by Gornitz et al. [36,37] and USACE [44] and is consistent with the ranking scheme suggested in the InVEST user guide. The model was implemented using open-source GIS-based tools [18].
Each variable was ranked from 1 (very low exposure) to 5 (very high exposure) based on predefined criteria (Table 2). In Table 2, percentile thresholds were used to assign ranks (1–5) for continuous variables, while categorical variables (geomorphology and habitats) were ranked based on class criteria following the InVEST user guide and local adjustments to reflect local coastal conditions. The Coastal Exposure Index (CEI) for each shoreline point was calculated as the geometric mean of all variable rankings:
C E I   = ( i = 1 n R i ) 1 n
where R represents the rank of each variable and n is the total number of variables. In this study, the CEI represents the relative exposure of each shoreline segment to erosion and inundation associated with marine hazards such as storms, waves, and storm surge; thus, higher CEI values indicate stronger vulnerability, whereas lower CEI values indicate weaker vulnerability. The resulting CEI values were classified into five vulnerability classes using the quantile breaks method, namely very low, low, medium, high, and very high.
The range of CEI values can generally be divided into equal parts using a quantile approach, such as quartiles and percentiles, as applied in several previous studies [11,34,45,46]. Various studies have also used different numbers of vulnerability classes, ranging from three [11] to five [47]. In practice, the study classified CEI into five quantile-based classes (20th, 40th, 60th, and 80th percentiles). This approach divides the range of CEI values into equal-sized groups, producing consistent coastal vulnerability information that can be compared across locations.
Based on the quantile breaks used in this study, the CEI values were grouped into five classes with the following numeric ranges. Very low: 1.7006–2.3291; Low: 2.3291–2.9576; Moderate: 2.9576–3.5861; High: 3.5861–4.2146; and Very high: 4.2146–4.8431.

3. Results

3.1. The Spatial Distributions of the Key Drivers of the Coastal Exposure Index (CEI)

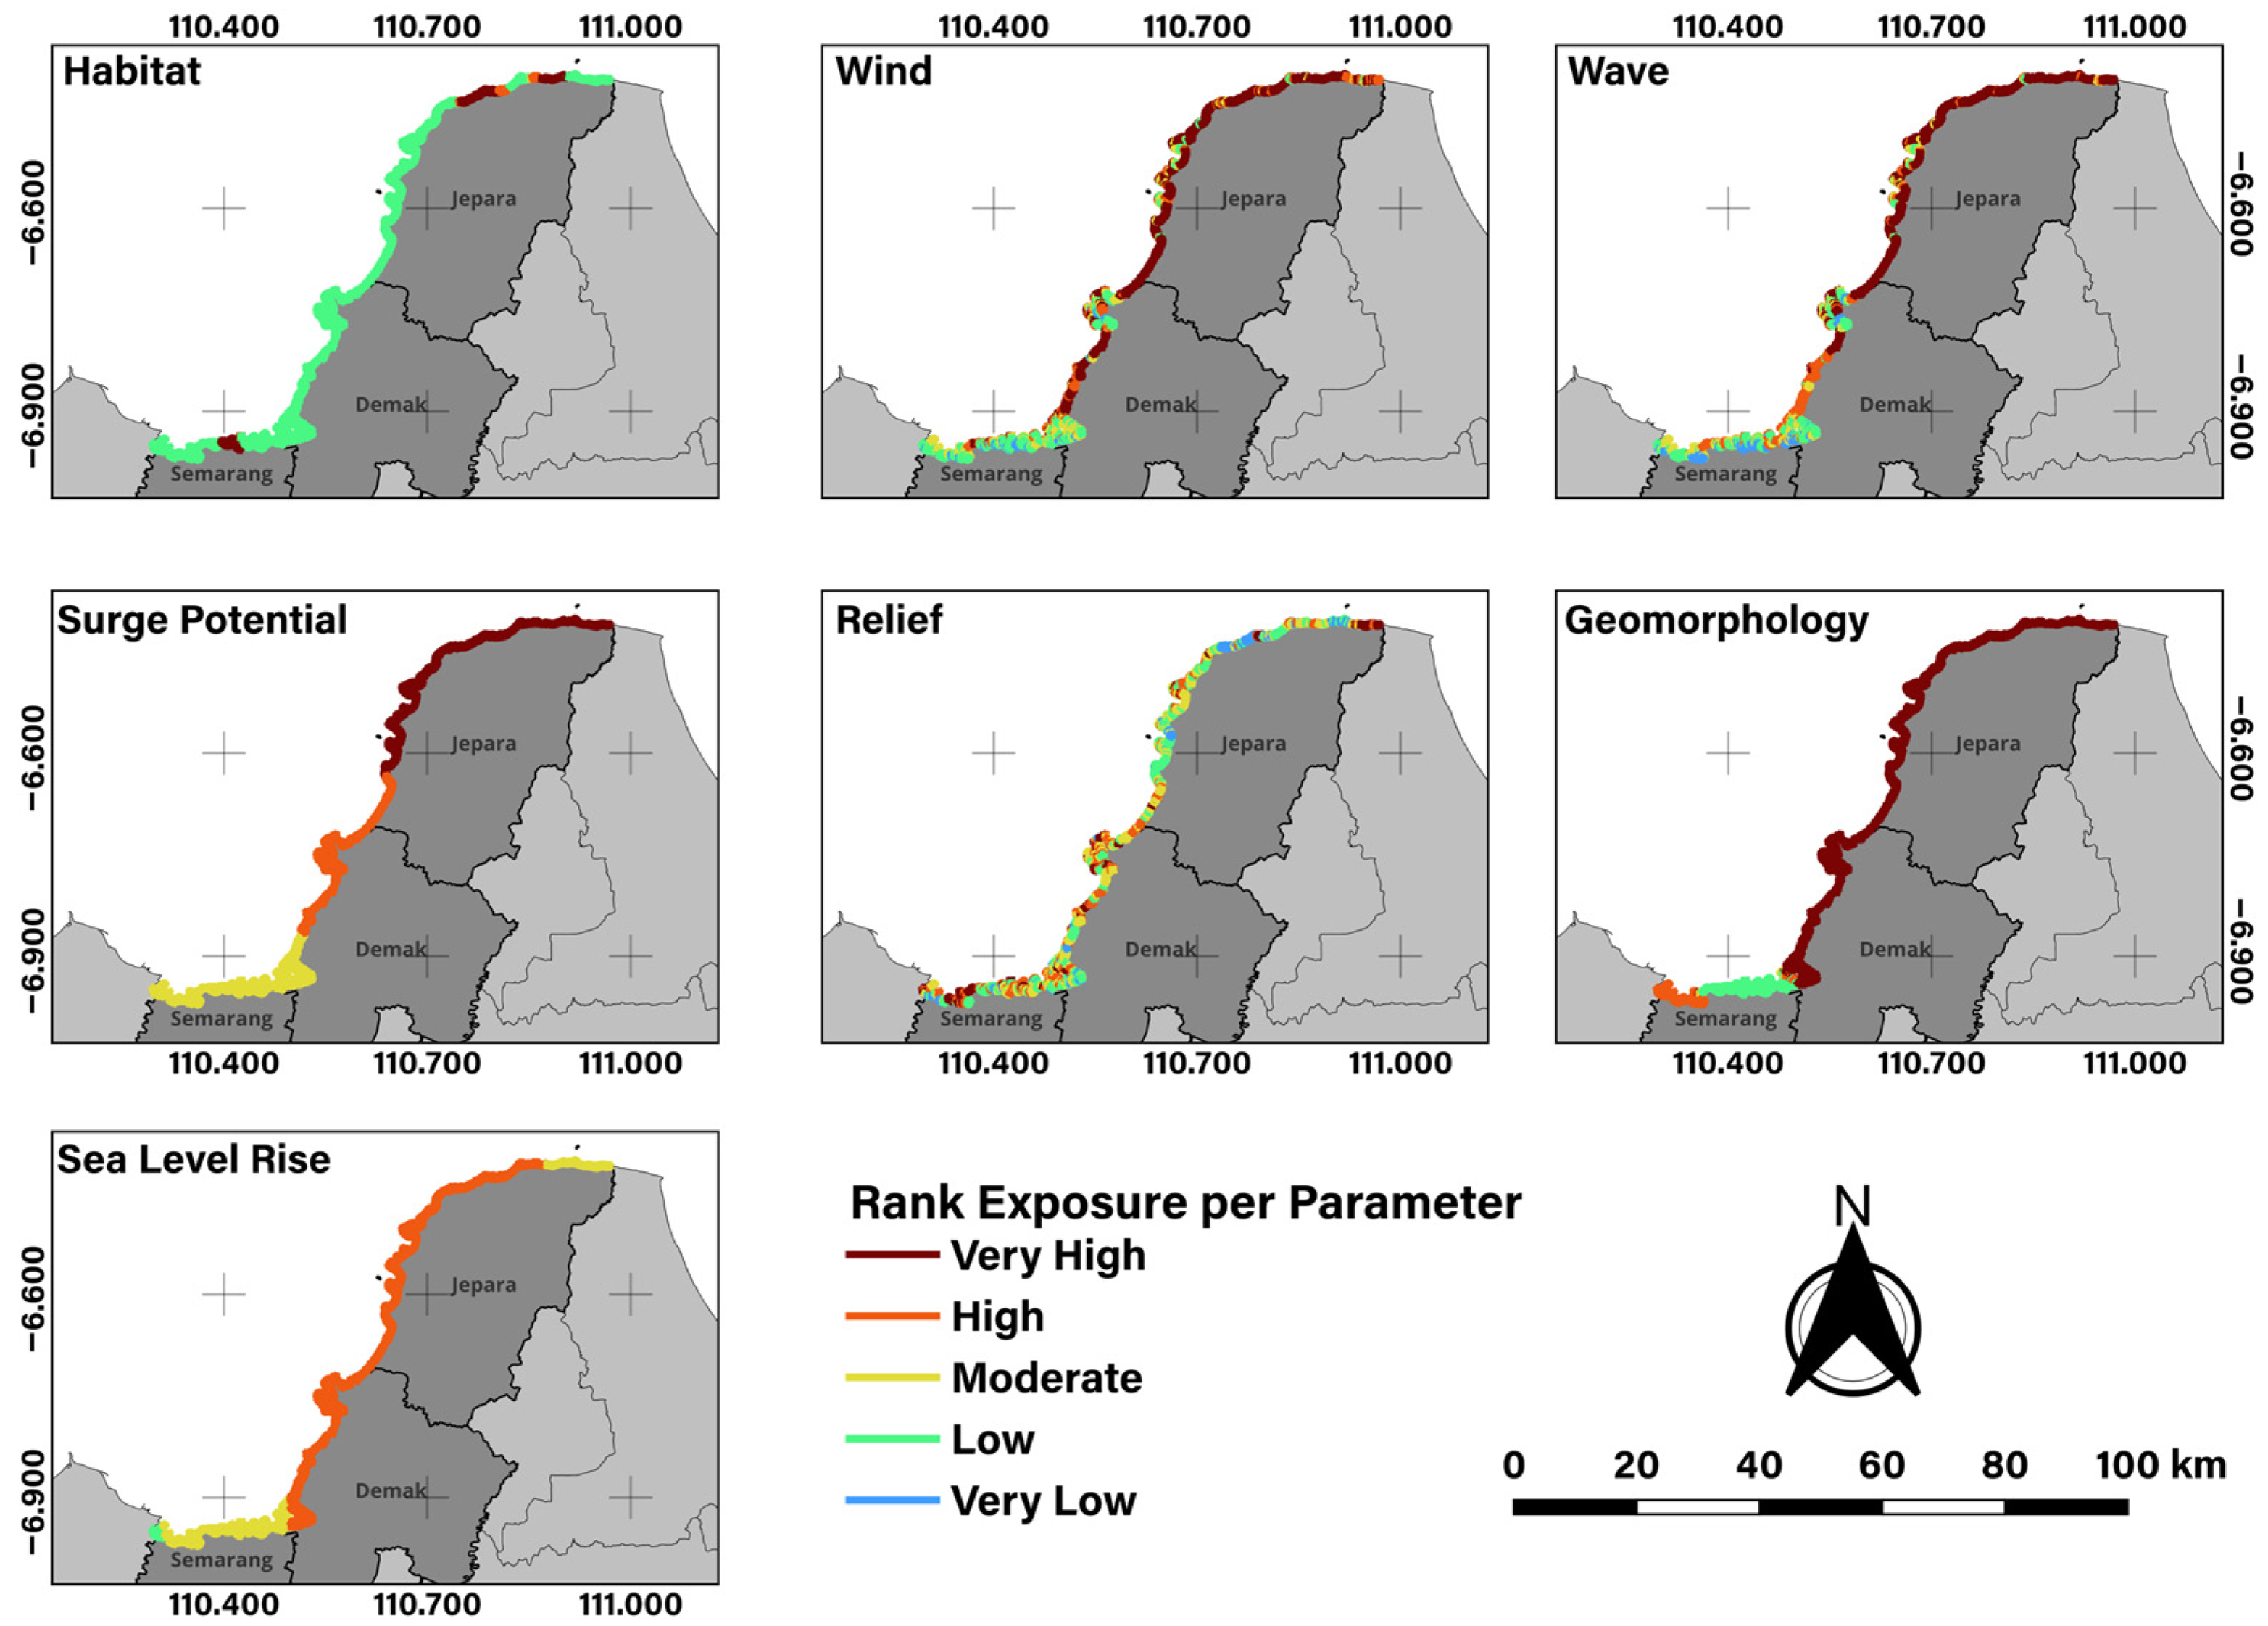
Figure 3 illustrates the spatial distribution of seven key drivers of CEI in the study area: habitat, wind, wave, surge potential, relief, geomorphology, and sea level rise. The blue color indicates low exposure, while purple represents very high exposure to climate hazards. All driving factor layers are reclassified into the same ordinal exposure scale (from very low to very high) to allow direct comparison between variables; the mapped classes represent relative exposure ratings, not absolute hazard magnitudes. In this study area, the only natural habitat present in the coastal ecosystem is the mangrove. According to Figure 3 (top left), most areas exhibit low to very low exposure; however, parts of Jepara (13.8%) and Semarang (20.5%) demonstrate very high exposure due to the lack of natural habitat. Additionally, the majority of the study area faces high wind exposure, particularly in Demak and Jepara. In terms of wave exposure, most of Jepara Regency is highly affected, while nearly 40% of Demak shows high exposure, and Semarang experiences low wave exposure. Furthermore, surge potential exposure is categorized as high in Jepara, moderate in Demak, and very low in Semarang. The exposure from relief is quite diverse, with Semarang showing the highest percentage of coastline classified as very high, followed by Demak and Jepara. Regarding geomorphology and sea level rise, Semarang exhibits very low exposure, while other areas exhibit low exposure. Overall, the driver maps show strong contrasts along coastlines, with Jepara consistently being more exposed to marine-style thrusters (wave and tidal wave potential), whereas Semarang shows relatively lower marine-style exposures but higher relief-related exposures, suggesting that different physical controls may dominate CEI patterns in different regencies.

3.2. The Spatial Distributions of CEI Under Two Scenarios

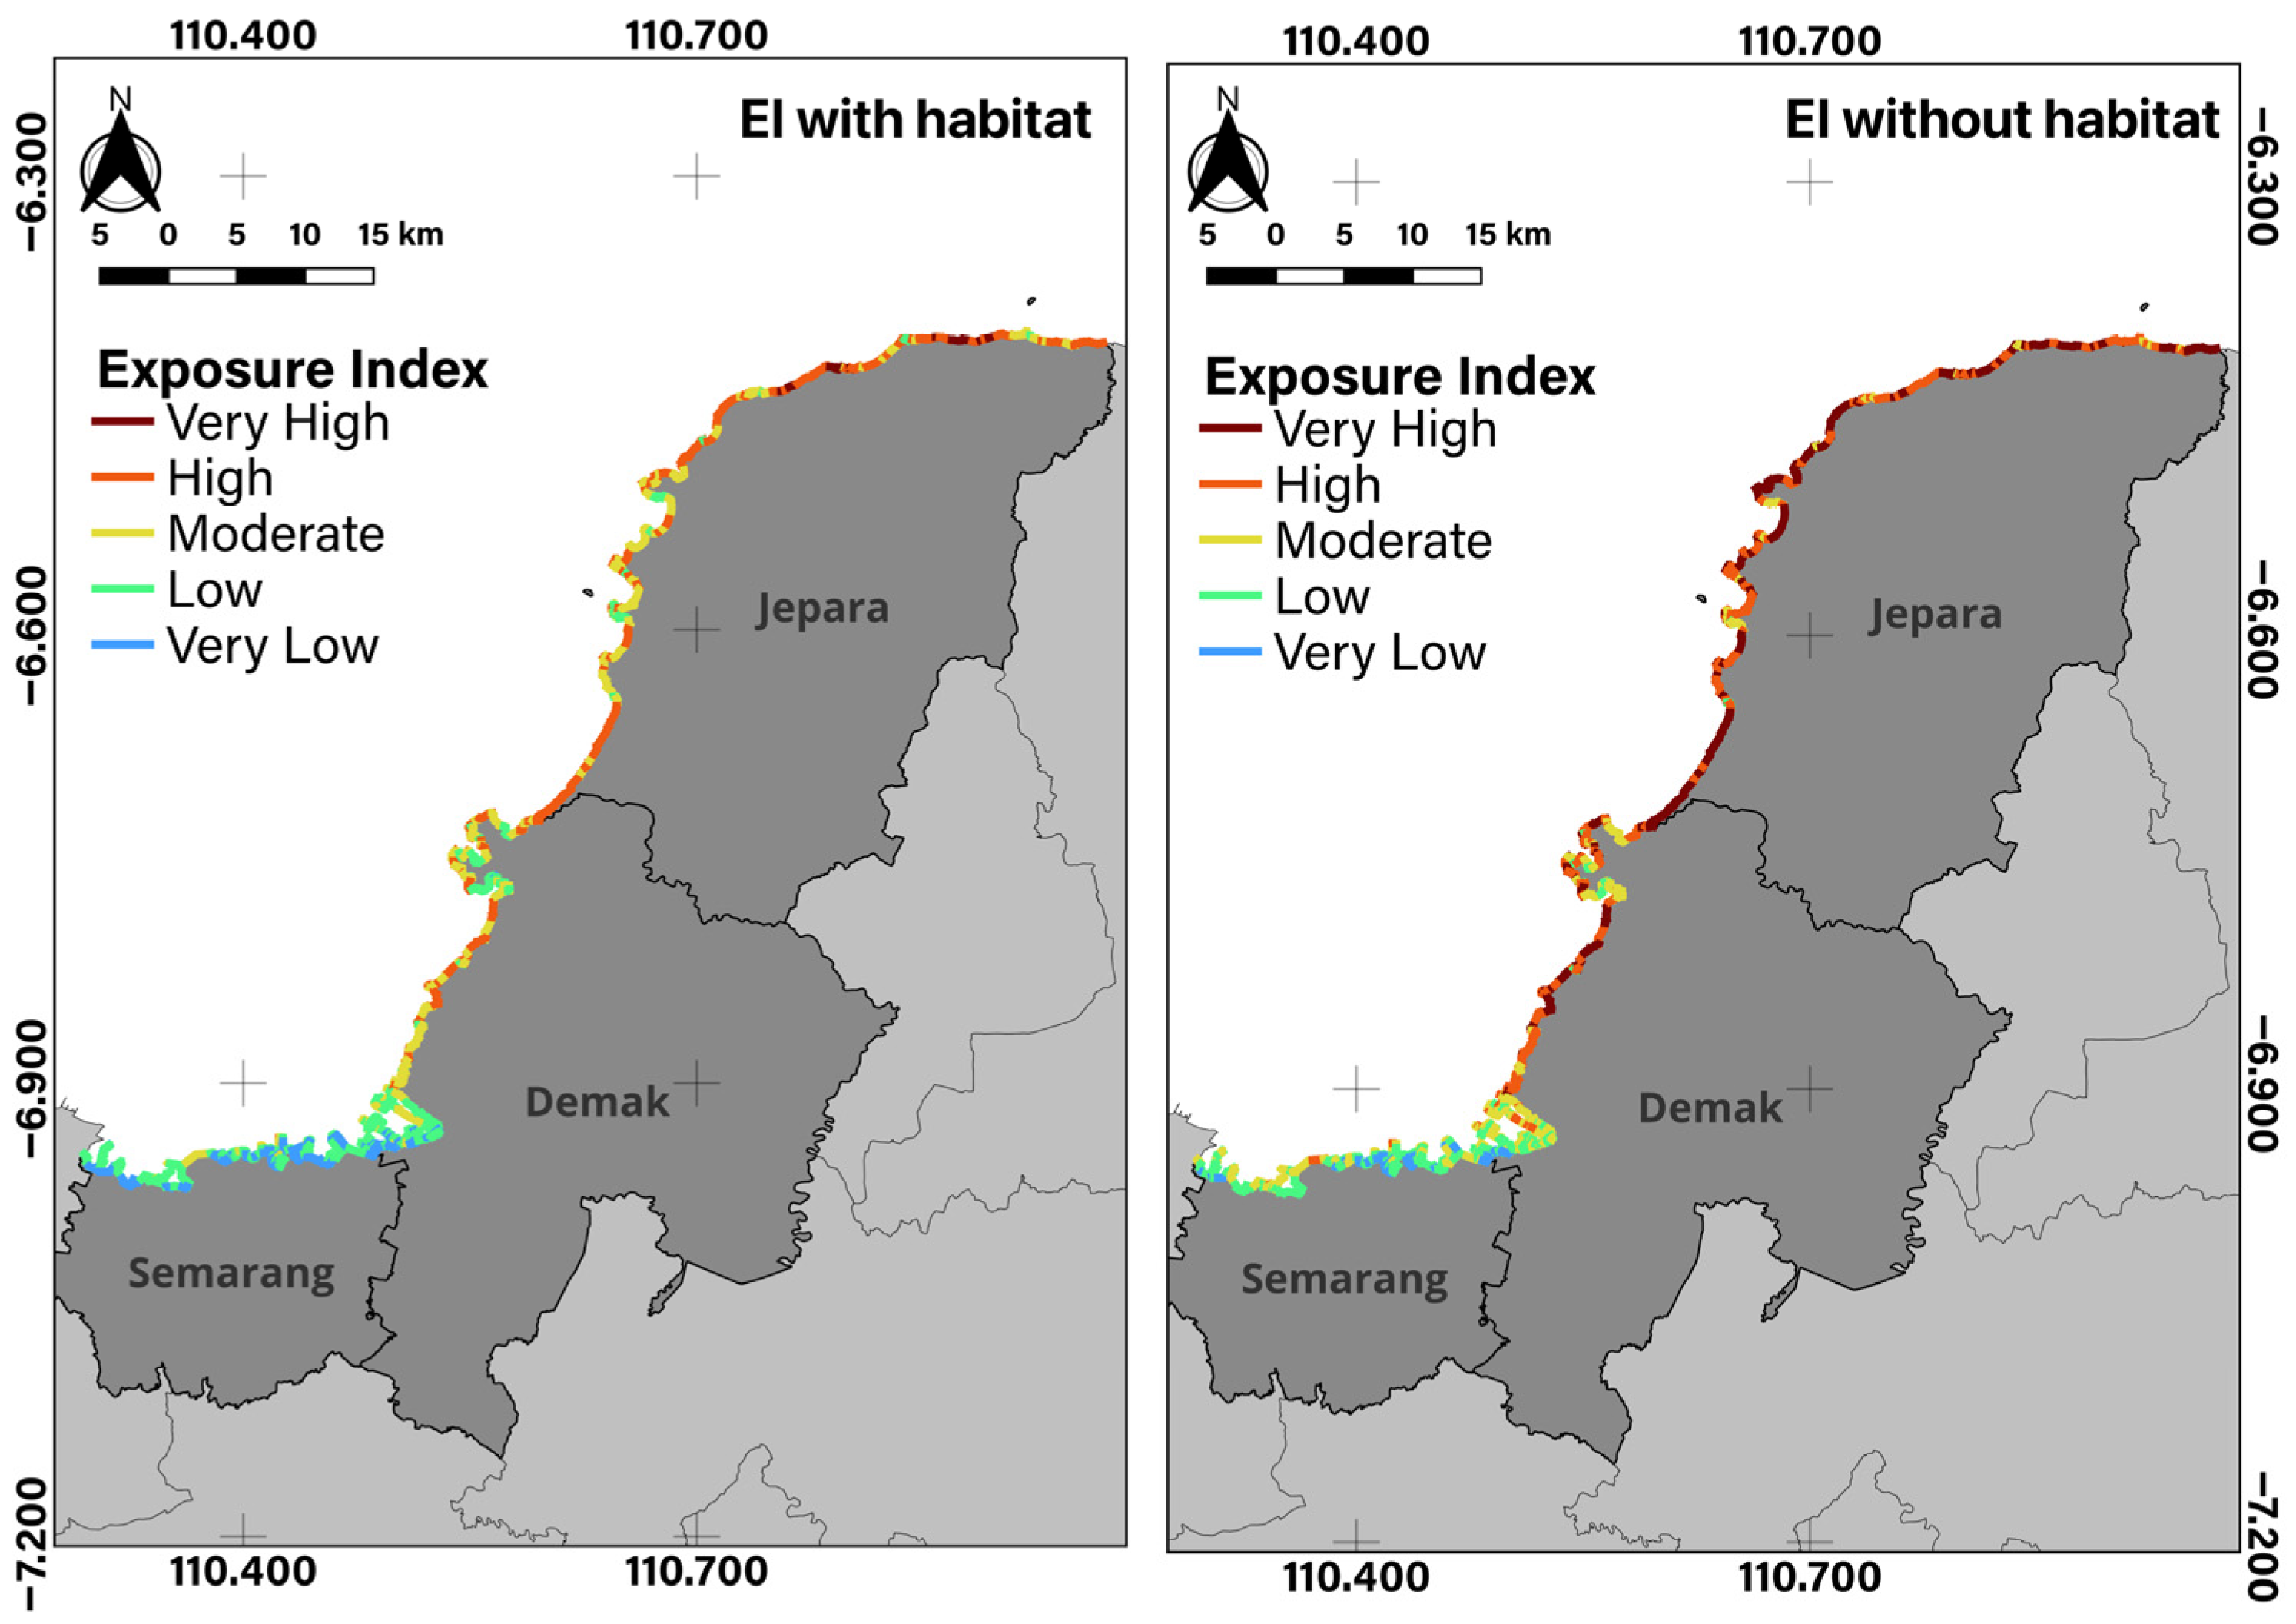
In this study, we evaluated the CEI under two habitat scenarios: one with mangroves present and one without. The scenario with mangroves reflects the current condition of these habitats in the study area, while the scenario without mangroves represents a situation where all mangrove areas have been destroyed. The “no mangrove” scenario is a counterfactual case designed to isolate the protection contribution from the presence of the habitat, which does not imply the expected future conditions. Still, it provides a clear basis for measuring the direction and magnitude of changes in the CEI. Figure 4 illustrates the spatial distribution of the CEI in both scenarios. The blue color indicates very low exposure, while purple indicates very high exposure. In the scenario with mangroves, Semarang predominantly shows very low to low exposure levels. In contrast, Demak and Jepara are mostly categorized as having moderate to high exposure levels. In the scenario without mangroves, Semarang exhibits an increase in exposure, shifting primarily from low to moderate levels. Additionally, Demak and Jepara show a trend of increasing exposure, moving from high to very high levels.
Table 3 presents the detailed coastal lengths of the CEI with habitat, along with the CEI classifications for each regency in the study area. In this area, low exposure was the most prevalent, accounting for 32.8% of the total coastline, followed by moderate exposure at 27.4% and high exposure at 23.5%. Notably, high and very high exposure levels were primarily found in Jepara, representing 57.7% of its total coastline, followed by Demak at 15.5% and Semarang at just 0.4%. In contrast, very low to low exposure was predominantly observed in Semarang, which accounted for 92.2%, while Demak and Jepara followed with 49.7% and 7.3%, respectively. Moderate exposure was mainly recorded in Jepara at 35%, followed closely by Demak at 34.7% and Semarang at 7.3%. These results highlight Jepara as the dominant hotspot of elevated exposure under current habitat conditions, whereas Semarang remains largely within very low–low CEI classes.
Table 4 shows the detailed coastal length of CEI without habitat within the study area. The result revealed that without coastal habitat, moderate exposure was dominant (25%), followed by high (24.2%) and very high (22.8%) exposure. The high and very high exposure were mainly found in Jepara regency (91%), followed by Demak (41.1%) and Semarang (2.2%). Meanwhile, the very low and low exposure was mainly found in Semarang (78%), followed by Demak (23.4%) and Jepara (0.8%). On the other hand, the moderate exposure was mainly found in Demak (35.6%), followed by Semarang (32%) and Jepara (8.1%).

3.3. The Role of the Coastal Ecosystem in the Study Areas

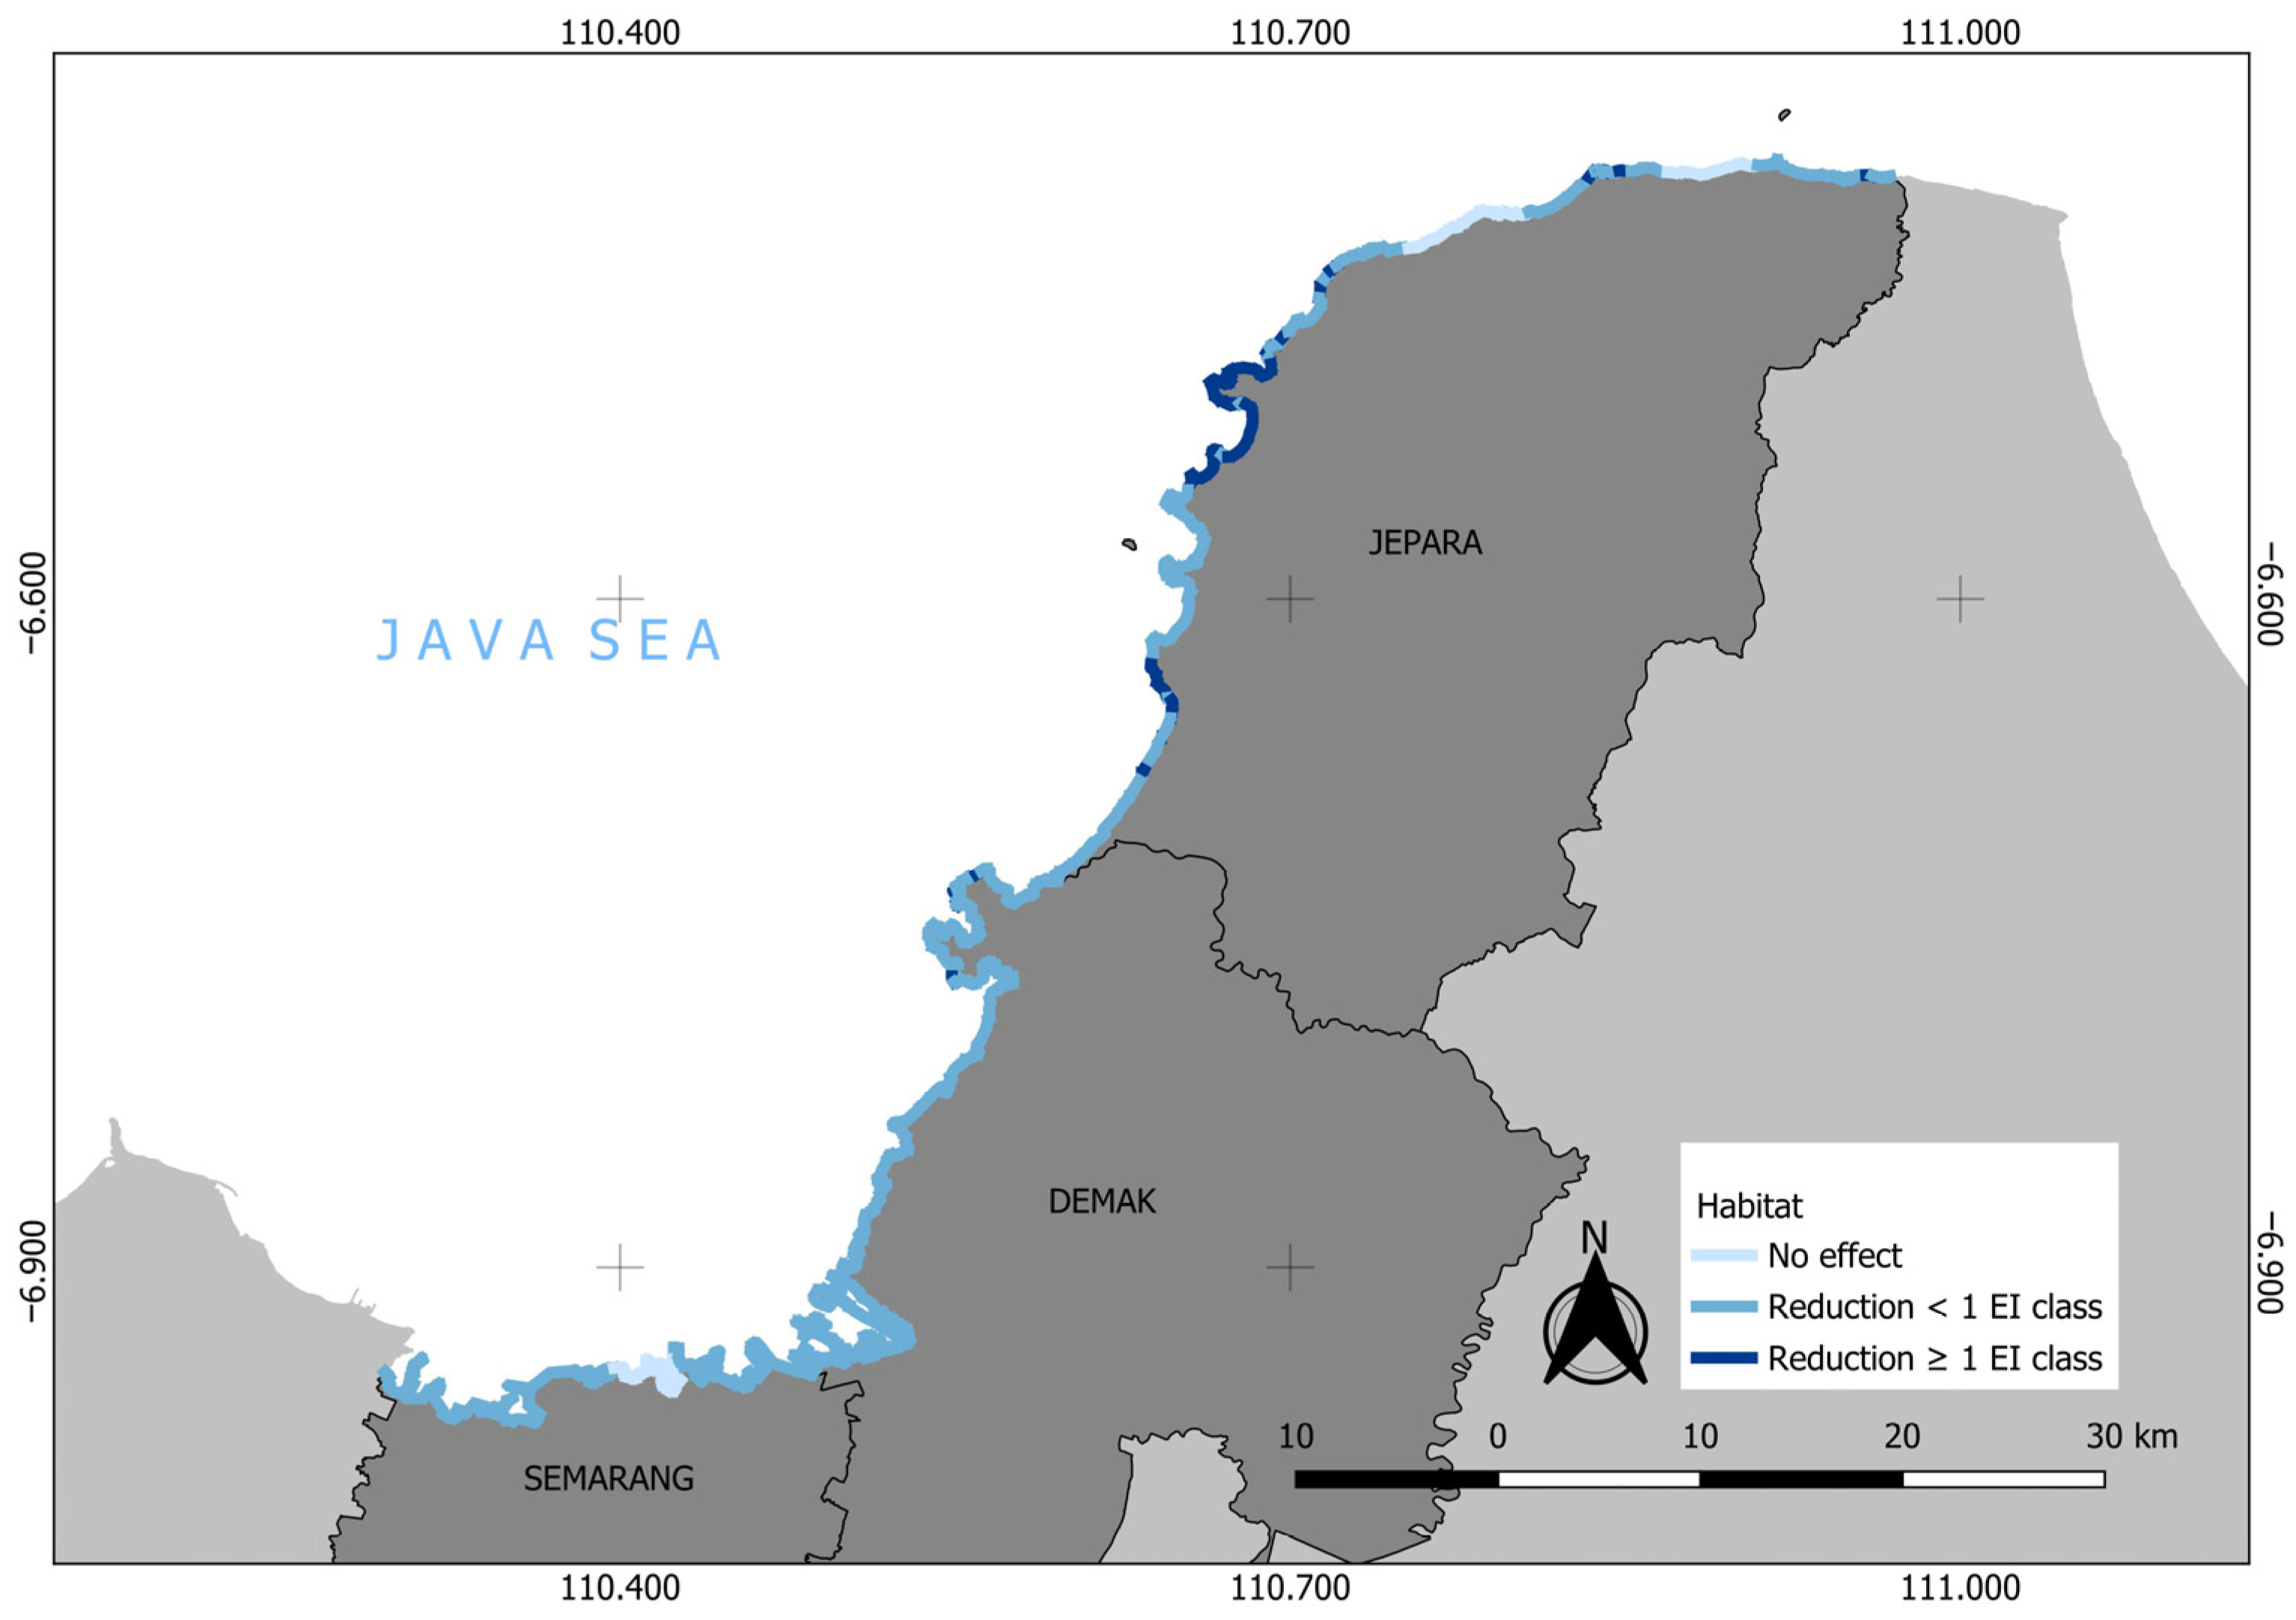
Figure 5 illustrates the spatial distribution of habitat roles in reducing the CEI within the study area. We classified the habitat roles into three categories: no effect (white), a reduction of less than 1 level of CEI (light blue), and a reduction of more than 1 level of CEI (dark blue). As shown in Figure 4, the most significant habitat role was observed in Jepara. Along the majority of the coastline, the habitats contributed to reducing exposure without altering the exposure levels. This pattern suggests that mangroves provide measurable buffering in many segments, but the reduction is often modest relative to the class boundaries used for mapping.
Table 5 shows the quantification of habitat role in reducing the CEI. As explained above, the reduction of less than one level is dominant, which accounted for 81.3%, followed by no effect (9.7%) and reduction equal to or more than one CEI level (9.0%). The most significant role of habitat was mainly found in Jepara, which accounted for 26.1%, followed by Demak and Semarang. In contrast, the no-effect habitat role was mainly observed in Semarang (19.4%), Jepara (13.3%), and Demak (0%). Meanwhile, the habitat role in which the reduction of CEI by less than 1 level was mainly found in Demak (98.9%), followed by Semarang (80.6%) and Jepara (60.6%). Despite these district-level differences, the overall result indicates that mangroves most frequently reduce CEI without triggering a full class shift, while substantial class reductions are spatially concentrated in a smaller set of coastline segments.

4. Discussion

This study investigates the CEI through three pilot studies along the North Java coastline, utilizing the InVEST model to analyze both habitat and non-habitat scenarios. The working hypothesis guiding this study is that coastal exposure along North Java is primarily controlled by the interaction between coastal physical conditions (geomorphology, relief, and nearshore thrust) and the presence of protective habitats, so that mangrove logging will result in measurable and spatially heterogeneous increases in CEI, especially in segments dominated by coasts with soft sediments and limited engineered protection. Numerous studies have examined coastal vulnerability indices worldwide, focusing on various physical properties in pilot areas. These studies have employed different methodologies, including the Coastal Vulnerability Index (CVI) with equal weights [11,34], CVI utilizing Analytic Hierarchy Process (AHP) protocols [48], and multidimensional CVIs [49]. However, there has been limited focus on the index that quantifies the role of natural capital in reducing coastal exposure to climate hazards. In recent years, the InVEST model has been primarily employed to assess the impact of natural habitats, as demonstrated by Silver et al. [50] in the USA, Singha et al. [51] in Tamil Nadu, India, and Setiawati et al. [32] on two small islands in Indonesia. The current research focuses on the InVEST model in North Java, particularly three selected regencies as the top four with the most coastal population at risk globally [52] and has been particularly identified as severely affected by sea level rise (SLR) when compared to other regions in Indonesia [33], highlighting the urgent need for assessment and intervention.
As previously mentioned, the CEI was assessed under two different scenarios. The comparative analysis between the two scenarios reveals a profound spatial shift in exposure classifications, confirming that the absence of natural habitats dramatically amplifies the coastline’s susceptibility to extreme climate hazards. This result highlights that areas classified as very high exposure indicate a strong sensitivity in the exposure classification, signaling that regions changing from high to very high require priority intervention to reduce risks. Jepara is identified as the primary area for these interventions (Figure 5). Previous research conducted on two small islands in Indonesia revealed that the increase in high exposure in areas without habitat was approximately 2.5-fold [32], whereas in the Great Bahamas it was 3.5-fold [50]. In comparison to this study, it suggests that small islands are more sensitive to habitat preservation than larger islands. Despite small islands being more vulnerable to coastal habitat loss due to limited natural protective mechanisms, larger islands like Java hold significant geographical importance due to their high population density and urban concentration. Northern Java, in particular, is one of the world’s most densely populated coastal zones, characterized by a concentration of large and megacities along the shoreline. Consequently, it is crucial to further study the pilot areas.
A previous study also found that shifting from a habitat scenario to a no-habitat scenario changes the CEI status of very low-exposure areas to low exposure, dropping from 16% to 0% [51]. This suggests that all coastlines previously classified as having minimal exposure are entirely dependent on the existence of coastal ecosystems. This finding underscores the crucial role of coastal ecosystems in buffering vulnerability levels and preventing coastal areas from shifting to higher vulnerability categories, which aligns with recent global assessments demonstrating the indispensability of nature-based solutions in coastal defense frameworks [53].

4.1. Driving Force of CEI for Each Regency

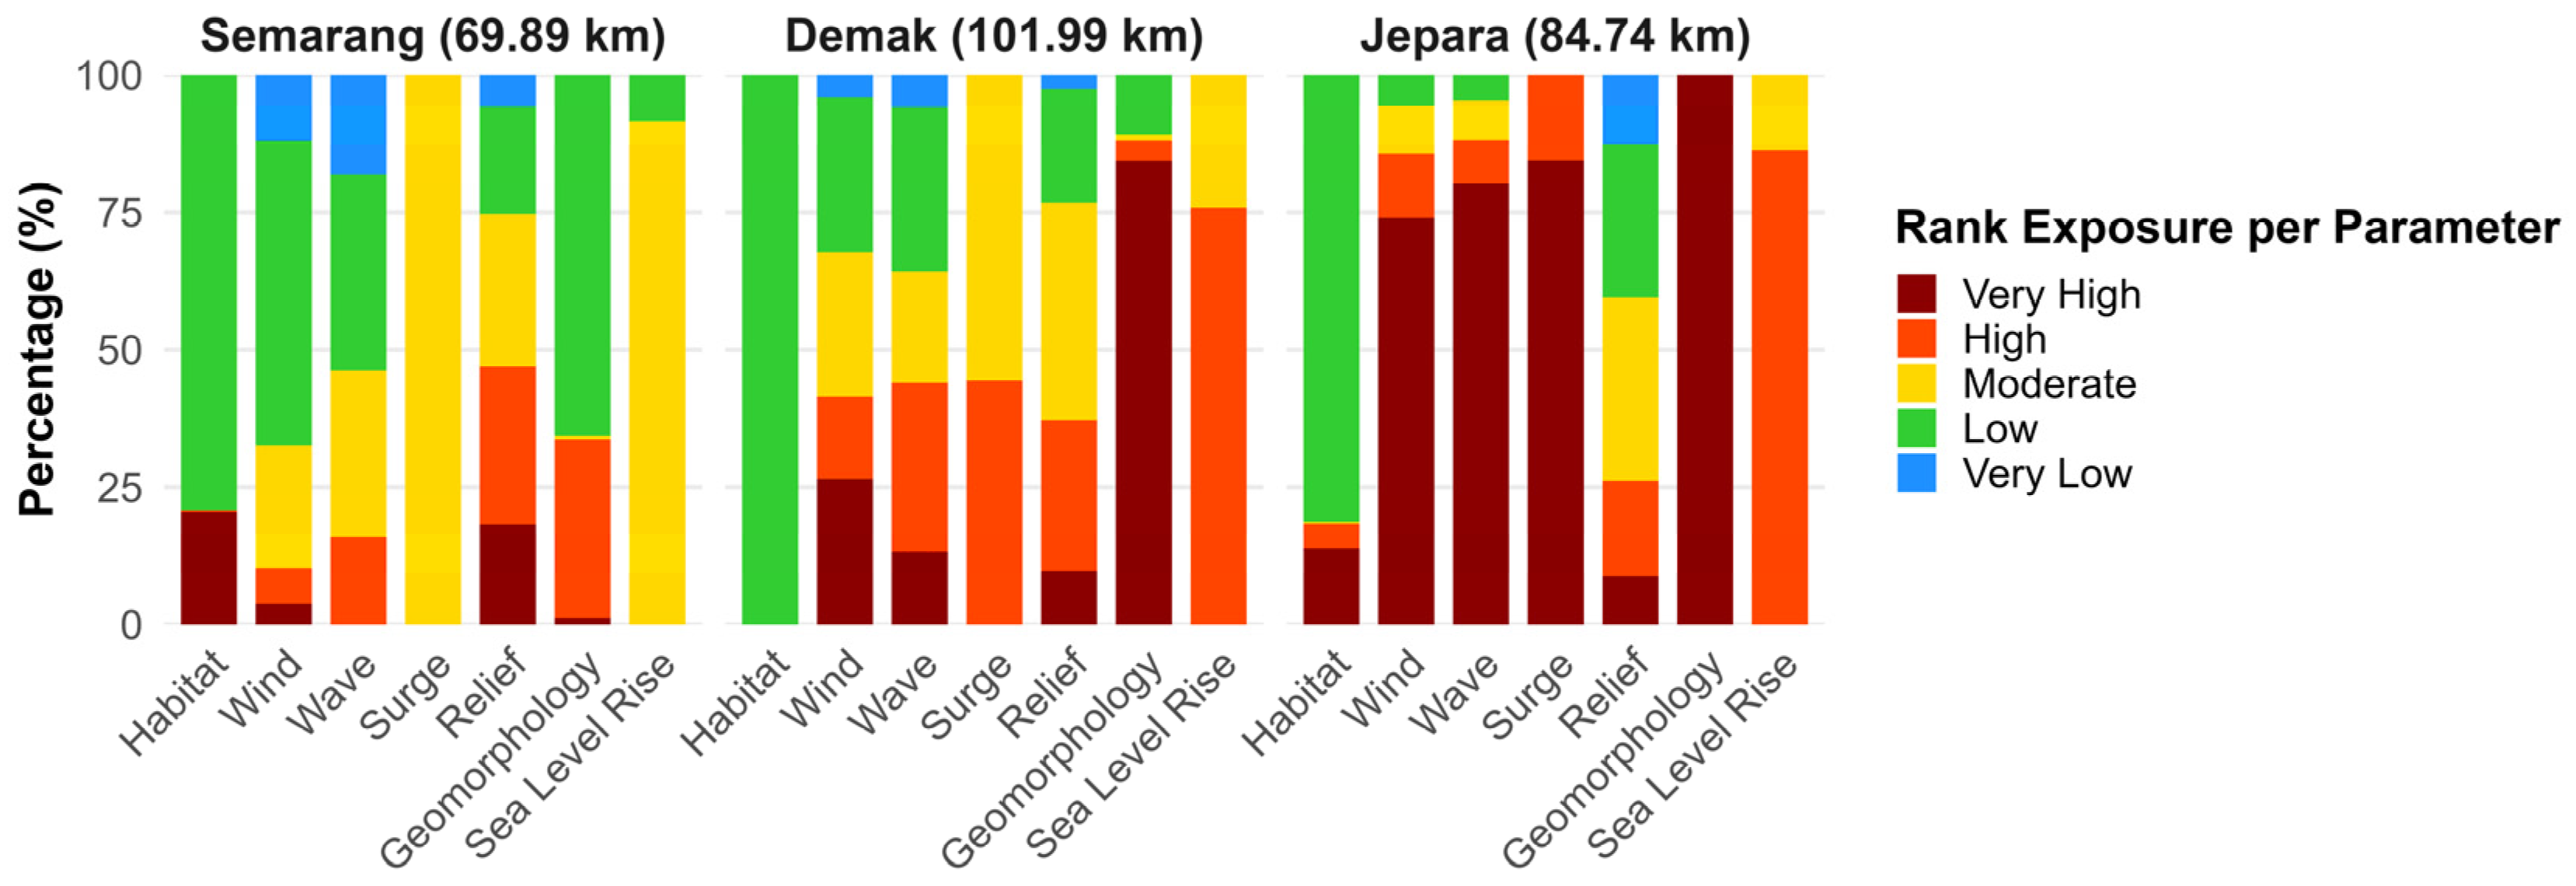
As seen in Figure 3, the most severe exposure occurred in Jepara, while the least exposure occurred in Semarang. Meanwhile, studies on the coastal vulnerability index are mostly located in Semarang (e.g., [33,34,35,54,55]), as a highly urbanized area. In this study, Semarang is classified as having very low to low vulnerability due to its well-protected natural habitats. Additionally, the area’s exposure to wind, waves, and geomorphological factors is predominantly low (see Figure 6). Given Semarang’s economic importance, its coastal geomorphology is largely characterized by hard structures, such as seawalls and concrete revetments, which are used to prevent erosion and make up about 66% of its coastline. In contrast, natural protection accounts for approximately 79% of the total coastline, with wind and wave exposure remaining relatively low. Therefore, despite Semarang being a focal point for coastal vulnerability studies, its CEI was the lowest among the various pilot studies conducted. For coastal planners and stakeholders in urban zones such as Semarang, these results validate that a “coexistence strategy,” that is, maintaining strong engineering defenses around critical assets while strictly protecting remnant mangrove forests, is more effective but requires ongoing structural maintenance to prevent land subsidence [34,46].
Geomorphology plays a crucial role in contributing to very high exposure in Demak, as much of the coastline is predominantly surrounded by fish ponds. Consequently, the main defense mechanism for this area relies on the natural habitat, which extends 100% along the coastline (see Figure 6). However, despite nearly half of the CEI with habitat being categorized as moderate to high along its coastline, three villages (Bedono, Sriwulan, and Purwosari) of this regency have experienced persistent inundation as reported by Pinuji et al. [56]. Despite the rapid erosion of Demak’s shoreline, several unused fish ponds are undergoing mangrove regeneration [57]. The government’s goal is to develop these mangrove areas into a greenbelt along the coastline, which aims to stabilize the coast and protect local villages and farmlands from future erosion. In contrast to the urban areas of Semarang, where coastal protection involves a combination of green and hard infrastructure, this region primarily relies on green infrastructure. As a result, the exposure to coastal risks is higher in this area compared to urban settings.
The highest CEI was found in Jepara Regency, as indicated in Table 4 and Table 5. The primary factor driving this high exposure is the geomorphology of the area, with 100% of its coastline classified as having very high exposure, as shown in Figure 6. Additionally, the exposure to wind, waves, and surge potential is categorized as very high for over two-thirds of its coastline (Figure 6). The SLR is also significant, affecting more than 80% of the coastline (Figure 6). Similarly to Demak, coastal protection in Jepara relies solely on natural habitats, as the geomorphology remains largely untouched by government intervention. Despite the area’s very high exposure to most risk factors, there is a notable lack of coastal vulnerability studies in this region. From a practical management perspective, the reliance on purely natural habitats in highly exposed, geomorphologically vulnerable areas like Demak and Jepara is insufficient. Stakeholders are strongly recommended to adopt “hybrid engineering” solutions. Integrating soft measures, such as permeable breakwaters to trap sediment, with large-scale mangrove reforestation in abandoned aquaculture ponds will provide a more resilient and adaptive defense mechanism against the compounding effects of SLR and land subsidence [35,58].

4.2. Role of Mangrove in Protecting the Coastal Region

Mechanistically, mangroves reduce wave energy and tidal impact by increasing surface roughness, dissipating momentum through trunks and roots, and capturing sediment to stabilize coastlines. These processes are widely recognized as the primary ways coastal habitats provide protective services [9]. Additionally, mangroves still have a positive effect on the CEI, even in areas where they cannot reduce the exposure level by even one degree, and they cover most of the region. In terms of CEI, this typically occurs when coastal habitat reduces the underlying index score but not enough to cross the class boundary, meaning that protection exists but is expressed as a sub-class increase rather than a whole class shift [17]. However, our analysis reveals that in certain spatial segments, the presence of mangroves fails to translate into a meaningful reduction in exposure class. This finding does not suggest that mangroves are unimportant but rather indicates that these sites may be unsuitable for regeneration. Several site constraints can limit effectiveness, including narrow or fragmented mangrove belts, insufficient sediment supply, unstable substrates, strong hydrodynamic forcing, or rapid vertical land motion that exceeds the capacity of mangroves to accrete and persist [59,60]. Therefore, other interventions are needed, whether through the use of hard infrastructure or by exploring alternatives to mangroves in establishing a greenbelt. In practice, this supports a “right action in the right place” approach, whereby mangrove restoration should be guided by site suitability and expected protection gains, while hybrid solutions (e.g., permeable barriers or complex artificial coastal structures) may be more appropriate in places where mangroves are unlikely to grow or provide a sufficient reduction in exposure.

4.3. Limitations and Recommendations

Despite the robust spatial framework, the study acknowledges some uncertainties and limitations that future studies should address. The CEI measures relative coastal exposure based on long-term average conditions, but does not capture absolute risk or short-term extreme hydrodynamic events. In addition, the results are strongly influenced by the resolution of input data, such as simplified offshore wave forcing and DeltaDTM vertical accuracy; similar limitations regarding data uncertainty were also reported in previous studies [4,61]. On the other hand, while our approach succeeded in separating the protective roles of ecosystems, the analysis was limited to a single measure of exposure reduction (whether a habitat scenario exists). This limitation arises from the standard design of the InVEST coastal vulnerability model, which does not automatically simulate complex multi-intervention scenarios such as local vertical land movement (VLM), especially land subsidence, which is a major driver of flooding on the north coast of Java [34]. If this severe land subsidence is not included as a data layer, CEI could underestimate exposure in areas where VLM dominates flooding. Therefore, future calculations of the CEI should clearly include the rate of local land subsidence and changes in land use. To be more complete and useful to stakeholders, future studies will need to go beyond standard InVEST capabilities by building a dynamic composite model that can test multiple concurrent adaptation scenarios, for example, comparing exposure reductions from targeted structural protection with those from gradual habitat restoration amid simultaneous sea-level rise and land subsidence [60]. Not only that, but because CEI is a theoretical relative index, the current version requires real field validation. To build confidence in the model results, subsequent studies strongly recommend examining CEI hotspots with documented field data, such as observations of past shoreline changes and records of tidal flood frequency [61].
In addition to model uncertainty, nature-based solutions have natural ecological limitations. Although our results emphasize the protective role of mangroves, in some highly exposed segments, the habitat does not fully mitigate changes in exposure grade. This indicates that local environmental conditions, such as unstable substrates, extreme subsidence, or strong hydrodynamic currents, may exceed the mangrove’s ability to survive and protect [60]. Therefore, to turn this limitation into a concrete step, local governments and environmental institutions in peri-urban vulnerable areas such as Jepara and Demak must conduct rigorous assessments of habitat suitability and avoid restoration carelessly. In areas where natural regeneration is complex, local governments should shift habitat restoration funding toward “hybrid engineering” solutions, combining permeable structures to capture sediment and dampen waves with continued mangrove planting [59]. While in dense urban Semarang, policymakers must implement a firm “coexistence strategy”, namely by increasing physical defenses around vital assets and imposing firm sanctions on remaining mangrove degradation actors who still serve as wave absorbers [9].
The CEI model applied in this study using the InVEST framework has limitations in representing dynamic coastal processes and in evaluating scenarios involving physical coastal modifications. As a spatially explicit approach, the CEI model relies on static input parameters derived from established methods and is not designed to simulate detailed temporal variability. Simulating different configurations of coastal protection structures usually requires more dynamic models with higher temporal resolution. Nevertheless, this study did incorporate scenario-based comparison by evaluating coastal exposure under two conditions, namely with habitat presence and without habitat presence, in order to examine the contribution of natural coastal habitats to exposure reduction. Although scenario-based analysis could expand the scope of this study, this approach adopted here was intentionally designed to provide a broad spatial assessment of coastal exposure conditions. In this respect, the scenario design remains consistent with previous applications of the InVEST Coastal Vulnerability model, including studies by Al Ruheili and Boluwade [30] and Andrawina et al. [62], which also used comparative scenario approaches to assess coastal vulnerability rather than to simulate a wide range of detailed physical intervention options. Therefore, the main objective of this research is to establish a baseline characterization of coastal vulnerability across the study rather than to evaluate specific intervention scenarios. The resulting spatial outputs are expected to provide useful information for stakeholders and coastal managers in supporting evidence-based coastal planning and management. For local communities and decision-makers, this baseline assessment is particularly valuable for identifying priority coastal segments, recognizing the protective role of existing habitats, and supporting the early formulation of adaptation and risk-reduction strategies. Establishing such a baseline exposure assessment represents an important first step prior to more complex scenario-based modeling. The spatial patterns identified in this study can therefore provide a foundation for future work that incorporates dynamic coastal processes or evaluates specific coastal management interventions and adaptation strategies.
In essence, the CEI in this study is best suited as an initial assessment to find coastal segments at relatively high risk. Since this relative vulnerability index is not a measure of direct economic losses, its use in policy should be cautious. To link spatial modeling to field management, regional planning authorities must legally incorporate these CEI maps into regional spatial plans as the primary scientific basis for establishing strict coastal boundaries (retreat zones) and prioritizing restoration investments [63]. With that foundation, policymakers are encouraged to stop issuing new permits to convert natural land into fish ponds or industrial zones. However, local governments still need to supplement these initial screening tools with site-specific economic risk assessments before allocating funds for large infrastructure projects or long-term adaptations [4].

5. Conclusions

The study advances the current understanding of coastal vulnerability by explicitly measuring the protection capacity of natural habitats along heavily modified tropical coastlines. By applying InVEST’s coastal vulnerability model to construct a comparative CEI, the study addresses critical gaps in evaluating environments exposed to extreme and complex hazards. Using the Jepara–Demak–Semarang coastline as a representative global testing ground, characterized by the combined threat of global sea level rise, severe local land subsidence, and massive land-use change, this study provides an essential empirical basis for integrating nature-based solutions into spatial planning for complex and densely populated coastal regions around the world.
Comparative scenarios show that coastal ecosystems, particularly mangrove forests, play a significant role in reducing vulnerability. The presence of natural habitats prevents large parts of the coastline from crossing the “very high” critical exposure threshold. However, the built CEI also highlights an important reality: nature-based solutions alone are not enough to reduce risks in coastal segments characterized by vulnerable geomorphology and strong marine propulsion components. While urban areas such as Semarang maintain relatively low exposure due to existing complex infrastructure, the conversion of natural coastlines to aquaculture in suburban areas such as Demak and Jepara has significantly increased their exposure. These spatial differences underscore that ecosystem preservation must be combined with site-specific hybrid engineering to achieve true coastal resilience.
Although the constructed CEI provides a relatively solid foundation, its applicability is currently limited due to the absence of local land subsidence data and dynamic multi-scenario capabilities. To address this gap, future research should focus on developing combined models that integrate VLM and empirically validate vulnerable points of exposure to the historical record. Thus, the researchers bridged the gap between relative vulnerability indices and absolute risk predictions, ultimately providing stakeholders with an exact, actionable blueprint for long-term adaptation investments.

Author Contributions

Conceptualization, M.R.N., H.A.R. and M.D.S.; methodology, M.R.N., H.A.R. and A.R.A.-s.; software, M.R.N. and H.A.R.; validation, M.R.N., H.A.R., L.O.A. and T.A.; formal analysis, M.R.N. and H.A.R.; investigation, M.R.N., H.A.R., A.K.D. and A.A.M.A.P.S.; data curation, M.R.N., H.A.R., A.K.D. and A.A.M.A.P.S.; writing—original draft preparation, M.D.S., M.R.N., H.A.R. and A.R.A.-s.; writing—review and editing, M.D.S., M.R.N., H.A.R., T.O., A.A.M.A.P.S. and A.R.A.-s.; visualization, M.R.N., H.A.R., M.D.S., L.O.A., T.A. and A.R.A.-s.; supervision, M.D.S. and A.R.A.-s.; funding acquisition, M.R.N. and M.D.S. All authors have read and agreed to the published version of the manuscript.

Funding

This research received no external funding.

Data Availability Statement

The raw data supporting the conclusions of this article will be made available by the authors on request.

Acknowledgments

We thank the Stanford Natural Capital Project for providing the InVEST Coastal Vulnerability model used in this study. We also acknowledge BIG for providing national geomorphology datasets, DeltaDTM for coastal topographic information, and the Allen Coral Atlas for coastal habitat data, all of which were essential to this research. Finally, we are grateful to the manuscript reviewers for their constructive feedback, which helped improve the quality of this work. During the preparation of this work the authors used Grammarly to improve the language and readability. After using this tool, the authors reviewed and edited the content as needed and take full responsibility for the publication’s content.

Conflicts of Interest

The authors declare no conflicts of interest.

References

  1. Intergovernmental Panel on Climate Change (IPCC). Climate Change 2021: The Physical Science Basis; Contribution of Working Group I to the Sixth Assessment Report of the IPCC; Cambridge University Press: Cambridge, UK, 2021.
  2. Nerem, R.S.; Beckley, B.D.; Fasullo, J.T.; Hamlington, B.D.; Masters, D.; Mitchum, G.T. Climate-change–driven accelerated sea-level rise detected in the altimeter era. Proc. Natl. Acad. Sci. USA 2018, 115, 2022–2025. [Google Scholar] [CrossRef]
  3. Nicholls, R.J.; Cazenave, A. Sea-level rise and its impact on coastal zones. Science 2010, 328, 1517–1520. [Google Scholar] [CrossRef]
  4. Vousdoukas, M.I.; Mentaschi, L.; Voukouvalas, E.; Verlaan, M.; Jevrejeva, S.; Jackson, L.P.; Feyen, L. Global probabilistic projections of extreme sea levels show intensification of coastal flood hazard. Nat. Commun. 2018, 9, 2360. [Google Scholar] [CrossRef] [PubMed]
  5. Marino, M.; Baptist, M.J.; Alkharoubi, A.I.; Nasca, S.; Cavallaro, L.; Foti, E.; Musumeci, R.E. Nature-based Solutions as Building Blocks for Coastal Flood Risk Reduction: A Model-Based Ecosystem Service Assessment. Sci. Rep. 2025, 15, 12070. [Google Scholar] [CrossRef]
  6. Bulleri, F.; Chapman, M.G. The introduction of coastal infrastructure as a driver of change in marine environments. J. Appl. Ecol. 2010, 47, 26–35. [Google Scholar] [CrossRef]
  7. National Oceanic and Atmospheric Administration. Nature-Based Solutions for Coastal Hazards: Installation and Maintenance Considerations; NOAA: Silver Spring, MD, USA, 2020. Available online: https://coast.noaa.gov/data/digitalcoast/pdf/nature-based-solutions-installation-maintenance.pdf (accessed on 4 March 2026).
  8. Narayan, S.; Beck, M.W.; Reguero, B.G.; Losada, I.J.; Van Wesenbeeck, B.; Pontee, N.; Sanchirico, J.N.; Ingram, J.C.; Lange, G.M.; Burks-Copes, K.A. The effectiveness, costs and coastal protection benefits of natural and nature-based defences. PLoS ONE 2016, 11, e0154735. [Google Scholar] [CrossRef]
  9. Spalding, M.D.; McIvor, A.L.; Beck, M.W.; Koch, E.W.; Möller, I.; Reed, D.J.; Rubinof, P.; Spencer, T.; Tolhurst, T.J.; Wamsley, T.V.; et al. Coastal ecosystems: A critical element of risk reduction. Conserv. Lett. 2014, 7, 293–301. [Google Scholar] [CrossRef]
  10. Beck, M.W.; Losada, I.J.; Menéndez, P.; Reguero, B.G.; Díaz-Simal, P.; Fernández, F. The global flood protection savings provided by coral reefs. Nat. Commun. 2018, 9, 2186. [Google Scholar] [CrossRef] [PubMed]
  11. Gornitz, V. Global coastal hazards from future sea level rise. Palaeogeogr. Palaeoclimatol. Palaeoecol. 1991, 89, 379–398. [Google Scholar] [CrossRef]
  12. Hammar-Klose, E.S.; Thieler, E.R. Coastal Vulnerability to Sea-Level Rise: A Preliminary Database for the U.S. Atlantic, Pacific, and Gulf of Mexico Coasts; Data Series 68; U.S. Geological Survey: Reston, VA, USA, 2001. [Google Scholar]
  13. Satta, A.; Puddu, M.; Venturini, S.; Giupponi, C. Assessment of coastal risks to climate change related impacts at the regional scale: The case of the Mediterranean region. Int. J. Disaster Risk Reduct. 2017, 24, 284–296. [Google Scholar] [CrossRef]
  14. Noor, N.M.; Abdul Maulud, K.N. Coastal vulnerability: A brief review on integrated assessment in Southeast Asia. J. Mar. Sci. Eng. 2022, 10, 595. [Google Scholar] [CrossRef]
  15. Ai, B.; Tian, Y.; Wang, P.; Gan, Y.; Luo, F.; Shi, Q. Vulnerability analysis of coastal zone based on InVEST model in Jiaozhou Bay, China. Sustainability 2022, 14, 6913. [Google Scholar] [CrossRef]
  16. Guannel, G.; Arkema, K.; Ruggiero, P.; Verutes, G. The power of three: Coral reefs, seagrasses and mangroves protect coastal regions and increase their resilience. PLoS ONE 2016, 11, e0158094. [Google Scholar] [CrossRef]
  17. Arkema, K.K.; Guannel, G.; Verutes, G.; Wood, S.A.; Guerry, A.; Ruckelshaus, M.; Kareiva, P.; Lacayo, M.; Silver, J.M. Coastal habitats shield people and property from sea-level rise and storms. Nat. Clim. Change 2013, 3, 913–918. [Google Scholar] [CrossRef]
  18. Natural Capital Alliance. InVEST 3.17.2. Stanford University, University of Minnesota, Chinese Academy of Sciences, The Nature Conservancy, World Wildlife Fund, Stockholm Resilience Centre and the Royal Swedish Academy of Sciences. 2025. Available online: https://natcap.github.io/invest.release-metadata/3.17.2.html (accessed on 17 January 2026).
  19. Marfai, M.A.; Sekaranom, A.B.; Ward, P. Community responses and adaptation strategies toward flood hazard in Jakarta, Indonesia. Nat. Hazards 2015, 75, 1127–1144. [Google Scholar] [CrossRef]
  20. Ward, P.J.; Blauhut, V.; Bloemendaal, N.; Daniell, J.E.; de Ruiter, M.C.; Duncan, M.J.; Emberson, R.; Jenkins, S.F.; Krischbum, D.; Kunz, M.; et al. Natural hazard risk assessments at the global scale. Nat. Hazards Earth Syst. Sci. 2020, 20, 1069–1096. [Google Scholar] [CrossRef]
  21. Chaussard, E.; Amelung, F.; Abidin, H.; Hong, S.H. Sinking cities in Indonesia: ALOS PALSAR detects rapid subsidence due to groundwater and gas extraction. Remote Sens. Environ. 2013, 128, 150–161. [Google Scholar] [CrossRef]
  22. Takagi, H.; Esteban, M.; Mikami, T.; Fujii, D. Projection of coastal floods in 2050 Jakarta. Urban Clim. 2016, 17, 135–145. [Google Scholar] [CrossRef]
  23. Abidin, H.Z.; Andreas, H.; Gumilar, I.; Sidiq, T.P.; Fukuda, Y. Land subsidence in coastal city of Semarang (Indonesia): Characteristics, impacts and causes. Geom. Nat. Hazards Risk 2013, 4, 226–240. [Google Scholar] [CrossRef]
  24. Bird, E.C.F.; Ongkosongo, O.S.R. Environmental Changes on the Coasts of Indonesia; United Nations University Press: Tokyo, Japan, 1980. [Google Scholar]
  25. Solihuddin, T.; Husrin, S.; Mustikasari, E.; Heriati, A.; Kepel, T.L.; Salim, H.L.; Risandi, J.; Dwiyanti, D. Coastal inundation and land subsidence in north coast of West Java: A new hazard? Proc. IOP Conf. Ser. Earth Environ. Sci. 2021, 925, 012015. [Google Scholar] [CrossRef]
  26. Purwanto; Sugianto, D.N.; Zainuri, M.; Permatasari, G.; Atmojo, W.; Rochaddi, B.; Wetchayont, P.; Wirasatriya, A. Seasonal variability of waves within Indonesia’s seas and its relation with monsoon wind. Indones. J. Mar. Sci. 2021, 26, 189–196. [Google Scholar] [CrossRef]
  27. Kusmana, C. Distribution and current status of mangrove forests in Indonesia. In Mangrove Ecosystems of Asia; Faridah-Hanum, I., Latiff, A., Hakeem, K., Ozturk, M., Eds.; Springer: New York, NY, USA, 2014; pp. 37–60. [Google Scholar]
  28. Ilman, M.; Dargusch, P.; Dart, P. A historical analysis of the drivers of loss and degradation of Indonesia’s mangroves. Land Use Policy 2016, 54, 448–459. [Google Scholar] [CrossRef]
  29. Hopper, T.; Meixler, M.S. Modeling coastal vulnerability through space and time. PLoS ONE 2016, 11, e0163495. [Google Scholar] [CrossRef]
  30. Al Ruheili, A.; Boluwade, A. Towards quantifying the coastal vulnerability due to natural hazards using the InVEST coastal vulnerability model. Water 2023, 15, 380. [Google Scholar] [CrossRef]
  31. Re, A.; Minola, L.; Pezzoli, A. Climate scenarios for coastal flood vulnerability assessments: A case study for the Ligurian Coastal Region. Climate 2023, 11, 56. [Google Scholar] [CrossRef]
  32. Setiawati, M.D.; Nandika, M.R.; Hernawan, U.E.; Rachman, H.A.; Chatterjee, U.; Adi, N.S.; Alifatri, L.O.; Eguchi, T.; Supriyadi, I.H.; Hanifa, N.R.; et al. Application of coastal hazard index to advance nature-based protection for coastal communities in small islands. Discov. Appl. Sci. 2024, 6, 462. [Google Scholar] [CrossRef]
  33. Sagala, P.M.; Bhomia, R.K.; Murdiyarso, D. Assessment of coastal vulnerability to support mangrove restoration along the northern coast of Java, Indonesia. Reg. Stud. Mar. Sci. 2024, 70, 103383. [Google Scholar]
  34. Husnayaen; Rimba, A.B.; Osawa, T.; Parwata, I.N.S.; As-syakur, A.R.; Kasim, F.; Astarini, I.A. Physical assessment of coastal vulnerability under enhanced land subsidence in Semarang, Indonesia, using multi-sensor satellite data. Adv. Space Res. 2018, 61, 2159–2179. [Google Scholar] [CrossRef]
  35. Handayani, W.; Rudiarto, I.; Setyono, J.S.; Chigbu, U.E.; Sukmawati, A.M. Vulnerability assessment: A comparison of three different city sizes in the coastal area of Central Java, Indonesia. Adv. Clim. Change Res. 2017, 8, 286–296. [Google Scholar] [CrossRef]
  36. Gornitz, V.; White, T.W.; Cushman, R.M. Vulnerability of the US to Future Sea Level Rise; Oak Ridge National Laboratory Report CONF-910780-1; Oak Ridge National Laboratory: Oak Ridge, TN, USA, 1990. [Google Scholar]
  37. Gornitz, V.M.; Daniels, R.C.; White, T.W.; Birdwell, K.R. The development of a coastal risk assessment database: Vulnerability to sea-level rise in the US Southeast. J. Coast. Res. 1994, 10, 327–338. [Google Scholar]
  38. Pronk, M. DeltaDTM: A Global Coastal Digital Terrain Model, Version 3; 4TU.ResearchData: Delft, The Netherlands, 2024. [CrossRef]
  39. Lyons, M.; Larsen, K.; Skone, M. CoralMapping/AllenCoralAtlas, v1.3; Zenodo: Geneva, Switzerland, 2022.
  40. Copernicus Climate Change Service (C3S). Sea Level Gridded Data from Satellite Observations for the Global Ocean from 1993 to Present; Climate Data Store (CDS): Reading, UK, 2018. [Google Scholar]
  41. Sims, K.; Reith, A.; Bright, E.; McKee, J.; Rose, A. LandScan Global 2021; Oak Ridge National Laboratory: Oak Ridge, TN, USA, 2022. [Google Scholar]
  42. Keddy, P.A. Quantifying within-lake gradients of wave energy: Interrelationships of wave energy, substrate particle size and shoreline plants in Axe Lake, Ontario. Aquat. Bot. 1982, 14, 41–58. [Google Scholar] [CrossRef]
  43. Malhotra, A.; Fonseca, M.S. WEMo (Wave Exposure Model): Formulation, Procedures and Validation; NOAA Technical Memorandum NOS NCCOS #65; National Oceanic and Atmospheric Administration: Silver Spring, MD, USA, 2007; 28p. [Google Scholar]
  44. U.S. Army Corps of Engineers (USACE). Coastal Engineering Manual (CEM) EM 1110-2-1100; U.S. Army Corps of Engineers: Vicksburg, MS, USA, 2002.
  45. Diez, P.; Perillo, G.; Piccolo, M. Vulnerability to sea-level rise on the coast of the Buenos Aires Province. J. Coast. Res. 2007, 23, 119–142. [Google Scholar] [CrossRef]
  46. As-syakur, A.R.; Rachman, H.A.; Nandika, M.R.; Setiawati, M.D.; Manessa, M.D.M.; Dewi, A.K.; Pratama, R.T. Coastal vulnerability assessment for the megacity of Jakarta, Indonesia under enhanced sea-level rise and land subsidence. In Climate Change, Community Response and Resilience; Chatterjee, U., Shaw, R., Bhunia, G.S., Setiawati, M.D., Banerjee, S., Eds.; Developments in Weather and Climate Science; Elsevier: Amsterdam, The Netherlands, 2023; Volume 6, pp. 433–450. [Google Scholar]
  47. Pendleton, E.A.; Thieler, E.R.; Williams, S.J. Coastal Vulnerability Assessment of Golden Gate National Recreation Area to Sea-Level Rise; U.S. Geological Survey Open-File Report 2005–1058; U.S. Geological Survey: Reston, VA, USA, 2005. [Google Scholar]
  48. Baig, M.R.I.; Shahfahad; Ahmad, I.A.; Tayyab, M.; Asgher, M.S.; Rahman, A. Coastal vulnerability mapping by integrating geospatial techniques and analytical hierarchy process (AHP) along the Vishakhapatnam coastal tract, Andhra Pradesh, India. J. Indian Soc. Remote Sens. 2021, 49, 215–231. [Google Scholar] [CrossRef]
  49. Furlan, E.; Pozza, P.D.; Michetti, M.; Torresan, S.; Critto, A.; Marcomini, A. Development of a multi-dimensional coastal vulnerability index: Assessing vulnerability to inundation scenarios along the Italian coast. Sci. Total Environ. 2021, 772, 144650. [Google Scholar]
  50. Silver, J.M.; Arkema, K.K.; Griffin, R.M.; Lashley, B.; Lemay, M.; Maldonado, S.; Moultrie, S.H.; Ruckelshaus, M.; Schill, S.; Thomas, A.; et al. Advancing coastal risk reduction science and implementation by accounting for climate, ecosystems, and people. Front. Mar. Sci. 2019, 6, 556. [Google Scholar] [CrossRef]
  51. Singha, P.; Dasgupta, R.; Hashimoto, S.; Mitra, B.K. An integrated coastal exposure modelling approach to foster mangrove-based disaster risk reduction (eco-DRR) in Tamil Nadu, India. Prog. Disaster Sci. 2024, 24, 100388. [Google Scholar]
  52. Varis, O.; Taka, M.; Kummu, M. Mapping the world’s coastal population facing water-related risks. Geogr. Sustain. 2026, 7, 100411. [Google Scholar] [CrossRef]
  53. Lin, Z.; Singh, M. Assessing coastal vulnerability and evaluating the effectiveness of natural habitats in enhancing coastal resilience: A case study in Shanghai, China. Sustainability 2024, 16, 609. [Google Scholar] [CrossRef]
  54. Bott, L.; Schöne, T.; Illigner, J.; Haghighi, M.H.; Gisevius, K.; Braun, B. Land subsidence in Jakarta and Semarang Bay: The relationship between physical processes, risk perception, and household adaptation. Ocean Coast. Manag. 2021, 211, 105775. [Google Scholar] [CrossRef]
  55. Yuliastuti, N.; Okta, E.V.; Haryanti, V.G.; Afif, F. Dimensions of community capability and their effects on social vulnerability in the coastal area of Semarang. J. Financ. Manag. Prop. Constr. 2022, 28, 164–177. [Google Scholar] [CrossRef]
  56. Pinuji, S.; de Vries, W.T.; Rineksi, T.W.; Wahyuni, W. Is Obliterated Land Still Land? Tenure Security and Climate Change in Indonesia. Land 2023, 12, 478. [Google Scholar] [CrossRef]
  57. Bijsterveldt, C.E.; van Wesenbeeck, B.K.; van der Wal, D.; Afiati, N.; Pribadi, R.; Brown, B.M.; Bouma, T.J. How to restore mangroves for greenbelt creation along eroding coasts with abandoned aquaculture ponds. Estuar. Coast. Shelf Sci. 2020, 235, 106576. [Google Scholar] [CrossRef]
  58. Schoonees, T.; Gijón Mancheño, A.; Scheres, B.; Bouma, T.J.; Silva, R.; Schlurmann, T.; Schüttrumpf, H. Hard structures for coastal protection, towards greener designs. Estuar. Coasts 2019, 42, 1709–1729. [Google Scholar] [CrossRef]
  59. Temmerman, S.; Meire, P.; Bouma, T.J.; Herman, P.M.J.; Ysebaert, T.; de Vriend, H.J. Ecosystem-based coastal defence in the face of global change. Nature 2013, 504, 79–83. [Google Scholar] [CrossRef]
  60. Lovelock, C.E.; Cahoon, D.R.; Friess, D.A.; Guntenspergen, G.R.; Krauss, K.W.; Reef, R.; Rogers, K.; Saunders, M.L.; Sidik, F.; Swales, A.; et al. The vulnerability of Indo-Pacific mangrove forests to sea-level rise. Nature 2015, 526, 559–563. [Google Scholar] [CrossRef] [PubMed]
  61. Hinkel, J.; Lincke, D.; Vafeidis, A.T.; Perrette, M.; Nicholls, R.J.; Tol, R.S.J.; Marzeion, B.; Fettweis, X.; Ionescu, C.; Levermann, A. Coastal flood damage and adaptation costs under 21st century sea-level rise. Proc. Natl. Acad. Sci. USA 2014, 111, 3292–3297. [Google Scholar] [CrossRef] [PubMed]
  62. Andrawina, Y.O.; Büyüksalih, G.; Gazioğlu, C.; Liufandy, H. Coastal vulnerability analysis of the semi-enclosed water systems of the Sea of Marmara, Türkiye using InVEST model. J. Coast. Conserv. 2025, 29, 42. [Google Scholar] [CrossRef]
  63. Guerry, A.D.; Ruckelshaus, M.H.; Arkema, K.K.; Bernhardt, J.R.; Guannel, G.; Kim, C.K.; Marsik, M.; Papenfus, M.; Toft, J.E.; Verutes, G.; et al. Modeling benefits from nature: Using ecosystem services to inform coastal and marine spatial planning. Int. J. Biodivers. Sci. Ecosyst. Serv. Manag. 2012, 8, 107–121. [Google Scholar] [CrossRef]
Figure 1. Location of the study area along the northern coast of Java Island, Indonesia, specifically Semarang City, Demak, and Jepara Regency.
Geohazards 07 00037 g001
Figure 2. Research framework illustrating data sources, parameter processing, and implementation of the InVEST Coastal Vulnerability model under habitat and no-habitat scenarios.
Geohazards 07 00037 g002
Figure 3. The spatial distribution of each key driver of CEI.
Geohazards 07 00037 g003
Figure 4. Spatial distribution of CEI under habitat and no-habitat scenarios.
Geohazards 07 00037 g004
Figure 5. The spatial distribution of habitat role in reducing the CEI within the study area.
Geohazards 07 00037 g005
Figure 6. The driving force of CEI by regency.
Geohazards 07 00037 g006
Table 1. Summary of datasets used in this study, including parameters, data description, year, spatial resolution, and sources.
ParameterDescriptionYearSpatial ResolutionData Source
Wind & Wave ExposureWind speed and wave energy1979–20090.25°WaveWatch
FetchMaximum wave fetch distanceProcessedVectorProcessed
TopographyDigital Elevation Model20241 arc-secondDeltaDTM
GeomorphologyCoastal landform classification2017–2021VectorBIG
BathymetryNearshore water depth20226 arc-secondBATNAS
Coastal HabitatMangroves, coral reefs, and seagrass2018–20225–10 mAllen Coral Atlas
Sea Level RiseSatellite altimetry trend1993–20230.25°AVISO
PopulationHuman population density2020~1 kmLandScan
Table 2. Ranking criteria and threshold values for CEI parameters implemented in the InVEST model. Ranking values range from 1 (very low) to 5 (very high), adapted from previous studies and adjusted to reflect local coastal conditions along the northern coast of Java.
ParameterVery Low
(1)
Low
(2)
Moderate
(3)
High
(4)
Very High
(5)
Wind & Wave Exposure0 to 20 Percentile21 to 40 Percentile41 to 60 Percentile61 to 80 Percentile81 to 100 Percentile
GeomorphologyRocky; high cliffs; fjord; fjord; seawallsMedium cliff; indented coast; bulkheads and small seawallsLow cliff; glacial drift; alluvial plain; revetments; rip-rap wallsCobble beach; estuary; lagoon; bluffBarrier beach; sand beach; mud flat; delta
Digital Elevation Model (DEM)81 to 100 Percentile61 to 80 Percentile41 to 60 Percentile21 to 40 Percentile0 to 20 Percentile
Surge Potential0 to 20 Percentile21 to 40 Percentile41 to 60 Percentile61 to 80 Percentile81 to 100 Percentile
Natural HabitatCoral reef; mangrove; coastal forestHigh dune; marshLow duneSeagrass; kelpNo habitat
Sea Level Rise0 to 20 Percentile21 to 40 Percentile41 to 60 Percentile61 to 80 Percentile81 to 100 Percentile
Table 3. Detailed CEI with habitat.
RegencyVery LowLowModerateHighVery HighTotal Length per Region (km)Total (%)
km%km%km%km%km%
Semarang29.3942.0%35.07950.2%5.137.3%0.30.4%00.0%69.89100%
Demak7.797.6%42.9742.1%35.4334.7%15.8115.5%00.0%101.99100%
Jepara00.0%6.187.3%29.6535.0%44.2652.2%4.655.5%84.74100%
Grand Total37.1814.5%84.2332.8%70.227.4%60.3623.5%4.6451.8%256.63100%
Table 4. Detailed CEI without habitat.
RegencyVery LowLowModerateHighVery HighTotal Length per Region (km)Total (%)
km%km%km%km%km%
Semarang13.8619.8%32.145.9%22.3932.0%1.532.2%00.0%69.89100%
Demak1.6841.7%22.0921.7%36.3235.6%28.7528.2%13.1512.9%101.99100%
Jepara00.0%0.690.8%6.878.1%31.6937.4%45.4953.7%84.74100%
Grand Total15.556.1%54.8921.4%65.5825.6%61.9824.2%58.6322.8%256.63100%
Table 5. The quantification of the habitat role in reducing the CEI.
RegencyNo EffectReduction < 1 CEI ClassReduction ≥ 1 CEI ClassTotal Length per Region (km)Total (%)
km%km%km%
Semarang13.5819.4%56.3280.6%00.0%69.89100%
Demak00.0%100.9298.9%1.071.1%101.99100%
Jepara11.2513.3%51.3660.6%22.1326.1%84.74100%
Grand Total24.829.7%208.681.3%23.219.0%256.63100%
Disclaimer/Publisher’s Note: The statements, opinions and data contained in all publications are solely those of the individual author(s) and contributor(s) and not of MDPI and/or the editor(s). MDPI and/or the editor(s) disclaim responsibility for any injury to people or property resulting from any ideas, methods, instructions or products referred to in the content.