Article

Multi-Objective Adaptive Harmony Search for Optimization of Seismic Base Isolator Systems
1
Department of Civil Engineering, İstanbul University-Cerrahpaşa, 34320 İstanbul, Turkey
2
College of IT Convergence, Gachon University, Seongnam 13120, Republic of Korea
*
Authors to whom correspondence should be addressed.
GeoHazards 2026, 7(1), 9; https://doi.org/10.3390/geohazards7010009

Submission received: 28 November 2025 / Revised: 30 December 2025 / Accepted: 4 January 2026 / Published: 6 January 2026

Abstract

The optimization of seismic isolation parameters is essential for balancing displacement demand and acceleration control in base-isolated structures. While numerous studies have applied metaheuristic algorithms to isolator tuning, the influence of objective-function weighting on optimal design outcomes remains insufficiently explored. This study investigates the effects of displacement and acceleration on control performance in a multi-objective optimization function. Thus, acceleration can be reduced economically by limiting the isolator displacement capacity. In the study, the effective values of the acceleration and displacement coefficients in the objective function of the problem are changed for the design optimization of seismic base isolators, and the determination of the most appropriate weights in the equation and their effects on the control are investigated. In the optimization process, the adaptive harmony search algorithm, which is obtained by adapting the parameters of the harmony search algorithm inspired by the search for the best harmony, is used. The results demonstrate that increased emphasis on acceleration minimization leads to longer effective isolation periods and higher damping ratios, whereas displacement-dominated weighting results in stiffer isolation systems with reduced mobility.

1. Introduction

Control systems are systems in which some devices compatible with the structure are used to reduce the response of the structure to various dynamic and environmental factors [1,2,3]. Base isolation is added to the structure to minimize the effects of seismic vibrations such as earthquakes transmitted from the base [4,5]. Seismic base isolators are control devices that are used to interrupt the transmission of vibrations from the ground to the structure. They are systems that are usually placed at the base of the building, are very rigid vertically, and can move horizontally thanks to the rubber-based material they contain [6,7,8].
Since it is often preferred in the design of structures that can accommodate important and sensitive equipment (hospitals, schools, emergency operation centers, factories, etc.), they are costly and may be heavy material systems with a single isolator weight that can be 1 tf [1].
Systems with isolators aim to absorb energy by moving within the limit of their mobility, in harmony with the vibration period of the isolators, in the face of a dynamic vibration. In damping logic, the damping degree of these systems with isolator mobility is directly proportional to ductility. However, this ductility must be at a certain level [9,10,11,12,13]. An isolator that acts too ductile can cause excessive damage to architectural elements due to the movement it will show in small earthquakes. Considering these situations, the ductility of the isolators is determined by considering the seismicity of the region. It is aimed to dampen the incoming vibrations by placing isolators following the location of the structure. While an isolator that is too ductile may have damaging effects on the structure, the use of an isolator with insufficient ductility also causes insufficient energy dissipation to isolate the structure from the ground against earthquakes in the region [14,15,16,17].
Base isolators are control systems that need to be optimally designed due to their high cost and maintenance-repair procedures. Considering their performance in control, they act as fast acceleration reducers and good displacement controllers. These features have made isolators the preferred choice as high-performance vibration dampers. Optimum design is a necessary step to reduce costs so that they can be used in buildings with lower building importance.
In isolator design, there are parameters such as the selection of the isolator material, adjustment of bearing friction properties and damping ratio, and optimization of the area to be opened around the structure for mobility. Correct selection and adjustment of these parameters are essential for optimum isolator performance. In recent years, as an alternative to rubber-based isolator material used for isolator flexibility, options such as a sand–tire mixture, scrap tires, scrap tire linings, silicone rubber, metal rubber, butyl rubber, and recycled rubber have been tried, and their effects on isolator performance have been investigated [2,3,4,5,6,7,8].
Alternative materials that can be used instead of talc and sand, which are generally preferred in the isolation layer, which affects various friction properties, have been the subject of studies for sliding floor isolation systems where friction is effective [9,10,11,12,13,14]. By investigating the seismic behavior and collapse performance of isolator systems using the natural damping model, the effect of damping on isolator performance in isolators with different damping ratios has been studied; with the success of isolators with variable damping features in reducing vibration force transmission, effective damping properties for isolator performance can be determined [15,16,17]. These researchers have offered various suggestions for determining the design criteria of isolators. Optimization has become necessary in selecting the most suitable design for a building model among this variety of design parameters. It is possible to choose the most suitable parameters among the options with an optimization process.
From a sustainable development perspective, optimizing seismic isolation systems contributes to resilient and resource-efficient infrastructure, which aligns with governmental directives and international programs promoting disaster risk reduction and sustainable construction. Efficient isolator design can reduce material demand, limit post-earthquake damage, and decrease repair and maintenance requirements over the structure’s lifecycle. By enabling performance-oriented design with optimized parameters, the proposed framework supports sustainability goals related to structural safety, economic efficiency, and long-term resilience of the built environment.
In the optimization of seismic isolators, there are many studies in which the basic characteristics of the control system are optimized [18,19,20,21,22,23,24]. Generally, a parametric optimization process is applied for isolator optimization.
Another optimization method applied consists of metaheuristic algorithms that provide perfect harmony, inspired by nature and living organisms. Its simple and understandable structure has made this method the preferred one for use in design optimization. It is a method that can be inspired by the way bees and birds follow each other when foraging or the learning of a group of students and the transfer of knowledge among themselves and it also benefits from natural cycles and instinctive behaviors. There are many variants inspired by different events and behaviors such as the algorithms in [25,26,27,28,29,30,31,32]. It is a method that is frequently used to determine the optimum design criteria in the optimization of seismic isolators. According to the boundary conditions of the study, different heuristic algorithms come to the fore.
Another factor in the optimization success of algorithms is the chosen objective function. In isolator optimization studies, acceleration and displacement minimization is generally the goal. Apart from these, different variables such as cost and frequency response functions can also be used as objective functions.
Quaranta et al. performed a test setup of a steel frame for a base isolator using differential evolution (DE) and Particle Swarm Optimization (PSO) algorithms in their work and they found that it gave more successful results in optimization [33]. Siami et al. created a multi-degree-of-freedom (MDOF) system of a tuned mass damper inverter (TMDI) and isolator to minimize vibrations of an artistic sculpture, subject to a displacement mean square value, took the minimization of the frequency response function (FRF) between the floor plate and superstructure as the objective function, and compared the efficiency of the Firefly Algorithm (FA) in system optimization with the Sequential Quadratic Programming (SQP) optimization method [34]. Çerçevik et al. used the Crow Search Algorithm (CSA), Whale Optimization (WOA), and Gray Wolf Optimization (GWO) algorithms in the design optimization of seismically isolated structures to minimize the acceleration by considering displacement limits and observed that there was no difference and they had good convergence [35]. Ocak et al. optimized a structure model with a single-degree-of-freedom (SDOF) isolator at different damping and motion limits to minimize acceleration with the adaptive harmony search (AHS) algorithm and investigated the effect of these limits on damping [16]. Tsipianit et al. carried out some optimization studies for the optimization of liquid storage tanks with friction-based isolators and included an optimization procedure aimed at minimizing the torsional response of the liquid tank using the Cuckoo Search Algorithm (CSA) [36]. Mehri et al. presented a study using the ratio of maximum inter-story slips of the controlled and uncontrolled structure under seismic excitations for the design optimization of a building with a lead rubber support (LRB) isolation system with the Grasshopper Optimization Algorithm (GOA) [37]. Xu et al. proposed an optimization function that took into account the maximum acceleration and maximum relative story displacement of each floor of the structure, using genetic algorithms to find the optimal pendulum parameters of a structure with a triple friction pendulum isolation system [38]. In the optimization of a hybrid isolator system, Aceto et al. formulated an objective function to minimize the transmitted acceleration and optimized it with the differential evolution algorithm (DE) [39]. Apart from the single-objective functions suggested in these studies, it is also possible to optimize with multi-objective functions. There are multi-objective function applications in the design optimization of isolators. Tsipianit and Tsompanakis used a multi-objective function in the optimization of a hybrid system consisting of a single friction pendulum isolator and viscous damper using a genetic algorithm and employed various objective functions, including effective isolator stiffness, damping coefficient, acceleration, and velocity minimization, and bearing size and capacity, to balance structural performance with financial benefits [40]. Etedali et al. tested the Cuckoo Search optimization (CSO) algorithm in two different optimization problems aimed at minimizing the maximum displacement of an isolator system and the maximum floor acceleration for the optimal design of their structure equipped with friction isolators and a recovery device [41]. Pourzeynali and Zarif used a multi-objective optimization function in multi-genetic algorithm (GA) optimization aimed at minimizing both the top-floor displacement of the structure and the isolator displacement in the optimization of a base-isolated system [42]. Fallah and Zamiri performed a multi-objective optimization that minimized the top-floor displacement, acceleration, and base displacement with a genetic algorithm for the optimal design of sliding isolation systems [43]. Rizzian et al. used a multi-objective genetic algorithm for the design optimization of reinforced concrete structures with elastomeric isolators, minimizing pavement material cost, top-floor acceleration, and top-floor displacement [44].
When optimizing, certain weighting coefficients are chosen for each objective function when more than one objective is included. In the selection of these weights, the effect ratio of each objective may be different. In friction isolators, friction properties can be more effective in terms of performance index, while isolator-bearing material can be more effective in rubber-based isolators. Weights can be assumed to be one at the beginning. However, determination of the weights is important for optimum efficiency, since the effect ratios of the indices that affect the performance are not the same. This situation highlights the necessity of developing a problem-oriented function when formulating multi-objective optimization algorithms.
In this study, a multi-objective optimization process was carried out to optimize the seismic performance in a structure model that was isolated from the base, and the superstructure was assumed to be rigid. For this purpose, seismic excitations were directed toward the model with the isolator as part of an earthquake simulation created in Matlab Simulink [45]. For earthquake records transmitted to the structure, 44 were used, consisting of FEMA P-695 far-fault earthquake records [46]. The damping ratio and period of the isolator system were optimized with the adaptive harmony search algorithm (AHS) derived by adapting the harmony search algorithm (HS) developed by Geem et al. [47]. The harmony search algorithm is an algorithm inspired by the process of searching for the best harmony. The adaptive harmony search algorithm was derived by adapting the harmony memory consideration rate (HMCR) and fret width (FW) parameter, which affect the success of this algorithm. The harmony search algorithm is a metaheuristic algorithm that has been successfully applied to various civil engineering problems [48,49,50,51,52,53,54]. However, since the focus of the study was to compare the weight effects of multi-objective optimization functions, no priority was given to the choice of search algorithms. In the study, a multi-objective optimization function was employed by using weights ranging from zero to one to minimize the maximum acceleration and displacement of the isolator system. After the optimization, critical earthquake analyses were conducted, the effect of the system displacement and acceleration weights in the objective function of the seismic base isolators on the performance was investigated, and the values of the effect values on the control system were interpreted.
Although harmony search–based algorithms have been previously applied to seismic isolator optimization, the present study does not aim to introduce a new algorithmic variant. Instead, it focuses on the problem-oriented contribution of systematically examining the influence of acceleration–displacement weighting in multi-objective optimization. The novelty lies in quantifying how different weight selections affect optimal isolator parameters and control performance under multiple real earthquake records, providing design-oriented insight beyond algorithmic implementation.

2. Theoretical Background

2.1. Design of Seismic Isolator and Equations of Motion

Seismic isolators are generally ground-mounted devices to prevent ground vibrations from being transmitted to the structure. The isolator system consists of two parts, the superstructure and the isolator floor. The total mass of the system (   m t o t a l ) is obtained by summing the isolator mass ( m b ) and the total structure mass ( m s t r u c t u r e ). Equation (1) shows the formula for the total mass of the system with isolators:
    m t o t a l = m b + m s t r u c t u r e
For a theoretical building where the superstructure is assumed to be rigid, the structural system moving together with the isolator has a common period, stiffness, and damping coefficient. Equations (2)–(4) show the system period ( T b ), stiffness ( k b ) and damping coefficient ( c b ) equations, respectively. In the equations, the angular frequency of the system is expressed as  w b , and the damping ratio is shown as  ζ b .
  T b = 2 π w b
  k b = m t o t a l × w b 2
  c b = 2 × ζ b × m t o t a l × w b
The basic equation of a system with isolators moving with the superstructure is given in Equation (5). Total mass ( m t o t a l ), system stiffness ( k b ), and the damping coefficient of the system ( c b ) are used in the  M K , and  C  matrices.
  M X ¨ + C X ˙ + K X = M 1 X ¨ g

2.2. Harmony Search and Adaptive Harmony Search Algorithm

The harmony search algorithm (HS) is a method developed by Geem et al., which includes the best-sounding search process, where harmony vectors are created and updated by the number of iterations, and optimum solutions are produced by reaching the best harmony [47]. To achieve the best harmony, sometimes, new harmony vectors are produced by using harmony vectors from memory, by imitating an existing harmony vector, or by improvising. There are two ways to create a harmony vector. The algorithm-specific design factor, the harmony memory-to-memory consideration ratio ( H M C R ), is used in deciding the chosen path in production. If a randomly selected number between 0 and 1 is less than the  H M C R  value, if it is greater than the  H M C R  value as shown in Equation (6), harmony vectors are produced as in Equation (7). These vectors are stored by repeating operations up to the harmony memory size (HMS).
X n e w = X m i n + r a n d   X m a x X m i n   i f   H M C R > r a n d
X n e w = X n + r a n d   FW   ( X m a x X m i n )   i f   H M C R r a n d
In the equations,  X n e w  is the new harmony vector,  X m a x  is the maximum harmony design value,  X m i n  is the minimum harmony design value,  X n  is the nth harmony vector, and FW stands for the number of fret widths specific to the algorithm.
Each created harmony vector is compared with the previous one, and the solution process increases harmony. These processes continue until the maximum number of iterations is reached and the best harmony is found.
The adaptive harmony search algorithm (AHS) is obtained by choosing the best value within the range of values that the  H M C R  and FW algorithm factors can take during optimization. In AHS optimization, the equations for obtaining the  H M C R  and FW values are shown in Equation (8) and Equation (9), respectively.
H M C R = H M C R i n 1 t m t
F W = F W i n 1 t m t
In the equations,  m t  represents the maximum iteration number,  t  represents the iteration number, and  H M C R i n  and  F W i n  are the initial values of  H M C R  and  F W .

2.3. Multi-Objective Optimization

The multi-objective optimization function is a function used to obtain optimum parameters by considering more than one purpose at the same time when optimizing. It is possible to use it in the optimum design of a seismic isolator by considering many options such as cost, period, displacement, and acceleration. Such optimization processes are called multi-objective optimization. In this study, an objective function was created to minimize the maximum acceleration and maximum displacement of the isolator system, as shown in Equation (10).
M i n i m i z e f x = a X i O p t i m u m   t o t a l   a c c e l e r a t i o n + b X j D i s p l a c e m e n t   L i m i t a ,   b 0 , 1
In the above equation,  X i  represents the maximum total acceleration of the system with isolators,  X j  is the displacement of the system with isolators,  a  is the acceleration effect coefficient, and  b  is the displacement effect coefficient. The optimum total acceleration refers to the value when the purpose is to optimize acceleration, and the displacement limit refers to the movement constraint of the isolator.
In this study, the optimum acceleration value for the isolator system was obtained for 30% and 50% damping limits and 40 cm movement restriction. The optimum total acceleration was obtained only when the optimization was aimed at minimizing the acceleration, and it is shown in Equation (11) for the 30% damped system and Equation (12) for the 50% damped system.
  f x 1 = a X i 2.3524 + b X j 0.4   a ,   b 0 , 1  
f x 2 = a X i 1.7565 + b X j 0.4   a ,   b 0 , 1  

2.4. Ground-Motion Selection and Performance Metrics

In this study, optimum system parameters were obtained by multi-objective optimization of a structure isolated from the base under earthquake excitation. Although acceleration and displacement response spectra can be useful for preliminary characterization of ground motion values, the present study was based on direct time-history analyses of the isolated system under each earthquake record. The optimization procedure evaluated system responses explicitly in the time domain for all selected FEMA P-695 far-field records, rather than relying on spectral quantities. Since the objective of the study was to investigate the sensitivity of multi-objective optimization results to acceleration–displacement weighting and not to compare spectral characteristics of individual records, response spectra are not presented. The selected ground motion values are standard benchmark records whose spectral properties are well documented in the FEMA P-695 database. Critical earthquake analyses were carried out with optimum modal parameters in a single-degree-of-freedom (SDOF) theoretical structure where the superstructure was assumed to be rigid and the structure was assumed to move with the isolator. The list of FEMA P-695 far-fault seismic records transmitted to the structure is shown in Table 1 [46].
The ground motion values used in this study consisted of 44 FEMA P-695 far-field records, which are widely adopted benchmark motion values in seismic performance evaluation studies. These records were selected to represent a broad range of strong ground-motion characteristics and were applied consistently across all optimization cases.
No additional record scaling was performed, as the focus of the study was on the relative influence of objective-function weighting on optimized isolator parameters rather than on an intensity-based performance assessment.
The optimization objectives were limited to peak isolator displacement and peak total acceleration, which are the primary governing response quantities in a base-isolated system design. Other performance measures such as residual displacement, energy dissipation capacity, and stability margins were not considered in order to maintain a focused and computationally feasible optimization framework.

3. Numerical Modelling

Under seismic excitations, the isolator structure model was optimized with the adaptive harmony search algorithm obtained by adapting the memory consideration ratio (HMCR) and fret width (FW) parameters. The initial values of the HMCR and FW algorithm parameters were taken as 0.5 and 0.05, respectively. The period of the isolator system was in the range of 1–5 s. The damping ratio limit was 1–30% and 1–50% for different cases. The maximum mobility of the isolator was optimized to be 40 cm for all cases. The parameters and value ranges used in the optimization are shown in Table 2.
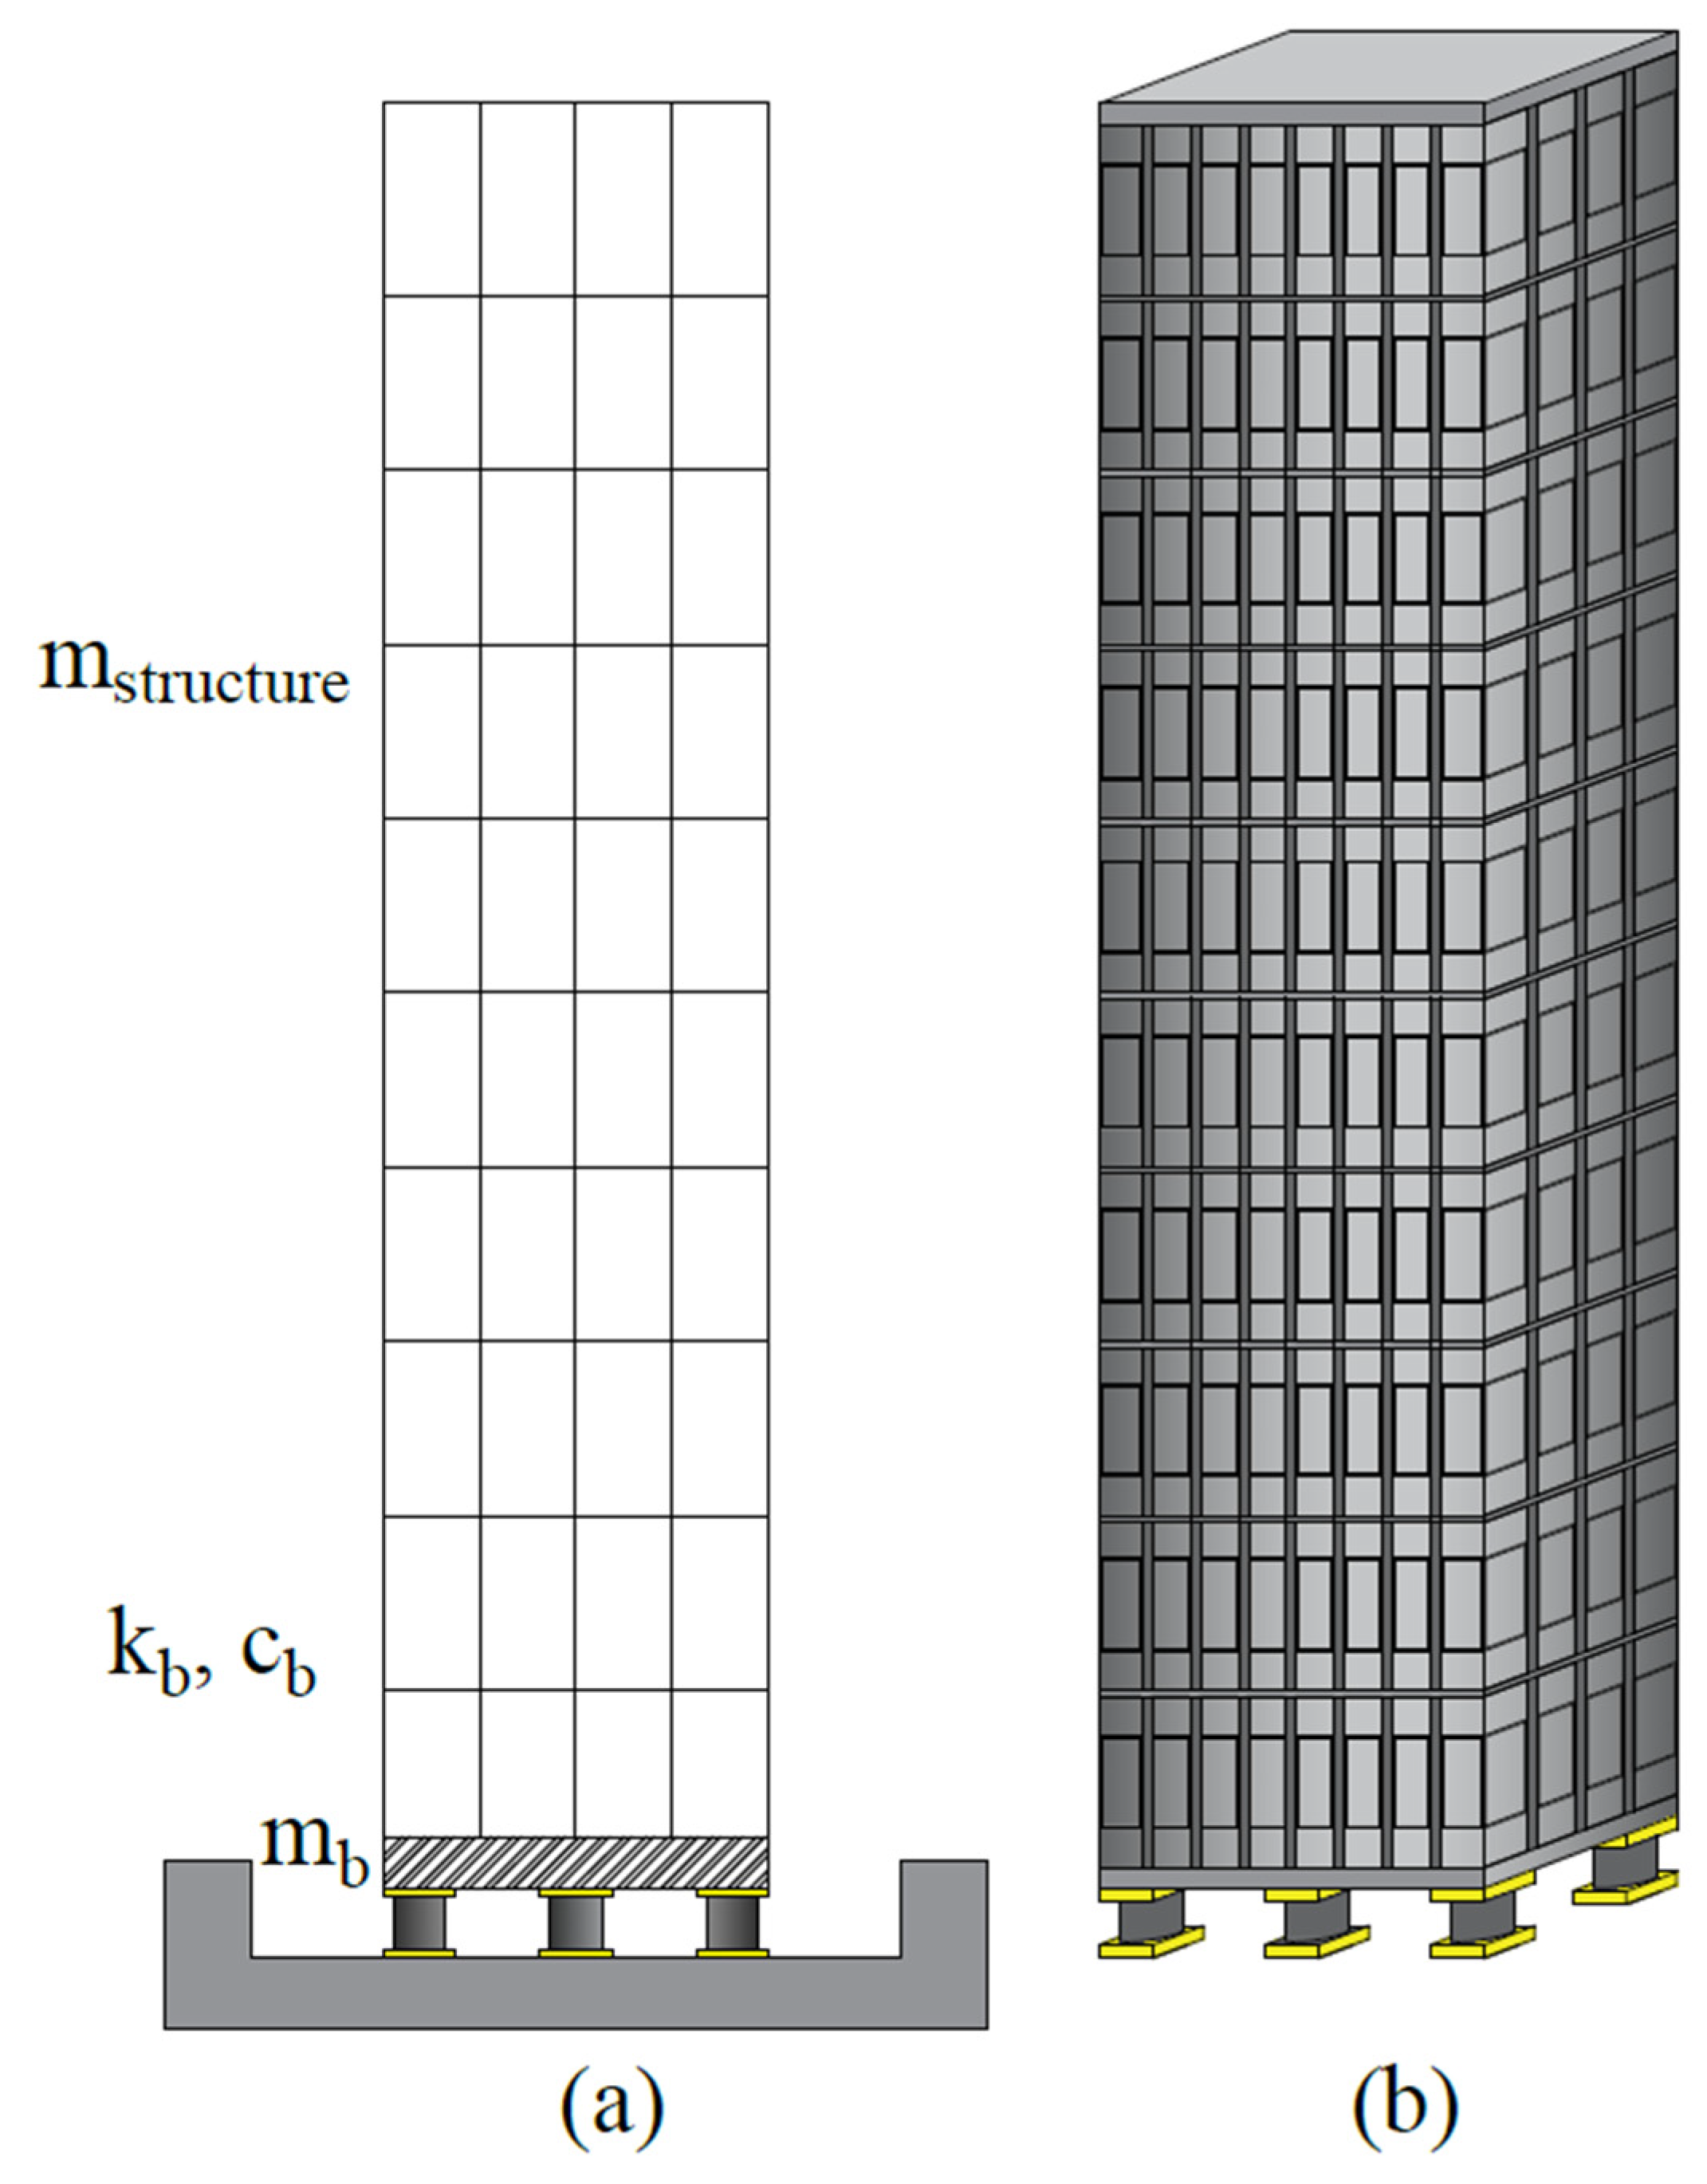
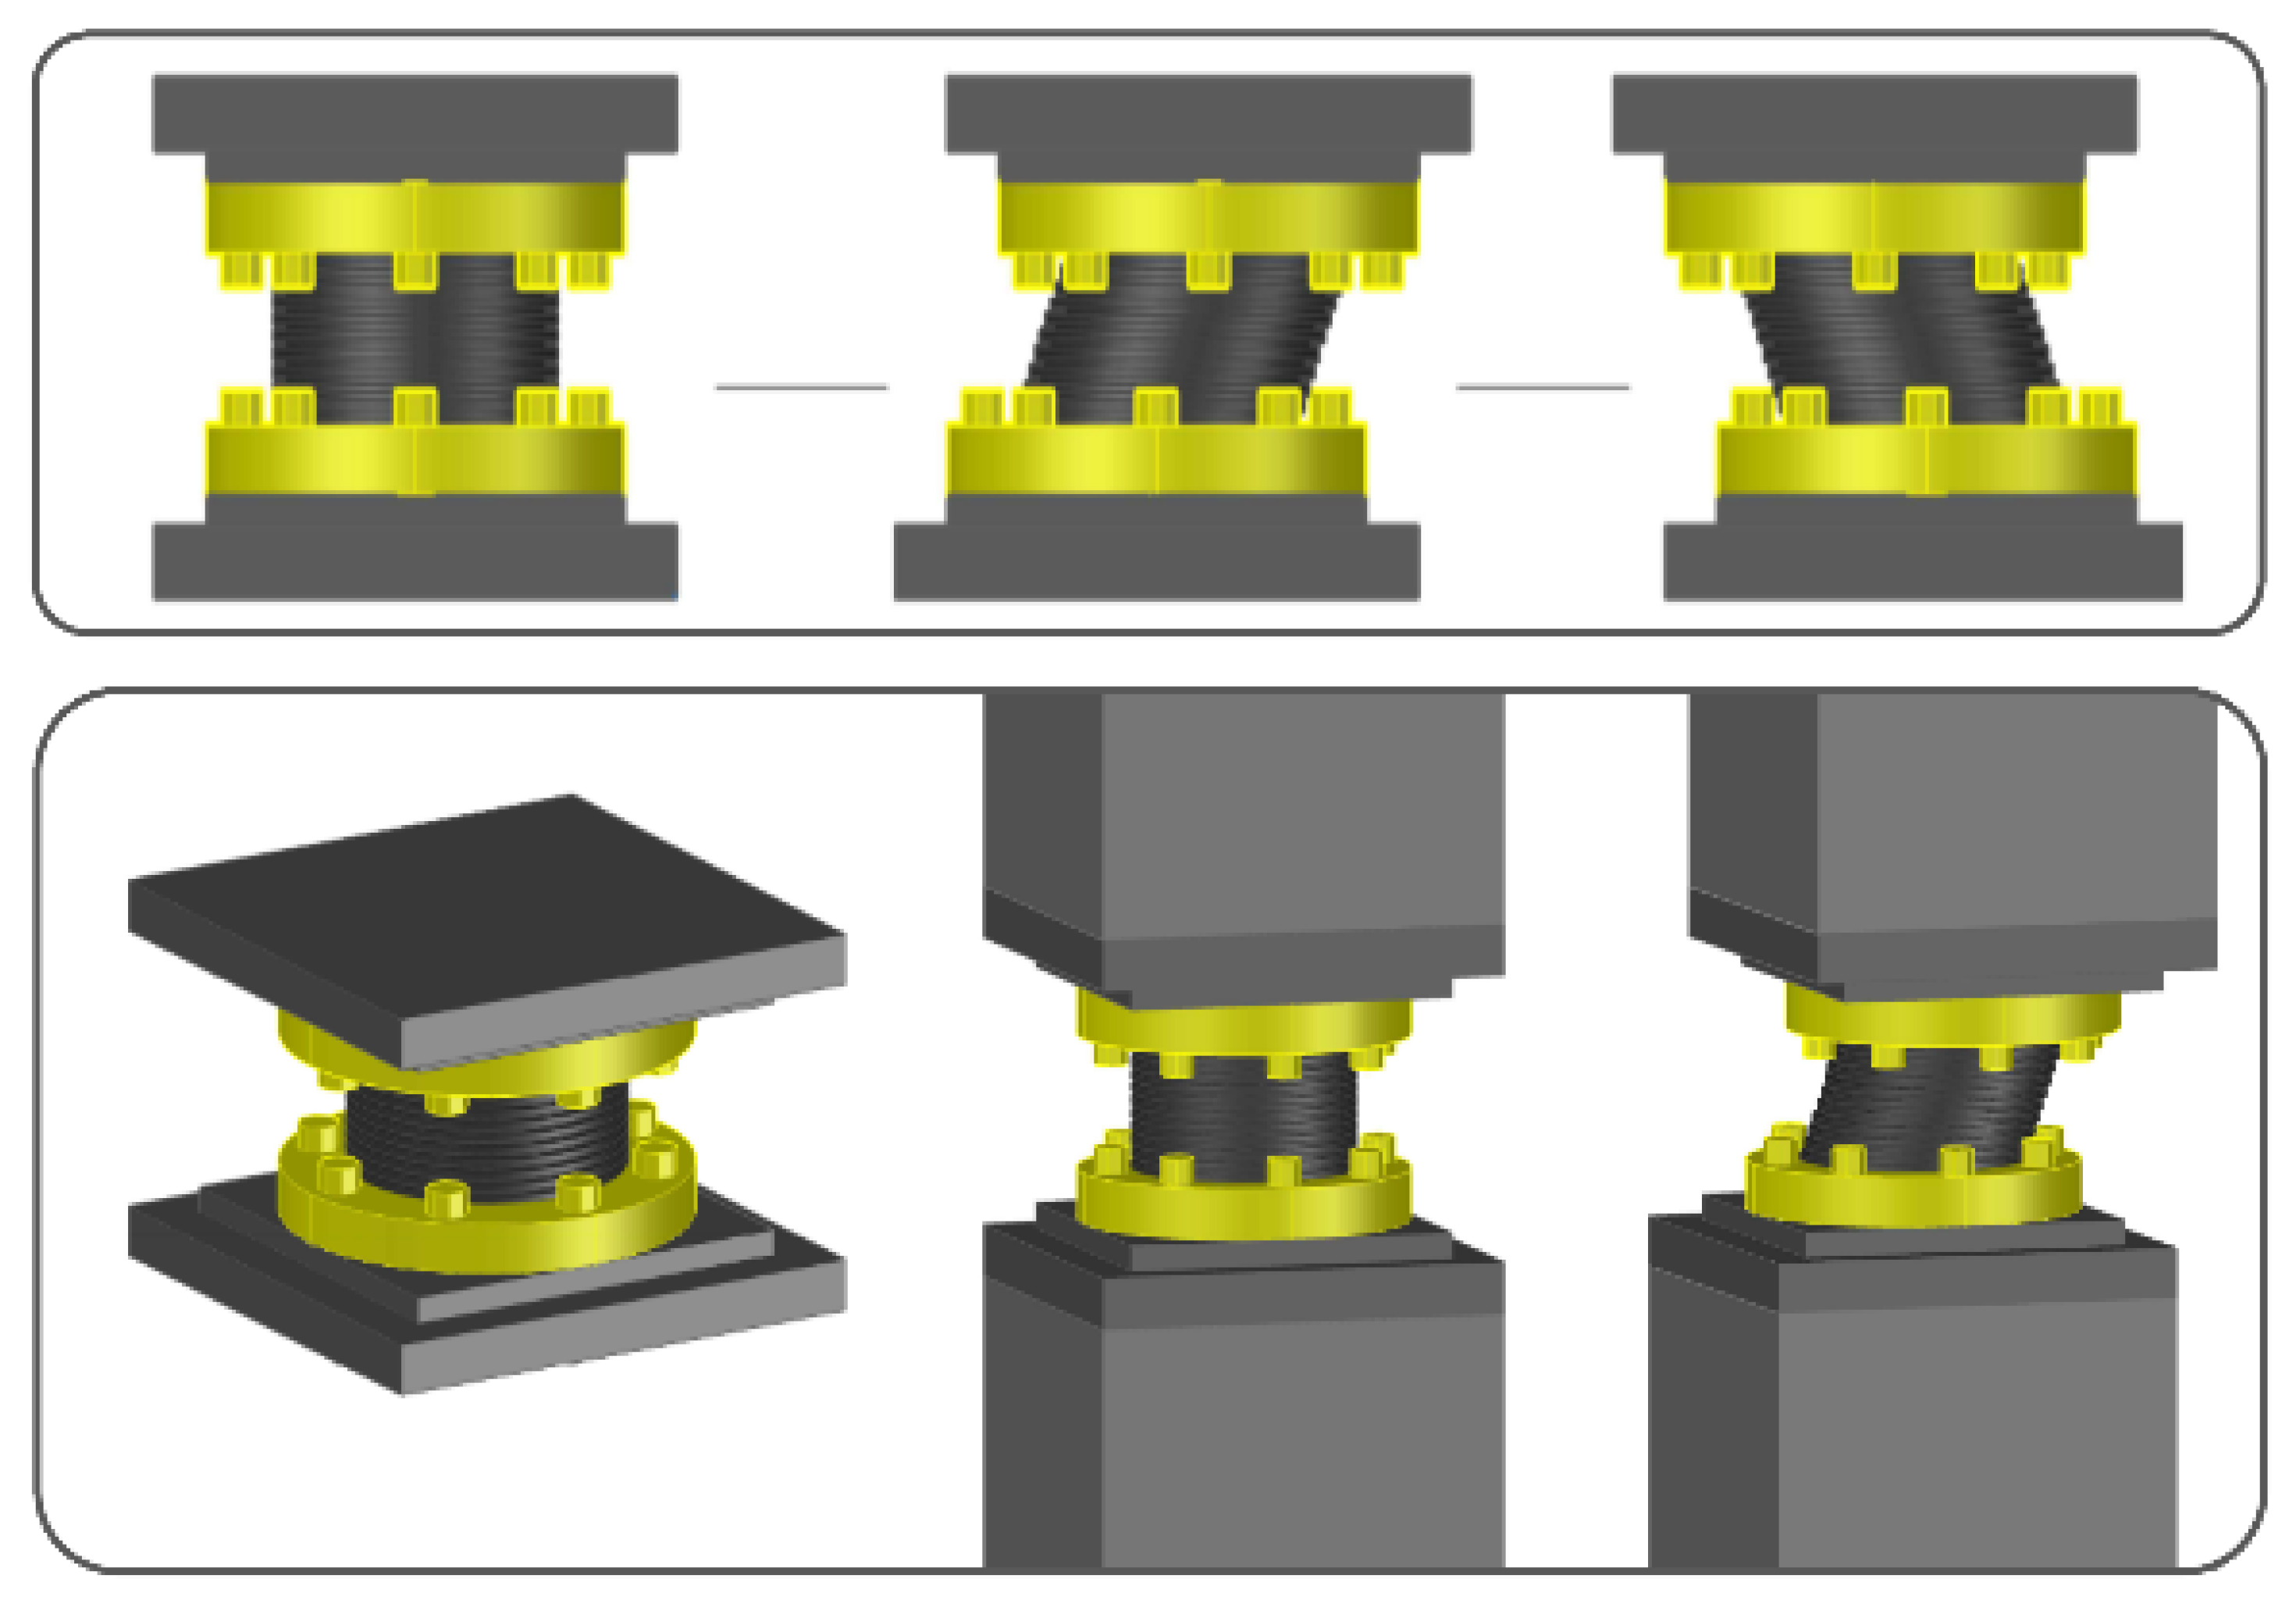
The base isolator was placed in a 10-story structure assumed to be an single degree of freedom (SDOF) system theoretical building where the superstructure was considered rigid. The isolator weight of the theoretical building and the weight of each floor were 360 tons, the floor stiffnesses were 650 MN/m, and the damping coefficients were 6.2 MNs/m [55]. Figure 1 shows the structure model with seismic isolators, and Figure 2 shows the representative movement of the isolator. The superstructure was idealized as rigid and modeled as an SDOF system to serve as a simplified benchmark, allowing clear interpretation of isolation parameter effects. This assumption neglects higher-mode contributions and detailed superstructure–isolation interaction; therefore, the results are intended to illustrate general trends rather than provide direct design values for complex multi degree of freedom (MDOF) structures.

4. Model Validation

The isolator structure model was optimized with the AHS algorithm with a 40 cm displacement limit and 30% and 50% damping limits. Optimum results were obtained by taking multi-objective optimization function weights in the range of 0–1 in the optimization. The optimum results for the different weights of the maximum acceleration and displacement are given in Table 3.
The critical earthquakes of the isolator system with a damping limit of 30% and a movement restriction of 40 cm, obtained with optimum design parameters, were the NORTHR/MUL009 and CHICHI/CHY101-N earthquake records, numbered 1 and 38, for the maximum displacement and acceleration values. In Table 4, the results of the critical earthquake analysis obtained according to the maximum displacement and the reduction percentages are given for values between zero and one of the acceleration coefficient (a) and displacement coefficient ( b ) in the objective function. In the earthquake record selected for the maximum acceleration of the isolator system, the results of the critical earthquake analysis are given in Table 5. The damping ratio was treated as a continuous design variable within the predefined bounds. In the case of a = 0.2 and b = 0.8, although the displacement was emphasized, the nonzero acceleration weight still influenced the objective function. For that specific weight combination, a slightly lower damping ratio provided a better balance between acceleration and displacement reduction, leading the optimizer to converge to ξ = 0.2683 instead of the upper bound. This outcome reflects the interaction between the weighted objectives rather than an inconsistency in the optimization process.
In the analyses conducted with the optimum parameters in the isolator system with a 50% damping limit and 40 cm displacement limit, earthquakes with maximum displacement and maximum total acceleration of the system were observed in the NORTHR/MUL279, DUZCE/BOL090, and CHICHI/CHY10-N records, numbered as 2, 6, and 38, respectively. According to the change in objective function coefficients, the results of the earthquake analysis critical for the displacement of the 50% damped system are given in Table 6, and the results obtained from the earthquake analysis critical for the maximum acceleration are given in Table 7.
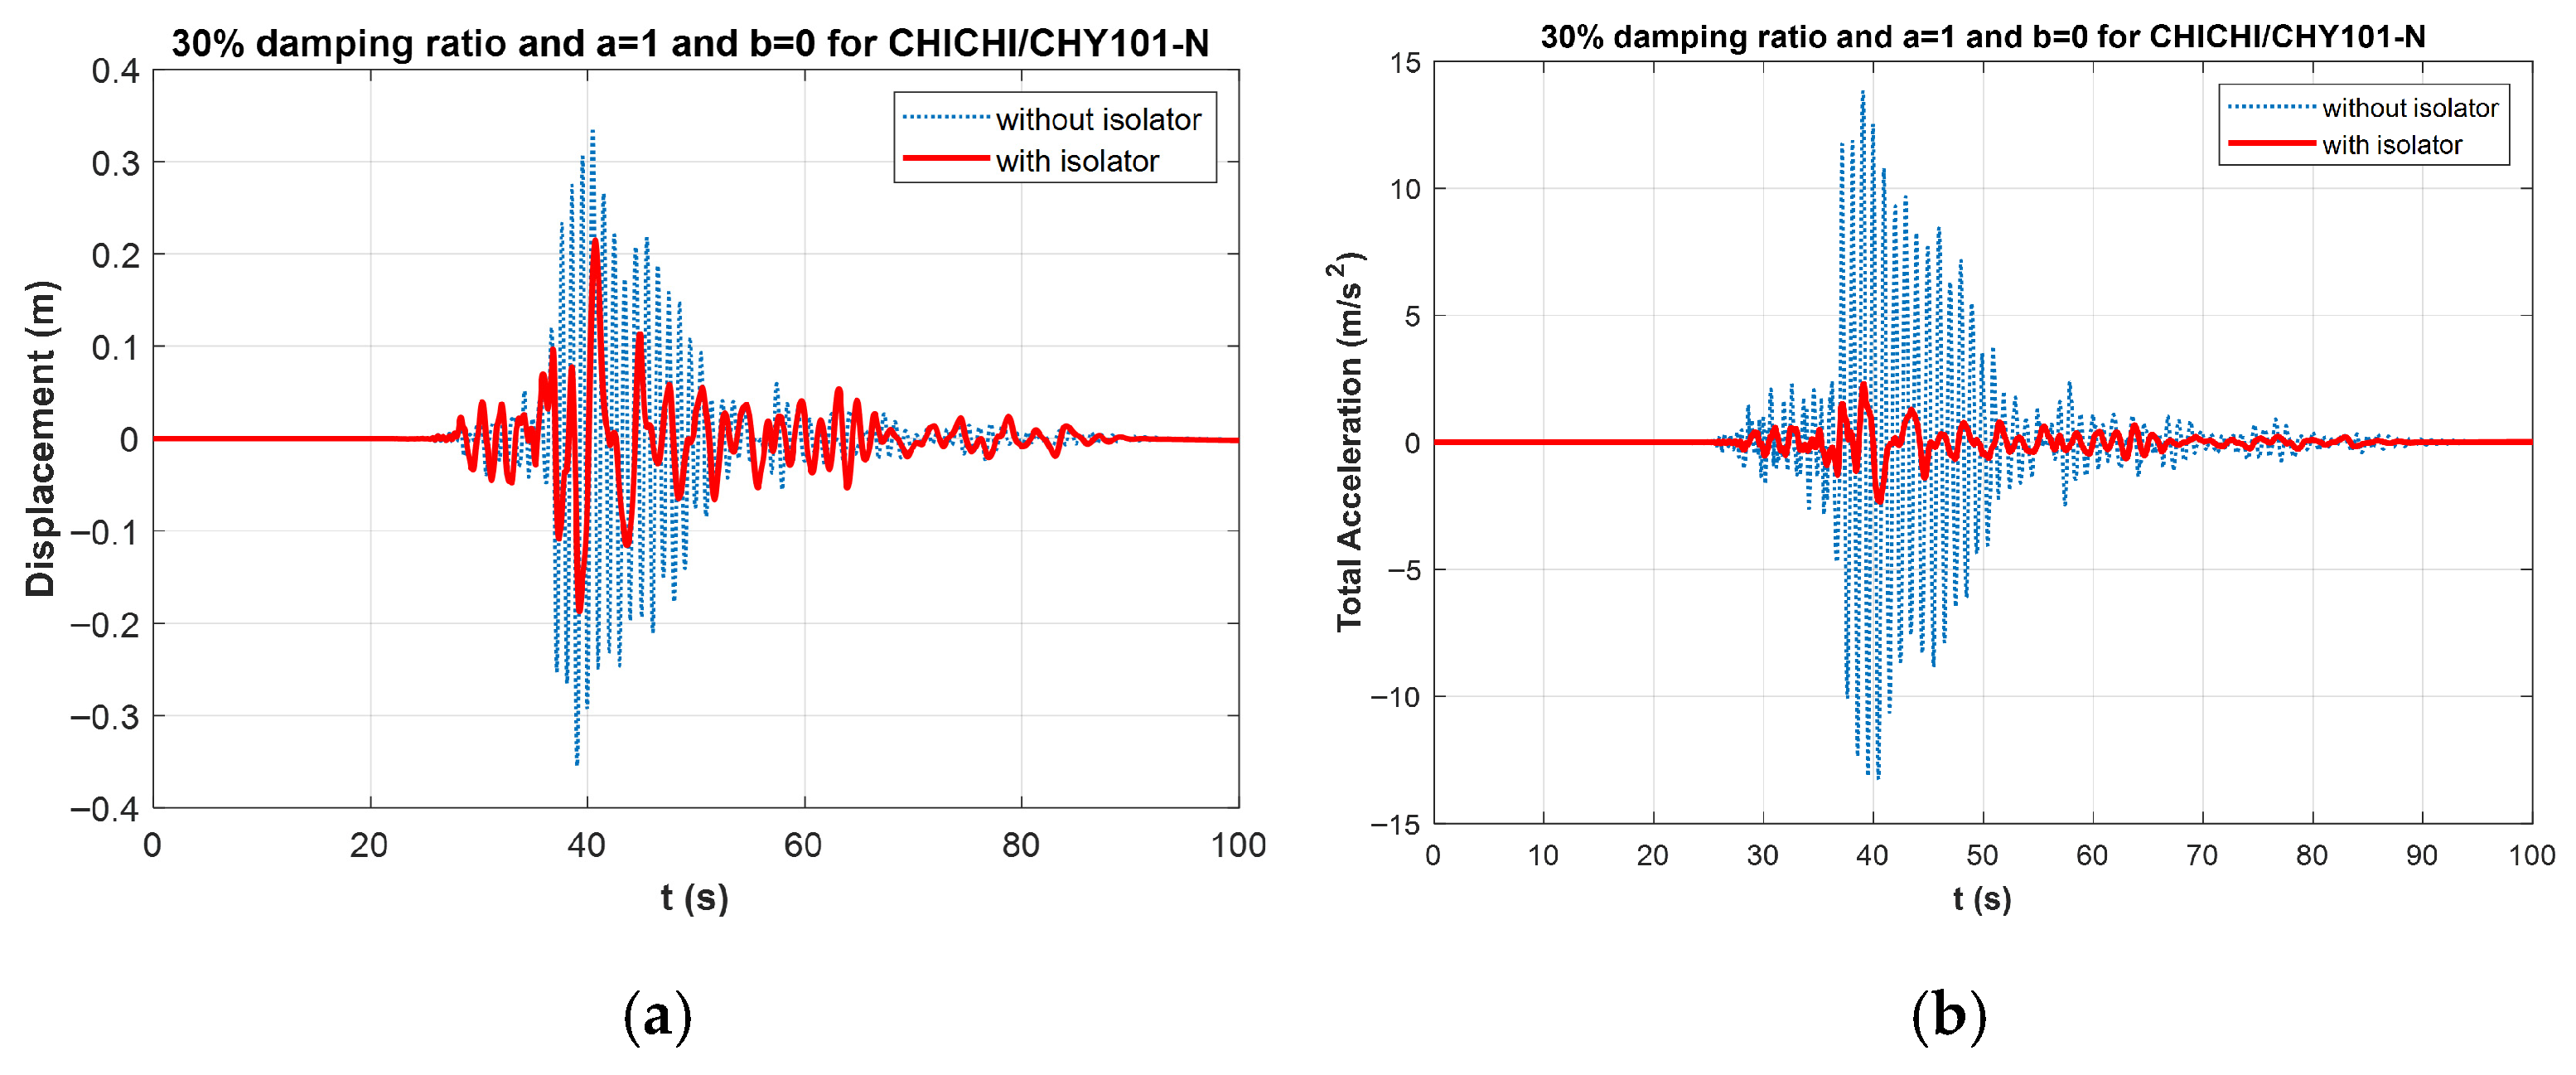
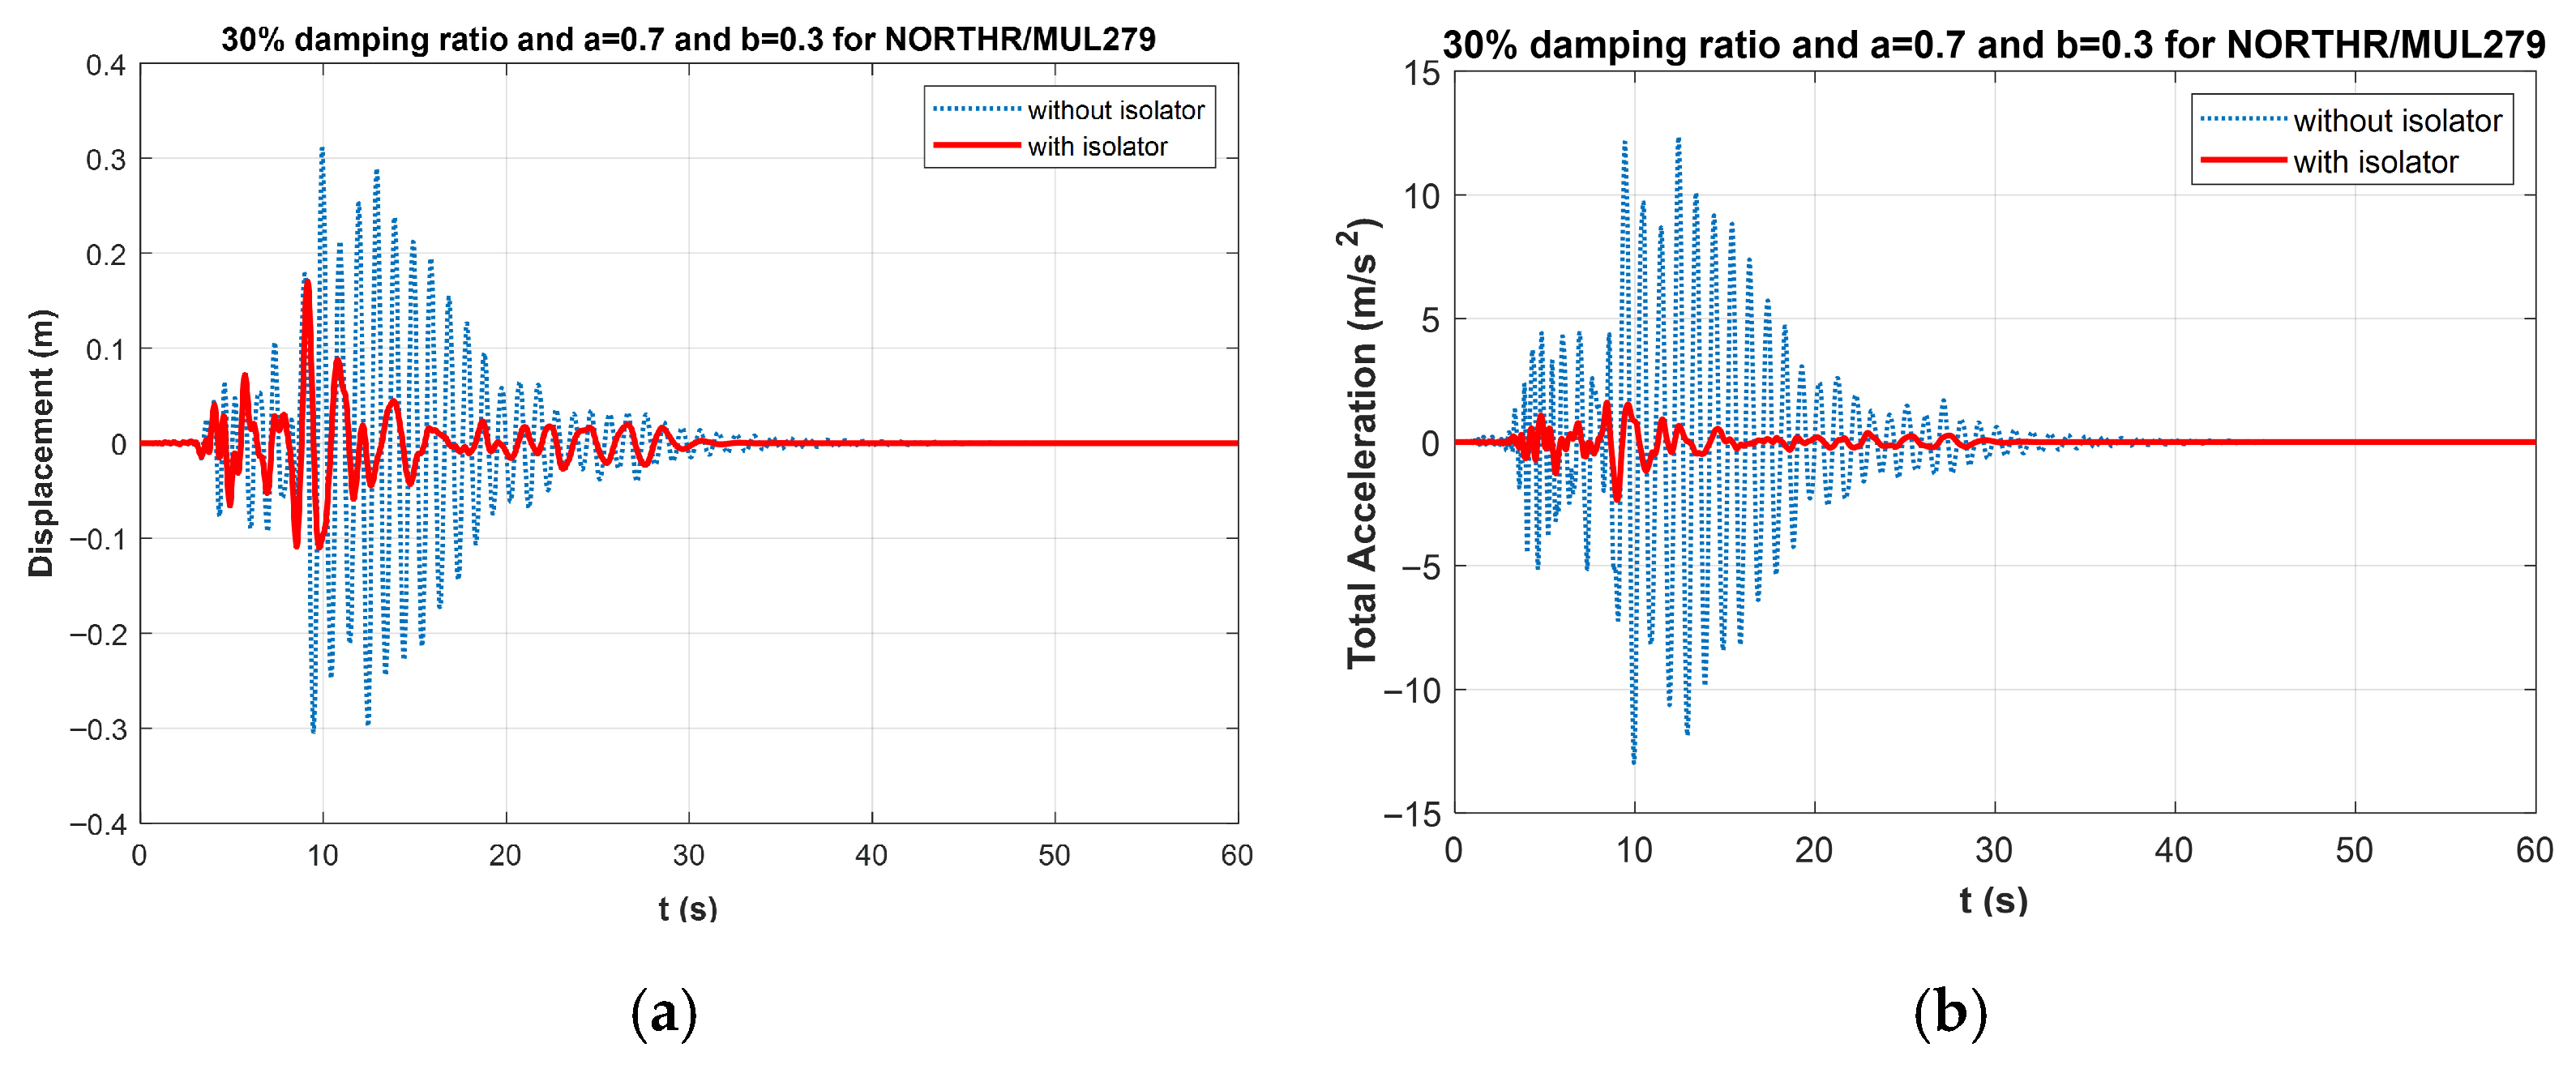
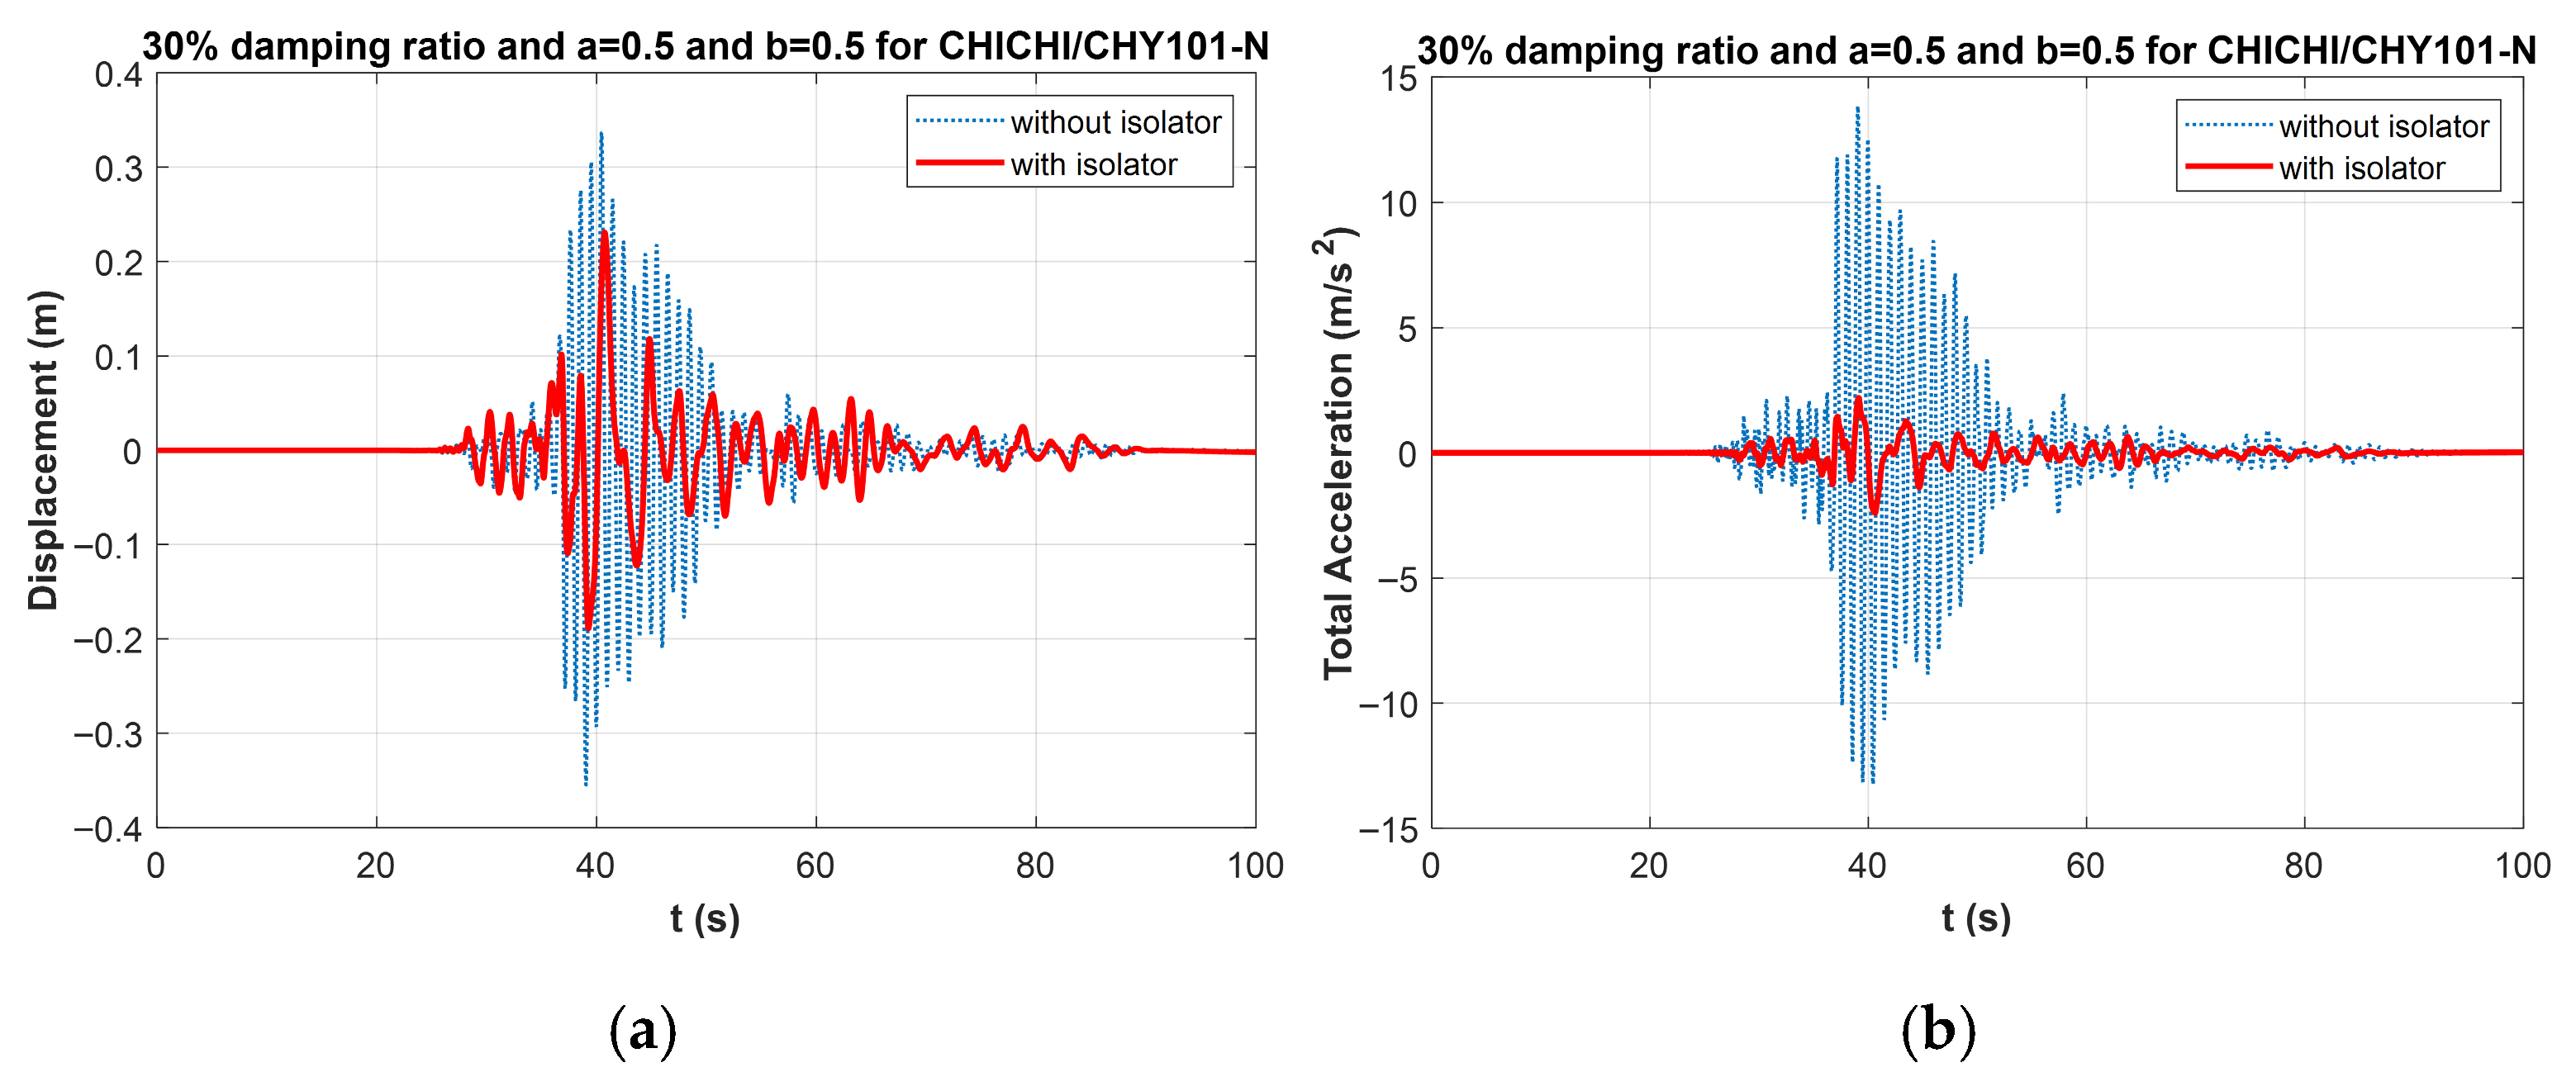
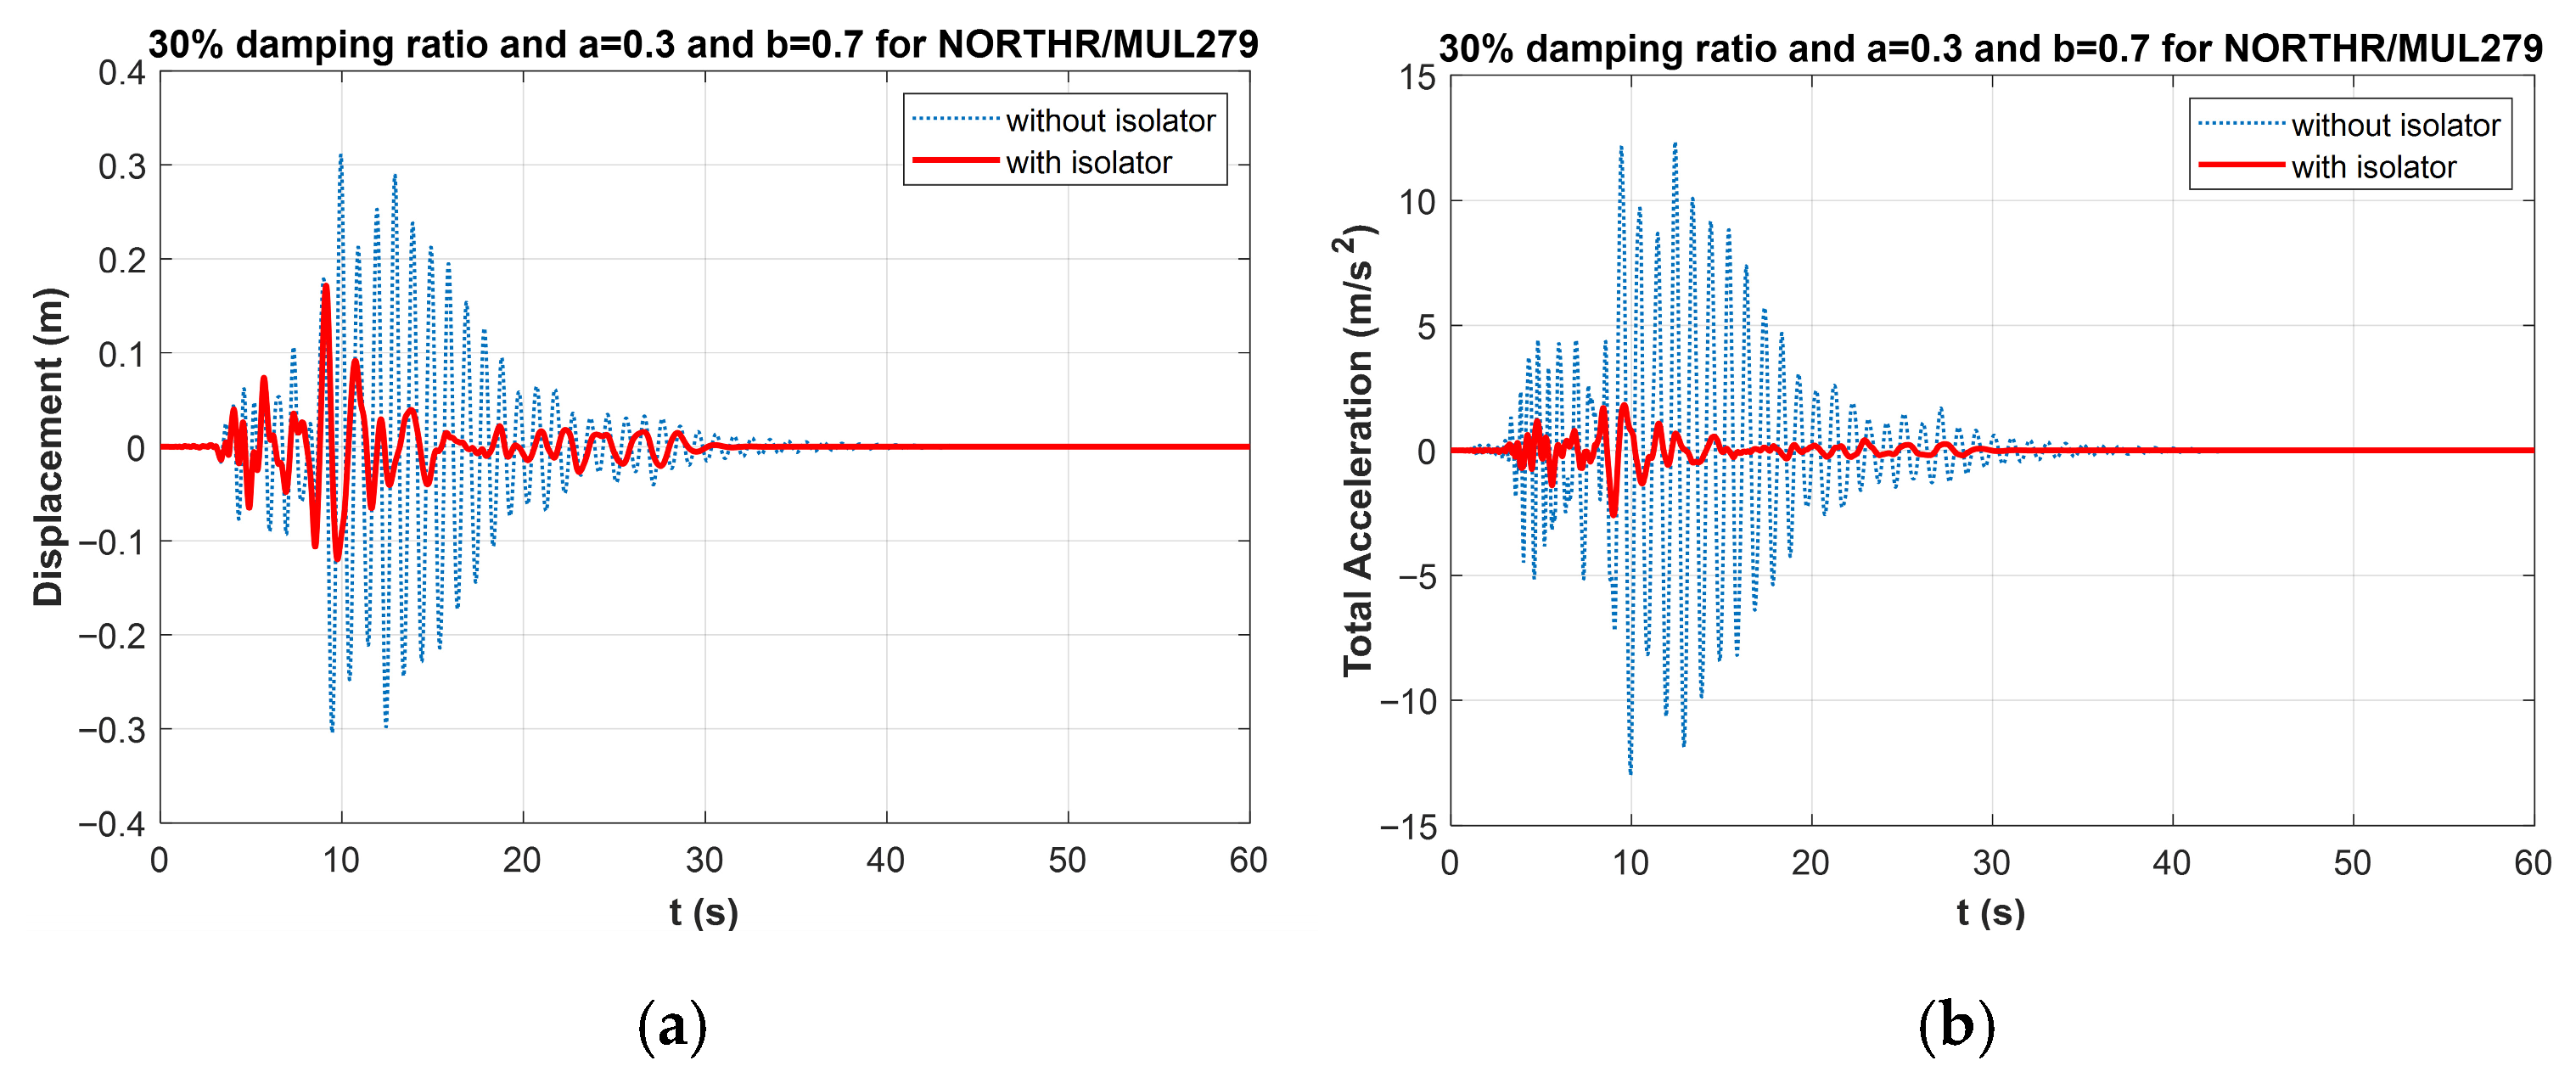
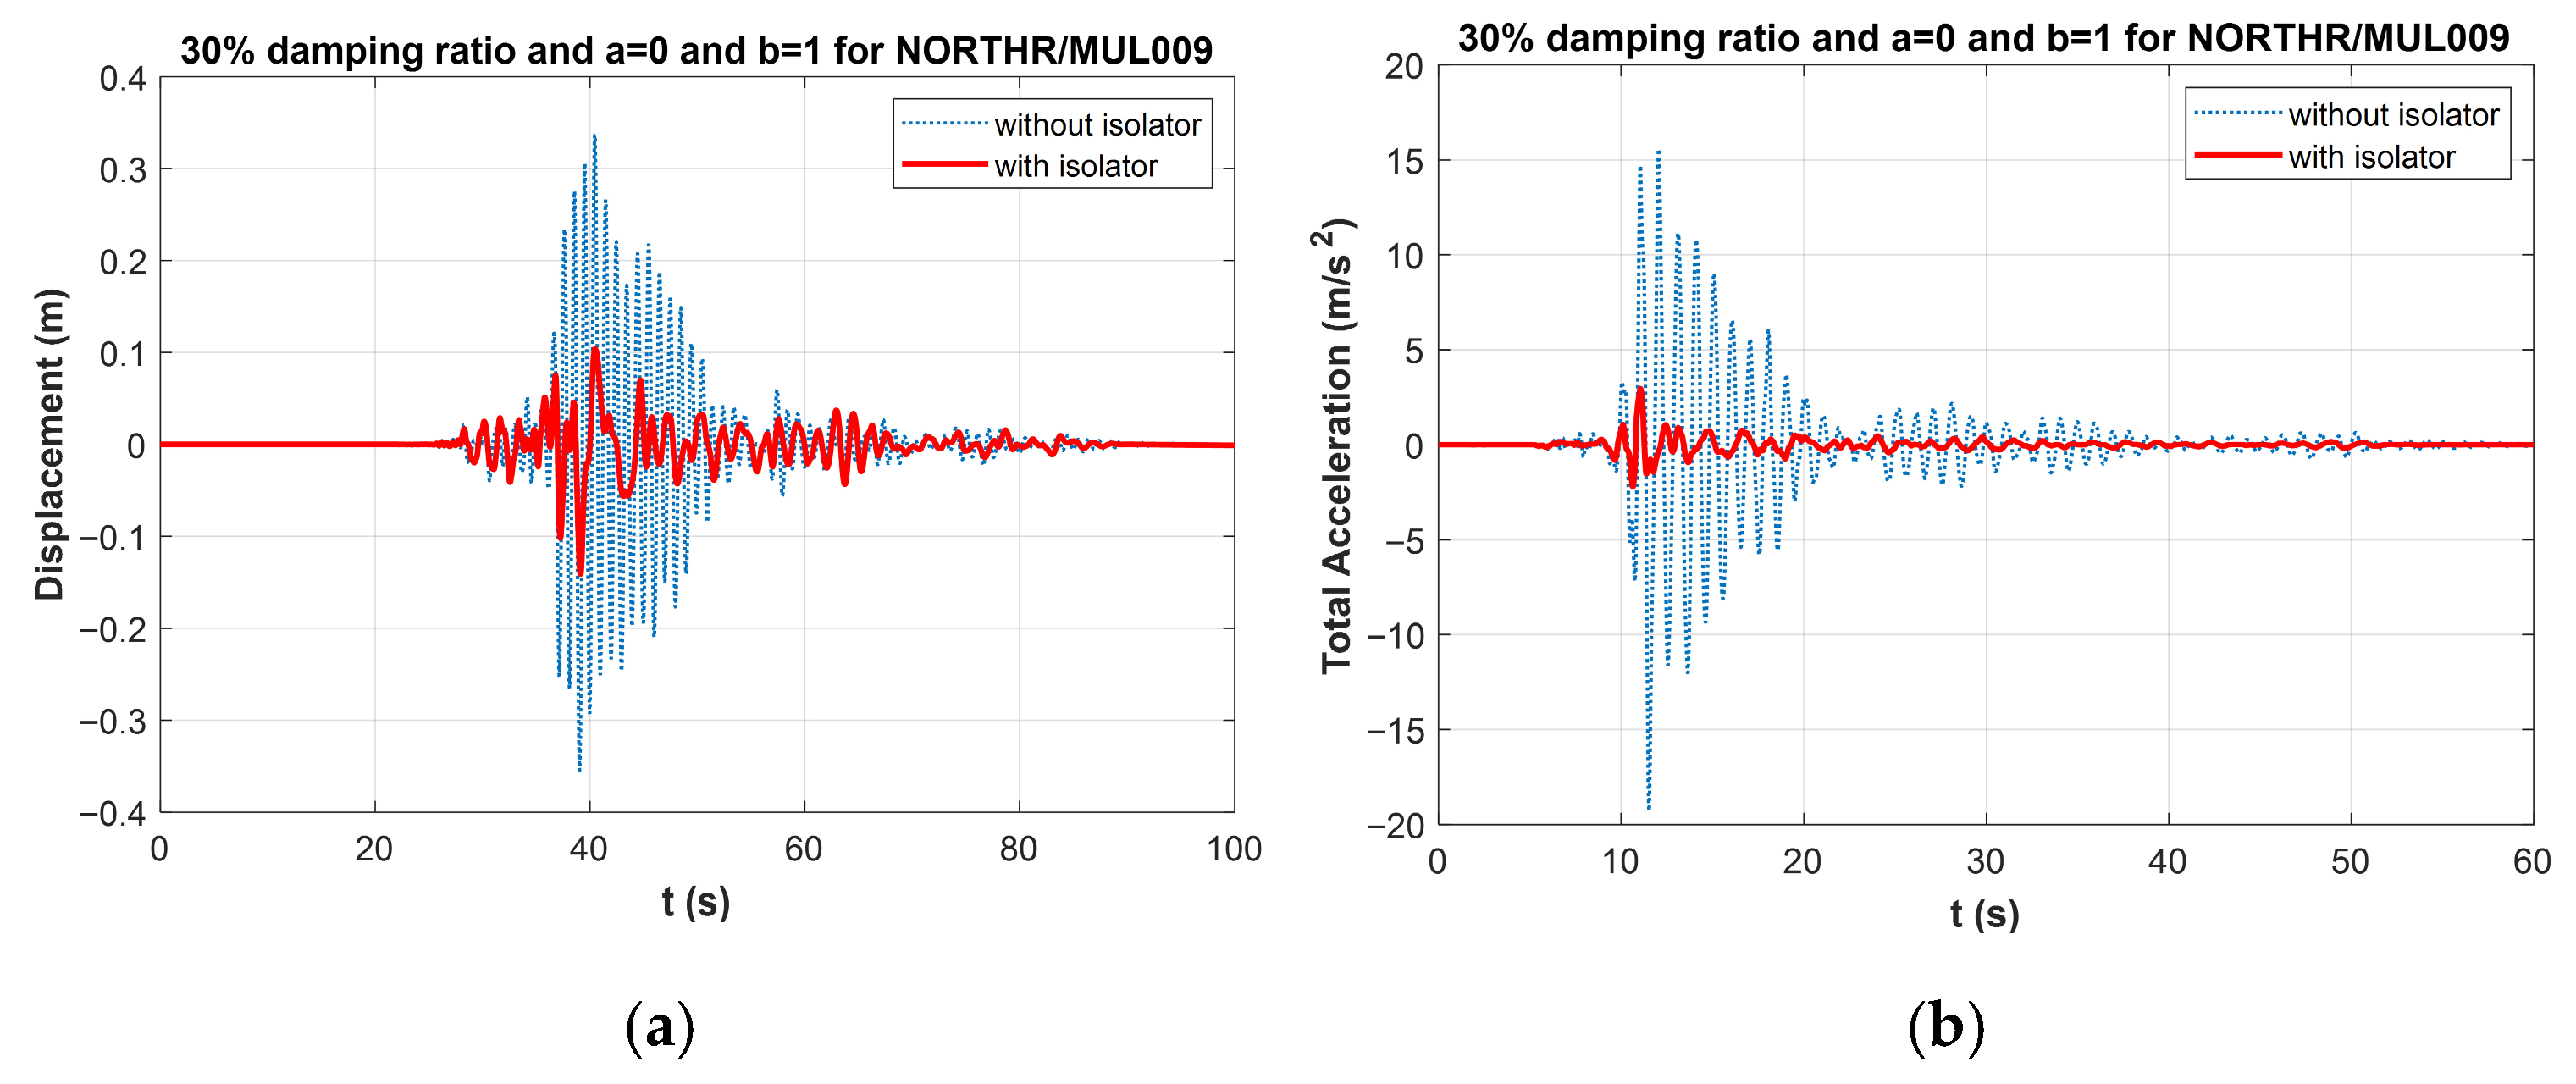
As a result of the critical earthquake analyses conducted with an earthquake based on the most critical acceleration in the system with a 30% damping limit, displacement–time and total acceleration–time graphs for which the acceleration effect value was 1 are shown in Figure 3, and the graphs where the effect values were 0.7, 0.5, 0.3, and 0 are shown in Figure 4, Figure 5, Figure 6 and Figure 7.
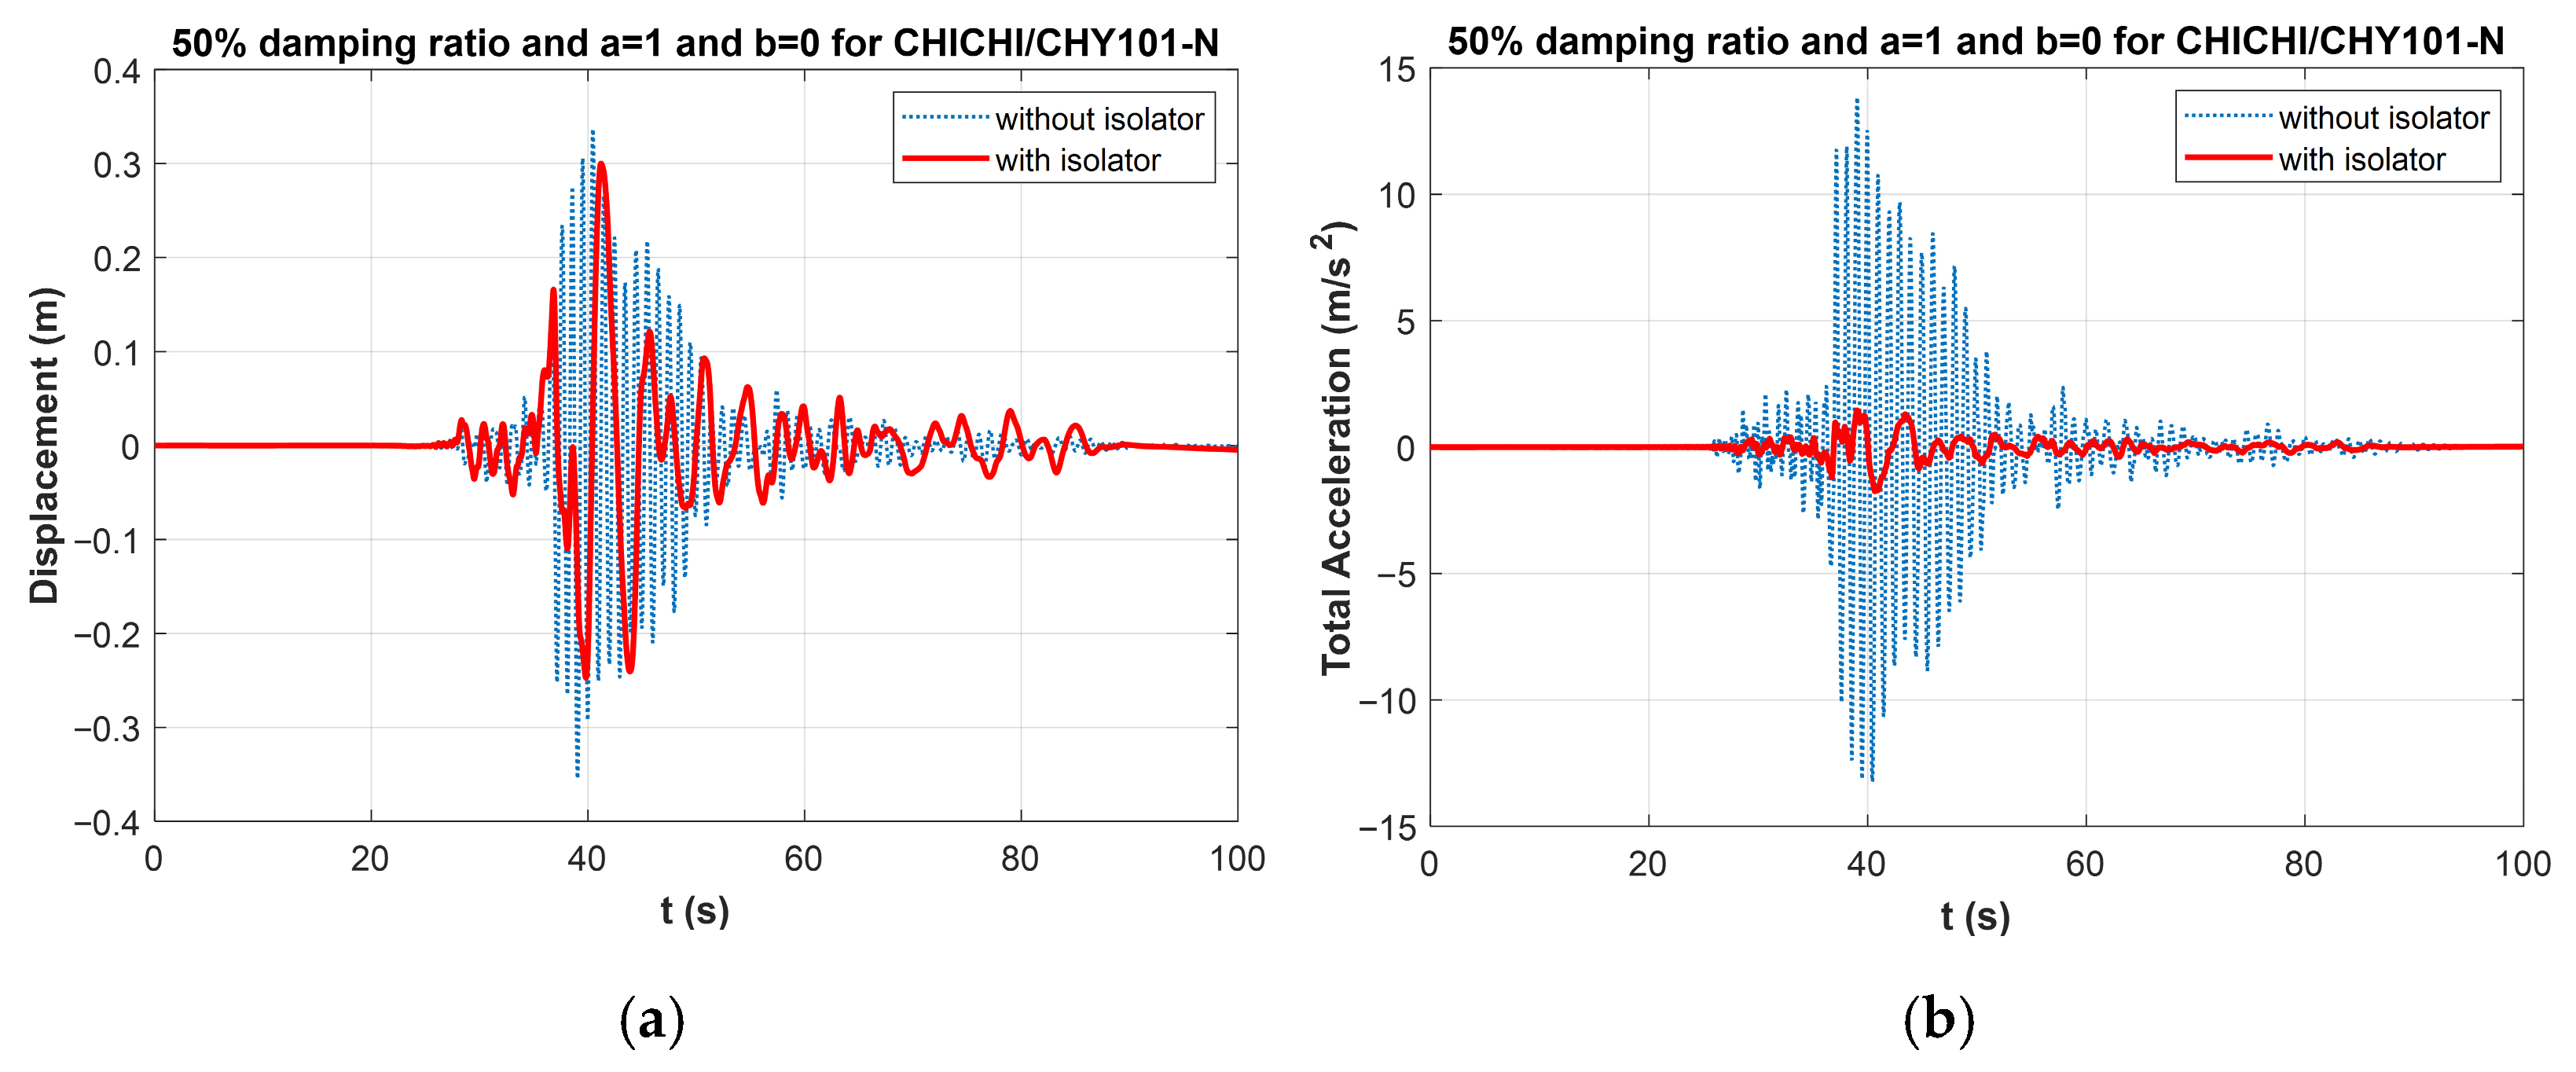
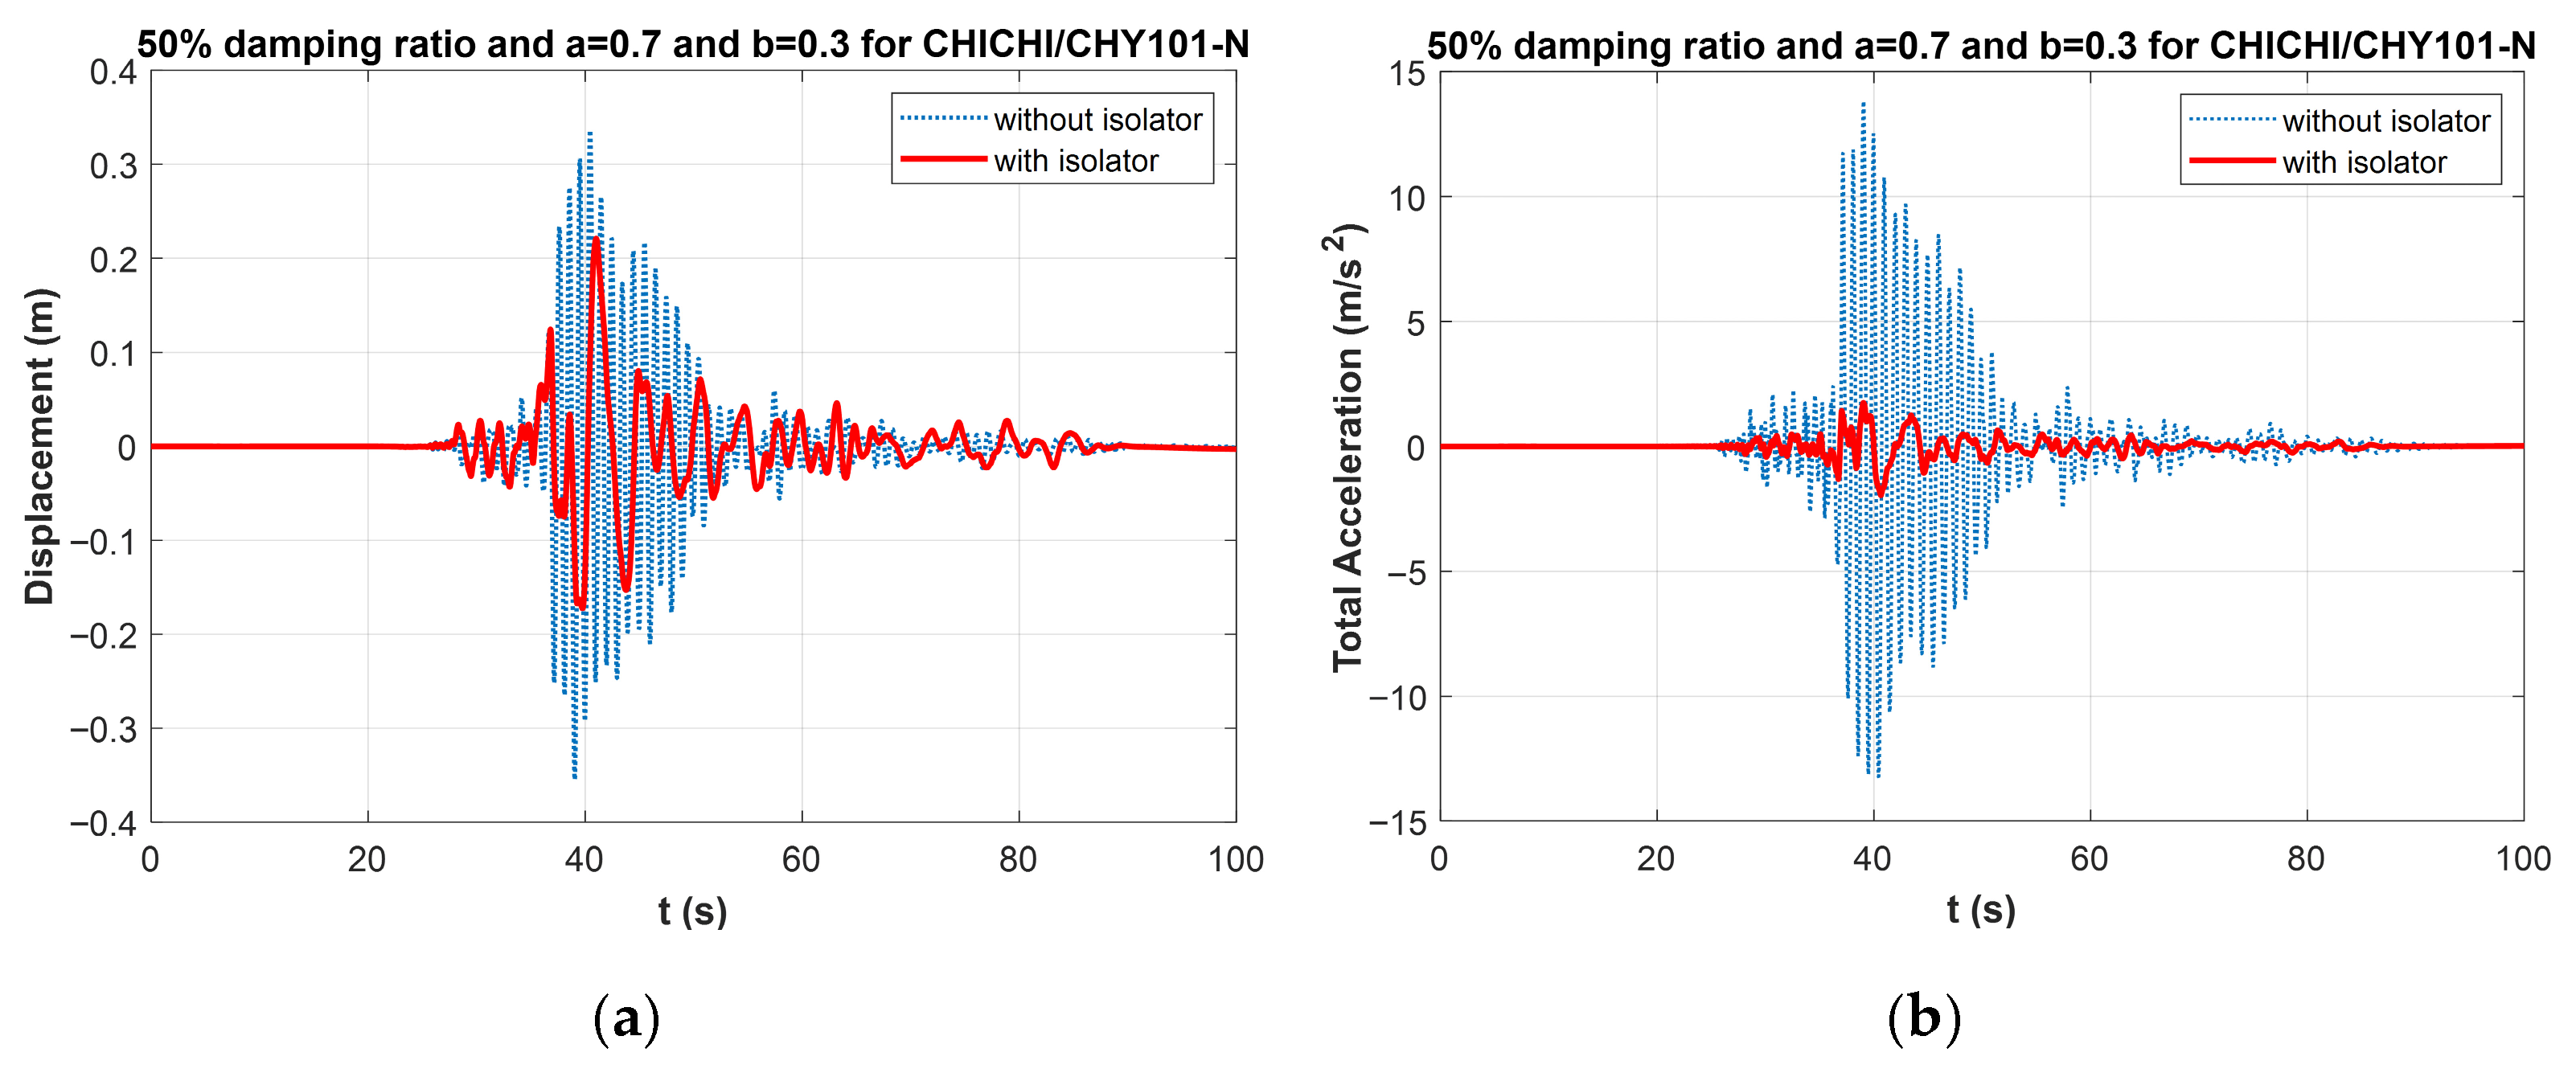
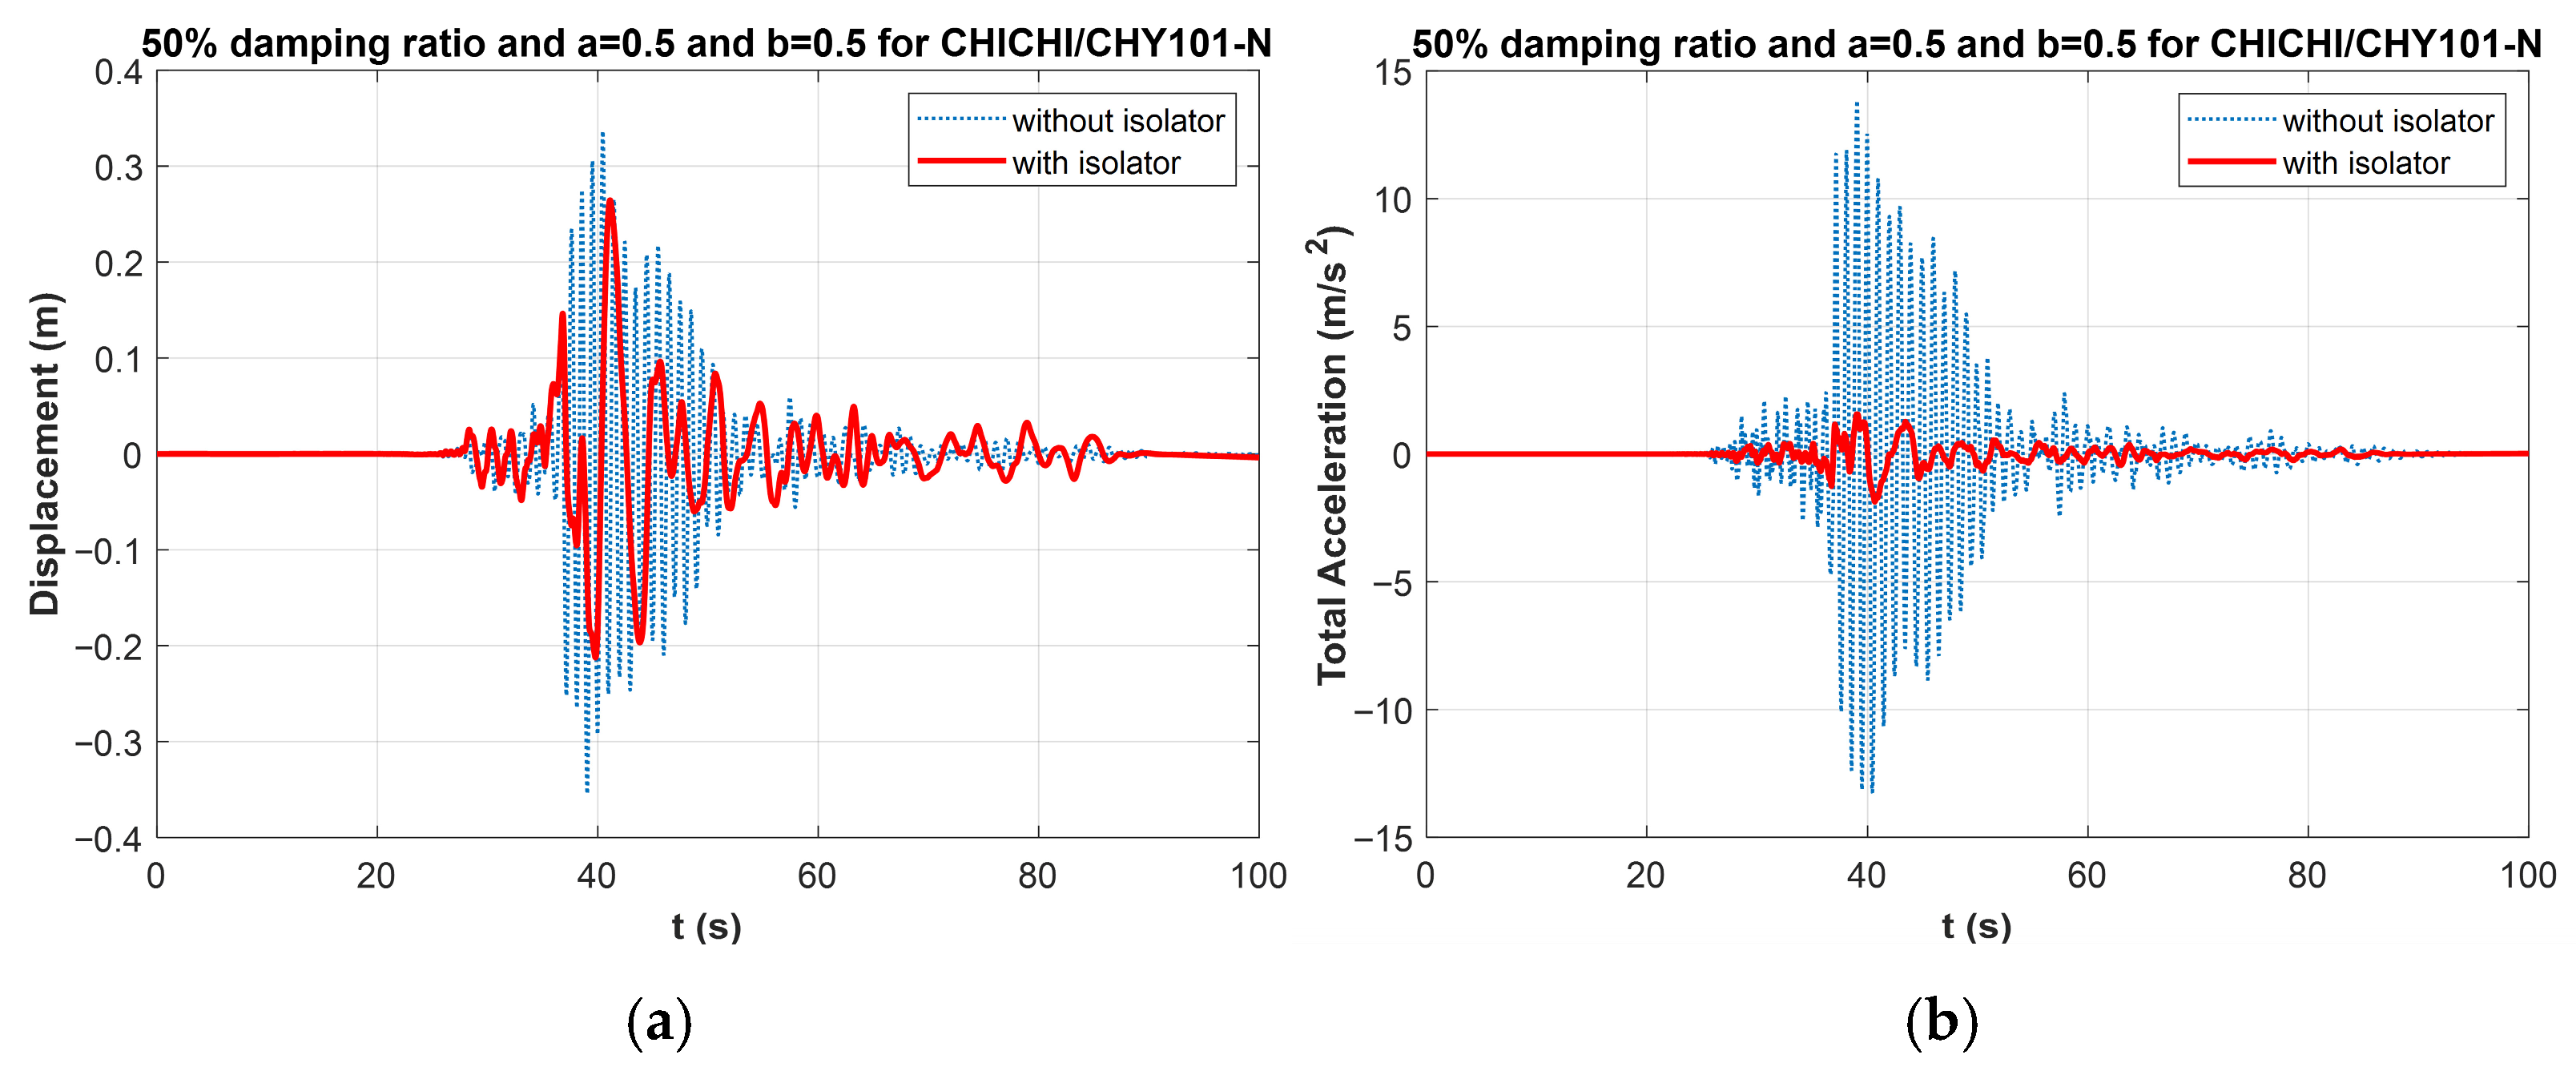
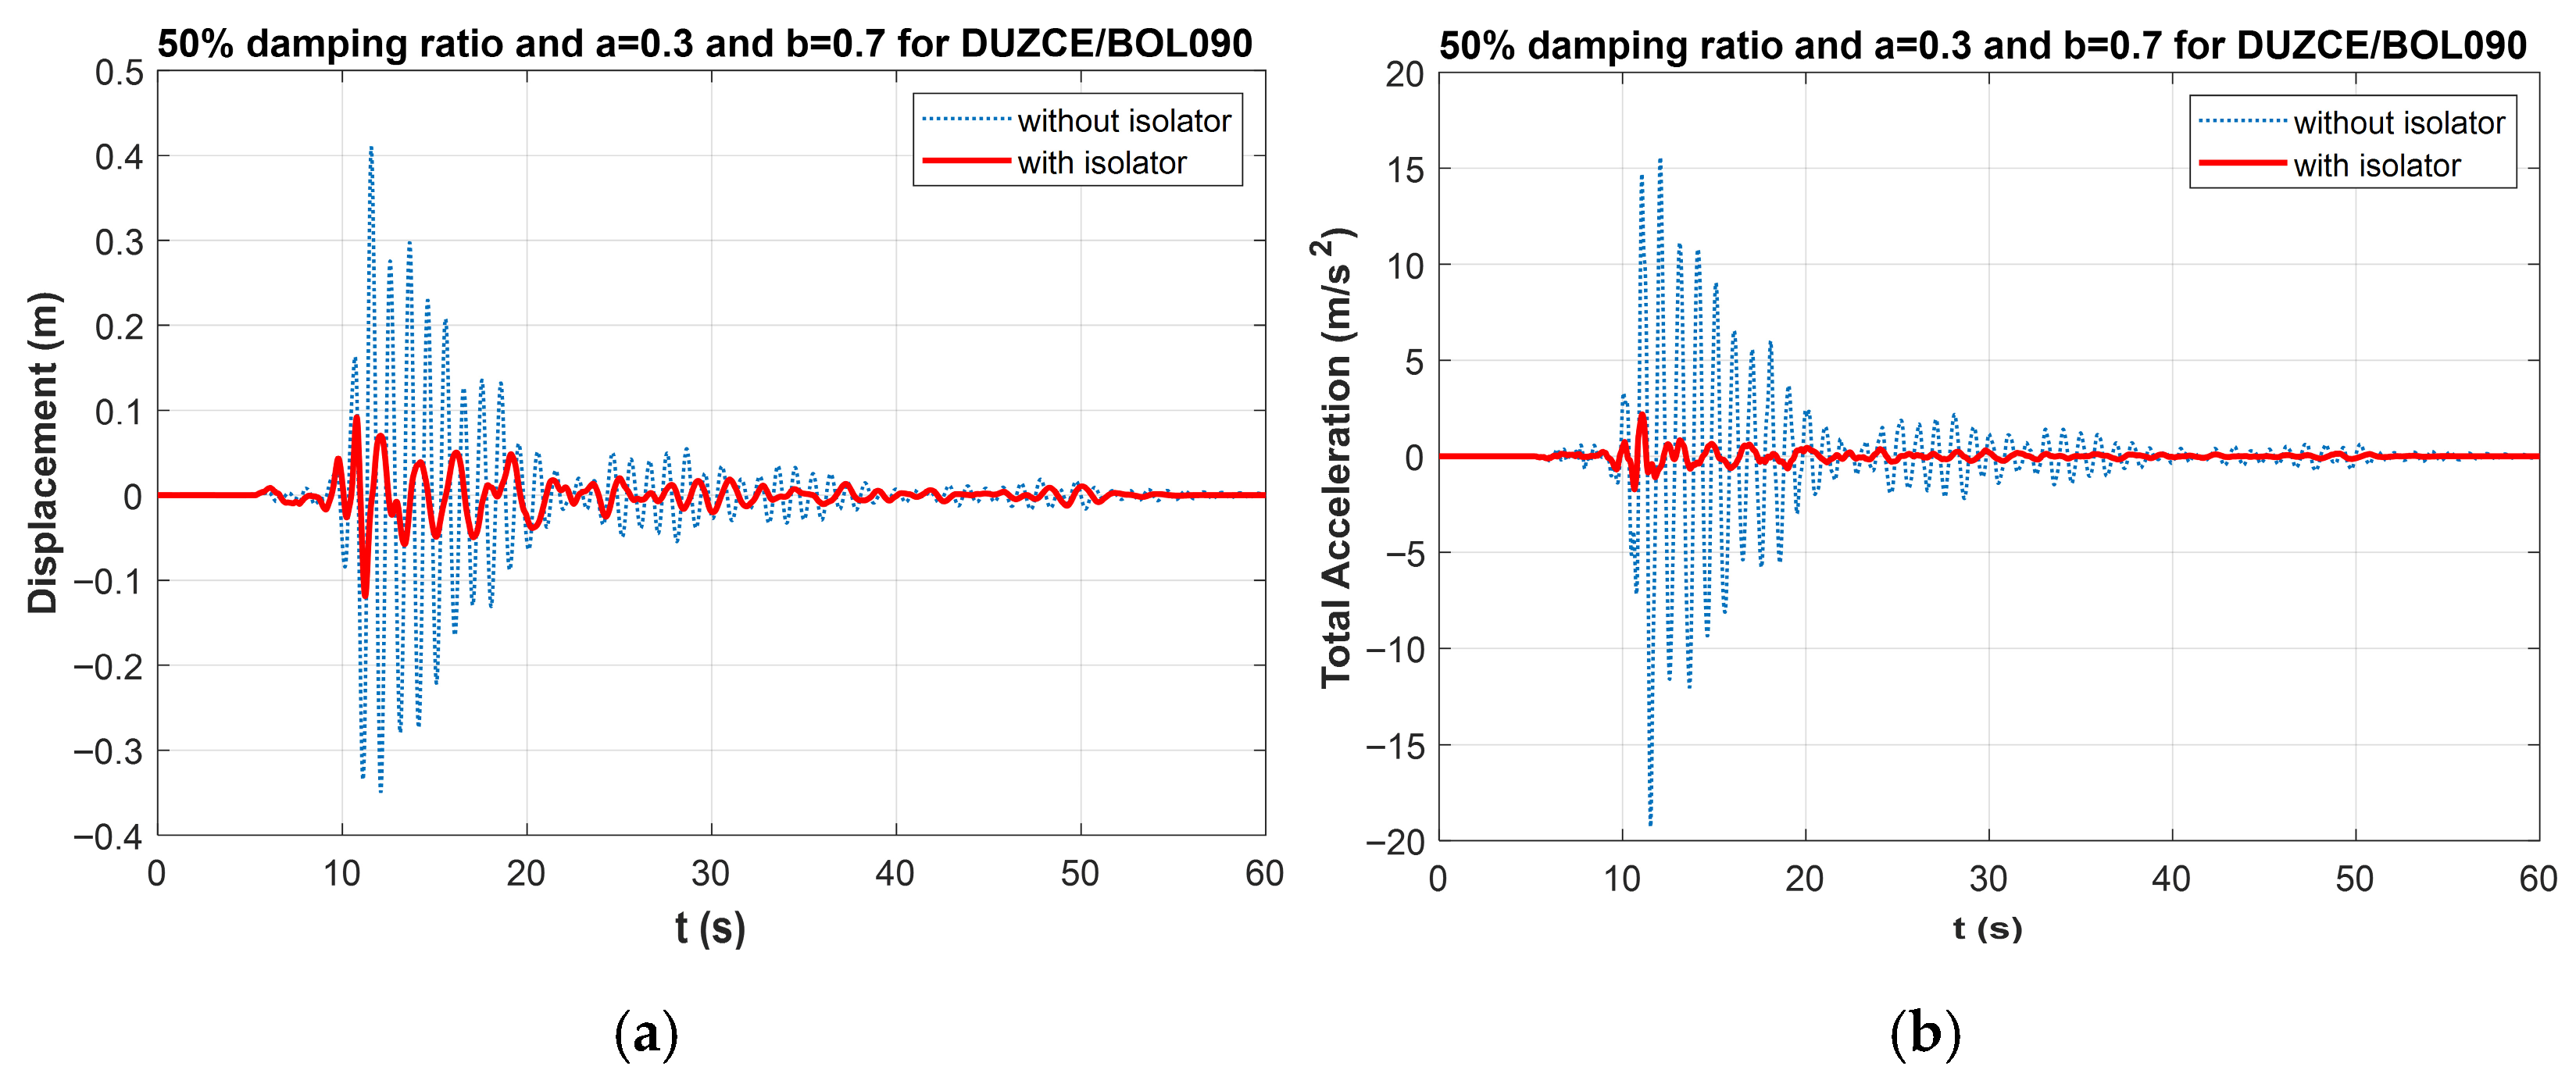
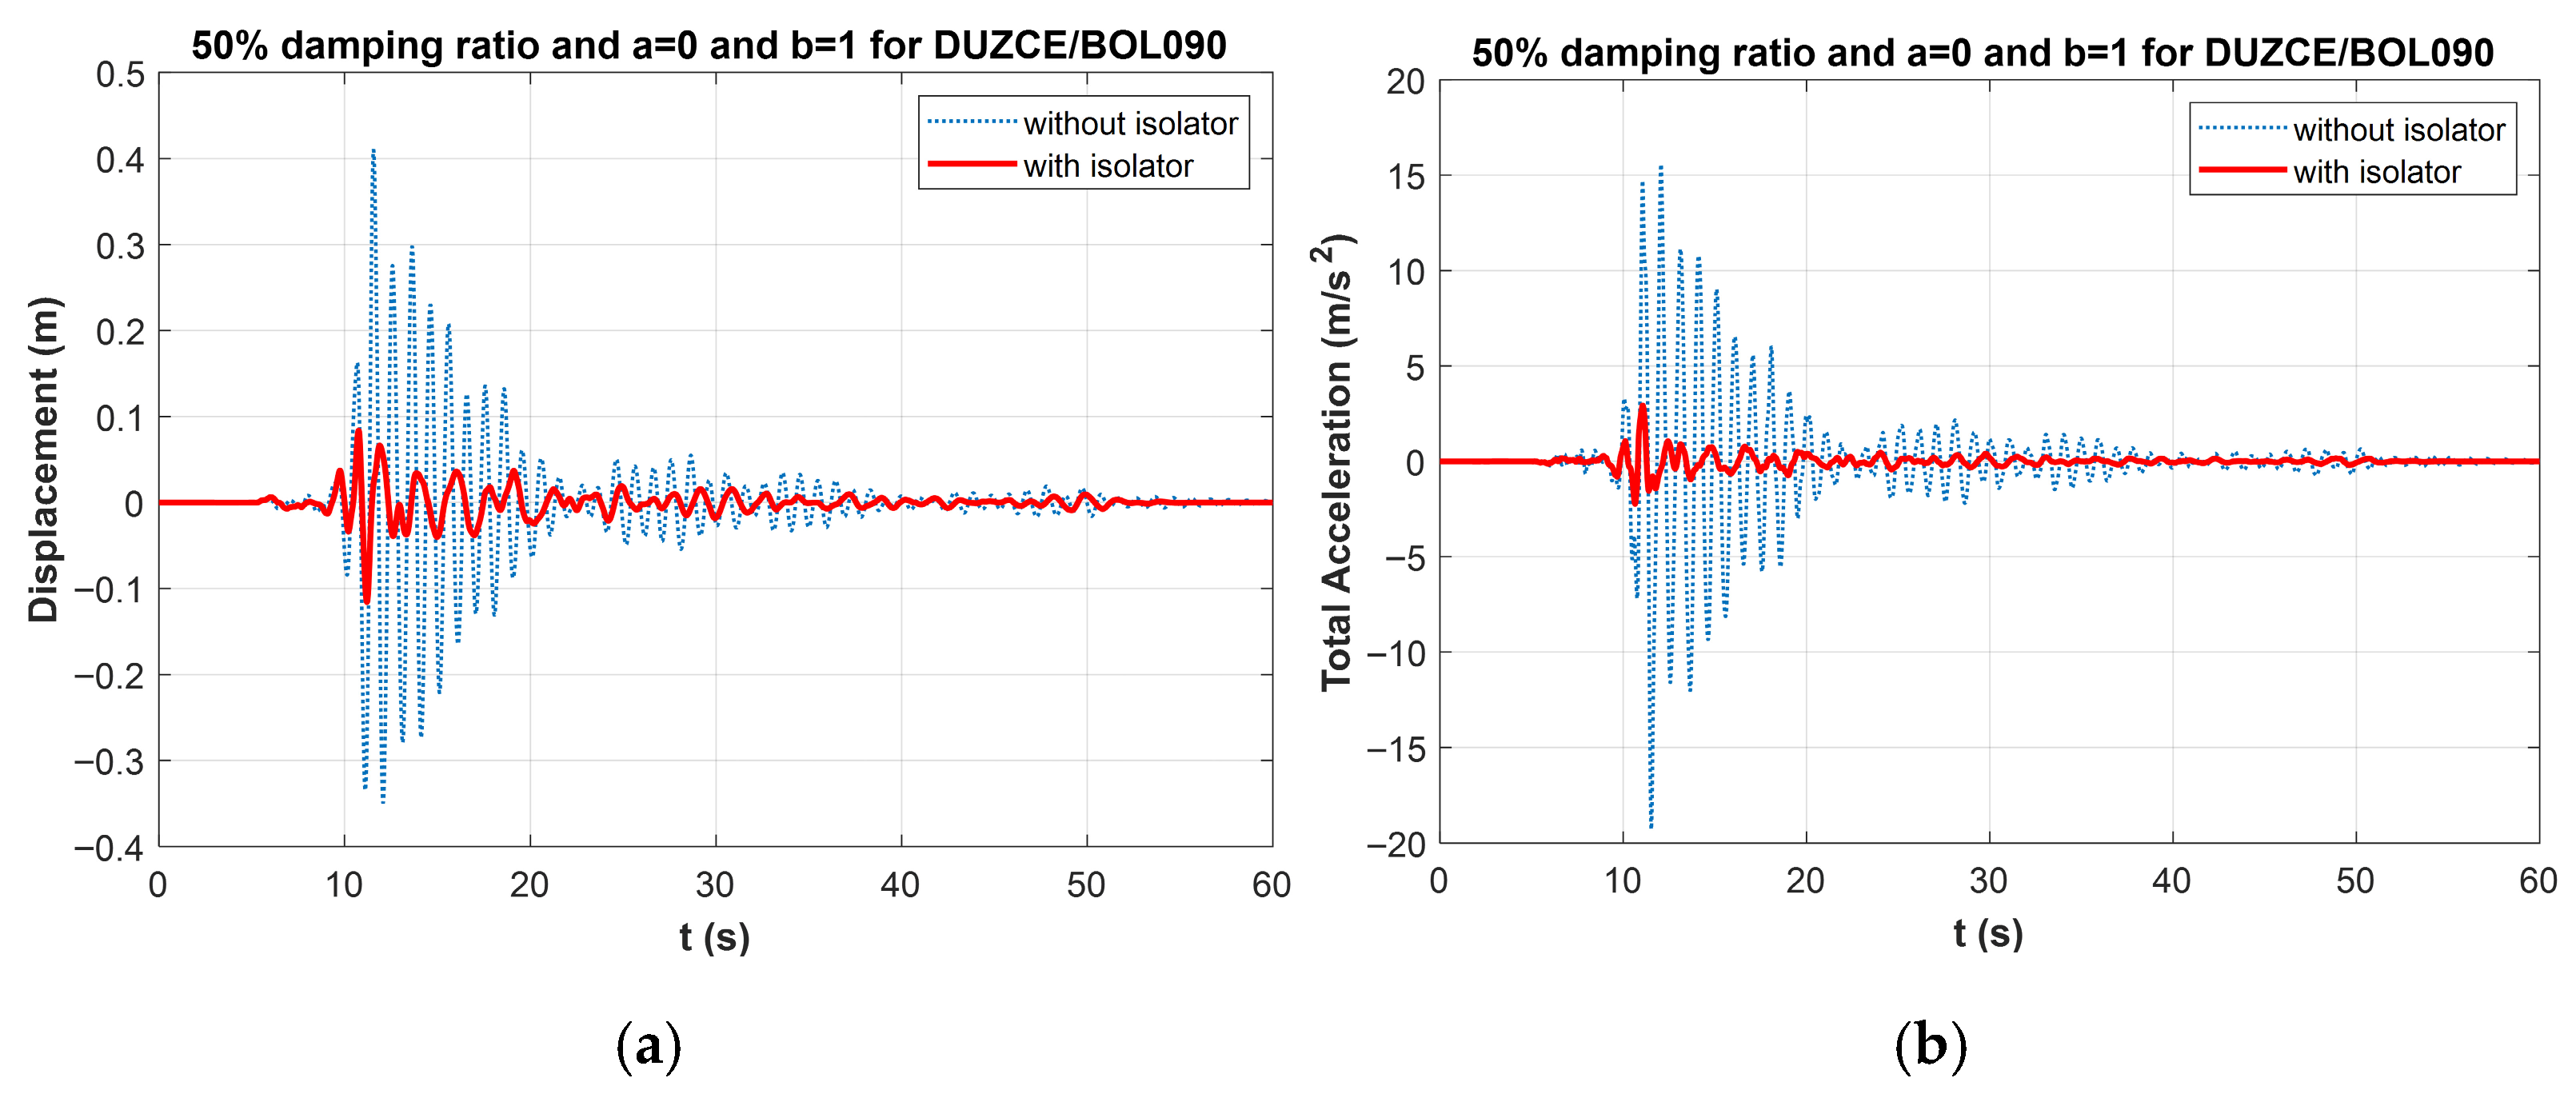
As a result of the critical earthquake analysis based on the earthquake with the most critical acceleration in the system with a 50% damping limit, the displacement–time and total acceleration–time graphs for which the acceleration effect value was 1 are shown in Figure 8, and the graphs where the effect values were 0.7, 0.5, 0.3, and 0 are shown in Figure 9, Figure 10, Figure 11 and Figure 12.

5. Discussion

In this study, design optimization was performed under seismic excitations using a structure model isolated from the base, where the superstructure was assumed to be rigid. The damping ratio and period parameters of the theoretical structure with an isolator system were optimized with the adaptive harmony search (AHS) algorithm. Optimum design parameters were sought for seismic excitations containing FEMA P-695 far-fault records. A multi-objective optimization function that minimized the maximum acceleration and displacement of the system for optimization was created. The focus of the study was to examine the effect ratios of the acceleration and displacement weights in the multi-objective optimization function on the optimum results and therefore on the isolator performance. In the objective function, the coefficients of acceleration and displacement were observed within the range of 0–1, and their effects on performance were observed in 0.1 intervals. The structure’s displacement and total acceleration reduction percentages for critical earthquakes where the maximum acceleration was observed in the earthquake analysis of the isolator system are shown in Table 8.
When the 30% damped system results are examined in Table 8, it is seen that the objective function effect value of the maximum acceleration drop is accepted as one and the effect of displacement is accepted as zero in the system created with the optimization data. As the effect value of the acceleration decreases in the objective function, there is a regular decrease up to a 0.5 acceleration weight, while beyond this value, the performance level tends to decrease, although it is not regular. In the optimization where the acceleration effect is taken as zero, the acceleration reduction performance of the isolator decreases by 78% compared to the maximum acceleration decrease of 5%. In the case where both coefficients are taken at the same rate, it is determined that there is less than a 1% difference with a rate of 82.66%, which is very close to the maximum acceleration reduction performance. Considering this situation, it appears that the reduction in the acceleration effect value does not affect the acceleration performance in 30% damped systems at very large levels, and it performs well even when the effect value is reduced to 0.5. When the effect on the displacement is examined, the maximum displacement reduction is seen in the case of the objective function where the displacement effect value is one. However, this also indicates the case with the lowest acceleration performance. In the case where the displacement effect is assumed to be zero in the objective function, the displacement reduction capacity of the isolator is found to be approximately 39.5%. Although the displacement effect value is 0, the lowest displacement performance is seen with a performance of approximately 35% when the displacement effect is 0.5. Considering this result, despite the definition of the displacement effect, the lowest displacement performance when taken at an equivalent rate with the acceleration indicates that the acceleration effect is also quite effective in reducing the displacement and can have a good effect on the displacement alone.
When the 50% damped system results are examined in Table 8, the best performance is seen in the objective function where the acceleration effect is 0.3, although the acceleration effect value is taken as 1. There is no regular increase or decrease in acceleration performance. There is a performance difference of about 4% between the best deceleration performance and the worst result. As in the 30% damped system, the acceleration performance is not significantly affected by the change in the weight values in the objective function. When the displacement reduction performance is examined, an insufficient displacement reduction of 15.40% is observed in cases where the displacement effect is 0 or 0.1. A similar performance graph of 71% is observed in cases where the displacement effect is 0.7 or more. It has been observed that the displacement effect is more important in systems with damping ratios greater than 30%, such as 50%, and it provides significant performance changes. In addition, a 55% displacement reduction performance is obtained when the objective function displacement effect coefficient is 0.6. Considering this situation, it can be concluded that the displacement effect value should be taken to be more than 60% in the design optimization to obtain good isolator performance when a higher-ratio damped system is selected. Considering the 30% damped system, performance values where the displacement effect value is more than 0.6 are also obtained in cases where the displacement effect values are 0.3 and 0.4. Therefore, in systems with lower damping, the displacement effect ratio can be taken in the range of 30–40%. Here, as an exception, in cases where the effect values are taken as 50% in both damped systems, the displacement reduction success is low. Accordingly, it is understood that taking acceleration and displacement in equal proportions does not have the same displacement reduction efficiencies.
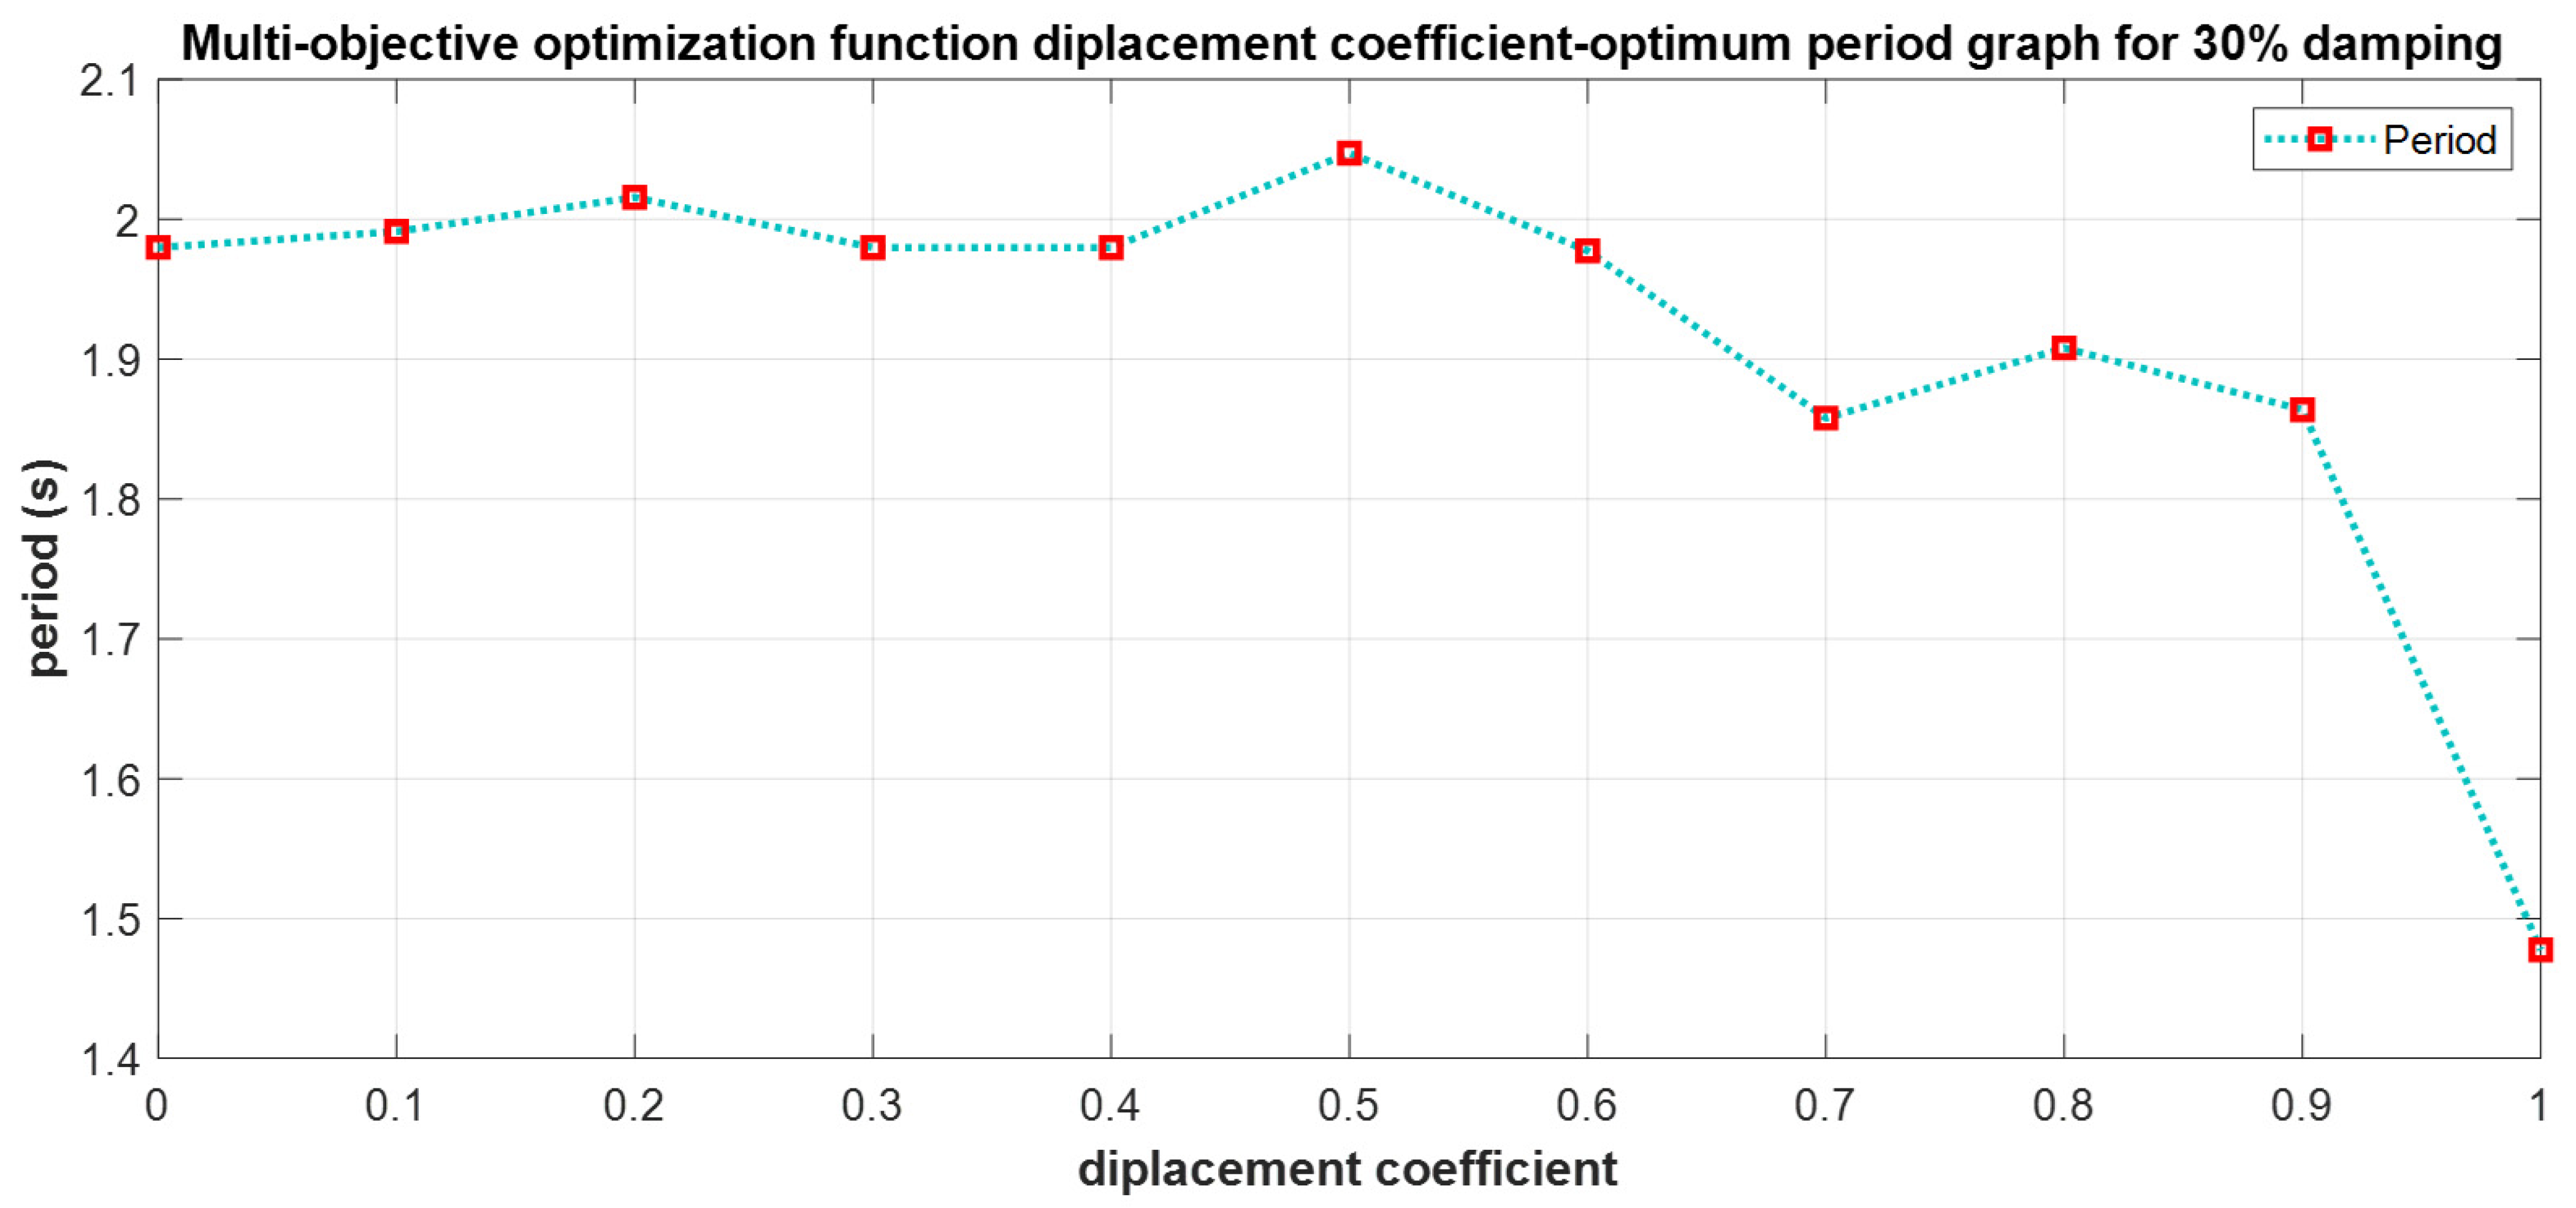
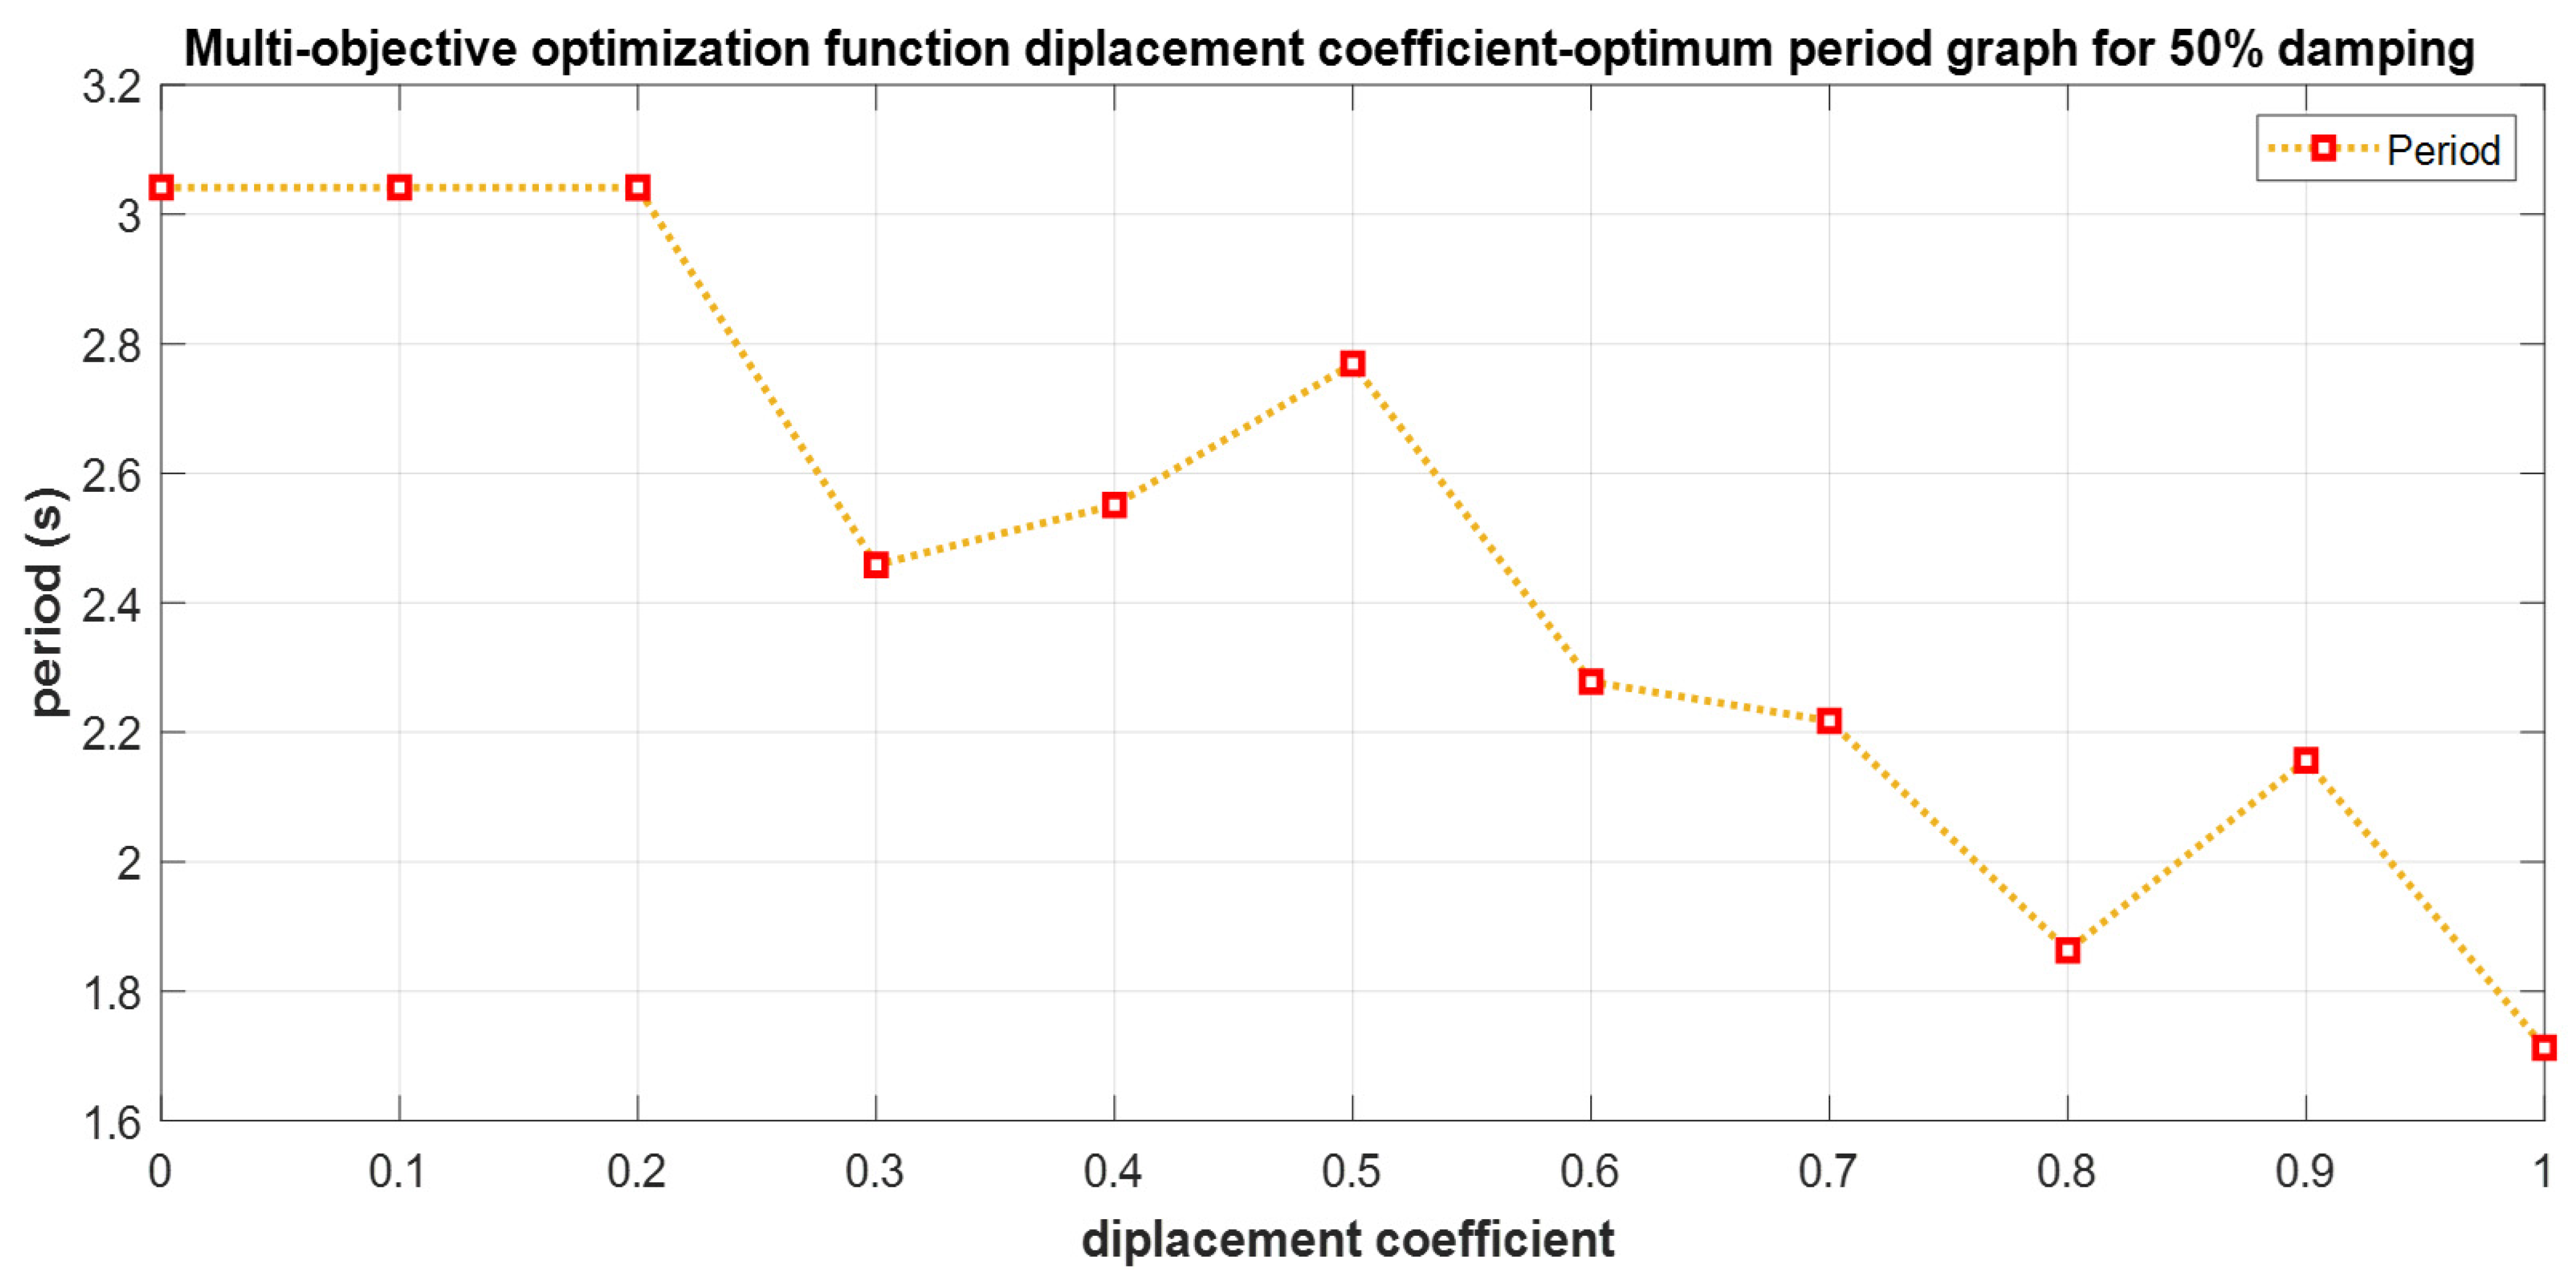
The graphs of the variation in the optimum period according to the objective function coefficients are given in Figure 13 for the 30% damped system and in Figure 14 for the 50% damped system.
When Figure 13 is examined, it is seen that increasing the displacement effect value in the objective function and decreasing the acceleration effect change the results considerably compared to the case where the displacement effect value is taken as 60%, and increasing the effect of displacement on the optimization tends to decrease the system period, although it is not regular. The most effective period decrease is seen when the effect of displacement is taken as 100%. Considering this situation, it can be concluded that the displacement effect in systems with a 30% damping ratio does not make a big difference unless the period change is taken as the maximum.
When Figure 14 is examined, the period of the 50% damped system does not show a regular increase or decrease depending on the displacement effect coefficient and it is understood from the graph that the displacement effect is more effective for the period change.
The findings of this study are now discussed in the context of existing seismic isolation research to enhance their scientific relevance. While no directly comparable study employing the same optimization formulation, modeling assumptions, and objective-function weighting is available, several published works have reported general response characteristics that support the trends observed here. In particular, previous studies have consistently shown that isolation systems designed with longer effective periods and higher damping ratios tend to reduce acceleration demand while allowing larger displacements, whereas stiffer isolation configurations improve displacement control at the expense of increased force transmission. The present results corroborate these established behaviors and further clarify how objective-function weighting governs the selection of optimal isolation parameters. At the same time, the systematic weighting-based investigation presented here contrasts with prior studies that primarily focus on algorithmic comparisons or single-objective formulations, thereby offering complementary insight into performance-oriented isolator design.
The findings of this study should therefore be interpreted as trend-oriented results that are strictly applicable to the selected ground-motion set, objective-function formulation, and benchmark modeling assumptions. The conclusions presented illustrate relative performance tendencies and optimization behavior rather than offering generalized design prescriptions applicable to broader classes of base-isolated structures.

6. Conclusions

The results of this research on the effect values of acceleration and displacement in the objective function in the multi-objective optimization of isolators can be summarized as follows:
-
In the optimization of systems with a 30% damping ratio, the change in the acceleration effect value in the objective function did not significantly affect the performance of the isolator in reducing the seismic acceleration at a rate as low as 5%, and it was a good acceleration reducer with a rate of 82.66% even when the acceleration coefficient was taken as 50% in the optimization function effect.
-
Similarly, an acceleration performance difference of 4% was observed in the 50% damped systems. It was found that the effective change in the acceleration coefficient between zero and one for both damping limits did not make any remarkable difference in the acceleration performance.
-
In all damping limits, when acceleration and displacement were taken equally in the objective function, no significant performance loss was observed in terms of acceleration, while the lowest displacement performance for the 30% damped system and an insufficient displacement of approximately 25% for the 50% damped system were achieved. Considering this situation, it is concluded that taking the acceleration and displacement coefficients to be equal does not change the deceleration much, but it may be insufficient to provide good performance in displacement.
-
For both systems, the best displacement reduction was seen in the displacement-dependent optimization where the displacement effect value was accepted as one in the objective function. In that case, the effect of acceleration was zero and there was a performance loss of about 5% in the 30% damping system compared to the case where the acceleration coefficient was one, while that loss was around 3% in the 50% damped system. Accordingly, although there was no significant difference, it can be said that removing the acceleration effect in the optimization of the higher-ratio damped system may affect the isolator performance less.
-
It was observed that increasing the displacement effect coefficient in the multi-objective optimization of high-damping-ratio systems, such as 50%, caused a remarkable change in the system period.
-
In the 50% damped system, a close displacement reduction of 71% was observed when the displacement effect was 0.6 or above. It is understood that the displacement effect coefficient of the optimization function is more important for the control performance in higher-ratio damped systems than the 30% damped system.
-
When the displacement effect value of the 30% damped system was 0.6 or above, the displacement reduction capacity was also seen at lower rates, such as 0.3 and 0.4; therefore, continuously increasing the displacement effect would not yield better results.
Considering all the results, it is understood that taking a displacement effect of more than 60% for the design optimization in systems with both damped isolators would provide more successful control performance, and a good displacement reduction can be obtained by taking the displacement effect value in the 30% and 40% band in less damped systems. In addition, it is concluded that taking the acceleration and displacement effect ratios to be equal in the optimization is insufficient in terms of the displacement reduction performance of the isolator system.
The reported findings apply to the specific benchmark model and parameter ranges examined in this study. Extension of these observations to more complex structural systems would require additional case studies and modeling considerations.
Recent studies have shown that hybrid or combined optimization strategies can improve search robustness and convergence characteristics in complex engineering optimization problems [56]. Exploring such combined optimization frameworks for seismic isolation design would require additional objective definitions and computational effort and is therefore identified as a direction for future research.
Future studies may extend the present framework by incorporating additional performance criteria such as residual displacement, energy dissipation capacity, and stability-related measures to provide a more comprehensive assessment of base-isolated system behavior. The use of more detailed MDOF structural models and advanced isolator constitutive formulations may further improve the applicability of the optimization results to real structures. In addition, recent research has shown that hybrid or combined optimization strategies can enhance search efficiency and robustness; therefore, integrating multiple optimization techniques within the proposed framework represents a promising direction for future investigation.

Author Contributions

Conceptualization, A.O., G.B. and S.M.N.; software, A.O., G.B. and S.M.N.; validation, S.M.N. and G.B.; formal analysis A.O. and S.M.N.; investigation, A.O. and S.M.N.; resources G.B. and S.M.N.; data curation, A.O. and G.B.; writing—original draft preparation, A.O., G.B. and S.M.N.; writing—review and editing, G.B., S.M.N. and Z.W.G.; visualization, A.O. and S.M.N.; supervision, G.B. and Z.W.G. All authors have read and agreed to the published version of the manuscript.

Funding

This research received no external funding.

Data Availability Statement

The original contributions presented in this study are included in the article. Further inquiries can be directed to the corresponding authors.

Conflicts of Interest

The authors declare no conflicts of interest.

References

  1. Moon, B.Y.; Kang, G.J.; Kang, B.S.; Kelly, J.M. Design and manufacturing of fiber-reinforced elastomeric isolator for seismic isolation. J. Mater. Process. Technol. 2002, 130, 145–150. [Google Scholar] [CrossRef]
  2. Tan, K.C.; Hejazi, F. Rubber-bearing isolator with granular and polymer filler core and application on a building. Structures 2022, 42, 309–332. [Google Scholar] [CrossRef]
  3. Wang, M.; Zhang, G. A low-cost isolator of scrap tire pads in rural construction: Evaluation of the mechanical properties and numerical assessment of the response control effects. J. Build. Eng. 2023, 67, 105996. [Google Scholar] [CrossRef]
  4. Raj, J.C.J.; Kumar, M.V. Performance evaluation of eco-friendly scrap tire base isolation technology in distinct construction quality RC framed buildings located in a seismic risk zone. Sustain. Energy Technol. Assess. 2022, 53, 102511. [Google Scholar]
  5. Habieb, A.B.; Formisano, A.; Milani, G.; Pianese, G. Seismic performance of Unbonded Fiber-Reinforced Elastomeric Isolators (UFREI) made by recycled rubber. Influence of suboptimal crosslinking. Eng. Struct. 2022, 256, 114038. [Google Scholar] [CrossRef]
  6. Yu, L.; Liu, S.; Ye, L.; Huang, G.; Xu, Y. The dynamic characteristics of silicone rubber isolator. J. Wuhan Univ. Technol. Mater. Sci. Ed. 2012, 27, 130–133. [Google Scholar] [CrossRef]
  7. Yan, H.; Zhang, W.J.; Jiang, H.Y.; Chen, L. Energy dissipation of a ring-like metal rubber isolator. Chin. Phys. B 2014, 23, 040702. [Google Scholar] [CrossRef]
  8. Shaska, K.; Ibrahim, R.A.; Gibson, R.F. Influence of excitation amplitude on the characteristics of nonlinear butyl rubber isolators. Nonlinear Dyn. 2007, 47, 83–104. [Google Scholar] [CrossRef]
  9. Naeim, F.; Kelly, J.M. Design of Seismic Isolated Structures: From Theory to Practice; John Wiley & Sons Inc.: New York, NY, USA, 1999; ISBN 978-0-471-14921-7. [Google Scholar]
  10. Li, Z.; Rossow, E.C.; Shah, S.P. Sinusoidal forced vibration of sliding masonry system. J. Struct. Eng. 1989, 115, 1741–1755. [Google Scholar] [CrossRef]
  11. Lou, Y.; Wang, M.; Su, J. Research of sliding shock absorbing multi-story brick building. In Proceedings of the 10th World Conference on Earthquake Engineering, Madrid, Spain, 19–24 July 1992. [Google Scholar]
  12. Nanda, R.P.; Agarwal, P.; Shrikhande, M. Base isolation by geosynthetic for brick masonry buildings. J. Vib. Control 2012, 18, 903–910. [Google Scholar] [CrossRef]
  13. Banović, I.; Radnić, J.; Grgić, N.; Matešan, D. The use of limestone sand for the seismic base isolation of structures. Adv. Civ. Eng. 2018, 2018, 9734283. [Google Scholar] [CrossRef]
  14. Ali, A.; Zhang, C.; Bibi, T.; Zhu, L.; Cao, L.; Li, C.; Hsiao, P.C. Investigation of five different low-cost locally available isolation layer materials used in sliding base isolation systems. Soil Dyn. Earthq. Eng. 2022, 154, 107127. [Google Scholar] [CrossRef]
  15. Kitayama, S.; Constantinou, M.C. Effect of modeling of inherent damping on the response and collapse performance of seismically isolated buildings. Earthq. Eng. Struct. Dyn. 2023, 52, 571–592. [Google Scholar] [CrossRef]
  16. Ocak, A.; Nigdeli, S.M.; Bekdaş, G.; Kim, S.; Geem, Z.W. Optimization of Seismic Base Isolation System Using Adaptive Harmony Search Algorithm. Sustainability 2022, 14, 7456. [Google Scholar] [CrossRef]
  17. Chikmath, C.; Sodha, A.; Adani, P.; Vasanwala, S.A. Application of Direct Displacement-Based Design for Base Isolated Reinforced Concrete Framed Structures. In Advances in Structural Integrity: Structural Integrity Over Multiple Length Scales; Jonnalagadda, K., Alankar, A., Eds.; Springer: Singapore, 2022; pp. 227–241. ISBN 978-981-16-8724-2. [Google Scholar]
  18. Zou, X.K.; Chan, C.M. Optimal drift performance design of base-isolated buildings subject to earthquake loads. WIT Trans. Built Environ. 2001, 54, 369–378. [Google Scholar]
  19. Iemura, H.; Taghikhany, T.; Jain, S.K. Optimum design of resilient sliding isolation system for seismic protection of equipment. Bull. Earthq. Eng. 2007, 5, 85–103. [Google Scholar] [CrossRef]
  20. Jangid, R.S. Equivalent linear stochastic seismic response of isolated bridges. J. Sound Vib. 2008, 309, 805–822. [Google Scholar] [CrossRef]
  21. Bucher, C. Probability-based optimal design of friction-based seismic isolation devices. Struct. Saf. 2009, 31, 500–507. [Google Scholar] [CrossRef]
  22. Dicleli, M.; Karalar, M. Optimum characteristic properties of isolators with bilinear force-displacement hysteresis for seismic protection of bridges built on various site soils. Soil Dyn. Earthq. Eng. 2011, 31, 982–995. [Google Scholar] [CrossRef]
  23. Weber, F.; Distl, H.; Braun, C. Isolation performance of optimized triple friction pendulum. Int. Ref. J. Eng. Sci. 2016, 5, 55–69. [Google Scholar]
  24. Charmpis, D.C.; Komodromos, P.; Phocas, M.C. Optimized earthquake response of multi-story buildings with seismic isolation at various elevations. Earthq. Eng. Struct. Dyn. 2012, 41, 2289–2310. [Google Scholar] [CrossRef]
  25. Karaboğa, D. An Idea Based on Honey Bee Swarm for Numerical Optimization; Technical Report-tr06; Erciyes University: Kayseri, Turkey, 2005. [Google Scholar]
  26. Rao, R.V.; Savsani, V.J.; Vakharia, D.P. Teaching-Learning-based optimization: A novel method for constrained mechanical design optimization problems. Comput. Aided Des. 2011, 43, 303–315. [Google Scholar] [CrossRef]
  27. Rao, R. Jaya: A simple and new optimization algorithm for solving constrained and unconstrained optimization problems. Int. J. Ind. Eng. Comput. 2016, 7, 19–34. [Google Scholar] [CrossRef]
  28. Holland, J.H. Adaptation in Natural and Artificial Systems; University of Michigan Press: Ann Arbor, MI, USA, 1975. [Google Scholar]
  29. Yang, X.S. A new metaheuristic bat-inspired algorithm. In Nature-Inspired Cooperative Strategies for Optimization (NICSO 2010); Gozalez, J.R., Pelta, D.A., Eds.; Springer: Berlin/Heidelberg, Germany, 2010; pp. 65–74. [Google Scholar]
  30. Mirjalili, S.; Mirjalili, S.M.; Lewis, A. Grey wolf optimizer. Adv. Eng. Softw. 2014, 69, 46–61. [Google Scholar] [CrossRef]
  31. Yang, X.S. Flower pollination algorithm for global optimization. In Unconventional Computation and Natural Computation; Lecture Notes in Computer Science 7445; Durand-Lose, J., Jonoska, N., Eds.; Springer: London, UK, 2012; pp. 240–249. ISBN 978-3642328930. [Google Scholar]
  32. Holland, J.H. Adaptation in Natural and Artificial Systems: An Introductory Analysis with Applications to Biology, Control, and Artificial Intelligence; MIT Press: Cambridge, MA, USA, 1992. [Google Scholar]
  33. Quaranta, G.; Marano, G.C.; Greco, R.; Monti, G. Parametric identification of seismic isolators using differential evolution and particle swarm optimization. Appl. Soft Comput. 2014, 22, 458–464. [Google Scholar] [CrossRef]
  34. Siami, A.; Karimi, H.R.; Cigada, A.; Zappa, E.; Sabbioni, E. Parameter optimization of an inerter-based isolator for passive vibration control of Michelangelo’s Rondanini Pietà. Mech. Syst. Signal Process. 2018, 98, 667–683. [Google Scholar] [CrossRef]
  35. Çerçevik, A.E.; Avşar, Ö.; Hasançebi, O. Optimum design of seismic isolation systems using metaheuristic search methods. Soil Dyn. Earthq. Eng. 2020, 131, 106012. [Google Scholar] [CrossRef]
  36. Tsipianitis, A.; Spachis, A.; Tsompanakis, Y. Combined Optimization of Friction-Based Isolators in Liquid Storage Tanks. Appl. Sci. 2022, 12, 9879. [Google Scholar] [CrossRef]
  37. Mehri, F.; Mollaei, S.; Noroozinejad Farsangi, E.; Babaei, M.; Ghahramani, F. Application of a Novel Optimization Algorithm in the Design of Lead Rubber Bearing Isolation Systems for Seismic Rehabilitation of Building Structures. Int. J. Eng. 2023, 36, 594–603. [Google Scholar] [CrossRef]
  38. Xu, Y.; Guo, T.; Yan, P. Design optimization of triple friction pendulums for base-isolated high-rise buildings. Adv. Struct. Eng. 2019, 22, 2727–2740. [Google Scholar] [CrossRef]
  39. Aceto, L.; Quaranta, G.; Camata, G.; Briseghella, B.; Spacone, E. Optimum design of a hybrid isolation device for server racks using a constrained differential evolution algorithm. In Proceedings of the 8th International Conference on Computational Methods in Structural Dynamics and Earthquake Engineering: ECCOMAS Thematic Conference, Athens, Greece, 28–30 June 2021; pp. 27–30. [Google Scholar]
  40. Tsipianitis, A.; Tsompanakis, Y. Multi-Objective Optimization of Base-Isolated Tanks with Supplemental Linear Viscous Dampers. Infrastructures 2022, 7, 157. [Google Scholar] [CrossRef]
  41. Etedali, S.; Hasankhoie, K.; Sohrabi, M.R. Optimal design of pure-friction isolators with and without restoring device: A multi-objective cuckoo search-based approach for seismic-excited structures. Structures 2020, 25, 708–719. [Google Scholar] [CrossRef]
  42. Pourzeynali, S.; Zarif, M. Multi-objective optimization of seismically isolated high-rise building structures using genetic algorithms. J. Sound Vib. 2008, 311, 1141–1160. [Google Scholar] [CrossRef]
  43. Fallah, N.; Zamiri, G. Multi-objective optimal design of sliding base isolation using genetic algorithm. Sci. Iran. 2013, 20, 87–96. [Google Scholar] [CrossRef]
  44. Rizzian, L.; Léger, N.; Marchi, M. Multiobjective sizing optimization of seismic-isolated reinforced concrete structures. Procedia Eng. 2017, 199, 372–377. [Google Scholar] [CrossRef]
  45. The MathWorks. Matlab R2018a, MathWorks: Natick, MA, USA, 2018.
  46. FEMA P-695; Quantification of Building Seismic Performance Factors. FEMA: Washington, DC, USA, 2009.
  47. Geem, Z.W.; Kim, J.H.; Loganathan, G.V. A new heuristic optimization algorithm: Harmony search. Simulation 2001, 76, 60–68. [Google Scholar] [CrossRef]
  48. Nigdeli, S.M.; Bekdas, G.; Kim, S.; Geem, Z.W. A novel harmony search-based optimization of reinforced concrete biaxially loaded columns. Struct. Eng. Mech. Int. J. 2015, 54, 1097–1109. [Google Scholar] [CrossRef]
  49. Siddique, N.; Adeli, H. Applications of harmony search algorithms in engineering. Int. J. Artif. Intell. Tools 2015, 24, 1530002. [Google Scholar] [CrossRef]
  50. De Almeida, F.S. Optimization of laminated composite structures using a harmony search algorithm. Compos. Struct. 2019, 221, 110852. [Google Scholar] [CrossRef]
  51. Cakiroglu, C.; Bekdaş, G.; Kim, S.; Geem, Z.W. Optimisation of Shear and Lateral–Torsional Buckling of Steel Plate Girders Using Meta-Heuristic Algorithms. Appl. Sci. 2020, 10, 3639. [Google Scholar] [CrossRef]
  52. Cakiroglu, C.; Islam, K.; Bekdaş, G.; Kim, S.; Geem, Z.W. Metaheuristic Optimization of Laminated Composite Plates with Cut-Outs. Coatings 2021, 11, 1235. [Google Scholar] [CrossRef]
  53. Arama, Z.A.; Kayabekir, A.E.; Bekdaş, G.; Kim, S.; Geem, Z.W. The Usage of the Harmony Search Algorithm for the Optimal Design Problem of Reinforced Concrete Retaining Walls. Appl. Sci. 2021, 11, 1343. [Google Scholar] [CrossRef]
  54. Ulusoy, S.; Bekdaş, G.; Nigdeli, S.M.; Kim, S.; Geem, Z.W. Performance of optimum tuned PID controller with different feedback strategies on active-controlled structures. Appl. Sci. 2021, 11, 1682. [Google Scholar] [CrossRef]
  55. Singh, M.P.; Singh, S.; Moreschi, L.M. Tuned mass dampers for response control of torsional buildings. Earthq. Eng. Struct. Dyn. 2002, 31, 749–769. [Google Scholar] [CrossRef]
  56. Asgarkhani, N.; Kazemi, F.; Jankowski, R.; Formisano, A. Dynamic ensemble-learning model for seismic risk assessment of masonry infilled steel structures incorporating soil-foundation-structure interaction. Reliab. Eng. Syst. Saf. 2025, 267, 111839. [Google Scholar] [CrossRef]
Figure 1. (a) Structure model with base isolator; (b) 3D view of the model.
Geohazards 07 00009 g001
Figure 2. Isolator appearance and representative movement of the isolator under seismic excitation.
Geohazards 07 00009 g002
Figure 3. Graphs of critical earthq uake analysis for a 30% damping ratio and 40 cm displacement limit for a = 1, b = 0: (a) structure displacement, (b) structure total acceleration.
Geohazards 07 00009 g003
Figure 4. Graphs of critical earthquake analysis for a 30% damping ratio and 40 cm displacement limit for a = 0.7, b = 0.3: (a) structure displacement, (b) structure total acceleration.
Geohazards 07 00009 g004
Figure 5. Graphs of critical earthquake analysis for a 30% damping ratio and 40 cm displacement limit for a = 0.5, b = 0.5: (a) structure displacement, (b) structure total acceleration.
Geohazards 07 00009 g005
Figure 6. Graphs of critical earthquake analysis for a 30% damping ratio and 40 cm displacement limit for a = 0.3, b = 0.7: (a) structure displacement, (b) structure total acceleration.
Geohazards 07 00009 g006
Figure 7. Graphs of critical earthquake analysis for a 30% damping ratio and 40 cm displacement limit for a = 0, b = 1: (a) structure displacement, (b) structure total acceleration.
Geohazards 07 00009 g007
Figure 8. Graphs of critical earthquake analysis for a 50% damping ratio and 40 cm displacement limit for a = 1, b = 0: (a) structure displacement, (b) structure total acceleration.
Geohazards 07 00009 g008
Figure 9. Graphs of critical earthquake analysis for a 50% damping ratio and 40 cm displacement limit for a = 0.7, b = 0.3: (a) structure displacement, (b) structure total acceleration.
Geohazards 07 00009 g009
Figure 10. Graphs of critical earthquake analysis for a 50% damping ratio and 40 cm displacement limit for a = 0.5, b = 0.5: (a) structure displacement, (b) structure total acceleration.
Geohazards 07 00009 g010
Figure 11. Graphs of critical earthquake analysis for a 50% damping ratio and 40 cm displacement limit for a = 0.3, b = 0.7: (a) structure displacement, (b) structure total acceleration.
Geohazards 07 00009 g011
Figure 12. Graphs of critical earthquake analysis for a 50% damping ratio and 40 cm displacement limit for a = 0, b = 1: (a) structure displacement, (b) structure total acceleration.
Geohazards 07 00009 g012
Figure 13. Optimum period plot of the system with isolators depending on the displacement coefficient of the multi-objective optimization function (for a 30% damping ratio).
Geohazards 07 00009 g013
Figure 14. Optimum period plot of the system with isolators depending on the displacement coefficient of the multi-objective optimization function (for a 50% damping ratio).
Geohazards 07 00009 g014
Table 1. FEMA earthquake records list.
DateEarthquake NameEarthquake
Number
Earthquake
Record
Earthquake
Number
Earthquake
Record
1994Northridge1NORTHR/MUL0092NORTHR/MUL279
1994Northridge3NORTHR/LOS0004NORTHR/LA270
1999Duzce, Turkey5DUZCE/BOL00006DUZCE/BOL090
1999Hector Mine7HECTOR/HEC0008HECTOR/HEC090
1979Imperial Valley9IMPVALL/H-DLT26210IMPVALL/H-DLT352
1979Imperial Valley11IMPVALL/H-E1114012IMPVALL/H-E11230
1995Kobe, Japan13KOBE/NIS00014KOBE/NIS090
1995Kobe, Japan15KOBE/SHI00016KOBE/SHI090
1999Kocaeli, Turkey17KOCAELI/DZC18018KOCAELI/DZC270
1999Kocaeli, Turkey19KOCAELI/ARC00020KOCAELI/ARC090
1992Landers21LANDERS/PLACE27022LANDERS/YER360
1992Landers23LANDERS/CLW-LN24LANDERS/CLW-TR
1989Loma Prieta25LOMAP/CAP00026LOMAP/CAP090
1989Loma Prieta27LOMAP/G0300028LOMAP/G03090
1990Manjil, Iran29MANJIL/ABBAR—L30MANJIL/ABBAR—T
1987Superstition Hills31SUPERST/B-ICC00032SUPERST/B-ICC090
1987Superstition Hills33SUPERST/B-POE27034SUPERST/B-POE360
1992Cape Mendocino35CAPEMEND/RIO27036CAPEMEND/RIO360
1999Chi-Chi, Taiwan37CHICHI/CHY101-E38CHICHI/CHY101-N
1999Chi-Chi, Taiwan39CHICHI/TCU045-E40CHICHI/TCU045-N
1971San Fernando41SFERN/PEL09042SFERN/PEL180
1976Friuli, Italy43FRIULI/A-TMZ00044FRIULI/A-TMZ270
Table 2. Optimization parameters.
SymbolDefinitionValue
H M C R Harmony memory consideration ratio0–0.5
H M C R i n Initial harmony memory consideration ratio0.5
F W Fret width0–0.05
F W i n Initial fret width0.05
m t Maximum iteration number200
t Iteration number1–200
p n Population number10
T b Isolator period 1–5 s
ζ b Isolator damping ratio1–30% and 1–50%
Table 3. Optimum results.
Objective Function
Coefficients
Damping Ratio of 30%Damping Ratio of 50%
a b Damping RatioPeriod (s) Damping RatioPeriod (s)
100.30001.97980.50003.0414
0.90.10.30001.99120.50003.0414
0.80.20.30002.01560.50003.0413
0.70.30.30001.97970.50002.4585
0.60.40.30001.97970.50002.5510
0.50.50.30002.04730.50002.7694
0.40.60.30001.97740.50002.2780
0.30.70.30001.85780.50002.2177
0.20.80.26831.90790.50001.8631
0.10.90.30001.86380.50002.1567
010.30001.47750.50001.7127
Table 4. Displacement and total acceleration values and reduction percentages obtained for earthquake records, which are critical for the maximum displacement of the 30% damped system.
Objective Function CoefficientsWith an Isolator Damping Ratio of 30%Earthquake Record No.
a b Displacement (m)Reduction
Percentage (%)
Total Acceleration (m/s2)Reduction
Percentage (%)
100.214642839.472.343675283.0638
0.90.10.217397238.702.354217882.9838
0.80.20.223239537.052.375230682.8338
0.70.30.214618539.482.343581383.0638
0.60.40.214618539.482.343581383.0638
0.50.50.230695434.952.399028482.6638
0.40.60.214058839.642.348298383.0338
0.30.70.184349348.012.475671582.1138
0.20.80.209358140.962.483697382.0538
0.10.90.185867447.592.466509082.1738
010.157697657.293.465346378.071
Table 5. Displacement and total acceleration values and reduction percentages obtained for earthquake records, which are critical for the maximum total acceleration of the 30% damped system.
Objective Function CoefficientsWith an Isolator Damping Ratio of 30%Earthquake Record No.
a b Displacement (m)Reduction
Percentage (%)
Total Acceleration (m/s2)Reduction
Percentage (%)
100.214642839.472.343675283.0638
0.90.10.217397238.702.354217882.9838
0.80.20.223239537.052.375230682.8338
0.70.30.170219045.272.343709881.952
0.60.40.170219045.272.343709881.952
0.50.50.230695434.952.399028482.6638
0.40.60.170255145.252.348298381.922
0.30.70.171449644.872.601359879.972
0.20.80.179083042.422.495071980.792
0.10.90.171434444.872.588096780.072
010.157697657.293.465346378.071
Table 6. Displacement and total acceleration values and reduction percentages obtained for earthquake records, which are critical for the maximum displacement of the 50% damped system.
Objective Function CoefficientsWith an Isolator Damping Ratio of 50%Earthquake Record No.
a b Displacement (m)Reduction
Percentage (%)
Total Acceleration (m/s2)Reduction
Percentage (%)
100.300000015.401.756470087.3038
0.90.10.300000015.401.756470087.3038
0.80.20.299990115.411.756512987.3038
0.70.30.221063437.661.950760785.9038
0.60.40.234379733.911.931697786.0438
0.50.50.264521925.411.865089486.5238
0.40.60.194391745.181.964451585.8038
0.30.70.185369847.731.960800085.8338
0.20.80.136829861.422.265502683.6238
0.10.90.176396350.262.000090685.5438
010.126464959.332.811242378.352
Table 7. Displacement and total acceleration values and reduction percentages obtained for earthquake records, which are critical for the maximum total acceleration of the 70% damped system.
Objective Function CoefficientsWith an Isolator Damping Ratio of 50%Earthquake Record No.
a b Displacement (m)Reduction
Percentage (%)
Total Acceleration (m/s2)Reduction
Percentage (%)
100.300000015.401.756470087.3038
0.90.10.300000015.401.756470087.3038
0.80.20.299990115.411.756512987.3038
0.70.30.221063437.661.950760785.9038
0.60.40.234379733.911.931697786.0438
0.50.50.264521925.411.865089486.5238
0.40.60.138248355.552.124021283.642
0.30.70.118889971.012.188336288.656
0.20.80.117258971.412.670806986.156
0.10.90.118799371.032.259816388.286
010.115663471.802.936594984.776
Table 8. Acceleration and displacement reduction percentages of the system with isolators as a result of the critical earthquake analysis.
Objective Function
Coefficient
Damping Ratio of 30%Damping Ratio of 50%
abDisplacement (%)Total Acceleration (%)Displacement (%)Total Acceleration (%)
1039.4783.0615.4087.30
0.90.138.7082.9815.4087.30
0.80.237.0582.8315.4187.30
0.70.345.2781.9537.6685.90
0.60.445.2781.9533.9186.04
0.50.534.9582.6625.4186.52
0.40.645.2581.9255.5583.64
0.30.744.8779.9771.0188.65
0.20.842.4280.7971.4186.15
0.10.944.8780.0771.0388.28
0157.2978.0771.8084.77
Disclaimer/Publisher’s Note: The statements, opinions and data contained in all publications are solely those of the individual author(s) and contributor(s) and not of MDPI and/or the editor(s). MDPI and/or the editor(s) disclaim responsibility for any injury to people or property resulting from any ideas, methods, instructions or products referred to in the content.