Abstract
As an earthquake is capable of causing significant losses, a strain buildup and release model following an earthquake is of importance for mitigation purposes. In this study, we aim to model strain buildup and release on a strike-slip fault which consists of elastic–brittle (upper crust) and elastic–viscous (lower crust and upper mantle) layers using a finite element model. The fault strength during strain buildup is controlled by the friction coefficient and cohesion, in addition to the viscoelastic parameter, as shown in the deformation model using Maxwell’s material. In the strain buildup model, we found that the differential stress on the elastic layer is larger than that on the viscoelastic layer and that the differential stress increases with the thickness of the elastic layer. When the viscoelastic layer is thinner, the deformation observed on the surface is larger. However, the differential of stress in the strain release model on the elastic layer is smaller than that on the viscoelastic layer, which shows the transfer stress from the lower crust and upper mantle to the upper crust. Using the knowledge gained by varying the thickness and frictional strength of the lithosphere, we discuss the seismicity pattern observed along the Great Sumatran Fault.
1. Introduction
The interseismic phase occurs when the strain in the brittle upper crust of a fault accumulates steadily over a long period of time due to the continuous slow relative motion of the adjacent plates. Following the deep slip model [1], during the interseismic phase, a fault in the seismogenic zone located in the upper crust is presumably locked due to frictional strength acting on the fault. On the other hand, the lower crust and upper mantle deforms continuously due to the tectonic stress. When the frictional strength of the fault is exceeded, the accumulated strain will be released instantaneously during the coseismic phase [2,3,4,5]. Following the coseismic phase, there is a transient phase of postseismic deformation where the lithosphere adjusts to the coseismic stress changes [1,6].
The buildup and release of tectonic stress that repeatedly occur during the earthquake cycle are reflected in the patterns of surface deformation [7]. The surface deformation patterns indicate the contribution of Earth’s rheology in earthquake cycles. Based on Reid’s elastic rebound theory, the surface deformation patterns often assume purely elastic deformation in the earthquake cycle [2]. However, for hours to hundreds of years, a precise mechanism for strain buildup is needed to explain the imposed stress that relaxes with time. Thus, viscoelastic models have been developed to understand the crustal deformation during the earthquake cycle (e.g., Nur and Mavko [8]; Savage and Prescott [9]; Cohen [10]; Li and Rice [11]; Kato [12]), where an elastic layer overlying a viscoelastic half space is assumed and earthquake slip is imposed on a shallower brittle part of the crust. The relaxation of the viscoelastic material of the lower crust and upper mantle and its interaction with the elastic upper crust are needed to understand deformation in the earthquake cycle.
One of the major strike-slip regions that is relatively less modeled is the Great Sumatran Fault (GSF). Sumatra experiences oblique plate convergence with northward motion at about 50 to 70 mm/year between the Eurasian continental lithosphere and Indian–Australian ocean lithosphere [13,14,15]. The GSF is a pure dextral strike-slip fault that is 1900 km long and that traverses the Sumatra Ocean Ridge near the active volcanic arc [16,17,18]. It runs parallel to the Sunda Trench and follows the magmatic arc southward from the Andaman Sea back-arc basin to the Sunda Strait [19]. Many shallow major earthquakes have occurred along the right-lateral strike-slip GSF since 1892. Among them are ten earthquakes with M ≥ 7.0, including the 1933 M 7.5 Kumering event, the 1935 M 7.0 and 7.2 events in the northwestern and southeastern parts of Tripa, the 1943 M 7.1 event in the thesoutheastern half of Sunda, the 1943 M 7.3 Ketaun event, and the M 7.6 Suliti and Sumani twin earthquakes [20]. On average, a major earthquake occurs along the GSF zone every five years [21]. This tectonically active strike-slip fault is divided into multiple segments with slip rates ranging from 3 to 16 mm/y (Figure 1).
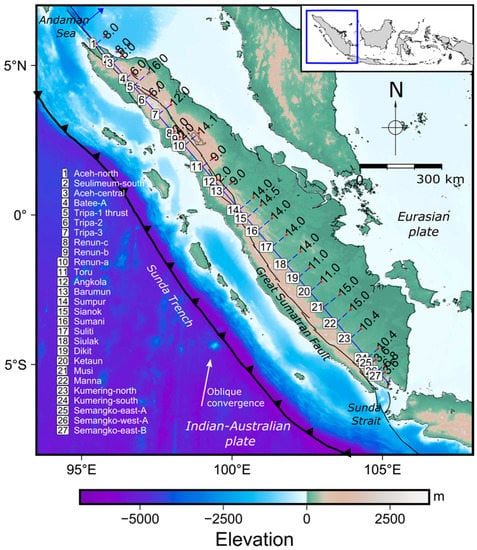
Figure 1.
Slip rate (mm/year) distribution across the Great Sumatran Fault (GSF) zone at each segment of the fault. The slip rates are inferred from GPS measurements of previous studies [15,21,22,23]. The fault segments refer to the National Center for Earthquake Studies of Indonesia [24].
Given all of the consequences of major earthquakes along the shallow strike-slip fault, modeling the lithosphere deformation model is crucial as a proxy to estimate earthquake occurrence. A few studies of the deformation model have been conducted: Savage and Prescott [9], Wang et al. [25], and Li et al. [26]. However, these studies have not reviewed the strain buildup and release with various lithosphere thicknesses and the effect of fault frictional strength on the lithosphere. Savage and Prescott [9] studied a simple two-dimensional earthquake cycle model (strain accumulation, strain release, and postseismic readjustment) in an elastic lithosphere overlying a viscoelastic asthenosphere. Meanwhile, Wang et al. [25] modeled a subduction earthquake cycle by addressing the loading mechanism, including the driving forces, the strength of plate boundary faults, and the coupling of long-term tectonic processes and short-term earthquake cycles. Hence, this study uses three-dimensional finite element modeling to highlight the importance of stress buildup and release with various lithosphere thicknesses and the effect of fault friction force on the lithosphere by adding velocity boundary conditions based on the decomposed oblique plate convergence. We also evaluate several parameters, such as material and boundary conditions, the frictional strength of the fault to the strain buildup and release along the fault, where the smaller differential stress on the elastic layer showed the strain released from the lower crust and upper mantle to the upper crust. However, the differential stress on the elastic layer in strain buildup model is larger than on the viscoelastic layer and also increases with the thickness of the elastic layer. Our results suggest a correlation between the accumulated strain in the brittle elastic crust, the crustal thickness, and the occurrence of major intraplate events along the GSF.
2. Methods
We implemented a finite element method to simulate the lithosphere deformation in a strike-slip mechanism. A Pylith finite element code was used to simulate the dynamic and quasi-static simulations of crustal deformation [27,28]. The procedures for building and simulating our numerical model are described in the following sections.
2.1. Model Building
First, a model representing the strike-slip fault is built. We simplified the geometry of the typical strike-slip model for the sake of reducing the computational time. The simulations were performed several times to infer the sensitivity of the layer thickness and frictional strength of the fault to stress accumulation.
The mesh was built using Coreform Cubit 2020.2 (Coreform, Orem, UT, USA), which is a software for generating high-quality meshes for finite element analysis. The model geometry is a block with the dimensions of 16 km × 16 km × 6 km for the length, width, and thickness, respectively, based on previous studies, i.e., Lynch and Richards [29]; Natawidjaja and Triyoso [17]; Burton and Hall [30] in which the average segment length was 120 km and the thickness was 45 km (15 km and 30 km for the brittle upper crust layer and lower crust and upper mantle, respectively). To simplify the calculations and to reduce the computational time, we downscaled the geometry of the model by 7.5. This model also consists of a vertical fault cutting through the entire model domain equally. We discretized the mesh in a hexahedron. A total of 14,157 nodes of uniform size were generated.
The model uses elastic material as an upper crust overlying a viscoelastic Maxwell material comprising the lower crust and upper mantle, with the constant parameter values in the model listed in Table 1. These parameter values are within reasonable values and were determined according to previous studies, e.g., Indrastuti et al. [31], Yegorova and Pavlenkova [32], Turcotte and Schubert [33], Billen and Gurnis [34], and Johnson et al. [35].

Table 1.
Model parameters for each layer.
The viscoelastic material thickness was varied to determine its effect on the deformation measured in the lithosphere. The material thickness was varied in three scenarios: (1) the elastic upper crust has the same thickness as the viscoelastic lower crust and upper mantle of 3 km, (2) the elastic layer is thinner than the viscoelastic layer, and (3) the elastic layer is thicker than the viscoelastic layer (Figure 2).
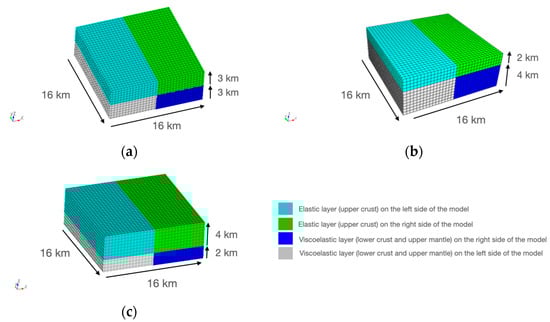
Figure 2.
Numerical mesh of the finite element model using three different scenarios: (a) an equal thickness of 3 km for the elastic upper crust (upper mesh layer) and the viscoelastic lower crust and upper mantle (lower mesh layer) as scenario one; (b) a thinner elastic upper crust layer (2 km) than the viscoelastic layer (4 km) as scenario two; and (c) a thicker elastic upper crust layer (4 km) than the viscoelastic layer (2 km) as scenario three.
2.2. Deformation Simulation
Lithosphere deformation was simulated to represent two processes: strain buildup and release. In each process, we varied the simulation parameters. For the strain buildup, the model was loaded by applying velocity boundary conditions. The load on the boundary was adjusted to give a sense of a right-lateral movement, representing the slip along the GSF. We found that velocity boundary conditions of 3 cm/year and 1 cm/year in the y and x directions, respectively, could represent the slip along GSF. It was decomposed from oblique plate convergence with northward motion at about 50–70 mm/year between the Eurasian continental lithosphere and the Indian–Australian ocean lithosphere, where the subduction angle is about 70°–80° with respect to the fault plane [13,14,15]. The bottom boundary (negative z) is fixed, as we assume that there is no displacement in the mantle related to the modeled strain build up [11,12]. The simulation was run under a quasi-static case for a simulation time of 250 years. The frictional strength of the fault, i.e., the friction coefficient and cohesion, was applied to simulate the strain buildup in the locking fault. In this simulation, the friction coefficient was varied by 0.4, 0.6, and 0.85 [36], and the cohesion was varied by 1 MPa, 2 MPa, and 5 Mpa [37] (Figure 3a).
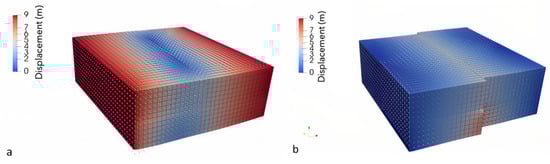
Figure 3.
Displacement model for scenario one: (a) the strain buildup model at time simulation of 250 years using friction coefficient 0.6 and cohesion 2 MPa; (b) the strain release model using slip 7.575 m.
For the strain release, the earthquake rupture at the upper crust and a steady fault creep at the viscoelastic layer of the lower crust and upper mantle were simulated along the fault plane. The determination of the earthquake recurrent interval in this study is taken from probability seismic hazard analysis implemented in Indonesia and in other regions, in which several seismic hazard maps are generated by taking into account earthquakes with recurrence intervals up to 500 and 2500 years [24]. We chose the 500-year recurrence interval to be simulated in this study, and the strain accumulation will be analyzed in each half recurrence interval before and after the earthquake, e.g., simulation years 250 and 750, respectively. For the strain release model, the lower portion of the fault slips at a steady rate of 1.5 cm/year and fully releases the accumulated strain at year 500 in the form of an earthquake rupture by 7.5 m slips. In addition, we also ran the model to partially accommodate the release of the accumulated strain by 80%, 60%, and 40% which is represented by the 6 m, 4.5 m, and 3 m slips, respectively (Figure 3b).
3. Results
3.1. Strain Build-Up Model
We investigated the strain buildup in the interseismic phase of the earthquake cycle using its slip magnitude, displacement, and differential stress. We showed how the frictional strength along the fault controls the strain buildup over 250 years. To illustrate the effects of the model parameters, we used scenario one, which has a friction coefficient of 0.6, cohesion of 2 MPa, and an equal elastic and viscoelastic layer thickness as the reference model, from which the increase or decrease in strain accumulation was estimated relative to this reference model.
After 250 simulation years, the surface model predicts smaller displacement around the fault than the area far from the fault (Figure 4). The displacement is the smallest in the fault core (locked zone). The amount of displacement in the fault is controlled by its frictional strength. As presented in Figure 5, the impact of the friction coefficient is larger than the cohesion. The other factor impacting the modeled surface displacement is the thickness ratio between the elastic to viscoelastic layer. The smaller elastic to viscoelastic ratio modeled in scenario two will also produce displacement on the surface that is 13.54% smaller compared to the reference model (Figure 4a,b).
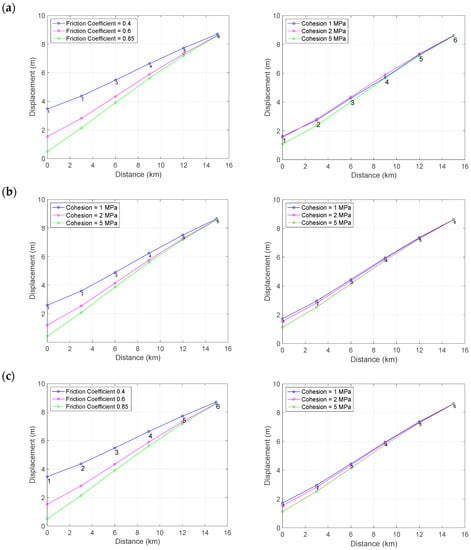
Figure 4.
Displacement with distance from the fault of strain buildup model at year 250 based on different friction coefficients and cohesion values in three scenarios: (a) scenario one, (b) scenario two, and (c) scenario three.
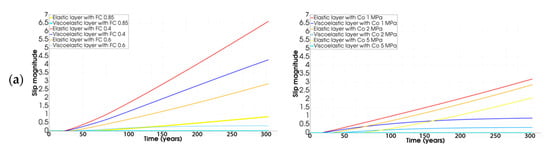
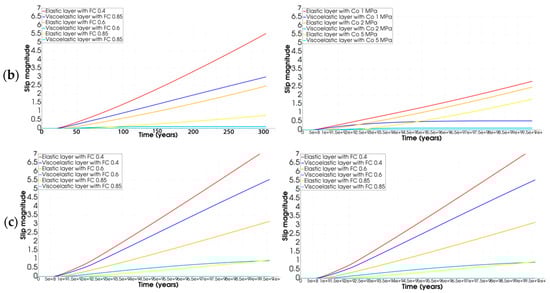
Figure 5.
Slip magnitude of strain buildup model based on different friction coefficients and cohesion values in three scenarios: (a) scenario one, (b) scenario two, and (c) scenario three.
Afterwards, slips along the fault are also estimated for the different scenarios applied in this simulation. As expected, applying a larger friction coefficient and cohesion value will result in a smaller slip in both the elastic and viscoelastic layers (see Figure 5). Furthermore, we found that the thicker the viscoelastic layer (scenario two), the smaller the slip along the fault (Figure 5b). Compared to the cohesion, the impact of the friction coefficients on the displacement on the surface was greater. The reduction in the displacement on the fault caused by the higher friction coefficient of 0.85 was found at ~0.9134 cm. It is almost three times higher than the displacement reduction caused by the higher cohesion value of 5 MPa (~0.3238 cm).
The differential stress values at the center and the boundary of each layer of the reference model are plotted in Figure 6 and Figure 7, respectively. In accordance with the displacement and slip, the impact of the friction coefficient on the differential stress is higher than the cohesion. Interestingly, the variations in the friction coefficient and cohesion used in the viscoelastic layer only caused a negligible impact on the modeled differential stress. This shows that the friction coefficients and cohesion used did not affect the viscoelastic material significantly in the lower crust and upper mantle. It was mainly because the lower crust and upper mantle is more plastic, and the upper crust is more brittle. Therefore, the impact of friction coefficient and cohesion is more significant in the upper crust. As for the reference model, we found that continuous loading increases the differential stress at an average of ~0.27 MPa/year for the elastic layer. This rate is more than four times higher than the rate due to the viscoelastic layer (~0.06 MPa/year). The higher stress accumulated in the elastic layer is then eventually released after it surpasses the frictional strength of the fault.
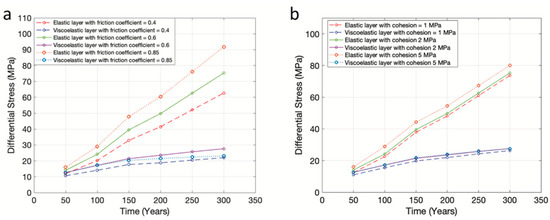
Figure 6.
Differential stress at the center of each layer of strain buildup model based on (a) different friction coefficients and (b) different cohesion levels.
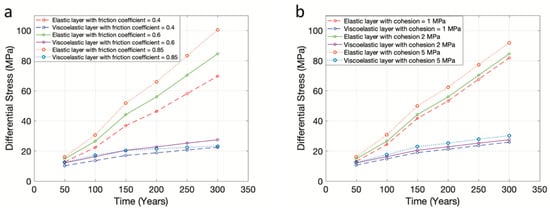
Figure 7.
Differential stress at the boundary of each layer of strain buildup model based on (a) different friction coefficient and (b) different cohesion.
3.2. Strain Release Model
We also investigated the strain release in the coseismic phases of the earthquake cycle using its displacement and differential stress resulting from slips along the fault. These slips represent the coseismic slip of the earthquake cycle, where we set the locked upper crust of the earth to slip every 500 years.
In order to investigate the viscoelastic material in the coseismic and interseismic phases, the displacement was analyzed two times, shortly after the earthquake (year 505) for the coseismic phase and 245 years after the earthquake (year 750) for the interseismic phase. We also implemented three models with different thickness ratios to analyze the effects of viscoelastic material.
Figure 8 shows the decrease in the displacement as a function of the distance from the fault. The trend is the opposite of the strain accumulation plotted in Figure 4, as it represents the stress release of the accumulated strain.
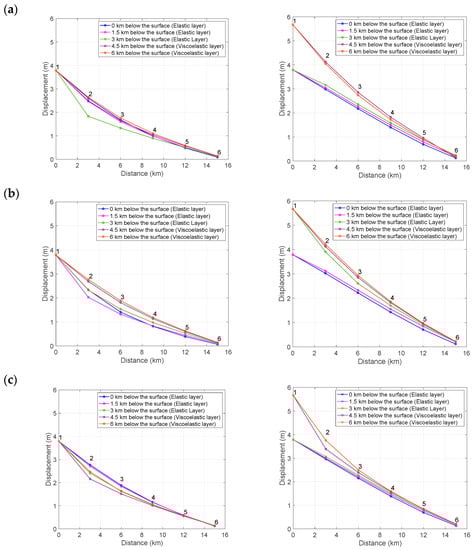
Figure 8.
Displacement with the distance of strain release model with slip of 7.575 m in three scenarios (left) at 505 years and (right) at 750 years for (a) scenario one, (b) scenario two, and (c) scenario three.
At the coseismic phase (year 505), the earthquake rupture at the upper crust (elastic layer) results in decreasing displacement along with increasing depth. On the other hand, the steady fault creep at the lower crust and upper mantle (viscoelastic layer) results in decreasing displacement with depth. The thickness ratio of the elastic to the viscoelastic layer also affects the deformation that occurred in the lithosphere, where a thicker viscoelastic layer (lower crust and upper mantle) produces a smaller displacement on the surface by −10.3%.
Meanwhile, in the interseismic phase, the deformation model at both layers shows increasing displacement with depth. This pattern is different from the coseismic one, indicating that the layer is accumulating strain with time for the next slip. Moreover, this graph shows a significant difference in displacement between the two layers, and the viscoelastic layer (lower crust and upper mantle) experienced more displacement, 1.8750 m more, than the elastic one. This represents the steady fault creep along the viscoelastic layer that increases the shear strain along the fault in the elastic layer. The results are almost identical for all three different scenarios tested in this study.
The viscoelastic material in the strain release model was also simulated for four different earthquake slip magnitudes, i.e., 3 m, 4.5 m, 6 m, and 7.575 m. Figure 9 shows the differential stress at the boundary of each layer. A greater earthquake slip magnitude results in a greater differential stress (Figure 9). Each slip that increases by 1.5 m results in increasing the differential elasticity by ~48.566 MPa in that elastic layer and by ~99.677 MPa in the viscoelastic layer.
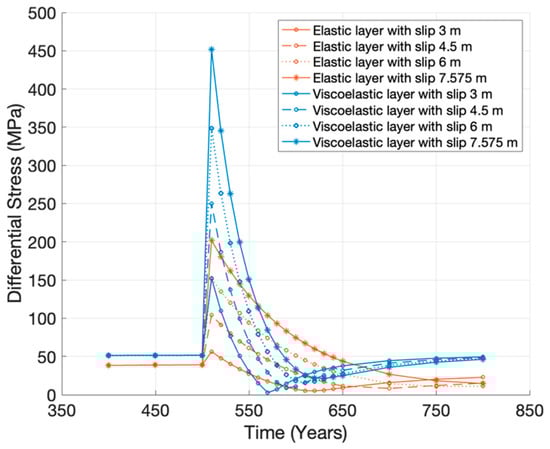
Figure 9.
Differential stress of strain release model on the boundary of each layer with varied slip magnitudes (3 m, 4.5 m, 6 m, and 7.575 m).
This increase is related to the coseismic phase, in which the energy or strain is released during an earthquake with significant slip. The viscoelastic material in the lower crust and upper mantle moves similar to a “viscous flow” that is capable of accumulating strain and transferring the stress to the layer above it (upper crust or elastic layer) so that the most significant differential stress is at the boundary of each layer, which is the area where the transfer occurs. Figure 9 also shows the interseismic phase marked by a gradual decrease in differential stress. The decrease occurs over 100 to 150 years from the earthquake rupture.
4. Discussion
In this first numerical modeling of GSF by taking into account the viscoelastic model, we emphasize the impact of the viscoelastic layer thickness and the frictional strength to the general seismic pattern along GSF. The fault segmentations could also impact the local seismic pattern. However, it is beyond the scope of this study. Based on our numerical modeling results of the slip, displacement, and differential stress, we showed that the viscoelastic material in the lower crust and upper mantle can control the deformation that takes place within tens or hundreds of years (long-term lithosphere deformation) and that impedes slip in the model.The friction coefficient and cohesion also play an important role in modeling the strain buildup process. They affect lithosphere deformation, where applying a larger friction coefficient and cohesion value will produce greater differential stress. Furthermore, we found that the friction coefficient has a more significant impact on the model than cohesion does.
The 3-D viscoelastic finite element model developed in this study provides a simulation of the long-term deformation along a linear strike-slip fault. The results obtained in this study were used to understand the seismicity pattern in GSF with respect to the variation in crustal thickness. In our model, we vary the thicknesses of the brittle elastic layers, which can be correlated with the crustal thickness. Based on the results of Figure 4b, a strain buildup model with a thin upper crust layer (scenario 2) will produce a larger displacement gradient (strain) than a thick upper crust layer (scenario 3). Therefore, the differential stress is higher for the thinner brittle layer.
Based on the geological history and patterns of deformation, Sieh and Natawidjaja [38] divided GSF into the northern, central, and southern domains. The GSF earthquake history shows that the southern and central parts of the GSF experienced more large earthquakes than the northern part. The history of major earthquakes in the central and southern GSF include 1933 M 7.5 Kumering, 1900 M 7.0 Musi, 1893 M 7.0 Manna, 1909 M 7.3 Siulak, 1892 M 7.5 Angkola, 1943 M 7.1 in the southeastern half of Sunda, 1943 M 7.3 Ketaun, and the M 7.6 Suliti and Sumani twin earthquakes [20]. The northern part of the GSF only experienced a few major earthquakes, e.g., 1935 M 7.0 and 7.2 in the northwestern and southeastern parts of Tripa.
Interestingly, based on CRUST1.0 model [39] in Figure 10, the crustal thickness of the GSF is decreasing from north (~34 km) to south (~30 km). According to our numerical results, the strain buildup model in scenario 2 with a thin upper crust layer produce a larger displacement gradient (strain) and higher differential stress than the other scenario. While the scenario 3 with a thicker upper crust layer produce a smaller displacement gradient (strain) and lower differential stress. Hence, we suspect that the stress accumulation in the central and southern regions with thinner crustal thickness is higher than in the northern part. Therefore, more major events were observed in the central and southern GSF. The small stress accumulation in the northern part of the GSF deduced from this study might explain the absence of significant events (M > 7) in the northern part of the GSF, even after the devastating M > 9 events in 2004.
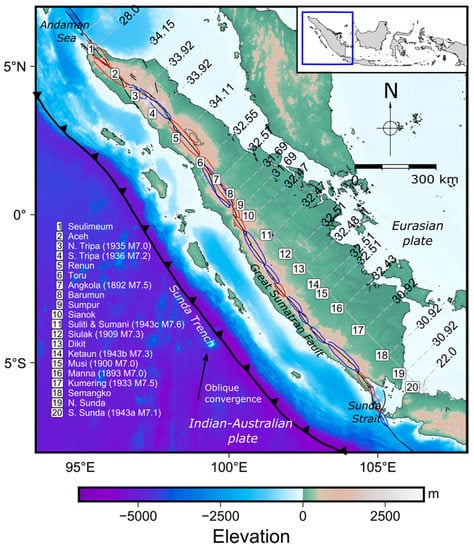
Figure 10.
The variation in crustal depth along GSF based on CRUST1.0 model and the M ≥ 7.0 earthquake history since 189 [20].
5. Conclusions
We modeled the strain buildup and release in a strike-slip fault using an elastic material as an upper crust overlying a viscoelastic Maxwell material of the lower crust and upper mantle via the finite element method to understand the earthquake cycle and its lithosphere deformation. The lithosphere deformation was modeled based on two processes, i.e., strain buildup and release. We varied the viscoelastic layer thickness into three scenarios to determine its effect on the deformation measured in the lithosphere in terms of slip, displacement, and differential stress. We also varied the frictional strength of the fault, i.e., the friction coefficient and cohesion during the strain buildup. The strain buildup model showed a higher displacement gradient (strain) at the center of the fault for the thin upper crust scenario compared to other scenarios. Moreover, the friction coefficient and cohesion also play an important role in modeling the strain buildup process, as applying a larger friction coefficient and cohesion will produce greater differential stress. Furthermore, we showed that the friction coefficient has a more significant impact on the model.
The results coincide with the occurrence of some major events in the southern part of the GSF, which has the thinnest crust along the GSF. Meanwhile, the thick upper crust in the northern part seems to delay the occurrence of major events, for example in the Tripa and Renun segments, which have the thickest crust along the GSF (~34 km).
It is worth to noting that the impact of the stress transfer imparted by the major events on the subduction zone and the stress heterogeneity due to fault segmentations might also affect the occurrence of major events in the northern part of the GSF. Further study is required to understand how stress transfer impacts stress accumulation along the GSF in both elastic and viscous layers.
Author Contributions
Conceptualization, D.P.S. and W.T.; methodology, M.A.B., D.P.S. and W.T.; software, M.A.B.; validation, D.P.S. and W.T.; formal analysis, M.A.B., D.P.S. and W.T.; investigation, M.A.B.; resources, D.P.S.; data curation, M.A.B., D.P.S. and W.T.; writing-original draft preparation, M.A.B., D.P.S. and D.K.; writing-review and editing, M.A.B., D.P.S. and D.K.; visualization: M.A.B. and D.K.; supervision, D.P.S. and W.T.; project administration, D.P.S.; funding acquisition, D.P.S. All authors have read and agreed to the published version of the manuscript.
Funding
This research was funded by Institut Teknologi Bandung PPMI 2022 research fund awarded to DPS and by the Program Penelitian Kolaborasi Indonesia (PPKI) Non-APBN Institut Teknologi Bandung with grant number 210/IT1.B07.1/SPP-LPPM/V/2022.
Institutional Review Board Statement
Not applicable.
Data Availability Statement
Not applicable.
Conflicts of Interest
The authors declare no conflict of interest.
References
- Scholz, C.H. The Mechanics of Earthquakes and Faulting; Cambridge University Press: Cambridge, UK, 2019. [Google Scholar]
- Reid, H.F. The Mechanics of the Earthquake. The California Earthquake of April 18, 1906. Report of the State Earthquake Investigation Commission 1910. Available online: http://activetectonics.asu.edu/ActiveFaultingSeminar/Papers/Reid_1910.pdf (accessed on 8 July 2022).
- Thatcher, W. Strain accumulation and release mechanism of the 1906 San Francisco Earthquake. J. Geophys. Res. Solid Earth 1975, 80, 4862–4872. [Google Scholar] [CrossRef]
- Koseluk, R.A.; Bischke, R.E. An elastic rebound model for normal fault earthquakes. J. Geophys. Res. Solid Earth 1981, 86, 1081–1090. [Google Scholar] [CrossRef]
- Ziv, A.; Schmittbuhl, J. The seismic cycle and the difference between foreshocks and aftershocks in a mechanical fault model. Geophys. Res. Lett. 2003, 30. [Google Scholar] [CrossRef]
- Wright, T.J. The earthquake deformation cycle. Astron. Geophys. 2016, 57, 4.20–4.26. [Google Scholar] [CrossRef]
- Thatcher, W.; Rundle, J.B. A viscoelastic coupling model for the cyclic deformation due to periodically repeated Earthquakes at subduction zones. J. Geophys. Res. Solid Earth 1984, 89, 7631–7640. [Google Scholar] [CrossRef]
- Nur, A.; Mavko, G. Postseismic viscoelastic rebound. Science 1974, 183, 204–206. [Google Scholar] [CrossRef]
- Savage, J.C.; Prescott, W.H. Asthenosphere readjustment and the earthquake cycle. J. Geophys. Res. Solid Earth 1978, 83, 3369–3376. [Google Scholar] [CrossRef]
- Cohen, S.C. A multilayer model of time dependent deformation following an earthquake on a strike slip fault. J. Geophys. Res. Solid Earth 1982, 87, 5409–5421. [Google Scholar] [CrossRef]
- Li, V.C.; Rice, J.R. Crustal deformation in Great California earthquake cycles. J. Geophys. Res. Solid Earth 1987, 92, 11533–11551. [Google Scholar] [CrossRef]
- Kato, N. Seismic cycle on a strike-slip fault with rate- and state-dependent strength in an elastic layer overlying a viscoelastic half-space. Earth Planets Space 2002, 54, 1077–1083. [Google Scholar] [CrossRef]
- Fitch, T.J. Plate convergence, transcurrent faults, and internal deformation adjacent to Southeast Asia and the western Pacific. J. Geophys. Res. 1972, 77, 4432–4460. [Google Scholar] [CrossRef]
- Jarrard, R.D. Terrane motion by strike-slip faulting of forearc slivers. Geology 1986, 14, 780–783. [Google Scholar] [CrossRef]
- Bradley, K.E.; Feng, L.; Hill, E.M.; Natawidjaja, D.H.; Sieh, K. Implications of the diffuse deformation of the Indian Ocean lithosphere for slip partitioning of oblique plate convergence in Sumatra. J. Geophys. Res. Solid Earth 2017, 122, 572–591. [Google Scholar] [CrossRef]
- Prawirodirdjo, L.; Bock, Y.; Genrich, J.F.; Puntodewo, S.S.O.; Rais, J.; Subarya, C.; Sutisna, S. One century of tectonic deformation along the Sumatran fault from triangulation and Global Positioning System surveys. J. Geophys. Res. Solid Earth 2000, 105, 28343–28361. [Google Scholar] [CrossRef]
- Natawidjaja, D.H.; Triyoso, W. The Sumatran fault zone—From source to hazard. J. Earthq. Tsunami 2007, 1, 21–47. [Google Scholar] [CrossRef]
- McCaffrey, R. The Tectonic Framework of the Sumatran Subduction Zone. Annu. Rev. Earth Planet. Sci. 2009, 37, 345–366. [Google Scholar] [CrossRef]
- Bellier, O.; Sébrier, M.; Pramumijoyo, S.; Beaudouin, T.; Harjono, H.; Bahar, I.; Forni, O. Paleoseismicity and seismic hazard along the Great Sumatran Fault (Indonesia). J. Geodyn. 1997, 24, 169–183. [Google Scholar] [CrossRef]
- Hurukawa, N.; Wulandari, B.R.; Kasahara, M. Earthquake history of the Sumatran fault, Indonesia, since 1892, derived from relocation of large earthquakes. Bull. Seismol. Soc. Am. 2014, 104, 1750–1762. [Google Scholar] [CrossRef]
- Natawidjaja, D.H. Updating active fault maps and sliprates along the Sumatran Fault Zone, Indonesia. IOP Conf. Series: Earth Environ. Sci. 2018, 118, 012001. [Google Scholar] [CrossRef]
- Ito, T.; Gunawan, E.; Kimata, F.; Tabei, T.; Simons, M.; Meilano, I.; Agustan; Ohta, Y.; Nurdin, I.; Sugiyanto, D. Isolating along-strike variations in the depth extent of shallow creep and fault locking on the northern Great Sumatran Fault. J. Geophys. Res. Solid Earth 2012, 117. [Google Scholar] [CrossRef]
- Natawidjaja, D.H.; Bradley, K.; Daryono, M.R.; Aribowo, S.; Herrin, J. Late Quaternary Eruption of the Ranau Caldera and New Geological Slip Rates of the Sumatran Fault Zone in Southern Sumatra, Indonesia. Geosci. Lett. 2017, 4, 21. [Google Scholar] [CrossRef]
- National Center for Earthquake Studies of Indonesia (PUSGEN). Indonesia’s Earthquake Source and Hazard Map (In Bahasa Indonesia); Research and Development Agency of Ministry of Public Work and Housing: Jakarta, Indonesia, 2017; ISBN 978-602-5489-01-3. [Google Scholar]
- Wang, K.; He, J.; Hu, Y. Elastic and Viscoelastic models of Crustal Deformation in Great Earthquake Cycles. AGU Fall Meet. Abstr. 2003, 2003, G22E-02. [Google Scholar]
- Li, Q.; Liu, M.; Zhang, H. A 3-D viscoelastoplastic model for simulating long-term slip on non-planar faults. Geophys. J. Int. 2009, 176, 293–306. [Google Scholar] [CrossRef]
- Aagaard, B.T.; Knepley, M.G.; Williams, C.A. A domain decomposition approach to implementing fault slip in finite-element models of quasi-static and dynamic crustal deformation. J. Geophys. Res. Solid Earth 2013, 118, 3059–3079. [Google Scholar] [CrossRef]
- Aagard, B.T.; Knepley, M.; Williams, C. PyLith User Manual, Version 2.2.0.; Computational Infrastructure for Geodynamics: Davis, CA, USA, 2017.
- Lynch, J.C.; Richards, M.A. Finite-element Models of Stress Orientations in Well-developed Strike-slip Fault Zones: Implications for the Distribution of Lower Crustal Strain. J. Geophys. Res. Solid Earth 2001, 106, 26707–26729. [Google Scholar] [CrossRef]
- Burton, P.W.; Hall, T.R. Segmentation of the Sumatran fault. Geophys. Res. Lett. 2014, 41, 4149–4158. [Google Scholar] [CrossRef]
- Indrastuti, N.; Nugraha, A.D.; McCausland, W.A.; Hendrasto, M.; Gunawan, H.; Kusnandar, R.; Kasbani, K. 3-D Seismic Tomographic study of Sinabung Volcano, Northern Sumatra, Indonesia, during the inter-eruptive period October 2010–July 2013. J. Volcanol. Geotherm.Res. 2019, 382, 197–209. [Google Scholar] [CrossRef]
- Yegorova, T.P.; Pavlenkova, G.A. Velocity-density models of the Earth’s crust and upper mantle from the quartz, Craton, and Kimberlite superlong seismic profile. Izv. Phys. Solid Earth 2015, 51, 250–267. [Google Scholar] [CrossRef]
- Turcotte, D.L.; Schubert, G. Geodynamics; Cambridge University Press: Cambridge, UK, 2002. [Google Scholar]
- Billen, M.I.; Gurnis, M. A low viscosity wedge in subduction zones. Earth Planet. Sci. Lett. 2001, 193, 227–236. [Google Scholar] [CrossRef]
- Johnson, K.M.; Hilley, G.E.; Burgmann, R. Influence of lithosphere viscosity structure on estimates of fault slip rate in the Mojave region of the San Andreas fault system. J. Geophys. Res. Solid Earth 2007, 112. [Google Scholar] [CrossRef]
- Byerlee, J.; Wyss, M. Rock Friction and Earthquake Prediction; Birkhäuser Verlag: Basel, Switzerland, 1978; Volume 116. [Google Scholar]
- Andrews, D.J. Rupture dynamics with energy loss outside the slip zone. J. Geophys. Res. 2005, 110, B01307. [Google Scholar] [CrossRef]
- Sieh, K.; Natawidjaja, D.H. Neotectonics of the Sumatran fault, Indonesia. J. Geophys. Res. Solid Earth 2000, 105, 28295–28326. [Google Scholar] [CrossRef]
- Laske, G.; Masters, G.; Ma, Z.; Pasyanos, M. Update on CRUST1.0—A 1-degree Global Model of Earth’s Crust. Geophys. Res. Abstr. 2013, 15, 2658. [Google Scholar]
Publisher’s Note: MDPI stays neutral with regard to jurisdictional claims in published maps and institutional affiliations. |
© 2022 by the authors. Licensee MDPI, Basel, Switzerland. This article is an open access article distributed under the terms and conditions of the Creative Commons Attribution (CC BY) license (https://creativecommons.org/licenses/by/4.0/).