Article

Hybrid Passive–Active Cooling Using a Single Closed Two-Phase Cooling System Integrated with Forced Aeration for Thermal Stabilization and Humidity Control in Paddy Storage

by
Wirote Ritthong
1,2,3,
P. V. Elumalai
4,
Sookjai Promprasansuk
2,
Khongdet Phasinam
1,2,
Naphat Albutt
3 and
Pongthep Poungthong
5,*
1
Faculty of Engineering and Technology, Pathumthani University, Pathum Thani 12000, Thailand
2
Faculty of Engineering and Technology, Shinawatra University, Pathum Thani 12160, Thailand
3
Faculty of Engineering, Bangkok Thonburi University, Bangkok 10170, Thailand
4
Department of Mechanical Engineering, Aditya University, Surampalem 533437, India
5
Department of Industrial Engineering, School of Engineering, King Mongkut’s Institute of Technology Ladkrabang, Bangkok 10520, Thailand
*
Author to whom correspondence should be addressed.
AgriEngineering 2026, 8(9), 399; https://doi.org/10.3390/agriengineering8090399 (registering DOI)
Submission received: 19 August 2026 / Revised: 5 September 2026 / Accepted: 14 September 2026 / Published: 20 September 2026

Abstract

A major problem in tropical regions is maintaining stable thermal and moisture conditions during paddy storage. High ambient temperatures can accelerate grain deterioration and compromise storage quality. This study proposes a hybrid passive–active cooling strategy that integrates a single closed two-phase cooling (SCTPC) system with controlled forced aeration to improve the thermal stability of stored paddy. Unlike conventional storage systems, the proposed configuration combines passive two-phase heat transfer with forced convection to enhance heat removal and reduce moisture stratification. The effect of the load-matched SCTPC configurations on cooling performance and intergranular air humidity distribution was studied experimentally under four storage conditions and three grain loads. The integrated configuration consistently provided lower temperatures and reduced relative humidity stratification than the individual cooling methods, with a maximum 24 h mean intergranular air temperature (MIAT) reduction of approximately 4.4 °C relative to the corresponding ambient condition. A comparison with the representative literature showed that the proposed system performed within established engineering performance ranges. The results demonstrate the feasibility of the combined configuration for short-term laboratory-scale thermal and relative humidity control; however, the airflow field showed measurable spatial variability, and energy efficiency, long-term storage performance, and commercial-scale applicability were not directly evaluated.

1. Introduction

Quality maintenance of stored paddy is a major engineering challenge in tropical and subtropical regions because high temperatures and relative humidity can accelerate biological and physicochemical deterioration. Insect infestation, microbial contamination, temperature fluctuations, and moisture redistribution can reduce grain quality and increase post-harvest losses [1,2,3,4]. Ambient storage provides limited active thermal control, whereas forced aeration can be constrained by inlet-air conditions, airflow distribution, grain-bed resistance, and storage depth. Recent experimental and numerical studies have improved our understanding of these coupled processes, but persistent spatial thermal gradients remain relevant to tropical storage applications.
Heat and moisture transport in stored grain has been investigated using both experiments and numerical models. Experimental studies provide direct measurements of grain-bed responses but are constrained by sensor density, test duration, and scale. Porous-medium and CFD-based models provide detailed spatial information and enable controlled sensitivity analyses, but their reliability depends on boundary conditions, material properties, and validation quality [5,6,7,8,9,10,11,12,13,14]. Recent work on aeration and storage modeling has also shown that inlet configuration and airflow distribution can materially influence cooling performance [9,10,11]. These complementary strengths and limitations support the need for experimentally validated hybrid cooling studies under representative tropical conditions. These complementary strengths and limitations support the need for experimentally validated hybrid cooling studies under representative tropical conditions. Recent paddy storage studies have further shown that aeration-window control, inlet-duct configuration, and airflow resistance can materially affect cooling performance and storage conditions [9,15,16,17].
Adequate drying before storage remains important because initial moisture content influences subsequent biological activity and storage stability. Solar drying has been investigated as an energy-efficient pre-storage option for paddy, including perforated-drum, photovoltaic-assisted, and inflatable solar-dryer configurations [18,19,20]. Thermosyphon-based approaches have also been investigated for paddy dehumidification, indicating the potential of passive two-phase heat transfer mechanisms for post-drying environmental control [15]. However, drying alone does not prevent heat accumulation during subsequent storage; therefore, post-drying thermal management remains necessary.
Passive cooling approaches can reduce heat accumulation without mechanical refrigerant circulation. Solar chimney systems generate buoyancy-driven airflow and have been studied for ventilation and thermal comfort [21,22,23,24,25]. Other passive approaches include evaporative and radiative cooling [26,27]. These technologies are relevant as general passive cooling concepts, but the present experimental apparatus does not contain a solar-chimney airflow device; therefore, the cooling component investigated here is described specifically as a single closed two-phase cooling (SCTPC) unit rather than as a solar chimney system.
A two-phase closed thermosyphon can transport heat through evaporation, vapor transport, condensation, and gravity-driven liquid return. Its performance depends on condenser conditions, internal flow behavior, surface characteristics, working fluid, and geometry [23,24,25,26,27,28,29,30,31,32,33,34,35]. Recent studies have also shown the value of CFD and experimental optimization for understanding airflow and thermal distributions in cooling systems [36,37,38]. R-290 was selected in the present study because of its suitable thermophysical properties and low ozone-depletion and global-warming impacts relative to many conventional refrigerants; however, its flammability requires careful laboratory handling and limits direct extrapolation to larger installations [28,38].
Forced aeration and passive two-phase cooling address heat removal through different pathways, but the present study does not establish statistically significant interaction between them. The research gap is instead the limited experimental characterization of their combined thermal response under tropical paddy storage conditions. In particular, the present design compares four treatment configurations across three load-matched SCTPC configurations, in which grain load, thermosyphon dimensions, heat transfer area, and R-290 charge vary together. Accordingly, the objective was to quantify the thermal and intergranular air humidity responses of the tested configurations and to identify practical operating limitations, especially those associated with condenser exposure.
Forced aeration, passive solar chimney ventilation, and TPCT-based cooling technologies have been extensively studied, but generally as independent systems. Therefore, the combined effects of passive two-phase cooling and forced aeration on heat removal and relative humidity distribution remain insufficiently understood, particularly under tropical environmental conditions, where high ambient temperatures challenge conventional cooling methods. Moreover, quantitative understanding of how load-matched grain/SCTPC configurations affect the interaction between airflow-driven sensible heat removal and passive latent heat transport remains limited. This knowledge gap restricts the practical optimization of hybrid grain cooling systems. Accordingly, the key unresolved issue is not merely whether passive cooling or forced aeration can individually reduce grain temperature but whether their integration can provide an additional cooling benefit under defined laboratory conditions. The present study addresses this gap by experimentally comparing the combined effects of passive two-phase heat transport and forced aeration across three load-matched configurations while recognizing that grain load, SCTPC geometry, and refrigerant charge vary together. The study therefore focuses on experimentally observed thermal and relative humidity responses rather than on claims of airflow uniformity, energy efficiency, or commercial-scale performance, which require additional measurements and longer-duration validation.

2. Methodology

2.1. Experimental Silo and Aeration System

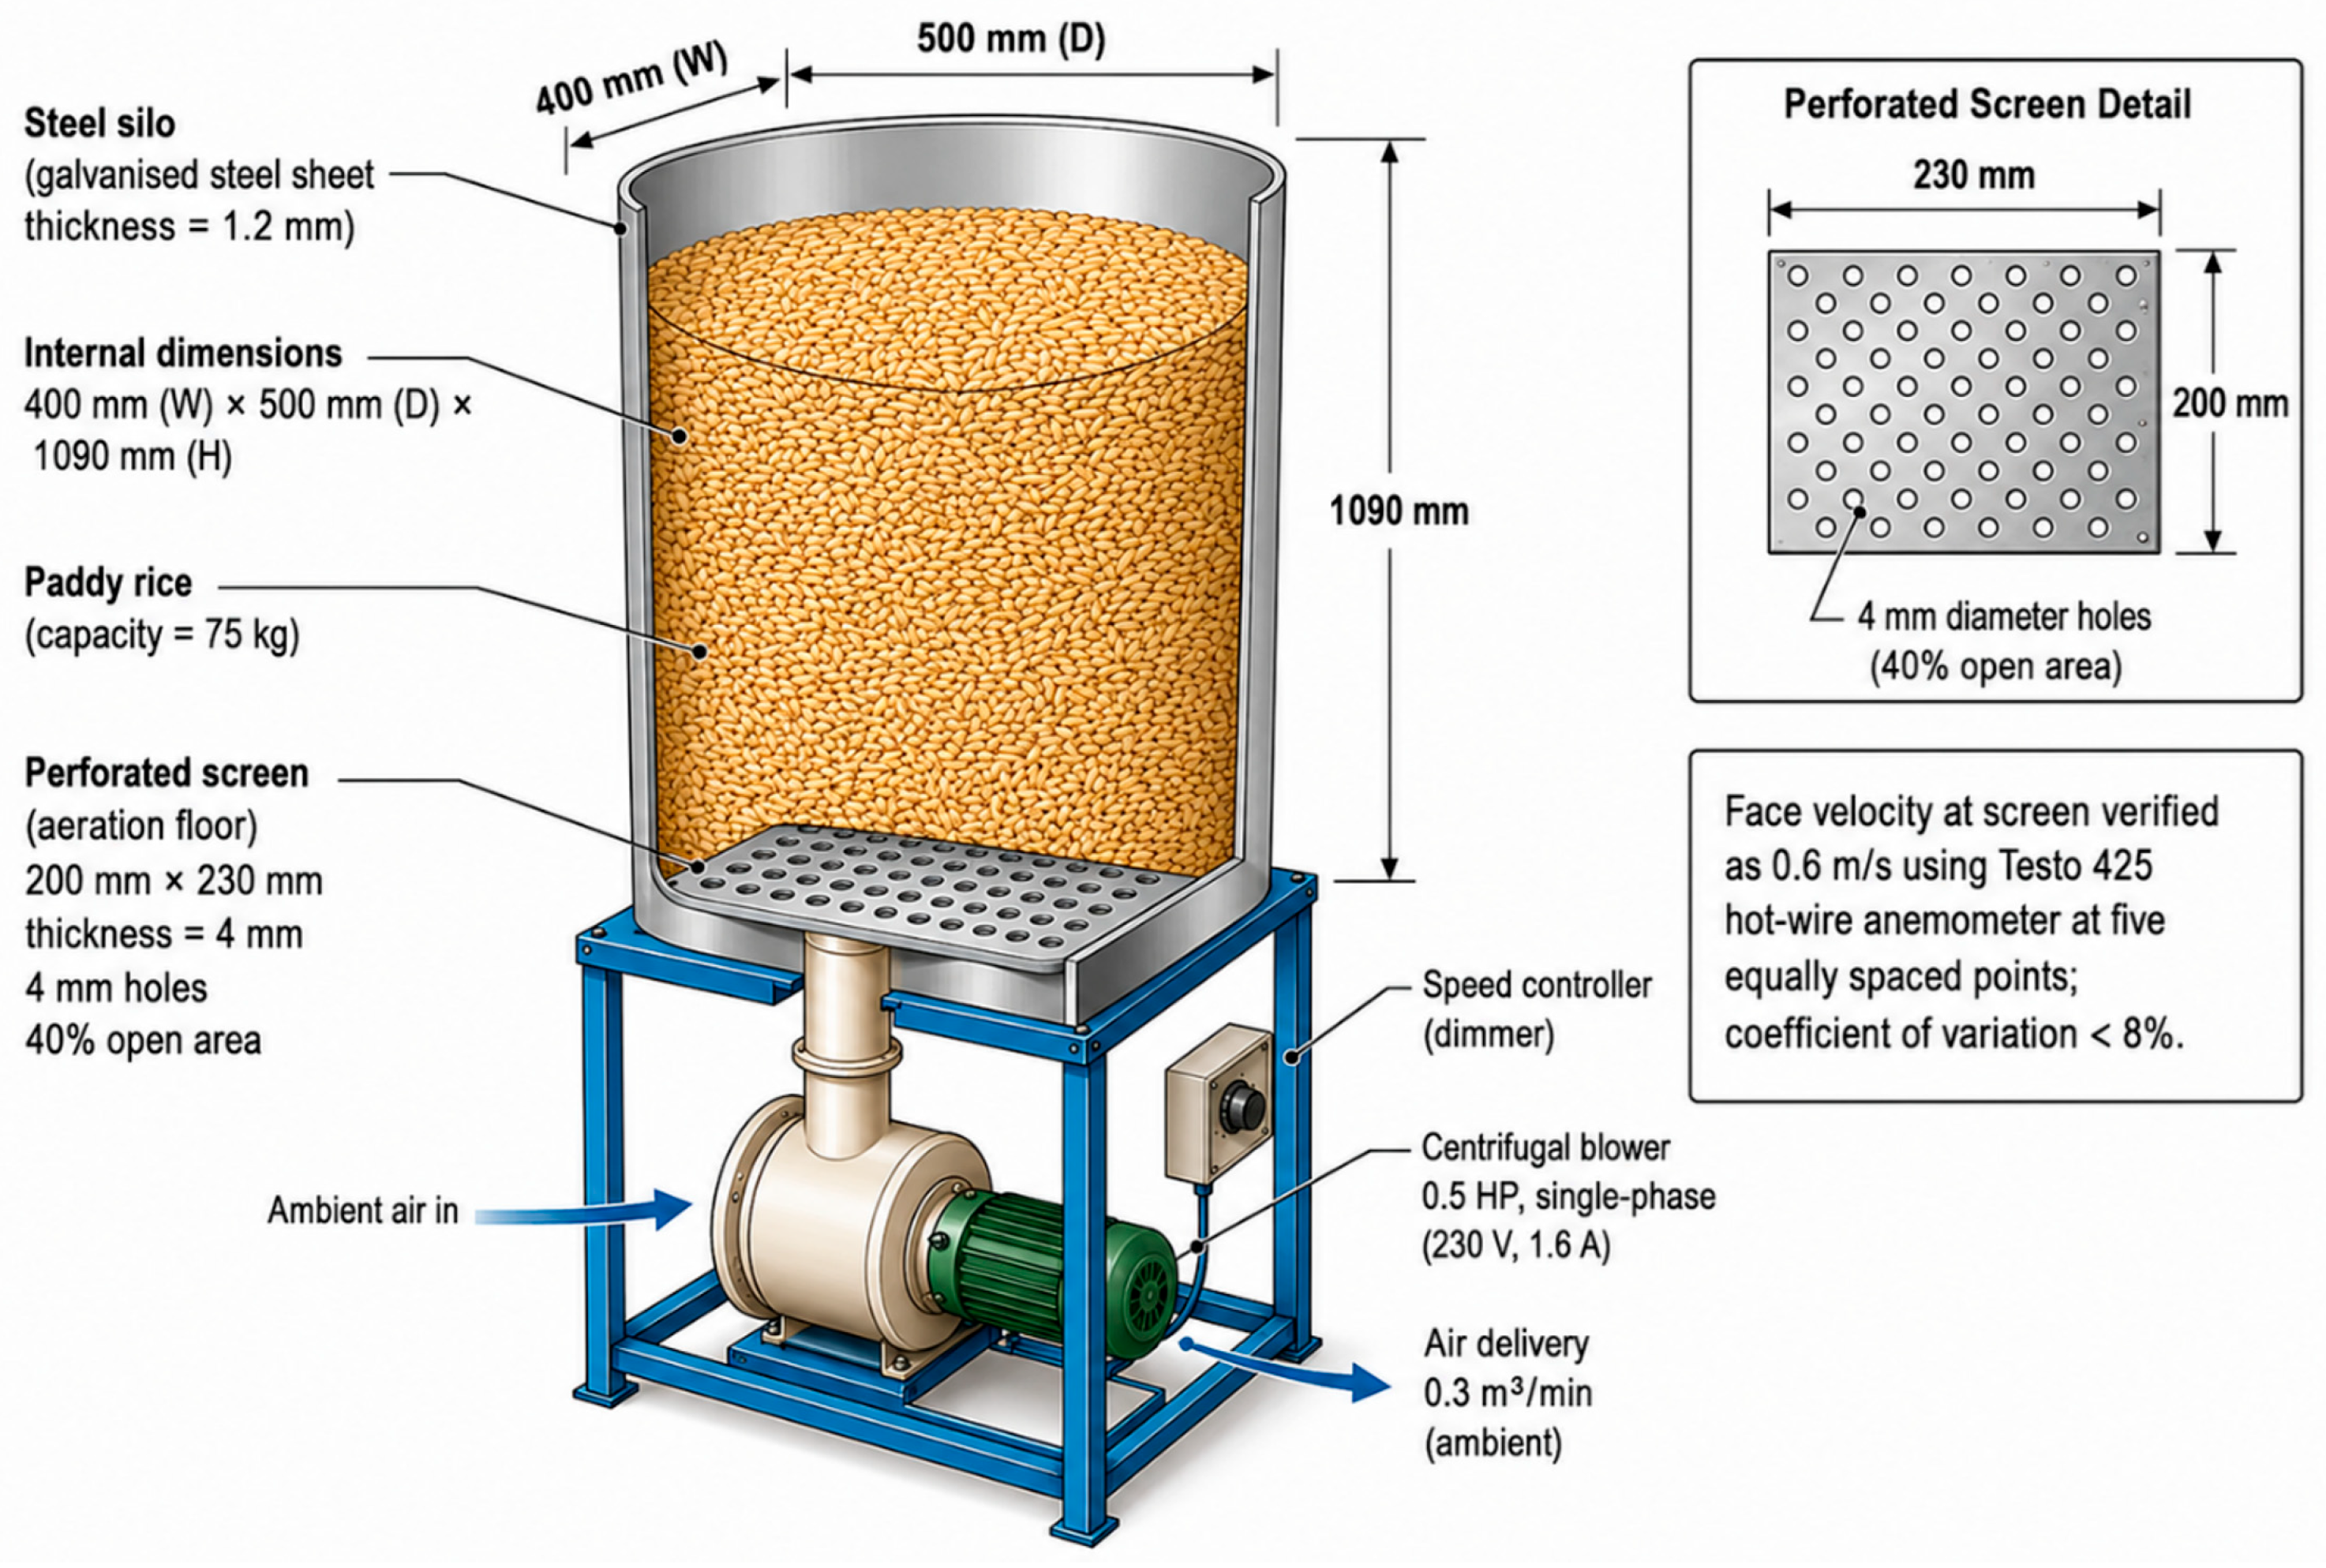
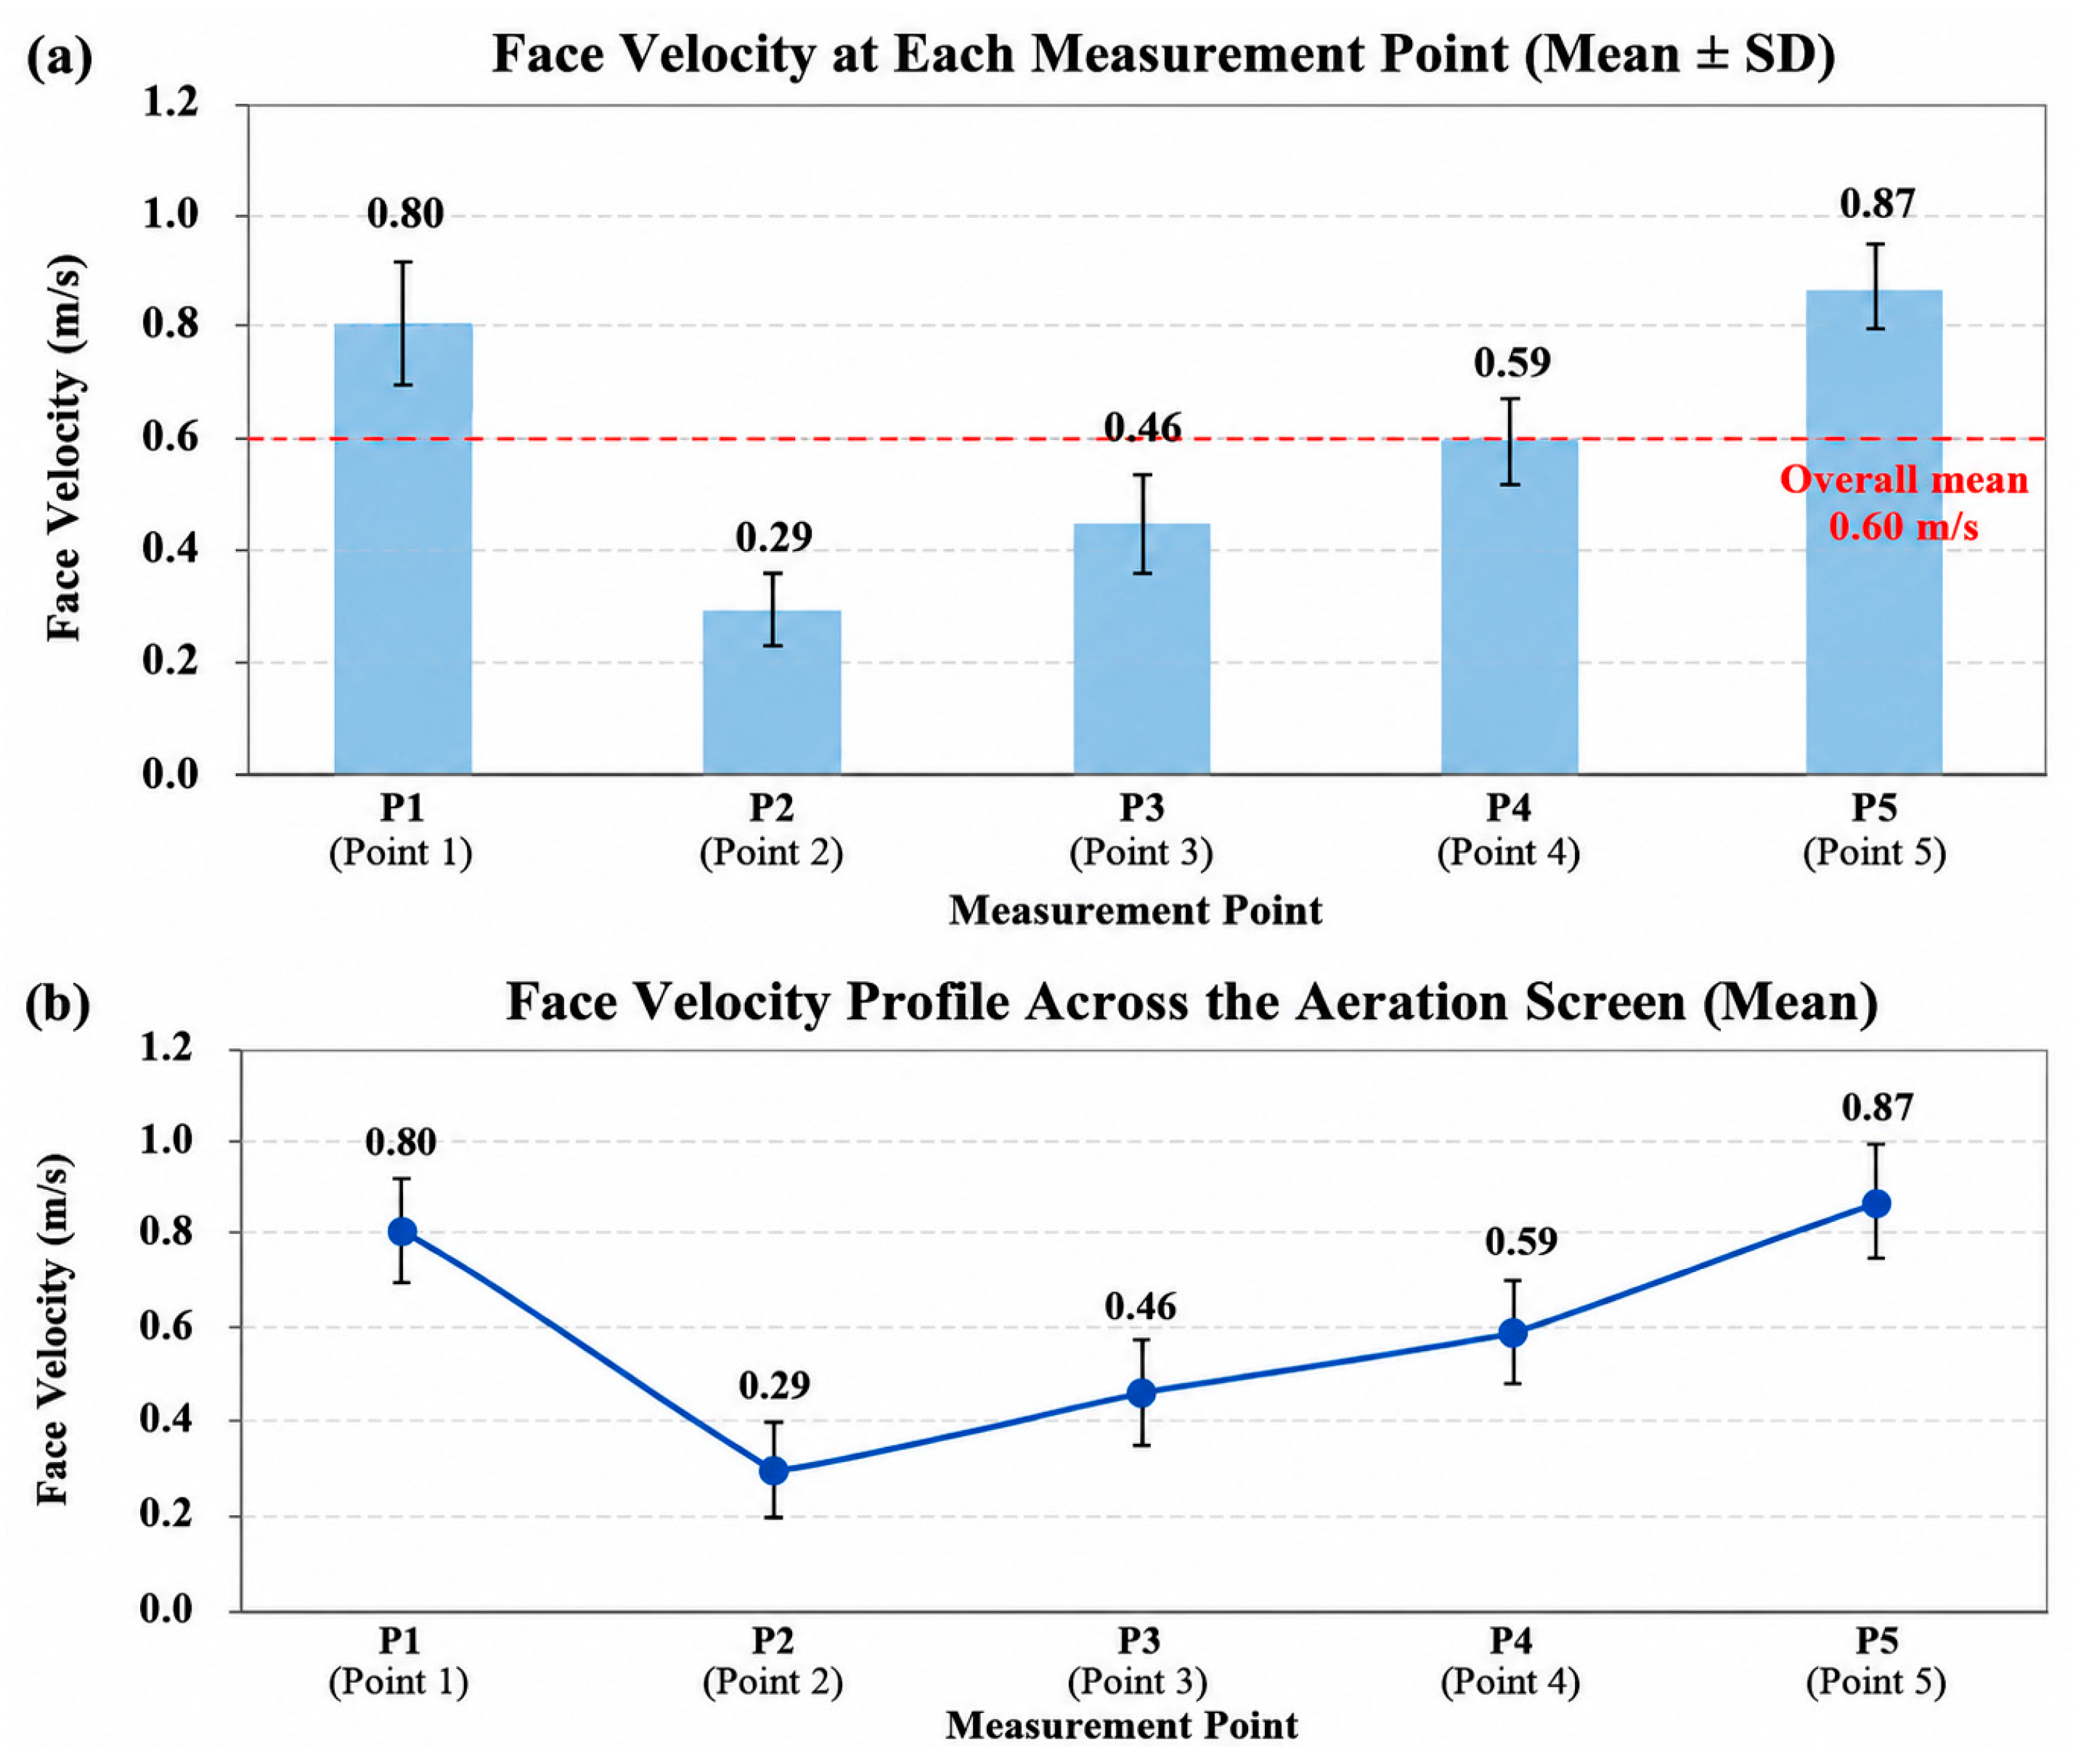
To create a controlled and reproducible storage environment to evaluate the combined effects of forced aeration and the SCTPC system on the intergranular air temperature and relative humidity of stored paddy rice, a laboratory-scale steel silo was designed and fabricated, as shown in Figure 1. The silo was fabricated from 1.2 mm thick galvanized steel sheets with internal dimensions of 400 mm × 500 mm × 1090 mm (W × D × H), allowing for a maximum storage capacity of 75 kg of paddy rice and maintaining a representative grain-bed geometry for laboratory-scale studies. In the floor of the silo, a uniform aeration floor was installed. This consisted of a 200 mm × 230 mm perforated steel plate with 4 mm circular perforations and 40% open area. The perforated design was chosen to minimize resistance to airflow and to provide uniform air distribution in the mass of grain. The aeration system was supplied by a 0.5 HP single-phase centrifugal blower (230 V, 1.6 A) with a variable-speed controller (dimmer) and provided a constant airflow rate of 0.3 m3 min−1 under ambient operating conditions. The airflow distribution above the perforated screen was checked before each experimental run by means of a calibrated Testo 425 hot-wire anemometer (Testo SE & Co. KGaA, Titisee-Neustadt, Germany). Air velocity measurements were taken at five equidistant locations across the aeration floor to assess airflow uniformity. The mean face velocity was 0.60 m s−1, while the spatial coefficient of variation across the five measurement positions was approximately 30%, indicating moderate spatial non-uniformity. Replicate measurements at each location were nevertheless stable, supporting comparable aeration conditions among experimental treatments. This verification procedure reduced spatial variability in delivering airflow and increased the reproducibility of subsequent thermal and moisture measurements. The reported blower flow rate and measured face velocity are therefore treated as separate operating descriptors; the face velocity values are the direct measurements used to characterize the spatial airflow distribution.
The structural configuration and airflow pathway of the laboratory-scale silo are illustrated in Figure 1, which includes the perforated aeration floor, centrifugal blower, airflow control system, and internal grain storage chamber. The integrated configuration presented stable operating conditions during the experiments and reduced systematic variations due to airflow non-uniformity.

2.2. SCTPC Design and Fabrication

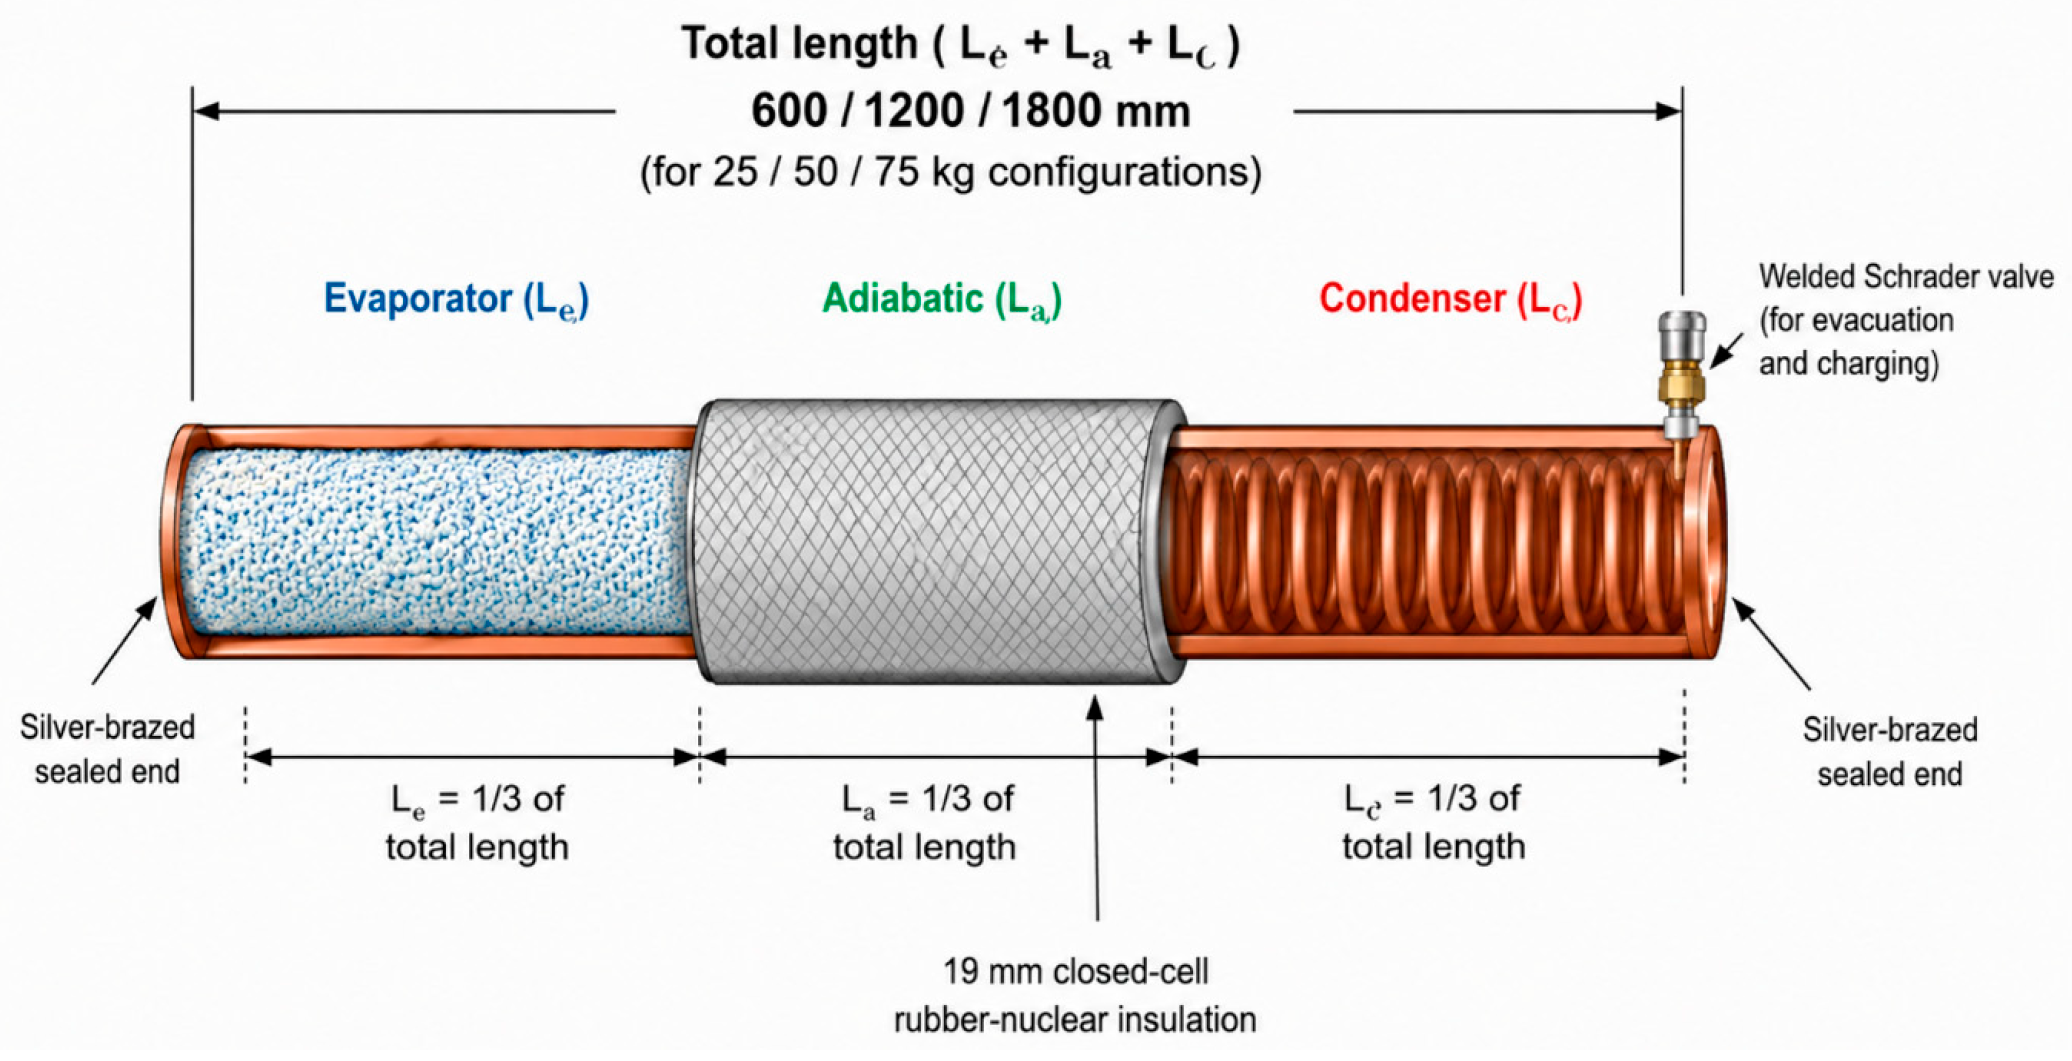
A laboratory-scale single closed two-phase cooling (SCTPC) unit, functioning as a gravity-assisted thermosyphon rather than a solar-chimney airflow device, was designed and built to passively remove heat from the stored grain bulk in a compact configuration that can be integrated with the experimental silo. The complete configuration of SCTPC is shown in Figure 2. The design was developed to provide identical geometric characteristics for all experimental configurations to enable direct comparison of the cooling performance under different paddy loading conditions. The SCTPC unit was constructed of commercially available ACR copper tubing with an outside diameter of 15.875 mm, a wall thickness of 0.700 mm, and an inside diameter of 14.475 mm. Copper tubing was chosen because of its high thermal conductivity, mechanical strength, and compatibility with hydrocarbon refrigerants operated under passive two-phase heat transfer. Each SCTPC unit was composed of three consecutive sections, an evaporator (Le), an adiabatic section (La), and a condenser (Lc), with equal length ratio of 1:1:1, following the design recommendations for gravity-assisted thermosyphon systems. This configuration provided a uniform thermal resistance along the heat transfer path, with uniform vapor transport and condensate return during operation. The adiabatic section was fully covered with 19 mm thick closed cell nitrile rubber insulation to minimize the radial heat transfer with the environment. In contrast, the condenser section was not insulated to maximize the heat rejection to the ambient air through natural convection. The evaporator section was placed inside the grain bulk to absorb the sensible heat generated inside the stored paddy, while the condenser section was placed outside the silo to allow continuous passive cooling, as shown in Figure 2.
To explore the performance of three load-matched grain/SCTPC configurations, total tube lengths of 600, 1200, and 1800 mm were used with storage capacities of 25, 50, and 75 kg, respectively. Because grain load, SCTPC geometry, active heat transfer length, and R-290 charge changed together, these conditions do not isolate an independent storage-capacity effect. As in the previous case, the length of the evaporator, adiabatic, and condenser sections was the same for all configurations and equal to one-third of the total tube length. Table 1 summarizes the geometric parameters and corresponding refrigerant loadings.
The required refrigerant charge was determined using the criterion Vi > 0.001 D2 (Le + La + Lc), where Vi is the internal vapor volume of the SCTPC unit. Based on this design criterion, R-290 charges of 12, 23, and 37 g were gravimetrically introduced in the 25, 50, and 75 kg configurations, respectively. To minimize charging uncertainty and ensure consistent refrigerant inventory for all experimental units, refrigerant charging was carried out using a calibrated electronic balance. Each SCTPC assembly was charged and then allowed to stabilize under laboratory conditions before being installed in the experimental silo. The procedure allowed for repeatable initial operating conditions and minimized variation due to refrigerant distribution before each experimental trial. Because R-290 is flammable, its use requires appropriate refrigerant handling and ignition control procedures. In the present laboratory procedure, hermetic integrity was checked by evacuation and dry-nitrogen leak testing before charging; the manuscript does not claim commercial-scale safety compliance.

2.3. Instrumentation and Data Acquisition

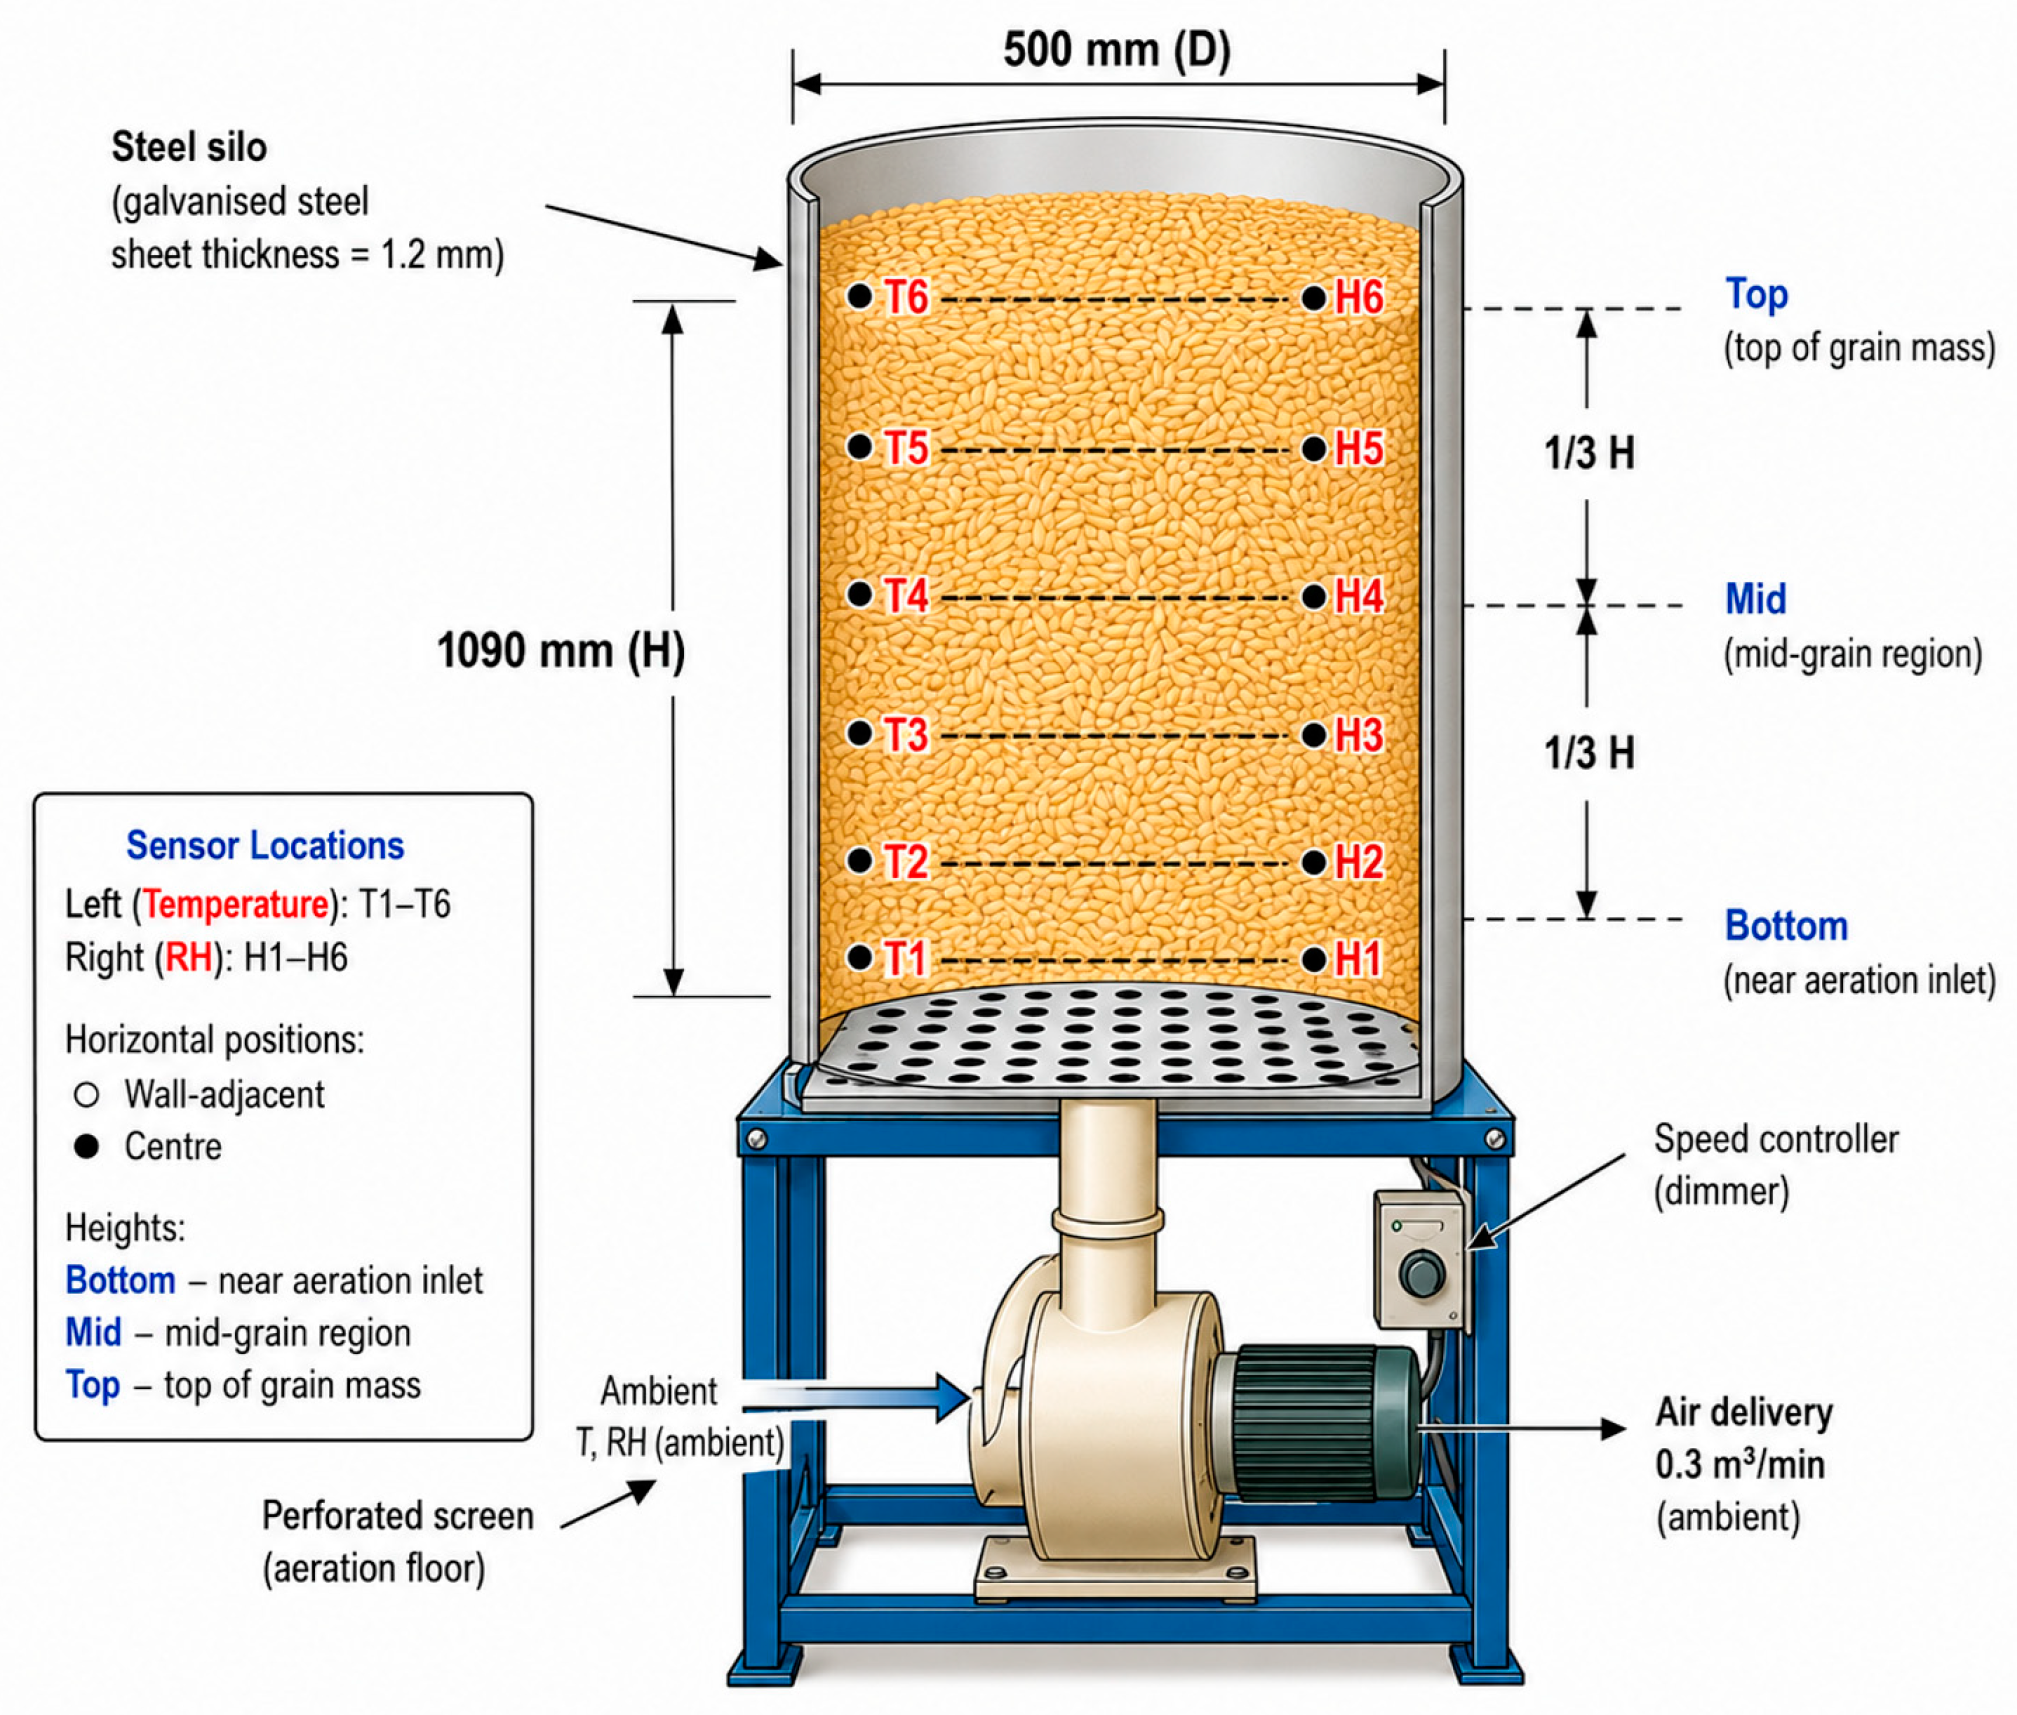
A complete monitoring system for temperature and relative humidity was installed to continuously characterize the thermal and moisture behaviors of the stored grain bulk during the whole experimental run. The measurement setup was designed to capture the horizontal and vertical distributions of temperature and relative humidity while ensuring consistent data acquisition under identical operating conditions. Figure 3 illustrates the sensor setup inside the lab-scale silo. Morse Space MSpace1 wireless data acquisition modules were used in conjunction with DHT22/AM2302 capacitive temperature–humidity sensors (Guangzhou Aosong Electronics Co., Ltd., Guangzhou, China) to monitor intergranular air temperature and relative humidity simultaneously. The measurement accuracies of the sensors were ±0.5 °C for the temperature and ±2%RH for the relative humidity during the storage experiments over the operating range encountered. Wireless communication was used for continuous real-time monitoring without cable interference in the grain bulk. Six relative humidity and temperature sensors (H1–H6 and T1–T6, respectively) were installed at predetermined positions to characterize the spatial variations over the stored grain mass. The monitoring positions were two horizontal locations (adjacent to the silo wall and the geometric center) and three vertical levels (the bottom region near the aeration inlet, the mid-grain region, and the upper grain layer), where heat and moisture accumulation during storage is generally most pronounced. This arrangement enabled simultaneous determination of the radial and vertical gradients associated with heat transfer and moisture migration. Before grain loading, we identified specific mounting sites to facilitate consistent sensor placement among all treatments in the experiment. The sensor sites were held constant throughout all experimental runs, thus removing positional variability between treatments and enhancing the reproducibility of comparative thermal analyses. The full sensor distribution in the grain bulk is presented in Figure 3. The sensor coordinates were defined by two horizontal positions (wall-adjacent and geometric center) and three vertical levels (bottom, mid-height, and top), with the vertical levels spaced at approximately one-third of the silo height (H ≈ 1090 mm).

2.4. Test Material

The experimental material was from recently harvested RD61 paddy rice. RD61 is one of the most cultivated high-yield rice cultivars in Thailand and is commercially important and widely used in post-harvest storage and drying systems. The harvested paddy was directly sourced from a commercial rice production area in Phitsanulok province, Thailand, and brought to the laboratory immediately after harvesting to minimize the quality deterioration prior to the experiment. Prior to each experimental run, foreign material, broken kernels, straw particles, and visible impurities were manually removed to ensure a homogeneous grain sample. The initial moisture content of paddy was determined with the help of a calibrated grain moisture meter and verified by the standard oven-drying method. The average initial moisture content was 14.2 ± 0.3% (wet basis), which is the moisture level typically recommended for commercial grain storage. Uniform initial moisture content among all the experimental treatments minimized the variations associated with evaporative heat transfer and moisture migration during storage. Three storage capacities of 25, 50, and 75 kg were studied to represent different grain-bed depths, maintaining the same geometry of the silo. These loading conditions enabled systematic evaluation of the effect of storage depth on the thermal performance of the SCTPC system under otherwise identical operating conditions. For each experimental run, fresh paddy samples were used to avoid any possible effect of repeated heating–cooling cycles or previous storage history.

2.5. Experimental Design and Operating Conditions

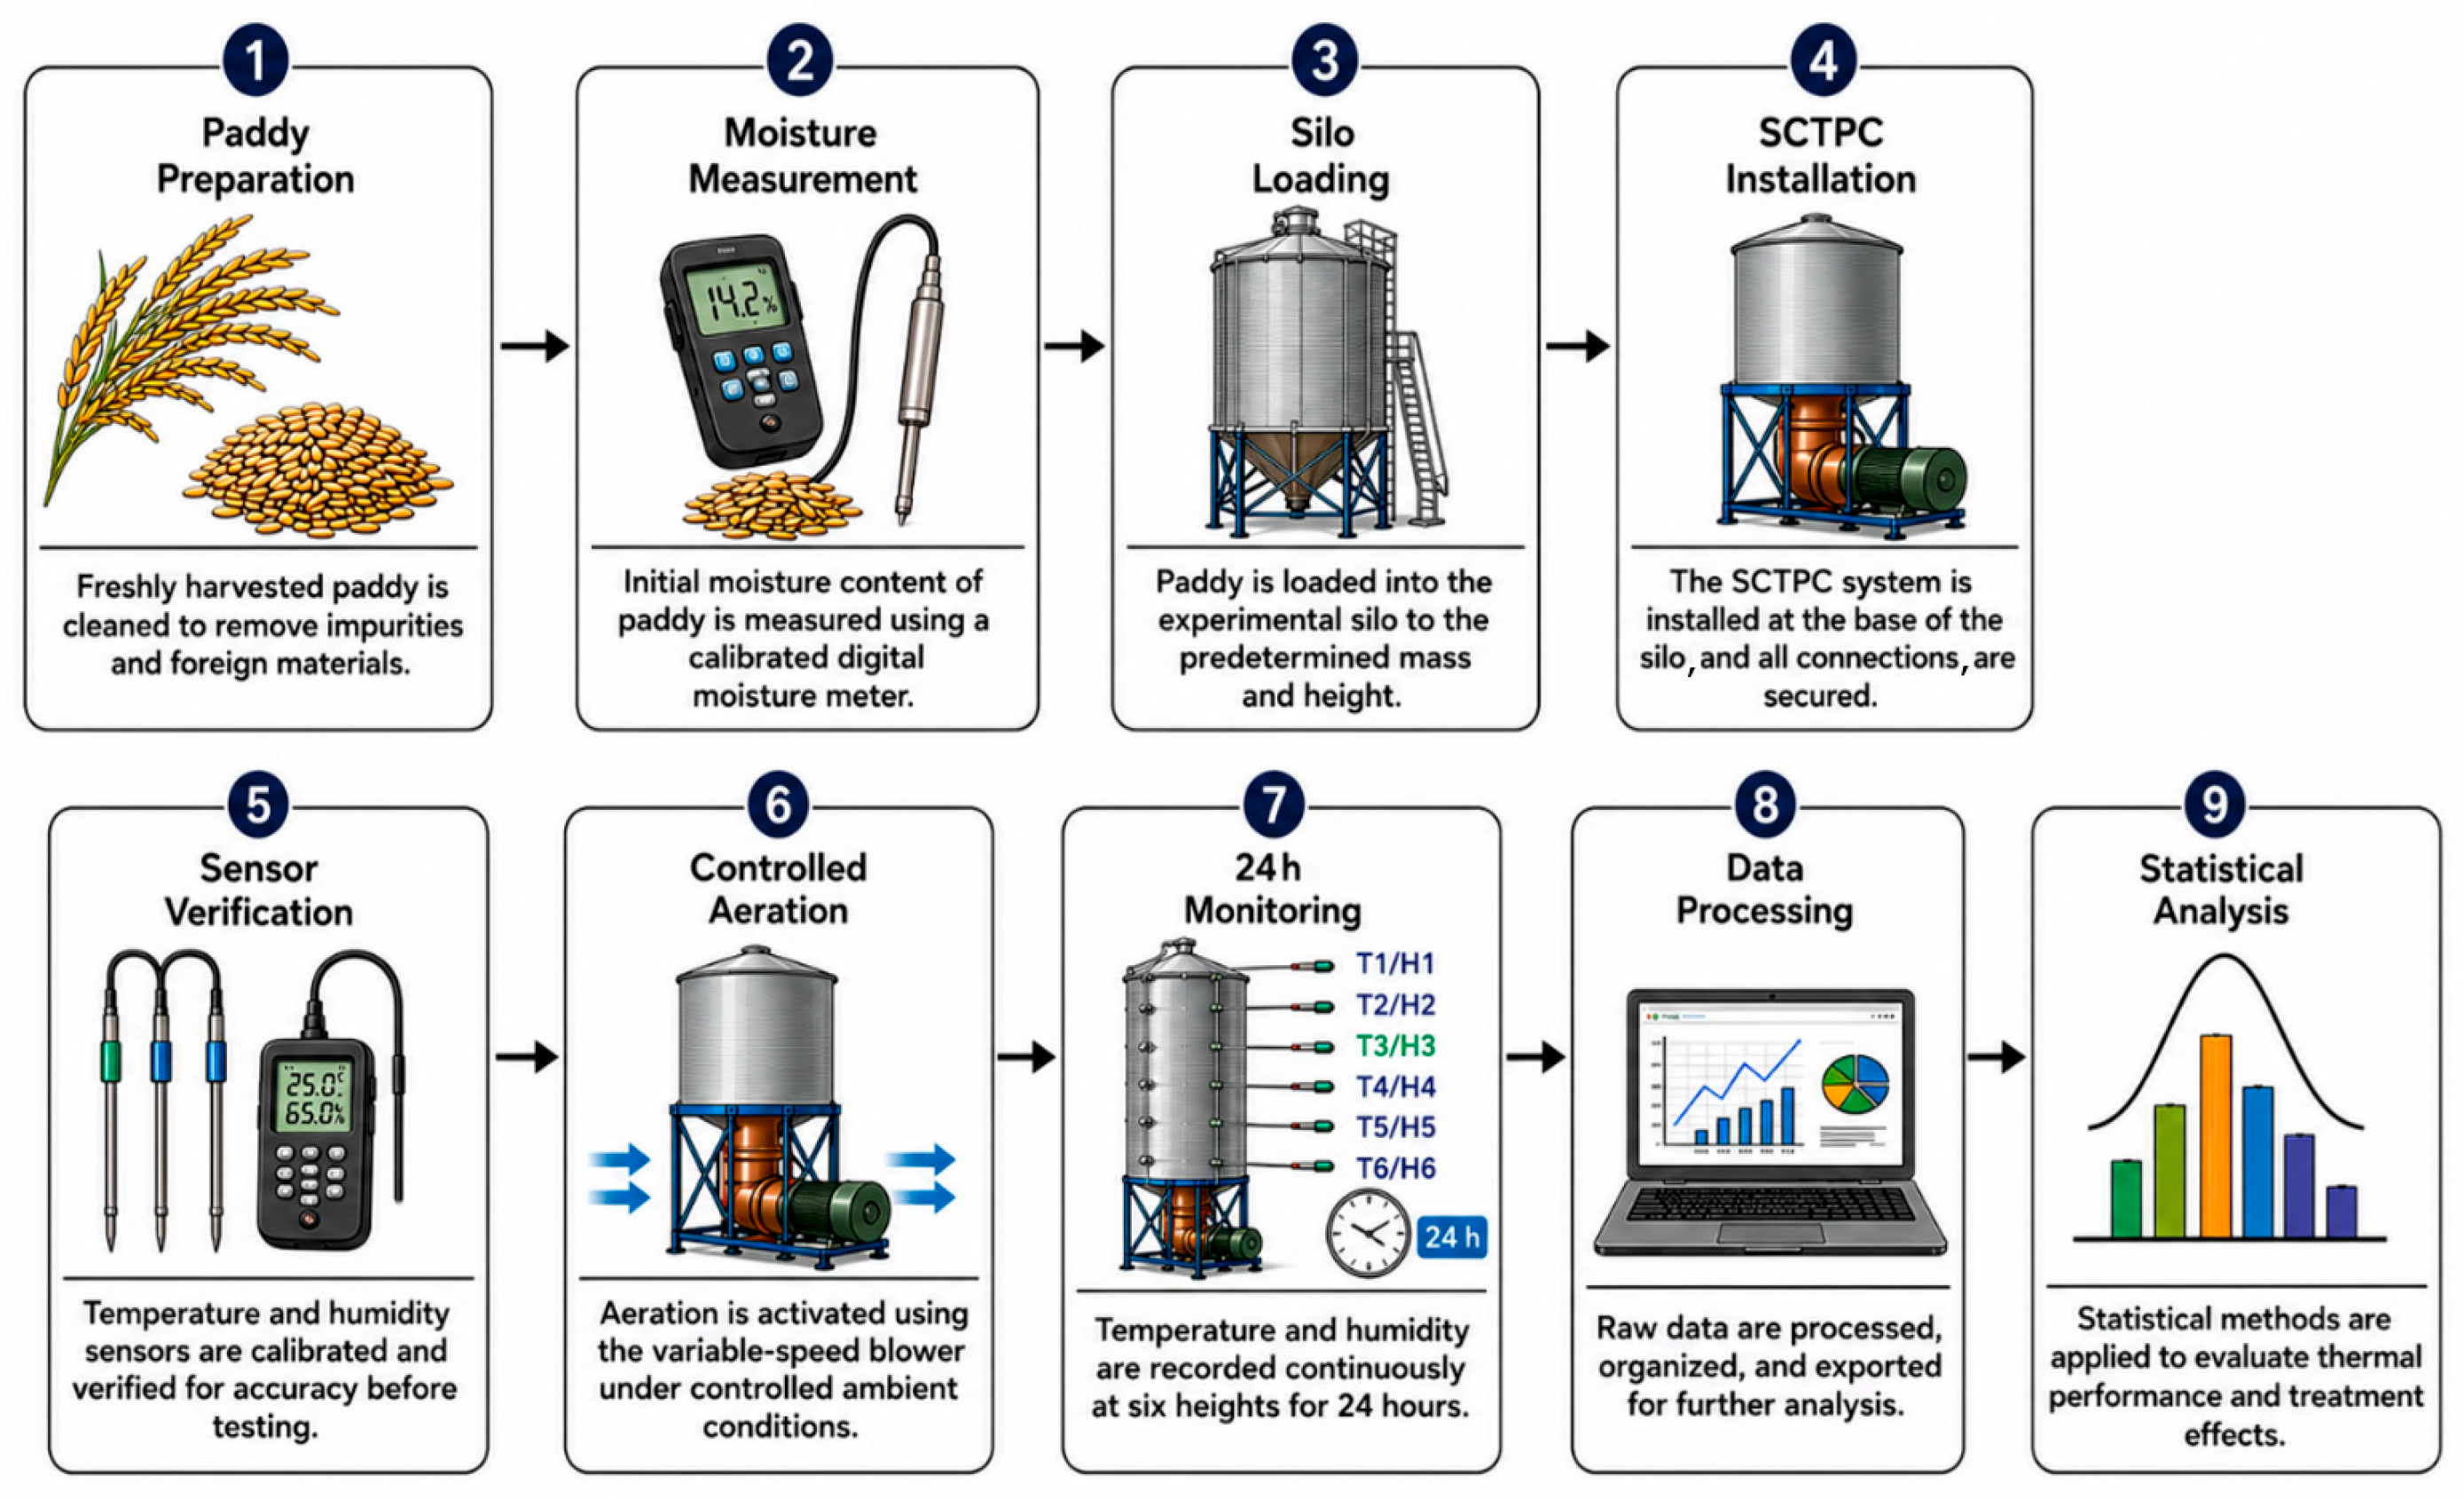
The experimental programmer was designed systematically to evaluate the cooling effectiveness of the single closed two-phase cooling (SCTPC) system under controlled conditions of paddy storage with high experimental reproducibility. Figure 1, Figure 2 and Figure 3 show the laboratory-scale silo, SCTPC configuration, and sensor layout. Figure 4 summarizes the overall experimental workflow including sample preparation, system installation, sensor validation, controlled aeration, continuous monitoring, and data analysis. Three representative capacities of grain-bed depths are chosen as 25, 50, and 75 kg for the same silo dimensions. For each storage capacity, an SCTPC unit with proportional evaporator lengths of 200, 400, and 600 mm, respectively, was installed, in order to keep the geometric relation between the heat transfer device and the grain bulk constant. Each experiment was run continuously for 24 h, and the temperature and relative humidity were simultaneously recorded from all the pre-determined monitoring sites within the storage silo. The effects of the grain-bed depth and the SCTPC configuration were isolated by fixing all other experimental parameters for the study. The controlled parameters were laboratory-scale silo dimensions, perforated aeration floor, blower specifications, airflow rate (0.3 m3/min), ambient laboratory environment, initial grain moisture content, SCTPC tube dimensions and construction material, refrigerant type (R-290), sensor locations, and data acquisition interval. By holding constant the operating conditions, any variation in cooling performance was attributable to the experimental variables and not to uncontrolled environmental or operational conditions. Before the beginning of each experimental trial, all measuring instruments were calibrated and functionally checked as described in Section 2.3. The SCTPC system was then allowed to equilibrate thermally with the surrounding environment prior to grain loading so as to establish the same initial conditions in all experimental runs. Paddy was filled manually into the silo, and the grain surface was leveled carefully without any mechanical compaction so that minimum segregation happened and the bulk density was comparable in all storage capacities. After the completion of system preparation, the centrifugal blower and SCTPC unit were operated in parallel under controlled conditions. Monitoring was started immediately after system startup, and all temperature and relative humidity measurements were automatically synchronized and recorded during the experimental period. Then, the obtained data sets were processed to quantitatively evaluate the thermal and moisture control performance of the SCTPC system. The experiments were conducted under laboratory ambient conditions; because solar irradiation was not independently controlled or systematically recorded as an experimental factor, the analysis is framed in terms of ambient thermal conditions rather than a quantified solar-load input.
A treatment matrix with four cooling combinations and three load-matched configurations was established. The four treatment combinations were defined by SCTPC operation (present/absent) and forced aeration (on/off). Because grain load, SCTPC geometry, and refrigerant charge changed together across the three configurations, the load levels were treated as descriptive experimental conditions rather than as an independent factorial storage-capacity factor; therefore, no treatment × load interaction was statistically tested. Accordingly, the observed capacity-dependent changes in cooling performance were evaluated not only from the mean differences among treatments but also from the physical interaction between cooling configuration and grain-bed depth. The four treatment combinations were (i) no aeration and SCTPC in ambient storage (T1), (ii) forced aeration only (T2), (iii) SCTPC only (T3), and (iv) forced aeration and SCTPC (T4). The treatment was evaluated at paddy storage capacities of 25, 50, and 75 kg for each treatment according to the workflow of the experiment, as shown in Figure 4. Thus, the experimental matrix comprised four cooling treatments × three storage capacities × three independent experimental runs, providing a total of thirty-six experimental runs. This design enabled the effects of cooling configuration and storage capacity to be evaluated separately while maintaining consistent initial grain and operating conditions.

2.6. Performance Indicators and Data Processing

A set of engineering performance indicators was employed to quantitatively evaluate the thermal performance of the single closed two-phase cooling (SCTPC) system, including cooling capability, intergranular air temperature distribution, and relative humidity conditions within the stored grain bulk. The main thermal indicator was the mean intergranular air temperature (MIAT), calculated at each sampling time as the arithmetic mean of the six temperature sensors installed at predefined monitoring locations inside the storage silo:
M I A T ( t ) = T 1 ( t ) + T 2 ( t ) + T 3 ( t ) + T 4 ( t ) + T 5 ( t ) + T 6 ( t ) 6
where T 1 T 6 are the temperatures measured at the six predefined monitoring locations. T 3 and T 5 are treated as individual sensor locations and are not used as substitutes for the six-sensor MIAT. To evaluate cooling effectiveness relative to the control treatment ( T 1 ), the peak temperature reduction ( Δ T p e a k ) was calculated from the corresponding mean daily peak intergranular air temperature values according to Equation (2):
Δ T p e a k = T p e a k , c o n t r o l T p e a k , t r e a t m e n t
where Δ T p e a k , c o n t r o l is the mean peak intergranular air temperature of the control treatment, and T p e a k , t r e a t m e n t is the corresponding value for each experimental treatment. Higher values of Δ T p e a k indicate a greater reduction in peak intergranular air temperature relative to the control condition.
The cooling performance of the SCTPC system was further assessed using the temperature difference (ΔT), defined as the difference between the mean grain-bulk temperature and the corresponding ambient air temperature measured simultaneously during the experiment:
Δ T = T g T a
where T g denotes the MIAT, and T a represents the ambient air temperature. Relative humidity control within the grain bulk was evaluated using the relative humidity difference (ΔRH) between the stored grain bulk and the surrounding ambient environment:
Δ R H = R H g R H a
where R H g and R H a denote the average relative humidity within the grain bulk and the ambient relative humidity, respectively.
Positive values of ΔT and ΔRH indicate that the grain bulk remained warmer and more humid than the surrounding ambient environment, respectively. MIAT, ΔT, and ΔRH were calculated throughout the 24 h experiment to evaluate the temporal evolution of the thermal and relative humidity conditions. Because relative humidity is temperature-dependent, ΔRH is interpreted here as an indicator of intergranular air humidity distribution and stratification rather than as a direct measurement of grain-moisture removal or water-mass loss.
Δ R H n e t = R H H 5 , C o n t r o l R H H 5 , t r e a t m e n t
where R H H 5 , C o n t r o l is the relative humidity measured at sensor H5 under the control treatment (T1), and R H H 5 , t r e a t m e n t is the corresponding relative humidity measured at the same sensor under each experimental treatment. This parameter was used to evaluate changes in relative humidity conditions in the upper grain layer, where moisture accumulation and condensation may occur. Larger positive values of R H n e t indicate a greater reduction in local relative humidity compared with the control condition; however, this parameter is not interpreted as a direct measure of moisture removal because grain moisture content and water-mass balance were not directly measured.

2.7. Statistical Analysis

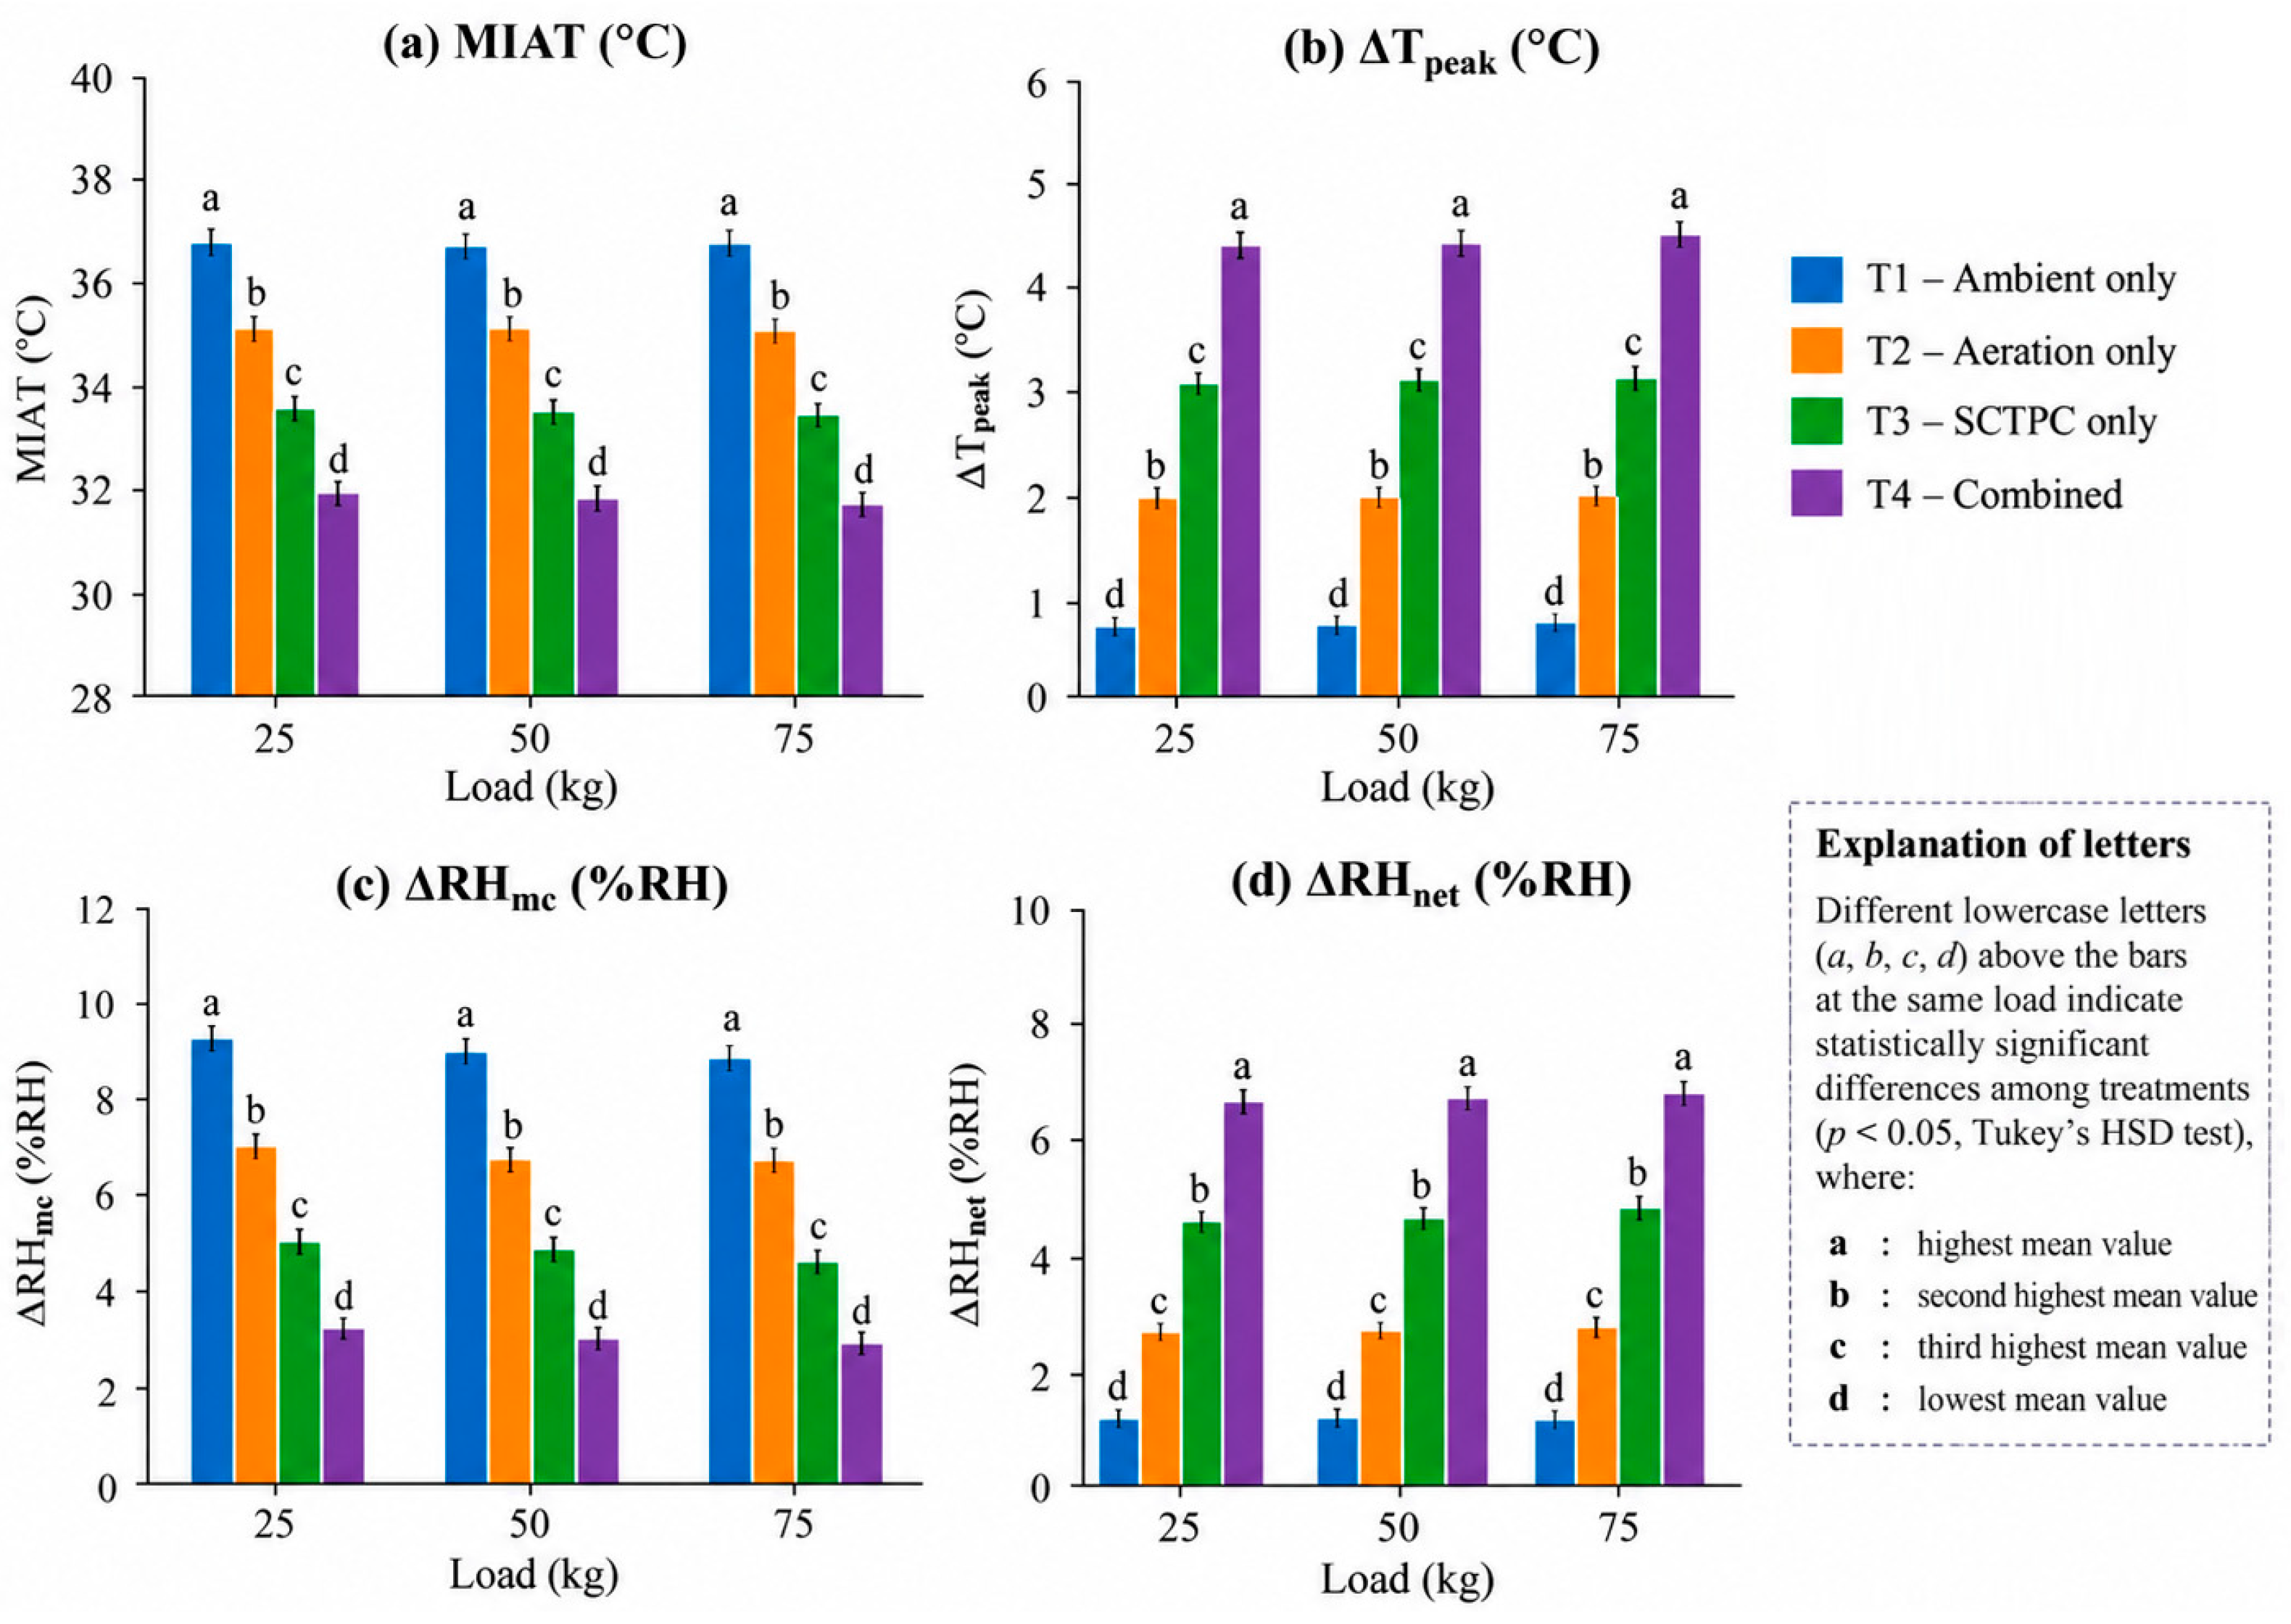
All experimental measurements were performed in three independent runs under the same operating conditions to evaluate reproducibility. Temperatures and relative humidity are given as the mean ± SD unless otherwise specified. Statistical analysis was performed using OriginPro (Version 2025, OriginLab Corporation, Northampton, MA, USA). Statistical comparison was preceded by a normality check of the experimental data. Because grain load, SCTPC geometry, and refrigerant charge changed together, the three load-matched configurations were not treated as an independent storage-capacity factor in a factorial model. The independent experimental run was treated as the experimental unit, and repeated time-series observations were not treated as independent replicates. The results are therefore presented primarily as descriptive run-level comparisons; no treatment-by-capacity interaction or statistically significant interaction is inferred. In the validation procedure, the comparison between calibrated sensors and reference instruments was carried out by linear regression analysis. The coefficient of determination (R2) was used to quantify goodness of fit, and root mean square error (RMSE) was used to assess predictive accuracy. All measuring instruments were calibrated before each series of experiments, and the data acquisition system was checked before loading the grains. Because the analysis was descriptive at the run level, no significance letters are assigned to the figures, and no treatment × load interaction or statistically significant interaction is claimed. The analysis did not introduce run order or timepoint observations as additional independent factors.
In the validation procedure, the comparison between calibrated sensors and reference instruments was carried out by linear regression analysis. The coefficient of determination (R2) was used to quantify the goodness of fit. The root mean square error (RMSE) was also used to assess the predictive accuracy of the regression models. All measuring instruments were calibrated before each series of experiments in order to minimize the experimental uncertainty and the whole data acquisition system was checked before loading the grains. According to the predefined quality control procedure, any abnormal sensor reading caused by communication interruption or instrument malfunction was excluded from the statistical analysis.

2.8. Generative AI Use

A generative AI tool (ChatGPT, GPT-5.5, OpenAI) was used solely to assist with language editing and improving the presentation of figures, Figure 1, Figure 2, Figure 3 and Figure 4. The AI tool was not used for data generation, data analysis, the interpretation of results, or drawing scientific conclusions. All scientific content was reviewed, verified, and approved by the authors.

3. Results and Discussion

3.1. Thermal Performance of the SCTPC System

The storage of grains requires effective suppression of heat accumulation, since high temperatures promote moisture migration and microbial activity and increase the risk of localized spoilage. The major objective of the proposed single closed two-phase cooling (SCTPC) system was to maintain lower and more uniform intergranular air temperature during the experimental period and to reduce relative humidity stratification. Four engineering performance indicators were used to assess the thermal performance of the SCTPC system: mean intergranular air temperature (MIAT), peak temperature reduction (ΔTpeak), vertical relative humidity difference (ΔRHmc), and net relative humidity reduction (ΔRHnet). The quantitative results are summarized in Table 2, and the corresponding comparisons are shown in Figure 5.
Forced aeration (T2) decreased the MIAT by about 2 °C compared to the control, showing that continuous airflow enhanced convective heat transfer within the grain bulk. However, the cooling effect was limited because the supplied air approached thermal equilibrium as it passed through the grain bed and thus reduced its ability to remove further heat from the upper storage layers. Therefore, forced aeration alone was not able to overcome the vertical temperature gradient, especially at the higher grain loads where the pathway for air was longer and the resistance to heat transfer was higher. These results indicate that conventional aeration mainly improves the surface and inlet near cooling but is not able to effectively reduce the internal heat accumulation within the whole storage volume. A lower 24 h mean MIAT was observed for Treatment T3 relative to T1 in Table 2; however, the 25 kg T3 cooling effect indicators are not attributed to SCTPC operation because no measurable passive cooling was confirmed in the dedicated operational assessment. At 50 and 75 kg, the SCTPC system produced measurable cooling relative to the corresponding ambient condition. These results support the effectiveness of passive two-phase heat transfer under the tested conditions where sufficient thermal driving force and condenser exposure were available. Unlike conventional ventilation, the SCTPC system uses the evaporation and the condensation of the R-290 refrigerant to transfer the heat from the embedded evaporator in the grain mass to the external condenser without mechanical refrigerant circulation. The heat absorbed from the surrounding grains caused the evaporation of the refrigerant, and the absorbed thermal energy was continuously rejected to the ambient environment at the condenser. Such a passive phase change mechanism allowed for a continuous heat transfer for the whole experimental period of 24 h, thereby restricting the internal heat accumulation with limited external energy input.
The best overall temperature response was observed when the SCTPC system was combined with forced aeration (T4). The minimum 24 h mean MIAT values were 31.7 ± 0.3, 32.0 ± 0.3, and 32.3 ± 0.4 °C for 25, 50, and 75 kg storage capacities, respectively (Figure 5a). The maximum 24 h MIAT reduction (ΔTpeak) was approximately 4.4 °C. The relatively stable temperature reduction across the three load-matched configurations indicates that the proportional increase in evaporator length provided a comparable heat transfer pathway through the grain bed. This observation should not be interpreted as a pure storage-capacity effect because the SCTPC geometry and refrigerant charge changed simultaneously.
Table 2 reports 24 h mean MIAT; these values are therefore not treated as interchangeable. For the 25 kg T3 condition, the lower 24 h mean MIAT is retained as a descriptive between-run result and is not attributed causally to SCTPC operation.

3.2. Airflow Distribution and Its Contribution to Cooling Performanc

The total thermal performance of the SCTPC-aided storage system was evaluated, and the airflow properties through the perforated aeration screen were subsequently examined to gain better insight into the mechanisms controlling heat removal within the grain bulk. In forced aeration storage, the cooling efficiency is not only related to the total volume of air supplied but also to the spatial distribution of the air entering the grain bed. Local variations in air velocity have a direct effect on the convective heat transfer coefficient and thus the rate of sensible heat removal from various parts of the stored grain. Thus, the quantification of the face velocity distribution is a key basis for the interpretation of the thermal behaviors presented in Section 3.1. The measured airflow properties are presented in Table 3, and the spatial airflow profile is shown in Figure 6. The overall mean face velocity of the aeration system was 0.60 m s−1, with an overall standard deviation of 0.18 m s−1 and coefficient of variation (CV) of 30% (Table 3). The relatively small variation of five replicate measurements indicates that the centrifugal blower was run under stable conditions during the experimental period. Thus, differences recorded at the five measurement sites can be largely related to the distribution of the airflow induced under the perforated aeration screen rather than to differences in blower performance. This result increases our confidence that the thermal responses reported in Section 3.1 are due to the designed airflow configuration and not to experimental variability.
Figure 6a shows the spatial distribution of the face velocity. The highest mean velocities were found at the peripheral positions P1 (0.80 ± 0.10 m s−1) and P5 (0.87 ± 0.04 m s−1), and the lowest average velocity was observed at the center of the aeration screen (P2) (0.29 ± 0.04 m s−1). Intermediate flow velocities were measured at P3 (0.46 ± 0.09 m s−1) and at P4 (0.59 ± 0.05 m s−1). The corresponding profile of airflow is shown in Figure 6b, which can be characterized as a U-shaped distribution over the aeration surface. It means that air mainly escaped to the peripheral regions and then redistributed to the central area. This behavior is consistent with the pressure drops and flow resistance typically present in aeration systems with perforated floors, where local pressure gradients influence the discharge velocity through each perforation. While the distribution of the airflow was not ideal, all measurement sites experienced positive airflow over the grain bed, i.e., the entire aeration surface was involved in heat removal. From a heat transfer perspective, the higher face velocities at P1 and P5 increase the local convective heat transfer coefficient and thus increase the sensible heat removal from the adjacent grain layers. On the contrary, the reduced velocity in the aeration screen canter may lead to a local decrease of convective cooling and may lead to temporary heat accumulation in the center grain region. The non-uniformity of airflow in traditional aeration systems often causes the formation of persistently existing temperature gradients and uneven migration of moisture through the storage bulk. Therefore, the measured coefficient of variation of 30% should be considered an important design characteristic rather than an experimental defect because it represents the realistic spatial variability of airflow that the SCTPC system was required to operate under. The ability of the integrated system to maintain improved thermal performance despite this non-uniform airflow provides additional evidence that passive heat transport can compensate for locally reduced convective cooling.
However, the thermal results (Section 3.1) indicated that the SCTPC and aeration treatment combination had the lowest MIATs and greatest temperature reductions despite moderate spatial variation in airflow distribution. This suggests that the passive two-phase cooling system effectively reduced the local variations of convective cooling by continuously transporting the thermal energy from the high-temperature zones to the external condenser through evaporation and condensation of the R-290 working fluid. The proposed cooling approach is based on the complementary mechanisms of sensible and latent heat transfer instead of the airflow to carry away the heat. Thus, the overall thermal performance was far less sensitive to the non-uniformity of flow, and the temperature field in the bulk of the grain became more uniform.
An important engineering consequence of these results is that the proposed aeration configuration exhibited measurable spatial variability in airflow, with a coefficient of variation of approximately 30%. The stable delivery of airflow (Table 3) and the spatial profile shown in Figure 6 provide a basis for interpreting the thermal responses across the tested conditions. The interaction between forced convection and passive two-phase heat transfer suggests that simply increasing the airflow rate is not sufficient for effective thermal management of bulk paddy storage and that other heat removal mechanisms may be useful for improving cooling uniformity. The present findings are limited to the laboratory-scale conditions tested here and do not establish commercial-scale applicability.

3.3. Ambient-Only Baseline (Treatment T1)

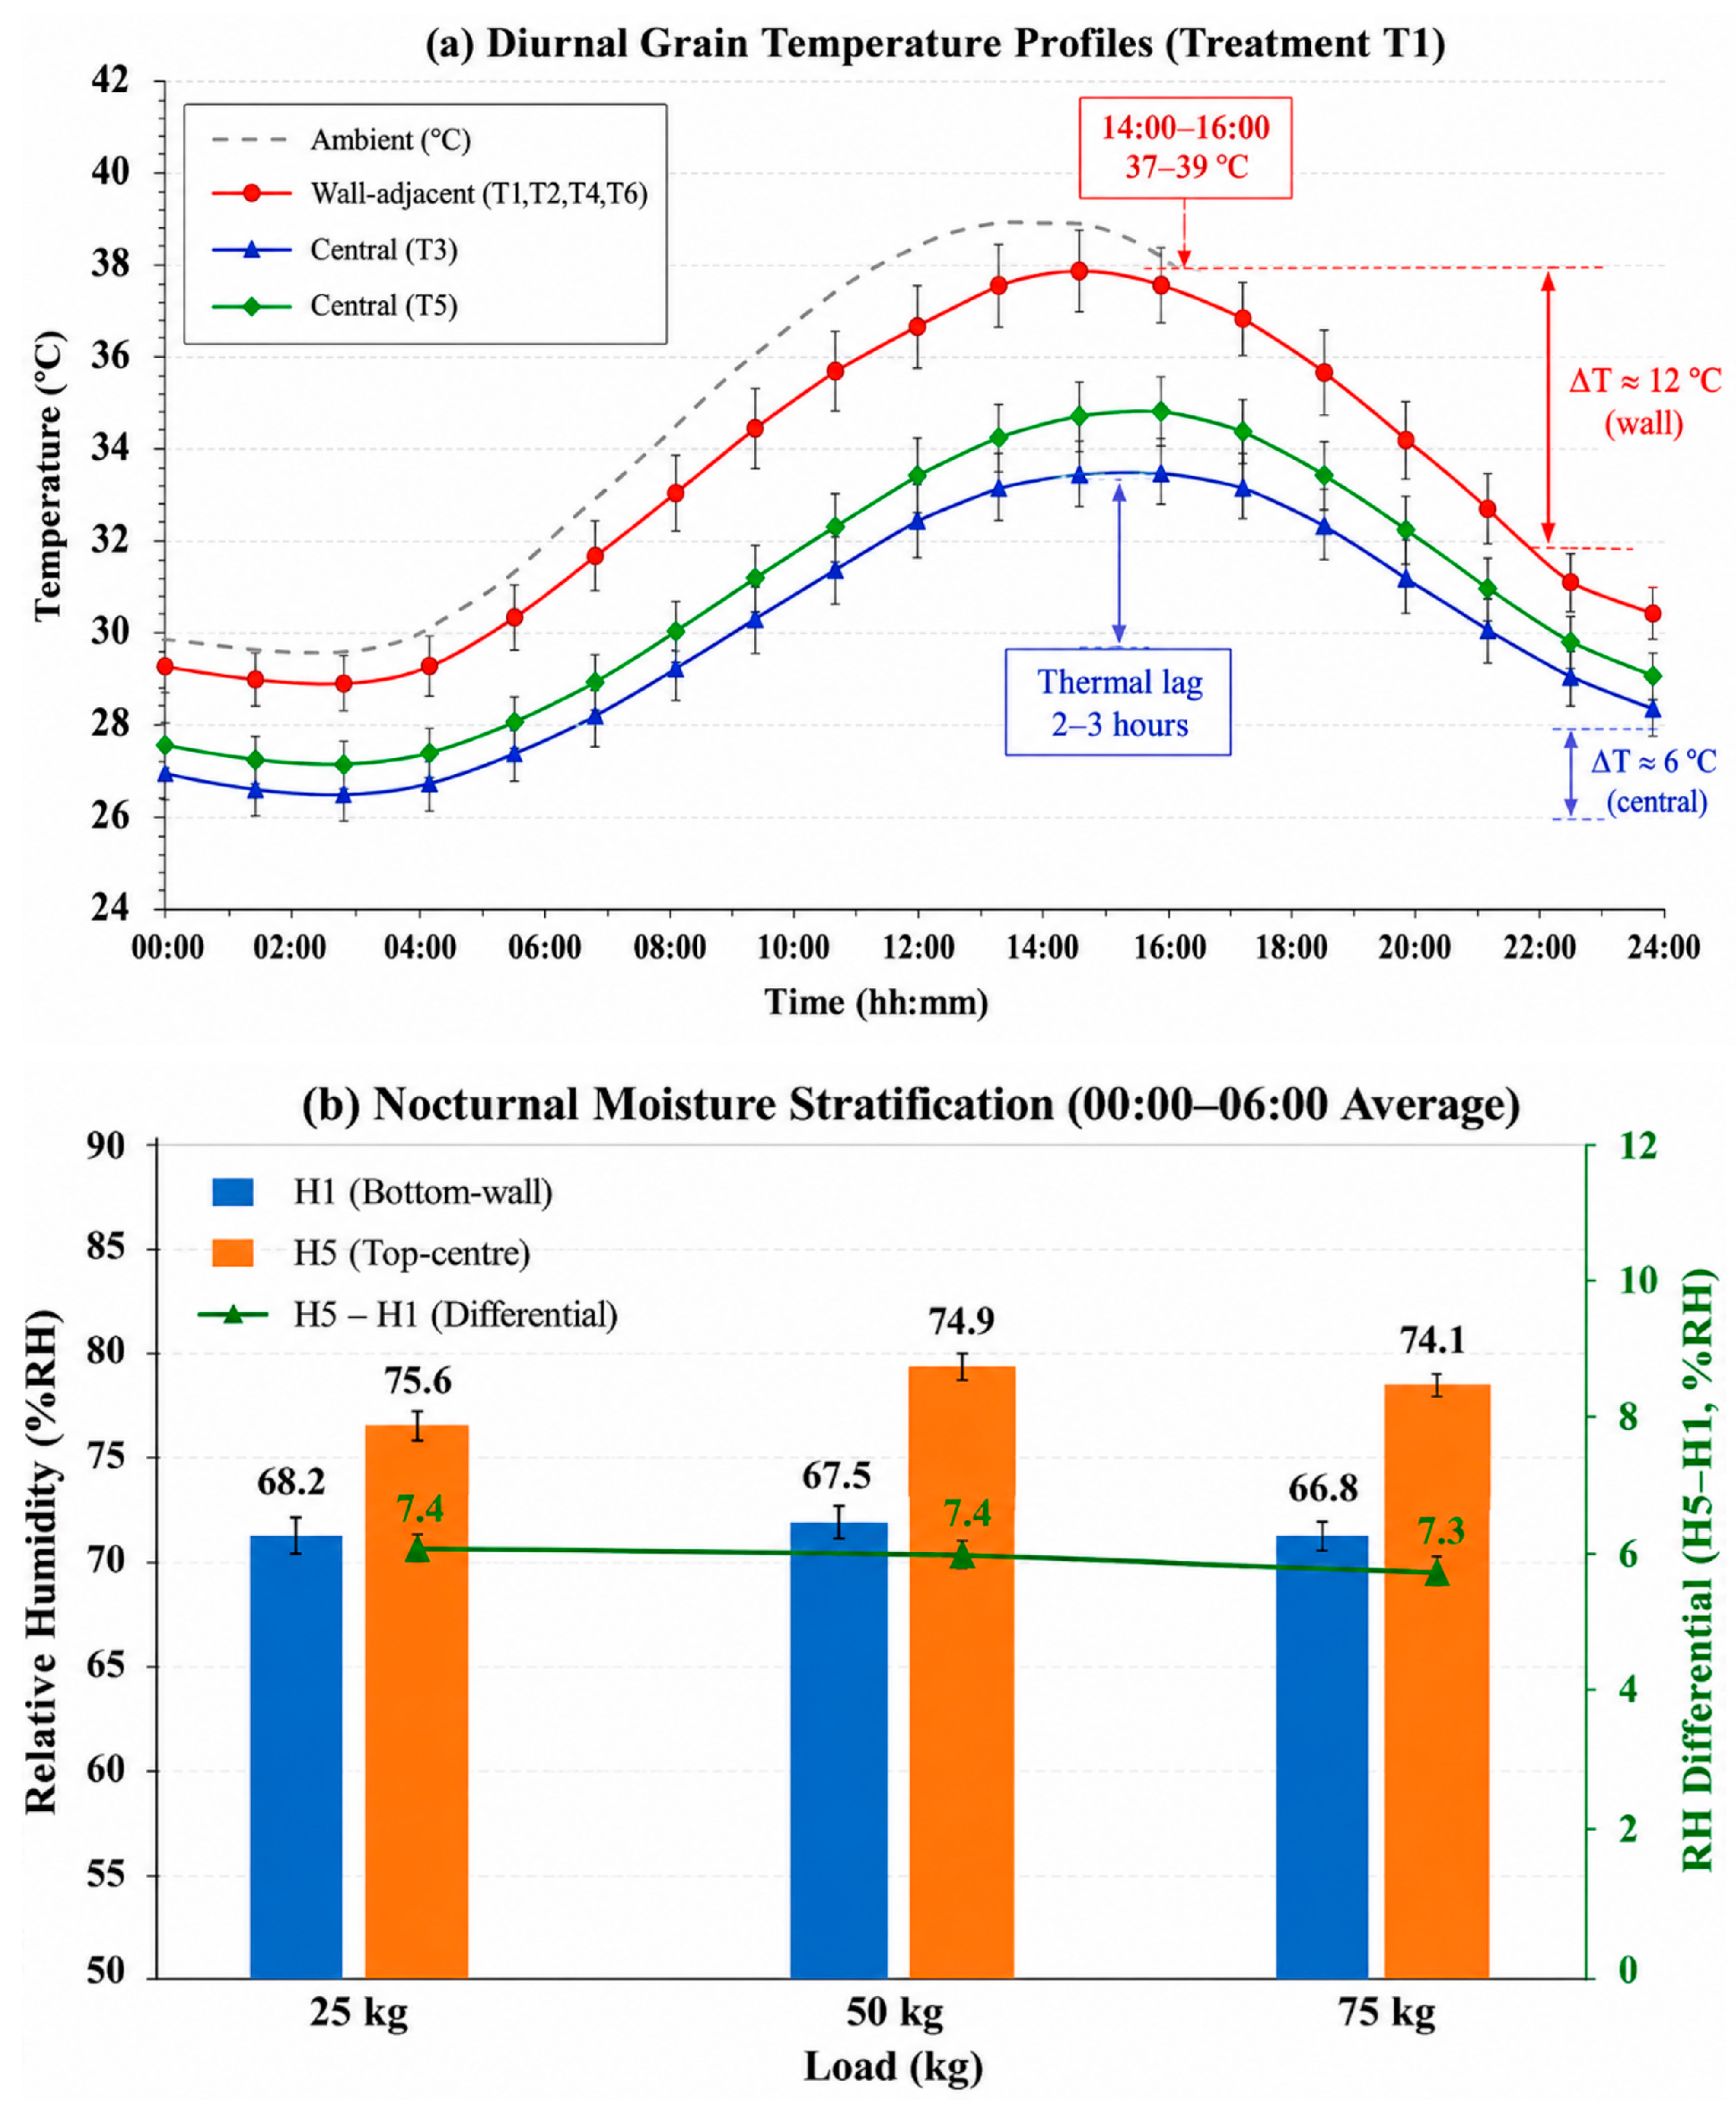
The control storage condition, T1, is the storage of paddy grain in ambient environmental conditions without aeration or SCTPC. This baseline is important as it describes the natural thermal and moisture behavior of bulk grain in tropical climatic conditions and serves as a reference for evaluating the effectiveness of the proposed cooling strategies. The main indices of the thermal humidity regime are presented in Table 4. Temporal changes in temperature and distribution of humidity during the night are shown in Figure 7. The mean peak grain temperature (MIAT) increased gradually from 36.3 °C at 25 kg storage capacity to 38.4 °C at 75 kg. The daily temperature peak occurred from 15:00 to 16:00, as shown in Table 4. The delay in the temperature maximum indicates that the thermal inertia of the storage system increased significantly with increased grain mass, although the increase in the MIAT was rather mild. Larger grain volumes have higher heat storage capacity and a lower surface area-to-volume ratio, which reduces the rate of heat dissipation to the surrounding environment. Therefore, the grain bulk still accumulated thermal energy with the decrease in the ambient temperature, the maximum temperature lagged behind, and the heat lasted for a long time.
Figure 7a shows the diurnal temperature profiles, which further illustrate these thermal behaviors. The ambient air temperature rises quickly in the afternoon, but the grain temperature lags behind slowly due to the slow heat transfer through the porous grain bed by conduction and natural convection. The sensors closest to the wall always showed the highest temperatures, with values of about 37–39 °C between 14:00 and 16:00, while the grain sensors in the middle remained significantly cooler throughout the heating period. The measured thermal lag of about 2–3 h indicates that the grain bulk acted as a thermal buffer and delayed the heat propagation from the silo wall to the interior. This is a typical behavior for bulk agricultural materials with relatively low effective thermal conductivity, where the internal heat transfer process is much slower than the fluctuations of the surrounding air temperature. The magnitude of the temperature variations listed in Table 4 supports this interpretation. The diurnal temperature amplitude in the peripheral zone was 11.8–12.3 °C, and in the central grain zone it was only 5.9–6.3 °C, about half of the value near the silo wall. The steep thermal gradient indicates that the solar heat was preferentially absorbed by the outer steel wall and subsequently conducted slowly into the grain interior. Hence, the peripheral grain was subjected to rapid thermal cycles, while the central region was thermally stable. Less temperature variation in the core might be a plus, but the long heat retention might keep the temperature high for long periods and increase the potential for moisture migration with long storage.
The nocturnal humidity measurements (Figure 7b and Table 4) clearly reflect the relationship between thermal gradients and moisture redistribution within the grain bulk. The relative humidity measured near the top-center position (H5) was higher than that measured near the bottom-wall location (H1) for all the storage capacities for the time period between 00:00 and 06:00. The vertical relative humidity difference thus remained at a relatively constant level of about 7.3–7.4%RH, which indicated a continuous moisture stratification during the whole storage period. The behaviors can be explained by the combined effect of heat-driven vapor transport and nocturnal cooling. During the day, the moisture evaporated from the lower and warmer layers of grain moved upwards with the temperature gradient to condense in the cooler upper portion of the bulk of grain at night. This daily cycle of evaporation and condensation will continue, gradually increasing the concentration of moisture in the upper layers of grain and increasing the risk of localized deterioration, but only moderate changes in the average moisture content of the stored grain will occur.
An interesting observation is the slight change in the vertical humidity difference with the increase in storage capacity from 25 to 75 kg, although the grain mass increased. This suggests that the storage capacity alone is not the primary driving force for moisture migration under ambient storage conditions, but rather persistent temperature gradients are. Following the establishment of thermal stratification, vapor transport proceeds until thermal equilibrium is approached. As a consequence, similar humidity gradients are observed in different grain loads. Therefore, merely increasing or decreasing the quantity of stored grain cannot effectively eliminate moisture redistribution without simultaneously controlling internal heat accumulation. In general, the baseline results (Table 4 and Figure 7) indicate that ambient storage under tropical conditions usually leads to heat accumulation, delayed thermal response, and persistent vertical moisture stratification within the bulk grain. High grain temperatures during the afternoon, large thermal gradients from the wall to the center, and stable nocturnal humidity differences give a clear physical explanation for the deterioration risks often experienced in long-term paddy storage. These baseline parameters provide the engineering motivation for the application of active heat removal techniques such as forced aeration and the SCTPC system to reduce the thermal gradients and limit moisture migration in bulk grain storage systems.

3.4. Thermal and Moisture Responses Under Forced Aeration (Treatment T2)

The treatment T2 was used to determine the effectiveness of forced aeration alone in the control of intergranular air temperature and relative humidity stratification under tropical storage conditions. The continuous airflow (rather than ambient only storage of Section 3.3) provides an additional avenue for convective heat transfer, which increases the removal of heat from the grain bulk and also promotes the exchange of moisture with the ambient air. Thermal and humidity indicators achieved under treatment T2 are presented in Table 5, and the diurnal temperature profiles and the nocturnal humidity distribution are shown in Figure 8. The results showed that forced aeration had a significant reduction in heat accumulation over the ambient-only condition. From Table 5, it can be seen that the MIAT was 34.0 to 34.6 °C at the storage capacities studied. This was about 2 to 4 °C lower than the untreated baseline shown in Section 3.3. The MIAT increased slightly with increasing grain load from 25 to 75 kg, but the magnitude of this increase was much lower than that observed under ambient storage conditions, indicating that continuous airflow successfully prevented the buildup of excessive heat in the grain bulk. Such behaviors indicate the increased convective heat transfer of the aeration system, the incoming air constantly removing sensible heat before large temperature gradients could be developed.
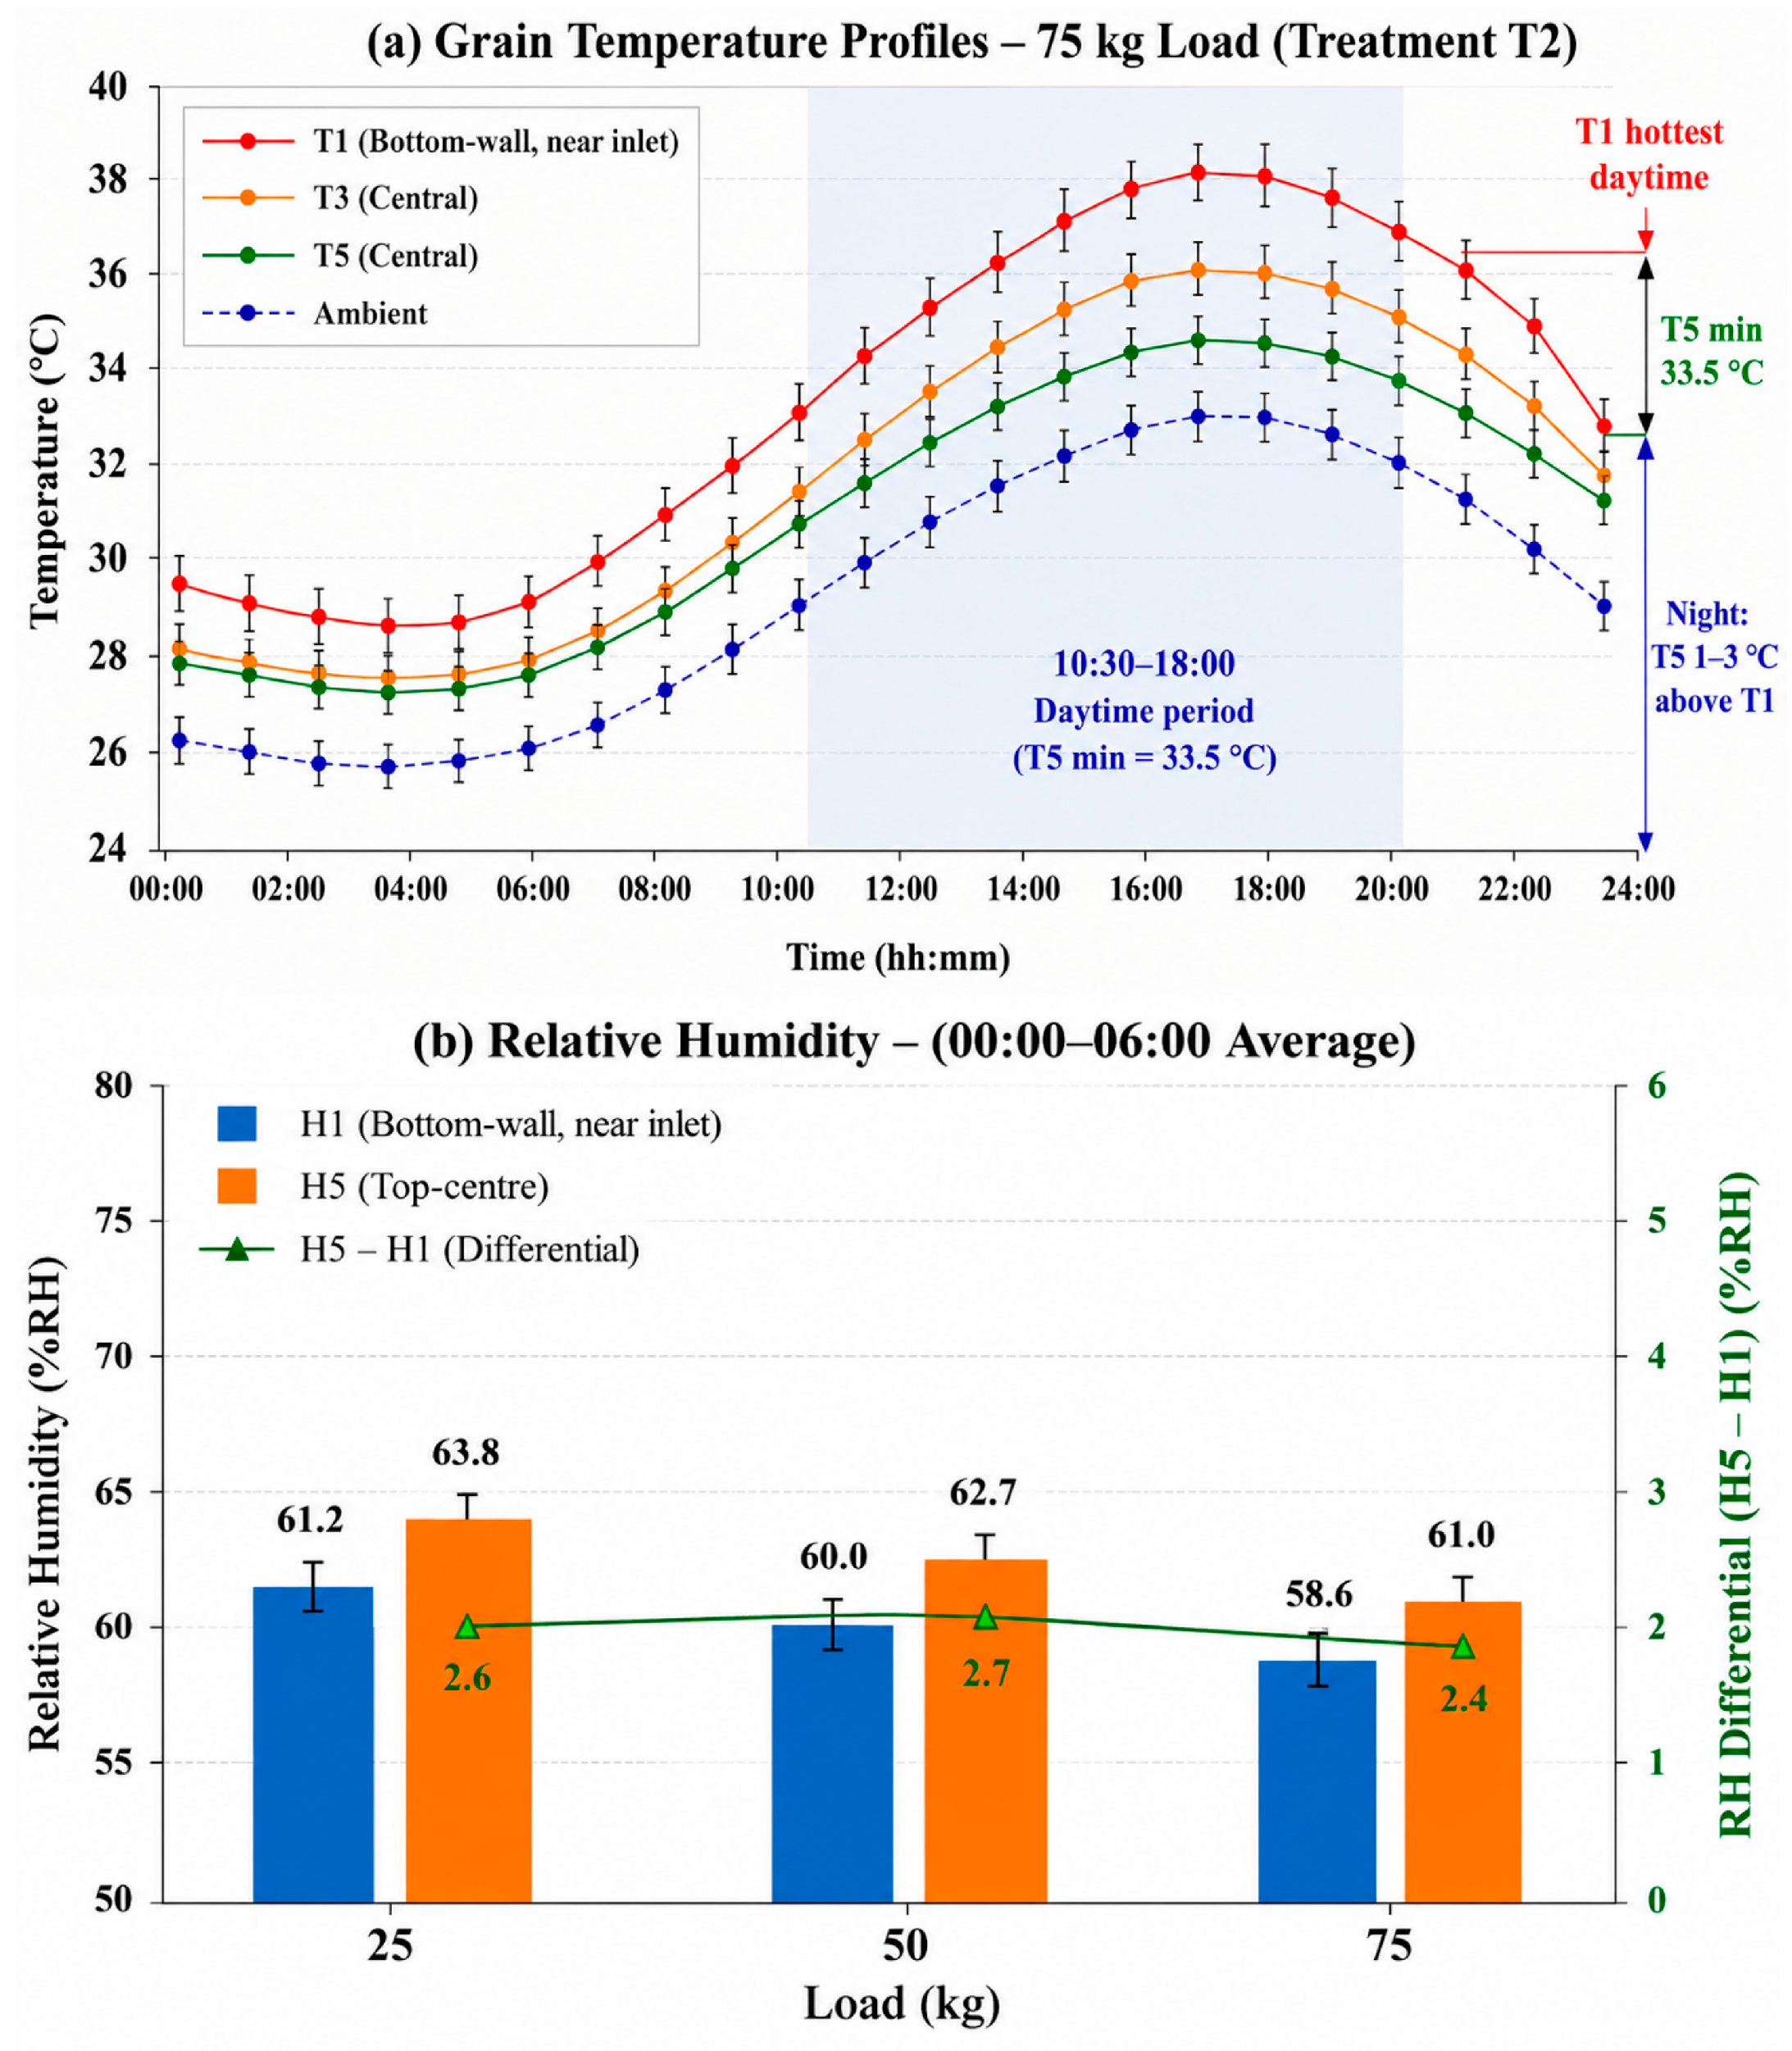
The temperature profiles in Figure 8a give us more insights into the cooling mechanism. The wall-side position (T1) was directly exposed to solar heat conducted through the steel wall of the silo and had the highest temperature consistently throughout the 24 h cycle. The central grain sites (T3 and T5) by contrast reacted more slowly to the changing ambient conditions. It is worth noting that T3 and T5 were very close to each other during the night and early morning (00:00–08:00), indicating that the central grain mass was close to thermal equilibrium during the times of less daytime heating. As daytime heating intensified, the two central sites developed a small temperature separation, but this separation was still much smaller than the temperature separation between the edge and the center. This behavior suggests that forced aeration was effective in redistributing thermal energy inside the grain bulk, thus minimizing the development of large temperature gradients inside the grain bulk.
The decrease in the diurnal temperature amplitude in Table 5 also reflects the daytime cooling effect. The variation of the daily temperature for the peripheral area was 7.2–8.0 °C, while in the central grain zone it was even smaller, 3.5–4.2 °C, which was significantly lower than that recorded under ambient storage. Figure 8a shows the shaded period where the minimum temperature of the central grain (T5) was kept around 33.5 °C during the main cooling period in daylight (10:30–18:00). This demonstrates that the heating rate was reduced by the continuous airflow even with the increase in the ambient temperature. These results suggest that forced aeration not only reduced maximum grain temperature but also damped the magnitude of daily thermal fluctuations. Such thermal stabilization is particularly important because repeated heating and cooling cycles accelerate vapor transport within stored grain and promote moisture redistribution.
The nocturnal humidity behaviors presented in Figure 8b and summarized in Table 5 gives further support to the beneficial effect of aeration on the internal storage conditions. During the period 00:00–06:00, the average relative humidity at the top-center position was only 2.4–2.7%RH higher than at the bottom-wall position. The forced aeration reduced the vertical humidity difference by about two-thirds compared to the ~7.3–7.4%RH gradient observed in ambient storage. This large decrease suggests that continuous airflow can effectively remove water vapor before major condensation occurs in the upper grain layers. This reduced the driving force of moisture migration and resulted in a more homogeneous distribution of humidity in the grain bulk. Forced aeration considerably enhanced the thermal regulation and the uniformity of humidity, but, as shown in Figure 8a, the area next to the wall was always warmer than the grain core in the afternoon. This observation suggests that convective cooling is insufficient to completely compensate the daytime heat input through the silo wall. Continuous ventilation was provided, but thermal gradients were still locally generated due to heat being conducted through the steel structure. This indicates that some of the thermal energy absorbed was trapped in the storage system. Thus, although aeration greatly reduced the accumulation of sensible heat and suppressed the moisture stratification, it could not completely eliminate the heating associated with the wall in tropical climate conditions.
The results in Table 5 and Figure 8 indicate that forced aeration can significantly improve the thermal stability of stored paddy through reducing the intergranular air temperature, reducing the daily temperature fluctuations and vertical moisture stratification. However, the persistent temperature difference between the grain regions near the wall and the regions near the center suggests that convection is not enough to remove all the accumulated heat. These results provide the engineering basis for coupling passive two-phase cooling with forced aeration, as discussed in the next section, where complementary sensible and latent heat transfer mechanisms are expected to further improve the temperature uniformity and inhibit moisture migration across the grain bulk.

3.5. Passive Two-Phase Cooling Performance (Treatment T3)

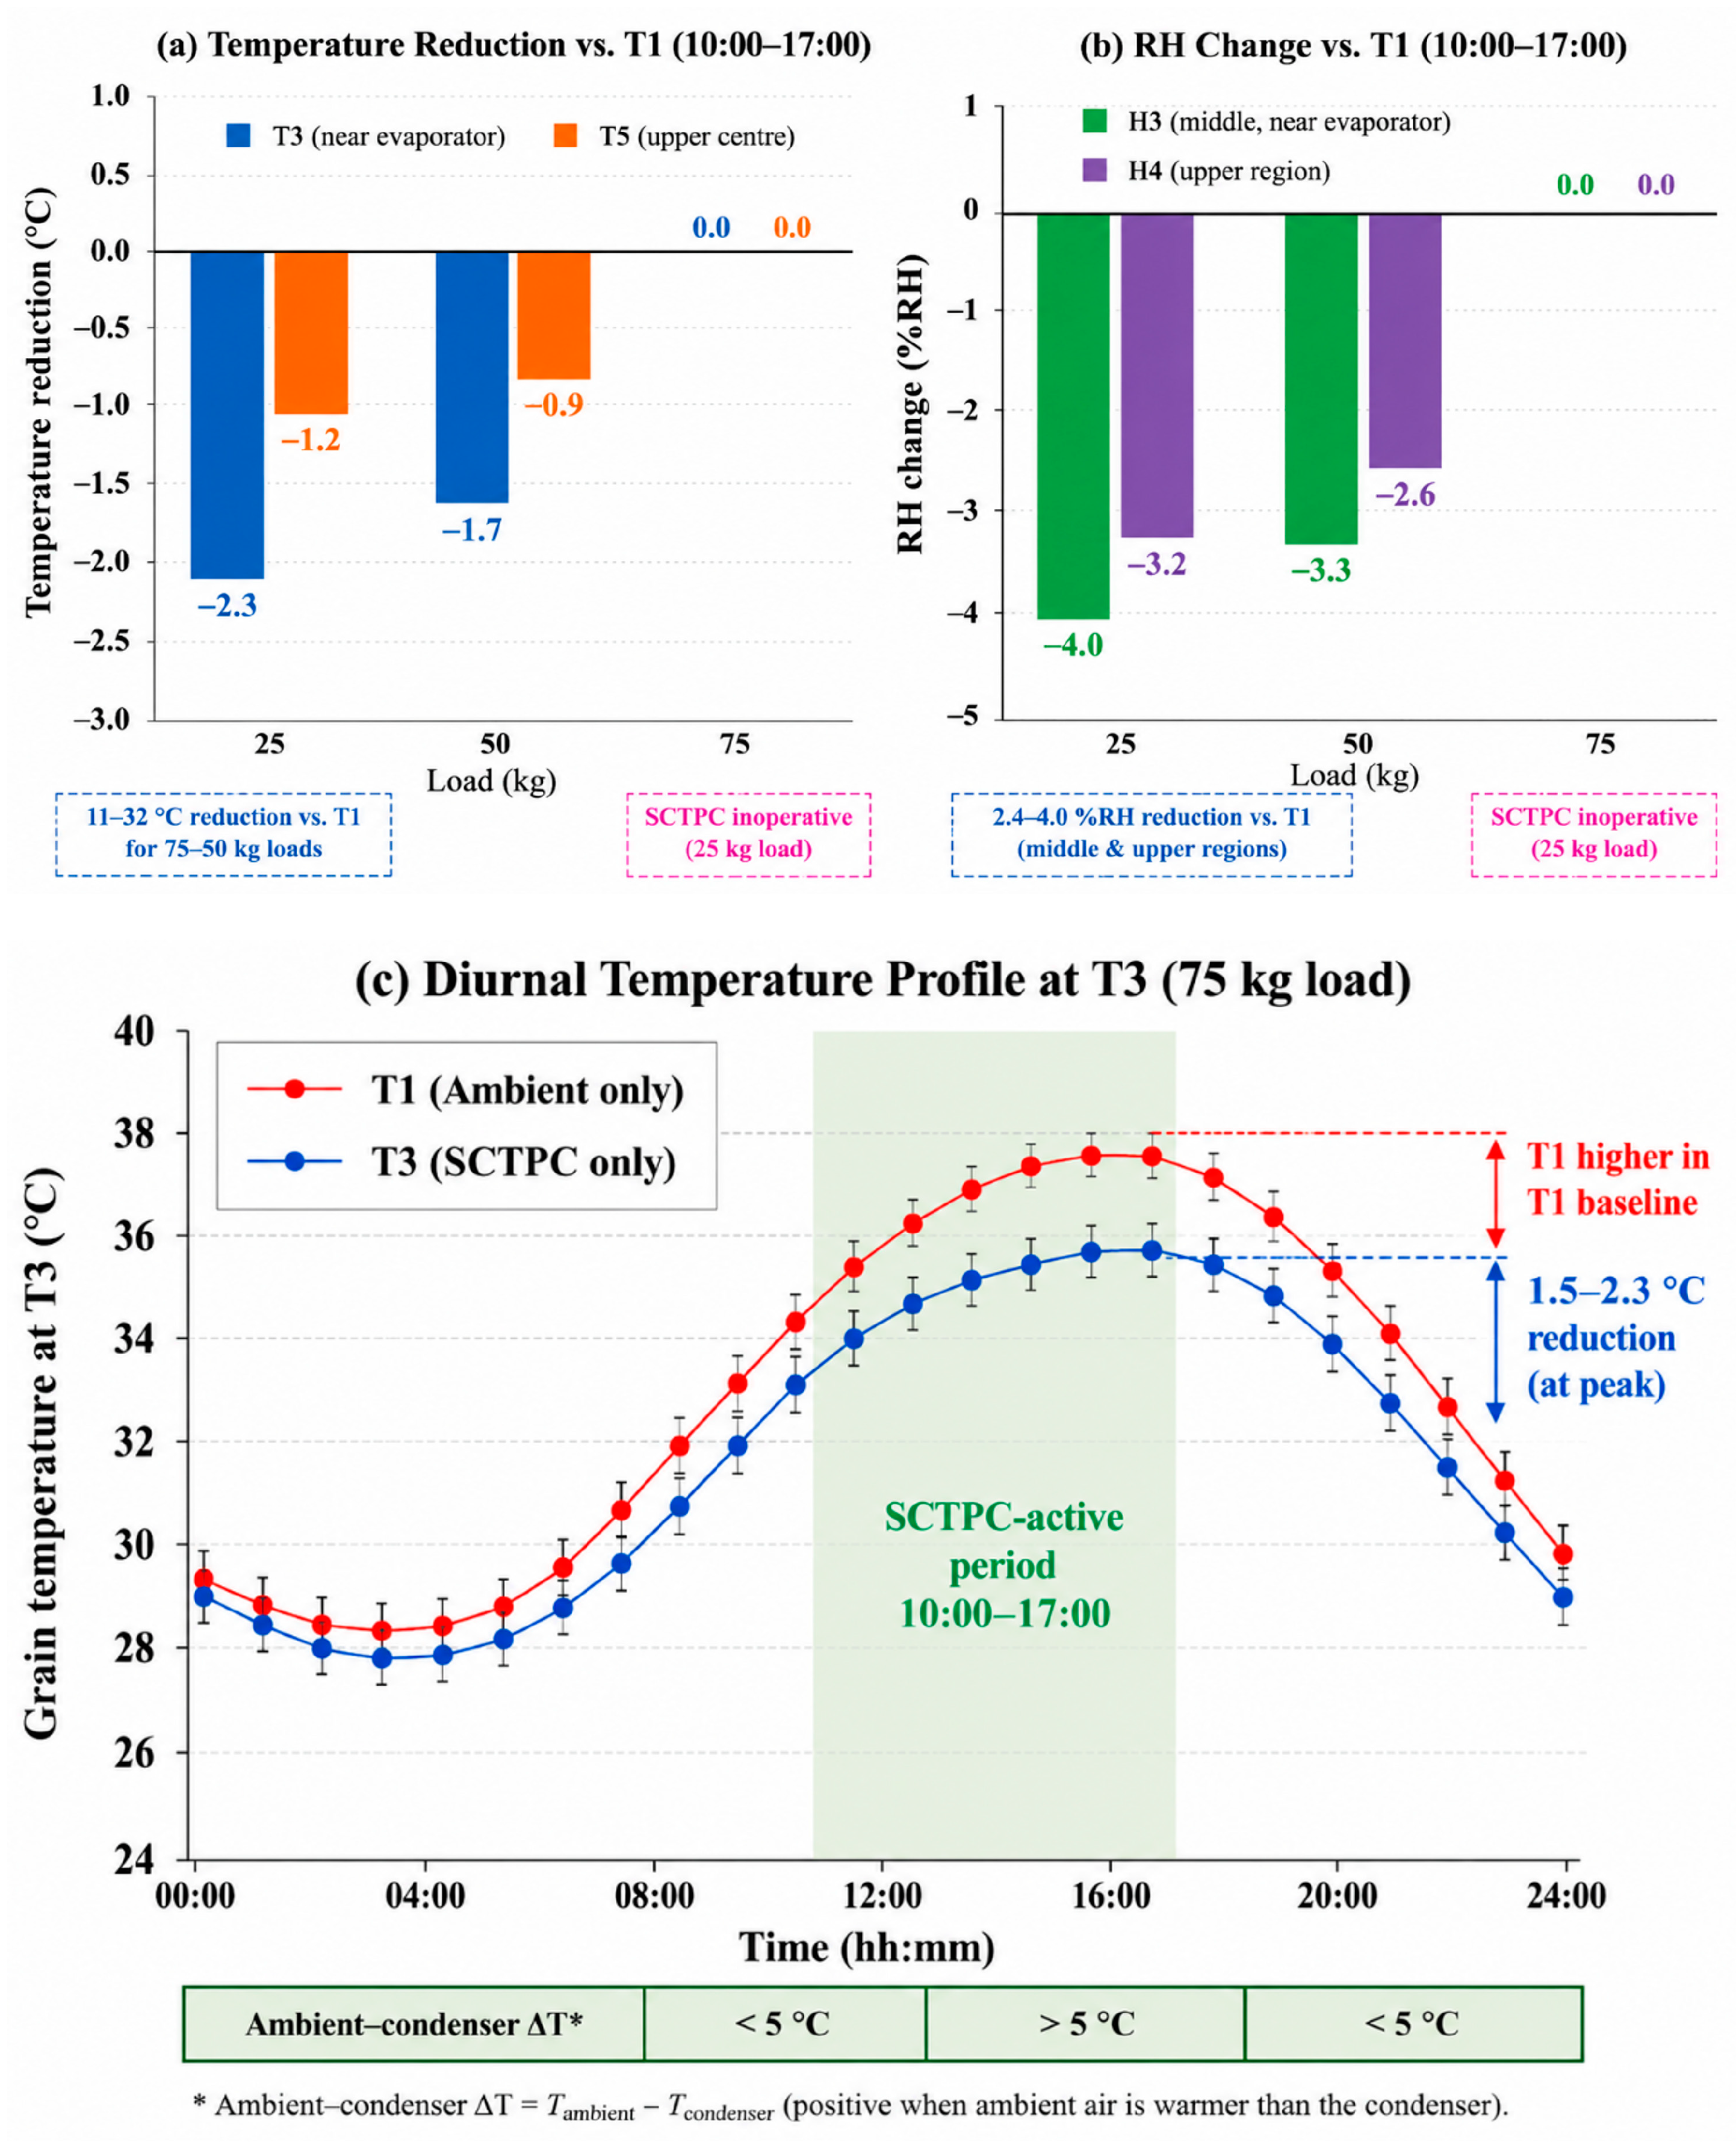
T3 treatment was designed to assess the intrinsic cooling capability of the SCTPC system without forced aeration. Unlike Treatment T2, where heat removal depended primarily on convective airflow, the SCTPC system relied exclusively on passive phase-change heat transfer to transport thermal energy from the grain bulk to the external environment. Thus, this treatment provides direct evidence for the cooling potential of the proposed system independent of ventilation effects. Table 6 summarizes the main thermal performance indicators, and the corresponding daytime temperature reduction, response of relative humidity, and representative diurnal temperature profile are shown in Figure 9. Table 6 summarizes that the only thermally effective SCTPC system was at the storage capacities of 50 and 75 kg, where the condenser section was sufficiently exposed to the surrounding air to reject the heat transported from the evaporator. During the principal cooling period (10:00–17.00), the grain temperature measured near the evaporator (T3) decreased by 1.7 °C and 2.3 °C for the 50 and 75 kg loads, respectively, whereas the corresponding reduction at the upper-center location (T5) reached 0.9 °C and 1.2 °C. These results demonstrate that the application of passive two-phase heat transfer was an effective means of removing the sensible heat from the grain bulk without the need for mechanical refrigeration or forced airflow. It is not surprising that the temperature reduction at T3 was greater, as this location was the closet to the evaporator part where the heat was directly removed by the evaporation of the refrigerant.
The spatial distribution of temperature reduction is further shown in Figure 9a. The SCTPC-only configuration was thermally effective at the 50 and 75 kg loads, whereas no measurable SCTPC was confirmed at 25 kg under the dedicated operational assessment. The three load-matched configurations differed in grain depth, tube length, and refrigerant charge; therefore, the observed differences cannot be attributed to storage capacity alone. For the 50 and 75 kg configurations, the exposed condenser section provided a sufficient ambient heat rejection path to sustain passive two-phase heat transfer. The previous description of the condenser as buried within the grain bulk has been removed because the condenser was positioned outside the silo and exposed to ambient air in the experimental configuration described in Section 2.2.
A typical diurnal temperature profile is shown in Figure 9c which can be used to gain further insight into the operating mechanism of the SCTPC system. During the night and early morning (00:00–08:00), the temperature profiles of the ambient-only (T1) and the SCTPC-only treatments were very similar. This indicates that the passive cooling system had a small effect under low ambient thermal load conditions. After 10:00, with increasing solar radiation, the difference between the two treatments gradually increased. The same time period corresponded with the ambient–condenser temperature difference being above about 5 °C. Meanwhile, the evaporator continued to absorb heat from the surrounding grain, causing the refrigerant to evaporate and carry latent heat to the condenser. The maximum cooling effect was achieved during the afternoon peak, with the grain temperature decreased by about 1.5–2.3 °C compared with ambient storage, in agreement with the quantitative results shown in Table 6. This behavior indicates the passive self-governing nature of the SCTPC system, where the cooling capacity increases automatically with the thermal load.
The response to humidity is also consistent with the thermal behaviors observed. As shown in Table 6 and Figure 9b, the relative humidity in the middle and upper grain regions was decreased by 2.4–4.0%RH for the case of effective operating conditions (50 and 75 kg). The reduction in the temperature of the grain reduces the difference in the vapor pressure between adjacent layers of grain, thus reducing the driving force for moisture migration. Consequently, less water vapor was accumulated in the upper part of the grain bulk, leading to a measurable reduction in local relative humidity. Although the humidity reduction was not as large as with forced ventilation, the results clearly demonstrate that passive heat removal alone can have a substantial impact on the internal redistribution of moisture by suppressing thermal gradients. An important engineering implication of these results is that the performance of the SCTPC system is a function not only of the thermo-physical properties of the working fluid but also of the geometrical relationship between the grain bed and the condenser section. The stagnant behaviors at the 25 kg load indicate the need for sufficient condenser exposure to ensure continuous condensation and heat rejection. Thus, in the practical implementation of passive two-phase cooling systems, the storage depth and condenser location should be considered to optimize the cooling efficiency. However, once an adequate thermal driving force is established, the SCTPC unit can transfer heat without mechanical refrigerant circulation or a compressor. Because blower electricity consumption, cooling capacity, and COP were not measured, no quantitative energy-efficiency conclusion is drawn from the present experiments.
The results shown in Table 6 and Figure 9, taken together, indicate that passive two-phase cooling can be effective at suppressing daytime heat accumulation and internal humidity in the absence of mechanical refrigeration. The observed dependence on condenser exposure is also an important design criterion for future system optimization and provides the engineering basis for the integration of SCTPC units with forced aeration, where complementary latent and sensible heat transfer mechanisms may provide additional cooling under the tested conditions.

3.6. Complementary Thermal and Relative Humidity Control by the Integrated SCTPC–Aeration System (Treatment T4)

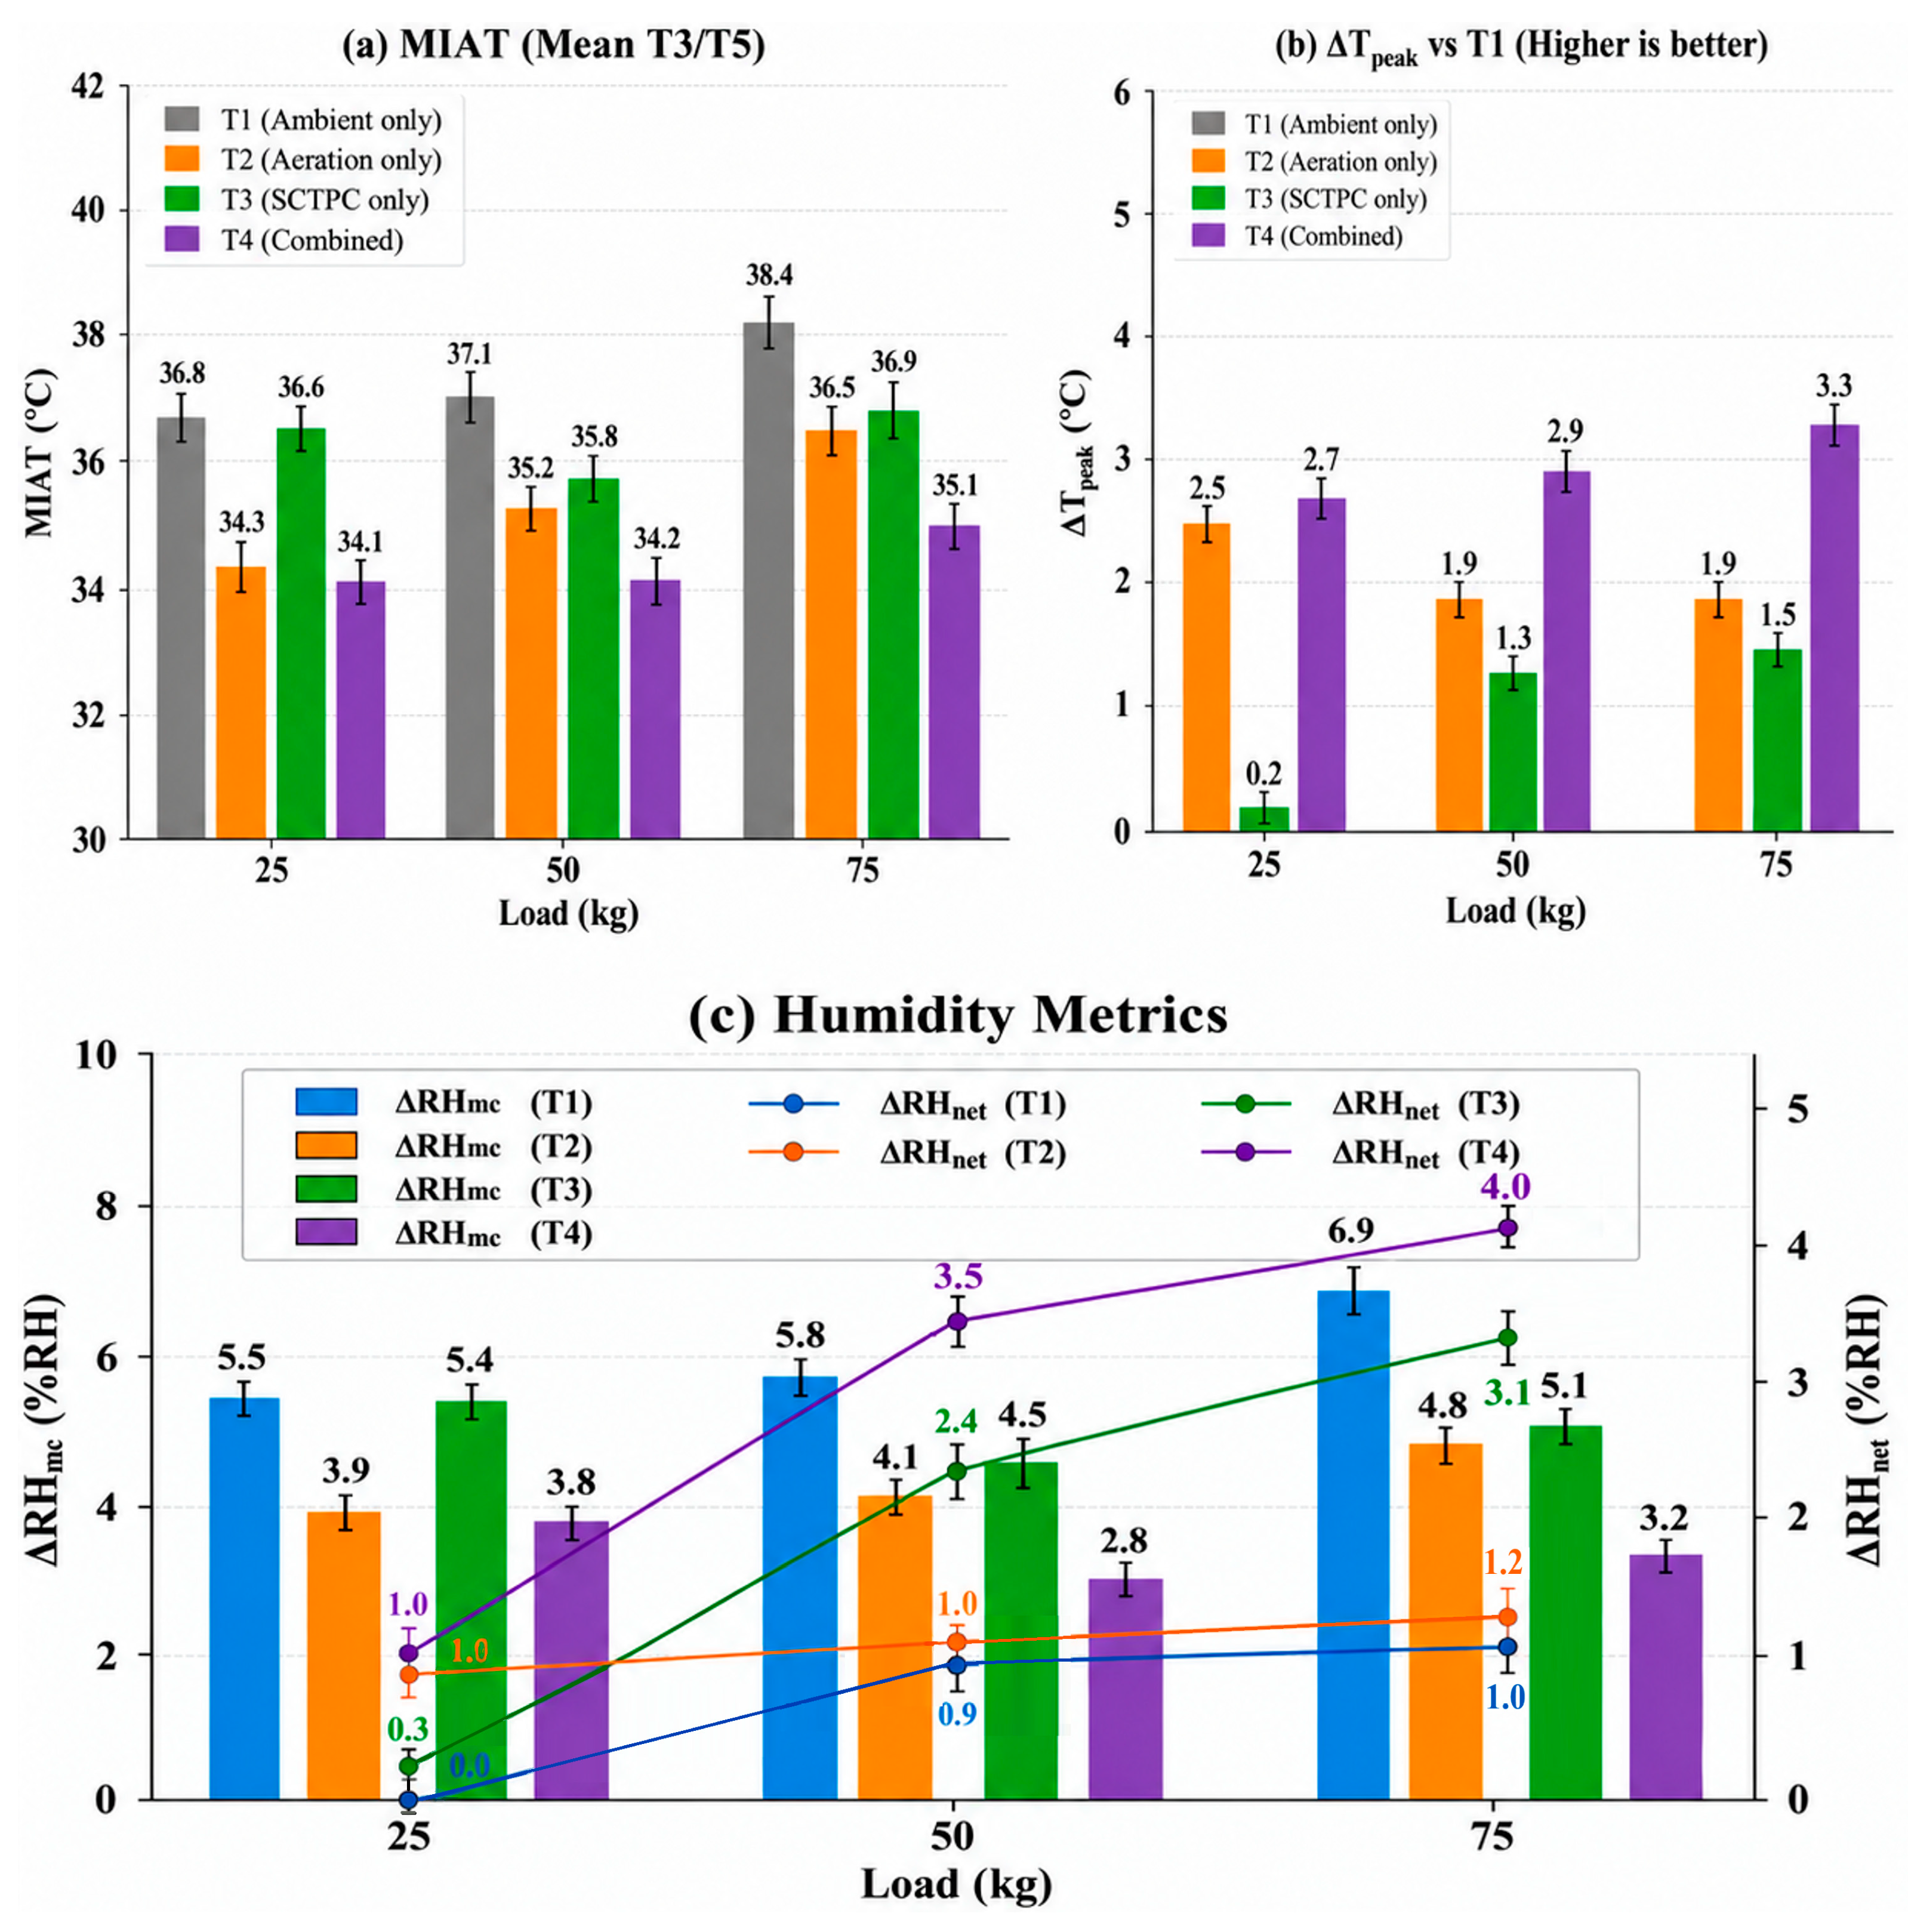
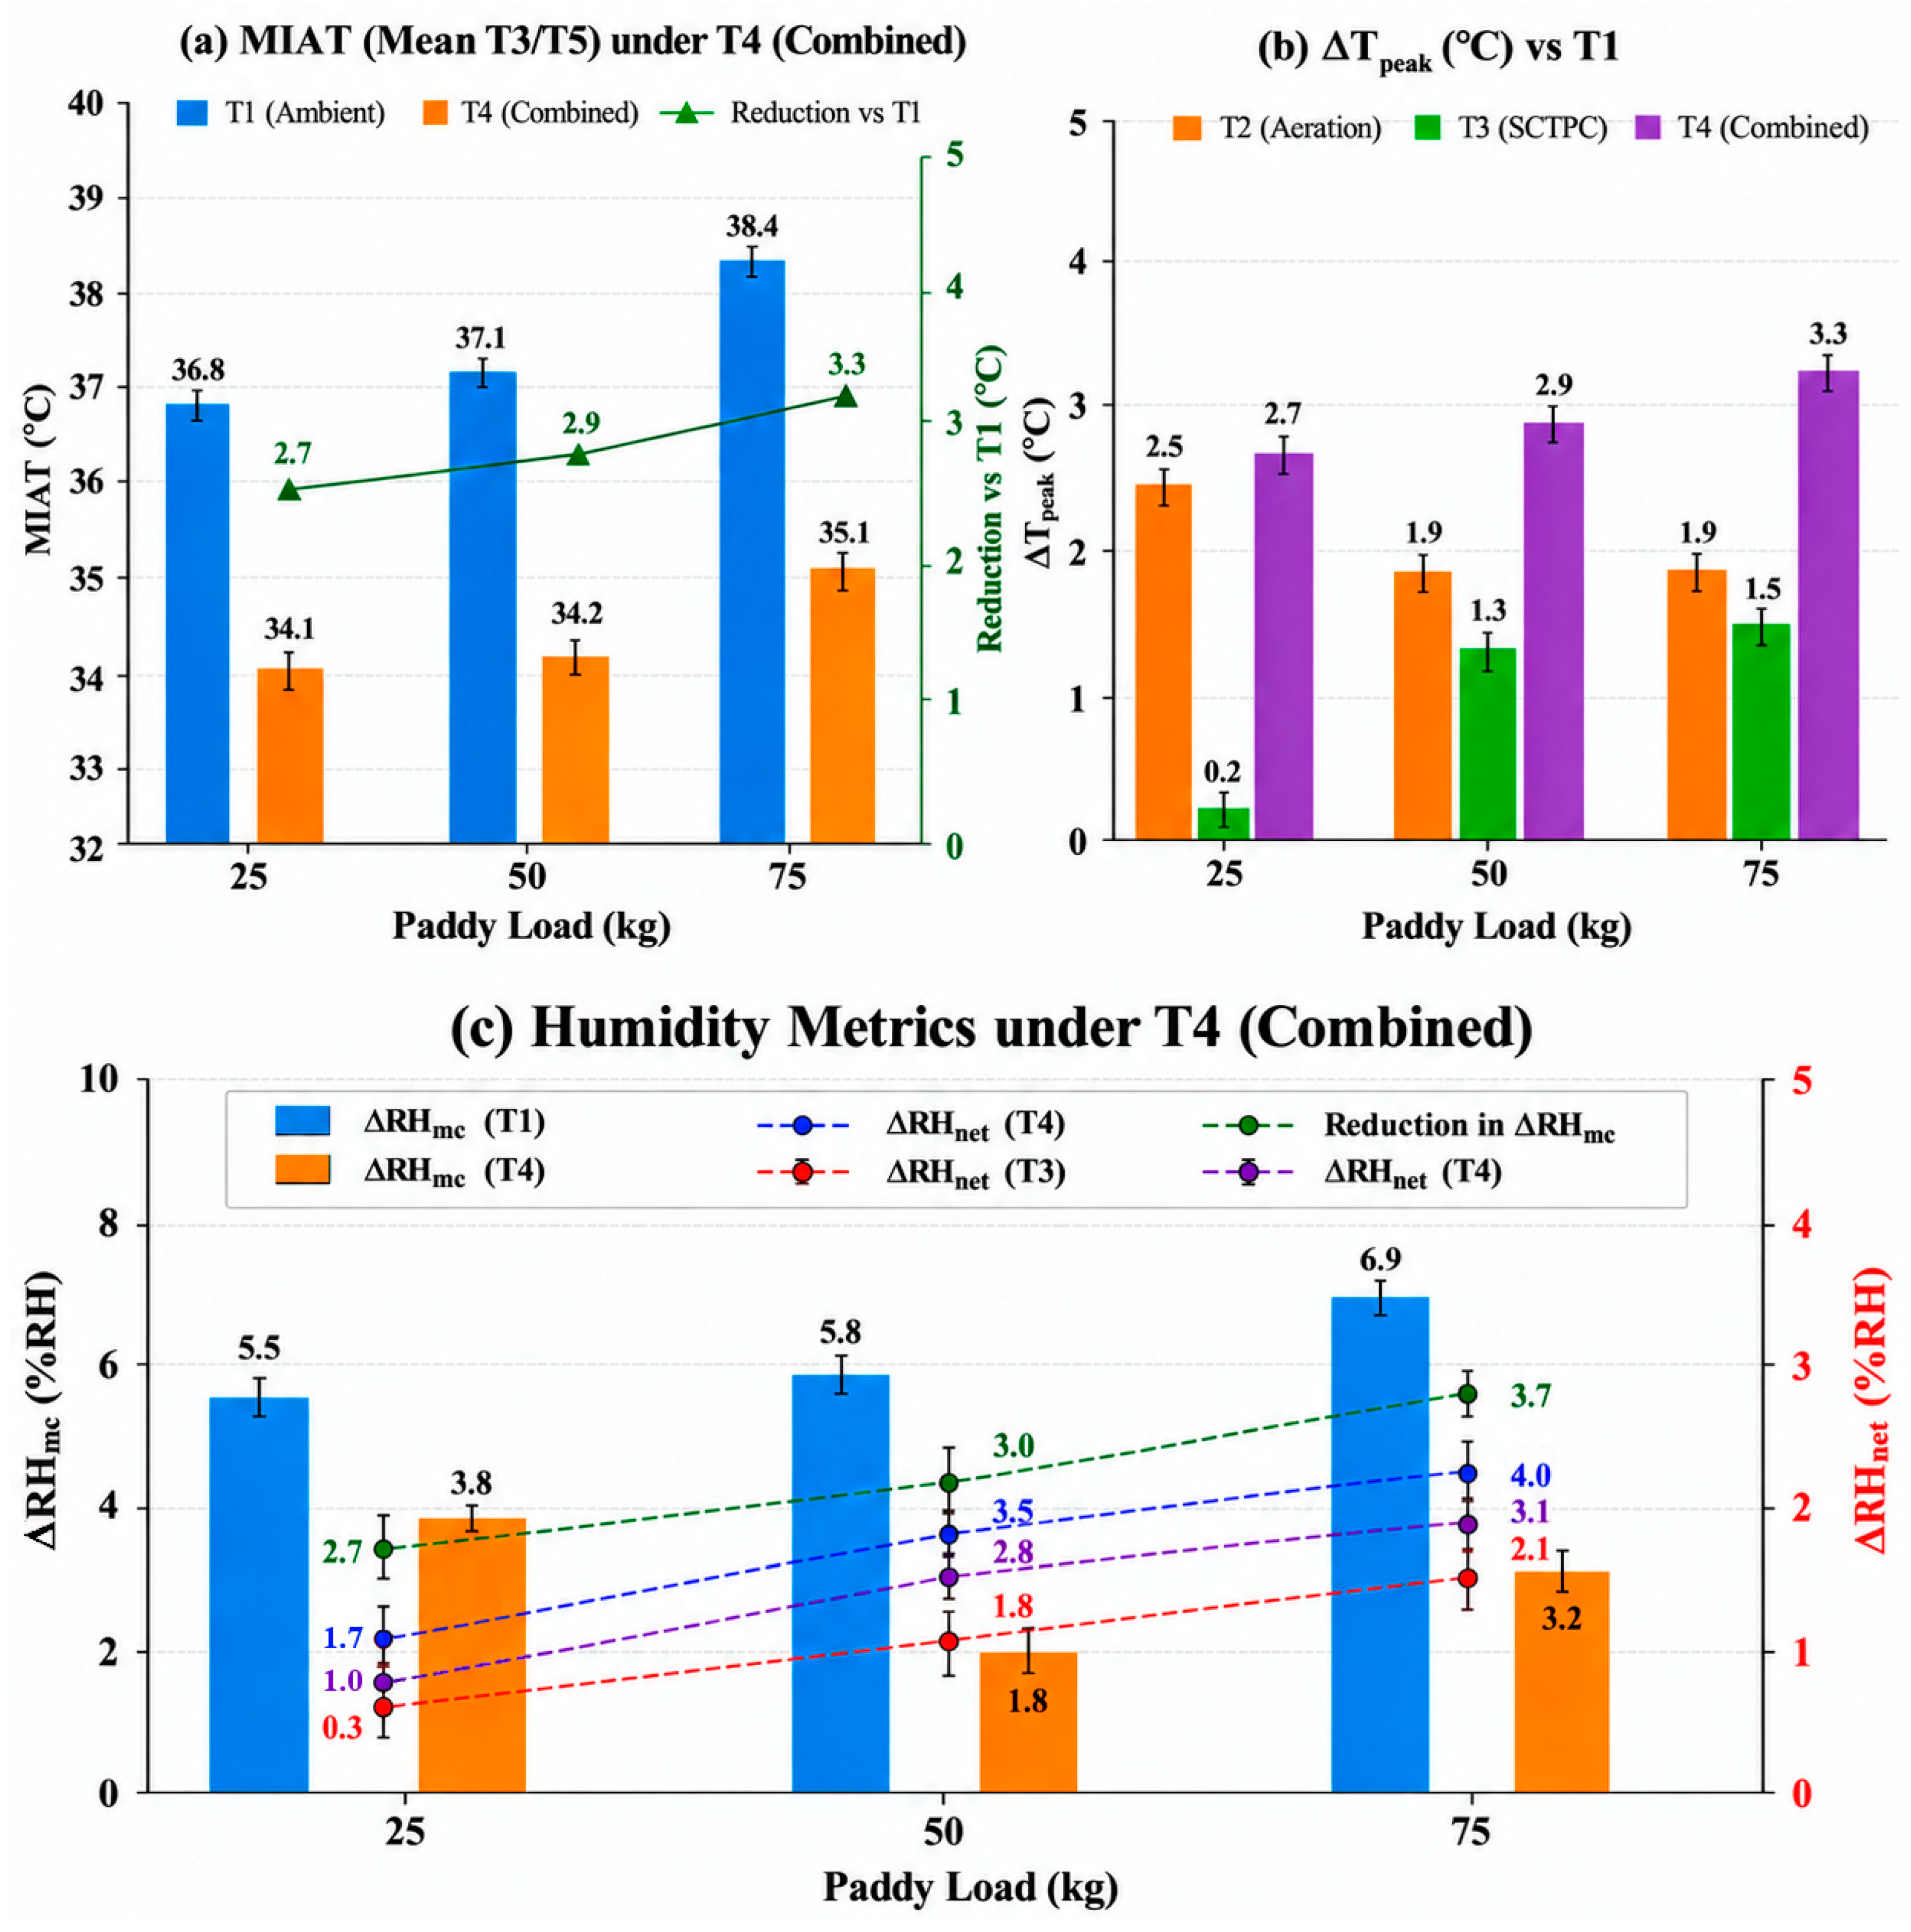
Treatment T4, a combination of the SCTPC system and forced aeration, was designed to investigate improved temperature control and relative humidity distribution through the simultaneous application of passive heat transfer and convective airflow compared with each technology alone. Table 7 summarizes the overall thermal and humidity performance for all storage configurations. The comparative responses of mean daily peak intergranular air temperature (MIAT), peak temperature reduction relative to ambient storage, and relative humidity indicators are presented in Figure 10a–c, respectively. The combined treatment produced the lowest mean daily peak intergranular air temperatures among the tested treatments, but the observed differences do not by themselves establish a statistically significant interaction. The values were 34.1, 34.2, and 35.1 °C for the 25, 50, and 75 kg configurations, respectively, corresponding to reductions of 2.7–3.3 °C relative to the corresponding ambient conditions. Figure 10b further shows that T4 provided the greatest peak-temperature reduction among the tested treatments at each load-matched configuration. These comparisons demonstrate an additional cooling benefit of the combined configuration, but they do not by themselves establish statistically significant interaction or super-additivity. As illustrated in Figure 10c, the reduction in relative humidity difference also indicates a more uniform intergranular air RH distribution; it is not interpreted as direct evidence of moisture removal from the grain mass.
In particular, the improvement due to Treatment T4 was more pronounced for the larger load-matched configurations. The larger grain mass has greater thermal inertia, while the corresponding SCTPC configurations provided longer active heat transfer paths. The better performance of the integrated system compared with either T2 or T3 alone can be explained by the simultaneous operation of forced convection and passive two-phase heat transfer. The results support a complementary combined effect under the tested conditions, rather than a statistically demonstrated interaction effect. The integrated configuration therefore appears to be the most effective among the tested treatments for short-term temperature and relative humidity control, while its performance should be further evaluated using an experimental design that independently varies grain load, SCTPC geometry, and airflow rate.

3.7. Influence of Paddy Storage Capacity on the Engineering Performance of the Integrated SCTPC–Aeration System

The overall engineering performance of the integrated SCTPC–aeration system was further assessed by comparing the combined thermal and moisture control indices for the three capacities of paddy storage. In this section, unlike previous ones, the effects of ambient storage, forced aeration, passive SCTPC, and the integrated configuration are not considered one by one, but the key engineering indicators are synthesized to find the operating condition that can bring the most benefits overall. The summary performance measures and the graphical comparison are shown in Table 8 and Figure 11, respectively. The results show that the storage capacity is an important factor affecting the performance of combined cooling strategy. The mean peak grain temperature (MIAT) during ambient storage (Table 8 and Figure 11a) increased gradually from 36.8 °C at a 25 kg load to 38.4 °C at a 75 kg load. This is because the larger mass of grain has greater thermal inertia. Nevertheless, the integrated SCTPC–aeration system consistently maintained substantially lower MIAT values of 34.1, 34.2, and 35.1 °C, corresponding to temperature reductions of 2.7, 2.9, and 3.3 °C, respectively. The increasing reduction observed with increasing storage capacity indicates that the combined cooling strategy becomes progressively more effective as the thermal load increases, suggesting that passive phase-change heat transfer contributes more significantly when greater quantities of stored heat are available for removal.
The maximum temperature decrease in Figure 11b also confirms the higher effectiveness of the integrated system. Although forced aeration alone provided relatively stable cooling performance across all storage capacities, the integrated treatment consistently produced the largest reduction in peak intergranular air temperature, exceeding the performance of both the aeration-only and SCTPC-only configurations. The observed behaviors suggest that the co-existence of convective airflow and passive latent heat transport leads to complementary mechanisms for heat removal, which allows for the removal of sensible heat near the grain surface and accumulated heat in the grain interior simultaneously. Thus, the integrated system showed better thermal stability than either of the two cooling techniques alone.
Moisture-related indicators showed a similar trend. As summarized in Table 8 and illustrated in Figure 11c, the vertical relative humidity difference under the integrated treatment remained lower than under ambient storage. Simultaneously, the net relative humidity difference at the upper region changed with the load. These RH results indicate changes in intergranular air humidity distribution and stratification. Because no post-treatment grain-moisture measurements or water-mass balance were performed, they should not be interpreted as direct evidence of moisture removal, condensation suppression, or grain-moisture loss.
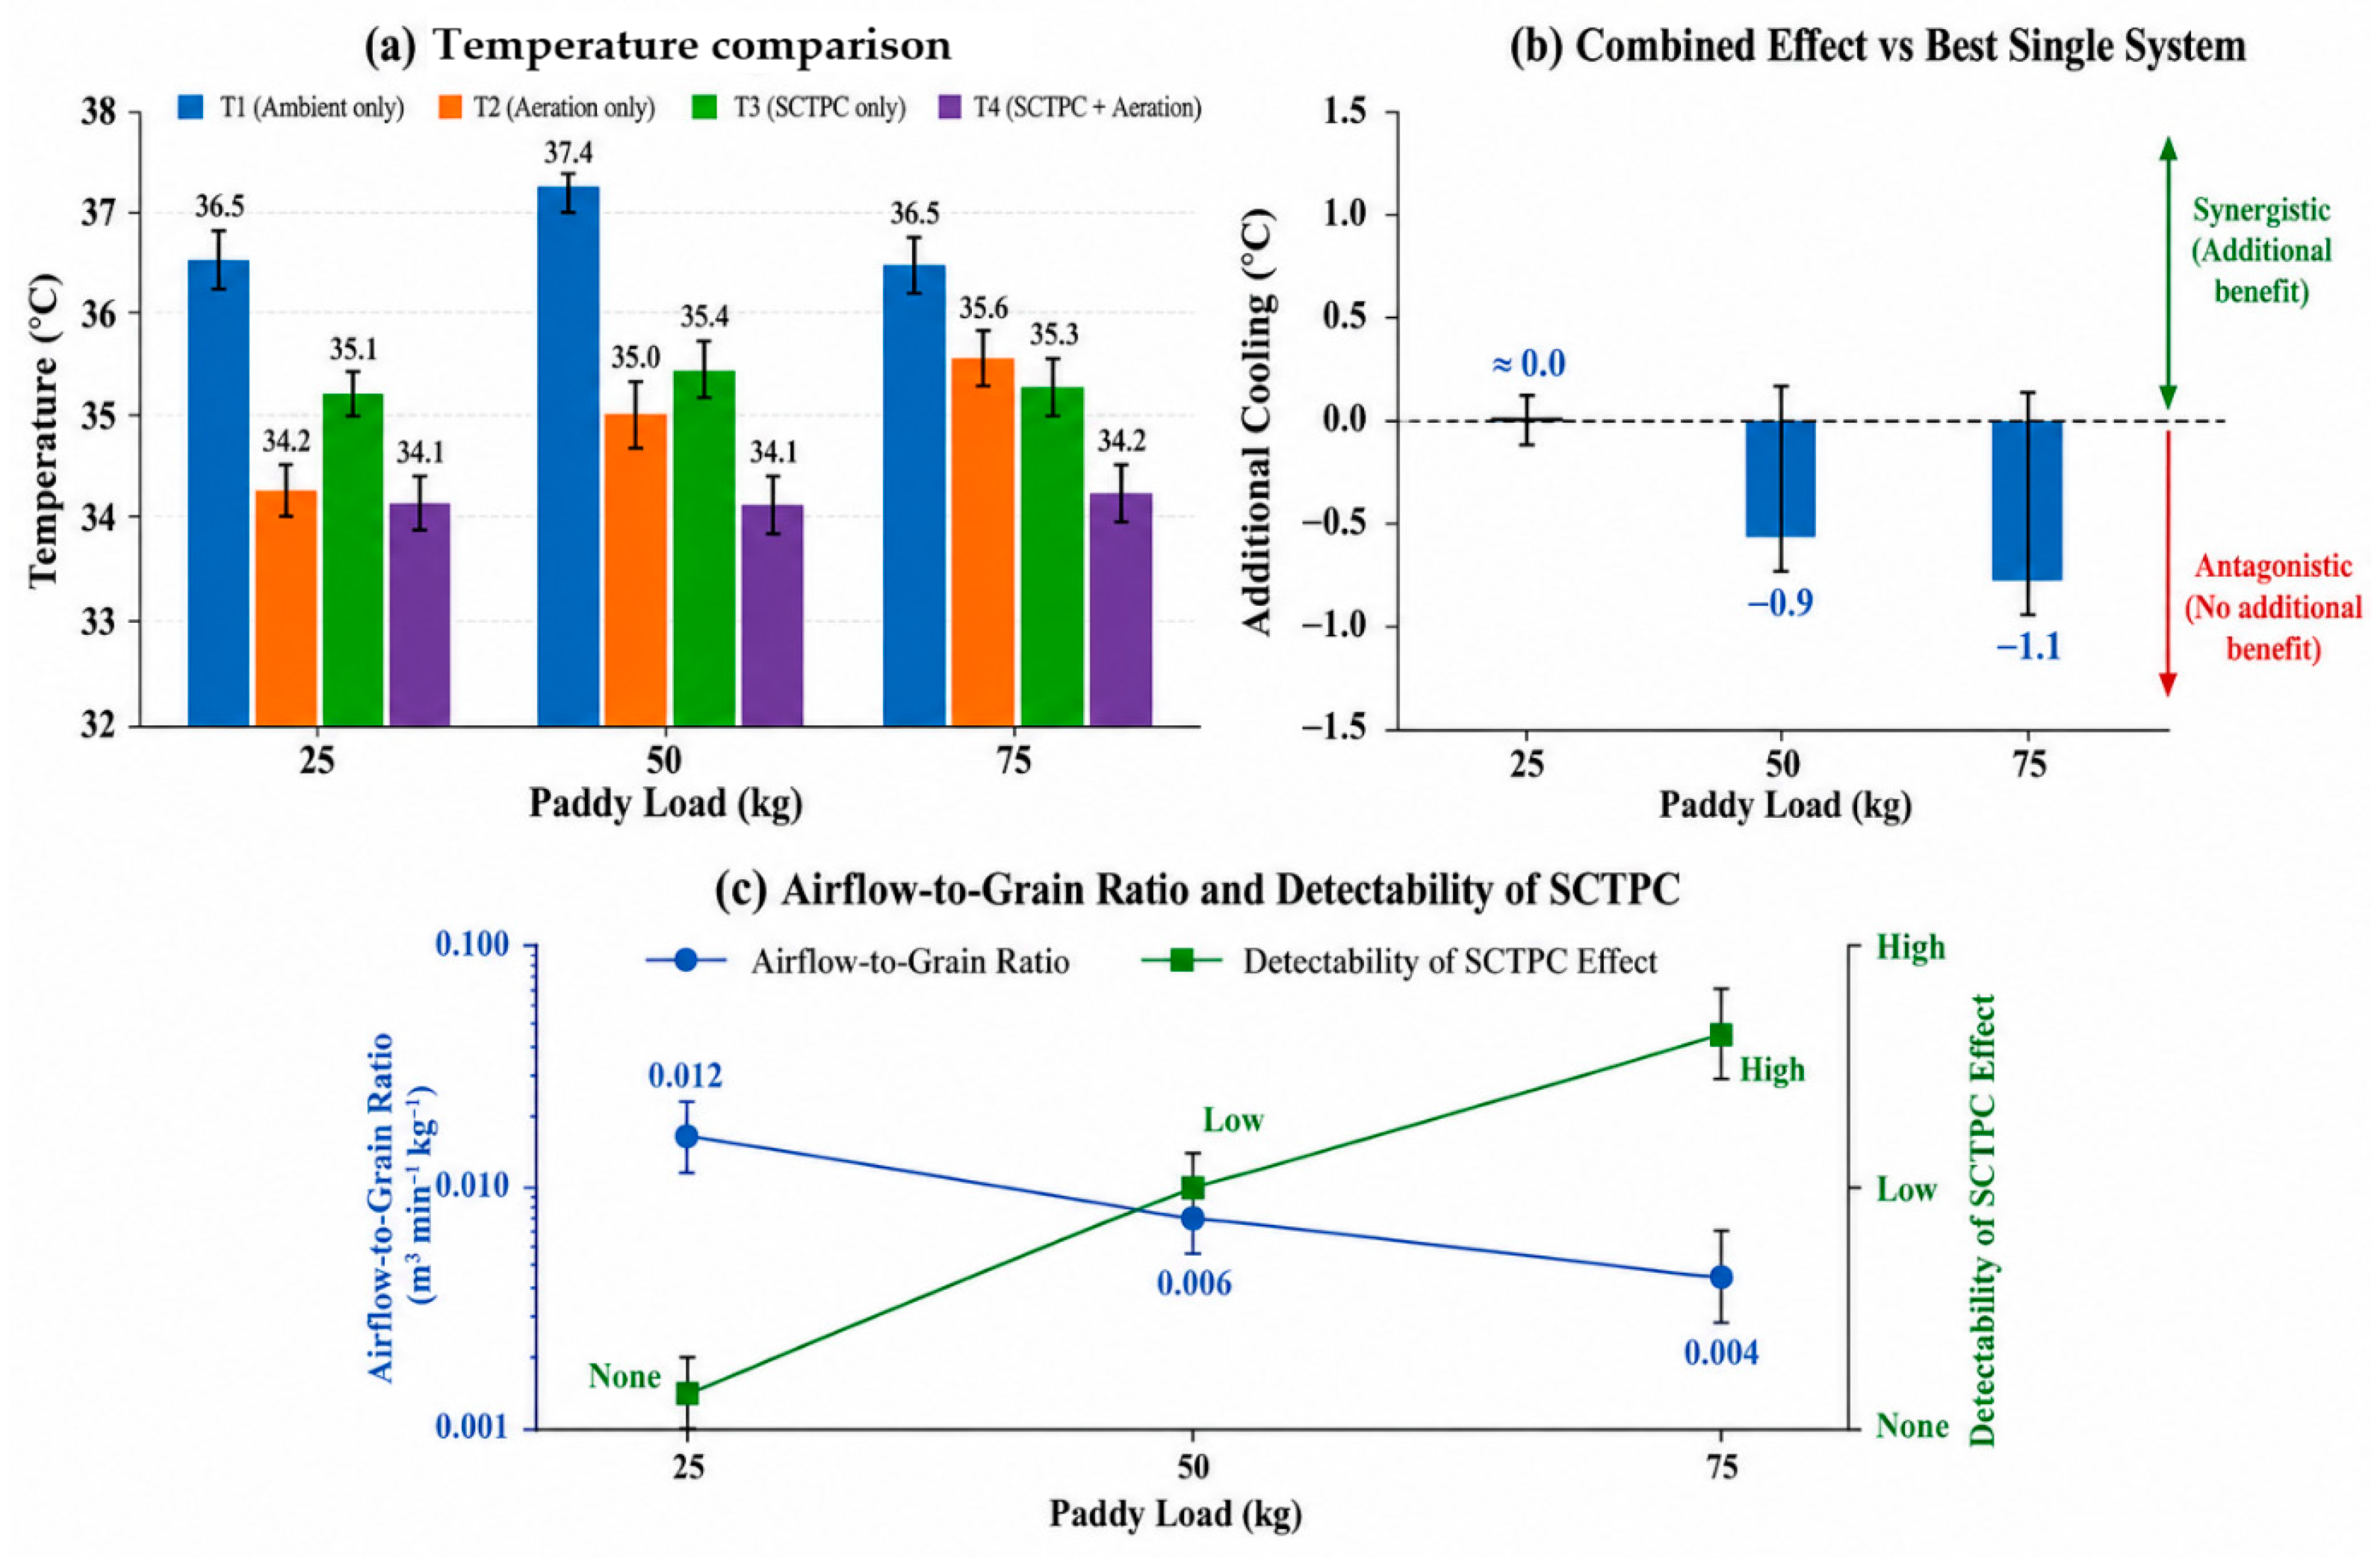
The relative air-to-grain ratio also decreased with the increase in storage capacity from 0.0120 to 0.0040 m3 min−1 kg−1 (Table 8), providing more engineering insight. The integrated system showed a progressive increase in the cooling performance with increasing grain loads, although the available airflow per unit mass of grain was reduced. This observation demonstrates that the enhanced thermal effectiveness was not primarily governed by airflow intensity but by instead the increasing contribution of passive two-phase heat transfer under larger thermal loads. Consequently, the SCTPC system compensated for the reduced specific airflow by continuously transferring heat from the grain bulk to the surrounding environment without mechanical refrigerant circulation.
Overall, the combined results presented in Table 8 and Figure 11 demonstrate that the integrated SCTPC–aeration configuration provided the lowest temperature and RH-stratification indicators among the tested conditions. The increasing response across the load-matched configurations should not be interpreted as an isolated storage-capacity effect because SCTPC geometry and refrigerant charge changed simultaneously. The results support the engineering relevance of combining forced aeration with passive two-phase heat transfer, while the magnitude of any interaction should be quantified in future factorial experiments.

3.8. Complementary Interaction Between Passive SCTPC and Forced Aeration

The engineering interaction between passive SCTPC and forced aeration was further evaluated to determine whether the integrated configuration provided additional cooling beyond that achieved by each technique individually. The comparative analysis (Table 9 and Figure 12) shows that the additional cooling benefit depended on the tested load-matched configurations. At 25 kg, the additional benefit over the best individual treatment was approximately 0.0 °C. For the 50 and 75 kg configurations, the integrated system reduced the temperature by 0.9 °C and 1.1 °C, respectively, compared with the best individual cooling method. These differences demonstrate an additional cooling benefit of the combined treatment, but they do not establish a statistically significant interaction or super-additivity. The passive latent heat transfer path and forced convection therefore appear complementary under the tested conditions. The relation between airflow availability and SCTPC response is also shown in Figure 12c, with the air-to-grain ratio decreasing as grain load increased. Because the SCTPC geometry and refrigerant charge also changed, the observed trend cannot be attributed to grain load alone.
The results in Table 9 and Figure 12 support a complementary combined cooling effect of the integrated SCTPC–aeration configuration. At the lower load, forced aeration dominated thermal regulation, whereas the passive two-phase contribution became more evident in the larger load-matched configurations. Importantly, the hybrid configuration should not be designed simply by maximizing the airflow rate. Instead, the relative contributions of sensible heat removal by aeration and latent heat transport by the SCTPC unit should be balanced according to grain depth, thermal load, condenser exposure, and SCTPC geometry. Independent factorial testing is required before a general scaling relationship can be established.

3.9. Practical Implications and Comparison with Literature

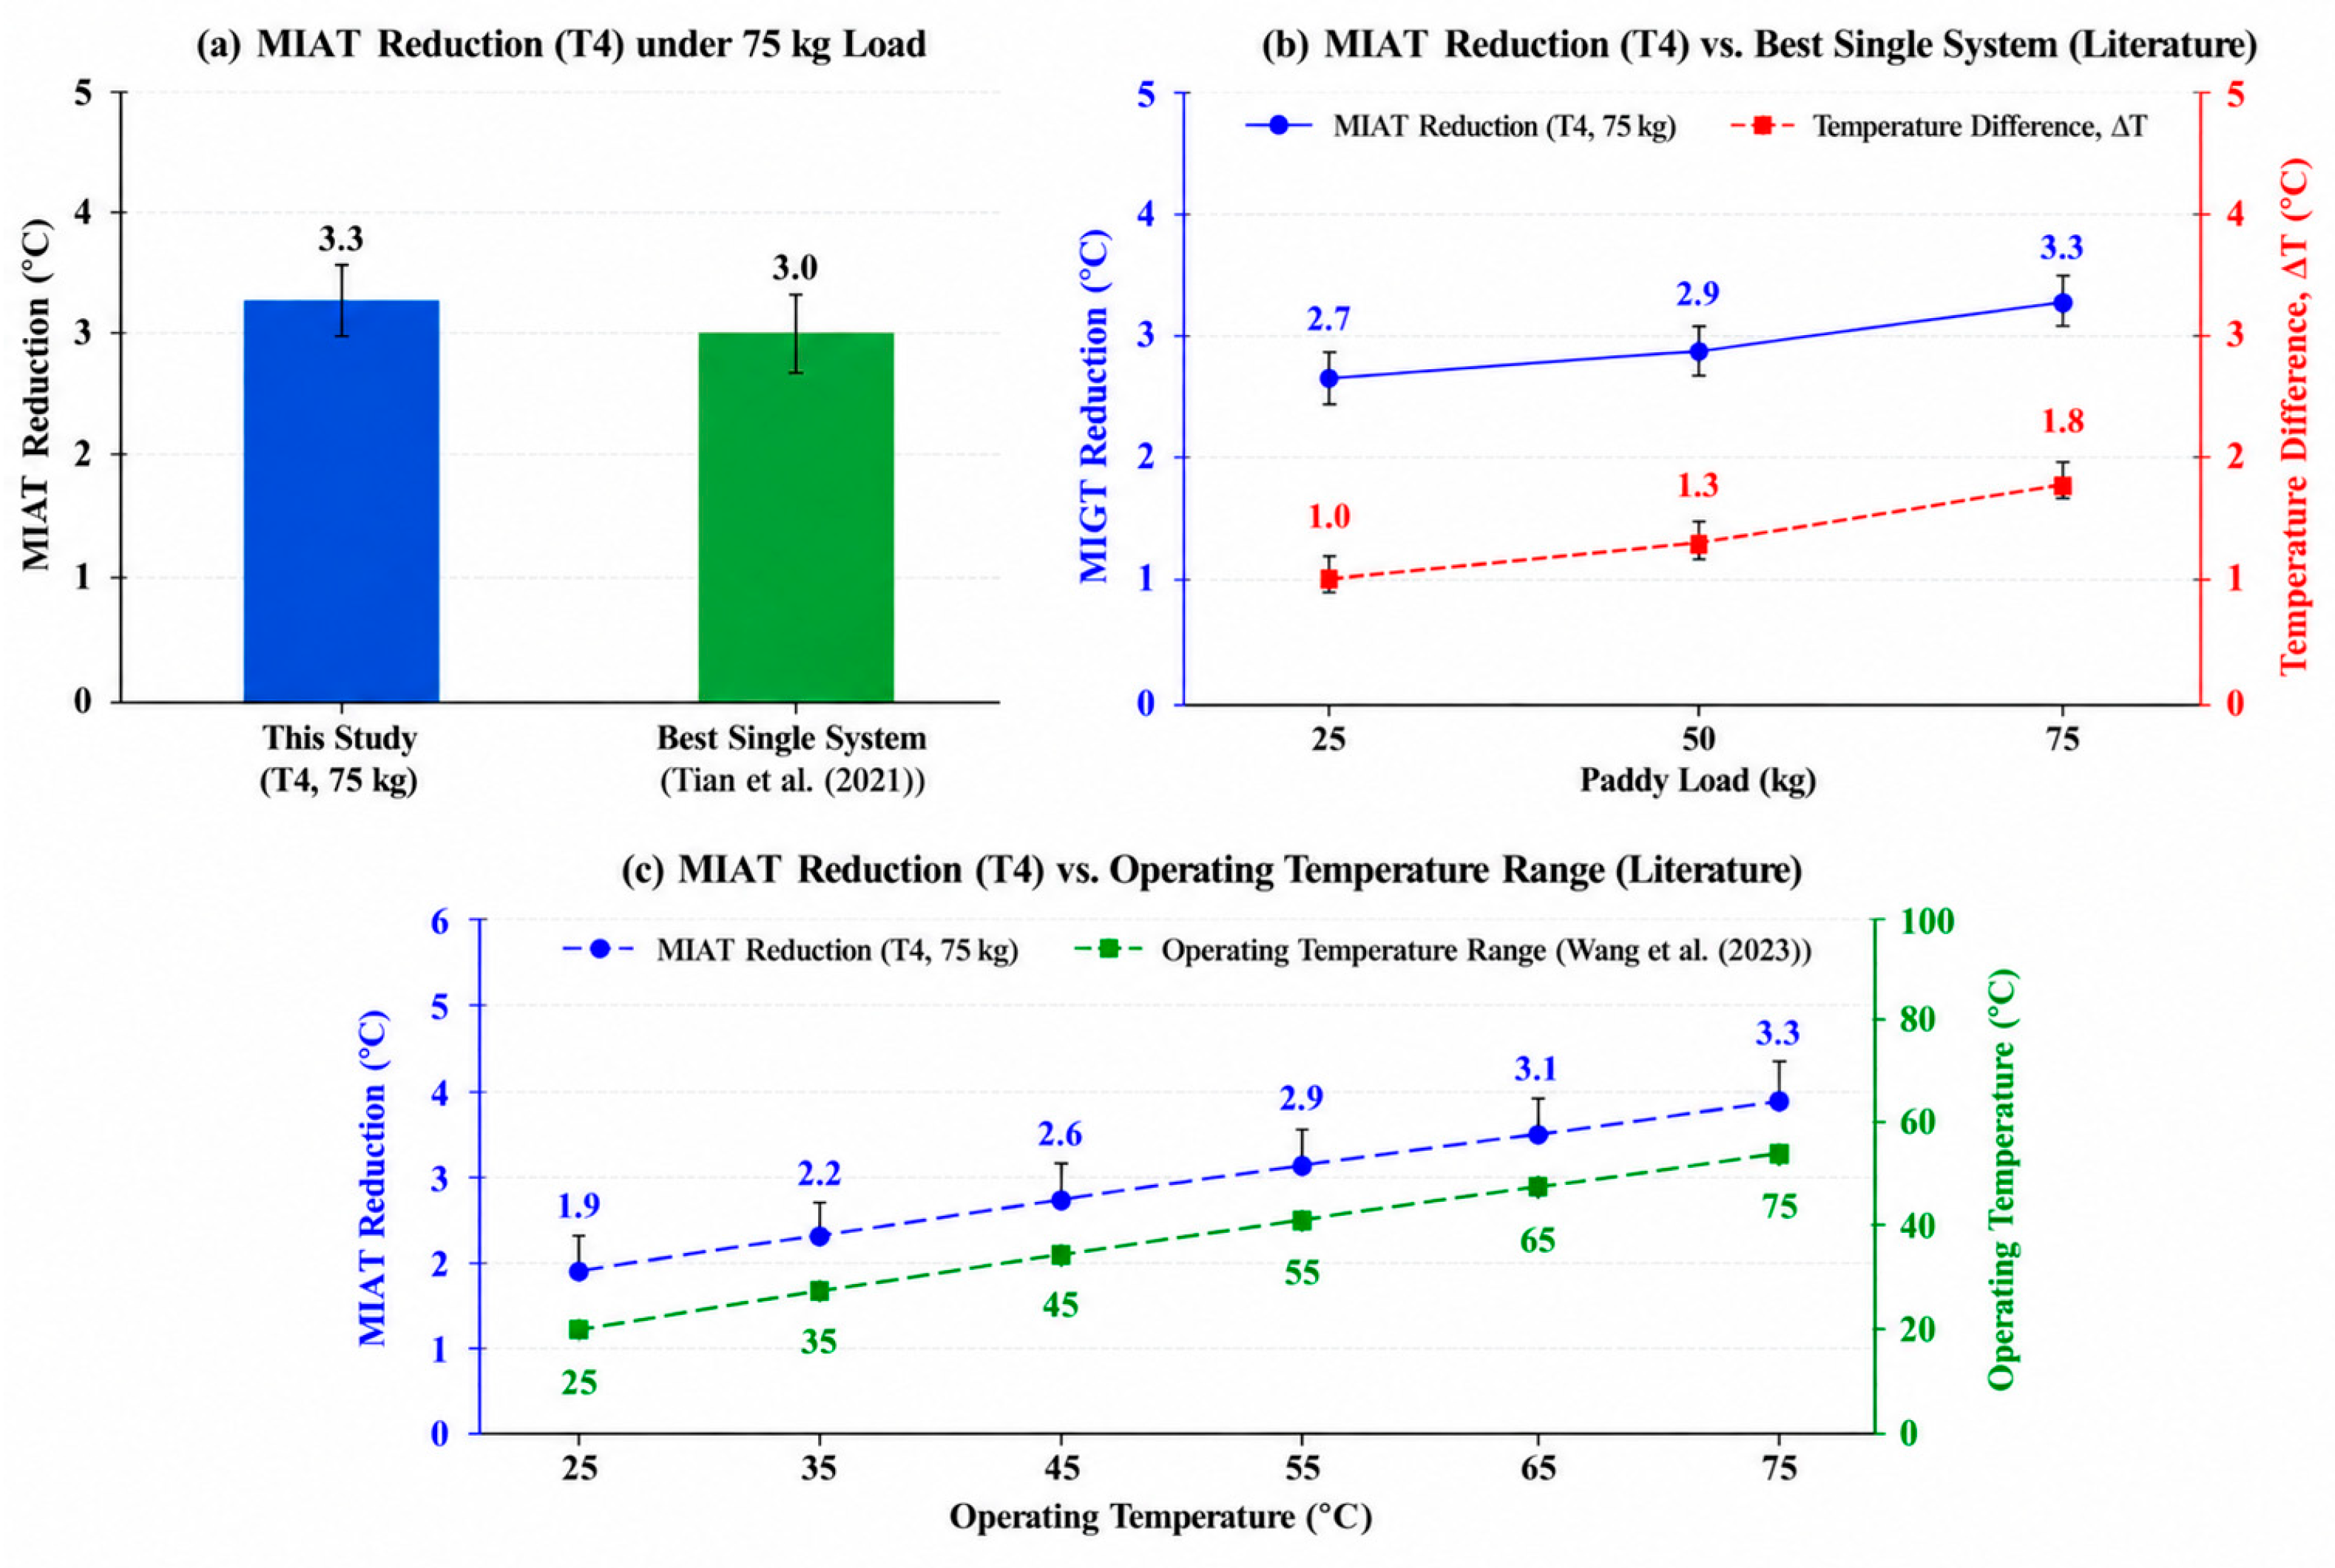
To further assess the engineering significance of the proposed cooling strategy, the performance of the integrated SCTPC–aeration system was compared with representative passive cooling studies in the literature. The proposed system achieved a maximum reduction in the mean daily peak intergranular air temperature of 3.3 °C in the 75 kg configuration, as shown in Table 10, which is within the reported range of 2–4 °C for passive thermosyphon-based cooling systems [28]. The comparison indicates that the combined configuration can achieve cooling performance within the range reported for representative passive systems under the present laboratory conditions. The literature comparison is intended to establish an engineering performance range rather than to demonstrate superiority. Direct comparison with paddy storage studies is also informative: recent work on smart cooling–aeration in concrete silos has emphasized the importance of aeration-window control and grain–ambient conditions, while experimental studies of rough-rice aeration have shown that inlet configuration and airflow resistance materially affect aeration performance [12,13]. A recent study of paddy preservation in small-scale barns further reported that ventilation conditions can influence both storage quality and energy-related performance [14]. These studies support the present interpretation that airflow distribution and operating conditions are critical to paddy cooling, while the present SCTPC results provide an additional passive heat transfer pathway under the tested laboratory conditions.
The comparison with the literature operating conditions shown in Figure 13c indicates that the observed MIAT range of the present study was 31.7–38.4 °C. This range is reported only to describe the measured thermal conditions and is not presented as an independent operating-temperature range. The use of R-290 (propane) provides favorable thermophysical properties and low environmental impact characteristics, consistent with previous reports [35,40,41,42]. Collectively, these comparisons indicate that the proposed SCTPC–aeration configuration provides a technically plausible combined cooling approach under the tested conditions. However, no quantitative energy-efficiency conclusion is drawn because electrical energy consumption, cooling capacity, and COP were not measured. Differences in silo geometry, grain depth, ambient conditions, airflow rate, condenser configuration, and measurement protocols among published studies may also influence the reported cooling performance. Therefore, the literature comparison is interpreted as an engineering benchmark rather than a direct performance ranking.

4. Conclusions

This study demonstrated the feasibility of integrating the single closed two-phase cooling (SCTPC) system with controlled forced aeration for short-term thermal and relative humidity control of paddy storage under the tested laboratory conditions. The integrated configuration provided lower temperatures and reduced relative humidity stratification than the individual cooling methods. The 24 h mean MIAT reduction reached approximately 4.4 °C in the tested configurations, while the mean daily peak temperature reduction reached 3.3 °C in the 75 kg configuration. The three load levels were tested with corresponding changes in SCTPC geometry and R-290 charge; therefore, the results do not isolate an independent storage-capacity effect. The combined treatment also produced additional cooling of approximately 1.0 and 1.4 °C over the best individual treatment at 50 and 75 kg, respectively; these observations support a complementary combined effect but do not establish statistically significant interaction. Relative humidity results indicate improved intergranular air RH distribution, but they do not provide direct evidence of grain-moisture removal because post-treatment grain moisture and a moisture mass balance were not measured. The airflow field also exhibited measurable spatial variability, with a coefficient of variation of approximately 30%, rather than highly uniform airflow. Because the experiments were limited to 24 h at the laboratory scale and blower energy consumption, cooling capacity, and COP were not measured, the present results do not establish quantitative energy-efficiency performance, long-term storage performance, grain-quality preservation, or commercial-scale applicability. These aspects require further validation under longer-duration and larger-scale operating conditions.

5. Limitations and Future Work

Although the present results demonstrate the thermal and relative humidity control potential of the integrated SCTPC–aeration system, several limitations should be considered when interpreting the results. First, the experiments were conducted using a laboratory-scale silo and a single paddy cultivar under controlled operating conditions; therefore, the observed performance may not directly represent full-scale commercial storage systems. Second, the experimental duration was limited to 24 h and did not allow for long-term assessment of grain quality, fungal development, insect activity, or storage stability. Third, the present study evaluated a single airflow rate and three load-matched SCTPC configurations, so the independent effects of grain load, SCTPC geometry, refrigerant charge, condenser exposure, and airflow rate cannot be separated. In addition, the measured airflow field exhibited spatial variability, with a coefficient of variation of approximately 30%; therefore, the results do not support a claim of highly uniform airflow throughout the grain bed. Fourth, relative humidity was measured, but post-treatment grain moisture content, absolute humidity/humidity ratio, and moisture mass balance were not determined; consequently, RH changes cannot be used to quantify actual moisture removal. Fifth, electrical energy consumption of the blower, cooling capacity, coefficient of performance, and specific energy consumption were not measured, so quantitative energy-efficiency claims cannot be made. The present experiments also do not establish long-term grain-quality preservation or commercial-scale applicability because they were conducted for only 24 h at the laboratory scale. Future studies should use factorial or response-surface designs to independently vary grain load, SCTPC geometry, refrigerant charge, condenser exposure, and airflow rate; investigate longer storage periods and different cultivars under outdoor tropical conditions; directly measure grain moisture and quality; quantify system energy performance; and evaluate the long-term reliability, safety, and scalability of the SCTPC configuration.

Author Contributions

Conceptualization, W.R. and P.P.; methodology, W.R., S.P. and P.P.; software, W.R. and N.A.; validation, W.R., P.V.E., S.P. and P.P.; formal analysis, W.R., N.A. and P.P.; investigation, W.R., S.P. and K.P.; resources, S.P. and K.P.; data curation, W.R. and N.A.; writing—original draft preparation, W.R. and P.P.; writing—review and editing, P.V.E., N.A. and P.P.; visualization, K.P. and P.P.; supervision, P.V.E. and P.P.; project administration, W.R. and P.P. All authors have read and agreed to the published version of the manuscript.

Funding

This research received no external funding.

Institutional Review Board Statement

Not applicable.

Informed Consent Statement

Not applicable.

Data Availability Statement

Data will be made available on request.

Acknowledgments

During the preparation of this manuscript, the authors used OpenAI ChatGPT (GPT-5.5) with the image generation feature to assist in the generation and refinement of selected figures. The authors reviewed and edited all AI-generated outputs, verified their scientific accuracy, and take full responsibility for the content of this publication.

Conflicts of Interest

The authors declare no conflicts of interest.

References

  1. Abdullahi, N.; Dandago, M.A. Postharvest losses in food grains—A review. Turk. J. Agric. Food Sci. Technol. 2021, 3, 25–36. [Google Scholar] [CrossRef] [Scilit]
  2. Guru, P.N.; Mridula, D.; Dukare, A.S.; Ghodki, B.M.; Paschapur, A.U.; Samal, I.; Nikhil Raj, M.; Padala, V.K.; Rajashekhar, M.; Subbanna, A.R.N.S. A comprehensive review on advances in storage pest management: Current scenario and future prospects. Front. Sustain. Food Syst. 2022, 6, 993341. [Google Scholar] [CrossRef] [Scilit]
  3. Liu, S.S.; Arthur, F.H.; VanGundy, D.; Phillips, T.W. Combination of methoprene and controlled aeration to manage insects in stored wheat. Insects 2016, 7, 25. [Google Scholar] [CrossRef] [Scilit] [PubMed]
  4. Qu, L.; Zhao, Y.; Xu, X.; Li, Y.; Lv, H. Untargeted lipidomics reveal quality changes in high-moisture Japonica brown rice at different storage temperatures. Foods 2023, 12, 4218. [Google Scholar] [CrossRef] [Scilit] [PubMed]
  5. Hammami, F.; Mabrouk, B.; Mami, A. Modelling and simulation of heat exchange and moisture content in a cereal storage silo. Math. Comput. Model. Dyn. Syst. 2016, 22, 207–220. [Google Scholar] [CrossRef] [Scilit]
  6. Zhang, L.D.; Chen, X.; Liu, H.; Peng, W.; Zhang, Z.J.; Ren, G.Y. Experiment and simulation research of storage for small grain steel silo. Int. J. Agric. Biol. Eng. 2016, 9, 170–178. [Google Scholar] [CrossRef]
  7. Panigrahi, S.S.; Singh, C.B.; Fielke, J.; Zare, D. Modeling of heat and mass transfer within the grain storage ecosystem using numerical methods: A review. Dry. Technol. 2020, 38, 1677–1697. [Google Scholar] [CrossRef] [Scilit]
  8. Poungthong, P.; Promprasansuk, S.; Tanaratchat, V.; Promchai, A.; Ritthong, W. Energy-efficient paddy rice dehumidification using a thermosyphon system. Sci. Technol. Asia 2025, 30, 62. [Google Scholar] [CrossRef]
  9. Zare, D.; Razavizadeh, N.; Maleki-Majd, K. New inlet duct arrangements for grain aeration in a small-scale silo: Computational simulation and experimental validation. J. Stored Prod. Res. 2025, 111, 102511. [Google Scholar] [CrossRef] [Scilit]
  10. Ritthong, N.; Thongkom, S.; Sawisit, A.; Duangsa, B.; Ritthong, W. Optimization design of closed-loop thermosyphons: Experimentation and computational fluid dynamics modeling. Energies 2024, 17, 527. [Google Scholar] [CrossRef] [Scilit]
  11. Gao, G.; Wang, X.; Wu, J.; Li, X.; Xu, R.; Zhang, X. An adaptive grain-bulk aeration system for squat silos in winter: Effects on intergranular air properties and grain quality. Smart Agric. Technol. 2023, 3, 100121. [Google Scholar] [CrossRef] [Scilit]
  12. Li, X.; Han, Z.; Lin, Q.; Wu, Z.; Chen, L.; Zhang, Q. Smart cooling-aeration guided by aeration window model for paddy stored in concrete silos in a depot of Guangzhou, China. Comput. Electron. Agric. 2020, 173, 105452. [Google Scholar] [CrossRef] [Scilit]
  13. Razavizadeh, N.; Zare, D.; Nassiri, S.M.; Karim, A.; Eslami, M.; Nematollahi, M.A. Experimental study and numerical simulation of resistance to airflow in a storage bin of rough rice with three inlet duct configurations. Biosyst. Eng. 2023, 225, 118–131. [Google Scholar] [CrossRef] [Scilit]
  14. Duangkhamchan, W.; Huangsaeng, K.; Kondo, N.; Jaisut, D. Enhancing paddy rice preservation in small-scale barns: Comparative analysis of hot air-drying techniques and ventilation impact on quality and energy efficiency. Foods 2024, 13, 672. [Google Scholar] [CrossRef] [Scilit] [PubMed]
  15. Molina-Herrera, F.I.; Quemada-Villagómez, L.I.; Calderón-Ramírez, M.; Martínez-González, G.M.; Jiménez-Islas, H. Modeling temperature and moisture dynamics in corn storage silos: A comparative 2D and 3D approach. Modelling 2025, 6, 7. [Google Scholar] [CrossRef] [Scilit]
  16. Molina-Herrera, F.I.; Jiménez-Islas, H.; Sandoval-Hernández, M.A.; Maldonado-Sierra, N.E.; Domínguez Campos, C.; Jarquín Enríquez, L.; Mondragón Rojas, F.J.; Flores-Martínez, N.L. Modeling of temperature and moisture dynamics in corn storage silos with and without aeration periods in three dimensions. ChemEngineering 2025, 9, 89. [Google Scholar] [CrossRef] [Scilit]
  17. Molina-Herrera, F.I.; Quemada-Villagómez, L.I.; Calderón-Ramírez, M.; Martínez-González, G.M.; Jiménez-Islas, H. Three-dimensional modeling of natural convection during postharvest storage of corn and wheat in metal silos in the Bajío region of Mexico. Eng 2025, 6, 224. [Google Scholar] [CrossRef] [Scilit]
  18. Leilayi, M.; Arabhosseini, A.; Kianmehr, M.H.; Amiri, H. Design, construction and performance evaluation of paddy rice solar drum dryer equipped with perforated drum. Clean Energy 2023, 7, 328–339. [Google Scholar] [CrossRef] [Scilit]
  19. Jha, A.; Tripathy, P.P. Performance evaluation and finite element modeling of heat, mass, and fluid flow inside a hybrid solar dryer during drying of paddy grains. Front. Food Sci. Technol. 2024, 4, 1411956. [Google Scholar] [CrossRef] [Scilit]
  20. Romuli, S.; Schock, S.; Somda, M.K.; Müller, J. Drying performance and aflatoxin content of paddy rice applying an inflatable solar dryer in Burkina Faso. Appl. Sci. 2020, 10, 3533. [Google Scholar] [CrossRef] [Scilit]
  21. Soto, A.; Martínez, P.; Soto, V.M.; Martínez, P.J. Analysis of the performance of a passive downdraught evaporative cooling system driven by solar chimneys in a residential building by using an experimentally validated TRNSYS model. Energies 2021, 14, 3486. [Google Scholar] [CrossRef] [Scilit]
  22. Wang, Q.; Zhang, G.; Wu, Q.; Li, W.; Shi, L. A combined wall and roof solar chimney in one building. Energy 2022, 240, 122480. [Google Scholar] [CrossRef] [Scilit]
  23. Jiménez-Xamán, C.; Xamán, J.; Gijón-Rivera, M.; Zavala-Guillén, I.; Noh-Pat, F.; Simá, E. Assessing the thermal performance of a rooftop solar chimney attached to a single room. J. Build. Eng. 2020, 31, 101380. [Google Scholar] [CrossRef] [Scilit]
  24. Khakzand, M.; Deljouiee, B.; Chahardoli, S.; Siavashi, M. Radiative cooling ventilation improvement using an integrated system of windcatcher and solar chimney. J. Build. Eng. 2024, 83, 108409. [Google Scholar] [CrossRef] [Scilit]
  25. Huang, J.; Hsu, H.; Wang, X.; Weng, H.; Hsieh, C.M. Passive solar chimney ventilation efficiency in a single enclosed space. Energy Sci. Eng. 2025, 14, 281–288. [Google Scholar] [CrossRef] [Scilit]
  26. Defraeye, T.; Shoji, K.; Schudel, S.; Onwude, D.; Shrivastava, C. Passive evaporative coolers for postharvest storage of fruit and vegetables: Where to best deploy them and how well do they perform. Front. Food Sci. Technol. 2023, 3, 1100181. [Google Scholar] [CrossRef] [Scilit]
  27. Zhao, D.; Aili, A.; Zhai, Y.; Xu, S.; Tan, G.; Yin, X.; Yang, R. Radiative sky cooling: Fundamental principles, materials, and applications. Appl. Phys. Rev. 2019, 6, 021306. [Google Scholar] [CrossRef] [Scilit]
  28. Seo, D.; Park, J.; Shim, J.; Nam, J.; Shin, D.H.; Nam, Y.; Lee, J. Effects and limitations of superhydrophobic surfaces on the heat transfer performance of a two-phase closed thermosyphon. Int. J. Heat Mass Transf. 2021, 176, 121446. [Google Scholar] [CrossRef] [Scilit]
  29. Sichamnan, S.; Chompookham, T.; Parametthanuwat, T. A case study on internal flow patterns of the two-phase closed thermosyphon (TPCT). Case Stud. Therm. Eng. 2020, 18, 100586. [Google Scholar] [CrossRef] [Scilit]
  30. Tian, Y.; Yang, Z.; Liu, Y.; Cai, X.; Shen, Y. Long-term thermal stability and settlement of heat pipe-protected highway embankment in warm permafrost regions. Eng. Geol. 2021, 292, 106269. [Google Scholar] [CrossRef] [Scilit]
  31. Kumar, V.; Pathak, M.; Khan, M.K. Heat transfer characteristics of a closed-loop two-phase thermosyphon system with a structured heating surface. J. Therm. Sci. Eng. Appl. 2022, 14, 011013. [Google Scholar] [CrossRef] [Scilit]
  32. Wang, Z.; Turan, A.; Craft, T. Numerical investigation of the two-phase closed thermosyphon operating with non-uniform heat flux profiles. Energies 2023, 16, 5141. [Google Scholar] [CrossRef] [Scilit]
  33. Khalili, M.; Mostafavi, S.A.; Mousavi, S.M.; Moghadamrad, H. Optimizing heat transfer performance in two-phase closed thermosyphons: A novel design and experimental evaluation. Heliyon 2025, 11, e42109. [Google Scholar] [CrossRef] [Scilit] [PubMed]
  34. Grądzka, P.; Obstawski, P. Design solutions and safety considerations in heat pumps using propane (R290): A review. Energies 2026, 19, 2011. [Google Scholar] [CrossRef] [Scilit]
  35. Lee, A.; Cheng, S. A comparative study of R134a and propane (R290) as refrigerants in heat pump water heaters. J. Energy Power Technol. 2023, 5, 029. [Google Scholar] [CrossRef] [Scilit]
  36. Phumpho, S.; Nabudda, K.; Poungthong, P.; Artnaseaw, A. CFD-based thermo-dynamic stability and energy performance optimization of a refrigerated truck compartment using experimental validation and surrogate modelling. Eng 2026, 7, 393. [Google Scholar] [CrossRef] [Scilit]
  37. Nabudda, K.; Suntivarakorn, R.; Artnaseaw, A.; Ritthong, W.; Poungthong, P.; Worasaen, K.; Intasonti, S. Optimal design of cooling rooms for mackerel using computational fluid dynamics. ES Energy Environ. 2025, 28, 1575. [Google Scholar] [CrossRef] [Scilit]
  38. Nabudda, K.; Thasnas, N.; Poungthong, P. Integrated CFD–drying model for design optimisation of multi-layer rack drying systems for mackerel processing. Ain Shams Eng. J. 2026, 17, 104311. [Google Scholar] [CrossRef] [Scilit]
  39. Liu, Q.; Yang, G.; Zhang, Q.; Ding, C. CFD simulations of aeration for cooling paddy rice in a warehouse-type storage facility. Trans. ASABE 2016, 59, 1873–1882. [Google Scholar] [CrossRef] [Scilit]
  40. Zhao, Z.; Zhang, Y.; Zhang, Y.; Zhou, Y.; Hu, H. Numerical study on the transient thermal performance of a two-phase closed thermosyphon. Energies 2018, 11, 1433. [Google Scholar] [CrossRef] [Scilit]
  41. Cao, J.; Zheng, L.; Peng, J.; Luo, Y.; Hu, M.; Wang, Q.; Pei, G. Preliminary characterization of a dual-source passive building cooling system based on loop thermosyphon. Energy Build. 2022, 262, 111981. [Google Scholar] [CrossRef] [Scilit]
  42. Cao, J.; Hong, X.; Zheng, Z.; Asim, M.; Hu, M.; Wang, Q.; Pei, G.; Leung, M.K.H. Performance characteristics of variable conductance loop thermosyphon for energy-efficient building thermal control. Appl. Energy 2020, 275, 115337. [Google Scholar] [CrossRef] [Scilit]
Figure 1. Laboratory-scale paddy storage silo and aeration system. This figure was generated with the assistance of OpenAI ChatGPT (GPT-5.5), image-generation functionality. Prompt: “Create a clear academic engineering schematic of a laboratory-scale paddy storage silo and aeration system. Include a perforated aeration screen (200 × 230 mm, 4 mm thickness, 4 mm diameter holes, 40% open area), a centrifugal blower (0.5 HP, single-phase, 230 V, 1.6 A), a speed controller, ambient-air inlet, and air delivery of 0.3 m3/min. Present the system as a clean, technically accurate engineering illustration suitable for an academic journal.”
Agriengineering 08 00399 g001
Figure 2. SCTPC configuration for passive grain cooling. This figure was generated with the assistance of OpenAI ChatGPT (GPT-5.5), image-generation functionality. Prompt: “Create a clear academic engineering schematic of an adiabatic thermal storage unit consisting of three equal-length sections. Indicate that each section represents one-third of the total length. Illustrate the evaporator with a cooled working-fluid region, the central adiabatic section covered with 19 mm closed-cell rubber-nuclear insulation, and the condenser with a coiled internal tube. Show silver-brazed sealed ends and a welded Schrader valve for evacuation and charging. Use dimension arrows, engineering labels, and a clean white background suitable for an academic journal figure.”
Agriengineering 08 00399 g002
Figure 3. Sensor layout inside the laboratory-scale storage silo. This figure was generated with the assistance of OpenAI ChatGPT (GPT-5.5), image-generation functionality. Prompt: “Create a clear academic engineering schematic of a laboratory-scale paddy storage silo and aeration system showing a galvanized-steel silo containing paddy rice, a perforated aeration floor, centrifugal blower, speed controller, ambient-air inlet, and air delivery. Present the system as a clean, technically accurate engineering illustration suitable for an academic journal.”
Agriengineering 08 00399 g003
Figure 4. Experimental workflow for evaluating paddy cooling performance under four treatment conditions and three storage capacities. This figure was generated with the assistance of OpenAI ChatGPT (GPT-5.5), image-generation functionality. Prompt: “Create a clear academic workflow diagram for a laboratory-scale paddy storage and controlled-aeration experiment. Present nine sequential steps: (1) paddy preparation; (2) initial moisture-content measurement; (3) loading paddy into the experimental silo; (4) installation of the SCTPC system at the base of the silo with all connections secured; (5) verification and calibration of temperature and humidity sensors; (6) controlled aeration using a variable-speed blower under ambient conditions; (7) continuous 24 hour monitoring of temperature and humidity at six sensor levels; (8) processing, organization, and export of recorded data; and (9) statistical analysis to evaluate thermal performance and treatment effects. Arrange the steps sequentially with arrows and use clean, technically accurate engineering illustrations suitable for an academic journal.”
Agriengineering 08 00399 g004
Figure 5. Comparison of thermal and relative humidity performance indicators under four experimental treatments at three paddy storage capacities: (a) MIAT, (b) Δ T p e a k , (c) Δ R H m c , and (d) Δ R H n e t .
Agriengineering 08 00399 g005
Figure 6. Airflow distribution across the perforated aeration screen used in the experimental storage system. (a) Mean face velocity (±SD) measured at five locations (P1–P5), with the dashed line indicating the overall mean face velocity (0.60 m s−1). (b) Spatial face velocity profile showing the variation in airflow distribution across the aeration surface.
Agriengineering 08 00399 g006
Figure 7. Thermal behaviors and nocturnal moisture stratification of paddy grain under ambient-only storage (Treatment T1). (a) Diurnal temperature profiles. (b) Relative humidity distribution and vertical humidity gradient for different grain loads.
Agriengineering 08 00399 g007
Figure 8. Thermal response and nocturnal moisture distribution of paddy grain under aeration-only conditions (Treatment T2). (a) Diurnal temperature profiles. (b) Relative humidity distribution and vertical humidity gradient for different grain loads.
Agriengineering 08 00399 g008
Figure 9. Performance of the SCTPC-only cooling system (Treatment T3): (a) daytime temperature reduction, (b) relative humidity reduction, and (c) diurnal temperature response at the evaporator location.
Agriengineering 08 00399 g009
Figure 10. Thermal and relative humidity responses of the integrated SCTPC–aeration system (Treatment T4): (a) MIAT. (b) Peak temperature reduction relative to ambient storage. (c) Humidity stratification and net humidity reduction.
Agriengineering 08 00399 g010
Figure 11. Engineering performance comparison of the integrated SCTPC–aeration system (Treatment T4). (a) Mean intergranular air temperature (MIAT). (b) Peak temperature reduction. (c) Moisture stratification and humidity control effectiveness.
Agriengineering 08 00399 g011
Figure 12. Engineering assessment of the additional cooling benefit of the integrated SCTPC–aeration system under different paddy storage capacities: (a) temperature comparison, (b) additional cooling benefit, and (c) airflow-to-grain ratio and SCTPC detectability.
Agriengineering 08 00399 g012
Figure 13. Comparison of the proposed SCTPC–aeration system with representative literature benchmarks: (a) MIAT reduction compared with the best-performing single system reported by Tian et al. (2021) [30], (b) effect of paddy storage capacity on MIAT reduction and temperature difference, and (c) comparison of MIAT reduction with the operating temperature range reported by Wang et al. (2023) [32].
Agriengineering 08 00399 g013
Table 1. Geometric dimensions and corresponding R-290 refrigerant charges of the three SCTPC configurations used for different paddy storage capacities.
SCTPC ConfigurationPaddy Storage Capacity (kg)Evaporator Length (mm)Adiabatic Length (mm)Condenser Length (mm)Total Tube Length (mm)R-290 Refrigerant Charge (g)
SCTPC-252520020020060012
SCTPC-5050400400400120023
SCTPC-7575600600600180037
Table 2. Thermal and relative humidity performance under different treatments and paddy storage capacities.
Paddy Storage Capacity (kg)Treatment24 h Mean MIAT (°C)ΔTpeak (°C)ΔRHmc (%RH)ΔRHnet (%RH)
25T1—Ambient storage36.1 ± 0.48.6 ± 1.1
T2—Forced aeration34.1 ± 0.32.0 ± 0.36.1 ± 0.92.7 ± 0.8
T3—SCTPC 33.0 ± 0.3
T4—SCTPC + aeration31.7 ± 0.34.4 ± 0.42.6 ± 0.46.6 ± 0.6
50T1—Ambient storage36.4 ± 0.59.1 ± 1.2
T2—Forced aeration34.5 ± 0.31.9 ± 0.46.6 ± 1.02.5 ± 0.8
T3—SCTPC 33.4 ± 0.33.0 ± 0.44.4 ± 0.74.5 ± 0.7
T4—SCTPC + aeration32.0 ± 0.34.4 ± 0.42.9 ± 0.56.5 ± 0.6
75T1—Ambient storage36.7 ± 0.49.8 ± 1.3
T2—Forced aeration34.7 ± 0.42.0 ± 0.47.2 ± 1.12.6 ± 0.8
T3—SCTPC 33.5 ± 0.43.2 ± 0.44.7 ± 0.74.7 ± 0.8
T4—SCTPC + aeration32.3 ± 0.44.4 ± 0.53.1 ± 0.56.5 ± 0.7
Note: Values are presented as the mean ± SD (n = 3). MIAT = mean intergranular air temperature calculated from T1–T6; ΔTpeak = peak 24 h MIAT reduction relative to the corresponding ambient condition (T1); ΔRHmc = vertical relative humidity difference between sensors H5 and H1; ΔRHnet = net relative humidity difference at sensor H5 relative to T1. For 25 kg T3, ΔTpeak, ΔRHmc, and ΔRHnet are reported as “Not attributed” because no measurable SCTPC was confirmed in the dedicated operational assessment.
Table 3. Face velocity measured at five sampling locations on the perforated aeration screen. Values represent the mean ± standard deviation of five replicate measurements.
MeasurementP1 (Peripheral)P2 (Centre)P3 (Intermediate)P4 (Intermediate)P5 (Peripheral)
Replicate 10.930.320.580.540.87
Replicate 20.880.240.530.680.84
Replicate 30.730.290.430.580.88
Replicate 40.680.270.380.590.91
Replicate 50.770.330.360.560.83
Mean ± SD0.80 ± 0.100.29 ± 0.040.46 ± 0.090.59 ± 0.050.87 ± 0.04
Note: Overall mean face velocity = 0.60 m s−1; overall SD = 0.18 m s−1; coefficient of variation (CV) = 30%.
Table 4. Representative baseline thermal and humidity characteristics of paddy grain stored under ambient-only conditions (Treatment T1).
Load (kg)Mean Daily Peak MIAT (°C)Time of MIAT (hh:mm)Peripheral ΔT (°C) *Central ΔT (°C)Bottom RH (%RH)Top RH (%RH)Vertical RH Difference (%RH)
2536.315:0011.85.968.275.67.4
5037.315:0012.16.167.574.97.4
7538.416:0012.36.366.874.17.3
Note: * Peripheral ΔT = daily temperature amplitude measured at the peripheral sensor locations (T1, T2, T4 and T6). Central ΔT = daily temperature amplitude measured between the central grain sensors (T3 and T5).
Table 5. Thermal and humidity characteristics of paddy grain stored under aeration-only conditions (Treatment T2).
Load (kg)Mean Daily Peak MIAT (°C)Time of Minimum Central Temperature (hh:mm)Peripheral ΔT (°C) *Central ΔT (°C) **Bottom RH (%RH)Top RH (%RH)Vertical RH Difference (%RH)
2534.010:30–18:007.23.561.263.82.6
5034.510:30–18:007.63.860.062.72.7
7534.610:30–18:008.04.258.661.02.4
Note: * Peripheral ΔT = daily temperature amplitude measured at the peripheral sensor locations (T1, T2, T4, and T6). ** Central ΔT = daily temperature amplitude measured at the central grain sensor locations (T3 and T5). MIAT = mean intergranular-air temperature; RH = relative humidity.
Table 6. Thermal and relative humidity performance of the SCTPC-only cooling system relative to ambient storage (Treatment T3).
Load (kg)Temperature Reduction (T3) * (°C)Temperature Reduction (T5) * (°C)Period of Maximum SCTPC (hh:mm)RH Reduction (H3) (%RH)RH Reduction (H4) (%RH)Ambient–Condenser ΔT (°C)SCTPC Operational Status
250.00.00.00.0Inactive
50−1.7−0.910:00–17:00−3.3−2.65.2Effective
75−2.3−1.210:00–17:00−4.0−3.25.6Effective
Note: * Relative to the corresponding measurements under ambient-only storage (Treatment T1). Relative humidity reduction relative to Treatment T1. The condenser section was positioned outside the silo and exposed to ambient air for all configurations; the 25 kg SCTPC condition was classified as inactive in the dedicated operational assessment because no measurable passive cooling was confirmed under the tested thermal driving conditions.
Table 7. Overall comparison of thermal and humidity performances among the four storage treatments under three paddy storage capacities, using the mean daily peak MIAT from the independent experimental runs.
Load (kg)TreatmentMean Daily Peak MIAT (°C)Peak Temperature Reduction (°C)Vertical RH Difference (%RH)Net RH Reduction (%RH)
25T1—Ambient storage36.85.5
T2—Forced aeration34.32.53.90.9
T3—SCTPC 36.60.25.40.3
T4—SCTPC + aeration34.12.73.81.0
50T1—Ambient storage37.15.8
T2—Forced aeration35.21.94.11.0
T3—SCTPC 35.81.34.52.4
T4—SCTPC + aeration34.22.92.83.5
75T1—Ambient storage38.46.9
T2—Forced aeration36.51.94.81.2
T3—SCTPC 36.91.55.13.1
T4—SCTPC + aeration35.13.33.24.0
Table 8. Engineering performance of the integrated SCTPC–aeration system (Treatment T4) under different paddy storage capacities.
Paddy Load (kg)Mean Daily Peak MIAT (Ambient) (°C)Mean Daily Peak MIAT (T4) (°C)MIAT Reduction (°C)Peak Temperature Reduction (°C)Vertical RH Difference (T4) (%RH)Net RH Reduction (T4) (%RH)Relative Air-to-Grain Ratio (m3 min−1 kg−1)
2536.834.12.72.73.81.00.0120
5037.134.22.92.92.83.50.0060
7538.435.13.33.33.24.00.0040
Table 9. Thermal and relative humidity responses of the integrated SCTPC–aeration system (Treatment T4): (a) MIAT, (b) ΔTpeak, and (c) relative humidity performance, with values harmonized to the mean daily peak MIAT reported in Table 7.
Paddy Load (kg)Mean Daily Peak MIAT (Ambient) (°C)Mean Daily Peak MIAT (T2) (°C)Mean Daily Peak MIAT (T3) (°C)Mean Daily Peak MIAT (T4) (°C)Additional Cooling Benefit (°C)Engineering InteractionAir-to-Grain Ratio (m3 min−1 kg−1)Engineering Interpretation
2536.534.235.134.10.2Negligible0.012Aeration dominant
5037.435.035.434.11.0Complementary0.006Combined cooling effective
7536.535.635.334.21.4Complementary0.004Additional cooling benefit greatest
Note: Additional cooling benefit = T4—min. (T2, T3). Negative values indicate that the integrated SCTPC–aeration system achieved additional cooling beyond the best individual cooling method. The 25 kg value is 0.2 °C, while the 50 and 75 kg values are 1.0 and 1.4 °C, respectively, based on the harmonized Table 7 values. These are descriptive comparisons and are not interpreted as statistical interaction effects.
Table 10. Engineering validation of the proposed SCTPC–aeration system by comparison with representative passive cooling studies reported in the literature.
Performance ParameterPresent Study (T4, 75 kg)Representative LiteratureReported RangeEngineering Assessment
Maximum MIAT reduction (°C)3.3Passive thermosyphon cooling [28]2–4Within the reported engineering range and achieved under experimental conditions.
Effective operating temperature (°C)31.7–38.4Tropical grain cooling studies [39]25–75Observed MIAT range under the tested laboratory conditions.
Working fluidR-290 (Propane)Passive thermosyphon systems [34]R-290/
R-22
Environmentally preferable refrigerant with low GWP and zero ODP.
Peak cooling capability (°C)1–4 Zhao et al. [40]; Cao et al. [41]1–4Comparable with previously reported passive cooling performance.
System operating criterionΔT (grain − ambient) > 1 °CPassive control strategy [42]ΔT thresholdEnables passive operation only when a favorable thermal driving force exists.
Disclaimer/Publisher’s Note: The statements, opinions and data contained in all publications are solely those of the individual author(s) and contributor(s) and not of MDPI and/or the editor(s). MDPI and/or the editor(s) disclaim responsibility for any injury to people or property resulting from any ideas, methods, instructions or products referred to in the content.