Author Contributions
Conceptualization, W.R. and P.P.; methodology, W.R., S.P. and P.P.; software, W.R. and N.A.; validation, W.R., P.V.E., S.P. and P.P.; formal analysis, W.R., N.A. and P.P.; investigation, W.R., S.P. and K.P.; resources, S.P. and K.P.; data curation, W.R. and N.A.; writing—original draft preparation, W.R. and P.P.; writing—review and editing, P.V.E., N.A. and P.P.; visualization, K.P. and P.P.; supervision, P.V.E. and P.P.; project administration, W.R. and P.P. All authors have read and agreed to the published version of the manuscript.
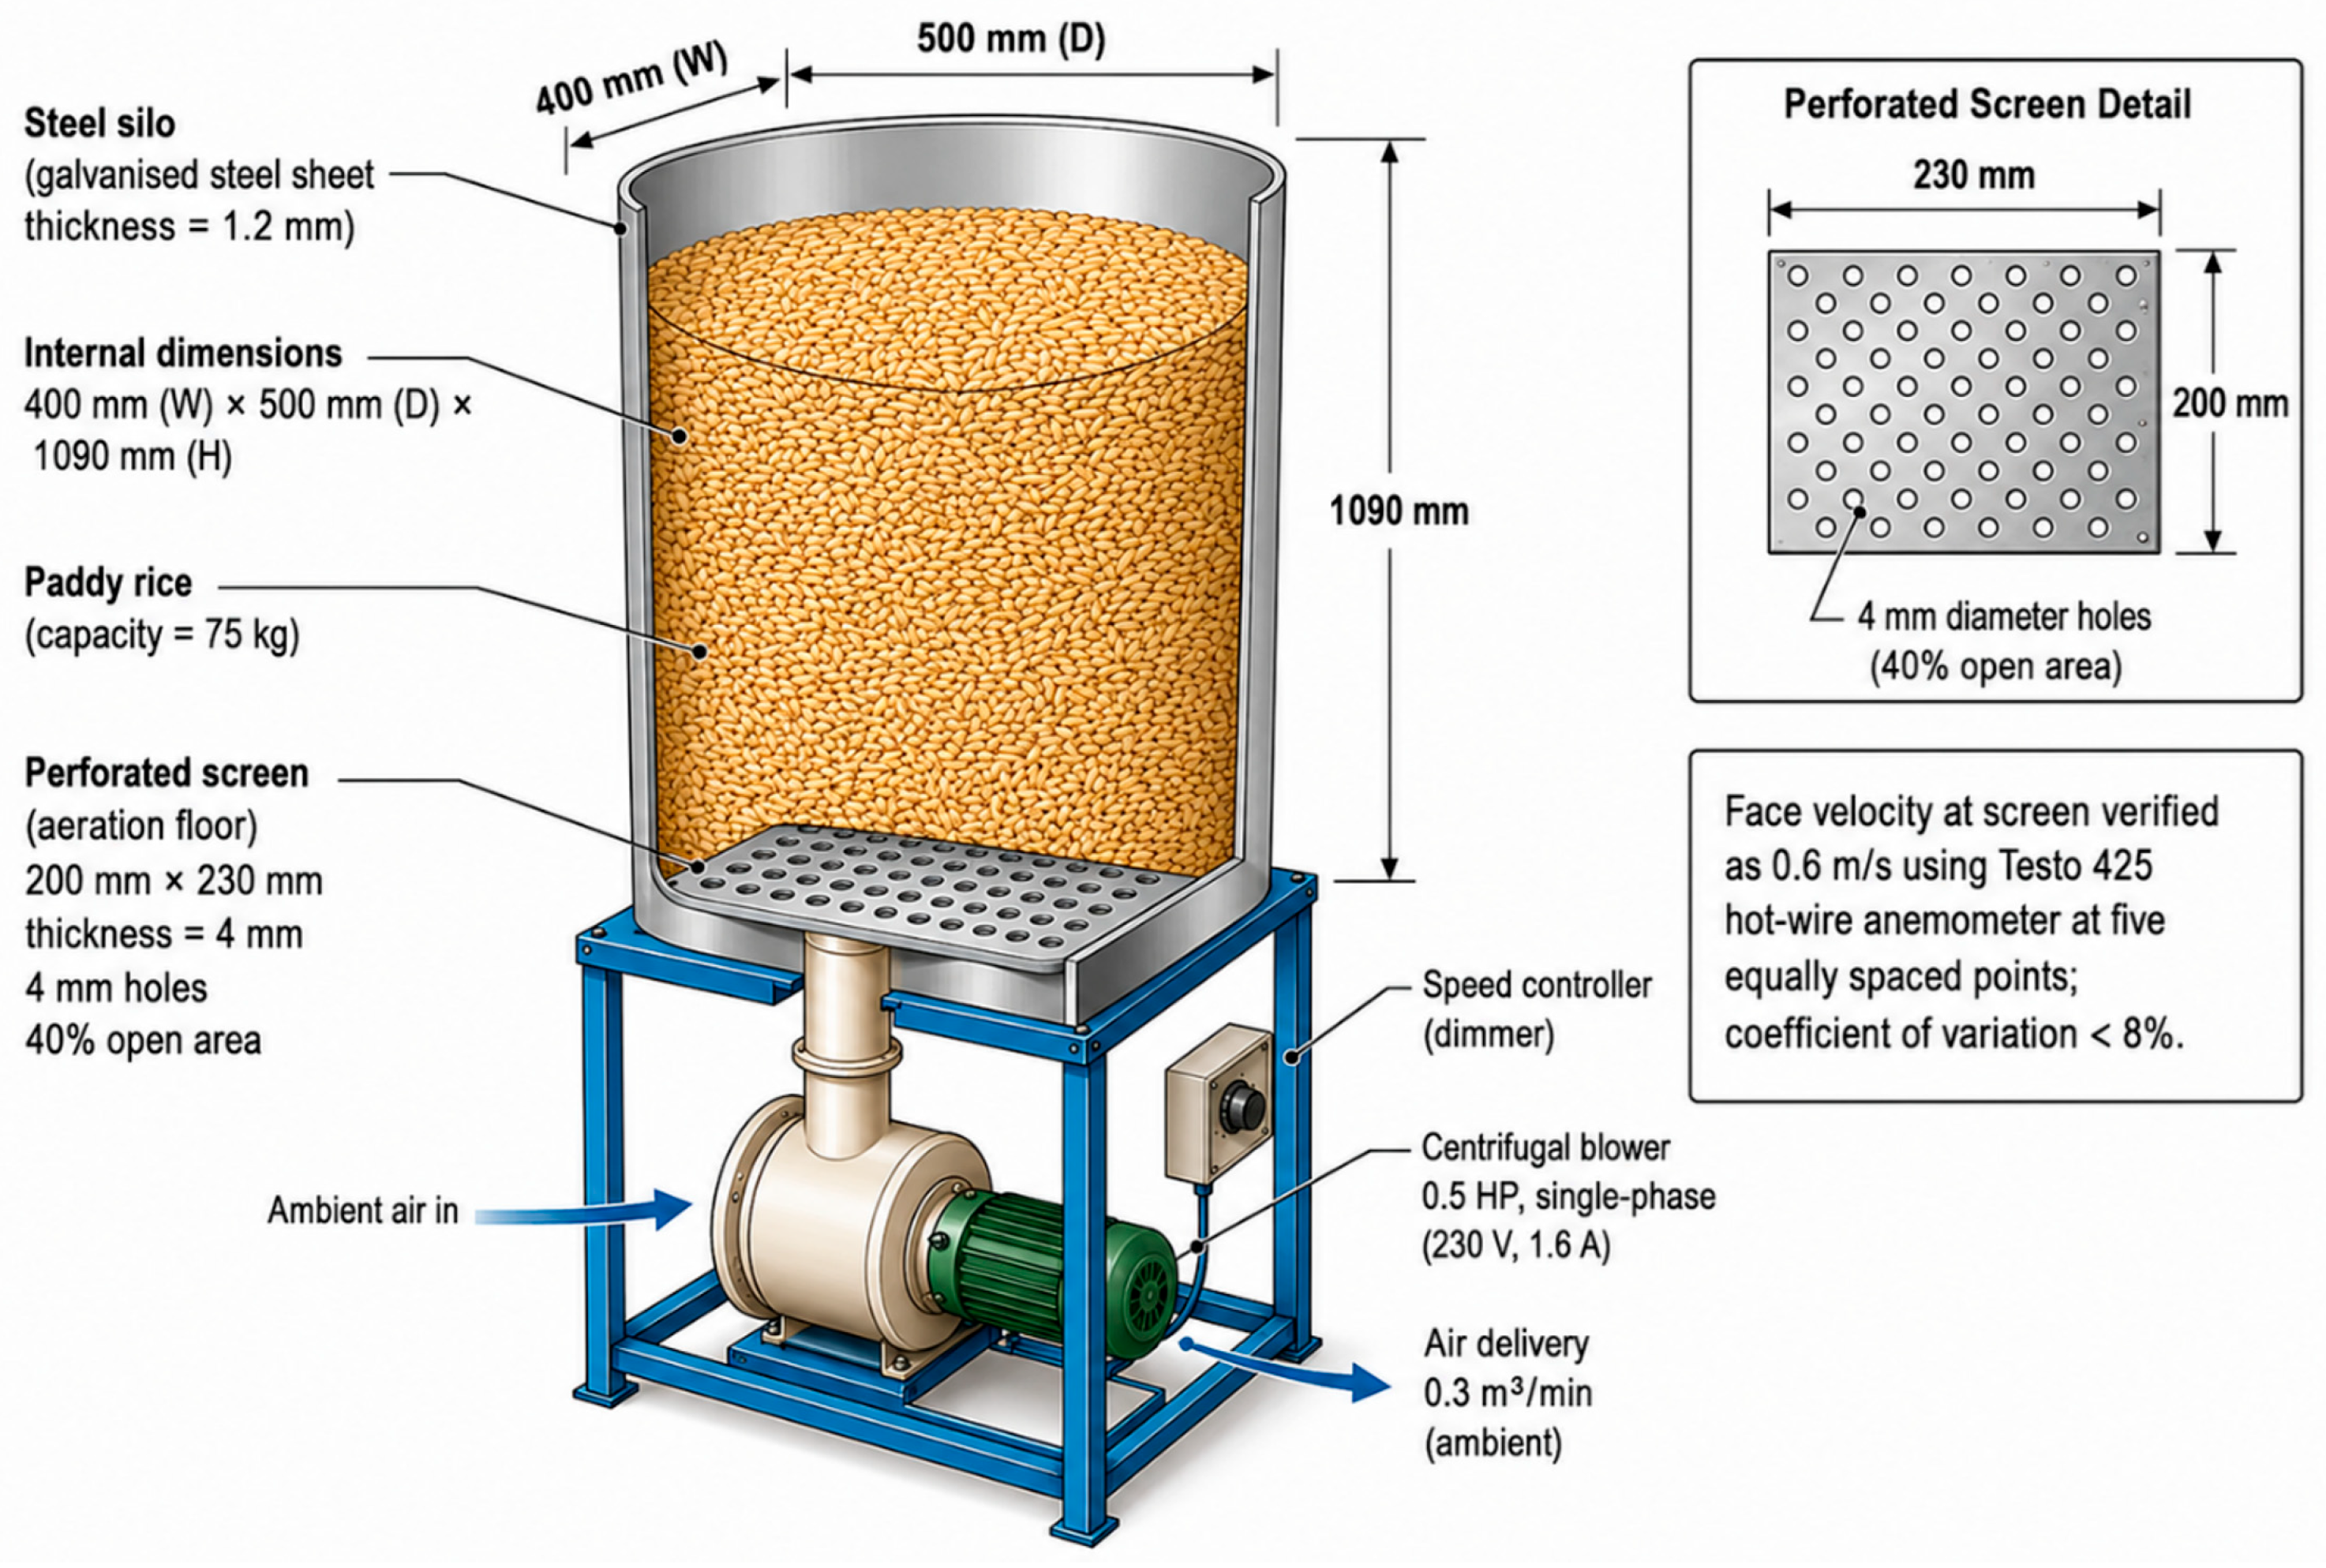
Figure 1.
Laboratory-scale paddy storage silo and aeration system. This figure was generated with the assistance of OpenAI ChatGPT (GPT-5.5), image-generation functionality. Prompt: “Create a clear academic engineering schematic of a laboratory-scale paddy storage silo and aeration system. Include a perforated aeration screen (200 × 230 mm, 4 mm thickness, 4 mm diameter holes, 40% open area), a centrifugal blower (0.5 HP, single-phase, 230 V, 1.6 A), a speed controller, ambient-air inlet, and air delivery of 0.3 m3/min. Present the system as a clean, technically accurate engineering illustration suitable for an academic journal.”
Figure 1.
Laboratory-scale paddy storage silo and aeration system. This figure was generated with the assistance of OpenAI ChatGPT (GPT-5.5), image-generation functionality. Prompt: “Create a clear academic engineering schematic of a laboratory-scale paddy storage silo and aeration system. Include a perforated aeration screen (200 × 230 mm, 4 mm thickness, 4 mm diameter holes, 40% open area), a centrifugal blower (0.5 HP, single-phase, 230 V, 1.6 A), a speed controller, ambient-air inlet, and air delivery of 0.3 m3/min. Present the system as a clean, technically accurate engineering illustration suitable for an academic journal.”
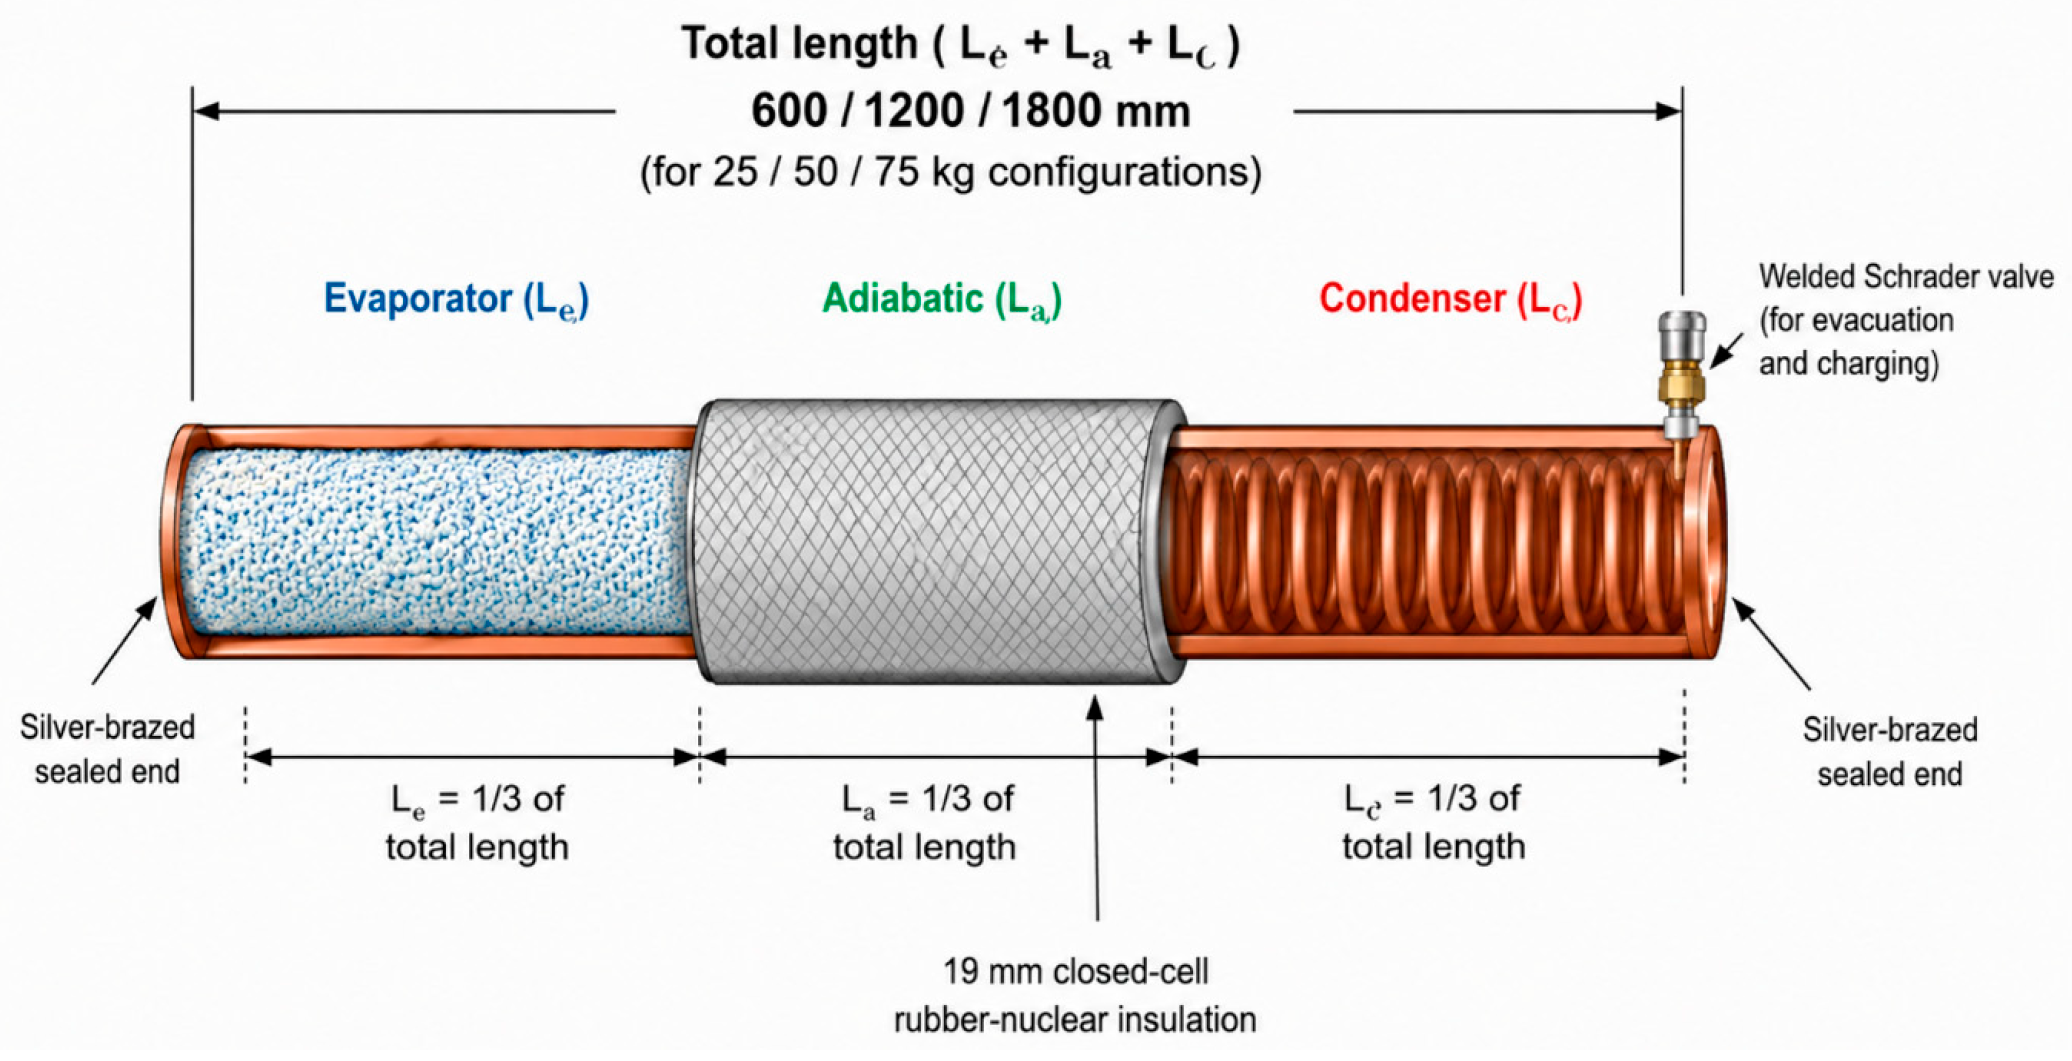
Figure 2.
SCTPC configuration for passive grain cooling. This figure was generated with the assistance of OpenAI ChatGPT (GPT-5.5), image-generation functionality. Prompt: “Create a clear academic engineering schematic of an adiabatic thermal storage unit consisting of three equal-length sections. Indicate that each section represents one-third of the total length. Illustrate the evaporator with a cooled working-fluid region, the central adiabatic section covered with 19 mm closed-cell rubber-nuclear insulation, and the condenser with a coiled internal tube. Show silver-brazed sealed ends and a welded Schrader valve for evacuation and charging. Use dimension arrows, engineering labels, and a clean white background suitable for an academic journal figure.”
Figure 2.
SCTPC configuration for passive grain cooling. This figure was generated with the assistance of OpenAI ChatGPT (GPT-5.5), image-generation functionality. Prompt: “Create a clear academic engineering schematic of an adiabatic thermal storage unit consisting of three equal-length sections. Indicate that each section represents one-third of the total length. Illustrate the evaporator with a cooled working-fluid region, the central adiabatic section covered with 19 mm closed-cell rubber-nuclear insulation, and the condenser with a coiled internal tube. Show silver-brazed sealed ends and a welded Schrader valve for evacuation and charging. Use dimension arrows, engineering labels, and a clean white background suitable for an academic journal figure.”
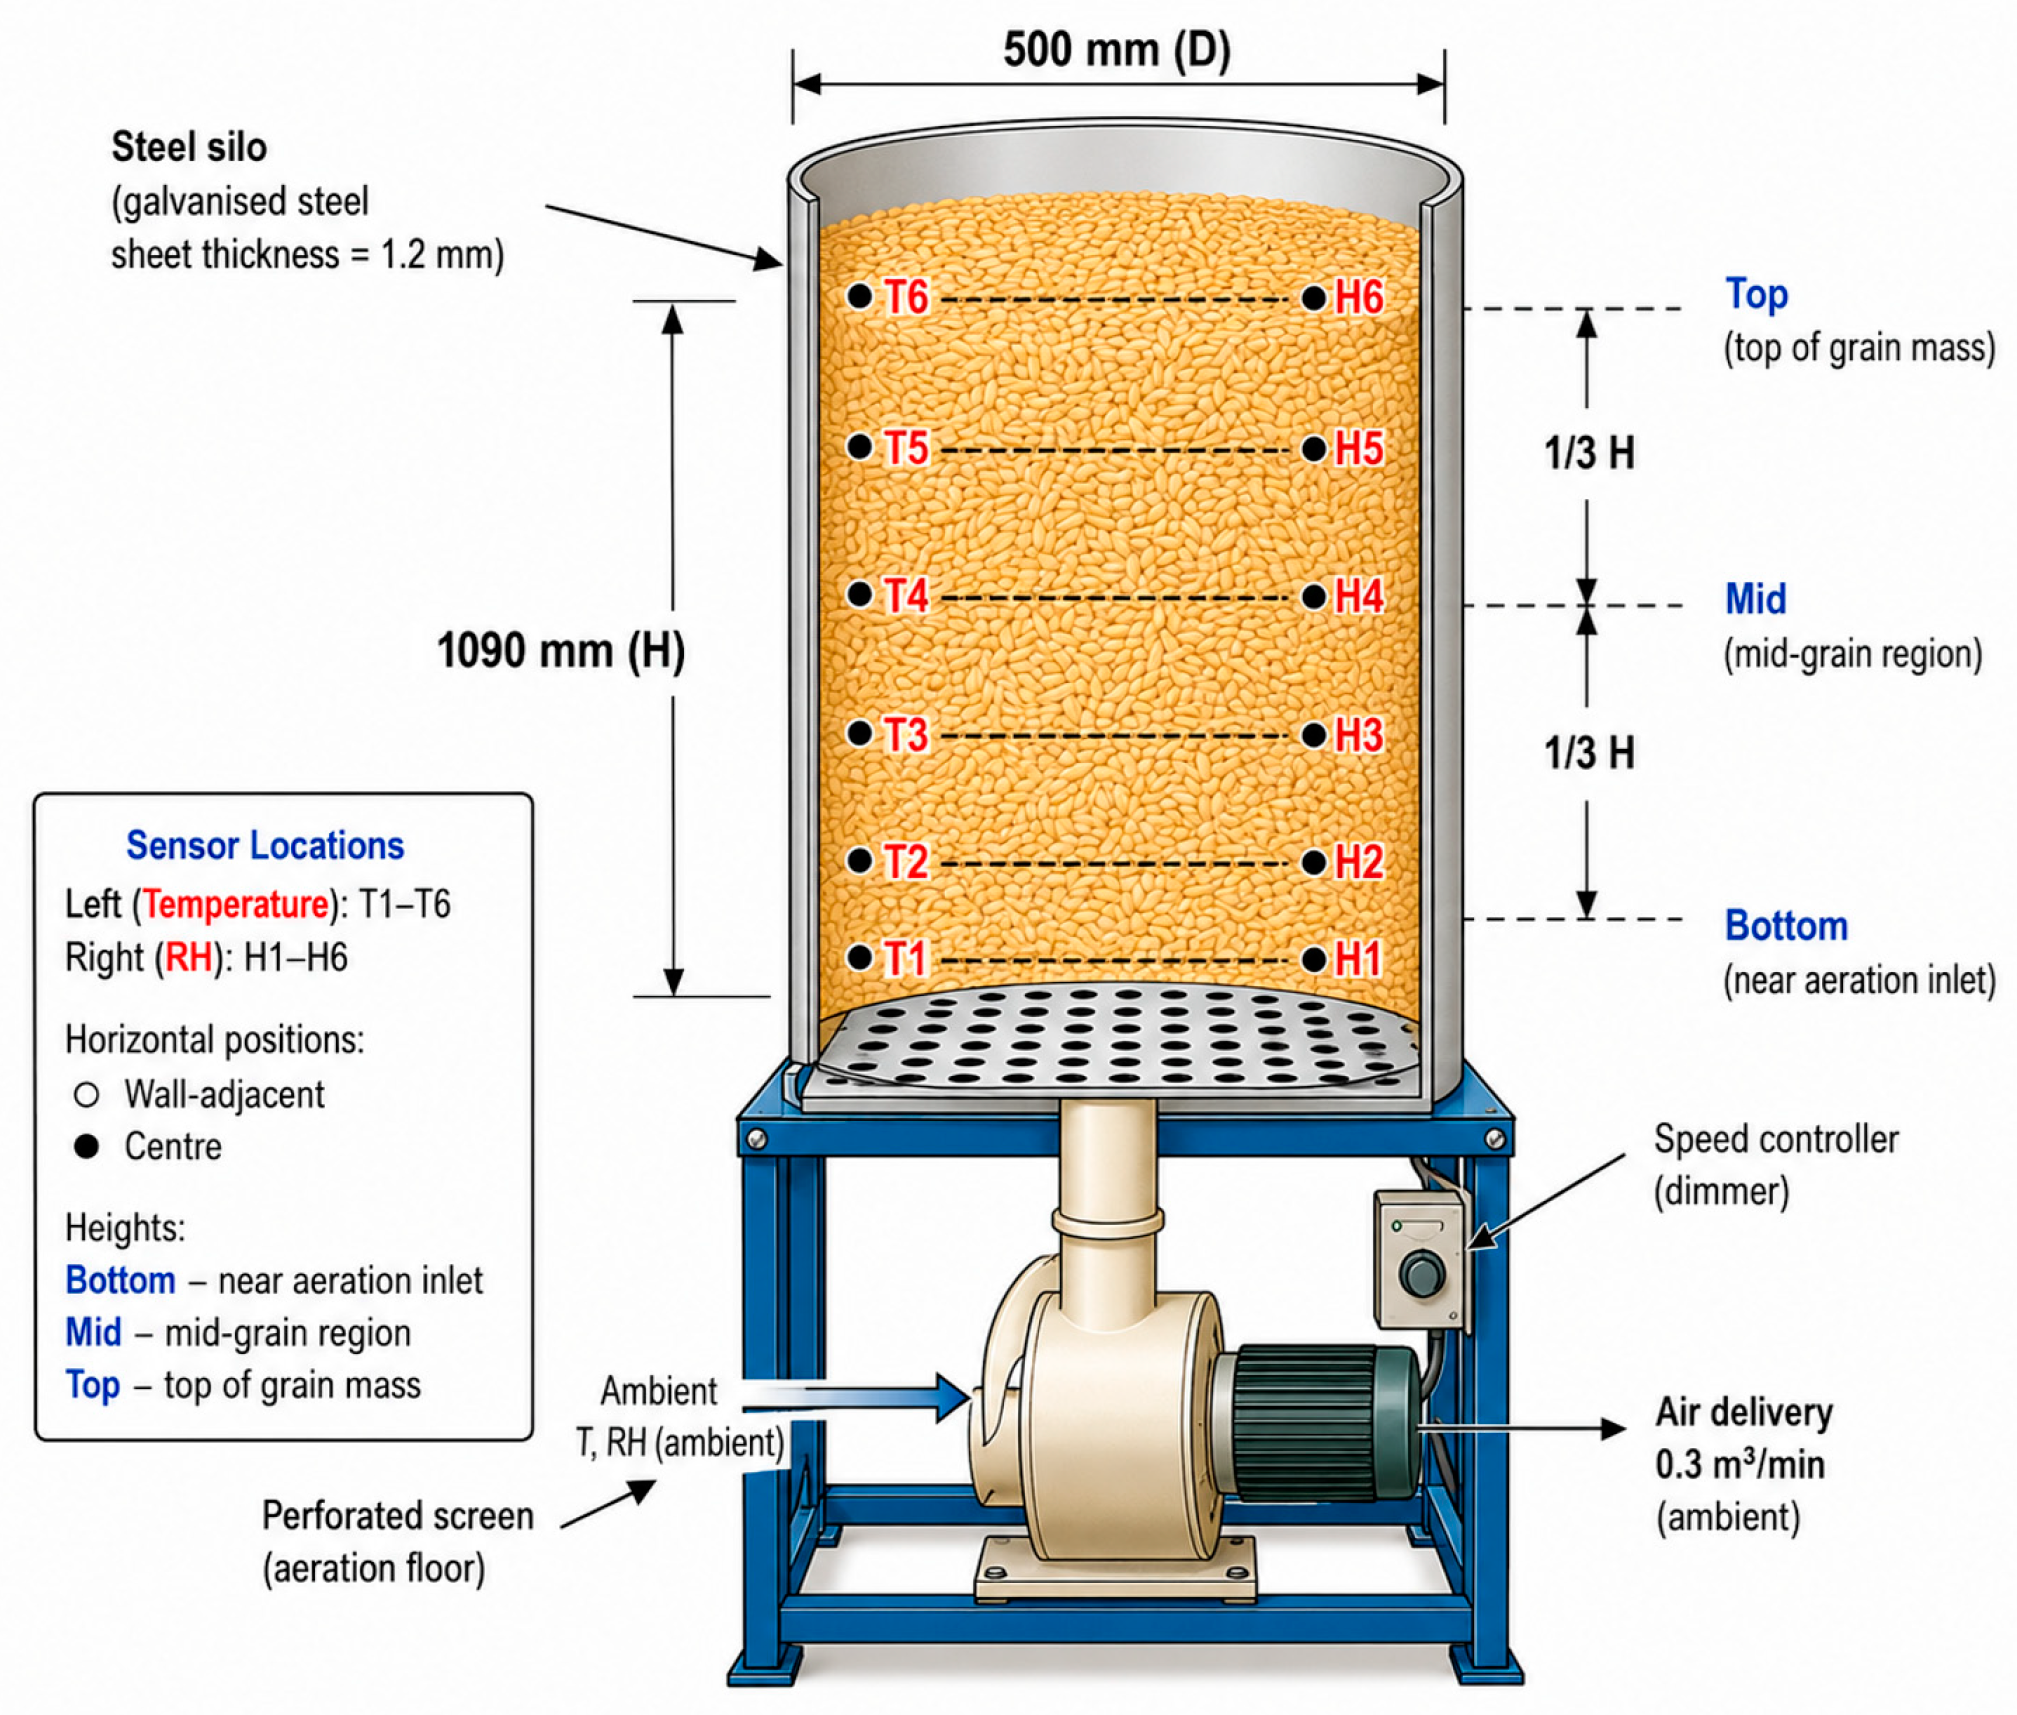
Figure 3.
Sensor layout inside the laboratory-scale storage silo. This figure was generated with the assistance of OpenAI ChatGPT (GPT-5.5), image-generation functionality. Prompt: “Create a clear academic engineering schematic of a laboratory-scale paddy storage silo and aeration system showing a galvanized-steel silo containing paddy rice, a perforated aeration floor, centrifugal blower, speed controller, ambient-air inlet, and air delivery. Present the system as a clean, technically accurate engineering illustration suitable for an academic journal.”
Figure 3.
Sensor layout inside the laboratory-scale storage silo. This figure was generated with the assistance of OpenAI ChatGPT (GPT-5.5), image-generation functionality. Prompt: “Create a clear academic engineering schematic of a laboratory-scale paddy storage silo and aeration system showing a galvanized-steel silo containing paddy rice, a perforated aeration floor, centrifugal blower, speed controller, ambient-air inlet, and air delivery. Present the system as a clean, technically accurate engineering illustration suitable for an academic journal.”
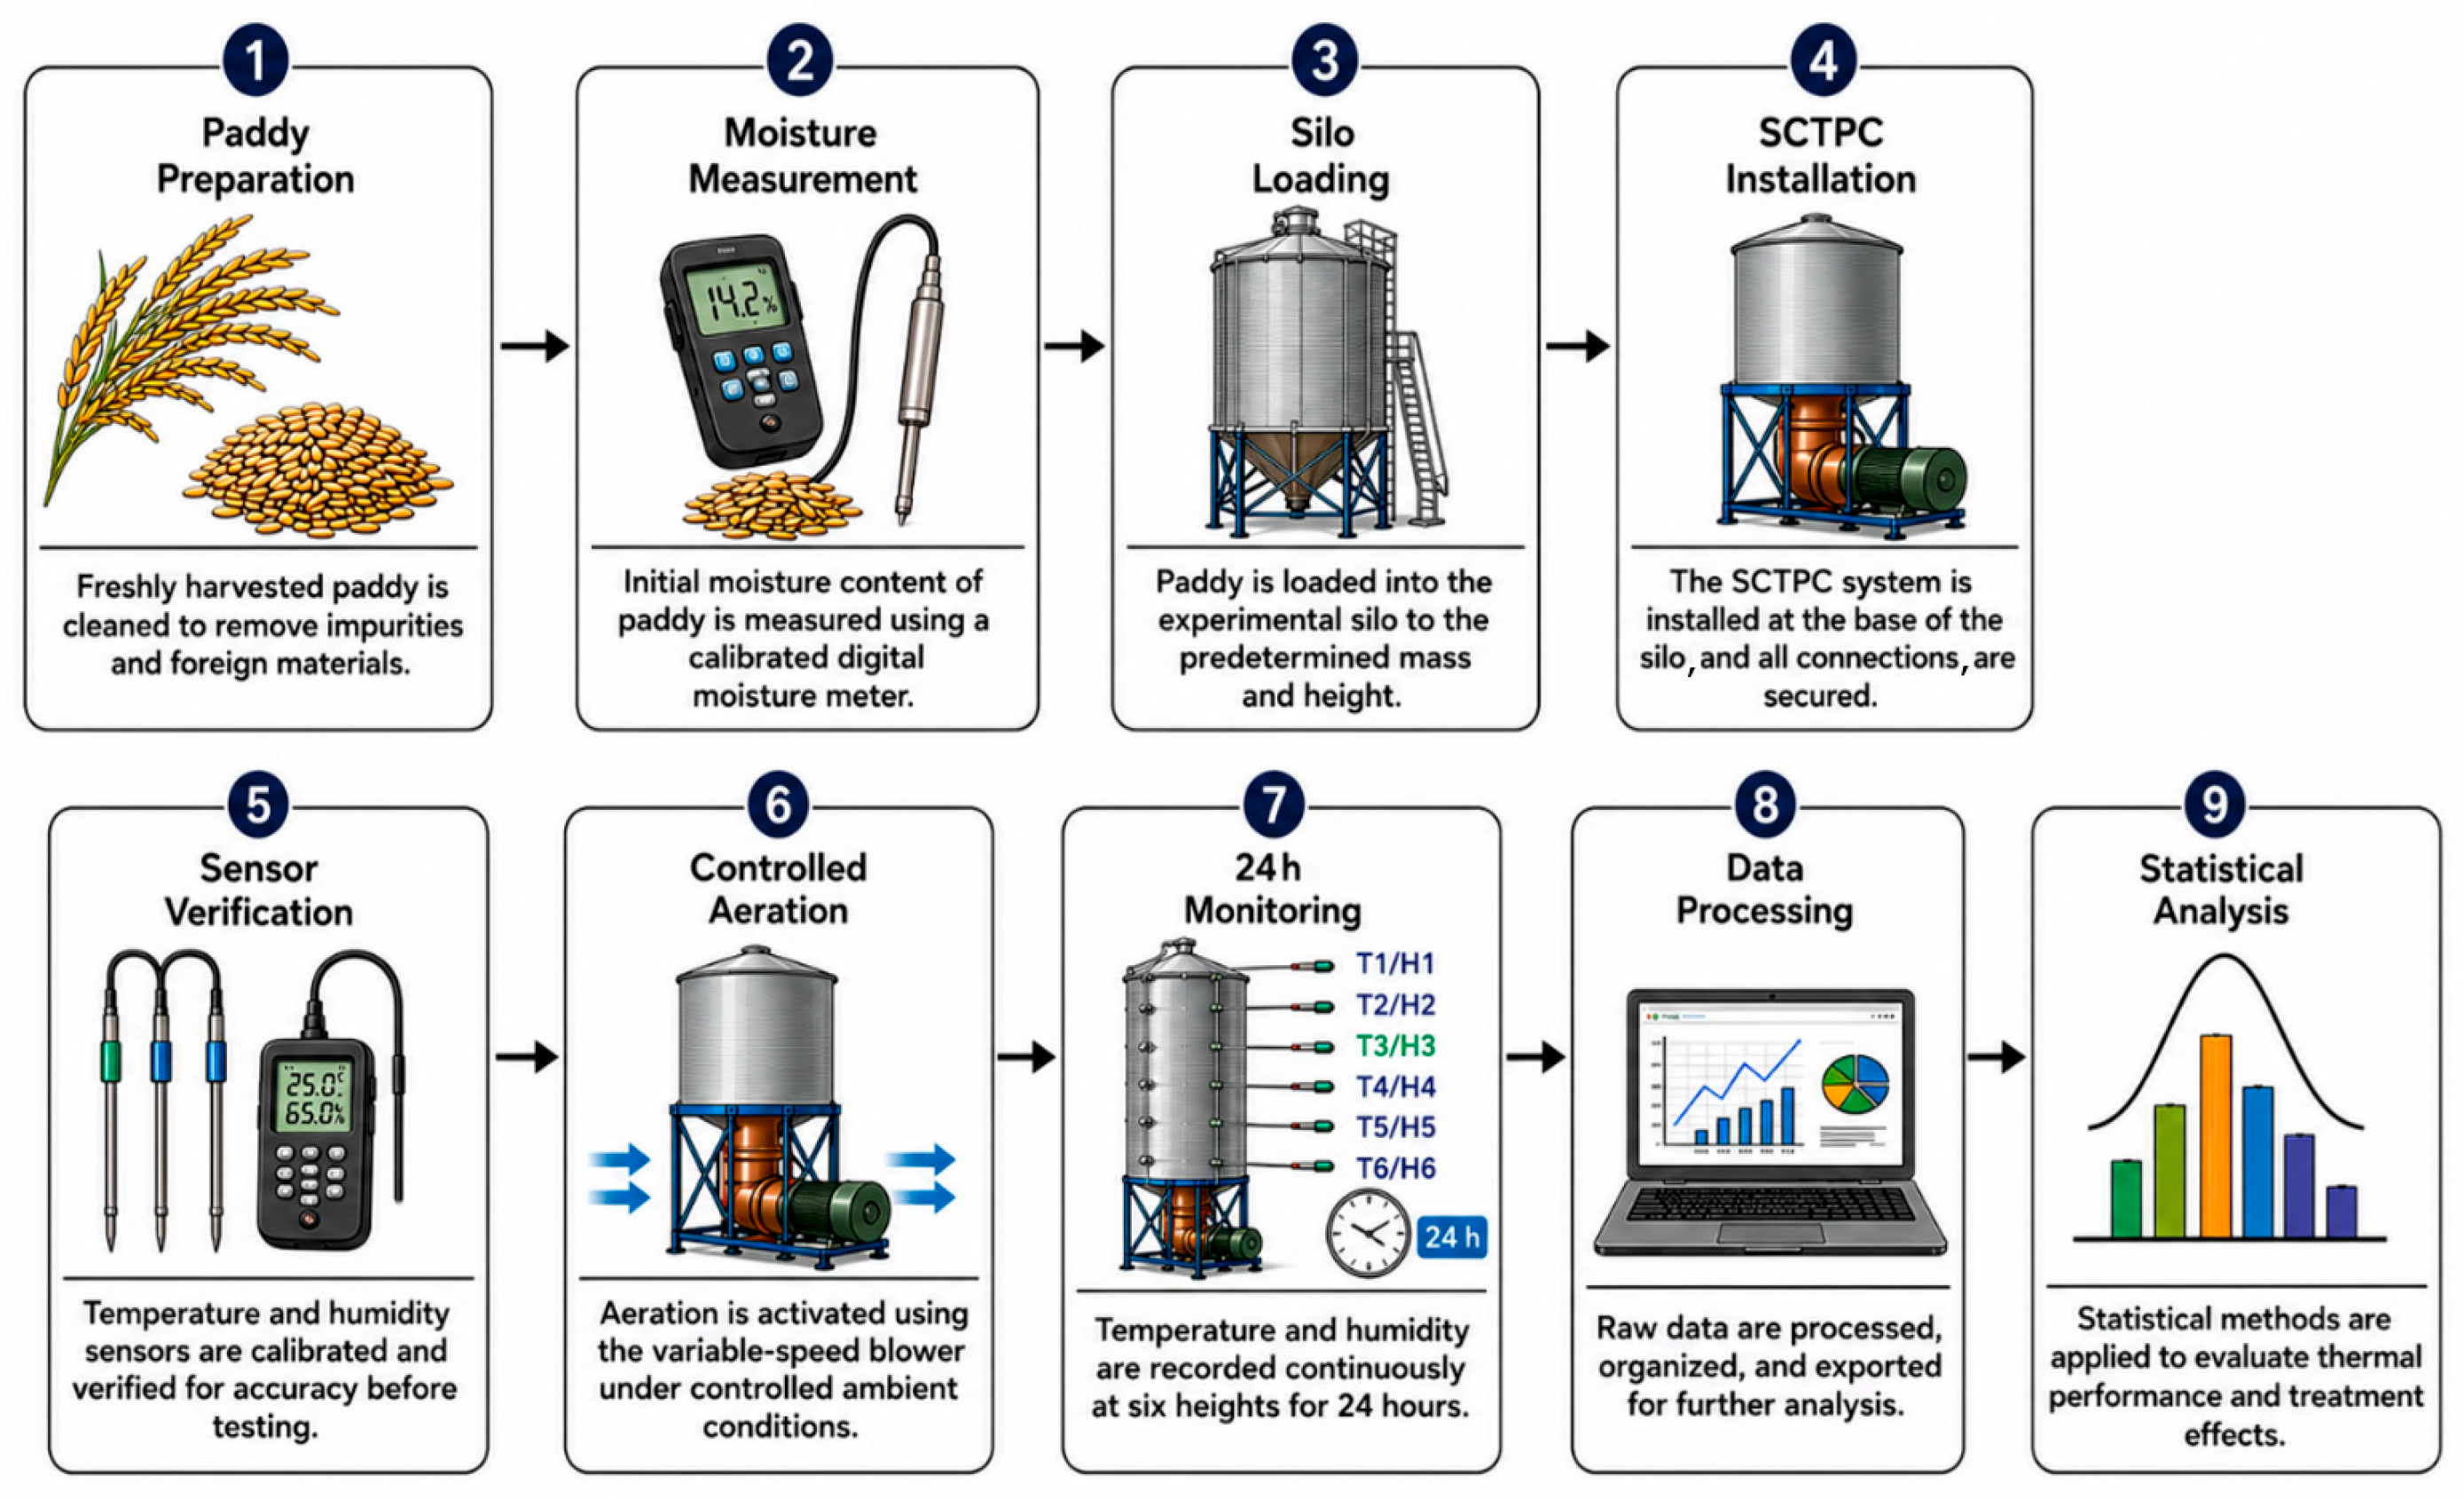
Figure 4.
Experimental workflow for evaluating paddy cooling performance under four treatment conditions and three storage capacities. This figure was generated with the assistance of OpenAI ChatGPT (GPT-5.5), image-generation functionality. Prompt: “Create a clear academic workflow diagram for a laboratory-scale paddy storage and controlled-aeration experiment. Present nine sequential steps: (1) paddy preparation; (2) initial moisture-content measurement; (3) loading paddy into the experimental silo; (4) installation of the SCTPC system at the base of the silo with all connections secured; (5) verification and calibration of temperature and humidity sensors; (6) controlled aeration using a variable-speed blower under ambient conditions; (7) continuous 24 hour monitoring of temperature and humidity at six sensor levels; (8) processing, organization, and export of recorded data; and (9) statistical analysis to evaluate thermal performance and treatment effects. Arrange the steps sequentially with arrows and use clean, technically accurate engineering illustrations suitable for an academic journal.”
Figure 4.
Experimental workflow for evaluating paddy cooling performance under four treatment conditions and three storage capacities. This figure was generated with the assistance of OpenAI ChatGPT (GPT-5.5), image-generation functionality. Prompt: “Create a clear academic workflow diagram for a laboratory-scale paddy storage and controlled-aeration experiment. Present nine sequential steps: (1) paddy preparation; (2) initial moisture-content measurement; (3) loading paddy into the experimental silo; (4) installation of the SCTPC system at the base of the silo with all connections secured; (5) verification and calibration of temperature and humidity sensors; (6) controlled aeration using a variable-speed blower under ambient conditions; (7) continuous 24 hour monitoring of temperature and humidity at six sensor levels; (8) processing, organization, and export of recorded data; and (9) statistical analysis to evaluate thermal performance and treatment effects. Arrange the steps sequentially with arrows and use clean, technically accurate engineering illustrations suitable for an academic journal.”

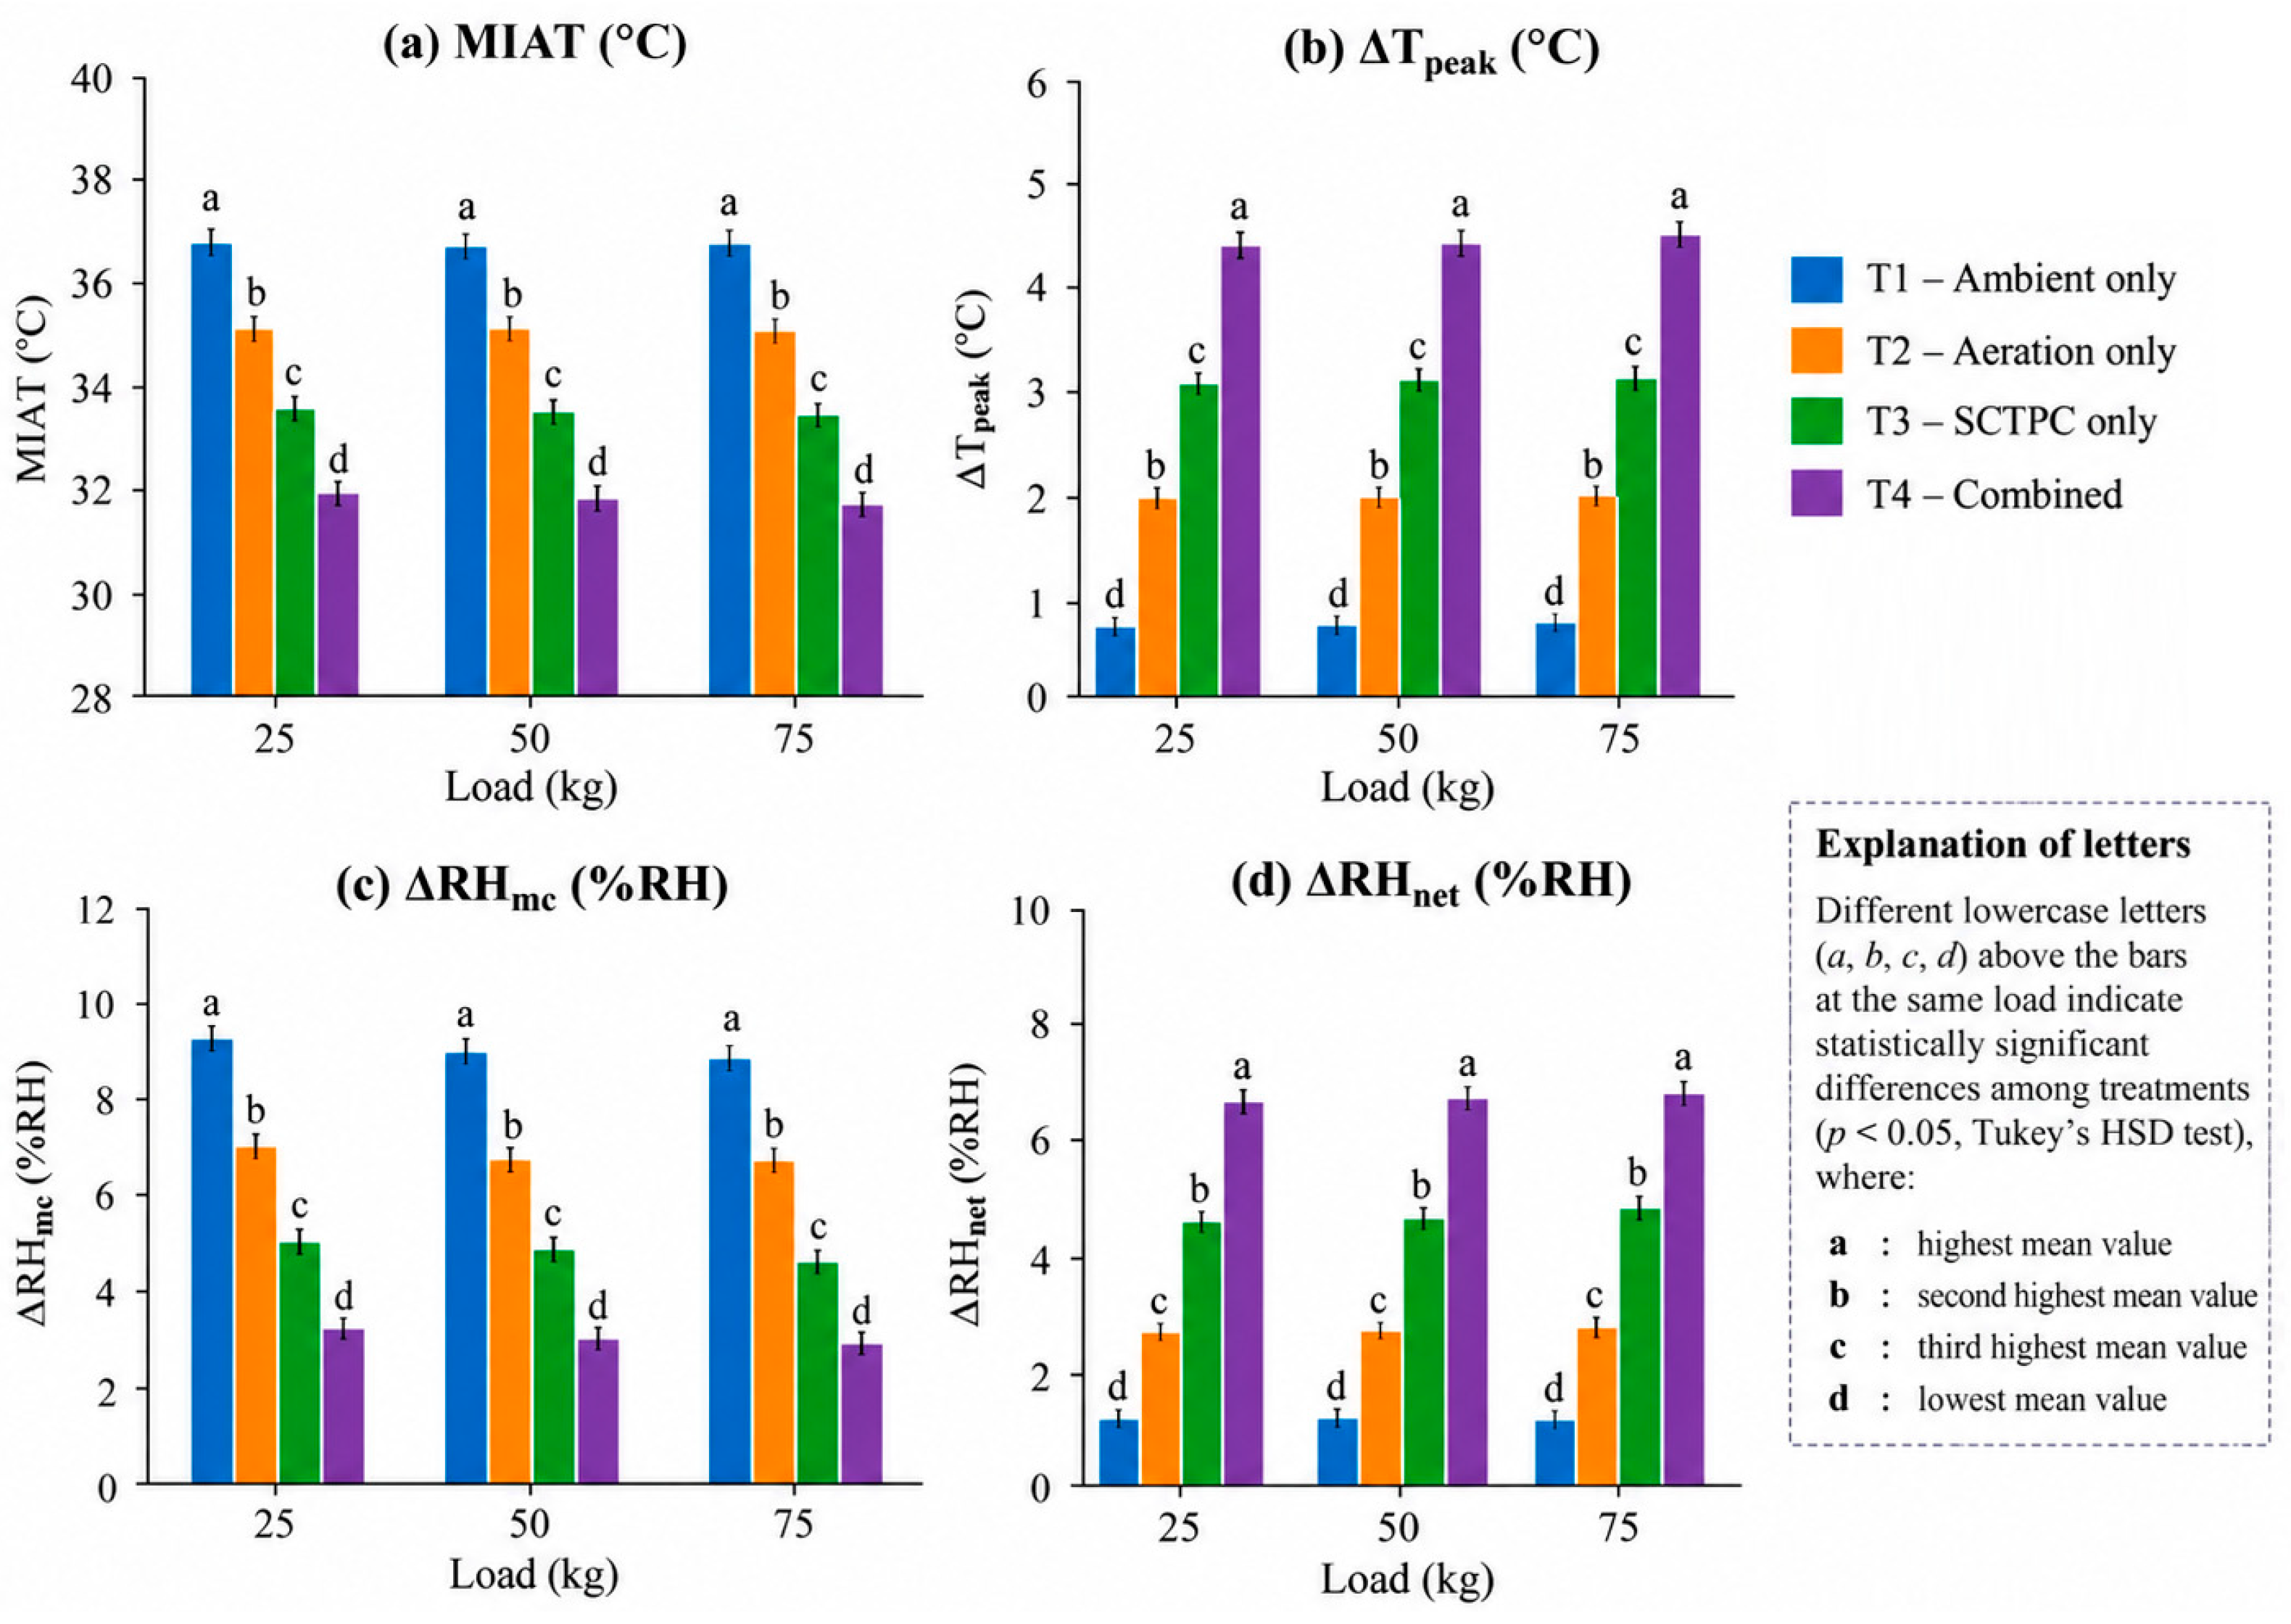
Figure 5.
Comparison of thermal and relative humidity performance indicators under four experimental treatments at three paddy storage capacities: (a) MIAT, (b) , (c) , and (d) .
Figure 5.
Comparison of thermal and relative humidity performance indicators under four experimental treatments at three paddy storage capacities: (a) MIAT, (b) , (c) , and (d) .
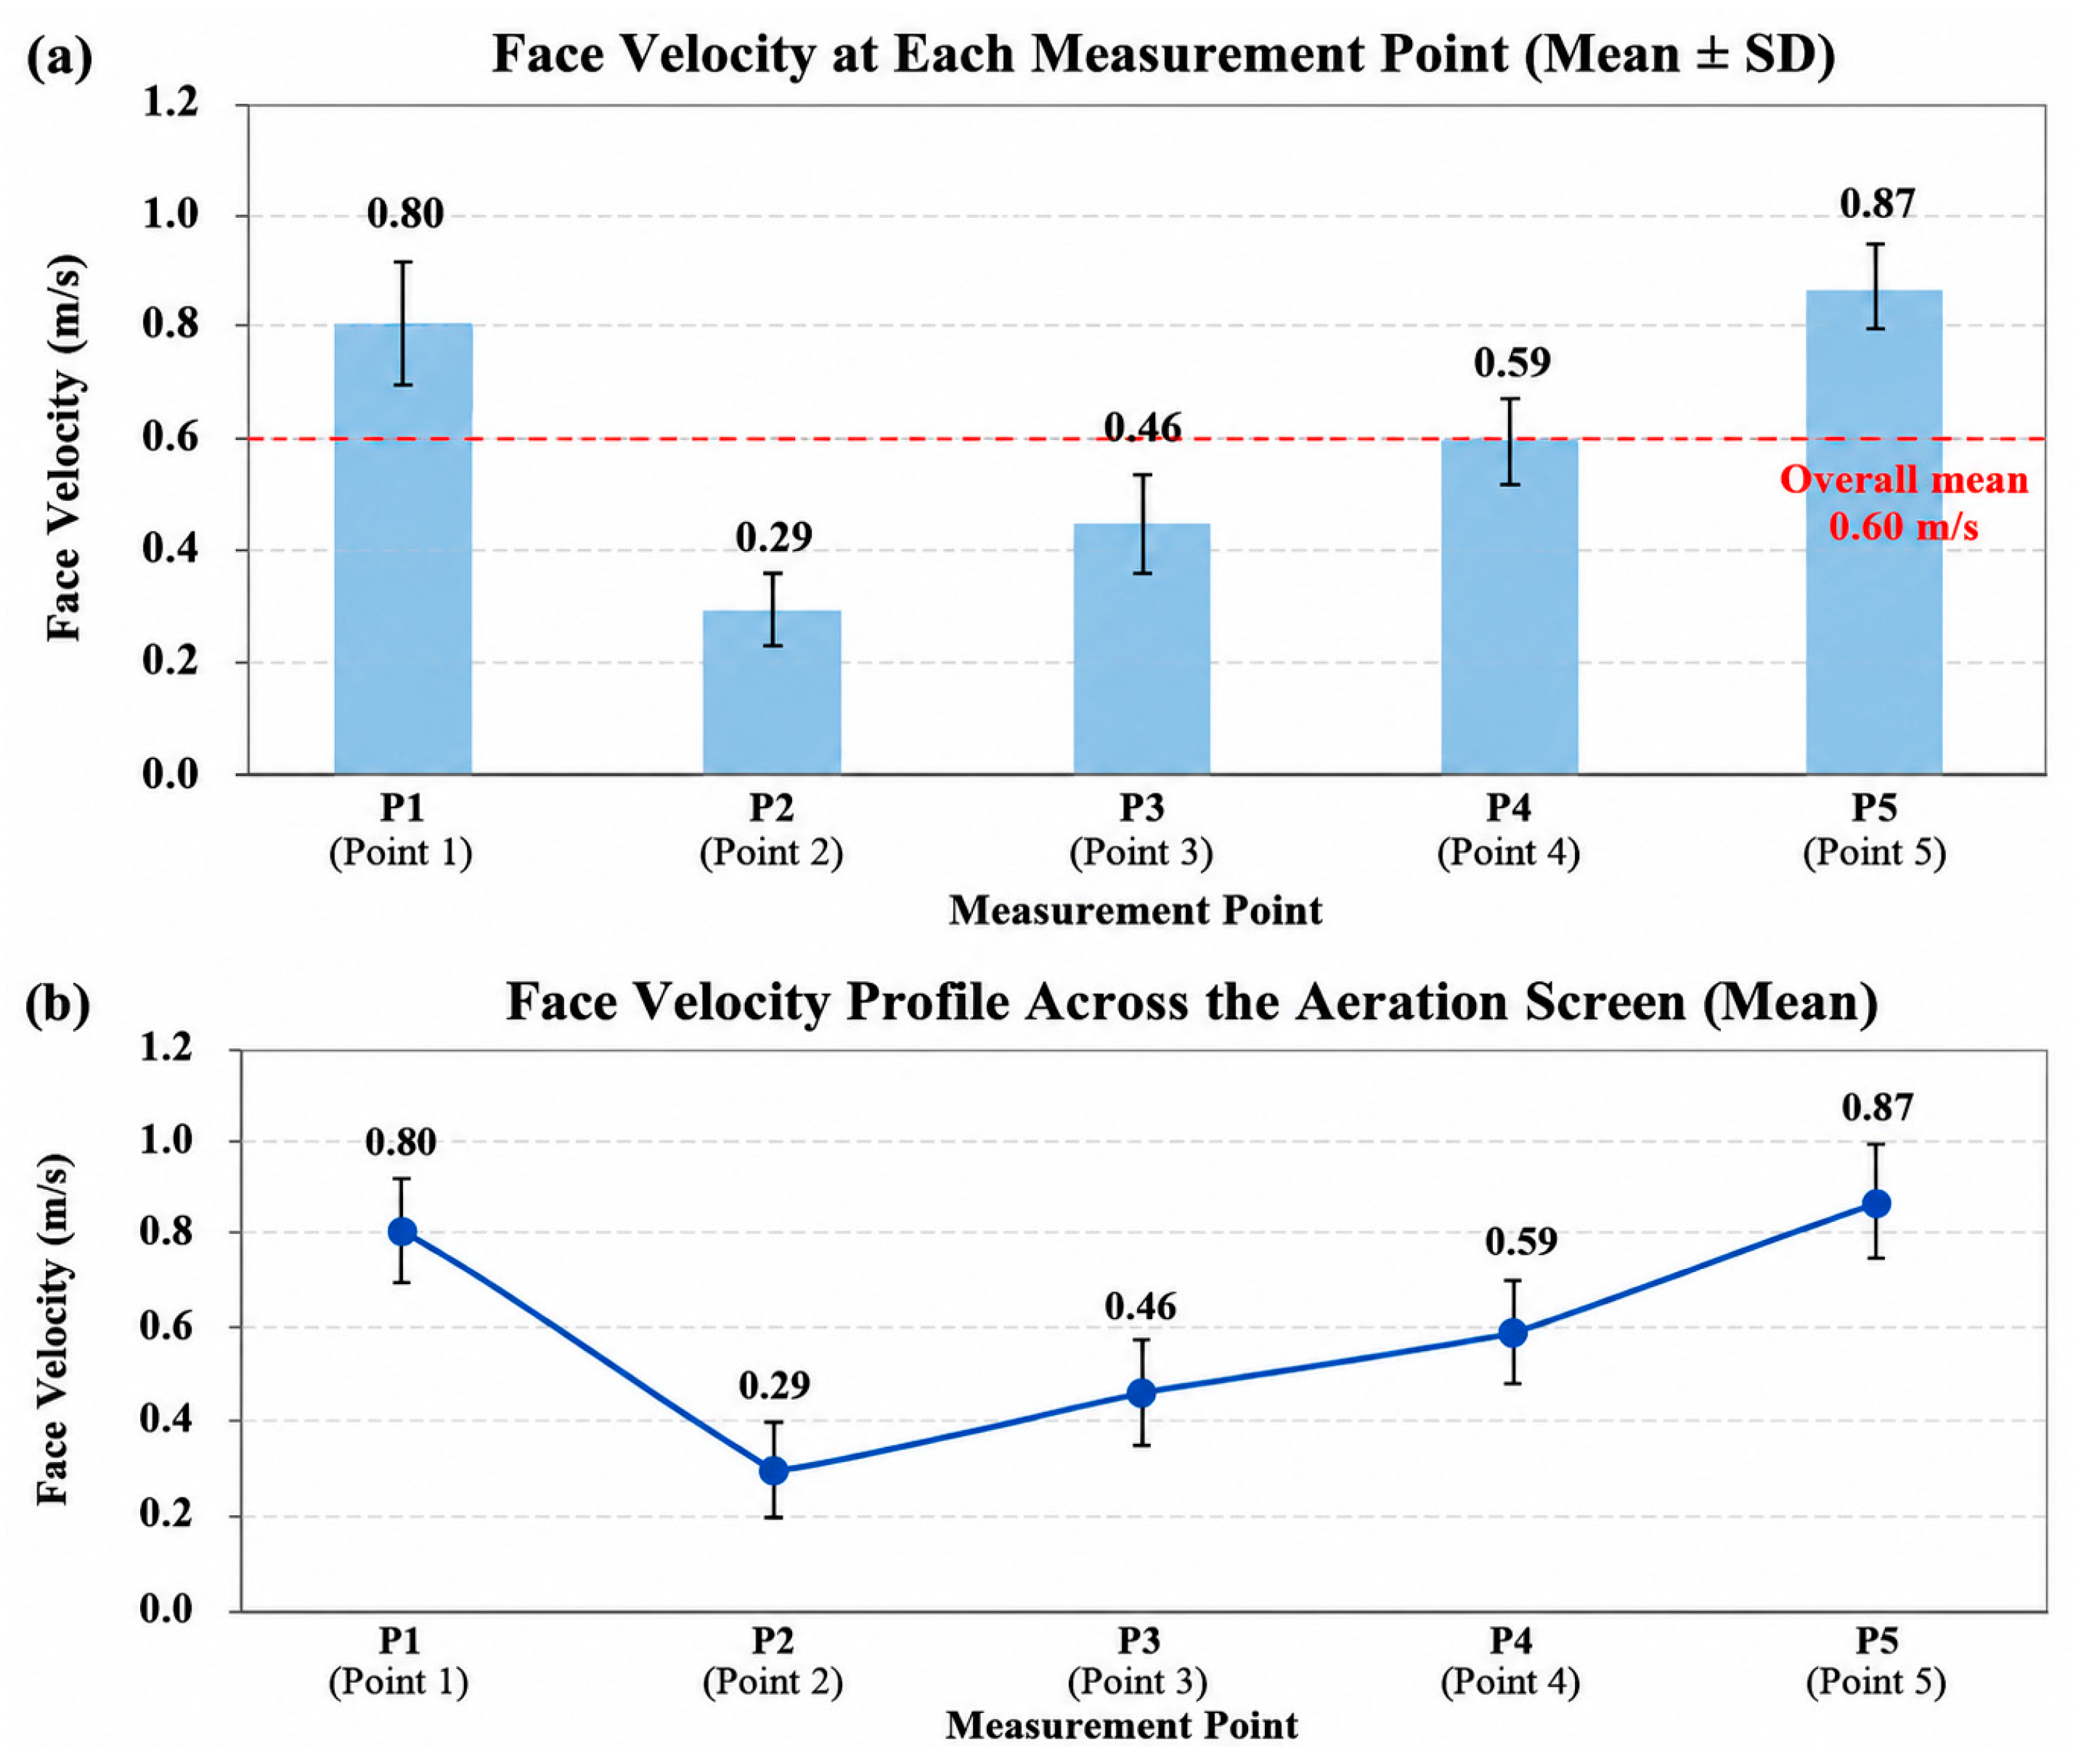
Figure 6.
Airflow distribution across the perforated aeration screen used in the experimental storage system. (a) Mean face velocity (±SD) measured at five locations (P1–P5), with the dashed line indicating the overall mean face velocity (0.60 m s−1). (b) Spatial face velocity profile showing the variation in airflow distribution across the aeration surface.
Figure 6.
Airflow distribution across the perforated aeration screen used in the experimental storage system. (a) Mean face velocity (±SD) measured at five locations (P1–P5), with the dashed line indicating the overall mean face velocity (0.60 m s−1). (b) Spatial face velocity profile showing the variation in airflow distribution across the aeration surface.
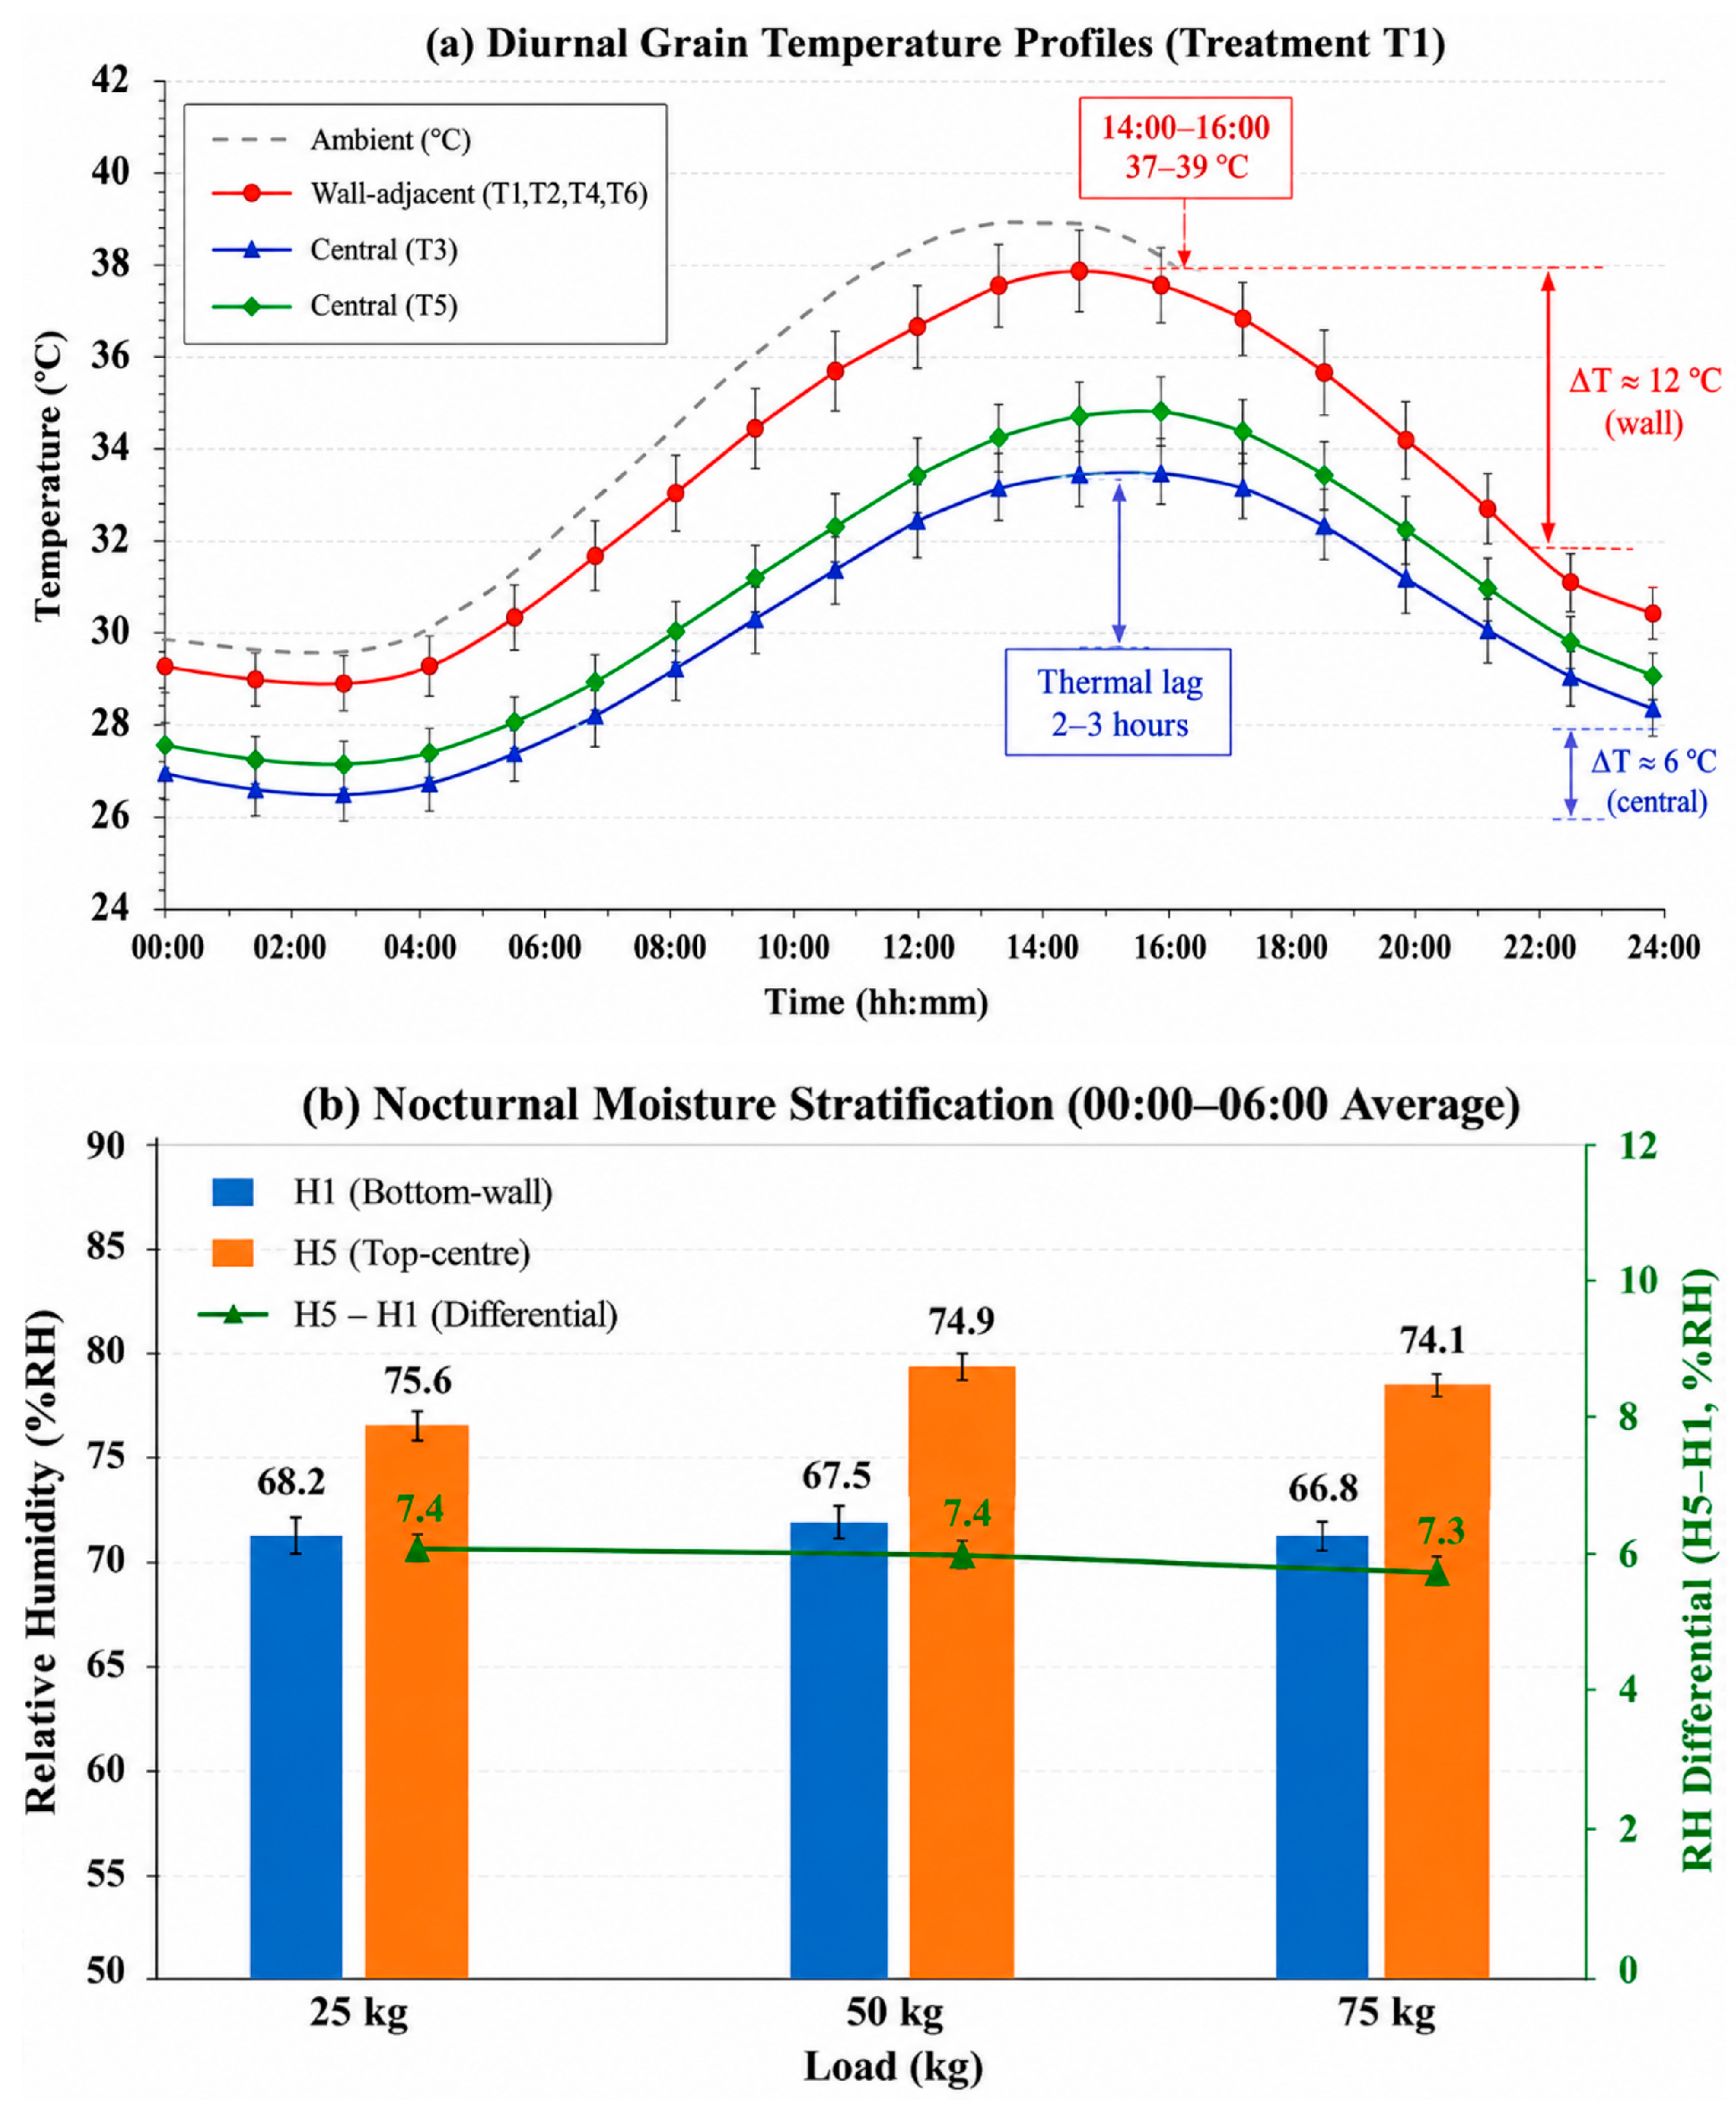
Figure 7.
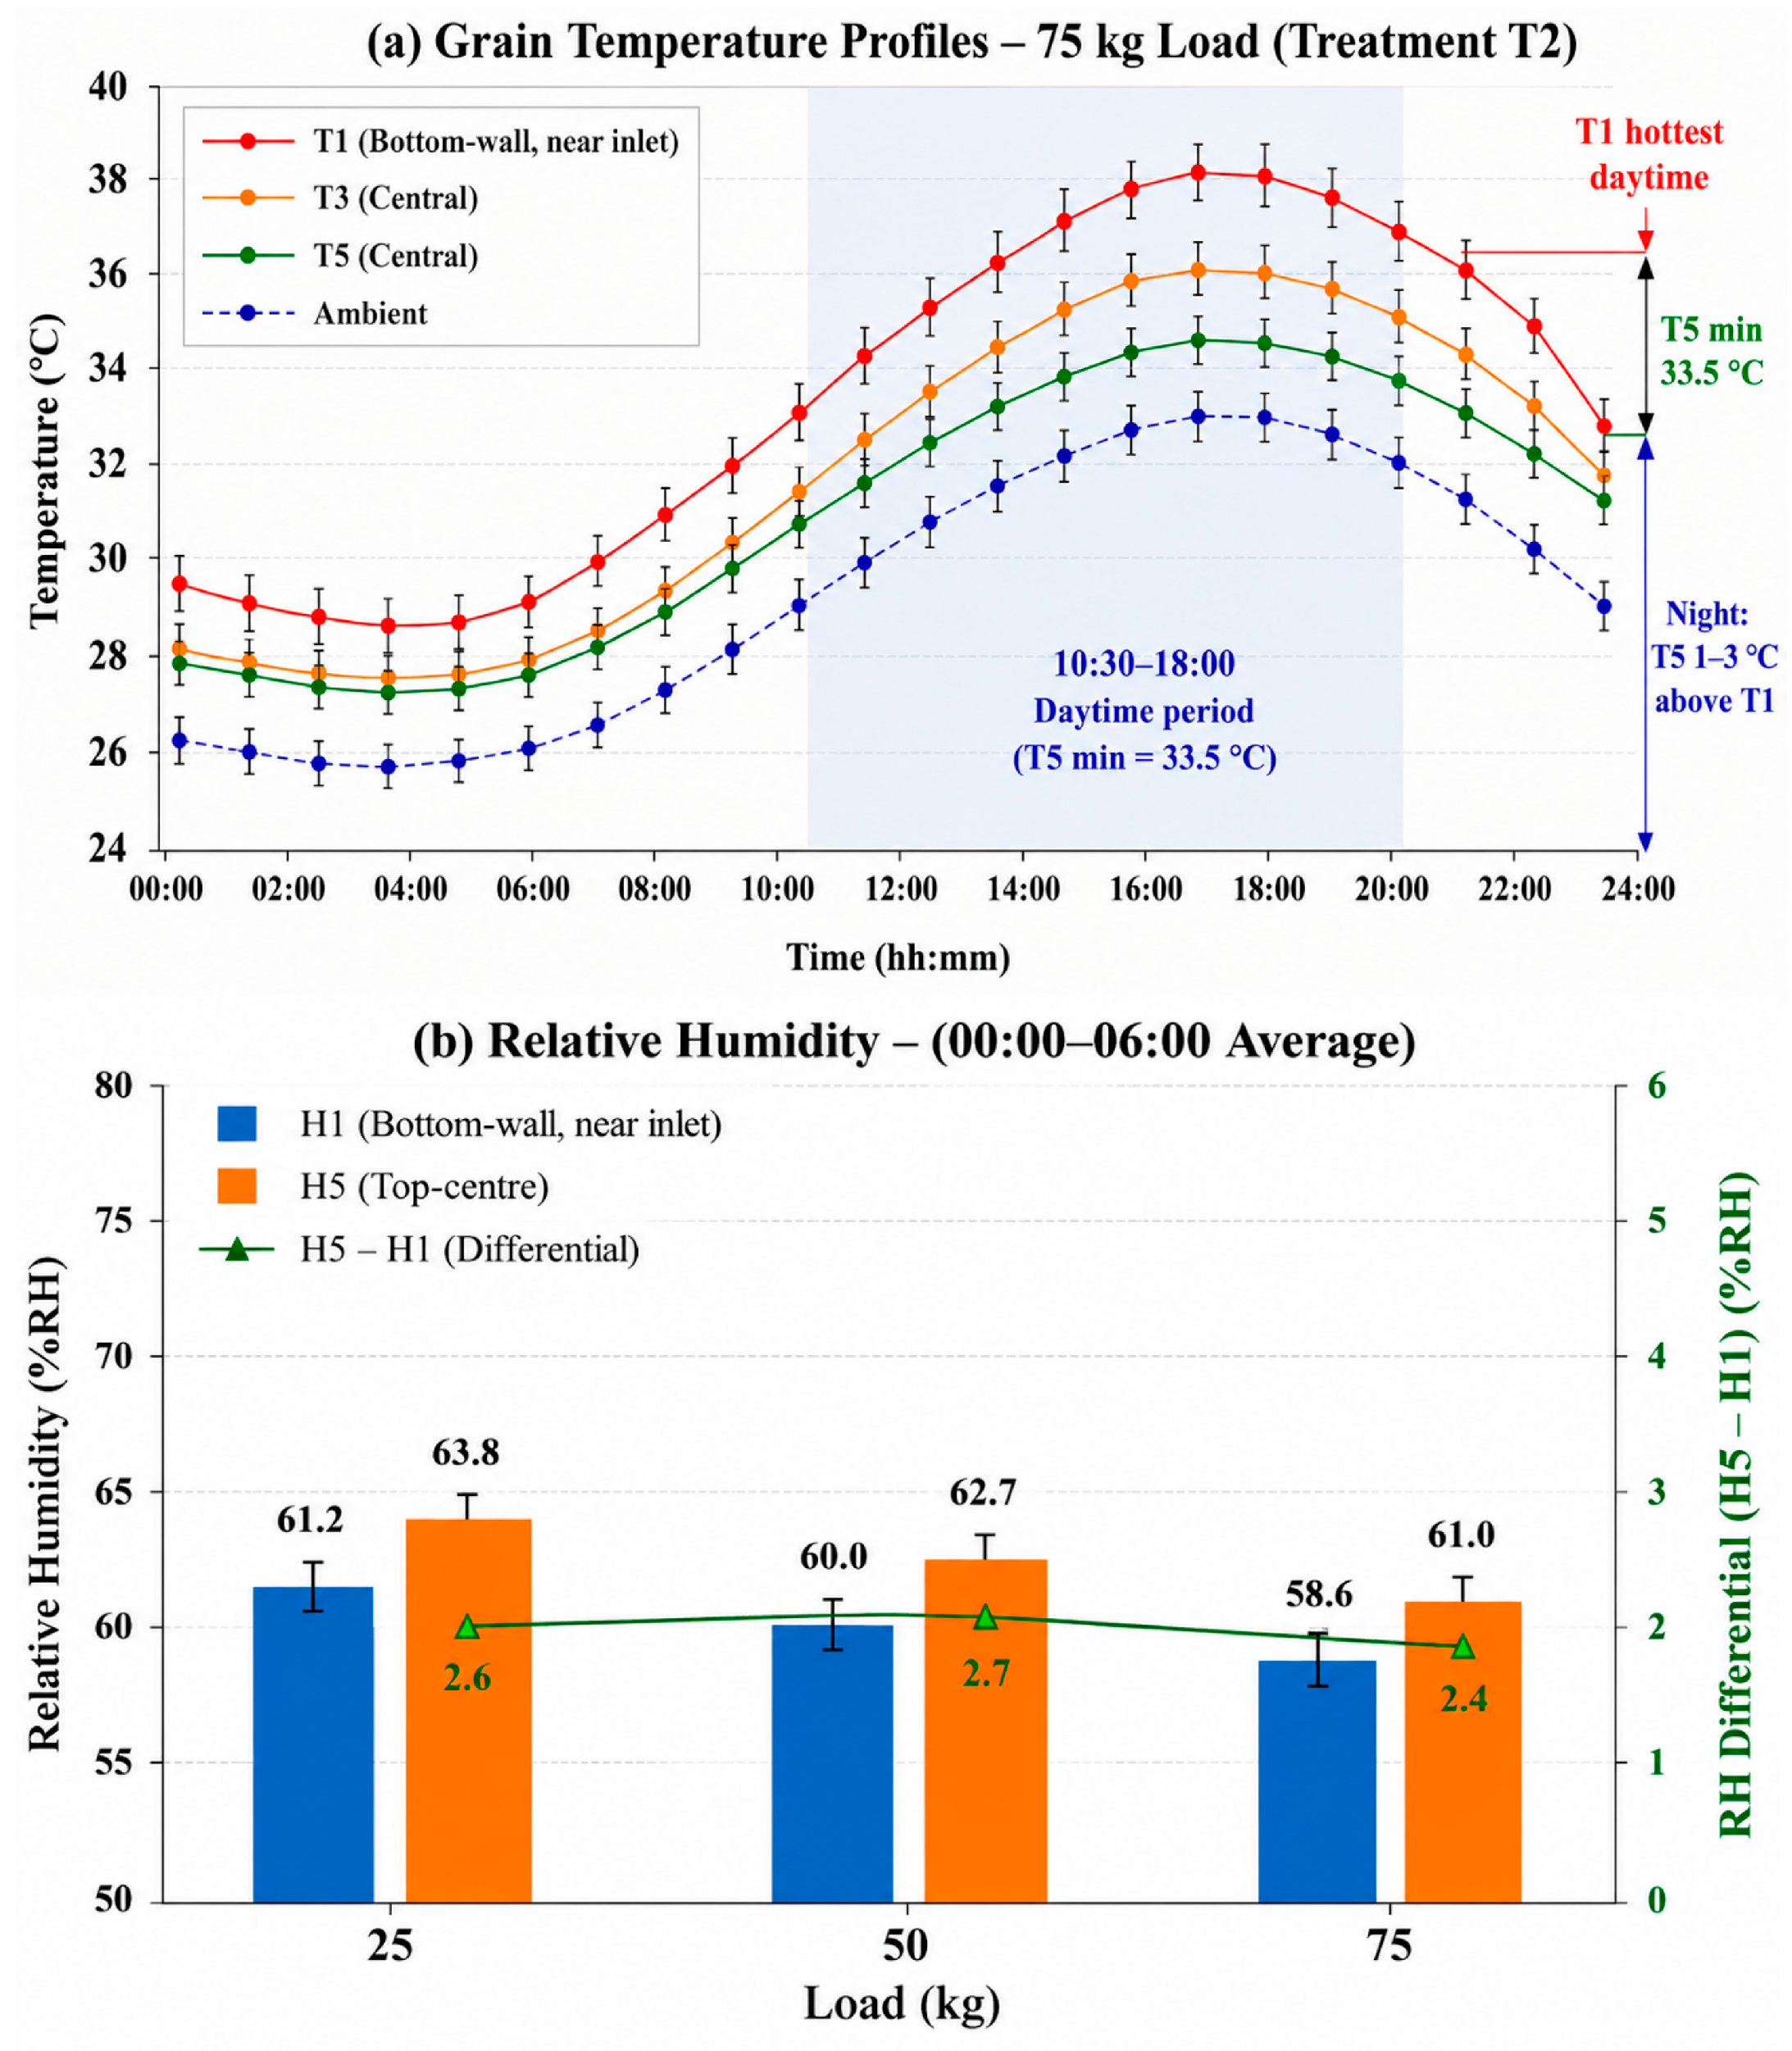
Thermal behaviors and nocturnal moisture stratification of paddy grain under ambient-only storage (Treatment T1). (a) Diurnal temperature profiles. (b) Relative humidity distribution and vertical humidity gradient for different grain loads.
Figure 7.
Thermal behaviors and nocturnal moisture stratification of paddy grain under ambient-only storage (Treatment T1). (a) Diurnal temperature profiles. (b) Relative humidity distribution and vertical humidity gradient for different grain loads.
Figure 8.
Thermal response and nocturnal moisture distribution of paddy grain under aeration-only conditions (Treatment T2). (a) Diurnal temperature profiles. (b) Relative humidity distribution and vertical humidity gradient for different grain loads.
Figure 8.
Thermal response and nocturnal moisture distribution of paddy grain under aeration-only conditions (Treatment T2). (a) Diurnal temperature profiles. (b) Relative humidity distribution and vertical humidity gradient for different grain loads.
Figure 9.
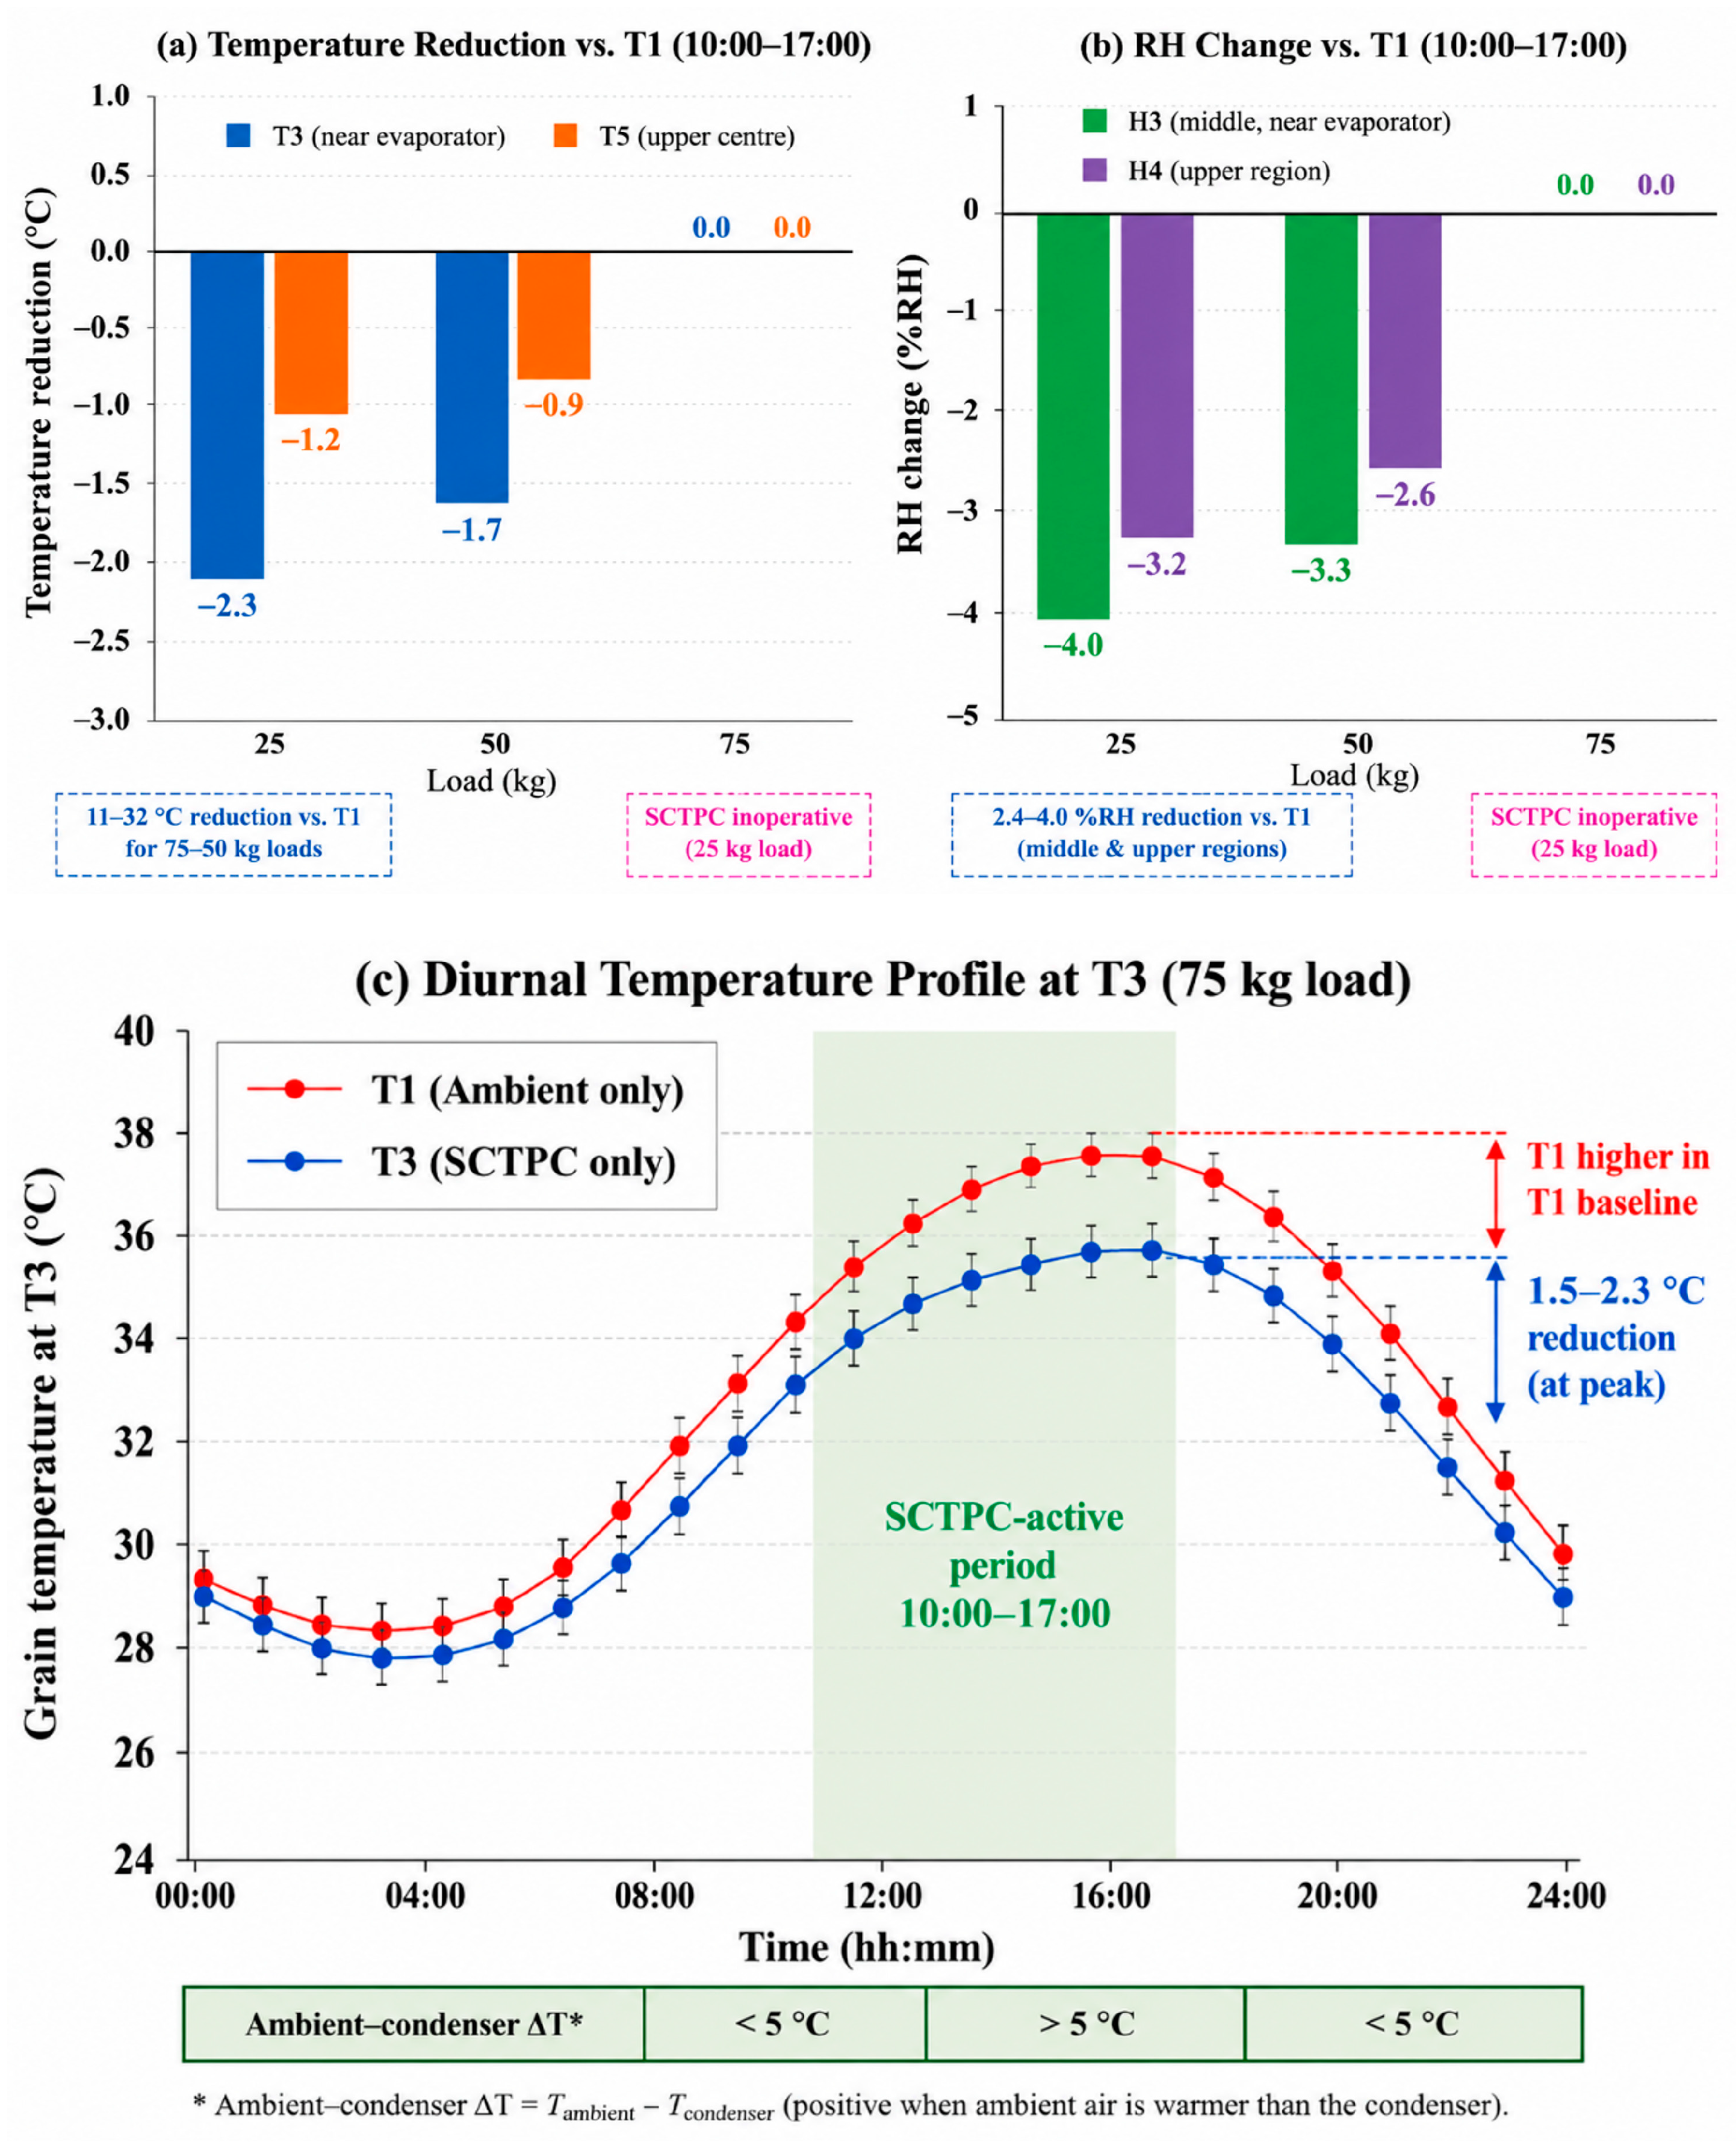
Performance of the SCTPC-only cooling system (Treatment T3): (a) daytime temperature reduction, (b) relative humidity reduction, and (c) diurnal temperature response at the evaporator location.
Figure 9.
Performance of the SCTPC-only cooling system (Treatment T3): (a) daytime temperature reduction, (b) relative humidity reduction, and (c) diurnal temperature response at the evaporator location.
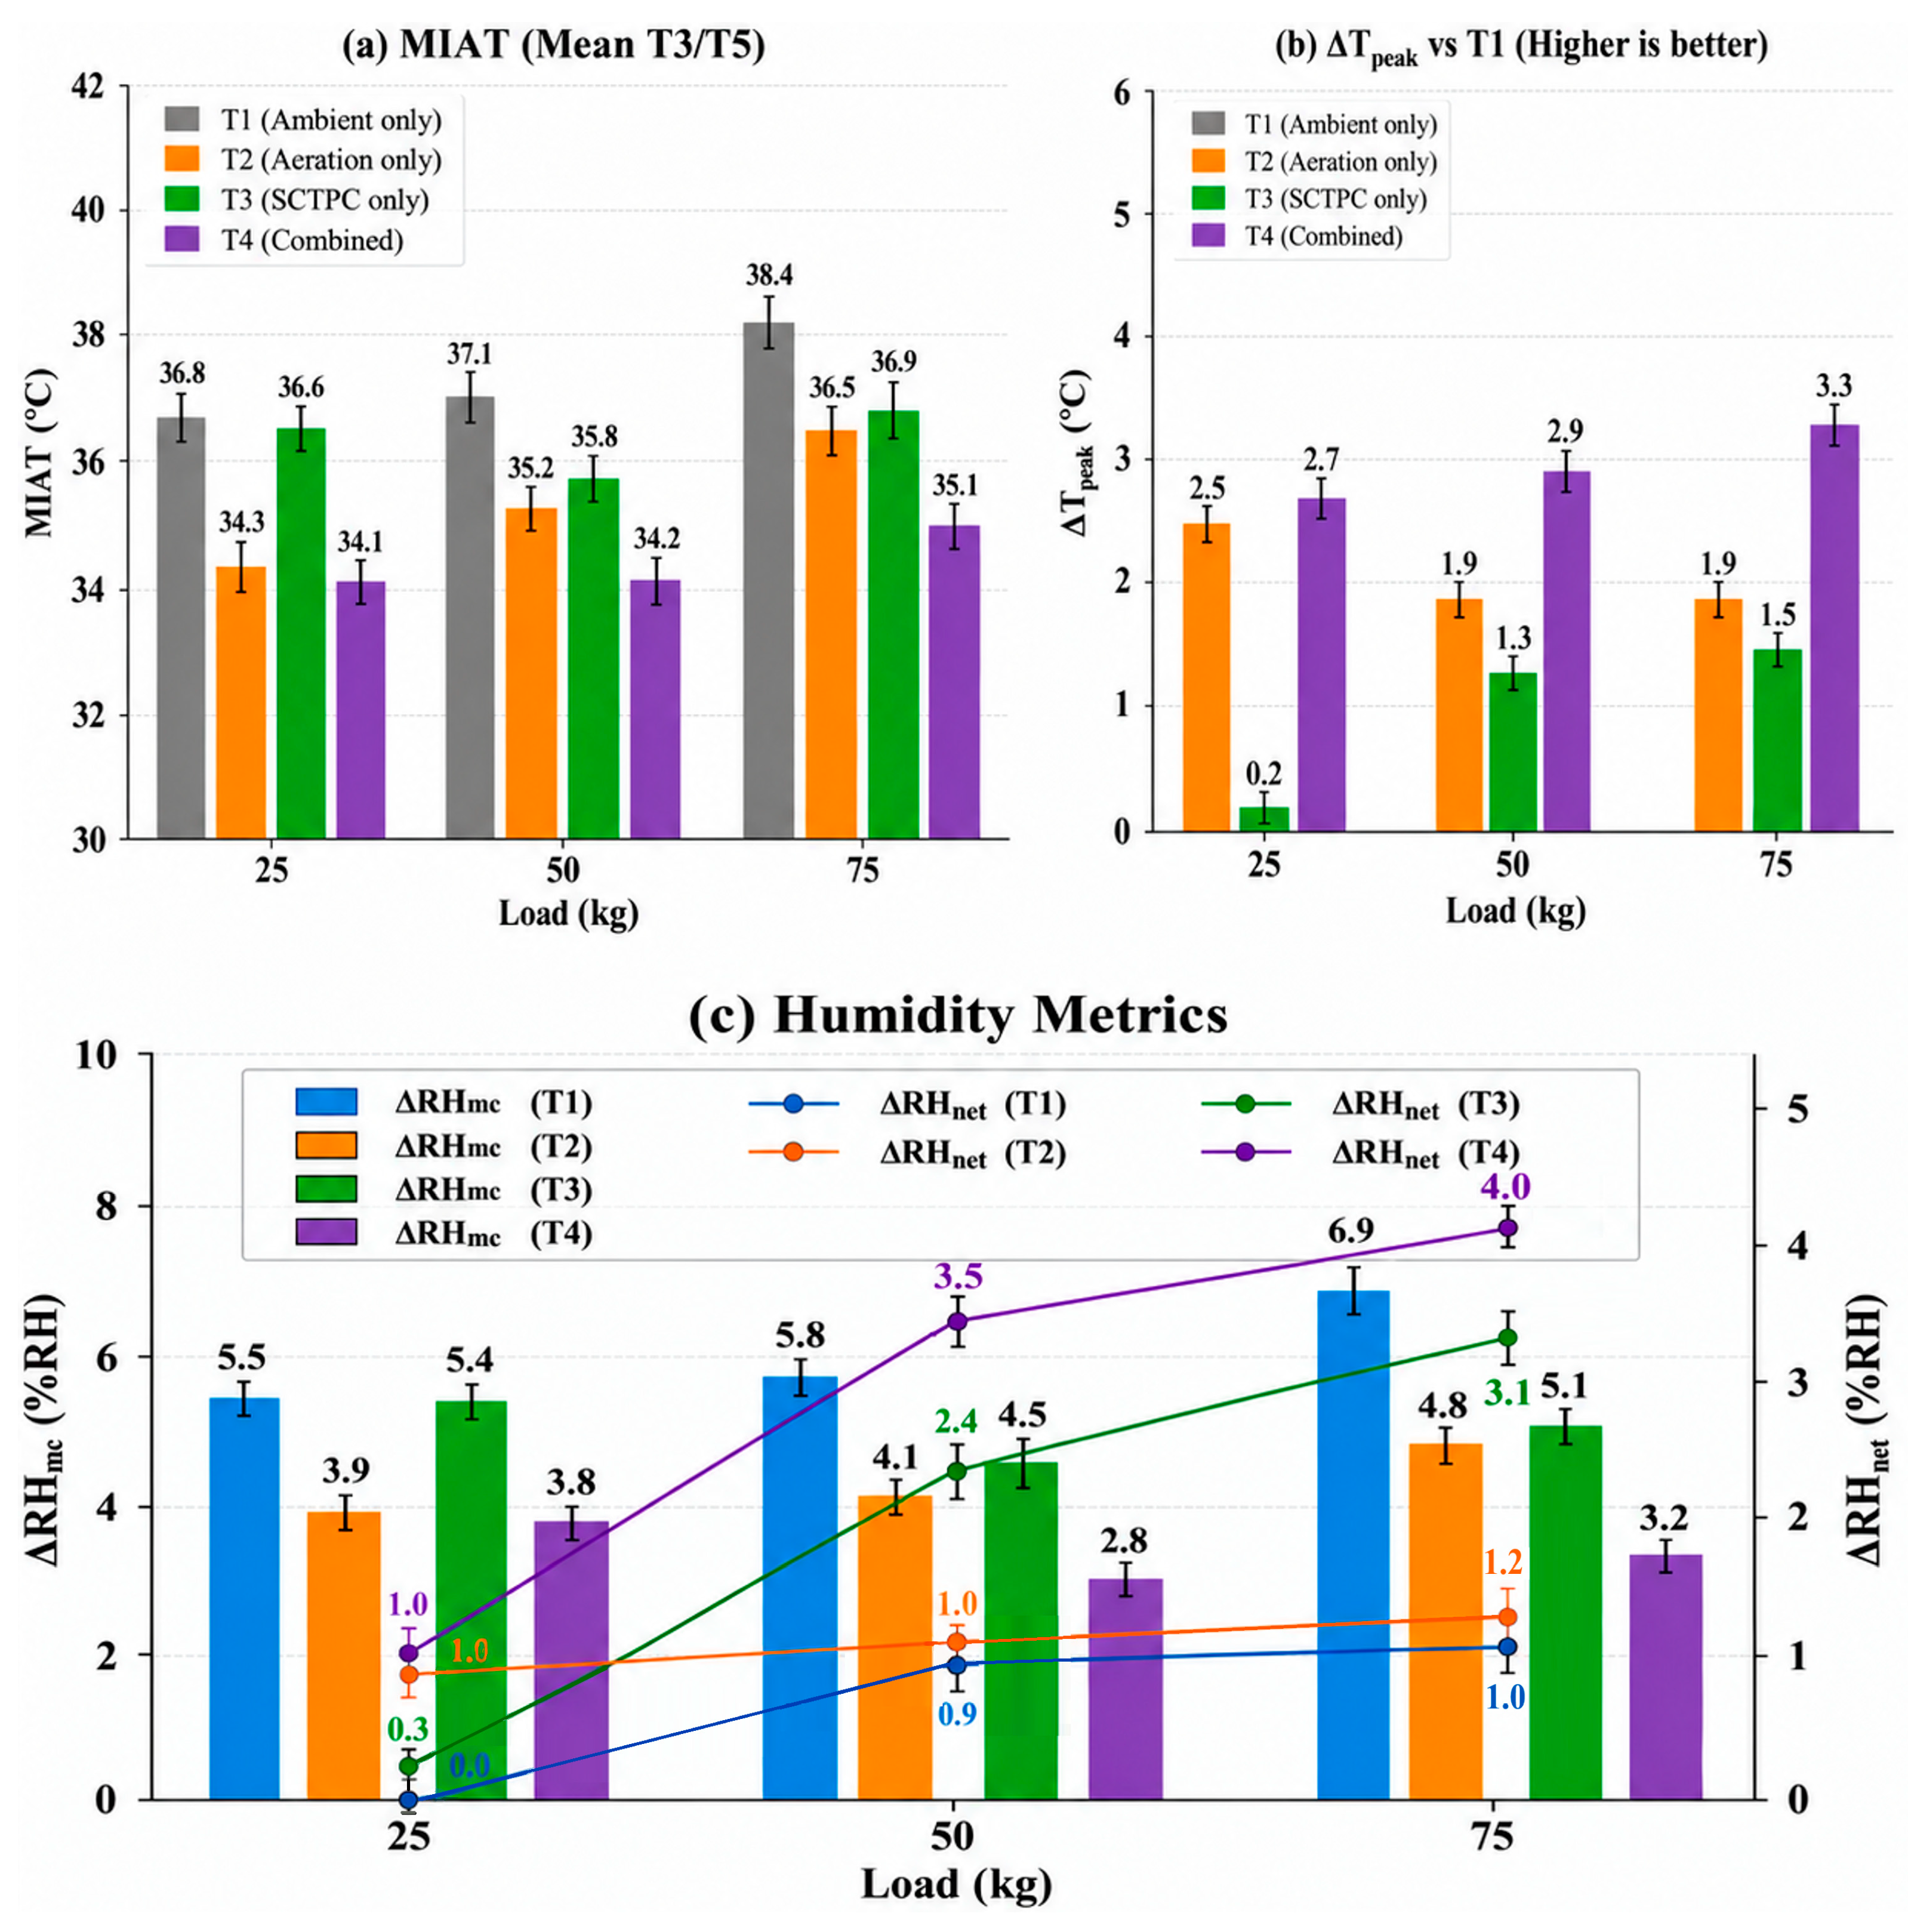
Figure 10.
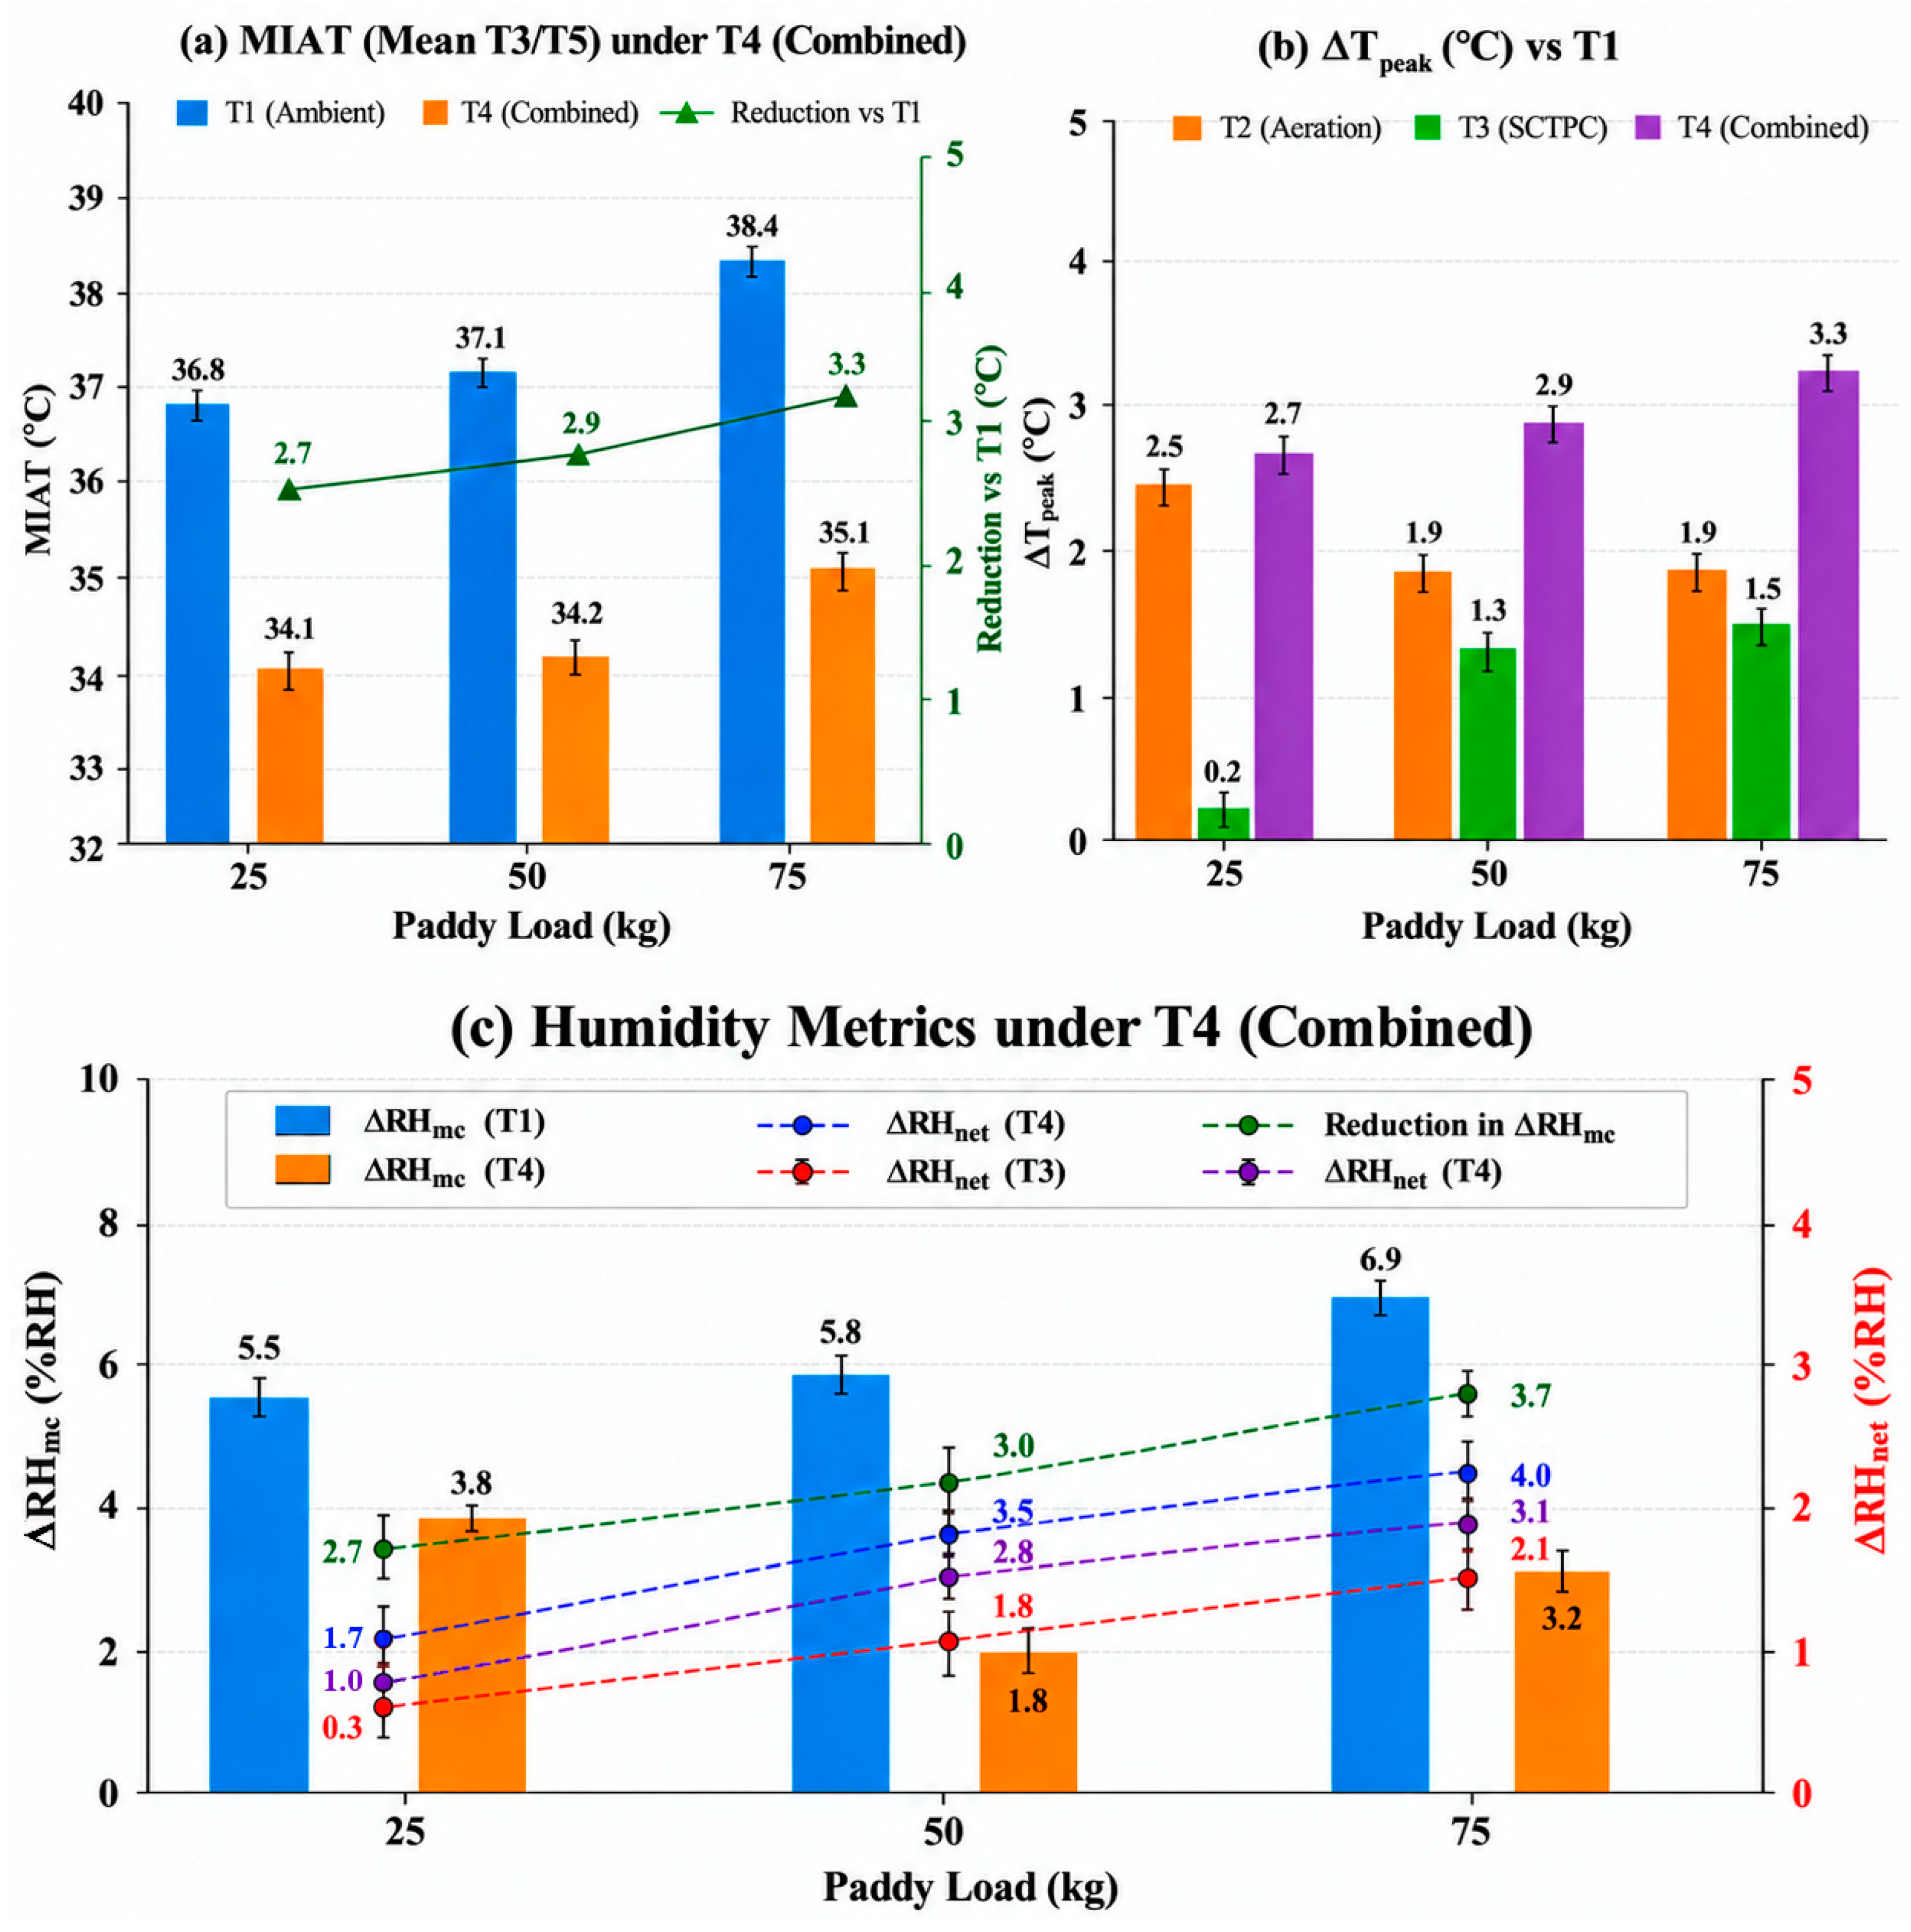
Thermal and relative humidity responses of the integrated SCTPC–aeration system (Treatment T4): (a) MIAT. (b) Peak temperature reduction relative to ambient storage. (c) Humidity stratification and net humidity reduction.
Figure 10.
Thermal and relative humidity responses of the integrated SCTPC–aeration system (Treatment T4): (a) MIAT. (b) Peak temperature reduction relative to ambient storage. (c) Humidity stratification and net humidity reduction.
Figure 11.
Engineering performance comparison of the integrated SCTPC–aeration system (Treatment T4). (a) Mean intergranular air temperature (MIAT). (b) Peak temperature reduction. (c) Moisture stratification and humidity control effectiveness.
Figure 11.
Engineering performance comparison of the integrated SCTPC–aeration system (Treatment T4). (a) Mean intergranular air temperature (MIAT). (b) Peak temperature reduction. (c) Moisture stratification and humidity control effectiveness.
Figure 12.
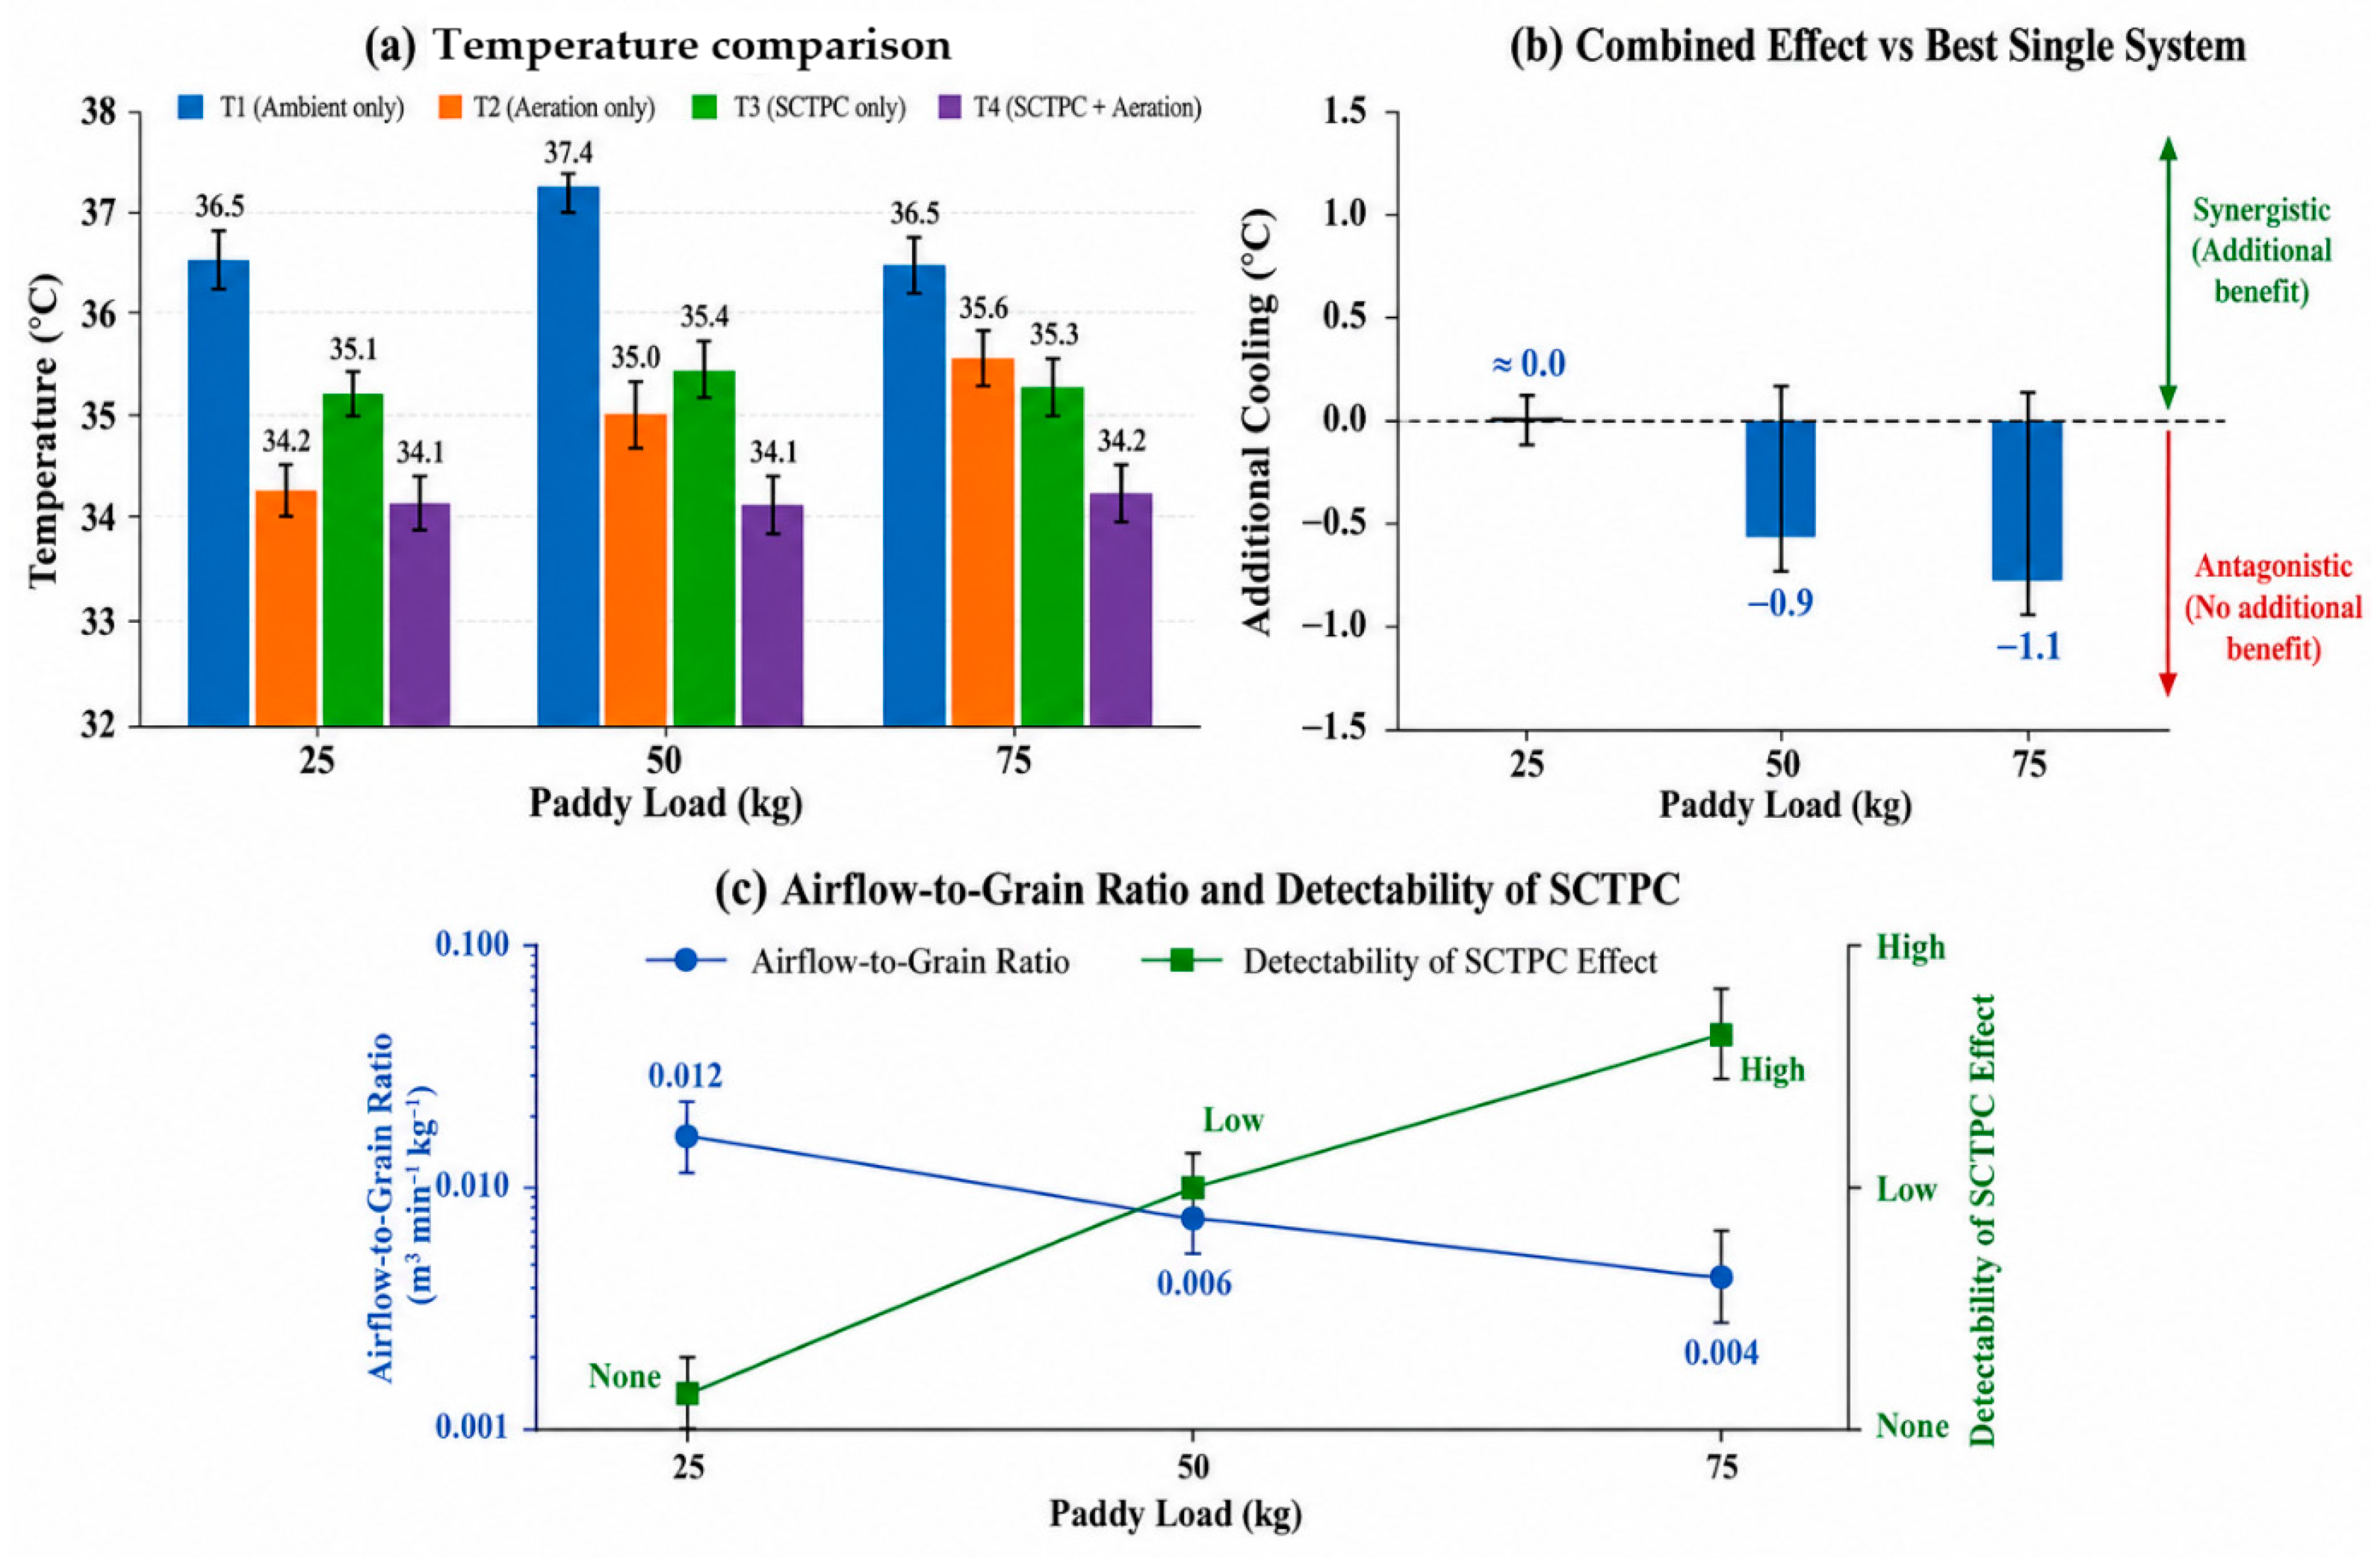
Engineering assessment of the additional cooling benefit of the integrated SCTPC–aeration system under different paddy storage capacities: (a) temperature comparison, (b) additional cooling benefit, and (c) airflow-to-grain ratio and SCTPC detectability.
Figure 12.
Engineering assessment of the additional cooling benefit of the integrated SCTPC–aeration system under different paddy storage capacities: (a) temperature comparison, (b) additional cooling benefit, and (c) airflow-to-grain ratio and SCTPC detectability.
Figure 13.
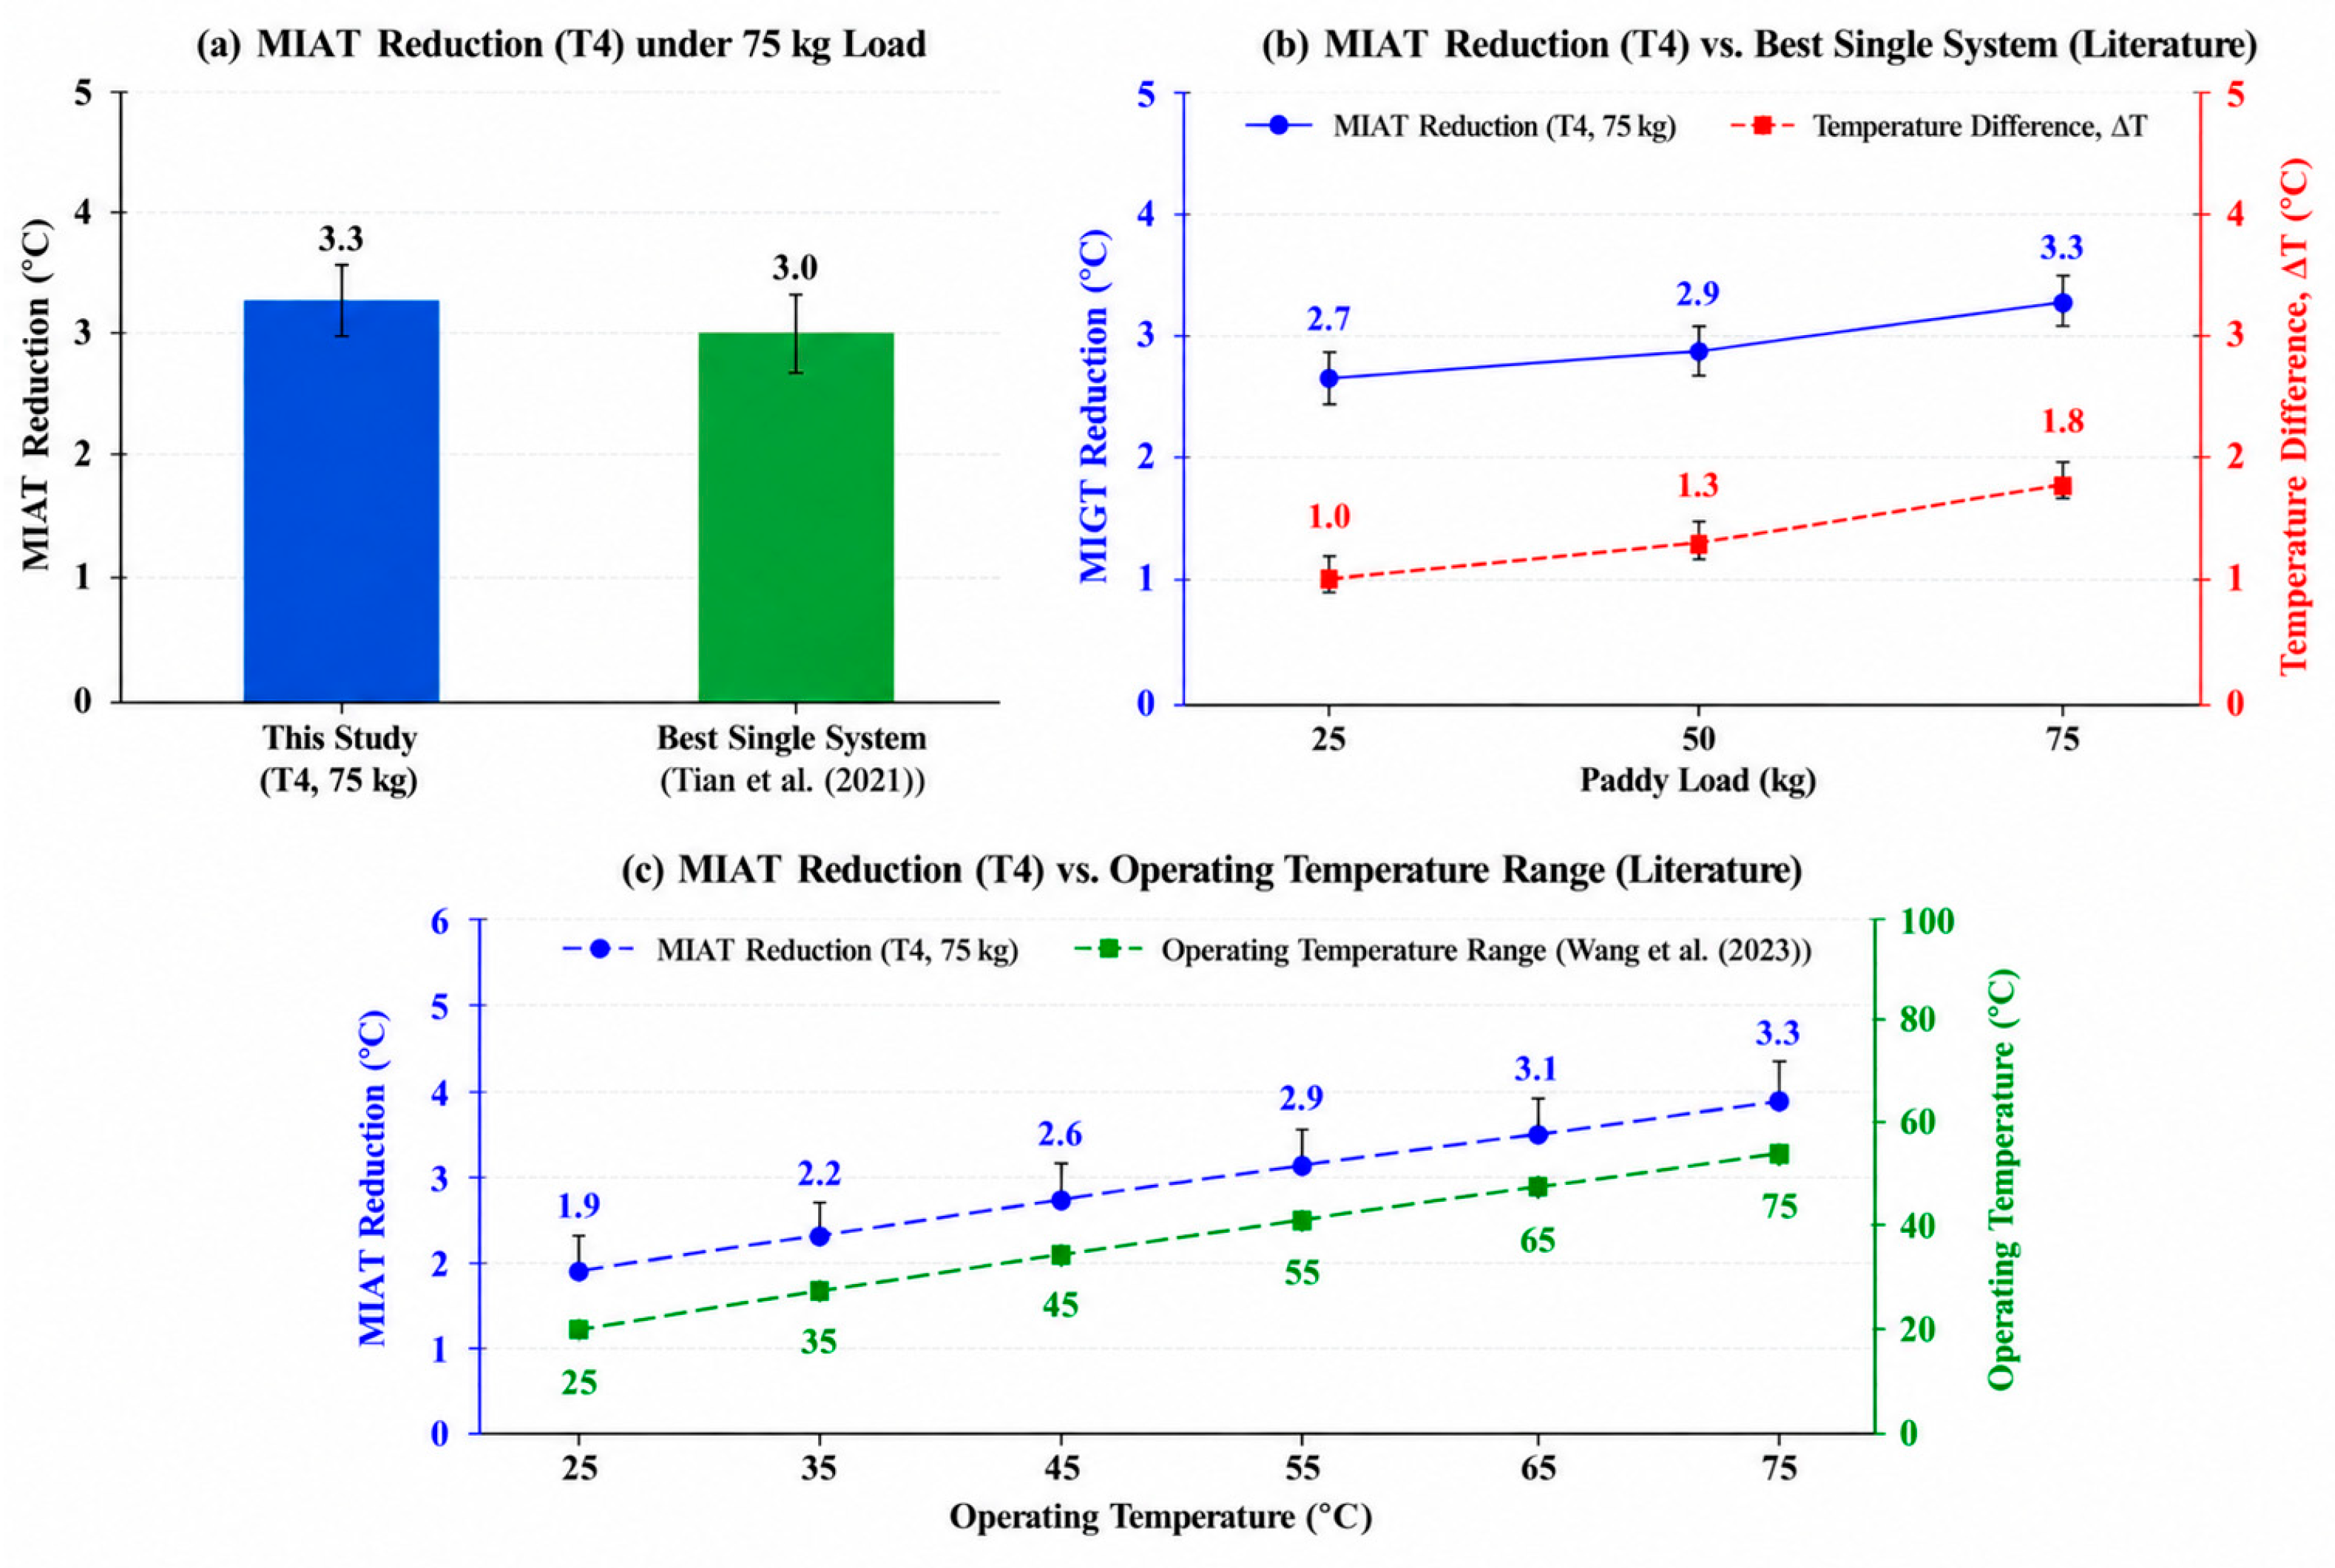
Comparison of the proposed SCTPC–aeration system with representative literature benchmarks: (
a) MIAT reduction compared with the best-performing single system reported by Tian et al. (2021) [
30], (
b) effect of paddy storage capacity on MIAT reduction and temperature difference, and (
c) comparison of MIAT reduction with the operating temperature range reported by Wang et al. (2023) [
32].
Figure 13.
Comparison of the proposed SCTPC–aeration system with representative literature benchmarks: (
a) MIAT reduction compared with the best-performing single system reported by Tian et al. (2021) [
30], (
b) effect of paddy storage capacity on MIAT reduction and temperature difference, and (
c) comparison of MIAT reduction with the operating temperature range reported by Wang et al. (2023) [
32].
Table 1.
Geometric dimensions and corresponding R-290 refrigerant charges of the three SCTPC configurations used for different paddy storage capacities.
Table 1.
Geometric dimensions and corresponding R-290 refrigerant charges of the three SCTPC configurations used for different paddy storage capacities.
| SCTPC Configuration | Paddy Storage Capacity (kg) | Evaporator Length (mm) | Adiabatic Length (mm) | Condenser Length (mm) | Total Tube Length (mm) | R-290 Refrigerant Charge (g) |
|---|
| SCTPC-25 | 25 | 200 | 200 | 200 | 600 | 12 |
| SCTPC-50 | 50 | 400 | 400 | 400 | 1200 | 23 |
| SCTPC-75 | 75 | 600 | 600 | 600 | 1800 | 37 |
Table 2.
Thermal and relative humidity performance under different treatments and paddy storage capacities.
Table 2.
Thermal and relative humidity performance under different treatments and paddy storage capacities.
| Paddy Storage Capacity (kg) | Treatment | 24 h Mean MIAT (°C) | ΔTpeak (°C) | ΔRHmc (%RH) | ΔRHnet (%RH) |
|---|
| 25 | T1—Ambient storage | 36.1 ± 0.4 | – | 8.6 ± 1.1 | – |
| T2—Forced aeration | 34.1 ± 0.3 | 2.0 ± 0.3 | 6.1 ± 0.9 | 2.7 ± 0.8 |
| T3—SCTPC | 33.0 ± 0.3 | – | – | – |
| T4—SCTPC + aeration | 31.7 ± 0.3 | 4.4 ± 0.4 | 2.6 ± 0.4 | 6.6 ± 0.6 |
| 50 | T1—Ambient storage | 36.4 ± 0.5 | – | 9.1 ± 1.2 | – |
| T2—Forced aeration | 34.5 ± 0.3 | 1.9 ± 0.4 | 6.6 ± 1.0 | 2.5 ± 0.8 |
| T3—SCTPC | 33.4 ± 0.3 | 3.0 ± 0.4 | 4.4 ± 0.7 | 4.5 ± 0.7 |
| T4—SCTPC + aeration | 32.0 ± 0.3 | 4.4 ± 0.4 | 2.9 ± 0.5 | 6.5 ± 0.6 |
| 75 | T1—Ambient storage | 36.7 ± 0.4 | – | 9.8 ± 1.3 | – |
| T2—Forced aeration | 34.7 ± 0.4 | 2.0 ± 0.4 | 7.2 ± 1.1 | 2.6 ± 0.8 |
| T3—SCTPC | 33.5 ± 0.4 | 3.2 ± 0.4 | 4.7 ± 0.7 | 4.7 ± 0.8 |
| T4—SCTPC + aeration | 32.3 ± 0.4 | 4.4 ± 0.5 | 3.1 ± 0.5 | 6.5 ± 0.7 |
Table 3.
Face velocity measured at five sampling locations on the perforated aeration screen. Values represent the mean ± standard deviation of five replicate measurements.
Table 3.
Face velocity measured at five sampling locations on the perforated aeration screen. Values represent the mean ± standard deviation of five replicate measurements.
| Measurement | P1 (Peripheral) | P2 (Centre) | P3 (Intermediate) | P4 (Intermediate) | P5 (Peripheral) |
|---|
| Replicate 1 | 0.93 | 0.32 | 0.58 | 0.54 | 0.87 |
| Replicate 2 | 0.88 | 0.24 | 0.53 | 0.68 | 0.84 |
| Replicate 3 | 0.73 | 0.29 | 0.43 | 0.58 | 0.88 |
| Replicate 4 | 0.68 | 0.27 | 0.38 | 0.59 | 0.91 |
| Replicate 5 | 0.77 | 0.33 | 0.36 | 0.56 | 0.83 |
| Mean ± SD | 0.80 ± 0.10 | 0.29 ± 0.04 | 0.46 ± 0.09 | 0.59 ± 0.05 | 0.87 ± 0.04 |
Table 4.
Representative baseline thermal and humidity characteristics of paddy grain stored under ambient-only conditions (Treatment T1).
Table 4.
Representative baseline thermal and humidity characteristics of paddy grain stored under ambient-only conditions (Treatment T1).
| Load (kg) | Mean Daily Peak MIAT (°C) | Time of MIAT (hh:mm) | Peripheral ΔT (°C) * | Central ΔT (°C) | Bottom RH (%RH) | Top RH (%RH) | Vertical RH Difference (%RH) |
|---|
| 25 | 36.3 | 15:00 | 11.8 | 5.9 | 68.2 | 75.6 | 7.4 |
| 50 | 37.3 | 15:00 | 12.1 | 6.1 | 67.5 | 74.9 | 7.4 |
| 75 | 38.4 | 16:00 | 12.3 | 6.3 | 66.8 | 74.1 | 7.3 |
Table 5.
Thermal and humidity characteristics of paddy grain stored under aeration-only conditions (Treatment T2).
Table 5.
Thermal and humidity characteristics of paddy grain stored under aeration-only conditions (Treatment T2).
| Load (kg) | Mean Daily Peak MIAT (°C) | Time of Minimum Central Temperature (hh:mm) | Peripheral ΔT (°C) * | Central ΔT (°C) ** | Bottom RH (%RH) | Top RH (%RH) | Vertical RH Difference (%RH) |
|---|
| 25 | 34.0 | 10:30–18:00 | 7.2 | 3.5 | 61.2 | 63.8 | 2.6 |
| 50 | 34.5 | 10:30–18:00 | 7.6 | 3.8 | 60.0 | 62.7 | 2.7 |
| 75 | 34.6 | 10:30–18:00 | 8.0 | 4.2 | 58.6 | 61.0 | 2.4 |
Table 6.
Thermal and relative humidity performance of the SCTPC-only cooling system relative to ambient storage (Treatment T3).
Table 6.
Thermal and relative humidity performance of the SCTPC-only cooling system relative to ambient storage (Treatment T3).
| Load (kg) | Temperature Reduction (T3) * (°C) | Temperature Reduction (T5) * (°C) | Period of Maximum SCTPC (hh:mm) | RH Reduction (H3) (%RH) | RH Reduction (H4) (%RH) | Ambient–Condenser ΔT (°C) | SCTPC Operational Status |
|---|
| 25 | 0.0 | 0.0 | — | 0.0 | 0.0 | — | Inactive |
| 50 | −1.7 | −0.9 | 10:00–17:00 | −3.3 | −2.6 | 5.2 | Effective |
| 75 | −2.3 | −1.2 | 10:00–17:00 | −4.0 | −3.2 | 5.6 | Effective |
Table 7.
Overall comparison of thermal and humidity performances among the four storage treatments under three paddy storage capacities, using the mean daily peak MIAT from the independent experimental runs.
Table 7.
Overall comparison of thermal and humidity performances among the four storage treatments under three paddy storage capacities, using the mean daily peak MIAT from the independent experimental runs.
| Load (kg) | Treatment | Mean Daily Peak MIAT (°C) | Peak Temperature Reduction (°C) | Vertical RH Difference (%RH) | Net RH Reduction (%RH) |
|---|
| 25 | T1—Ambient storage | 36.8 | — | 5.5 | — |
| T2—Forced aeration | 34.3 | 2.5 | 3.9 | 0.9 |
| T3—SCTPC | 36.6 | 0.2 | 5.4 | 0.3 |
| T4—SCTPC + aeration | 34.1 | 2.7 | 3.8 | 1.0 |
| 50 | T1—Ambient storage | 37.1 | — | 5.8 | — |
| T2—Forced aeration | 35.2 | 1.9 | 4.1 | 1.0 |
| T3—SCTPC | 35.8 | 1.3 | 4.5 | 2.4 |
| T4—SCTPC + aeration | 34.2 | 2.9 | 2.8 | 3.5 |
| 75 | T1—Ambient storage | 38.4 | — | 6.9 | — |
| T2—Forced aeration | 36.5 | 1.9 | 4.8 | 1.2 |
| T3—SCTPC | 36.9 | 1.5 | 5.1 | 3.1 |
| T4—SCTPC + aeration | 35.1 | 3.3 | 3.2 | 4.0 |
Table 8.
Engineering performance of the integrated SCTPC–aeration system (Treatment T4) under different paddy storage capacities.
Table 8.
Engineering performance of the integrated SCTPC–aeration system (Treatment T4) under different paddy storage capacities.
| Paddy Load (kg) | Mean Daily Peak MIAT (Ambient) (°C) | Mean Daily Peak MIAT (T4) (°C) | MIAT Reduction (°C) | Peak Temperature Reduction (°C) | Vertical RH Difference (T4) (%RH) | Net RH Reduction (T4) (%RH) | Relative Air-to-Grain Ratio (m3 min−1 kg−1) |
|---|
| 25 | 36.8 | 34.1 | 2.7 | 2.7 | 3.8 | 1.0 | 0.0120 |
| 50 | 37.1 | 34.2 | 2.9 | 2.9 | 2.8 | 3.5 | 0.0060 |
| 75 | 38.4 | 35.1 | 3.3 | 3.3 | 3.2 | 4.0 | 0.0040 |
Table 9.
Thermal and relative humidity responses of the integrated SCTPC–aeration system (Treatment T4): (a) MIAT, (b) ΔTpeak, and (c) relative humidity performance, with values harmonized to the mean daily peak MIAT reported in
Table 7.
Table 9.
Thermal and relative humidity responses of the integrated SCTPC–aeration system (Treatment T4): (a) MIAT, (b) ΔTpeak, and (c) relative humidity performance, with values harmonized to the mean daily peak MIAT reported in
Table 7.
| Paddy Load (kg) | Mean Daily Peak MIAT (Ambient) (°C) | Mean Daily Peak MIAT (T2) (°C) | Mean Daily Peak MIAT (T3) (°C) | Mean Daily Peak MIAT (T4) (°C) | Additional Cooling Benefit (°C) | Engineering Interaction | Air-to-Grain Ratio (m3 min−1 kg−1) | Engineering Interpretation |
|---|
| 25 | 36.5 | 34.2 | 35.1 | 34.1 | 0.2 | Negligible | 0.012 | Aeration dominant |
| 50 | 37.4 | 35.0 | 35.4 | 34.1 | 1.0 | Complementary | 0.006 | Combined cooling effective |
| 75 | 36.5 | 35.6 | 35.3 | 34.2 | 1.4 | Complementary | 0.004 | Additional cooling benefit greatest |
Table 10.
Engineering validation of the proposed SCTPC–aeration system by comparison with representative passive cooling studies reported in the literature.
Table 10.
Engineering validation of the proposed SCTPC–aeration system by comparison with representative passive cooling studies reported in the literature.
| Performance Parameter | Present Study (T4, 75 kg) | Representative Literature | Reported Range | Engineering Assessment |
|---|
| Maximum MIAT reduction (°C) | 3.3 | Passive thermosyphon cooling [28] | 2–4 | Within the reported engineering range and achieved under experimental conditions. |
| Effective operating temperature (°C) | 31.7–38.4 | Tropical grain cooling studies [39] | 25–75 | Observed MIAT range under the tested laboratory conditions. |
| Working fluid | R-290 (Propane) | Passive thermosyphon systems [34] | R-290/
R-22 | Environmentally preferable refrigerant with low GWP and zero ODP. |
| Peak cooling capability (°C) | 1–4 | Zhao et al. [40]; Cao et al. [41] | 1–4 | Comparable with previously reported passive cooling performance. |
| System operating criterion | ΔT (grain − ambient) > 1 °C | Passive control strategy [42] | ΔT threshold | Enables passive operation only when a favorable thermal driving force exists. |



 ,
,