Article

A Proof-of-Concept Greenhouse Lighting Control System for Lettuce Using a Real-Time Chlorophyll Fluorescence Biofeedback

by
Suyun Nam
and
Rhuanito Soranz Ferrarezi
*
Department of Horticulture, University of Georgia, 1111 Miller Plant Sciences Building, Athens, GA 30602, USA
*
Author to whom correspondence should be addressed.
AgriEngineering 2026, 8(7), 263; https://doi.org/10.3390/agriengineering8070263
Submission received: 14 April 2026 / Revised: 13 June 2026 / Accepted: 22 June 2026 / Published: 26 June 2026

Abstract

Supplemental light-emitting diode (LED) lighting is essential for greenhouse crop production when solar radiation is insufficient, but it also contributes substantially to operating costs. Conventional strategies based on fixed photosynthetic photon flux density (PPFD) do not accurately reflect plant photosynthetic status, often leading to inefficient use of light energy. A chlorophyll fluorescence (CF)-based biofeedback system offers a plant-driven approach that dynamically adjusts light output to maintain target photosynthetic parameters. This system has been successfully tested in growth chambers with controlled environmental conditions, but no research has been conducted in greenhouses yet. This study developed and tested a greenhouse-compatible biofeedback lighting system using ‘Casey’ lettuce (Lactuca sativa) to evaluate its performance compared with conventional light controls. Two biofeedback control logics were applied: electron transport rate (ETR)-based (target ETR of 85 or 120 µmol·m−2·s−1) and quantum yield of photosystem II (ΦPSII)-based control (target ΦPSII of 0.735), with constant PPFD- and timer-based lighting as reference treatments. Both biofeedback logics maintained their target values, confirming stable performance under dynamic greenhouse conditions. Despite successful real-time light regulation in greenhouse conditions, shoot biomass and energy-use efficiency did not differ among treatments under moderate greenhouse conditions (p > 0.05). This study establishes a functional prototype of a real-time physiological biofeedback system for greenhouse supplemental lighting control.

1. Introduction

Artificial lighting plays a key role in greenhouse production, especially when seasonal or weather conditions reduce natural sunlight and limit photosynthetic light availability [1,2]. Photosynthetically active radiation directly influences photosynthesis, and supplemental lighting can enhance crop yield as well as plant morphology, flowering, uniformity, and fruit quality [3,4]. However, electricity for greenhouse supplemental lighting can account for 10–30% of operating costs [5], underscoring the need for precise light management that meets crop requirements while remaining economically viable.
High-pressure sodium (HPS) lamps have long been used for both photoperiodic and photosynthetic purposes, but light-emitting diode (LED) fixtures have become increasingly popular in recent years for their higher energy efficiency and dimmability [6]. Supplemental LED lighting is often regulated by photosynthetic photon flux density (PPFD)-based control, which adjusts LED output to maintain a target PPFD by providing the additional PPFD required beyond sunlight [7]. A more advanced approach is DLI-based control, which aims to achieve a target daily light integral (DLI) by adjusting both light output and photoperiod over the day. This method utilizes natural sunlight more efficiently by reducing or ending supplemental lighting early when sunlight is abundant or extending the photoperiod when it is insufficient. It provides greater flexibility while optimizing energy use [8]. Both adaptive light strategies improved energy efficiency compared with the on/off regime [9].
While maintaining PPFD or DLI supports consistent growth, more dynamic lighting strategies have been designed based on plant photosynthetic characteristics to improve crop yield and light-use efficiency. For instance, extending the photoperiod while lowering PPFD can deliver the same DLI with greater photosynthetic efficiency. Gradually increasing light intensity over the crop cycle can improve light interception, and providing supplemental light only at the end of production can enhance pigmentation and crop quality within a short period [10,11,12].
However, photosynthetic efficiency is influenced by light intensity and various environmental factors, as well as their interactions. For example, high light combined with low temperature can induce severe photoinhibition [13], suggesting the need to reduce light intensity under such conditions. Conversely, elevated carbon dioxide (CO2) increases light-use efficiency, enabling similar photosynthetic rates at lower light levels [14]. Extreme humidity can limit photosynthesis by affecting nutrient uptake and stomatal conductance [15]. These synergistic and antagonistic effects underscore the importance of adjusting supplemental lighting in response to sunlight availability and overall environmental conditions.
Plant-driven climate control strategies have attracted increasing attention for their ability to adjust resource inputs in response to real-time crop physiological status [16,17]. Chlorophyll fluorescence (CF) offers a rapid, non-invasive measurement of photosynthetic responses and is highly responsive to a wide range of abiotic stresses [18,19]. CF parameters, such as electron transport rate (ETR) and the quantum yield of photosystem II (ΦPSII), have been used to develop plant-driven supplemental lighting strategies. One example is targeting daily photochemical integral (DPI) rather than the DLI. DPI represents the total number of electrons transported through photosystem II each day and is more directly linked to plant growth [6]. This approach enables growers to deliver precisely the amount of light energy that plants can use for carbon assimilation, as environmental effects are already reflected in the DPI calculation derived from a regression model relating PPFD to ETR.
Unlike this DPI model-based approach, the “CF-based biofeedback system” directly regulates LED light intensity in real time based on measured photosynthetic responses [20]. In ΦPSII-based control, light intensity is reduced when photosynthetic efficiency declines (e.g., under environmental stress) and increased when plants can utilize higher light intensities. In contrast, ETR-based control adjusts light intensity to maintain a target photosynthetic rate: when ΦPSII decreases, PPFD is increased to compensate, and when ΦPSII is high enough, PPFD is reduced to save energy. This enables more precise, plant-responsive regulation of LED lighting compared with fixed PPFD or DLI-based strategies, although its effectiveness can vary with crop species and environmental conditions [21].
Previous studies have validated the biofeedback systems in climate-controlled chambers, where they dynamically adjusted LED output to capture light acclimation, diurnal patterns, and species-specific responses [20,21]. Under steady indoor conditions with sole source LED lighting, PPFD was increased later in the photoperiod to offset the gradual decline in ΦPSII, and the system maintained PPFD at relatively higher levels for cucumber (Cucumis sativus) than for lettuce (Lactuca sativa) to compensate for cucumber’s slightly lower ΦPSII. However, it remains uncertain whether such dynamic regulation would perform similarly under greenhouse conditions, where rapidly changing sunlight and environmental variability alter photosynthetic responses throughout the day, compared to constant lighting [22]. Despite this uncertainty, no trials have yet been conducted in greenhouses using the biofeedback system, and validation remains limited to small-scale and steady indoor settings.
This study had two main objectives: (1) to develop and adapt the CF-based biofeedback lighting system for dynamic greenhouse environments, and (2) to evaluate its performance against conventional lighting control methods with respect to crop yield and energy-use efficiency. It was hypothesized that the CF-based biofeedback lighting system would maintain target ETR and ΦPSII accurately even under fluctuating greenhouse conditions and achieve energy-use efficiency and plant growth comparable to or higher than those under conventional light control.

2. Materials and Methods

2.1. Plant Materials and Growth Conditions

Lettuce ‘Casey’ seeds (Johnny’s Selected Seeds, Waterville, ME, USA) were sown into 72-cell plug trays filled with a peat-perlite soilless substrate (Fafard 1P; SunGro Horticulture, Agawam, MA, USA). The seedlings were cultivated in a walk-in growth chamber equipped with white LED light bars (RAY series with Physiospec indoor spectrum; Fluence Bioengineering, Austin, TX, USA) emitting 39% red, 40% green, 18% blue, and 3% far-red. The PPFD at canopy height was maintained at 250 μmol·m−2·s−1 under a 16 h photoperiod, providing a DLI of 14.4 mol·m−2·d−1. An automated ebb-and-flow subirrigation system supplied daily irrigation using a 15N-2.2P-12.4K fertilizer (Jack’s Professional® LX 15-5-15 Ca-Mg; JR Peters, Allentown, PA, USA) at 100 mg·L−1 N. During the seedling stage, the chamber’s average air temperature, vapor pressure deficit (VPD), and CO2 concentration were 23.6 ± 0.2 °C, 1.01 ± 0.06 kPa, and 820 ± 47 μmol·mol−1, respectively (mean ± standard deviation [SD]).

2.2. Experiment Settings

Three-week-old seedlings were transplanted into 10 cm square containers filled with the same substrate and moved to a glass-covered greenhouse located at the University of Georgia (College of Agricultural and Environmental Sciences, Department of Horticulture, Controlled Environment Agriculture [CEA] Crop Physiology and Production Laboratory), in Athens, GA, USA (lat. 33°57′26.676″ N, long. 83°22′36.48″ W). After 1 week of acclimation, allowing the development of fully expanded leaves suitable for continuous CF measurements, two uniform-sized lettuce plants were selected for each experimental unit. The experiment was conducted on a 9 m × 1.5 m bench divided into five blocks, each containing four experimental units separated by vertical aluminum panels to prevent light interference. Light treatments were randomized within each block. A 60% shade net was installed to reduce solar radiation and maintain DLI within the desired range.
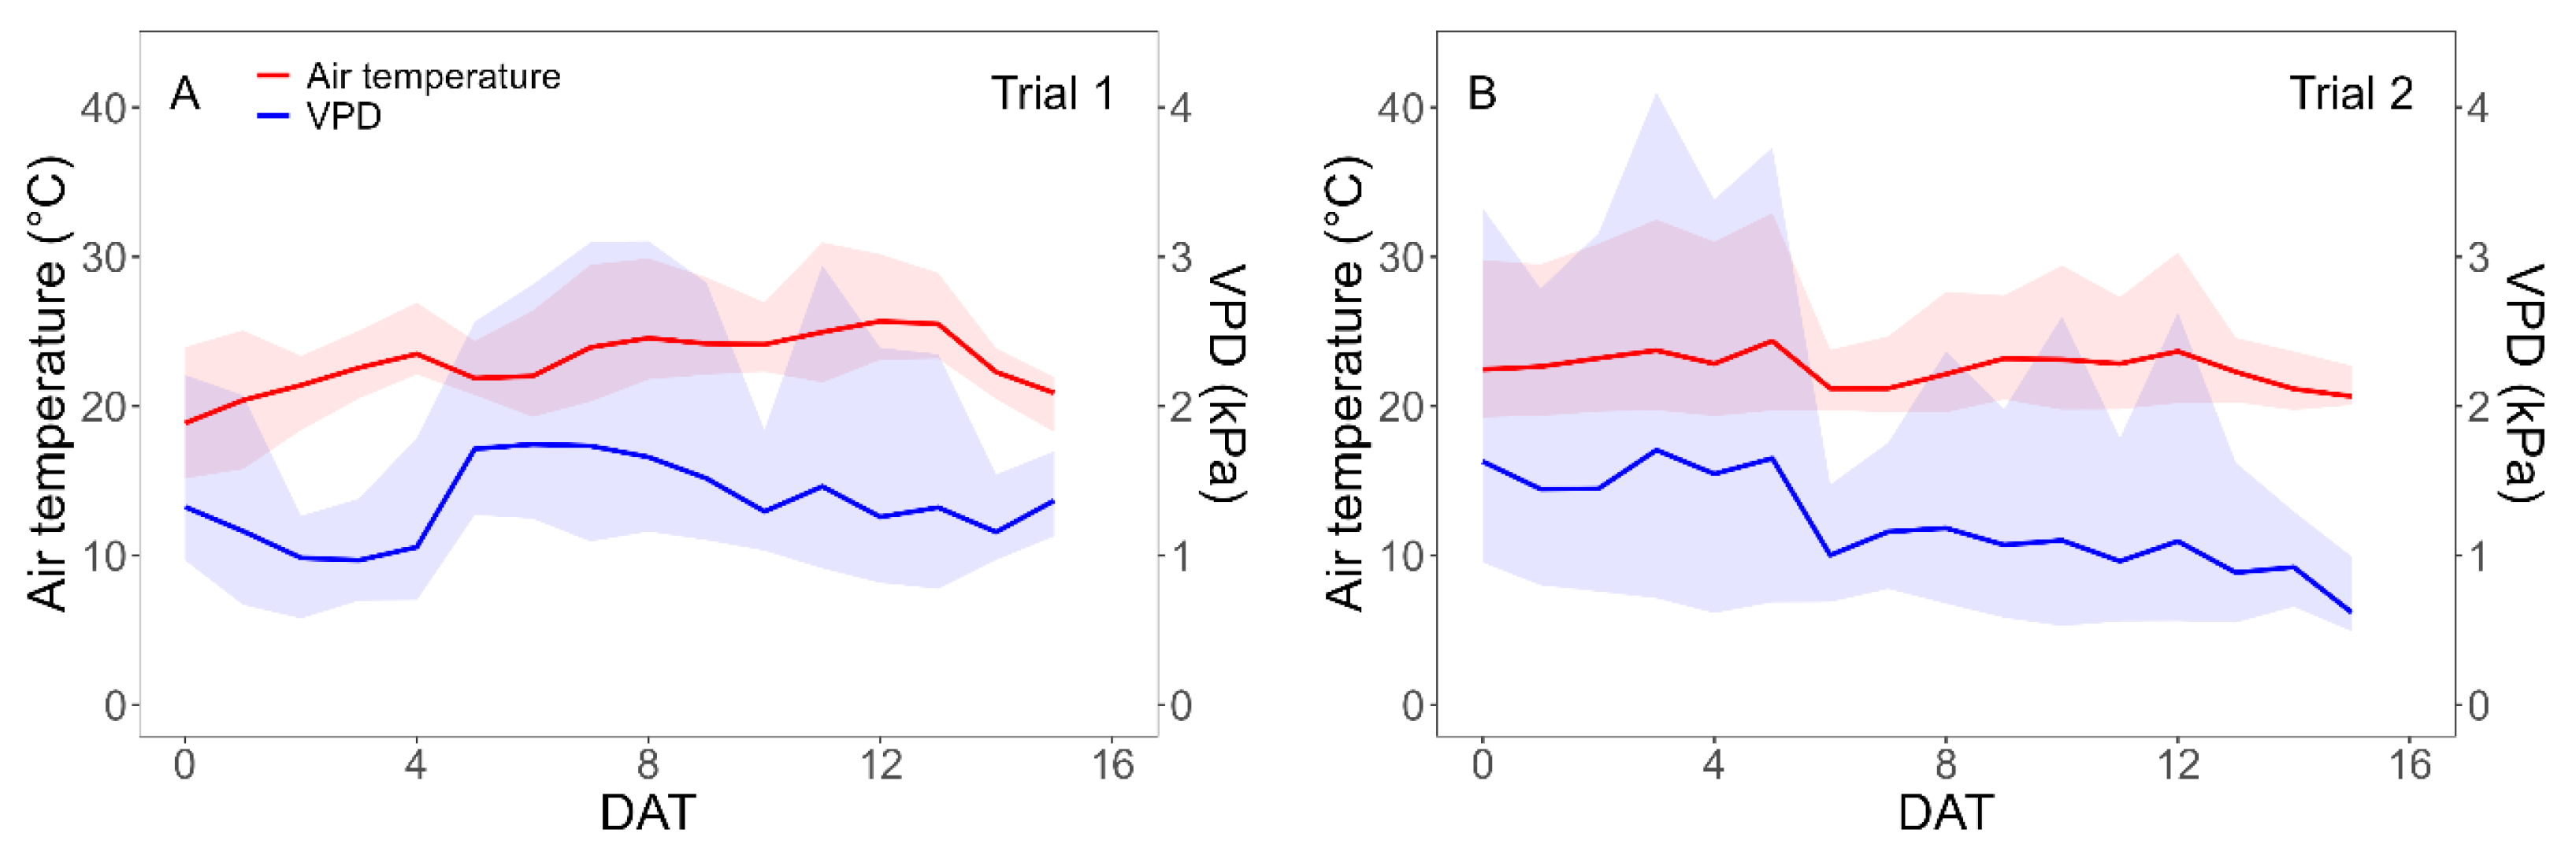
Two independent experiments were conducted during separate growing periods to evaluate the biofeedback system under different natural light conditions: trial 1 from 7–22 April 2024, and trial 2 from 21 October to 5 November 2024. Therefore, different control targets were evaluated between trials to assess the system performance under a broader range of greenhouse lighting conditions. Daily average, minimum, and maximum values of temperature and VPD during trials 1 and 2 were measured using a temperature and humidity sensor (HMP50; Vaisala, Vantaa, Finland), and the data are shown in (Figure 1). Plants were irrigated daily using an automated ebb-and-flow system with the same nutrient solution used during the seedling stage. Dimmable white LED lights (RAY series with Physiospec Greenhouse spectrum; Fluence Bioengineering, Austin, TX, USA) emitting 37% red, 39% green, 21% blue, and 3% far-red were installed above each experimental unit. Quantum sensors (SQ-500-SS; Apogee Instruments, Logan, UT, USA) were placed 25 cm below the LED bars in all treatments of the third block to measure combined sunlight and LED light every 10 s. The LEDs provided a maximum supplemental PPFD of approximately 500 μmol·m−2·s−1 at canopy height. All sensors were connected to a datalogger (CR1000; Campbell Scientific, Logan, UT, USA) for data acquisition and LED light control.

2.3. CF Measurements

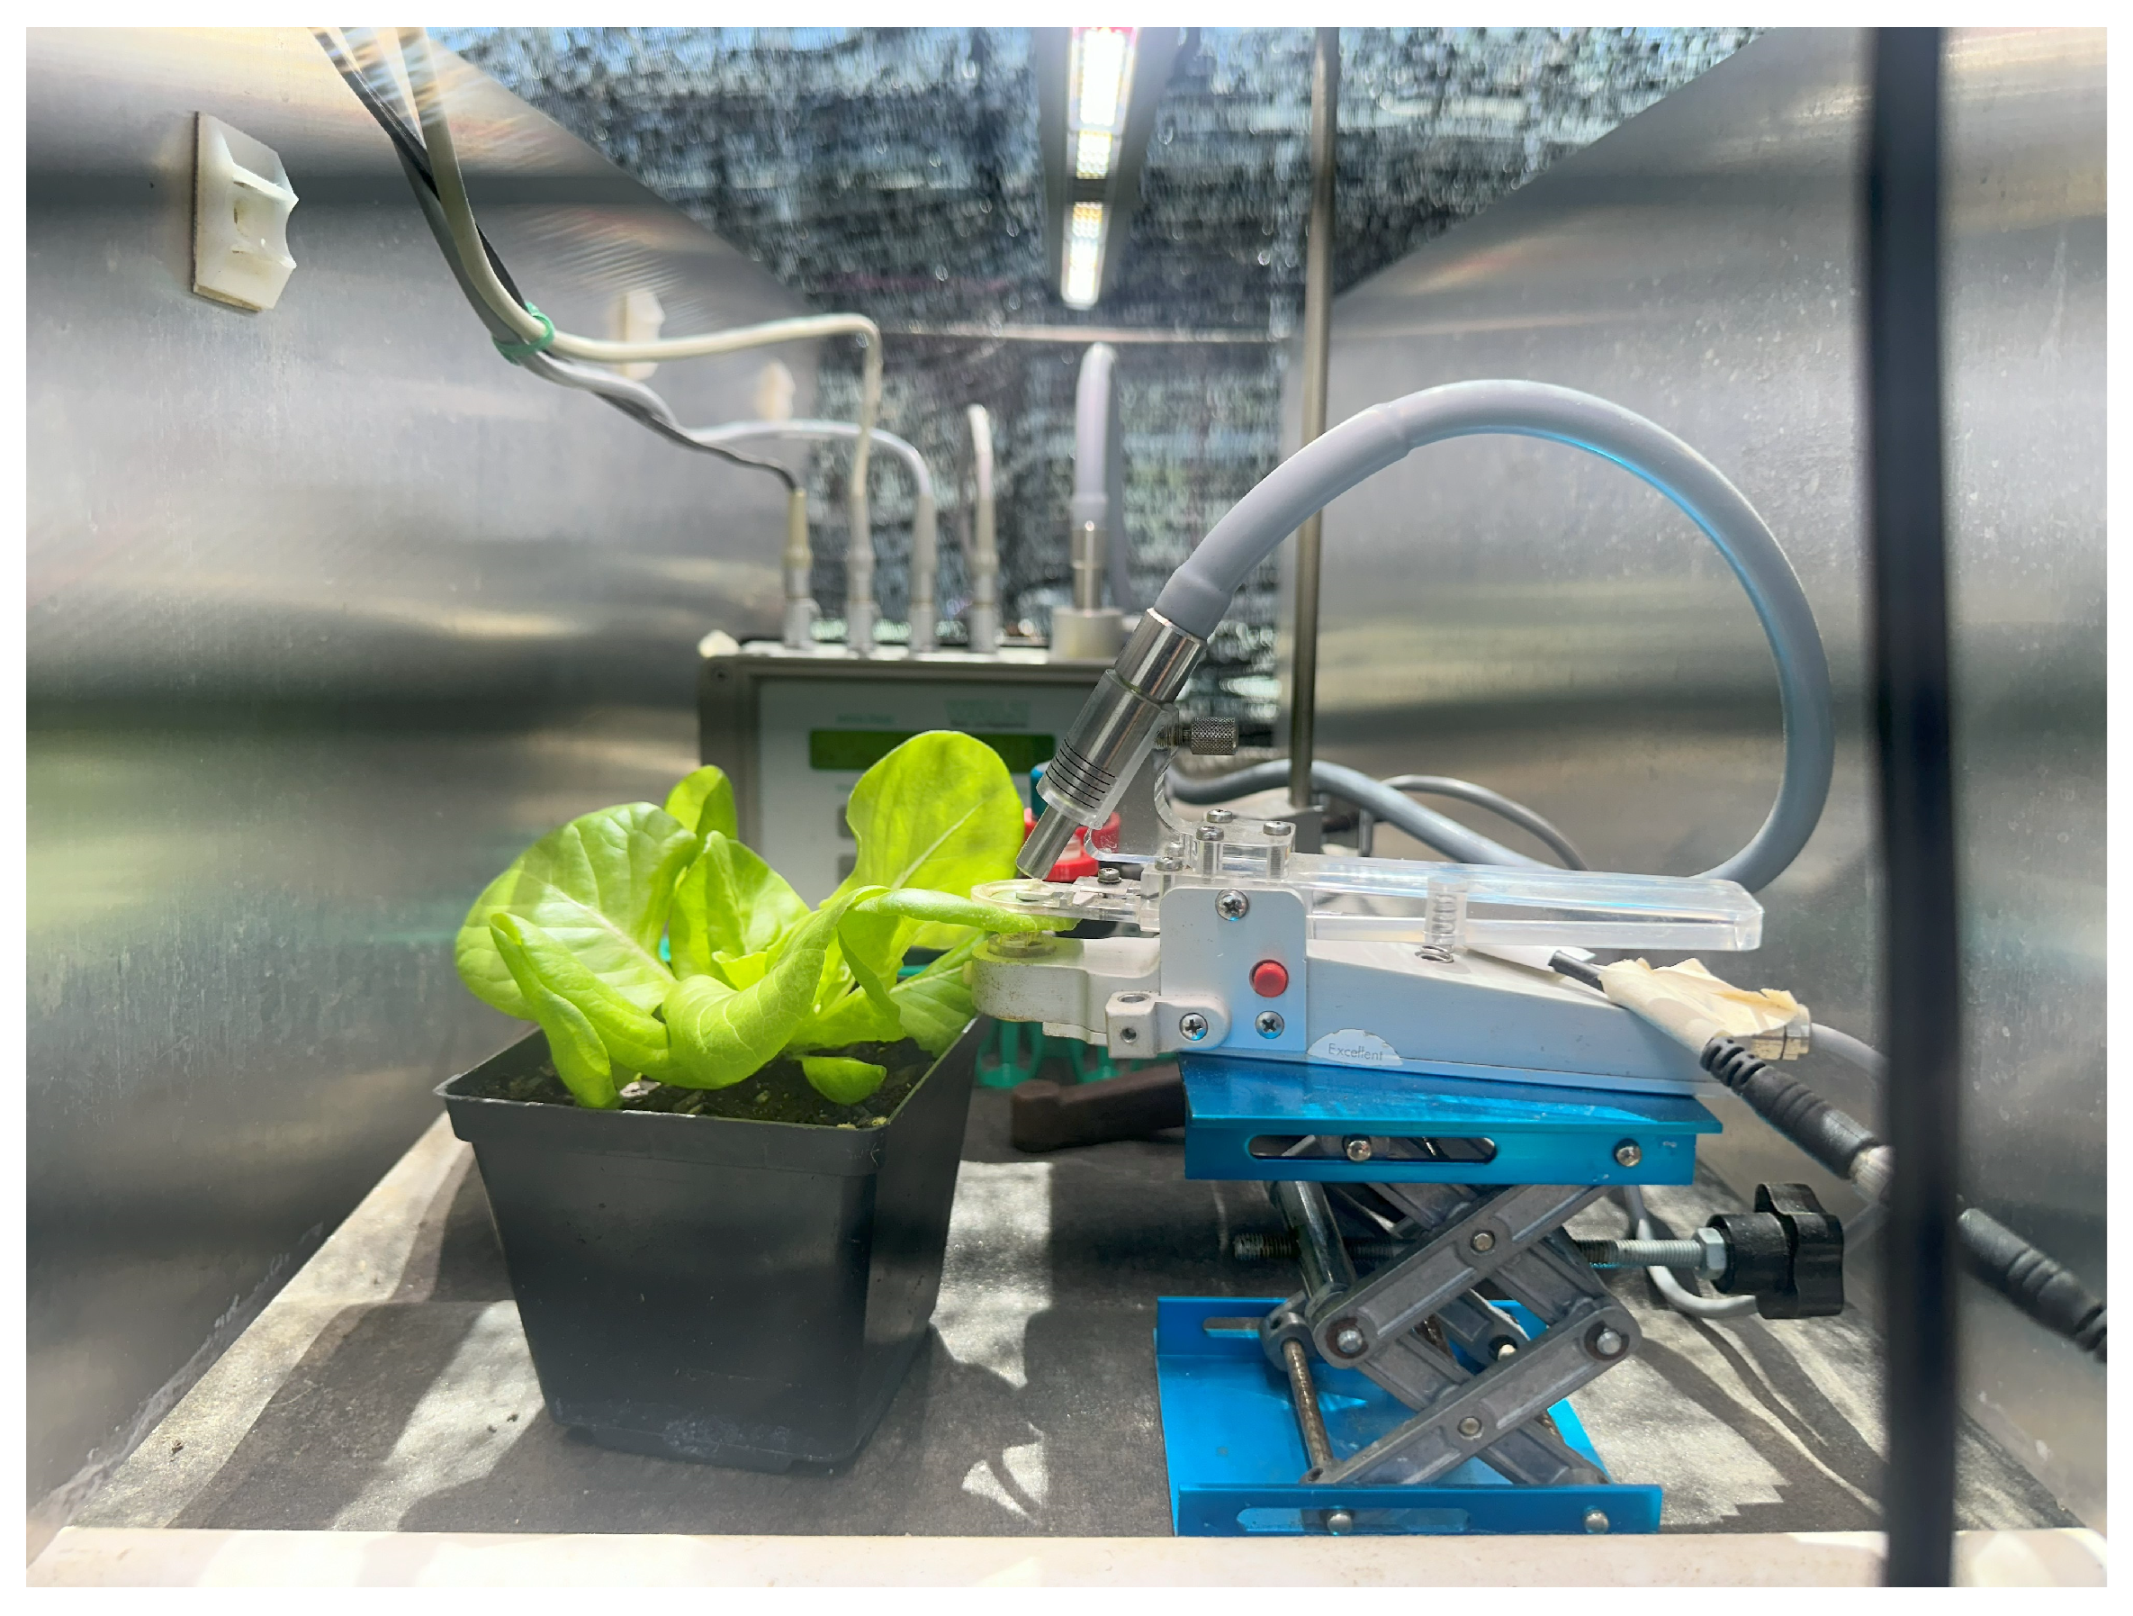
CF parameters were measured using two pulse–amplitude modulation (PAM) fluorometers (MINI-PAM; Heinz Walz, Effeltrich, Germany) connected to the datalogger via an RS-232 interface for real-time CF monitoring and biofeedback-controlled supplemental LED lighting. Measurement protocols were programmed via proprietary software (LoggerNet version 4.7; Campbell Scientific, Logan, UT, USA) and performed automatically by the datalogger. CF measurements were conducted every 15 min throughout the photoperiod. Additional details on communication between the fluorometers and the datalogger are provided in Nam et al. [21]. The uppermost fully expanded leaf of each plant was used for the measurement, with fluorescence measured at the middle portion of the leaf lamina between secondary veins. Leaves were selected to avoid shading from surrounding foliage and positioned horizontally, such that incoming light was approximately perpendicular to the leaf surface, to ensure representative light exposure (Figure 2). To maintain similar leaf developmental stages during the experiment and to avoid potential photodamage from repeated saturating pulses, the measurement leaf spot was periodically relocated to another uppermost fully expanded leaf on the same plant. The leaf relocation was performed daily at midday in trial 1, whereas in trial 2 it was conducted at the end of each photoperiod to enable tracking of diurnal responses within the same sample.
The CF parameters included ETR, ΦPSII, quantum yield of non-photochemical quenching (ΦNPQ), quantum yield of non-regulated energy dissipation (ΦNO), and maximum quantum efficiency of PSII (Fv/Fm). These were calculated according to the method of Hendrickson et al. [23] using the following equations (Equations (1)–(5)):
ΦPSII = (Fm′ − Fs)/Fm
ΦNO = Fs/Fm
ΦNPQ = Fs/Fm′ − Fs/Fm
ETR = ΦPSII × PPFD × 0.5 × 0.84
Fv/Fm = (FmFo)/Fm
where Fs is the steady-state fluorescence under actinic light, and Fm′ is the maximum fluorescence from a light-adapted leaf. Fo and Fm refer to the minimum and maximum fluorescence from a dark-adapted leaf, respectively, both measured daily one hour before sunrise after overnight dark adaptation.
The measuring light intensity and saturating pulse intensity were set to 8 and 10 (out of 12), respectively, with a saturating pulse width of 0.8 s. The measuring light frequency was set to 0.6 kHz (“LOW”) at night and 20 kHz (“HIGH”) during the photoperiod. These settings were chosen to optimize the signal-to-noise ratio, and the actinic effect of the measuring light was negligible under high ambient light from sunlight and supplemental LEDs. Further details are provided in the fluorometer manual [24].

2.4. Biofeedback Supplemental Light Control

Two biofeedback logics were implemented in the datalogger to control the supplemental lighting based on either ETR or ΦPSII. Real-time CF measurements were obtained every 15 min, and the datalogger calculated the updated target PPFD (PPFDt) based on the current PPFD (PPFDc) and the ratio of the target CF value to the current CF value. For the ETR-based logic, PPFDt was calculated as:
PPFDt = PPFDc × (ETRt/ETRc)
Here, ETRt is a target ETR value, and ETRc is the current ETR value. The equation assumes a linear relationship between ETR and PPFD, allowing light intensity to increase or decrease proportionally depending on whether ETRc falls below or exceeds ETRt. For the ΦPSII-based logic, PPFDt was computed as:
PPFDt = PPFDc × (ΦPSII,cPSII,t)
ΦPSII,t is a target ΦPSII value, and ΦPSII,c is the current ΦPSII value. This equation reflects the general decrease in ΦPSII with increasing PPFD, such that when ΦPSII,c exceeds ΦPSII,t, supplemental light intensity increases, while when ΦPSII,c falls below ΦPSII,t, supplemental light intensity decreases.
During the first 30 min of the photoperiod, a fixed PPFD of 275 in trial 1 and 420 μmol·m−2·s−1 in trial 2 was uniformly applied to all biofeedback-controlled treatments as an initial light condition. The initial period allowed ΦPSII to stabilize before initiating dynamic light control, thereby preventing unstable fluctuations in light intensity caused by transient ΦPSII responses, as demonstrated previously [21].
The datalogger was connected to an analog output module (SDM-AO4A, Campbell Scientific, Logan, UT, USA) to control the intensity of supplemental lighting. The module sent 0–10 V direct current dimming signals to the LED drivers, each of which powered one of the supplemental light treatments in all five blocks. The dimming signal was determined based on the third block and applied uniformly across all blocks. Although some spatial variation in sunlight among blocks may occur, this configuration reflects a centralized control approach in which supplemental lighting is regulated based on measurements from a limited number of sensors, as commonly practiced in greenhouse production. The dimming signals were updated every 10 s based on the following equation:
New dimming signal = Old dimming signal × (PPFDt/PPFDc)
Here, PPFDt is the target PPFD, which is reset every 15 min based on each CF measurement, while PPFDc is the instantaneous PPFD measured every 10 s. Although CF is measured less frequently, this approach enabled rapid and continuous adjustment of LED output based on real-time sunlight irradiance throughout each 15 min cycle.
To avoid potential flickering at low dimming levels, a minimum dimming signal of 0.8 V (corresponding to 8% of full output in the 0–10 V control range) was enforced. This ensured that the supplemental LED lights remained continuously on during the photoperiod, even when high natural sunlight resulted in reduced dimming output. This approach also prevented frequent switching and minimized potential effects of inrush current on electricity use.

2.5. Harvest and Energy Use Parameters

All plants were harvested 15 days after the initiation of supplemental light treatments. Shoot fresh weight was recorded, and shoot dry weight was measured after drying at 80 °C for 72 h. Leaf chlorophyll contents were measured on the uppermost fully expanded leaves using a handheld meter (CCM-200 plus; Opti-Sciences, Hudson, NH, USA). Total leaf area was measured using a leaf area meter (LI-3100; LI-COR, Lincoln, NE, USA). A linear relationship between dimming signals and power consumption was determined using a power meter (P4400; P3 International Corporation, New York, NY, USA). Power consumption was measured at dimming signals ranging from 0 to 10 V in 1 V increments, with five replicates at each level. Linear regression resulted in the following equation: Power consumption (W) = 8.106 × dimming signal (V) (R2 = 0.99). This equation was used to estimate total electricity use for LED lighting accumulated over the experiment, and energy-use efficiency (g DW·kWh−1) was calculated as shoot dry weight divided by total electricity use.

2.6. Experimental Design and Statistical Analysis

In trial 1, four supplemental light treatments were arranged in a randomized complete block design (RCBD) with five blocks. The treatments were: (1) ETR-based control with a ETRt of 85 μmol·m−2·s−1 (ETR 85), (2) ΦPSII-based control with a ΦPSII,t of 0.735 (ΦPSII 0.735), (3) constant PPFD of 275 μmol·m−2·s−1 (PPFD 275), and (4) timer-based PPFD of 400 μmol·m−2·s−1 from 6:00 to 10:00 and from 17:00 to 21:00 (Add 400).
The constant PPFD and timer-based treatments were included as reference lighting strategies for comparison with the biofeedback controls. In the constant PPFD treatment, supplemental lighting was adjusted to maintain the target PPFD when natural sunlight was below the setpoint, while total PPFD could exceed the target under high sunlight conditions. In contrast, in the timer-based treatment, a fixed LED output was added to ambient sunlight during low-sunlight hours without light level adjustment. All target values were selected based on preliminary testing to ensure that all treatments delivered comparable DLIs, allowing direct comparison of lighting strategies under similar light conditions.
In trial 2, only the ETR-based biofeedback logic was further tested because it demonstrated more stable supplemental lighting regulation in trial 1, whereas the ΦPSII-based control resulted in larger fluctuations in light intensity. Two treatments were evaluated: ETRt of 120 μmol·m−2·s−1 (ETR 120) and a constant PPFD of 420 μmol·m−2·s−1 (PPFD 420), using the same RCBD layout. This simplified treatment structure in trial 2 allowed direct comparison between the most stable biofeedback strategy identified in trial 1 and a conventional greenhouse lighting control approach.
Target values for ETR (85 and 120 µmol·m−2·s−1) and ΦPSII (0.735) were initially informed by PPFD response ranges reported in Nam et al. [21]. Because that study was conducted in a growth chamber using a different lettuce cultivar, additional preliminary tests were conducted under greenhouse conditions to identify target levels that produced comparable PPFD ranges. The photoperiods were 15 h (6:00–21:00 h) and 12 h (07:00–19:00 h) in trials 1 and 2, respectively, and were selected to approximate the natural daylength during each experimental period while avoiding excessively extended photoperiods.
All statistical analyses were performed in R (v4.5.0; R Foundation for Statistical Computing, Vienna, Austria). For final growth and energy-use parameters, linear mixed-effects models were applied with lighting treatment as a fixed effect and block as a random effect. One-way analysis of variance (ANOVA) was used to test treatment effects, and Tukey’s Honestly Significant Difference (HSD) test was performed for pairwise comparisons at a 95% confidence level.

3. Results and Discussion

3.1. Adaptation of the Biofeedback System for the Greenhouse

Several modifications were required to adapt the previously developed indoor biofeedback system to greenhouse conditions [20,21]. The first adjustments focused on the fluorometer settings. The measuring light intensity was set to level “8”, the same as the device preset. Although the default measuring light frequency is 0.6 kHz, a higher frequency of 20 kHz was used during the photoperiod since a higher measuring light frequency was required to improve signal detection under high ambient irradiance in the greenhouse. Increasing measuring light intensity or frequency amplifies the fluorescence signal, but may cause an actinic effect or an increase in leaf temperature [24]. At the standard 12 mm distance between a fiber-optic and leaf surface, the combination of intensity level 8 with 0.6 or 20 kHz corresponds to approximately 0.15 and 5 µmol·m−2·s−1 PPFD, respectively. However, those PPFD levels and thermal effects were negligible under the high greenhouse ambient irradiance during the experiment. The datalogger program was therefore designed to automatically switch to 20 kHz when ambient PPFD exceeded 100 µmol·m−2·s−1, while maintaining 0.6 kHz at night. This approach optimized the signal-to-noise ratio under fluctuating greenhouse conditions.
Another consideration was the potential interference between the PAM-measuring light and the modulation frequency of the photosynthetic LEDs. Commercial horticultural LEDs commonly use pulse-width modulation (PWM) dimming, with modulation frequencies ranging from 100 Hz to 50 kHz [25]. When the PWM frequency is close to the PAM modulation frequency, aliasing effects can distort fluorescence signals.
In this study, analog-dimming LEDs operating at 120 Hz were used, which eliminated potential overlap with the MINI-PAM’s high modulation frequencies of 20 kHz during the photoperiod. However, relatively newer PAM models such as MINI-PAM II operate at much lower modulation frequencies (5–25 Hz under normal conditions and 100 Hz during saturating pulses) [26]. In such cases, aliasing could occur if the LED system operates at lower, overlapping frequency. Therefore, reliable CF measurements require verifying the specifications of both the PAM fluorometer version and the LED fixtures to avoid potential aliasing artifacts.
The saturating pulse intensity was set to level “10”, slightly higher than the default value of “8”. This was necessary because plants that are acclimated to high light levels in the greenhouse may require stronger pulses to fully close PSII reaction centers. However, both the intensity and duration of the saturating pulse should be carefully optimized, as repeated Fm′ measurements with excessively strong and prolonged pulses may cause irreversible photodamage [21]. Pulse duration was kept at the default of 0.8 s. The average values of Fv/Fm during the experiments were 0.847 ± 0.003, 0.853 ± 0.004, and 0.820 ± 0.008 for the ETR 85, ΦPSII 0.735, and ETR 120 treatments, respectively (mean ± SD). These values are above 0.82 and within the typical range for healthy, non-stressed plants, suggesting that photodamage was minimal [19]. In addition, the measured leaves were replaced daily to avoid cumulative stress from repeated CF measurements. Based on these results, the saturating pulse intensity and duration used in this study appear appropriate under greenhouse conditions with regular leaf replacement applied.
Photochemical quenching (e.g., qP, qL) could not be determined in this study because its calculation requires Fo′, the light-adapted minimum fluorescence measured using a brief dark interval followed by far-red illumination to fully open PSII reaction centers. Such conditions are challenging to implement in the field or greenhouse conditions under natural sunlight [19]. Traditionally, Fo′ was also required to calculate ΦNPQ and ΦNO according to Kramer et al. [27]. To overcome this limitation, an alternative approach based on the “lake model” was applied, which assumes interconnected light harvesting antennae and provides a more realistic representation of energy distribution for higher plants [23]. This calculation (Equations (2) and (3)) does not require Fo′ measurements and can be readily implemented in dataloggers. Importantly, using ΦNPQ and ΦNO could open opportunities for future biofeedback strategies, such as minimizing ΦNO while allowing photoprotective ΦNPQ, rather than relying solely on ΦPSII, thereby improving both energy-use efficiency and plant stress management [28].

3.2. Biofeedback System Performance Under Greenhouse Conditions

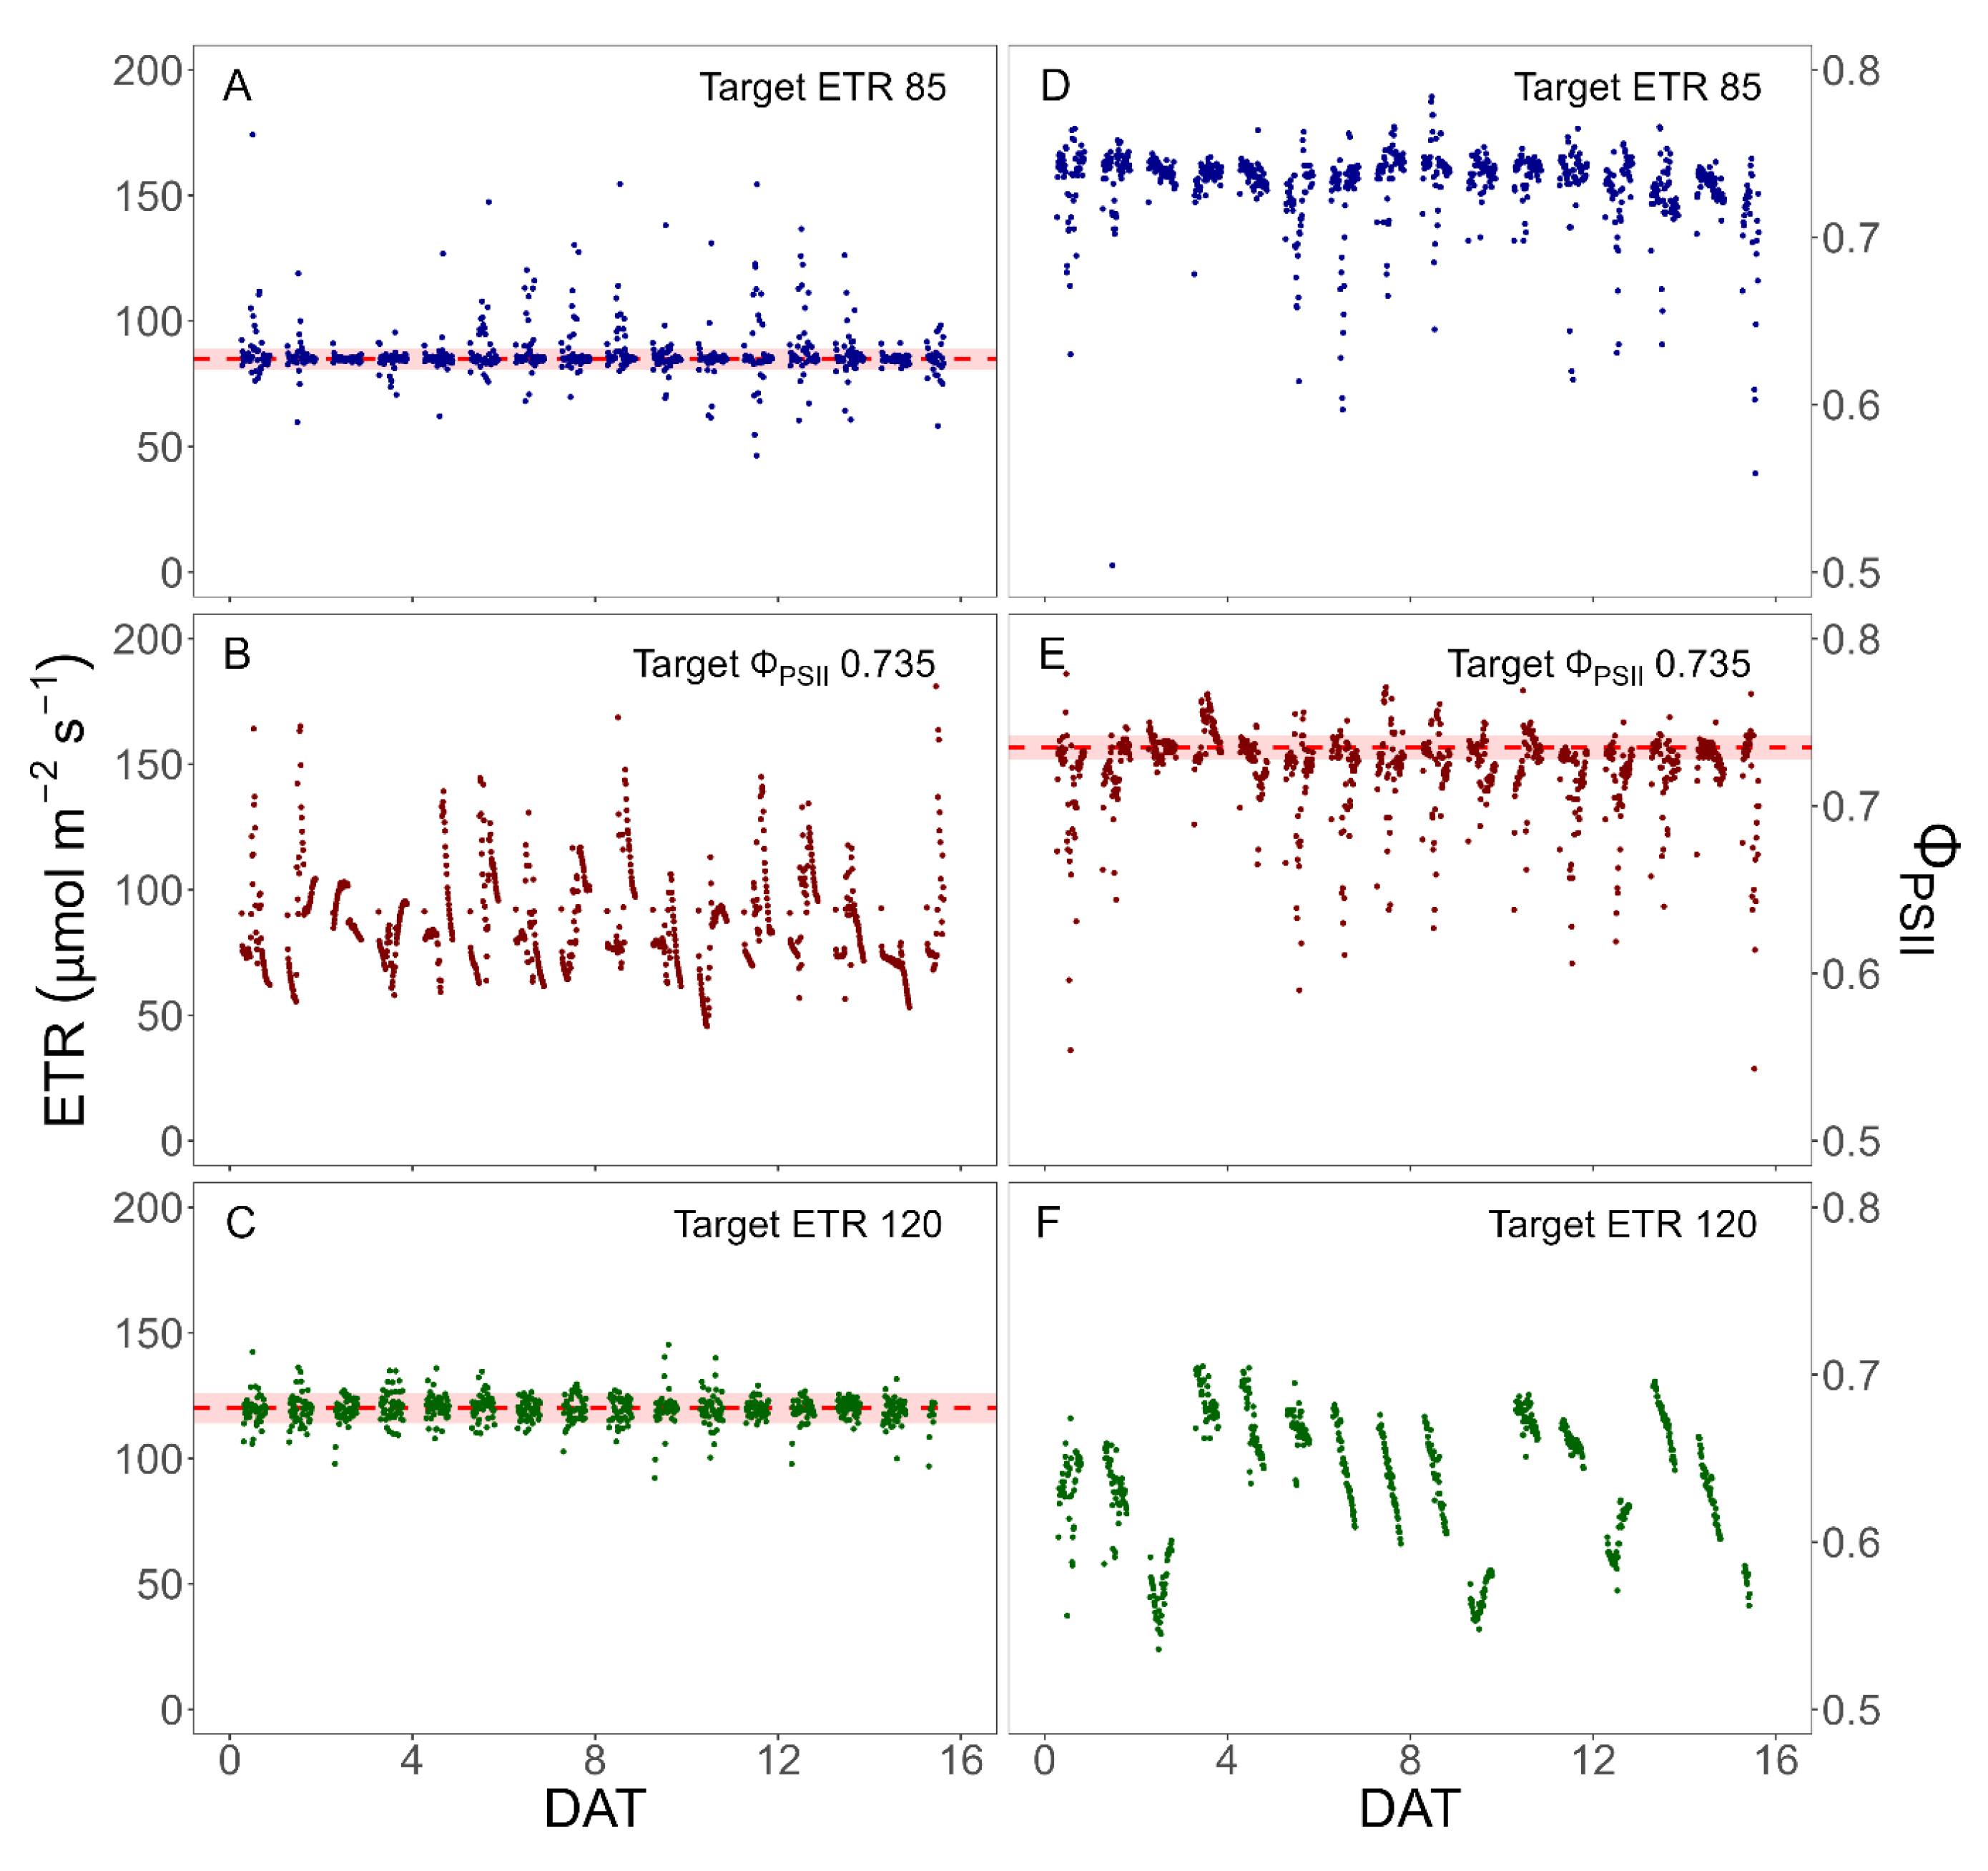
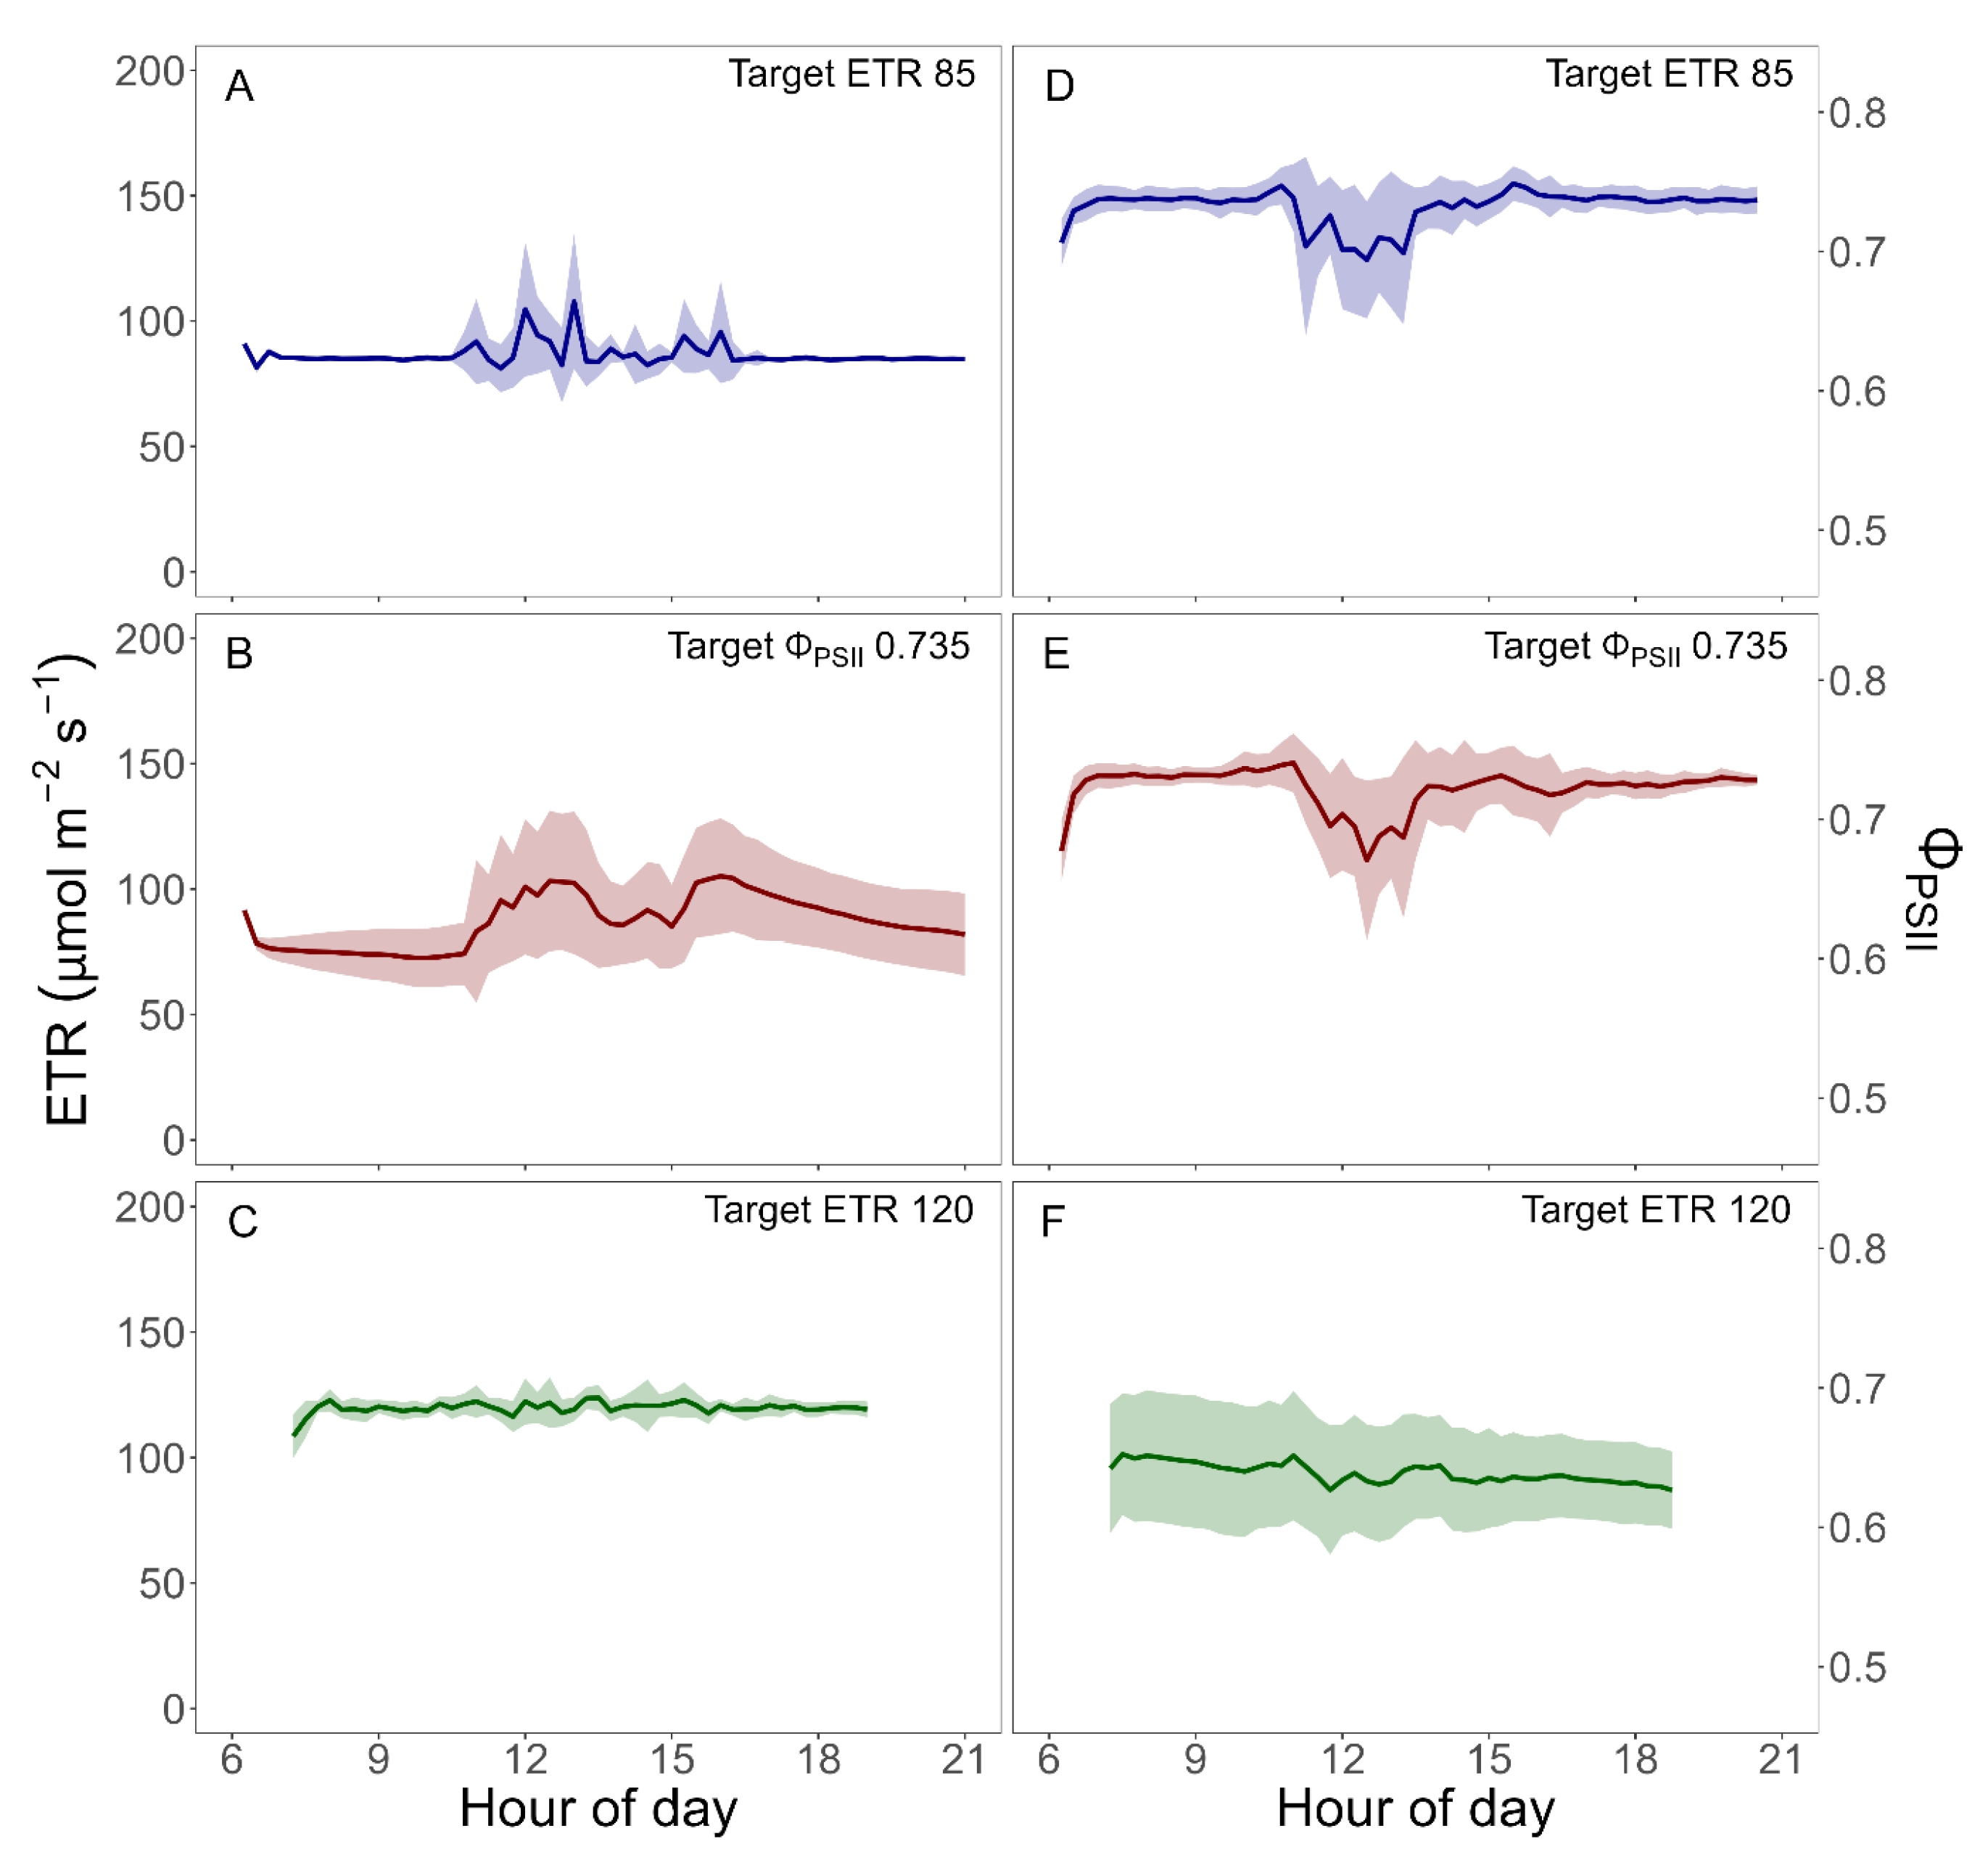
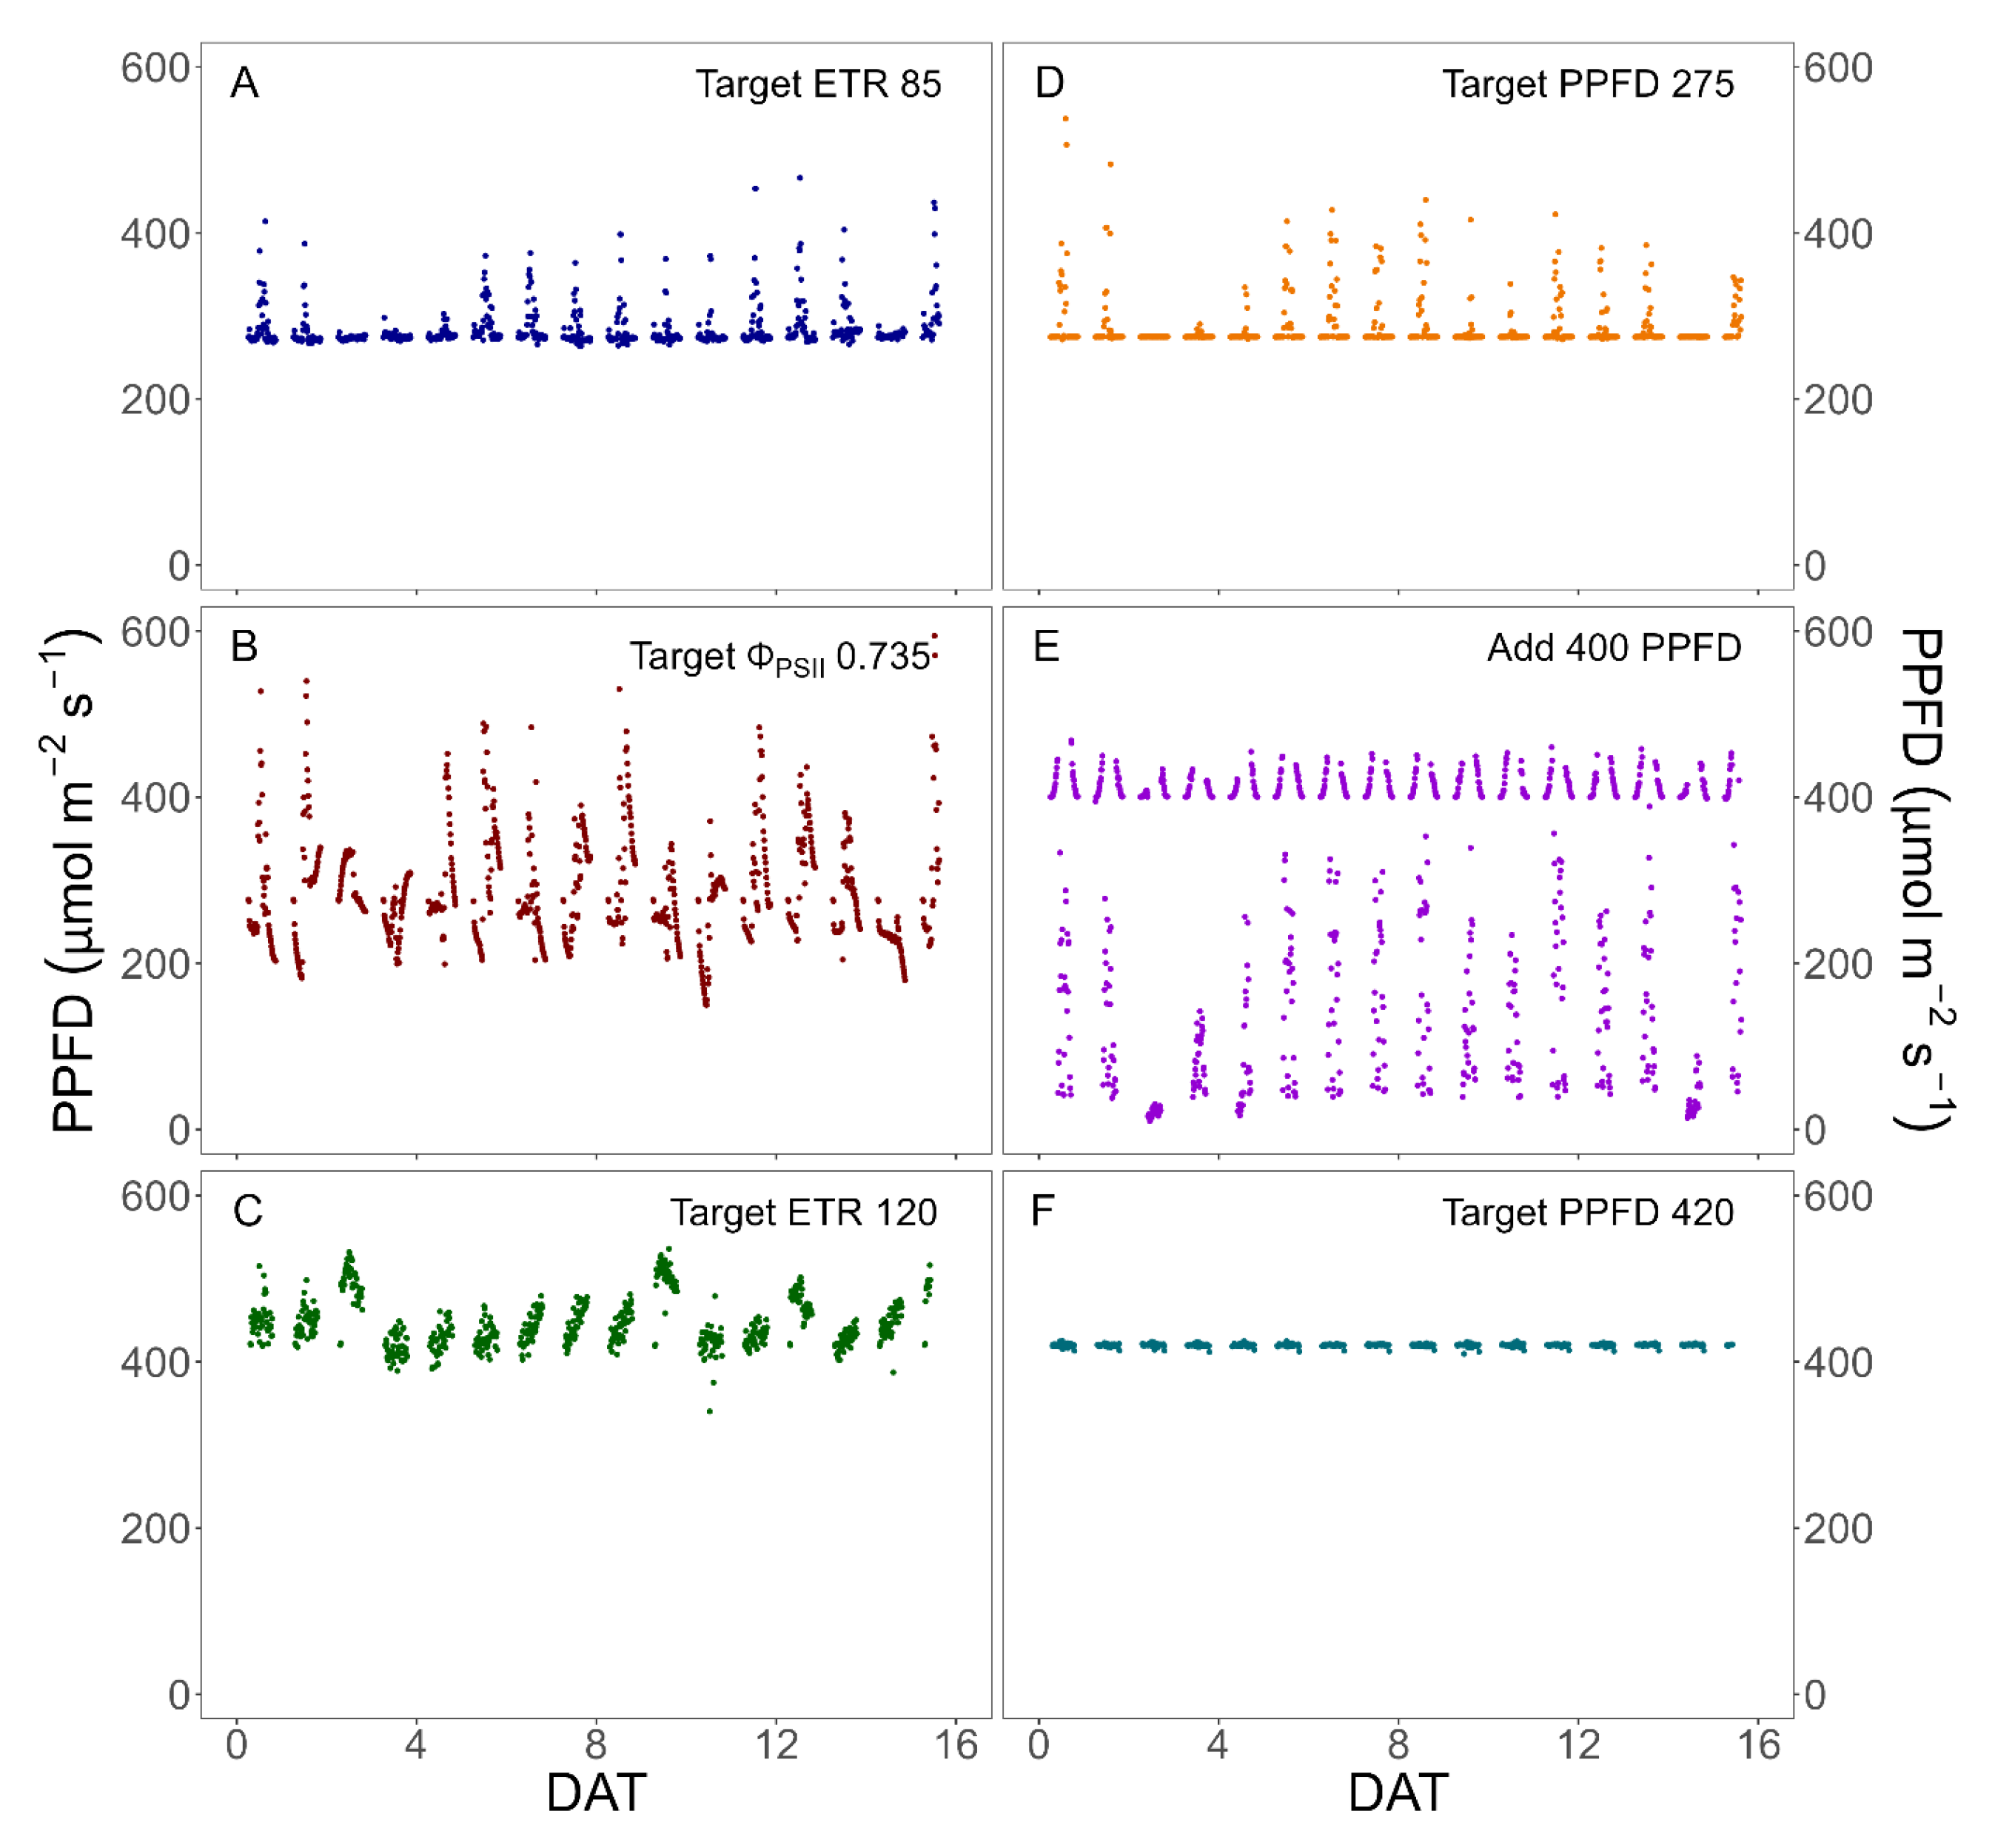
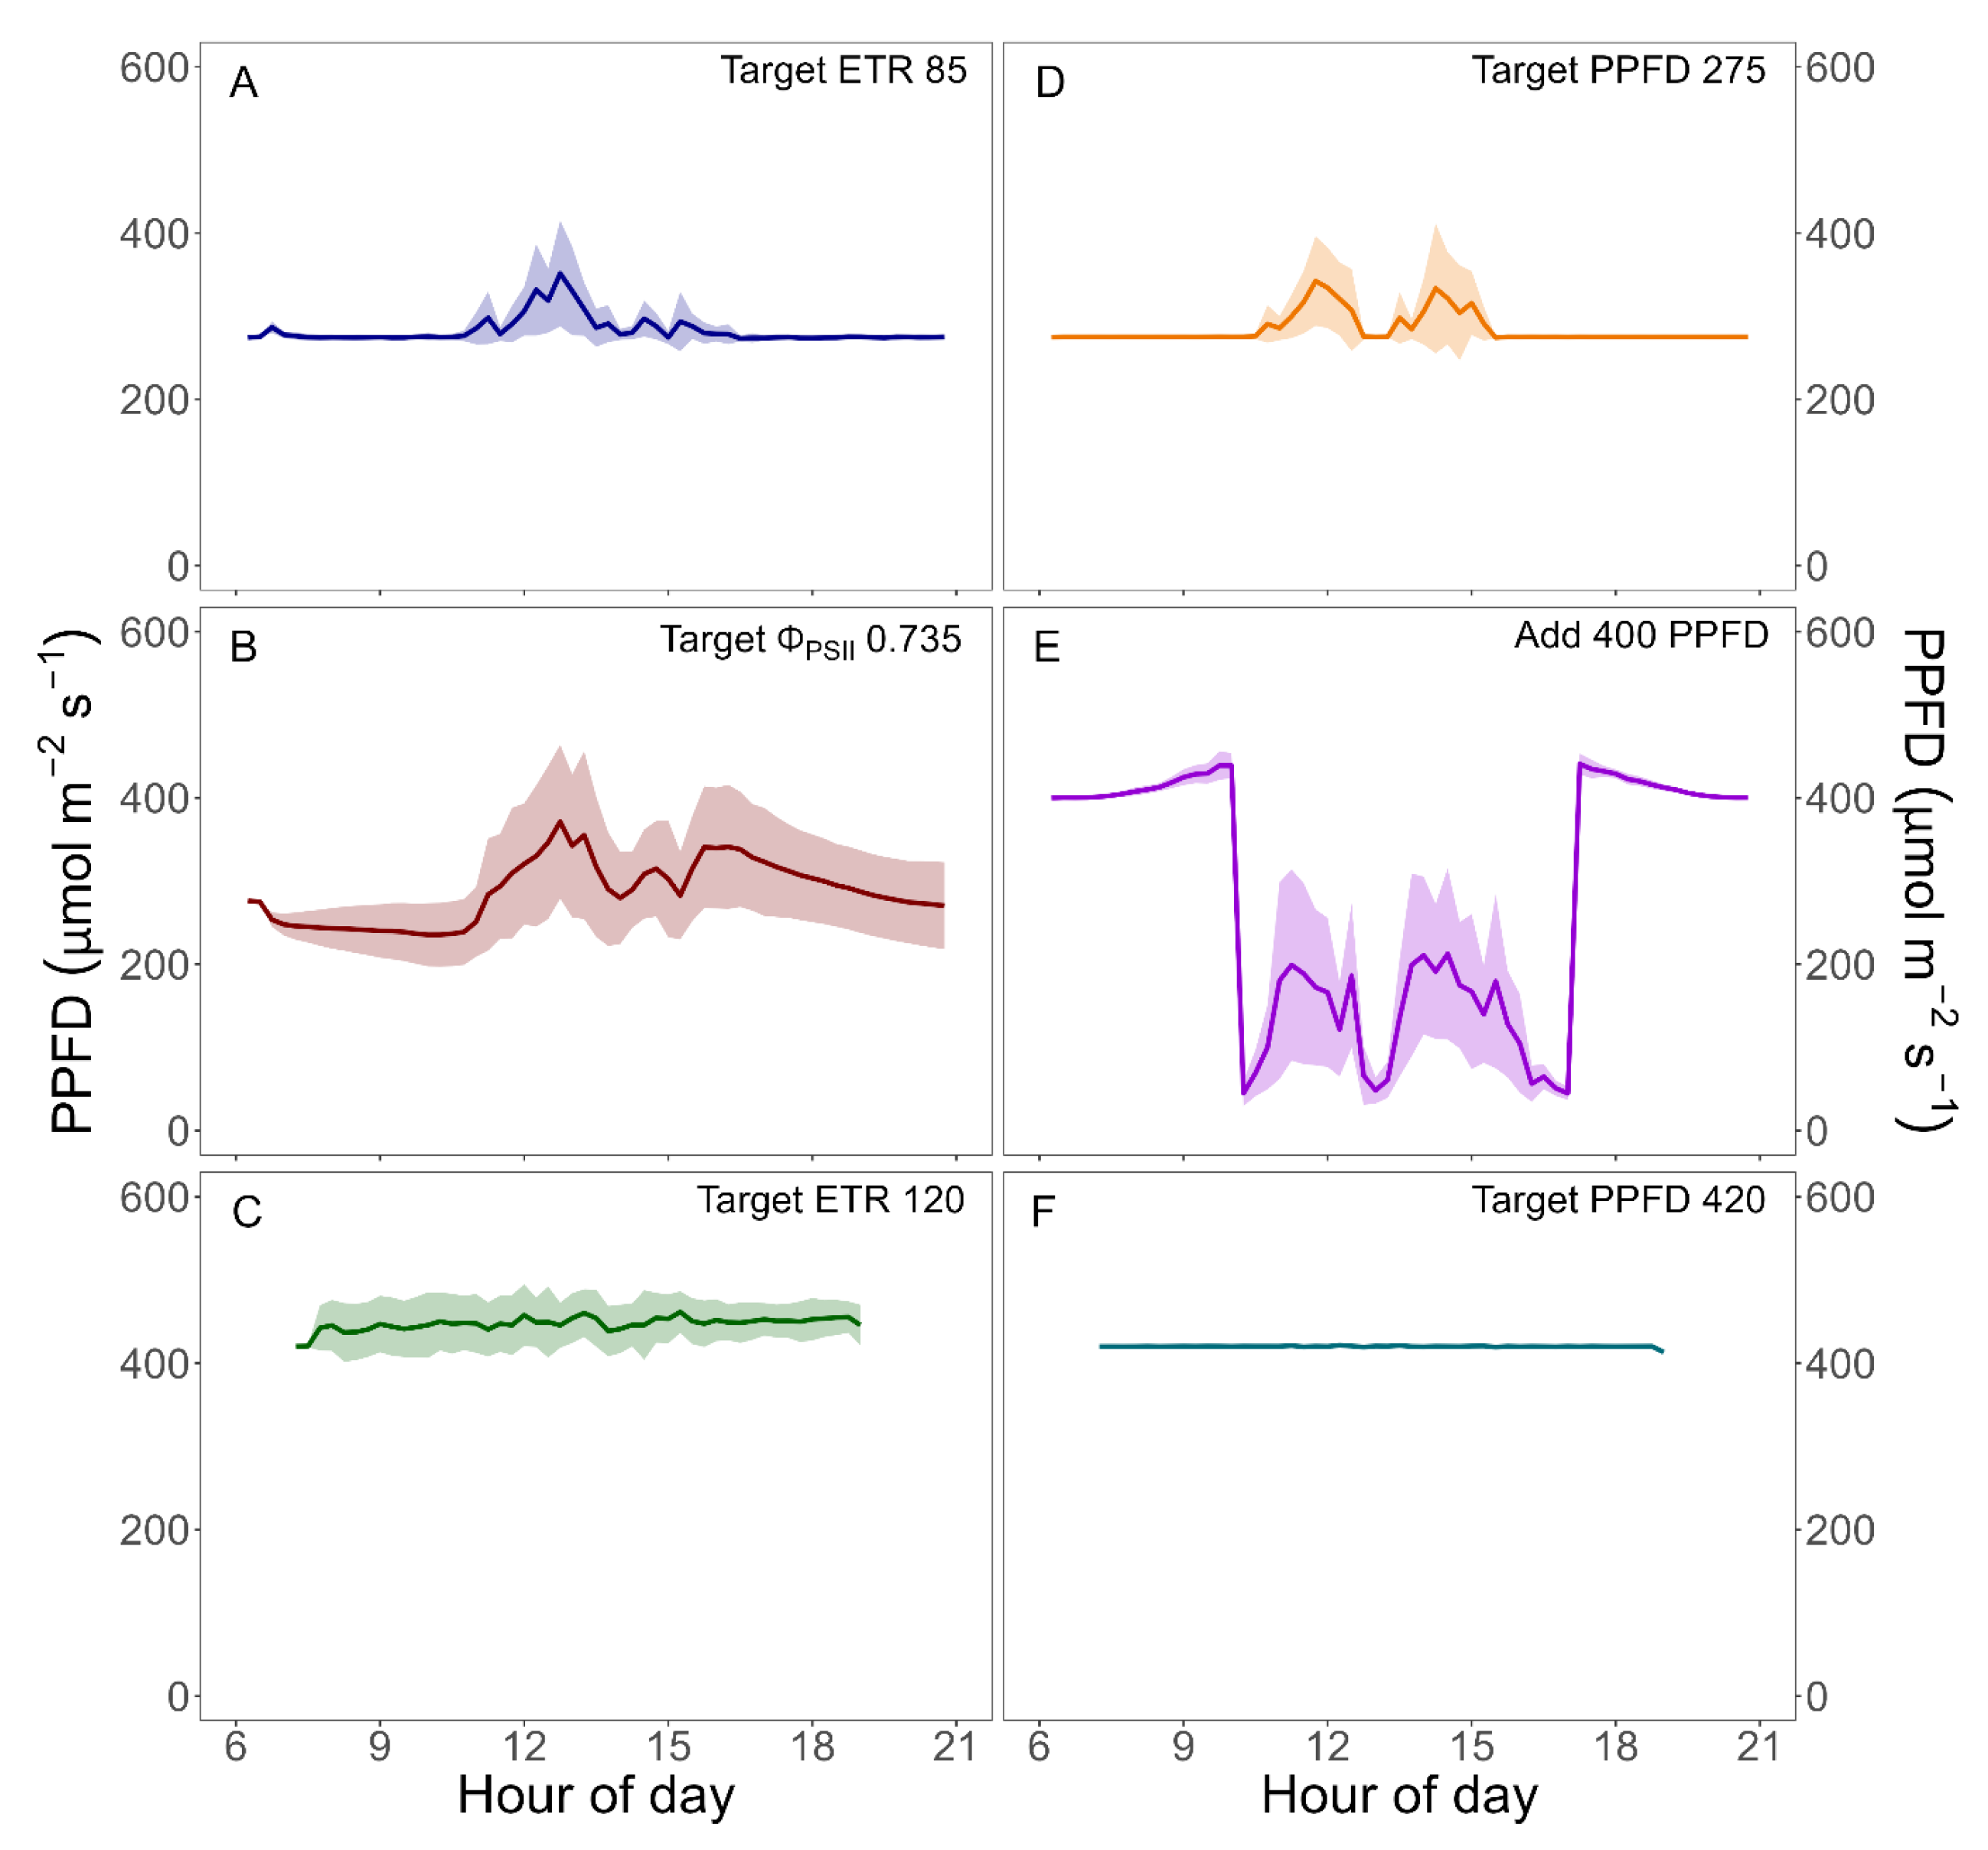
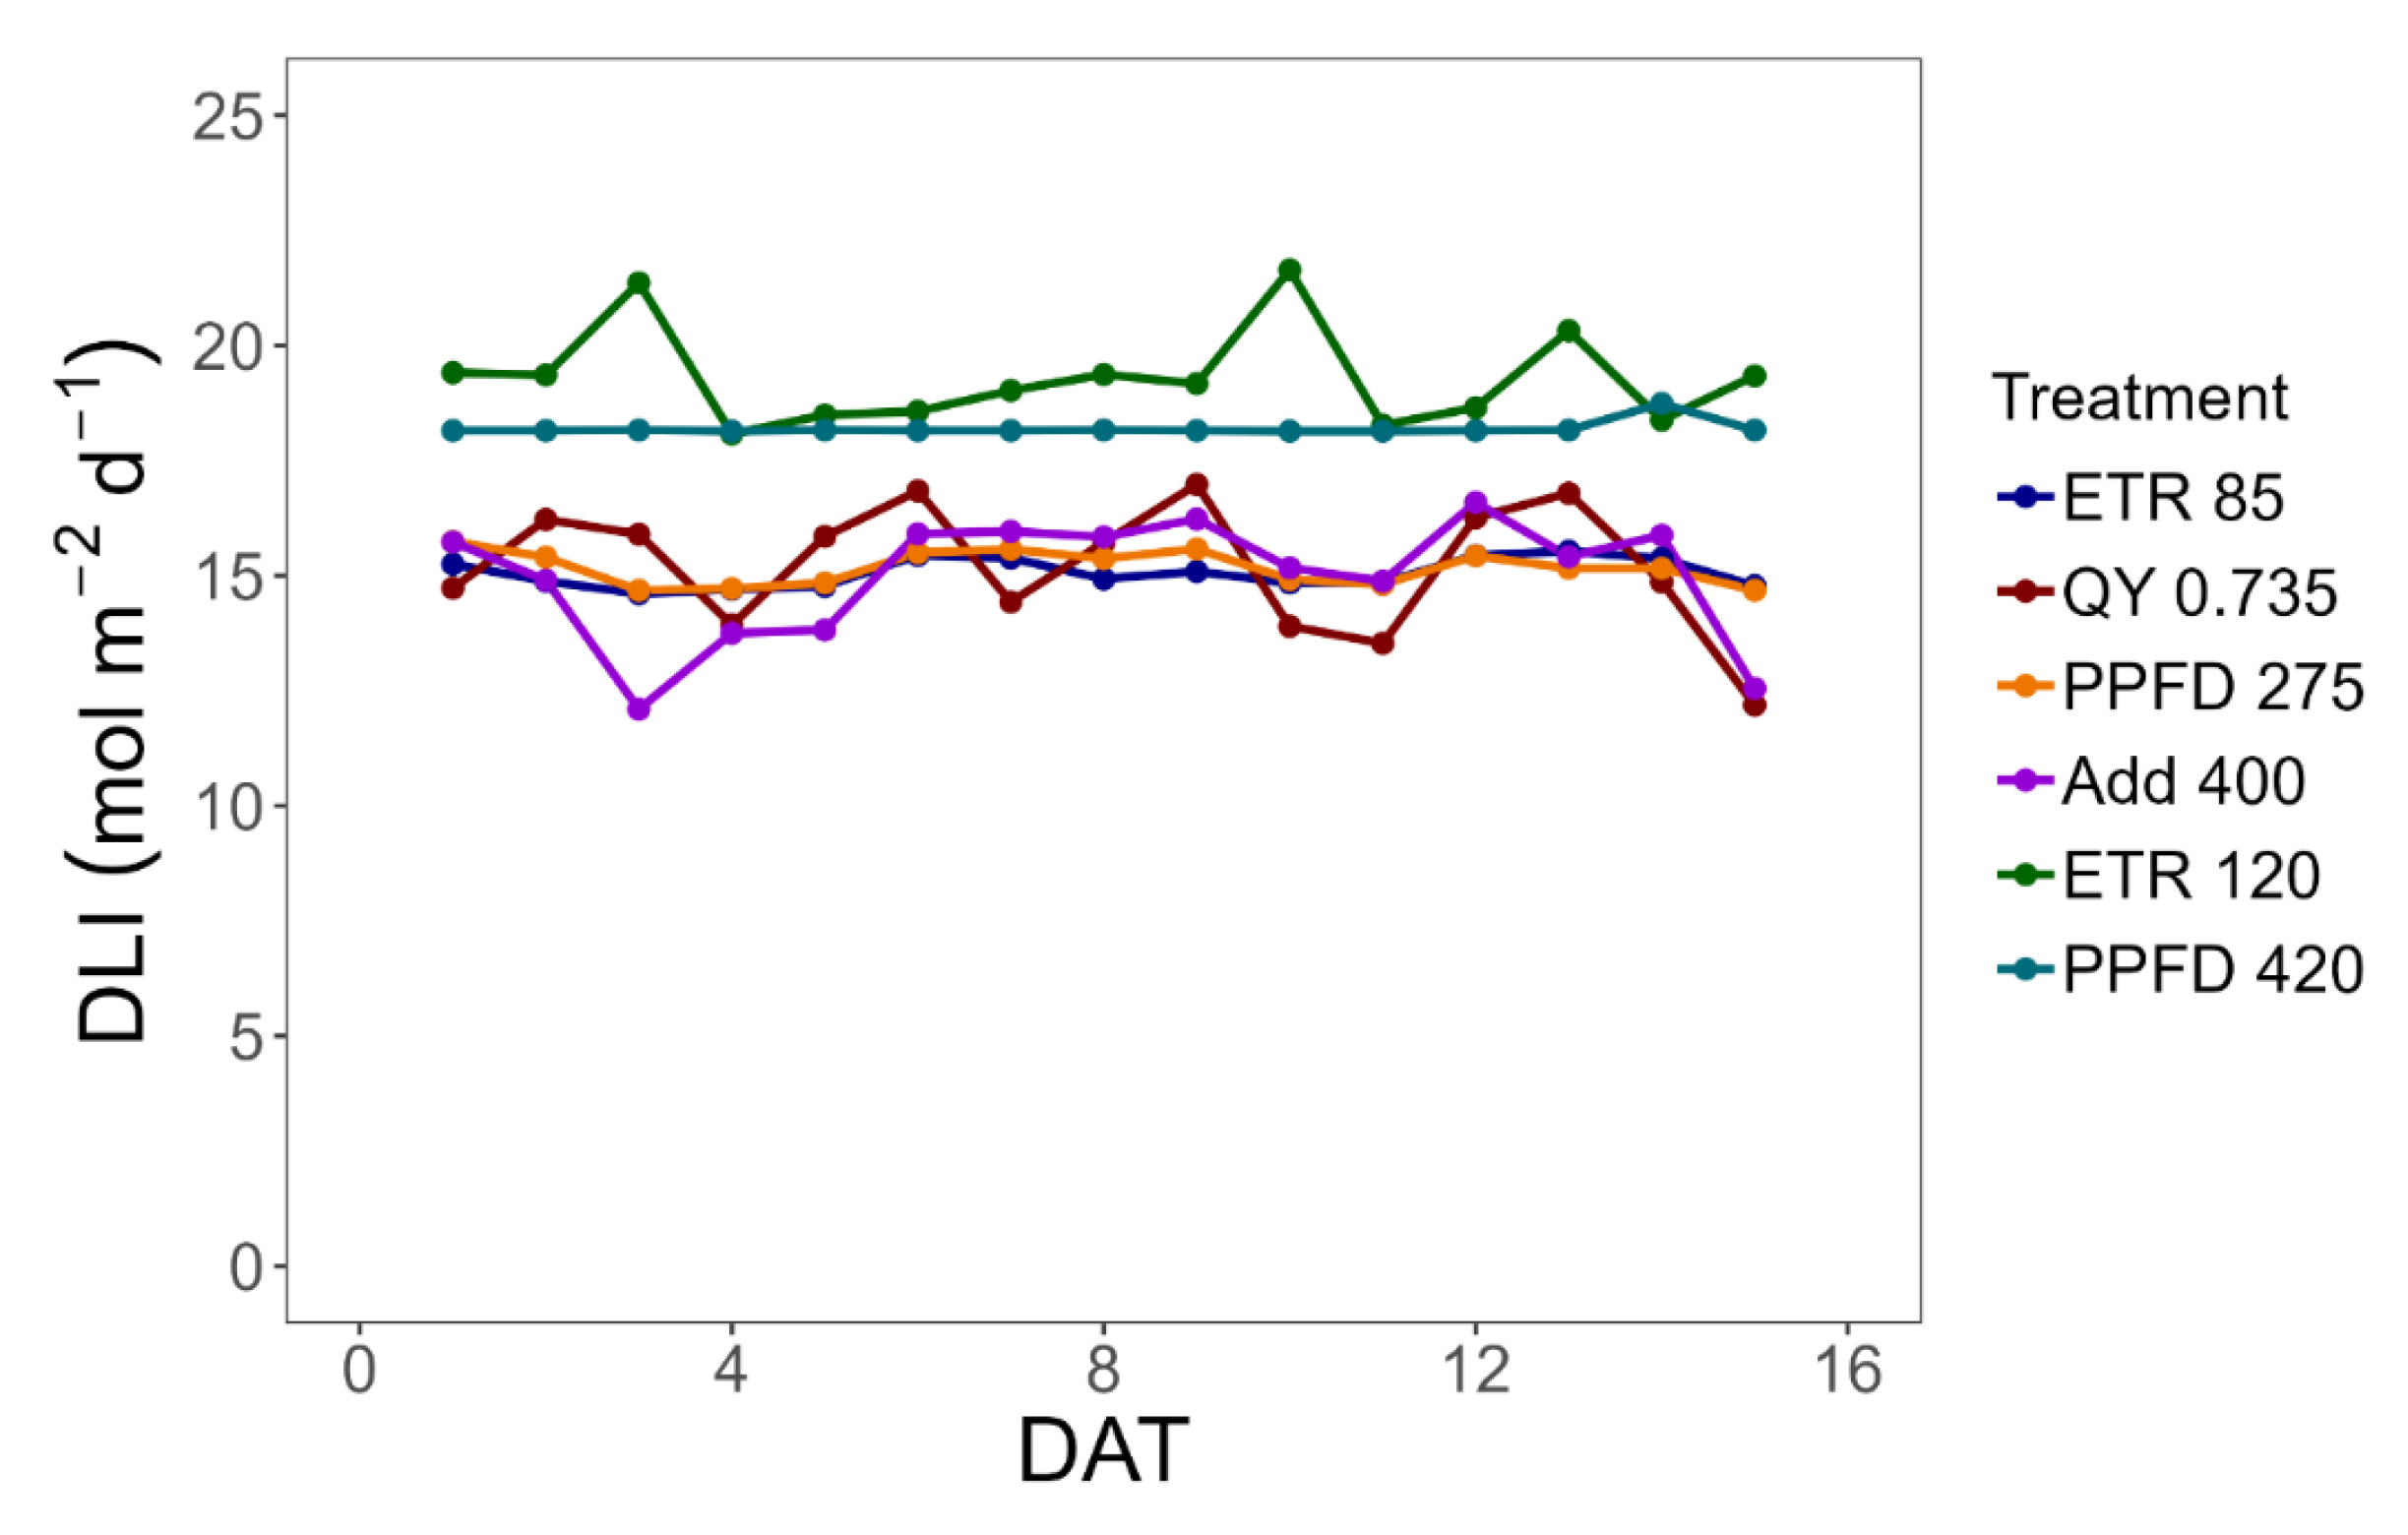
In trial 1, the average ETR of the ETR 85 treatment was 86.6 µmol·m−2·s−1 (Table 1), with 80% of data points falling within ± 5% of the target (Figure 3A). The slightly higher average to the setpoint (Figure 4A) resulted from midday fluctuation in sunlight (Figure 5A), which induced transient peaks in PPFD (Figure 6A) and corresponding ETR above the target. In the PPFD 275 treatment, similar spikes occurred when natural sunlight alone exceeded the PPFD setpoint despite minimal supplemental lighting input (Figure 6D). These values should be regarded not as inaccurate control of the biofeedback system but as an unavoidable outcome of fluctuating sunlight in greenhouse conditions. The PPFD and DLI variability under ETR 85 were comparable to those of PPFD 275 (Figure 5 and Figure 7), demonstrating stable regulation of supplemental lighting by the ETR-based biofeedback logic under fluctuating sunlight. The Add 400 treatment showed apparent day-to-day variations in DLI, because a fixed amount of supplemental light (11.5 mol·m−2·day−1) was simply added to natural sunlight (Figure 7). In contrast, the ETR 85 and PPFD 275 treatments maintained consistent levels, avoiding both under- and over-supply of light energy, thereby ensuring proper crop growth and efficient energy use [9].
The average ΦPSII of the ΦPSII 0.735 treatment was 0.722, slightly below the target, largely because occasional midday sunlight spikes reduced ΦPSII (Table 1). Only 45% of data points fell within ± 1% of the target ΦPSII value (Figure 3E), showing relatively higher variability (Figure 4E). PPFD adjustments were also considerably more dynamic than in the ETR 85 treatment (Figure 6B). This pattern may be associated with daily replacement of the fluorometer measurement spot during the day. Even when measurements were taken from the same plant, newly selected leaves may have differed in their light prehistory and microclimate [19], leading to abrupt PPFD shifts until ΦPSII stabilized to the target value. This leaf replacement protocol was applied equally to both ΦPSII- and ETR-based treatments. However, ETR-based control was less sensitive to such changes because PPFD is incorporated into the ETR calculation, buffering the effects of fluctuations in ΦPSII. To reduce these disturbances and avoid interfering with light adjustment, it is preferable to change measurement spots before or after the photoperiod. The ΦPSII 0.735 treatment showed slightly higher ΦNPQ compared to ETR 85 (Table 1), likely reflecting the need for stronger photoprotective responses under fluctuating PPFD [28,29]. Non-photochemical quenching (NPQ) responds rapidly to high irradiance but relaxes more slowly when irradiance decreases, potentially leading to an “overprotected” PSII and reduced photosynthetic efficiency [30]. This suggests that even when similar amounts of light are provided, supplemental lighting may be used less efficiently for photosynthesis depending on the control parameter.
DLI of the ΦPSII 0.735 treatment fluctuated across days independently of natural sunlight availability, in contrast to the consistent DLI levels of ETR 85 and PPFD 275 (Figure 7). This highlights the inherently dynamic nature of ΦPSII-based logic, which regulates supplemental light input upward under favorable conditions and downward under stressful conditions [21,31]. However, average PPFD and DLI over the entire cultivation period were similar among the three light treatments; ETR 85, ΦPSII 0.735, and PPFD 275 (Table 1). The target values applied in this study were determined based on lettuce ‘Casey’ grown under the specific greenhouse conditions and should not be expected to produce identical PPFD or DLI under different species, cultivars, or environmental conditions. For example, high-light-acclimated plants upregulate photosynthetic machinery and have higher ΦPSII and ETR, whereas shade-adapted species such as pothos maintain relatively lower ΦPSII and ETR even after acclimating to high light [32,33]. Consequently, shade species would yield higher PPFD under ETR-based control to compensate for their lower ΦPSII values, and there will be lower PPFD under ΦPSII-based control to avoid excess light stress, with the opposite responses expected from sun-acclimated plants or crops. Therefore, appropriate target values for either ΦPSII- or ETR-based control should be determined empirically for each crop and growth environment through preliminary testing.

3.3. Dynamic Regulation of PPFD Under High ETR Target

The ETR 120 treatment averaged 119.8 µmol·m−2·s−1 (Table 1), with 82% of data points within ± 5% of the target (Figure 3C). Trial 2 was conducted under lower sunlight availability than trial 1, and the higher ETR setpoint further reduced the occurrence of light overshoots (Figure 6C). As a result, the achieved ETR was closer to the target, with a smaller standard deviation than in the ETR 85 treatment in trial 1 (Figure 4C). The corresponding PPFD of the ETR 120 treatment averaged 447.1 µmol·m−2·s−1 over trial 2 (Table 1). ΦPSII values of the ETR 120 treatment were lower and more variable than in ETR 85 and ΦPSII 0.735 treatments (Figure 3D–F), and corresponding supplemental light was dynamically adjusted to compensate for those changes in ΦPSII, resulting in day-to-day variation in DLI (Figure 5C and Figure 7).
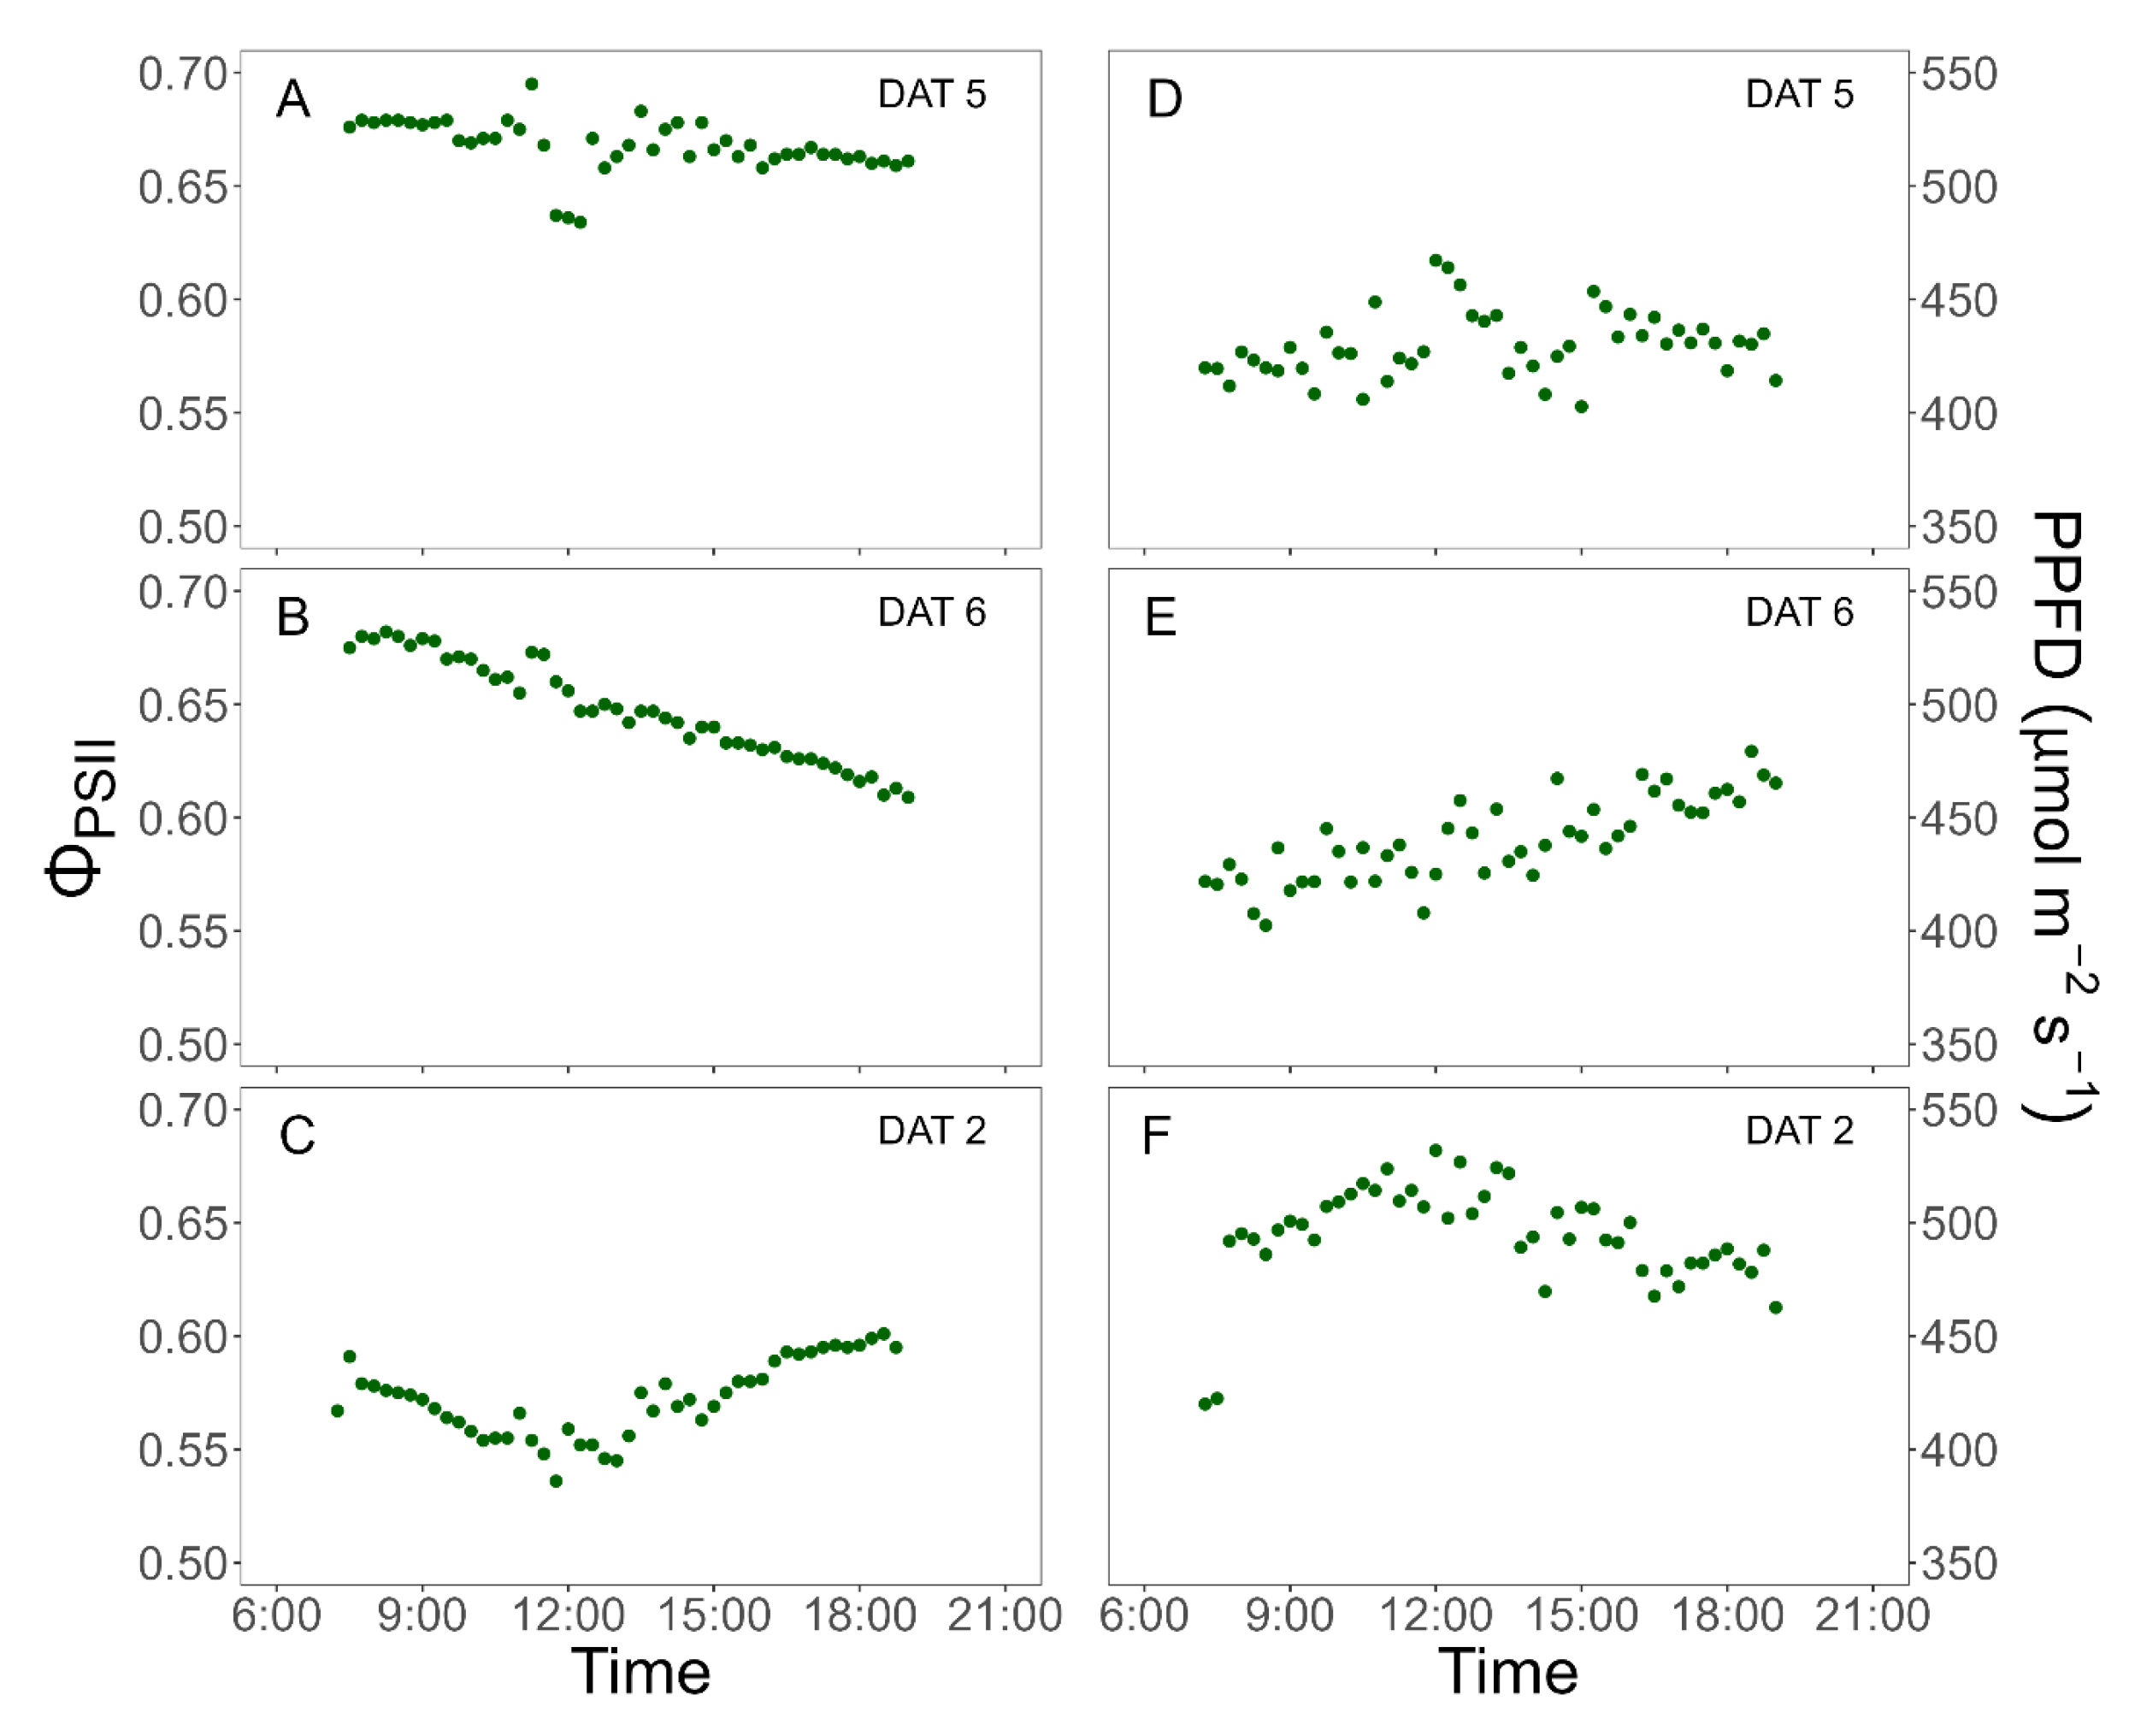
Distinct diurnal patterns of ΦPSII were observed in the ETR 120 treatment (Figure 8A–C), with values either remaining stable, gradually decreasing, or declining followed by recovery later in the day. The corresponding PPFD responses exhibited inverse patterns, showing three distinct trends: remaining stable, gradually increasing, and peaking before declining (Figure 8D–F). Even when ΦPSII was relatively stable, PPFD still ranged widely between 400–450 µmol·m−2·s−1 during a day (Figure 8D), whereas PPFD 420 maintained a tightly consistent intensity (Figure 6F). Similar trends have been reported previously, where higher ETR setpoints led to greater variation in ΦPSII and PPFD across replications in lettuce and cucumber [21]. These results suggest that ETR-based control does not necessarily provide a constant PPFD but instead varies light intensity in response to real-time changes in ΦPSII, particularly under higher ETR setpoints. Such variability likely arises because photosynthetic processes cannot adjust instantly to rapid light fluctuations. The kinetics of NPQ, stomatal conductance, and the utilization of adenosine triphosphate (ATP) and nicotinamide adenine dinucleotide phosphate (NADPH) are inherently delayed and often asymmetric, so short-term changes in PPFD are not immediately matched by changes in ΦPSII [34,35,36]. In addition, cumulative environmental stress during a day may reduce photosynthetic efficiency in the midday and afternoon [37]. Taken together, the combination of a high ETR setpoint and dynamic greenhouse conditions led to more variable supplemental light regulation in the ETR 120 treatment than in the ETR 85 treatment (Figure 5A,C).

3.4. ETR- and ΦPSII-Based Biofeedback Logic

In ETR-based biofeedback control, PPFD is adjusted according to the ratio of the target to the current ETR (Equation (6)), assuming a linear relationship between ETR and PPFD. This approach has been used successfully in climate-controlled chambers [20,31]. Table 2 shows an example dataset from the ETR 85 treatment in trial 1 on 17 April. At 10:00 and 16:00 h, when sunlight was low, ETRc was already close to the ETRt, and only small PPFD adjustments were needed. Around midday, fluctuating sunlight caused abrupt deviations in PPFDc, most likely due to cloud movement. This led to sharp shifts in the ETRt/ETRc ratio. Even so, the calculated PPFDt remained stable within a narrow range (270–290 µmol·m−2·s−1). ETR increases with increasing PPFD and approaches saturation at higher light levels, reflecting photosynthetic limitations such as upregulated NPQ and reduced CO2 availability [38]. However, the ETR-based logic, based on a linear relationship between ETR and PPFD, successfully maintained consistent light control with frequent and iterative adjustments despite fluctuations in sunlight, demonstrating the practical utility of the linear approximation for greenhouse lighting control. Nevertheless, the performance of this approach under greater variability in solar radiation remains to be evaluated.
In ΦPSII-based control, PPFD is adjusted based on the ratio of current to target ΦPSII (Equation (7)), reflecting the general decrease in ΦPSII with increasing PPFD. Table 3 shows an example dataset illustrating ΦPSII-based biofeedback control. In the morning and late afternoon, ΦPSII,t was stably achieved with only minor PPFD adjustments, similar to ETR-based control. Around midday, however, fluctuating sunlight led to abrupt increases in PPFDc, resulting in transient deviations in ΦPSII,c relative to ΦPSII,t. For instance, at 12:30 h, PPFDc was 365 µmol·m−2·s−1 while ΦPSII,c remained relatively high (0.737), close to the target value. Consequently, PPFDt was kept at a similarly high level (366 µmol·m−2·s−1), resulting in a decline in ΦPSII at 12:45 and sustained elevated supplemental light levels. However, following iterative corrections lowered PPFDt and restored ΦPSII close to the target value by 13:30 h.
Although ΦPSII generally decreases with increasing PPFD, its response may lag behind rapid fluctuations in light intensity due to relatively slow mechanisms such as NPQ dynamics and stomatal behavior [39,40]. As a result, ΦPSII-based control, which relies directly on instantaneous photochemical efficiency, exhibited greater variability in PPFD adjustments compared to ETR-based control under fluctuating greenhouse conditions. These results suggest that relying solely on ΦPSII for light regulation may lead to less stable control, especially when photosynthetic responses are not synchronized with rapid changes in incident light.

3.5. Lettuce Growth Responses and Energy-Use Efficiency

In trial 1, shoot fresh and dry weight did not differ significantly among treatments (Table 4). Total leaf area was slightly smaller, and leaf chlorophyll content was higher at PPFD 275, whereas the Add 400 treatment showed the opposite trend, with biofeedback treatments displaying intermediate responses. However, these differences were minor and did not indicate distinct treatment effects. Regarding lighting energy use, the ΦPSII 0.735 treatment consumed the most energy over the experiment, followed by the ETR 85 and reference controls, but overall energy-use efficiency remained statistically similar among treatments. Similarly, in trial 2, no significant differences were found in either growth parameters or energy-use efficiency.
In contrast to the present results, a comparable study conducted in a climate-controlled chamber on basil (Ocimum basilicum) reported higher biomass and energy-use efficiency under CF-based feedback lighting compared with constant PPFD [41]. Under constant 380 µmol·m−2·s−1 PPFD for 18 h, ΦPSII declined from 0.65 to 0.45 during the later part of each photoperiod. The authors attributed this decline primarily to photosynthate accumulation and reduced sink capacity in leaves [42], leading the feedback controller to reduce LED intensity as photosynthetic demand decreased. However, the observed decline in ΦPSII may not solely reflect diurnal physiological responses. The controller reached the target ΦPSII late in the photoperiod, suggesting a slow system response, and frequent saturating pulses (every 5 min) may also have induced photoinhibition [21]. Thus, it remains unclear whether the reduced light intensity reflected plant regulation or artifacts of the control system itself.
In this study, the absence of differences in growth and energy-use efficiency across the biofeedback and reference light control methods likely reflected the relatively steady environmental conditions. Under such conditions, plant photosynthetic demand likely remained relatively stable throughout the photoperiod. The benefits of the biofeedback lighting may become more evident under environments with greater temporal variability or extreme greenhouse environments, such as strong diurnal changes in temperature. Under these conditions, photosynthetic capacity may vary over time, allowing dynamic light regulation to better align light supply with real-time plant demand compared with constant PPFD strategy.
Crop characteristics may also influence the effectiveness of the biofeedback lighting. Species with higher light requirements may response differently to dynamic light regulation than shade-adapted crops. For example, Nam et al. [21] reported that lettuce and cucumber showed different PPFD adjustment patterns under the same biofeedback target levels, reflecting crop-specific photosynthetic responses. Comparative studies across crops with contrasting light requirements could therefore further reveal the advantages of dynamic, plant-driven light regulation in greenhouses.
Although growth and energy use did not differ here, this study demonstrates the feasibility of implementing a CF-based biofeedback prototype in greenhouses and provides a foundation for future refinements under more variable or stress-prone environments and across diverse crops. Future research may explore a broader range of control target levels and alternative CF parameters for biofeedback control to further optimize plant-driven lighting strategies.

4. Conclusions

The first proof-of-concept application of a chlorophyll fluorescence-based biofeedback system under greenhouse conditions was demonstrated for regulating supplemental LED lighting. The system, originally developed for indoor environments, was successfully adapted to dynamic greenhouse conditions with fluctuating sunlight and heterogeneous microclimates. Both ETR- and ΦPSII-based logics maintained target photosynthetic responses under variable greenhouse conditions. Across two trials, lettuce growth and light energy-use efficiency did not differ significantly among the biofeedback and reference controls. Nevertheless, these results demonstrate the feasibility of chlorophyll fluorescence-based biofeedback lighting control in greenhouses and provide a foundation for further validation under more variable environments and across diverse crops. More broadly, this work highlights the use of real-time plant physiological responses for plant-centered greenhouse control.

Author Contributions

Conceptualization, S.N. and R.S.F.; methodology, S.N.; software, S.N.; validation, S.N. and R.S.F.; formal analysis, S.N.; investigation, S.N.; resources, R.S.F.; data curation, S.N.; writing—original draft preparation, S.N.; writing—review and editing, S.N. and R.S.F.; visualization, S.N. and R.S.F.; supervision, R.S.F.; project administration, R.S.F.; funding acquisition, R.S.F. All authors have read and agreed to the published version of the manuscript.

Funding

This research was funded by the following sources: USDA-NIFA-SCRI, grant number 2018-51181-28365, project “LAMP: Lighting approaches to maximize profits”; USDA-AFRI-FAS Program A1521 5a, grant number 2026-67021-45822, project “Chlorophyll fluorescence-based biofeedback system to control LED lighting in greenhouses and vertical farms”; USDA NIFA joint NSF/USDA award number 2024-67021-43862 (project “Controlled wastewater-hydroponic systems for enhanced nutrient and water efficiency via coupled real-time sensing and data-driven technologies”); USDA NIFA AFRI award number 2024-67021-42876 (project “Triboelectric biocomposite membranes for in situ wastewater heavy metal management for irrigation”); the Department of Horticulture, the College of Agricultural and Environmental Sciences; the Office of the Senior Vice President for Academic Affairs and Provost.

Data Availability Statement

Data will be available upon requests.

Acknowledgments

We are deeply indebted to the late Marc W. van Iersel, whose pioneering ideas and conceptual guidance laid the foundation for this research. We thank the CEA Crop Physiology and Production Laboratory for the technical support and Cari Peters and JR Peters for fertilizer donations. Mention of a trademark, proprietary product, or vendor does not constitute a guarantee or warranty of the product and does not imply its approval to the exclusion of other products or vendors that also may be suitable.

Conflicts of Interest

The authors declare no conflicts of interest. The funders had no role in the design of the study; in the collection, analyses, or interpretation of data; in the writing of the manuscript; or in the decision to publish the results.

Abbreviations

The following abbreviations are used in this manuscript:
HPSHigh-pressure sodium
LEDLight-emitting diode
PPFDPhotosynthetic photon flux density
DLIDaily light integral
CO2Carbon dioxide
CFChlorophyll fluorescence
ETRElectron transport rate
PSIIPhotosystem II
ΦPSIIQuantum yield of photosystem II
DPIDaily photochemical integral
VPDVapor pressure deficit
SDStandard deviation
CEAControlled environment agriculture
PAMPulse–amplitude modulation
ΦNPQNon-photochemical quenching
ΦNONon-regulated energy dissipation
Fv/FmMaximum quantum efficiency of PSII
FsSteady-state fluorescence under actinic light
FmMaximum fluorescence from a light-adapted leaf
FoMinimum fluorescence from a dark-adapted leaf
FmMaximum fluorescence from a dark-adapted leaf
PPFDtTarget PPFD
PPFDcCurrent PPFD
ETRtTarget ETR
ETRcCurrent ETR
ΦPSII,tTarget ΦPSII
ΦPSII,cCurrent ΦPSII
RCBDRandomized complete block design
ETR 85ETR-based control with a ETRt of 85 μmol·m−2·s−1
ΦPSII 0.735ΦPSII-based control with a ΦPSII,t of 0.735
PPFD 275Constant PPFD of 275 μmol·m−2·s−1
Add 400Timer-based PPFD of 400 μmol·m−2·s−1 from 6:00 to 10:00 and from 17:00 to 21:00
ETR 120ETR-based control with a ETRt of 120 μmol·m−2·s−1
PPFD 420Constant PPFD of 420 μmol·m−2·s−1
ANOVAAnalysis of variance
HSDHonestly significant difference
PWMPulse-width modulation
NPQNon-photochemical quenching
ATPAdenosine triphosphate
NADPHNicotinamide adenine dinucleotide phosphate

References

  1. Azizi, S.; Aliniaeifard, S.; Zarbakhsh, S.; Esmaeili, S.; Baghalian, K.; Gruda, N.S. Photobiology, photosynthesis, and plant responses under artificial lighting in controlled environment agriculture. Sci. Hortic. 2025, 349, 114248. [Google Scholar] [CrossRef]
  2. Dietz, K.-J. Efficient high light acclimation involves rapid processes at multiple mechanistic levels. J. Exp. Bot. 2015, 66, 2401–2414. [Google Scholar] [CrossRef] [PubMed]
  3. Oh, W.; Runkle, E.S.; Warner, R.M. Timing and duration of supplemental lighting during the seedling stage influence quality and flowering in petunia and pansy. HortScience 2010, 45, 1332–1337. [Google Scholar] [CrossRef]
  4. Paponov, M.; Kechasov, D.; Lacek, J.; Verheul, M.J.; Paponov, I.A. Supplemental light-emitting diode inter-lighting increases tomato fruit growth through enhanced photosynthetic light use efficiency and modulated root activity. Front. Plant Sci. 2020, 10, 1656. [Google Scholar] [CrossRef] [PubMed]
  5. Jayalath, T.C.; van Iersel, M.W.; Ferrarezi, R.S. The energy requirement for supplemental greenhouse lighting can be reduced by considering ‘excess’ light from the previous day. Plants 2024, 13, 652. [Google Scholar] [CrossRef] [PubMed]
  6. Weaver, G.M.; van Iersel, M.W.; Velni, J.M. A photochemistry-based method for optimising greenhouse supplemental light intensity. Biosyst. Eng. 2019, 182, 123–137. [Google Scholar] [CrossRef]
  7. Pinho, P.; Hytönen, T.; Rantanen, M.; Elomaa, P.; Halonen, L. Dynamic control of supplemental lighting intensity in a greenhouse environment. Light. Res. Technol. 2013, 45, 295–304. [Google Scholar] [CrossRef]
  8. Weaver, G.; van Iersel, M.W. Longer photoperiods with adaptive lighting control can improve growth of greenhouse-grown ‘Little Gem’lettuce (Lactuca sativa). HortScience 2020, 55, 573–580. [Google Scholar] [CrossRef]
  9. van Iersel, M.W.; Gianino, D. An adaptive control approach for light-emitting diode lights can reduce the energy costs of supplemental lighting in greenhouses. HortScience 2017, 52, 72–77. [Google Scholar] [CrossRef]
  10. Elkins, C.; van Iersel, M.W. Longer photoperiods with the same daily light integral increase daily electron transport through photosystem II in lettuce. Plants 2020, 9, 1172. [Google Scholar] [CrossRef] [PubMed]
  11. Jin, W.; Ji, Y.; Larsen, D.H.; Huang, Y.; Heuvelink, E.; Marcelis, L.F. Gradually increasing light intensity during the growth period increases dry weight production compared to constant or gradually decreasing light intensity in lettuce. Sci. Hortic. 2023, 311, 111807. [Google Scholar] [CrossRef]
  12. Owen, W.G.; Lopez, R.G. End-of-production supplemental lighting with red and blue light-emitting diodes (LEDs) influences red pigmentation of four lettuce varieties. HortScience 2015, 50, 676–684. [Google Scholar] [CrossRef]
  13. Janda, T.; Prerostová, S.; Vanková, R.; Darkó, É. Crosstalk between light-and temperature-mediated processes under cold and heat stress conditions in plants. Int. J. Mol. Sci. 2021, 22, 8602. [Google Scholar] [CrossRef] [PubMed]
  14. Huber, B.M.; Louws, F.J.; Hernández, R. Impact of different daily light integrals and carbon dioxide concentrations on the growth, morphology, and production efficiency of tomato seedlings. Front. Plant Sci. 2021, 12, 615853. [Google Scholar] [CrossRef] [PubMed]
  15. Shamshiri, R.R.; Jones, J.W.; Thorp, K.R.; Ahmad, D.; Man, H.C.; Taheri, S. Review of optimum temperature, humidity, and vapour pressure deficit for microclimate evaluation and control in greenhouse cultivation of tomato: A review. Int. Agrophys. 2018, 32, 287–302. [Google Scholar] [CrossRef]
  16. Kernbach, S. Biofeedback-based closed-loop phytoactuation in vertical farming and controlled-environment agriculture. Biomimetics 2024, 9, 640. [Google Scholar] [CrossRef] [PubMed]
  17. Sun, Z.T.; Yang, Y.X.; Lu, M.; Li, H.M.; Peng, J.X.; Tian, S.J.; Hu, J.; Gao, P. Real-Time Nitrogen Regulation via IoT Edge Computing: A Chlorophyll Fluorescence-Driven Framework for Sustainable Plant Factories. IEEE Internet Things J. 2025, 12, 34434–34445. [Google Scholar] [CrossRef]
  18. Adireddy, R.G.; Anapalli, S.S.; Ojha, M.; Puppala, N.; Reddy, K.N. Photosynthetic responses to light levels in drought-tolerant novel peanut (Arachis hypogaea L) genotypes. Sci. Rep. 2025, 15, 25032. [Google Scholar] [CrossRef] [PubMed]
  19. Maxwell, K.; Johnson, G.N. Chlorophyll fluorescence—A practical guide. J. Exp. Bot. 2000, 51, 659–668. [Google Scholar] [CrossRef]
  20. van Iersel, M.W.; Weaver, G.; Martin, M.T.; Ferrarezi, R.S.; Mattos, E.; Haidekker, M. A chlorophyll fluorescence-based biofeedback system to control photosynthetic lighting in controlled environment agriculture. J. Am. Soc. Hortic. Sci. 2016, 141, 169–176. [Google Scholar] [CrossRef]
  21. Nam, S.; van Iersel, M.W.; Ferrarezi, R.S. Biofeedback control of photosynthetic lighting using real-time monitoring of leaf chlorophyll fluorescence. Physiol. Plant. 2025, 177, e70073. [Google Scholar] [CrossRef] [PubMed]
  22. Shrestha, S.; Berman, S.R.; Oosterkamp, J.; Marcelis, L.F.; Kaiser, E.; Vialet-Chabrand, S. Elevated [CO2] Affected Fluctuating Light Acclimation in Cucumber Plants by Changes in Specific Leaf Area and Photosynthetic Efficiency. Physiol. Plant. 2025, 177, e70436. [Google Scholar] [CrossRef] [PubMed]
  23. Hendrickson, L.; Furbank, R.T.; Chow, W.S. A simple alternative approach to assessing the fate of absorbed light energy using chlorophyll fluorescence. Photosynth. Res. 2004, 82, 73–81. [Google Scholar] [CrossRef] [PubMed]
  24. Heinz Walz GmbH. Photosynthesis yield analyzer MINI-PAM portable chlorophyll fluorometer. In Handbook of Operation, 2nd ed.; Version 2.155; Heinz Walz GmbH: Effeltrich, Germany, 1999. [Google Scholar]
  25. Wu, Y.-E. Design and implementation of an LED automatic lighting system for plant factories. IEEE Photonics J. 2021, 13, 8100109. [Google Scholar] [CrossRef]
  26. Heinz Walz GmbH. MINI-PAM-II Photosynthesis Yield Analyzer Manual, 6th ed.; Heinz Walz GmbH: Effeltrich, Germany, 2022; Available online: https://www.walz.com/files/downloads/mini_pam_ii_07.pdf (accessed on 10 April 2026).
  27. Kramer, D.M.; Johnson, G.; Kiirats, O.; Edwards, G.E. New fluorescence parameters for the determination of QA redox state and excitation energy fluxes. Photosynth. Res. 2004, 79, 209–218. [Google Scholar] [CrossRef] [PubMed]
  28. Murchie, E.H.; Lawson, T. Chlorophyll fluorescence analysis: A guide to good practice and understanding some new applications. J. Exp. Bot. 2013, 64, 3983–3998. [Google Scholar] [CrossRef] [PubMed]
  29. Morales, A.; Kaiser, E. Photosynthetic acclimation to fluctuating irradiance in plants. Front. Plant Sci. 2020, 11, 268. [Google Scholar] [CrossRef] [PubMed]
  30. Kaiser, E.; Morales, A.; Harbinson, J. Fluctuating light takes crop photosynthesis on a rollercoaster ride. Plant Physiol. 2018, 176, 977–989. [Google Scholar] [CrossRef] [PubMed]
  31. van Iersel, M.; Mattos, E.; Weaver, G.; Ferrarezi, R.; Martin, M.; Haidekker, M. Using chlorophyll fluorescence to control lighting in controlled environment agriculture. Acta Hortic. 2016, 1134, 427–434. [Google Scholar] [CrossRef]
  32. Walters, R.G. Towards an understanding of photosynthetic acclimation. J. Exp. Bot. 2005, 56, 435–447. [Google Scholar] [CrossRef] [PubMed]
  33. Zhen, S.; van Iersel, M.W. Photochemical acclimation of three contrasting species to different light levels: Implications for optimizing supplemental lighting. J. Am. Soc. Hortic. Sci. 2017, 142, 346–354. [Google Scholar] [CrossRef]
  34. Lawson, T.; Blatt, M.R. Stomatal size, speed, and responsiveness impact on photosynthesis and water use efficiency. Plant Physiol. 2014, 164, 1556–1570. [Google Scholar] [CrossRef] [PubMed]
  35. Matuszyńska, A.; Heidari, S.; Jahns, P.; Ebenhöh, O. A mathematical model of non-photochemical quenching to study short-term light memory in plants. Biochim. Biophys. Acta (BBA)-Bioenerg. 2016, 1857, 1860–1869. [Google Scholar] [CrossRef] [PubMed]
  36. Zaks, J.; Amarnath, K.; Kramer, D.M.; Niyogi, K.K.; Fleming, G.R. A kinetic model of rapidly reversible nonphotochemical quenching. Proc. Natl. Acad. Sci. USA 2012, 109, 15757–15762. [Google Scholar] [CrossRef] [PubMed]
  37. Muramatsu, K.; Yoneda, E.; Soyama, N.; López-Ballesteros, A.; Thanyapraneedkul, J. Use of light response curve parameters to estimate gross primary production capacity from chlorophyll indices of global observation satellite and flux data. Sci. Remote Sens. 2024, 10, 100164. [Google Scholar] [CrossRef]
  38. Evans, J.; Jakobsen, I.; Ögren, E. Photosynthetic light-response curves: 2. Gradients of light absorption and photosynthetic capacity. Planta 1993, 189, 191–200. [Google Scholar] [CrossRef]
  39. Long, S.P.; Taylor, S.H.; Burgess, S.J.; Carmo-Silva, E.; Lawson, T.; De Souza, A.P.; Leonelli, L.; Wang, Y. Into the shadows and back into sunlight: Photosynthesis in fluctuating light. Annu. Rev. Plant Biol. 2022, 73, 617–648. [Google Scholar] [CrossRef] [PubMed]
  40. Eilers, P.; Peeters, J. Dynamic behaviour of a model for photosynthesis and photoinhibition. Ecol. Model. 1993, 69, 113–133. [Google Scholar] [CrossRef]
  41. Stevens, J.; Davey, P.; Kasznicki, P.; Hofmann, T.A.; Lawson, T. Green instructions: Intelligent lighting via real-time chlorophyll fluorescence feedback: Enhancing yield and energy efficiency in controlled environment agriculture. Smart Agric. Technol. 2026, 13, 101593. [Google Scholar] [CrossRef]
  42. Paul, M.J.; Foyer, C.H. Sink regulation of photosynthesis. J. Exp. Bot. 2001, 52, 1383–1400. [Google Scholar] [CrossRef] [PubMed]
Figure 1. Air temperature and vapor pressure deficit (VPD) recorded during (A) trial 1 (7–22 April 2024) and (B) trial 2 (21 October–5 November 2024). Solid lines represent daily means, and shaded areas indicate the range between daily minimum and maximum values.
Agriengineering 08 00263 g001
Figure 2. Experimental unit of the biofeedback treatment showing chlorophyll fluorescence measurement on lettuce (Lactuca sativa). A quantum sensor was placed adjacent to the measured leaf and fluorometer at the same height, aligned with the light-emitting diode (LED) bar to ensure equal irradiance.
Agriengineering 08 00263 g002
Figure 3. Electron transport rate (ETR) (AC) and quantum yield of photosystem II (ΦPSII) (DF) under three biofeedback treatments over 16 days after treatment (DAT). Dashed lines indicate the target values (ETR 85 µmol·m−2·s−1, ΦPSII 0.735, or ETR 120 µmol·m−2·s−1), and red shaded areas represent the acceptable target ranges, defined as ±5% for ETR and ±1% for ΦPSII. Panels (A,B,D,E) show results from trial 1, and panels (C,F) show results from trial 2.
Agriengineering 08 00263 g003
Figure 4. Diurnal patterns of electron transport rate (ETR) (AC) and quantum yield of photosystem II (ΦPSII) (DF) under three biofeedback treatments, summarized across 16 days. Data were aggregated across days at each time of day (15 min resolution), with solid lines representing the mean ETR and shaded areas indicating ±1 standard deviation (SD). (A,D): target electron transport rate (ETR) of 85 µmol·m−2·s−1, (B,E): target ΦPSII of 0.735, and (C,F): target ETR of 120 µmol·m−2·s−1. Panels (A,B,D,E) show results from trial 1, and panels (C,F) show results from trial 2.
Agriengineering 08 00263 g004
Figure 5. Photosynthetic photon flux density (PPFD) under three biofeedback and three reference treatments over 16 days after treatment (DAT). (A) target electron transport rate (ETR) of 85 µmol·m−2·s−1; (B) target ΦPSII of 0.735; (C) target ETR of 120 µmol·m−2·s−1. Reference controls included maintaining PPFD at 275 (D) or 420 µmol·m−2·s−1 (F) by adjusting LEDs in response to sunlight and adding 400 µmol·m−2·s−1 supplemental light for 4 h at the beginning and end of the photoperiod (E). Panels (A,B,D,E) show results from trial 1, and panels (C,F) show results from trial 2.
Agriengineering 08 00263 g005
Figure 6. Diurnal patterns of photosynthetic photon flux density (PPFD) under three biofeedback and three reference treatments, summarized across 16 days. Data were aggregated across days at each time of day (15 min resolution), with solid lines representing the mean PPFD and shaded areas indicating ±1 standard deviation (SD). (A) target electron transport rate (ETR) of 85 µmol·m−2·s−1; (B) target ΦPSII of 0.735; (C) target ETR of 120 µmol·m−2·s−1. Reference controls included maintaining PPFD at 275 (D) or 420 µmol·m−2·s−1 (F) by adjusting LEDs in response to sunlight, and adding 400 µmol·m−2·s−1 supplemental light for 4 h at the beginning and end of the photoperiod (E). Panels (A,B,D,E) show results from trial 1, and panels (C,F) show results from trial 2.
Agriengineering 08 00263 g006
Figure 7. Daily light integral (DLI) over 16 days after treatment (DAT) under six supplemental LED lighting treatments in trial 1 and 2.
Agriengineering 08 00263 g007
Figure 8. Quantum yield of photosystem II (ΦPSII) on representative days after treatment (DAT) (AC) and the corresponding photosynthetic photon flux density (PPFD) for those days (DF). Single-day profiles are shown to illustrate diurnal patterns not readily visible in the 16-day overview. All panels show results from trial 2.
Agriengineering 08 00263 g008
Table 1. Light and chlorophyll fluorescence parameters averaged over 16 days in trial 1 and 2. Parameters include daily light integral (DLI), photosynthetic photon flux density (PPFD), electron transport rate (ETR), quantum yield of photosystem II (ΦPSII), quantum yield of non-photochemical quenching (ΦNPQ), and quantum yield of non-regulated energy dissipation (ΦNO).
TrialsTreatmentsDLI
(mol·m−2·day−1)
PPFD
(µmol·m−2·s−1)
ETR
(µmol·m−2·s−1)
ΦPSIIΦNPQΦNO
1ETR 8515.1 ± 0.3283.0 ± 24.186.6 ± 9.20.732 ± 0.0240.078 ± 0.0150.188 ± 0.017
ΦPSII 0.73515.2 ± 1.4286.2 ± 65.486.9 ± 19.70.722 ± 0.0260.090 ± 0.0190.185 ± 0.019
PPFD 27515.2 ± 0.4284.6 ± 28.3
Add 40015.0 ± 1.3279.2 ± 155.6
2ETR 12019.3 ± 1.1447.1 ± 29.8119.8 ± 5.40.639 ± 0.0390.107 ± 0.0170.255 ± 0.031
PPFD 42018.2 ± 0.2420.0 ± 1.5
Values are means ± standard deviations. For DLI, n = 15. For other parameters, n = 939 for trial 1 and n = 733 for trial 2.
Table 2. Example dataset illustrating electron transport rate (ETR)-based biofeedback control.
TimePPFDcETRcETRtETRt/ETRcPPFDt
···
10:0026985.4850.995270
10:1527085.0851.000270
10:3027185.2850.998270
···
12:3027885.0851.000278
12:4520861.5851.382288
13:00427131.0850.649277
13:1521366.0851.287275
13:3027583.5851.018280
···
16:0027284.8851.010272
16:1527384.5851.007274
16:3027184.8851.014272
···
Time: measurement time (hh:mm); PPFDc: current PPFD at the time of measurement (µmol·m−2·s−1); ETRc: current ETR at the time of measurement (µmol·m−2·s−1); ETRt: target ETR (µmol·m−2·s−1); ETRt/ETRc: ratio of target to current ETR; PPFDt: target PPFD calculated by the ETR-based biofeedback logic (µmol·m−2·s−1); “···”: indicates omitted intermediate time points.
Table 3. Example dataset illustrating quantum yield of photosystem II (ΦPSII)-based biofeedback control.
TimePPFDcΦPSII,cΦPSII,tΦPSII,cPSII,tPPFDt
···
10:002280.7290.7350.992228
10:152270.7330.7350.997226
10:302270.7310.7350.995226
···
12:303650.7370.7351.003366
12:453560.6850.7350.932332
13:003410.6620.7350.901307
13:152970.6900.7350.939279
13:302790.7300.7350.993277
···
16:002930.7420.7351.010296
16:152960.7400.7351.007298
16:302960.7450.7351.014300
···
Time: measurement time (hh:mm); PPFDc: current PPFD at the time of measurement (µmol·m−2·s−1); ΦPSII,c: current ΦPSII at the time of measurement; ΦPSII,t: target ΦPSII; ΦPSII,cPSII,t: ratio of current to target ΦPSII; PPFDt: target PPFD calculated by the inverse model without intercept based on PPFDc; “···”: indicates omitted intermediate time points.
Table 4. Growth and energy use parameters measured 16 days after the treatments.
TrialsTreatmentsShoot Fresh Weight (g)Shoot Dry Weight (g)Total Leaf Area (cm2)Leaf Chlorophyll Content (CCI)Total Electricity Use (kWh)Energy-Use Efficiency
(g DW·kWh−1)
1ETR 85122 ± 76.38 ± 0.281969 ± 60 ab13.4 ± 0.2 ab9.810.651 ± 0.029
ΦPSII 0.735128 ± 46.76 ± 0.171945 ± 56 ab13.6 ± 0.3 ab10.230.661 ± 0.017
PPFD 275115 ± 36.26 ± 0.121786 ± 57 b14.5 ± 0.6 a9.090.689 ± 0.013
Add 400123 ± 46.51 ± 0.182068 ± 39 a12.5 ± 0.8 b9.080.717 ± 0.020
p-values0.240.320.00250.028 0.095
2ETR 120147 ± 137.2 ± 0.42459 ± 119 12.160.594 ± 0038
PPFD 420141 ± 136.8 ± 0.42380 ± 119 10.890.622 ± 0.038
p-values0.690.390.64 0.54
Values are means ± standard errors. n = 5 for trial 1 and n = 4 for trial 2. Different letters within each column indicate significant differences at α = 0.05, according to Tukey’s HSD test.
Disclaimer/Publisher’s Note: The statements, opinions and data contained in all publications are solely those of the individual author(s) and contributor(s) and not of MDPI and/or the editor(s). MDPI and/or the editor(s) disclaim responsibility for any injury to people or property resulting from any ideas, methods, instructions or products referred to in the content.