Article

Unmanned Aerial Vehicle Remote Sensing and Machine Learning to Predict Productive and Physiological Traits of Forage Cactus in Semi-Arid Forage Systems

by
Ricardo Macedo da Silva
1,
Mario Adriano Ávila Queiroz
2,
Thieres George Freire da Silva
3,
Juliana Caroline Santos Santana
4,
Stela Antas Urbano
4,
Juliana Cantalino dos Santos
1,
Wagner Martins dos Santos
3,
Antonio Leandro Chaves Gurgel
5,
Felipe Pontes Teixeira das Chagas
4,
Fábio dos Anjos Rezende
1 and
João Virgínio Emerenciano Neto
2,4,*
1
Federal Institute of Education, Science and Technology of the Sertão Pernambucano, Petrolina 56300-000, PE, Brazil
2
Agricultural Sciences Campus, Federal University of Vale São Francisco, Petrolina 56300-000, PE, Brazil
3
Federal Rural University of Pernambuco, Serra Talhada 56909-535, PE, Brazil
4
Academic Unit Specialized in Agrarian Sciences, Federal University of Rio Grande do Norte, Macaíba 59280-000, RN, Brazil
5
Campus Professora Cinobelina Elvas, Federal University of Piauí, Bom Jesus 64900-000, PI, Brazil
*
Author to whom correspondence should be addressed.
AgriEngineering 2026, 8(7), 261; https://doi.org/10.3390/agriengineering8070261
Submission received: 17 April 2026 / Revised: 18 June 2026 / Accepted: 23 June 2026 / Published: 25 June 2026

Abstract

The use of nondestructive technologies combined with machine learning has emerged as a promising approach for estimating structural and productive traits in agricultural systems. This study evaluated the potential of Unmanned Aerial Vehicle (UAV) imagery integrated with the Random Forest algorithm to predict structural, physiological and productive variables of forage cactus cultivated under semi-arid conditions. The experiment was conducted over two years using four varieties: Orelha de Elefante Mexicana (OEM), Miúda, IPA Sertânia and IPA 20. RGB and red–green–near-infrared (RGNir) orthomosaics, along with a digital elevation model, were used to derive spectral and structural variables, which were related to field measurements. Model performance was assessed using the coefficient of determination (R2). The models showed high predictive performance for dry mass production, particularly for OEM, IPA Sertânia and IPA 20 (R2 = 0.85, 0.85 and 0.83). Physiological variables, such as chlorophyll A and B, also showed consistent fits (R2 = 0.70 and 0.83), while structural variables, including height and volume, exhibited lower stability. Differences among varieties affected model accuracy, especially for Miúda, due to its architectural characteristics. The integration of UAV imagery and machine learning provides a reliable approach for monitoring forage cactus, although model performance depends on plant structure.

1. Introduction

Ruminant nutrition relies largely on forage resources, whose productivity varies according to soil conditions, management practices, and edaphoclimatic factors. In semi-arid regions, characterised by prolonged dry periods [1], these constraints limit the productive capacity of livestock systems. In such environments, cultivating forage cactus is a strategic approach to maintaining forage availability. Real-time prediction of forage cactus productivity can support management decisions and optimise livestock production systems.
Arid and semi-arid regions cover approximately 40% of the Earth’s surface and are home to more than two billion people [2]. In these areas, water scarcity restricts the cultivation of conventional crops, highlighting the need for species adapted to such conditions. Forage cactus stands out in this context, with the genera Opuntia and Nopalea being historically the most used due to their adaptation to semi-arid environments and high productive potential [3]. The crassulacean acid metabolism (CAM) of these species reduces water loss and enhances water-use efficiency [4], making them strategic crops for regions with low rainfall indices [5]. The ability to estimate productivity can support feed planning for livestock herds and contribute to more efficient crop management.
The geoprocessing of satellite imagery is an established technology for assessing and monitoring agricultural production. Silva et al. [6] characterised the spectral responses of soil and plant indicators in forage cactus cultivation areas using the Soil-Adjusted Vegetation Index (SAVI) and Leaf Area Index (LAI). They reported a strong correlation between plant height, cladode number, and vegetation indices, which were used as predictive variables in multiple regression models. However, Sentinel-2 satellite imagery offers limited spatial resolution and depends on favourable atmospheric conditions, restricting its use to small areas with minimal cloud interference. In this context, the use of Unmanned Aerial Vehicles (UAVs), commonly known as drones, has gained prominence because they operate below cloud cover, providing greater temporal and spatial flexibility for data collection. This capability enables the acquisition of high-resolution spectral and structural information, supporting more detailed and accurate crop analyses [7].
Machine learning has further expanded the use of remote sensing data in agricultural systems by allowing complex and non-linear relationships between image-derived predictors and plant traits to be modelled. In forage systems, these approaches have been used as non-destructive tools to predict agronomic and nutritional responses and support precision management decisions [8]. Among machine learning algorithms, Random Forest is particularly useful because it combines multiple decision trees, handles interactions among predictors, and reduces sensitivity to noise and overfitting [9].
Although UAV-based remote sensing and machine learning have been increasingly used in agricultural and forage systems, their integrated application to forage cactus remains limited, particularly under semi-arid conditions. Forage cactus has a distinct architecture compared with conventional forage crops, as its productivity is closely related to cladode number, cladode area, plant volume, and differences between Opuntia and Nopalea varieties. These morphological differences may affect the relationship between UAV-derived predictors and field-measured traits, indicating the need for variety-specific modelling. In this context, integrating RGB and RGNir UAV imagery, structural information derived from digital elevation models, and Random Forest modelling represents an innovative strategy to generate predictive information on productive, morphological, and physiological traits of forage cactus, with the potential to reduce dependence on repeated destructive sampling and labour-intensive field assessments.
In forage crops, UAV-based monitoring has shown considerable potential for identifying areas of higher productivity [10], thus enabling harvest optimisation and maximising feed supply for livestock. By tracking the productive performance of forage cactus, it is possible to detect reductions in yield that may indicate, for example, early pest attacks or physiological issues. UAVs allow for the collection of detailed plant information, including structural attributes and spectral indices derived from imaging spectroscopy, enabling centimetre-scale canopy analyses [11] and providing accurate data on crop health and development.
Furthermore, drone-based monitoring makes it possible to evaluate the impact of management practices, such as fertilisation and irrigation, on forage productivity. Based on the collected data, water and nutrient application can be adjusted with greater precision, promoting more efficient resource use and increasing agricultural output. Thus, the objective of this study was to evaluate the use of UAV-derived spectral and canopy-structure variables combined with the Random Forest algorithm to predict productive, morphological, and physiological traits of four forage cactus varieties cultivated under semi-arid conditions.

2. Materials and Methods

2.1. Study Area

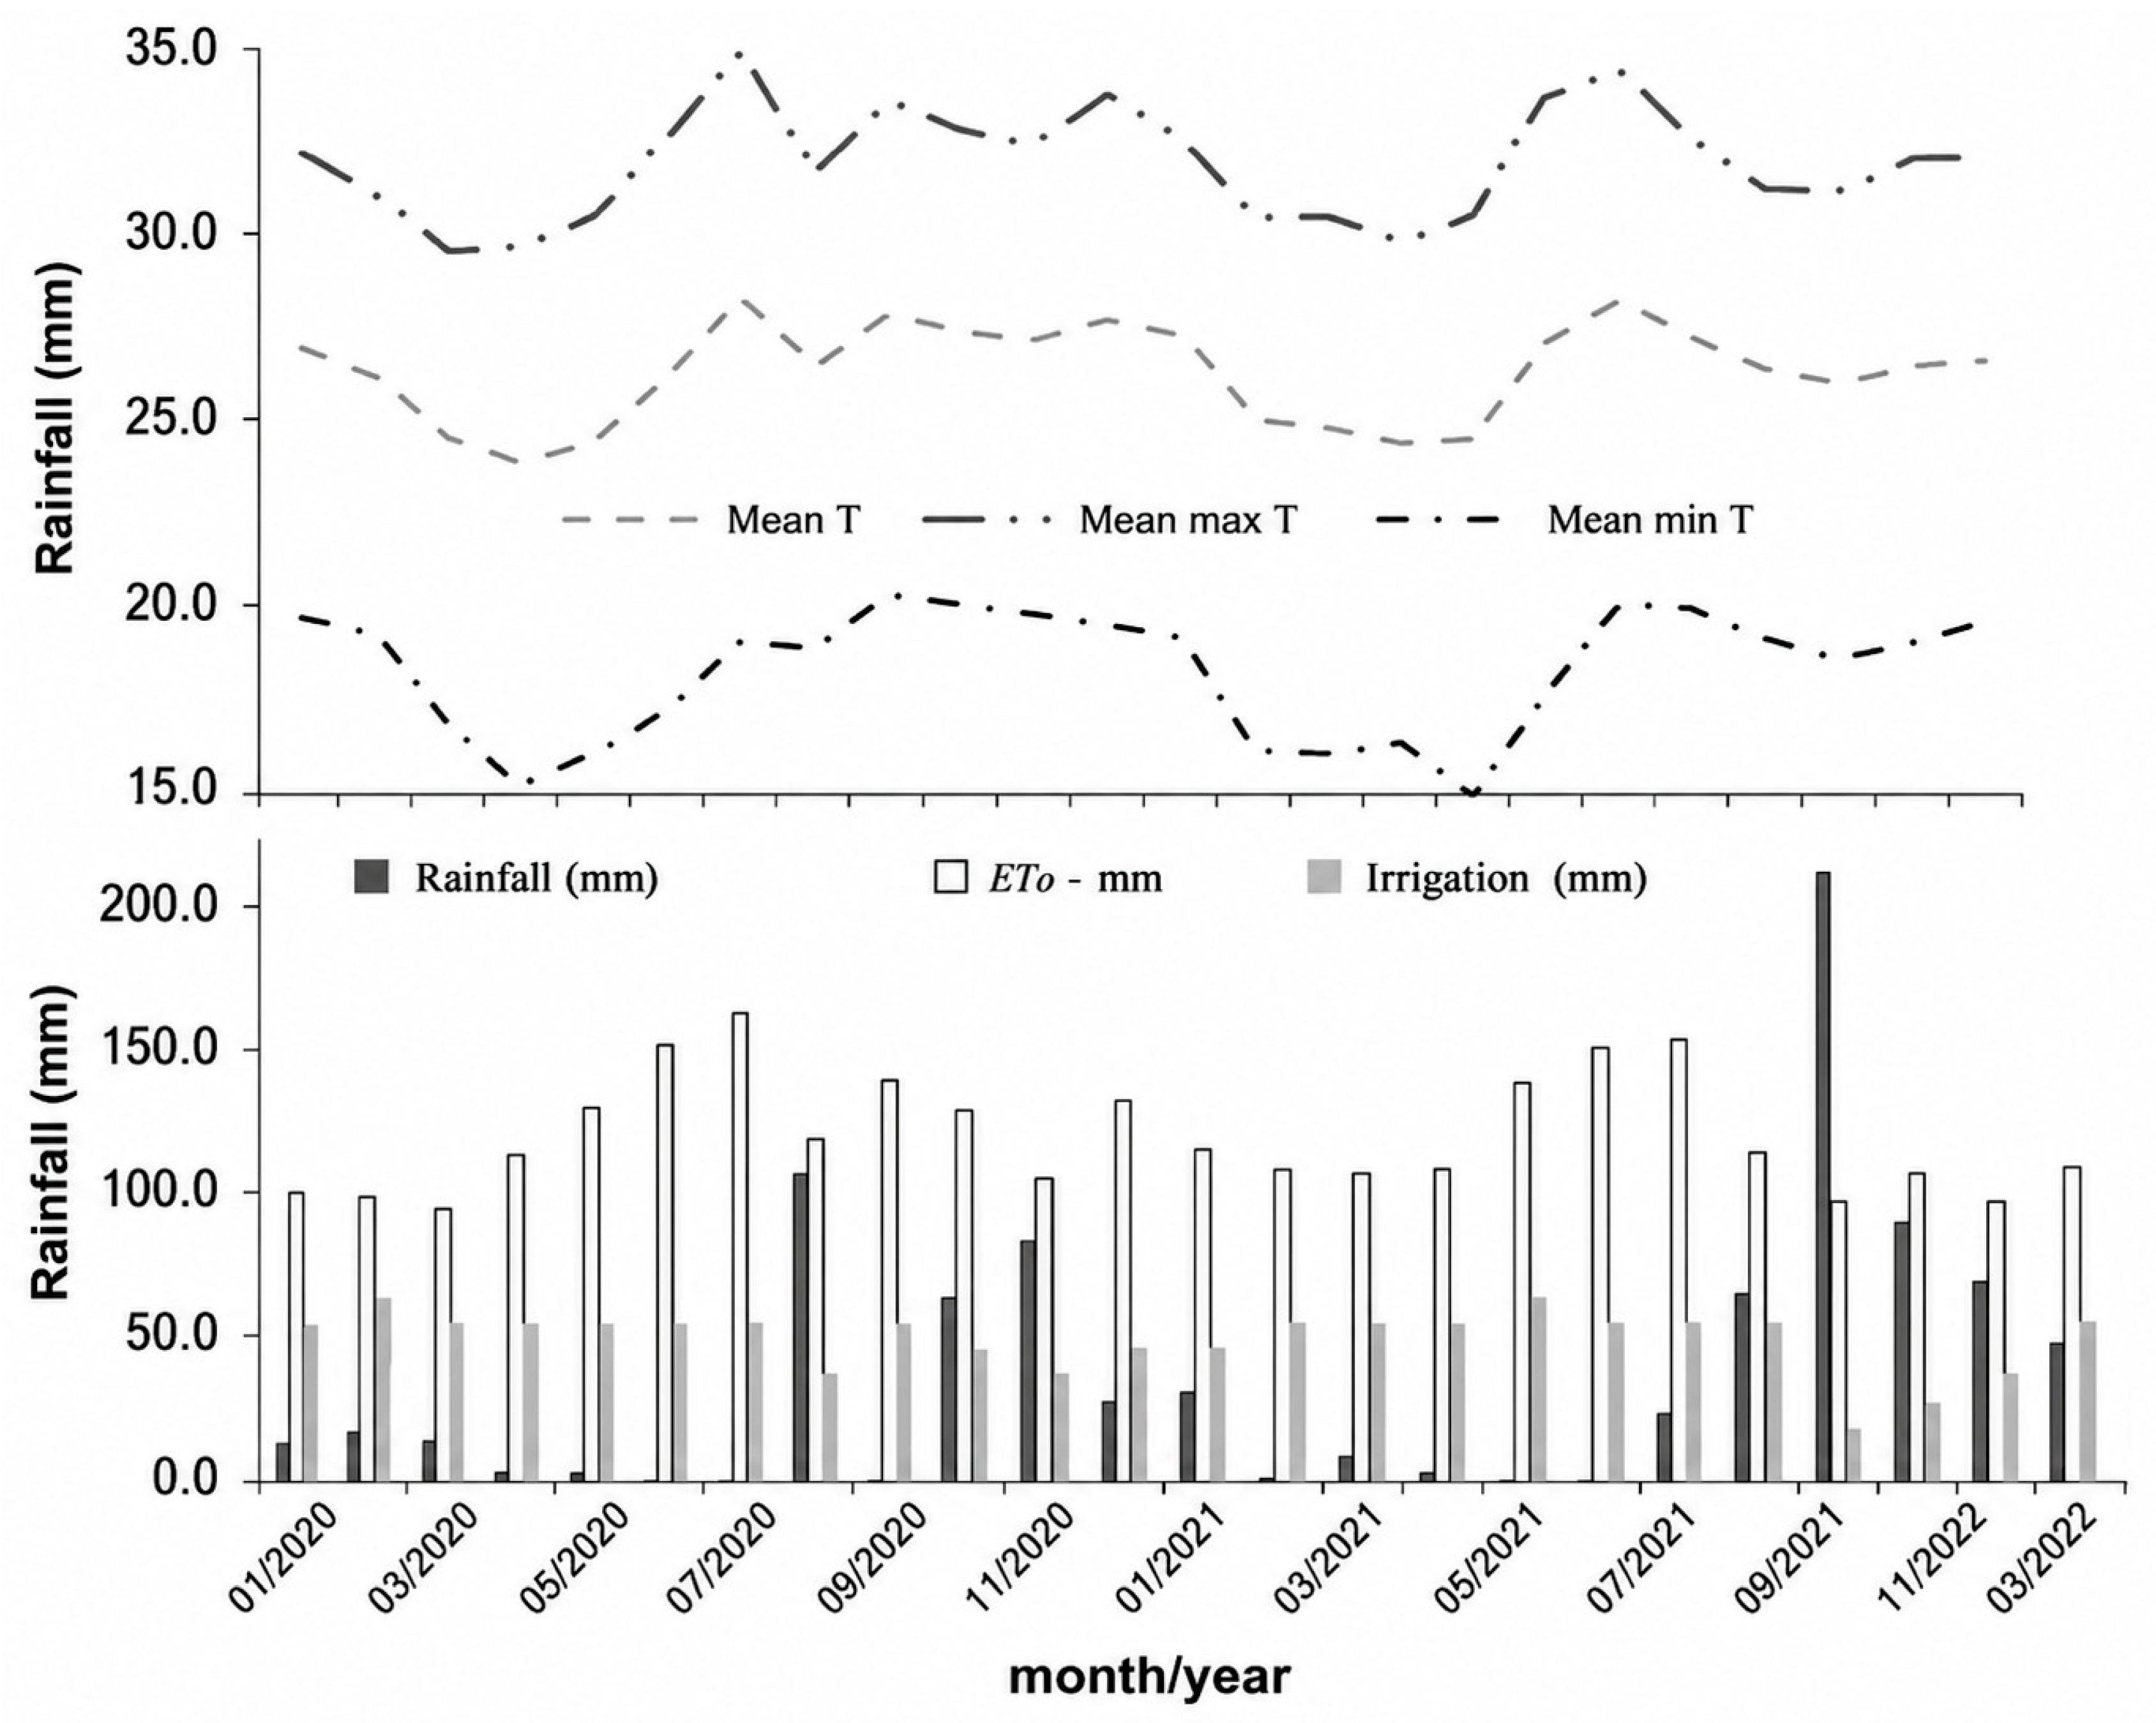
The experiment was conducted at the Federal University of Vale do São Francisco, Agricultural Sciences Campus, near the coordinates 9°19′23.56″ S and 40°33′3.92″ W, at an elevation of 387 m. The region is classified as BSh’ according to the Köppen system, characterised as a hot, dry semi-arid climate with annual rainfall below 500 mm [12]. During the experimental period, mean temperatures ranged from 24 °C (minimum recorded in August 2020) to 28 °C (maximum recorded in December 2020). Average rainfall ranged from less than 1 mm (minimum recorded in August 2020 and September 2021) to 200 mm (maximum recorded in December 2021). Reference evapotranspiration (ET0) remained consistently high throughout the period, ranging from 90 mm (minimum recorded in April 2020 and November 2021) to 155 mm (maximum recorded in October 2020) (Figure 1).

2.2. Experimental Design

Four forage cactus clones were cultivated: Orelha de Elefante Mexicana—OEM (Opuntia stricta (Haw.) Haw), Miúda (or “doce”)—MIU (Nopalea cochenillifera (L.) Salm-Dyck), IPA Sertânia (or “Mão de Moça”)—IPA (Nopalea cochenillifera (L.) Salm-Dyck), and IPA 20 (Opuntia ficus-indica (L.) Mill). All varieties were irrigated via drip irrigation. Plant spacing was 20 cm within rows and 1.80 m between rows. The cultivation system adopted was agroecological. Drone flights were conducted at 6, 12, 18, and 24 months after planting.
Morphological and productive characteristics of the cactus plants were obtained simultaneously with each flight (Table 1). Within each evaluated row, four replicates composed of five plants were selected. These plants were measured for height (cm), taken from the soil surface to the highest cladode, and width (cm), measured between the two most distant extremities of the cladode. From these five plants, the central plant was harvested and taken to the laboratory for determination of cladode length, width, perimeter, thickness, cladode mass, and total plant mass. Each cladode was classified according to its insertion order on the plant.
After harvesting the central plant of each plot, all cladodes were separated and weighed to determine fresh mass per cladode (g) and total plant fresh mass (kg). Each cladode was then identified according to its insertion order and taken to the laboratory for dry mass determination. The material was oven-dried at 65 °C with forced-air circulation until constant weight, allowing the calculation of individual dry mass (g). Dry matter content was calculated for each cladode as the ratio between dry mass and fresh mass. Total dry mass yield (total DMY, ton ha−1) was estimated based on the sum of the dry mass of all cladodes per plant and the plant density within the usable plot area. Additionally, the mean dry mass per cladode (g plant−1) was obtained by dividing the total plant dry mass by the total number of cladodes.
Cladode area (CA, cm2) was measured to estimate the cladode area index (CAI, m2 m−2). Specific equations were required for each variety. To calculate CAI, the total cladode area of each plant was divided by the row spacing [13]. Equations used for OEM and IPA 20 (1), MIU (2), and IPA Sertânia (3) were as follows:
CAOEM e IPA 20 = 0.7086 × (1 − exp(−0.000045765 × CL × CW))/0.000045765
CAMIU = 0.7198 × CL × CW
CAIPA Sertânia = 1.6694 × (1 − exp (0.0243 × CP))/−0.0243
CAI = ( i = 1 n C A ) / 10,000 ( S 1 × S 2 )
where: cladode length (CL, cm)—measured from the base to the apex; cladode width (CW, cm)—measured from one end to the other in the middle region of the cladode; cladode perimeter (CP, cm)—measured using a measuring tape around the circumference of the cladode. CAI is the cladode area index, expressed in m2 m−2:
CAI = ΣCA/[10,000 × (S1 × S2)]
where ΣCA is the total cladode area per plant (cm2), 10,000 is the conversion factor from cm2 to m2, and S1 × S2 represents the ground area occupied by each plant, calculated from the spacing between rows and between plants.
Chlorophyll a and b contents were measured using an electronic chlorophyll metre (Clorofilog CFL 1030, Falker Automação Agrícola Ltda., Porto Alegre, Brazil®).

2.3. Datasets and Image Processing

Aerial photographs were acquired using a DJI Phantom IV Pro multirotor UAV (DJI, Shenzhen, China). The flight was planned in DJI Pilot at an altitude of 40 m, with 80% side overlap and 70% forward overlap. The flight speed was set at 10 m/s. All flight procedures followed the regulations established by the Brazilian National Civil Aviation Agency (ANAC) [14], the authority responsible for UAV operations in Brazil.
Ground control points (GCPs) were distributed around the experimental area. They were made from wooden boards measuring 50 × 50 cm, painted with four alternating black and white squares. Concrete markers measuring 10 cm in diameter, containing a central fixed screw and painted in alternating colours similar to the wooden boards, except using red paint, were also installed.
GCPs are photo-identifiable points, objects, targets, or terrain features, that appear in the aerial images. These points were used to correct the drone imagery by matching the image coordinate system to the ground coordinate system during processing. GCP georeferencing was performed using a conventional survey approach with a Spectra Precision SP80 GNSS receiver (Spectra Precision, Westminster, CO, USA), which allows GNSS positioning with an accuracy of 10 mm = 1.5 ppm × D, using all available GNSS signals.
Two types of cameras were used for the surveys: the Phantom IV’s onboard RGB camera (red, green, and blue) and a Mapir® RGNir (red, green, and near-infrared) (MAPIR, San Diego, CA, USA) camera mounted on the UAV. Calibration of the Mapir® camera was performed using a reflectance calibration panel from the same manufacturer, containing reference surfaces with known reflectance values. Calibration of the RGNir images was carried out using the “Mapir Camera Control” software version 10/16/2019.
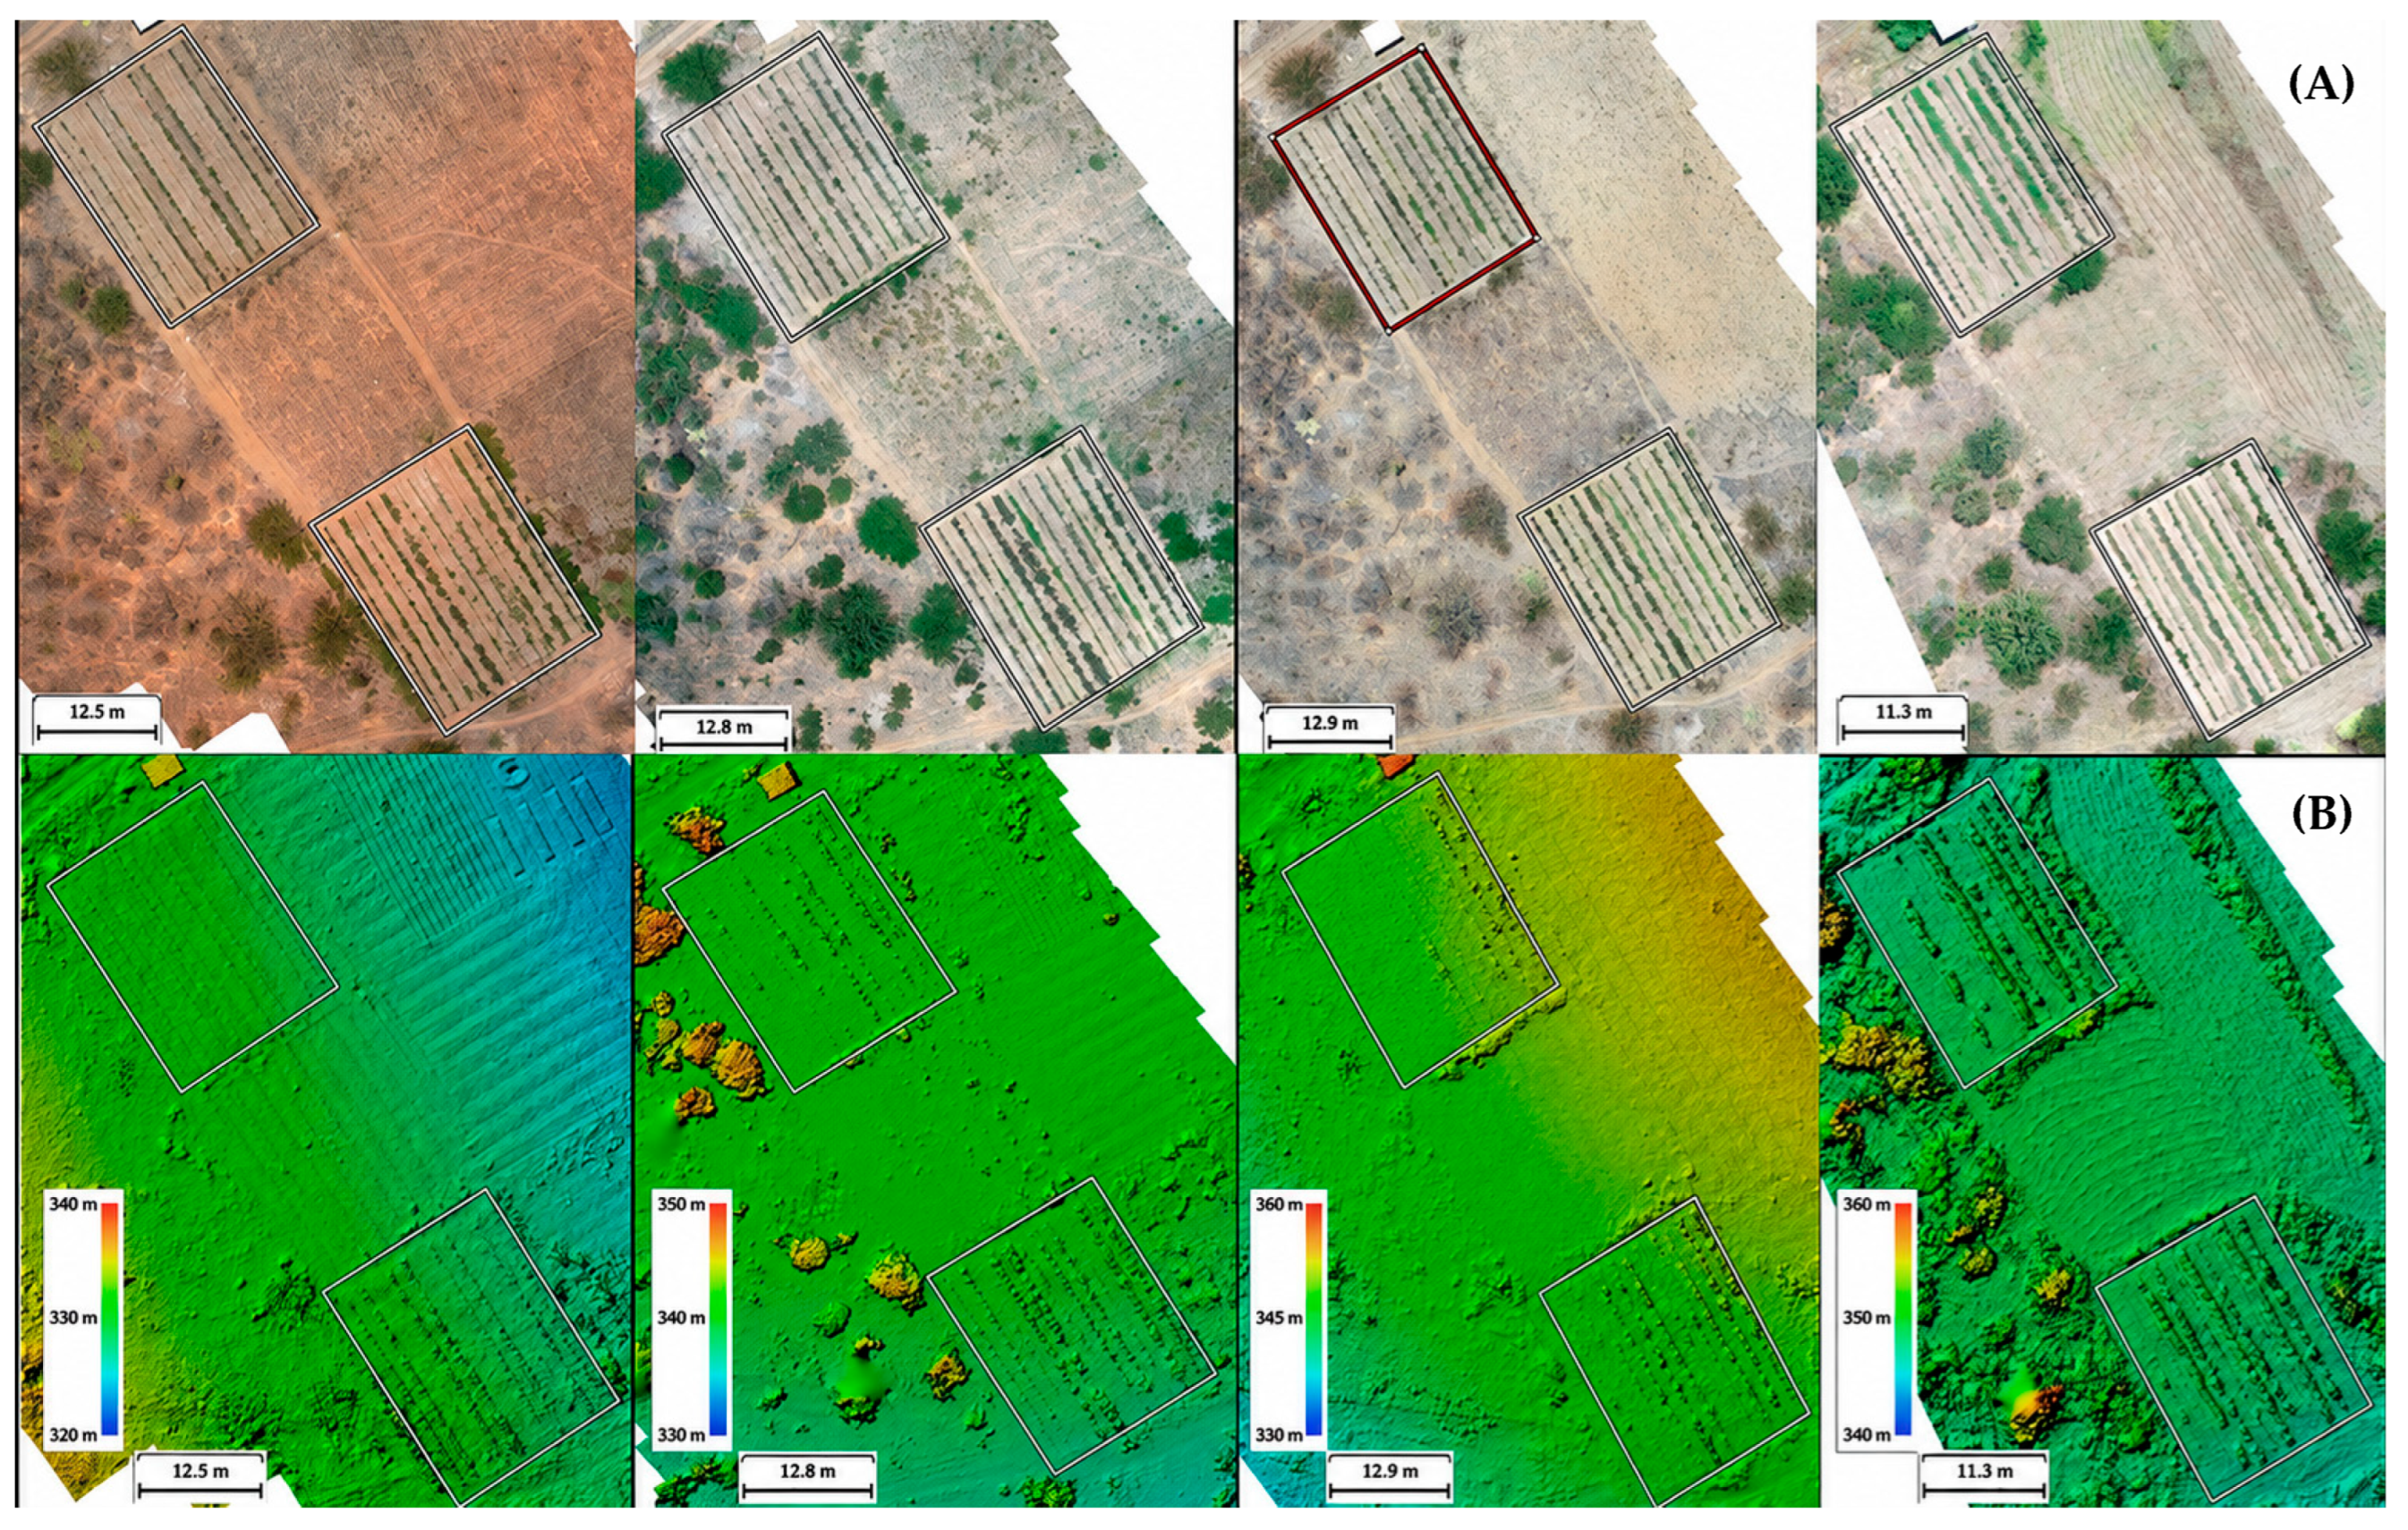
All images captured by the UAV were processed in Agisoft PhotoScan version 1.5.5 on a computer equipped with an Intel Core i5 processor (Intel Corporation, Santa Clara, CA, USA), 8 GB RAM, and an NVIDIA graphics card. Image processing included photo alignment, dense point-cloud generation, creation of the digital elevation model (DEM), and generation of the orthomosaic. Medium-quality settings were used for all processing steps (Figure 2). The final images were corrected using the ground control points.
After processing in Agisoft, the orthomosaics (RGB and RGNir) and the Digital Elevation Models (DEMs) were exported to Quantum GIS (QGIS) version 3.8.0. The vegetation index values were computed using the QGIS “Raster Calculator,” which was used to derive the vegetation indices listed in Table 2.
After calculating the vegetation indices, a sampling grid with 0.2 × 0.2 m cells was generated, and the “zonal statistics” tool was applied. For each raster layer of interest, the mean and maximum pixel values within each cell were extracted, yielding the vegetation index information.
A Random Forest model (RF) was proposed using the ranger package version 0.16.0 [19] in R version 4.3.2 (R Core Team, 2023) [20]. The algorithm fits regression and classification models by combining multiple individual and independent decision trees.
The main Random Forest parameters tuned were: num.trees, the total number of trees built; mtry, the number of variables considered at each split; min.node.size, the minimum size of terminal nodes; max.depth, the maximum tree depth; and sample.fraction, the fraction of samples used to construct each tree. For each clone and response variable, a specific combination of these parameters was adopted, as presented in Appendix A (Table A1).
To ensure that increased model complexity did not lead to overfitting, the dataset was split into training (80%) and testing (20%) subsets. This procedure ensures that the trained model generalises to new data represented by the test set [21]. During parameter tuning, a search grid with 70,000 parameter combinations was employed using 10-fold cross-validation generated from the training data. In this method, the data are divided into n groups, and the model is iteratively validated once in each group, while the remaining n − 1 groups are used for training [22]. This procedure ensures that the test data are used only for final model evaluation. Model performance was evaluated using mean absolute error (MAE), root mean squared error (RMSE), mean absolute percentage error (MAPE), and the coefficient of determination (R2). MAE reflects the average prediction error; RMSE highlights larger errors; and MAPE expresses errors as percentages, allowing comparisons across traits. These metrics jointly describe model accuracy, precision, and proportional deviation between predicted and observed values.
For species-level comparisons, statistical analyses were performed using SAS software version 9.0. Analysis of variance was conducted using PROC ANOVA and PROC GLM, and Pearson’s correlation was obtained using PROC CORR. Spearman correlation analyses were applied between the structural and agronomic traits of forage cactus and their vegetation indices. Correlation strength was classified as very strong (r ≥ 0.8), strong (0.6 ≤ r < 0.8), moderate (0.4 ≤ r < 0.6), weak (0.2 ≤ r < 0.4), and negligible (r < 0.2); the same classification was applied to negative correlations.

3. Results

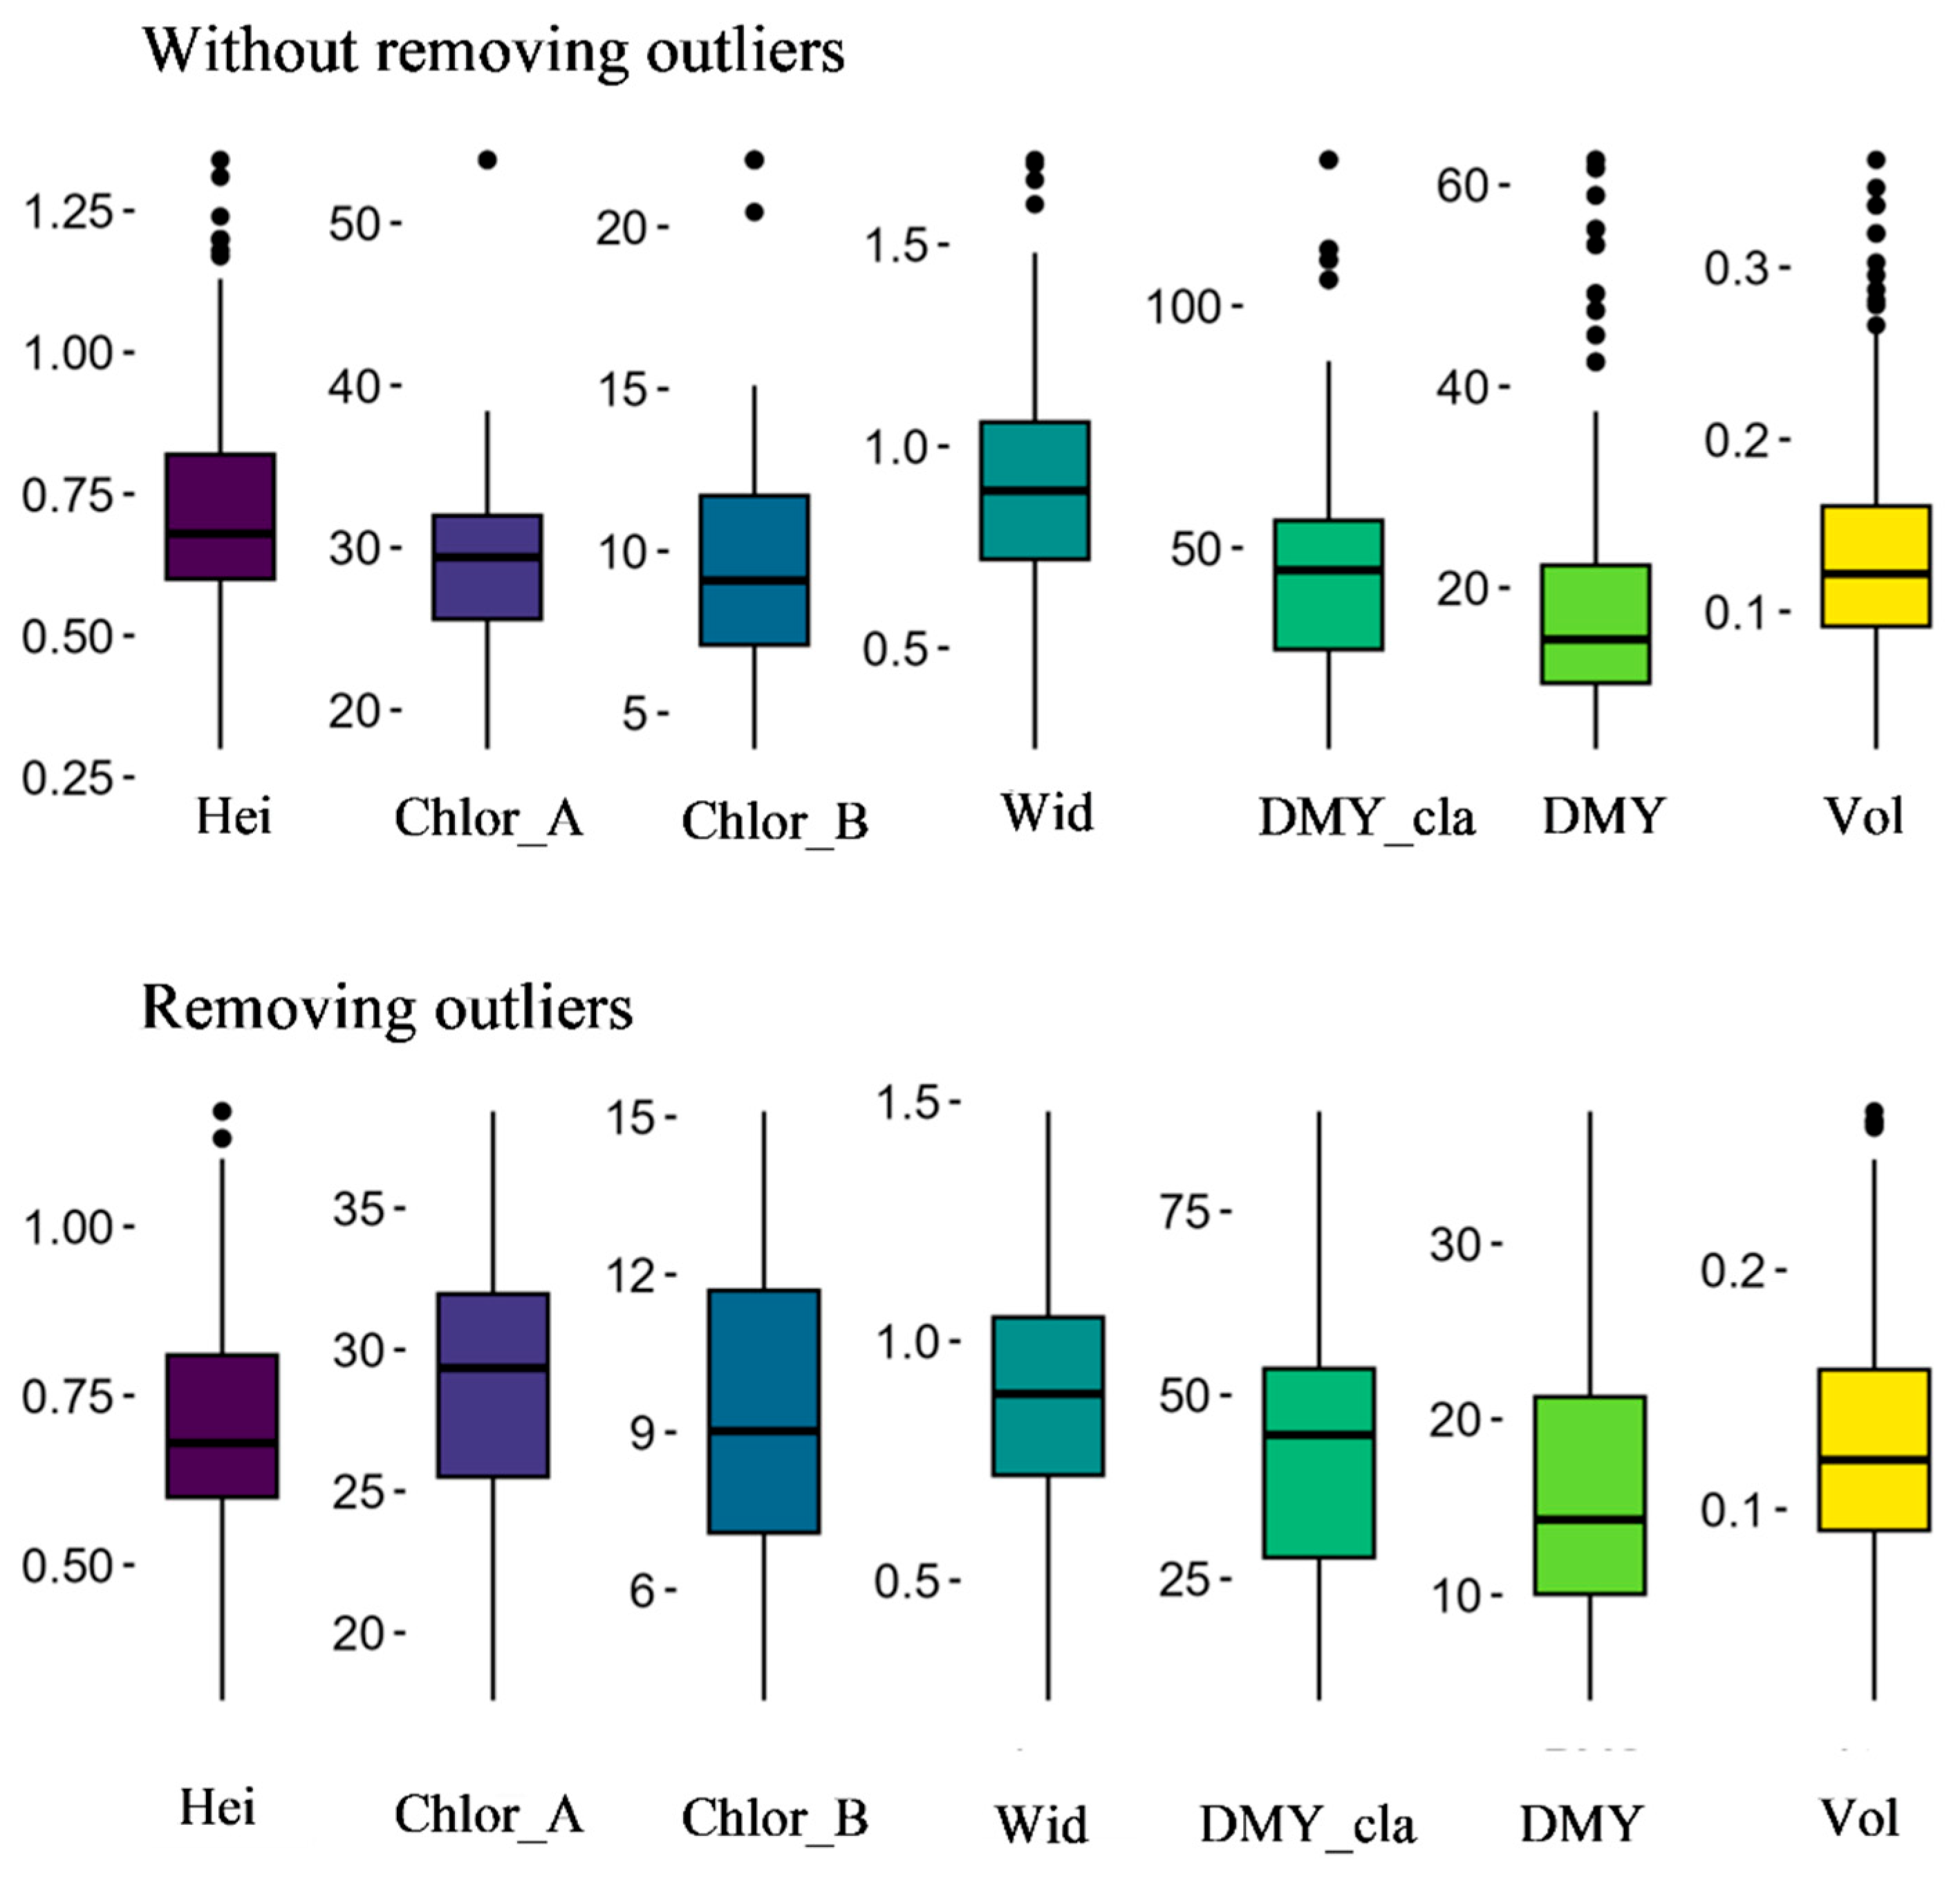
The distribution of structural, physiological, and productive variables was first evaluated to identify extreme values that could affect model fitting (Figure 3). A filtering procedure was then applied separately for each variable, removing observations located at the lower and upper extremes of the distribution, corresponding to 5% in each tail and 10% of observations in total for each variable. This procedure was applied at the variable level and not to the entire dataset simultaneously, avoiding disruption of the relationship among predictors and response variables. This approach reduced the influence of extreme values while preserving the central variability of the dataset. After filtering, the data showed a greater concentration of values around the median, particularly for height, dry mass per cladode, total dry mass, and volume. These variables showed wider dispersion before filtering, indicating that productive and structural traits were more affected by extreme observations than chlorophyll A and B, which presented comparatively narrower distributions.
The adjusted variables ranged from 0.60 to 0.81 for plant height, 25.46 to 31.90 for chlorophyll A, 6.08 to 11.68 for chlorophyll B, 0.71 to 1.05 for cladode width, 27.9 to 78.41 for dry mass per cladode, 10.0 to 31.36 for total dry mass, and 0.10 to 0.16 for volume, reflecting the central distribution representative of the sampled population. These ranges indicate that the filtering procedure retained variation among structural, physiological, and productive traits while reducing the effect of extreme observations. The narrower ranges observed for chlorophyll A and B suggest greater physiological uniformity among plants, whereas dry mass per cladode, total dry mass, and volume maintained wider variation, reflecting differences in plant size and productive structure within the evaluated dataset.
The overall correlation analysis showed that total dry mass had positive but weak correlations with UAV-derived spectral indices, particularly mean GLI and mean VARI (Table 3). DMY was positively correlated with mean VARI (r = 0.25; p < 0.01), maximum VARI (r = 0.16; p < 0.01), mean GLI (r = 0.26; p < 0.01), and maximum GLI (r = 0.18; p < 0.01). Lower correlations were observed for mean NDVI (r = 0.09; p < 0.05) and maximum NDVI (r = 0.13; p < 0.01). Among the structural variables, width (r = 0.33; p < 0.01) and volume (r = 0.25; p < 0.01) were associated with DMY. The highest correlation was observed between DMY and the cladode area index (CAI; r = 0.73; p < 0.01).
In contrast to the weak associations observed for spectral indices, the strong correlation between DMY and CAI indicates that, in the overall dataset, dry mass production was more closely related to plant architecture and cladode surface development than to isolated spectral responses. The positive correlations between DMY, number of cladodes (r = 0.65; p < 0.01), and CAI also show that productive performance was associated with the structural expansion of the plant, rather than with a single UAV-derived vegetation index.
The correlation data by forage cactus variety for dry mass production (Table 4) show distinct relationships among cultivars. Spectral indices showed weak to moderate associations with DMY, with VARI being more relevant for OEM and IPA Sertânia, reaching r = 0.32 and r = 0.36, respectively. In contrast, GLI was more associated with DMY in Miúda and IPA 20, although with lower coefficients (r = 0.31 and r = 0.21, respectively). NDVI showed positive correlations with DMY only in OEM, with r = 0.25 for mean NDVI and r = 0.24 for maximum NDVI, whereas its associations were weak or absent in the other varieties. CI showed negative correlations with DMY only in IPA Sertânia, with r = −0.25 for mean CI and r = −0.19 for maximum CI. These results indicate that the spectral response associated with dry mass production varied according to the variety and the vegetation index considered.
Among the UAV-derived structural variables, estimated width showed the strongest association with DMY in OEM (r = 0.52), while weaker and less consistent relationships were observed for the other varieties. Estimated height and volume were negatively correlated with DMY in IPA Sertânia, indicating that UAV-derived structural predictors did not show a uniform pattern across varieties. Field-derived structural traits showed stronger and more consistent associations with DMY than spectral indices. The cladode area index was strongly correlated with DMY in OEM and IPA 20 (r = 0.82 and r = 0.86, respectively), while the number of cladodes showed the strongest association with DMY in Miúda (r = 0.91). In IPA Sertânia, the number of cladodes also showed a strong correlation with DMY (r = 0.82), while CAI showed a moderate association (r = 0.57). These patterns show that dry mass accumulation was more closely associated with field-measured structural traits, especially CAI and number of cladodes, than with individual spectral indices. These results indicate that dry mass accumulation in forage cactus is strongly related to plant architecture and cladode development, and that the relationship between UAV-derived predictors and DMY depends on the morphological characteristics of each variety.
The correlation matrix for plant height (Table 5) also showed distinct relationships among cultivars. Associations between observed height and UAV-derived spectral indices were generally weak, with the highest coefficients observed for GLI in Miúda (r = 0.33) and CI in IPA 20 (r = 0.22). These low coefficients indicate that spectral indices were not strong indicators of plant height, regardless of variety. Among UAV-derived structural variables, estimated height showed weak correlations with observed height in Miúda and IPA 20 (r = 0.25 and r = 0.26, respectively), whereas estimated volume was more associated with observed height in Miúda (r = 0.35). For OEM, the correlation between estimated height and observed height was negligible (r = 0.06), and for IPA Sertânia this association was negative (r = −0.25), showing that UAV-derived height did not consistently represent field-measured height across varieties. In contrast, field-measured structural variables showed stronger relationships with observed height, particularly observed volume across all varieties (r ≥ 0.81) and observed width in IPA Sertânia (r = 0.53). The strongest and most stable association was observed between field-measured volume and observed height, with correlations ranging from 0.81 to 0.84 among varieties. This pattern indicates that plant height was more closely related to the three-dimensional structure measured in the field than to height or volume estimated from the UAV-derived digital elevation model. These results suggest that UAV-derived variables captured part of the vertical and canopy-structure variation, but their direct association with plant height was less consistent than that observed among field-measured structural traits. Therefore, the correlation results already indicate a limitation of the UAV-derived structural variables, especially estimated height, for representing the architecture of forage cactus plants.
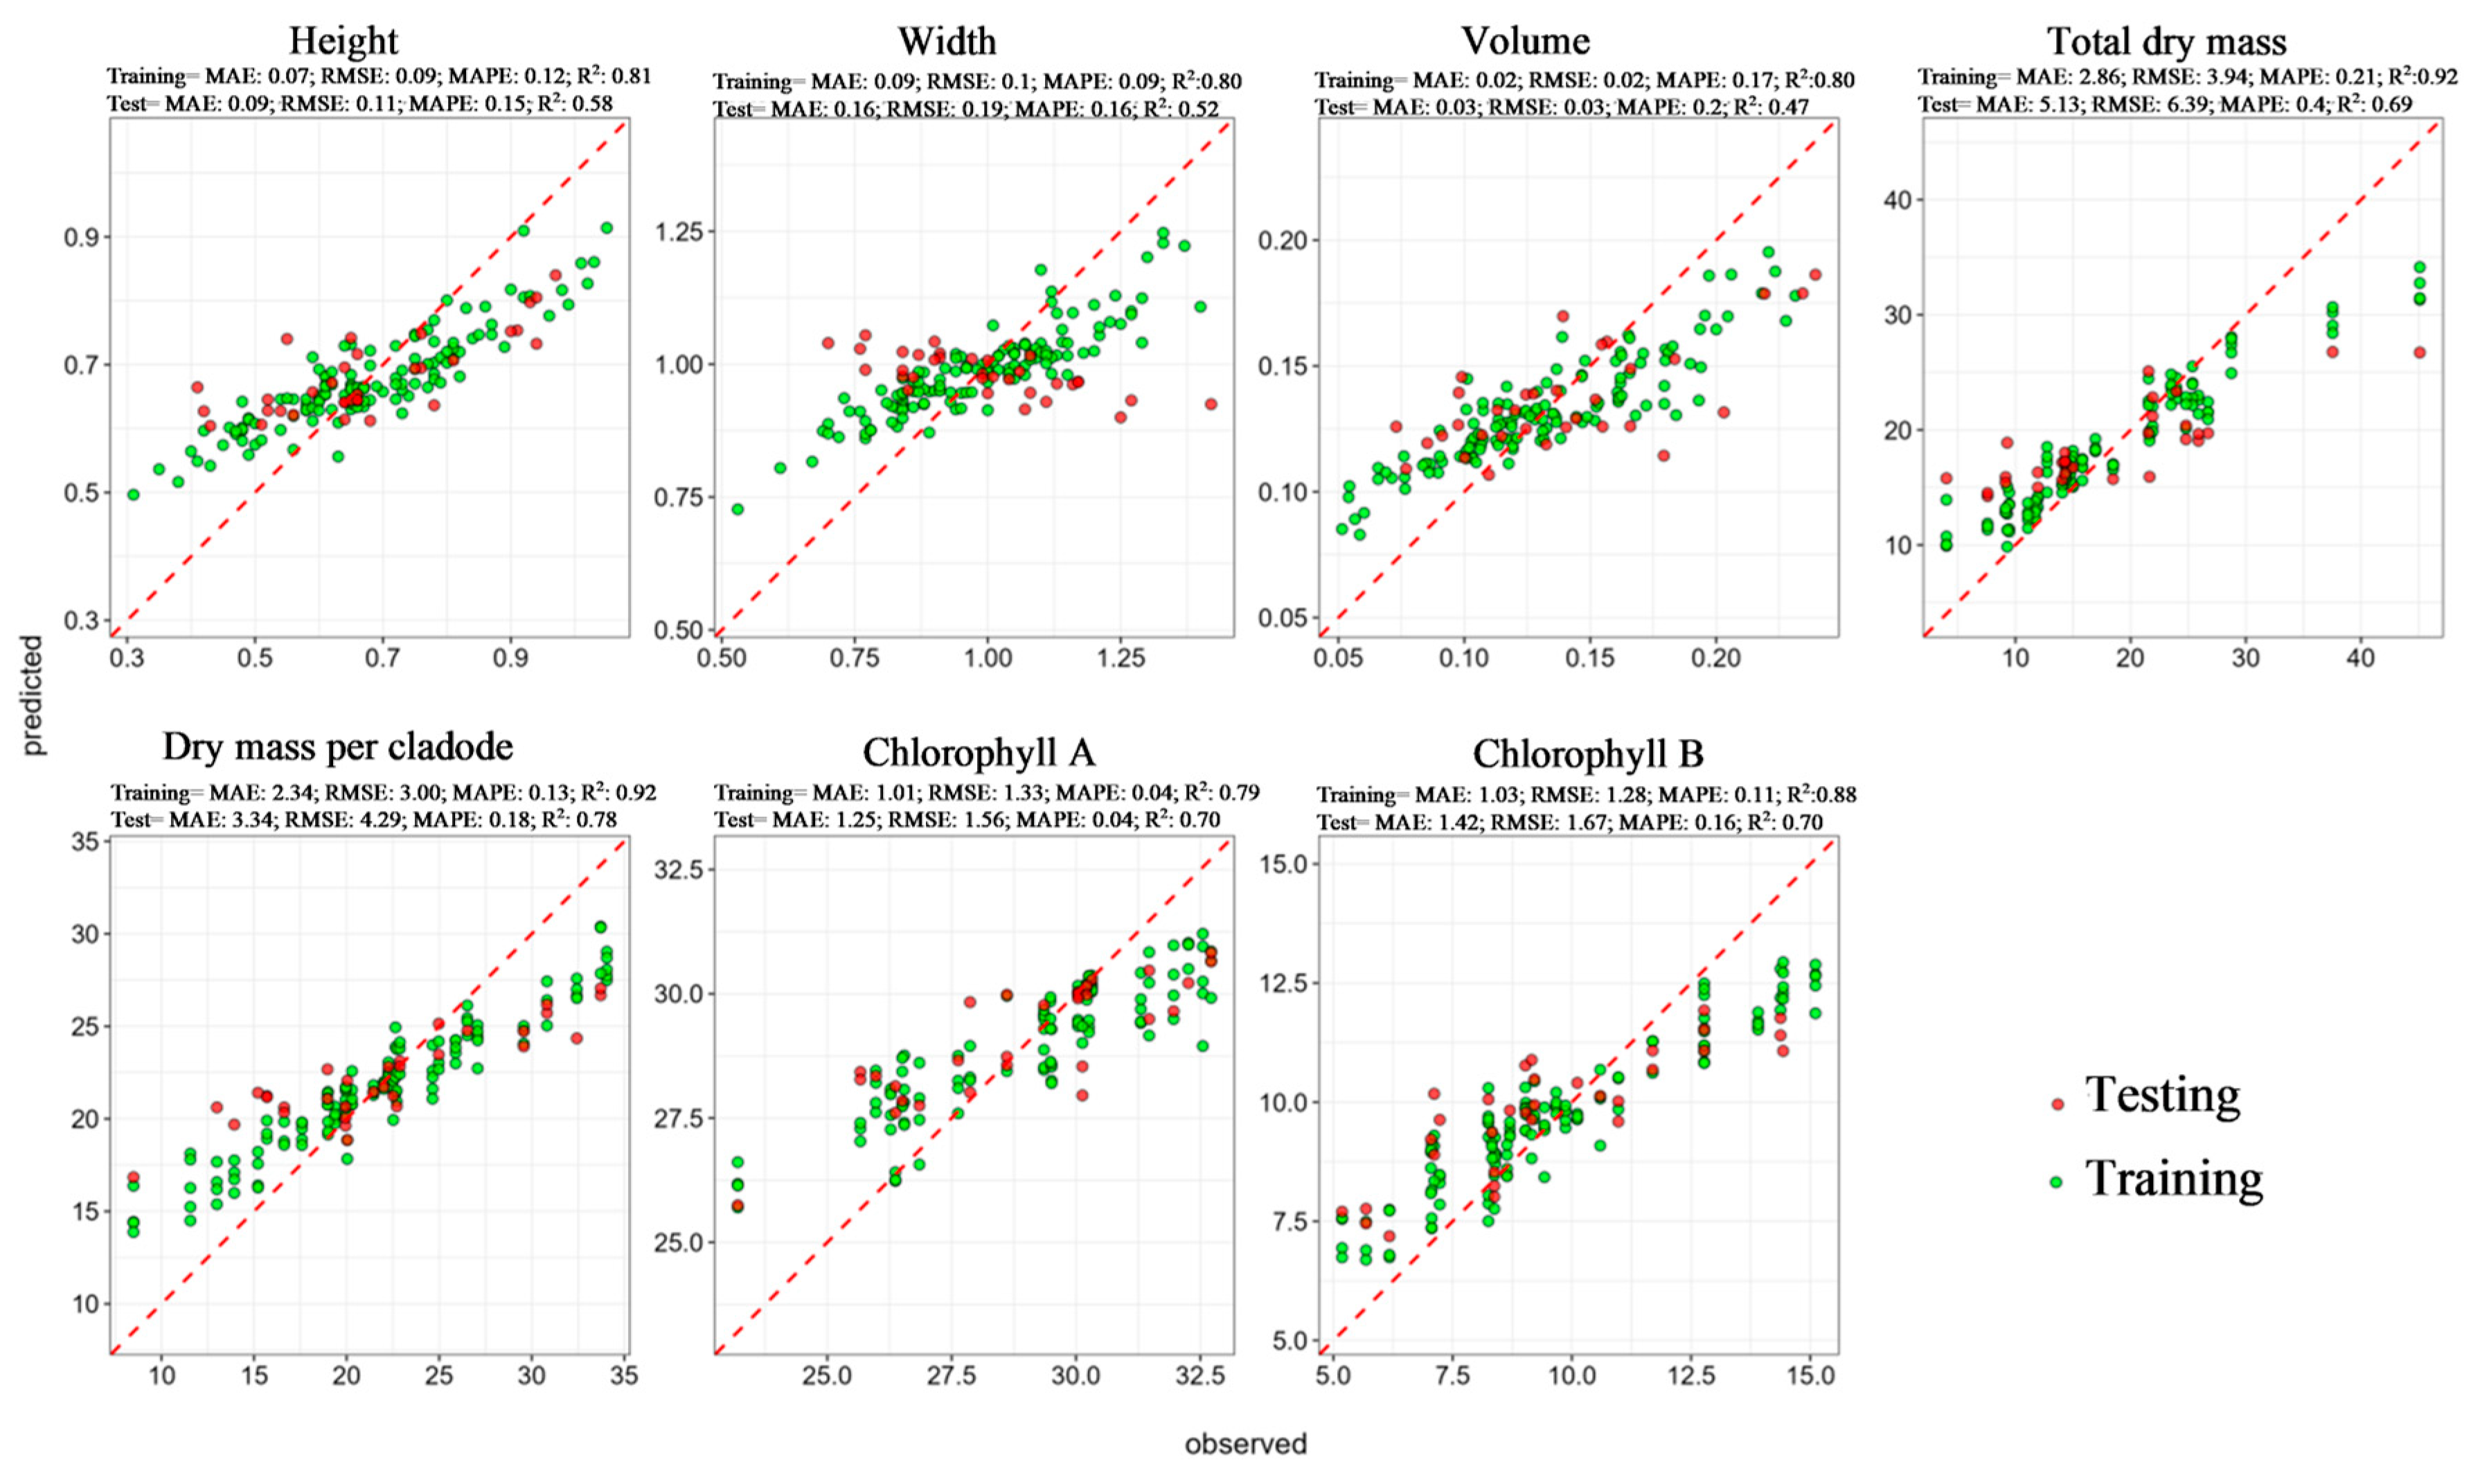
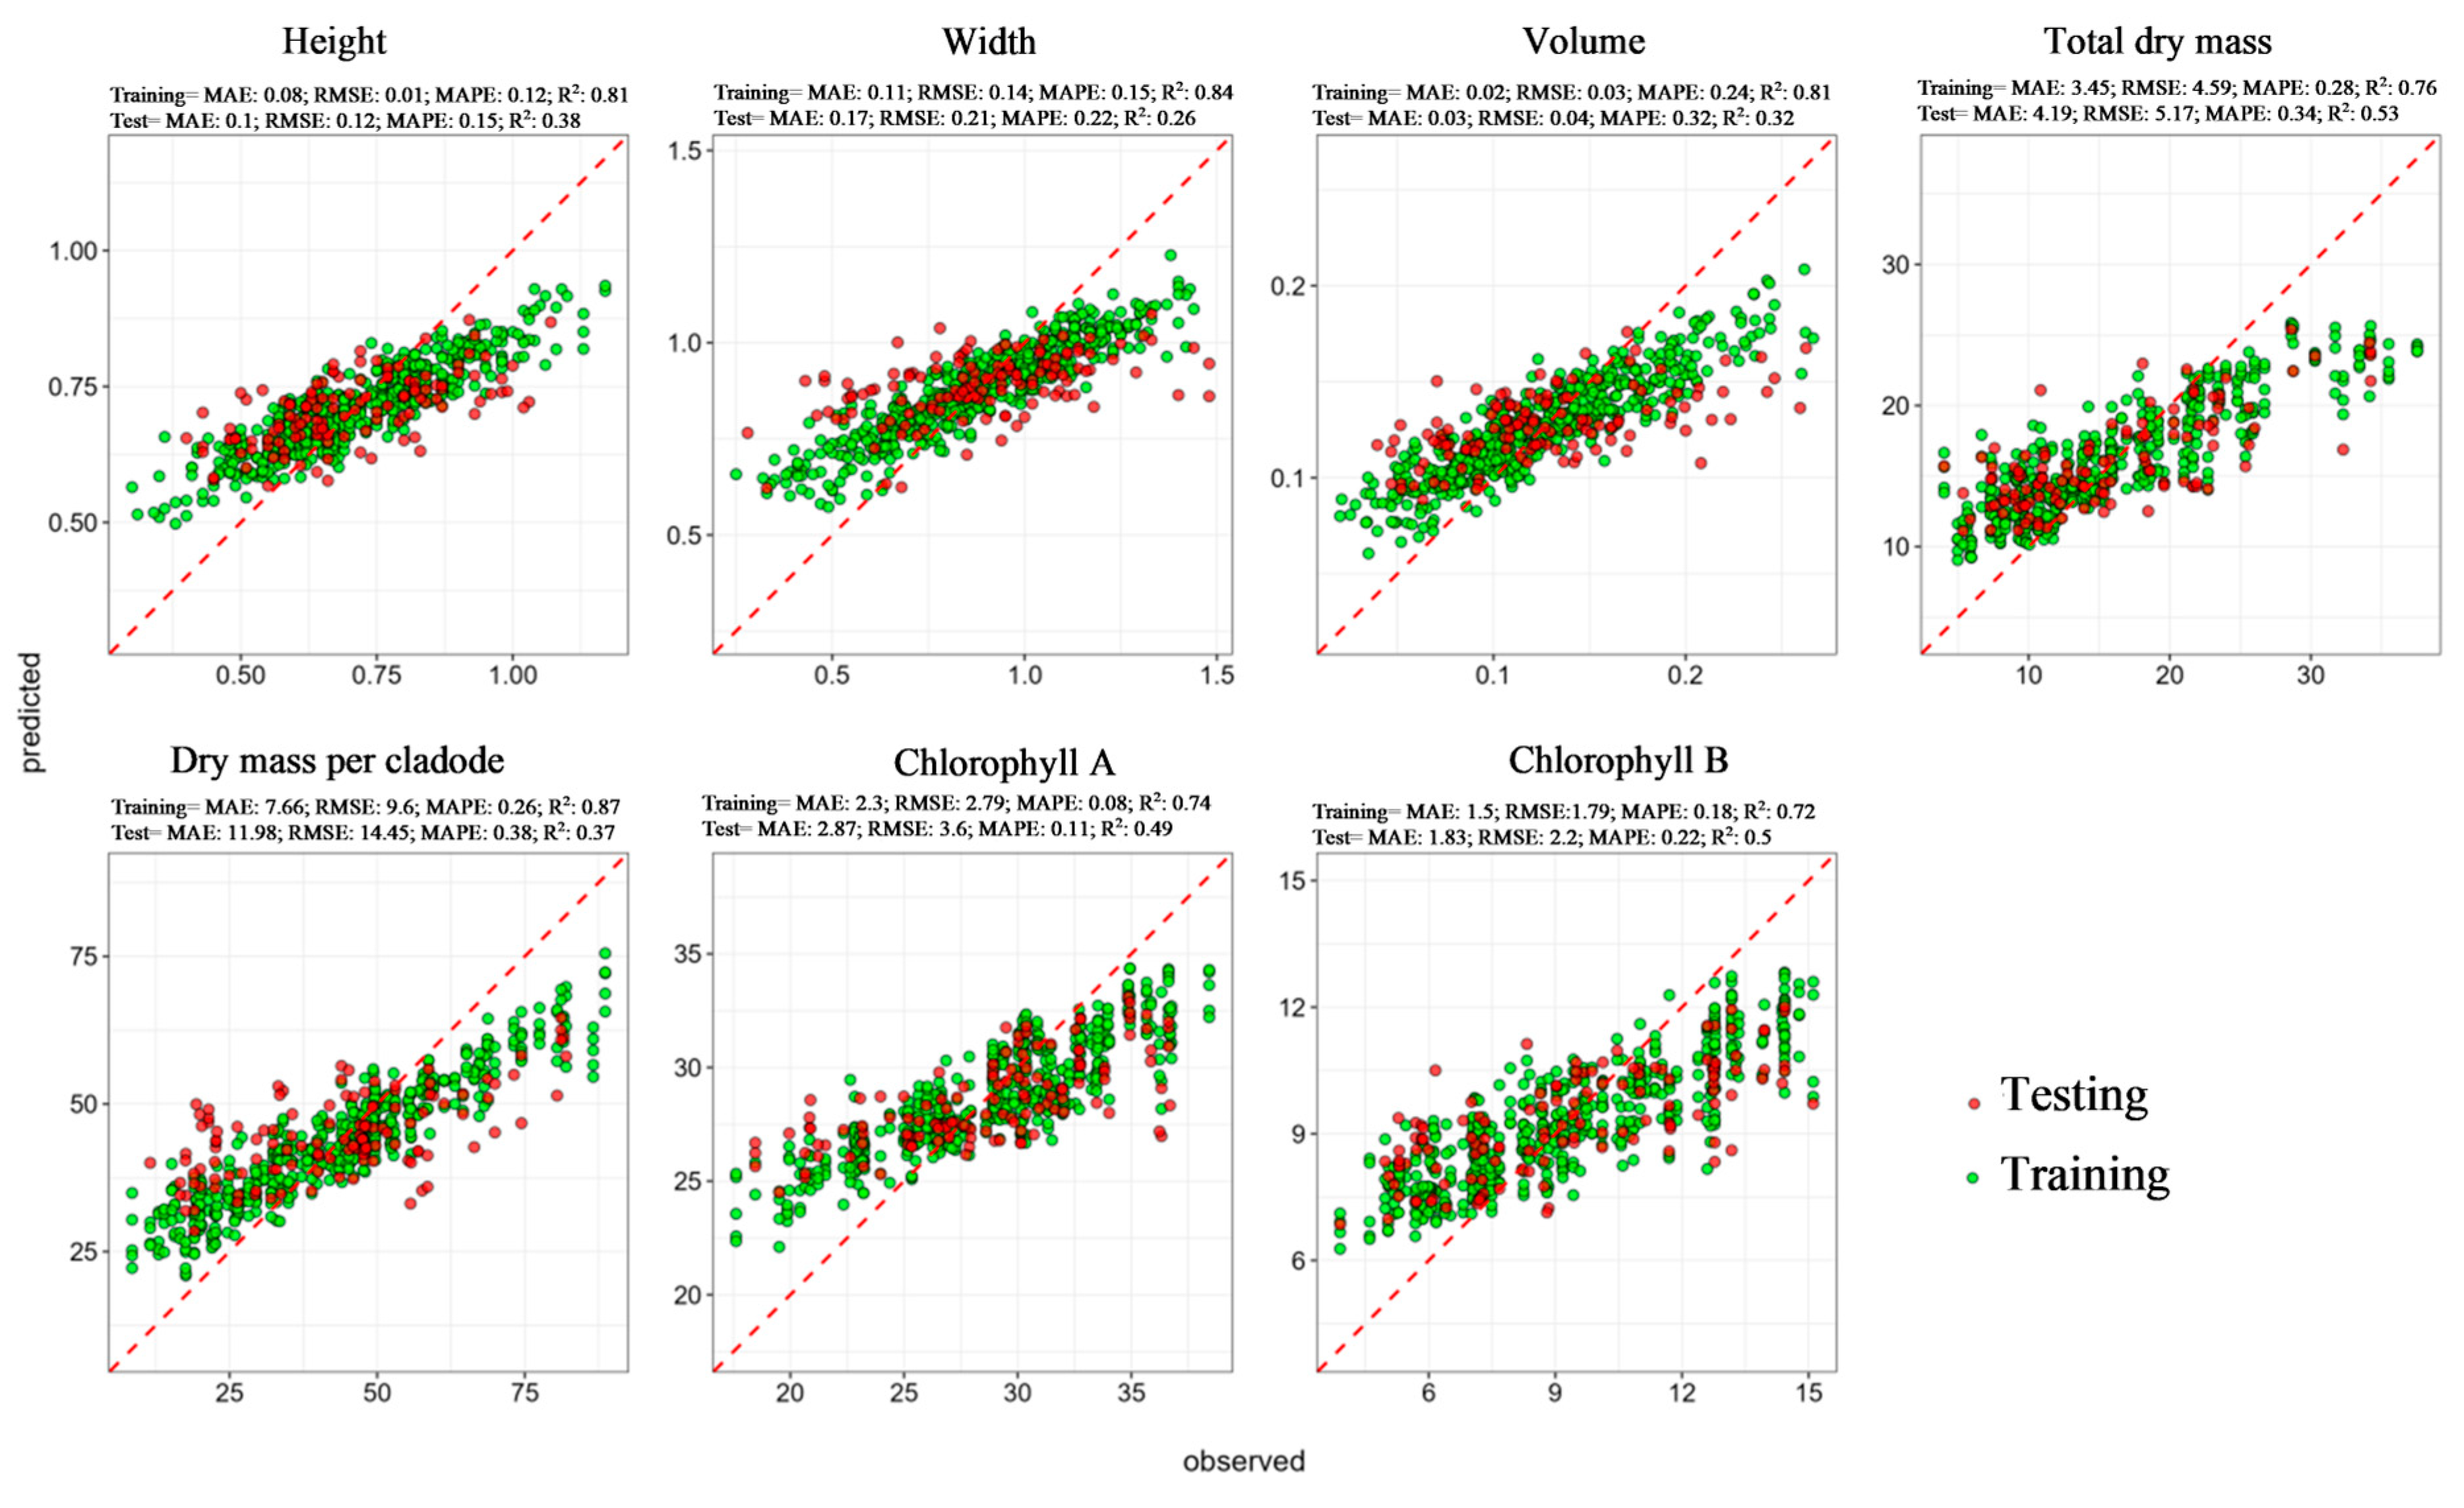
The relationship between predicted and observed values for the overall forage cactus dataset (Figure 4) indicates good model fit during the training phase, with coefficients of determination above 0.80 for structural traits and above 0.70 for DMY and chlorophylls. However, model performance decreased in the testing phase, with low linearity for structural variables (R2 < 0.40) and moderate performance for DMY (R2 = 0.53).
In the testing phase, the point distribution became more dispersed, indicating lower agreement between predicted and observed values compared with the training phase. This dispersion was more evident for height, width, and volume, whereas DMY and chlorophyll variables showed comparatively closer alignment between predicted and observed values. A greater spread of points was also observed at higher observed values for some variables, indicating lower prediction consistency in the upper range of the dataset.
The predicted and observed data for the OEM cultivar showed good agreement between model predictions and field values (Figure 5). For the OEM cultivar, model performance for DMY reached R2 = 0.76 in training and 0.73 in testing. DMY per cladode reached R2 = 0.85 in training and 0.84 in testing. Height reached R2 = 0.83 in training and 0.66 in testing. The close R2 values between training and testing for DMY and DMY per cladode indicate greater stability of the model for productive variables in this cultivar. The point distribution for these variables showed closer alignment between predicted and observed values, particularly when compared with width and volume. Among the structural variables, height showed the best testing performance, while width and volume presented greater dispersion of predicted values in relation to observed values.
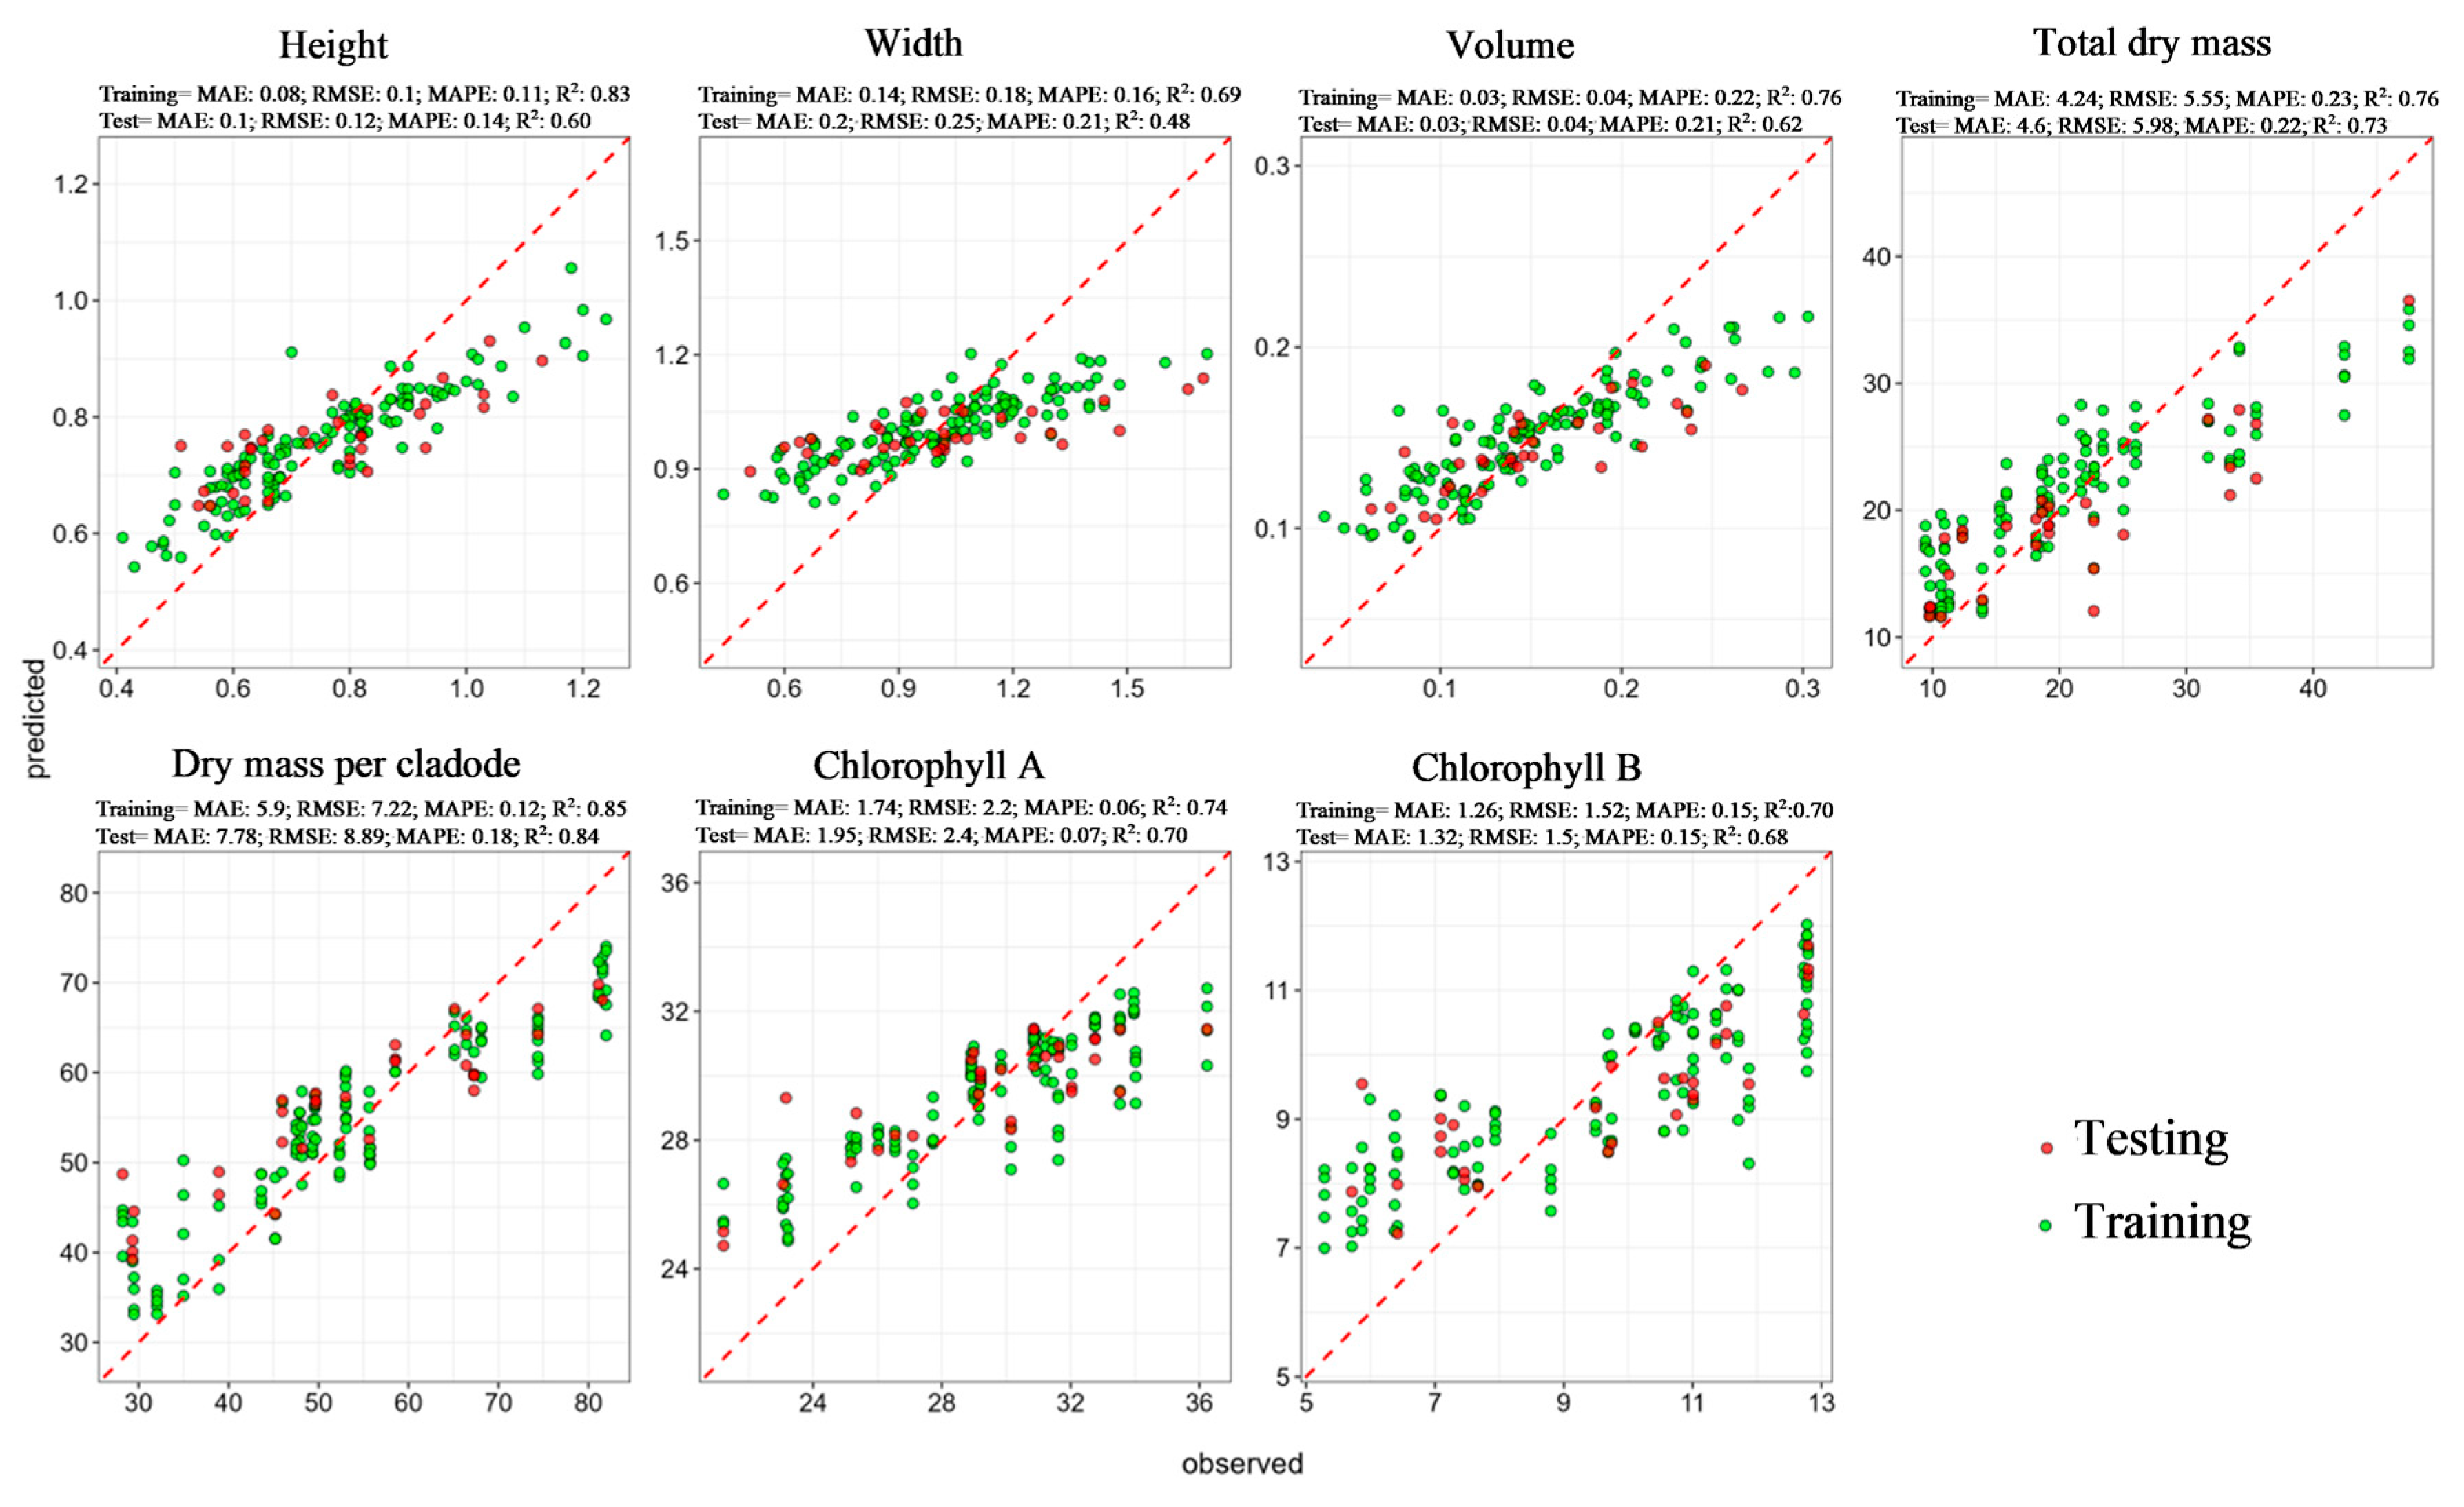
For the Miúda variety, model performance was lower, with R2 = 0.69 for DMY and 0.58 for height in the testing phase. DMY per cladode reached R2 = 0.92 in training and 0.72 in testing (Figure 6). Compared with the OEM cultivar, the Miúda variety showed greater reduction in model performance from training to testing, especially for DMY per cladode. Although this variable showed the highest R2 in the training phase, the testing phase presented lower agreement between predicted and observed values. For DMY and height, the points showed moderate alignment, whereas width and volume presented greater dispersion. Overall, the Miúda models showed less stable prediction patterns across variables when compared with the best-performing cultivars.
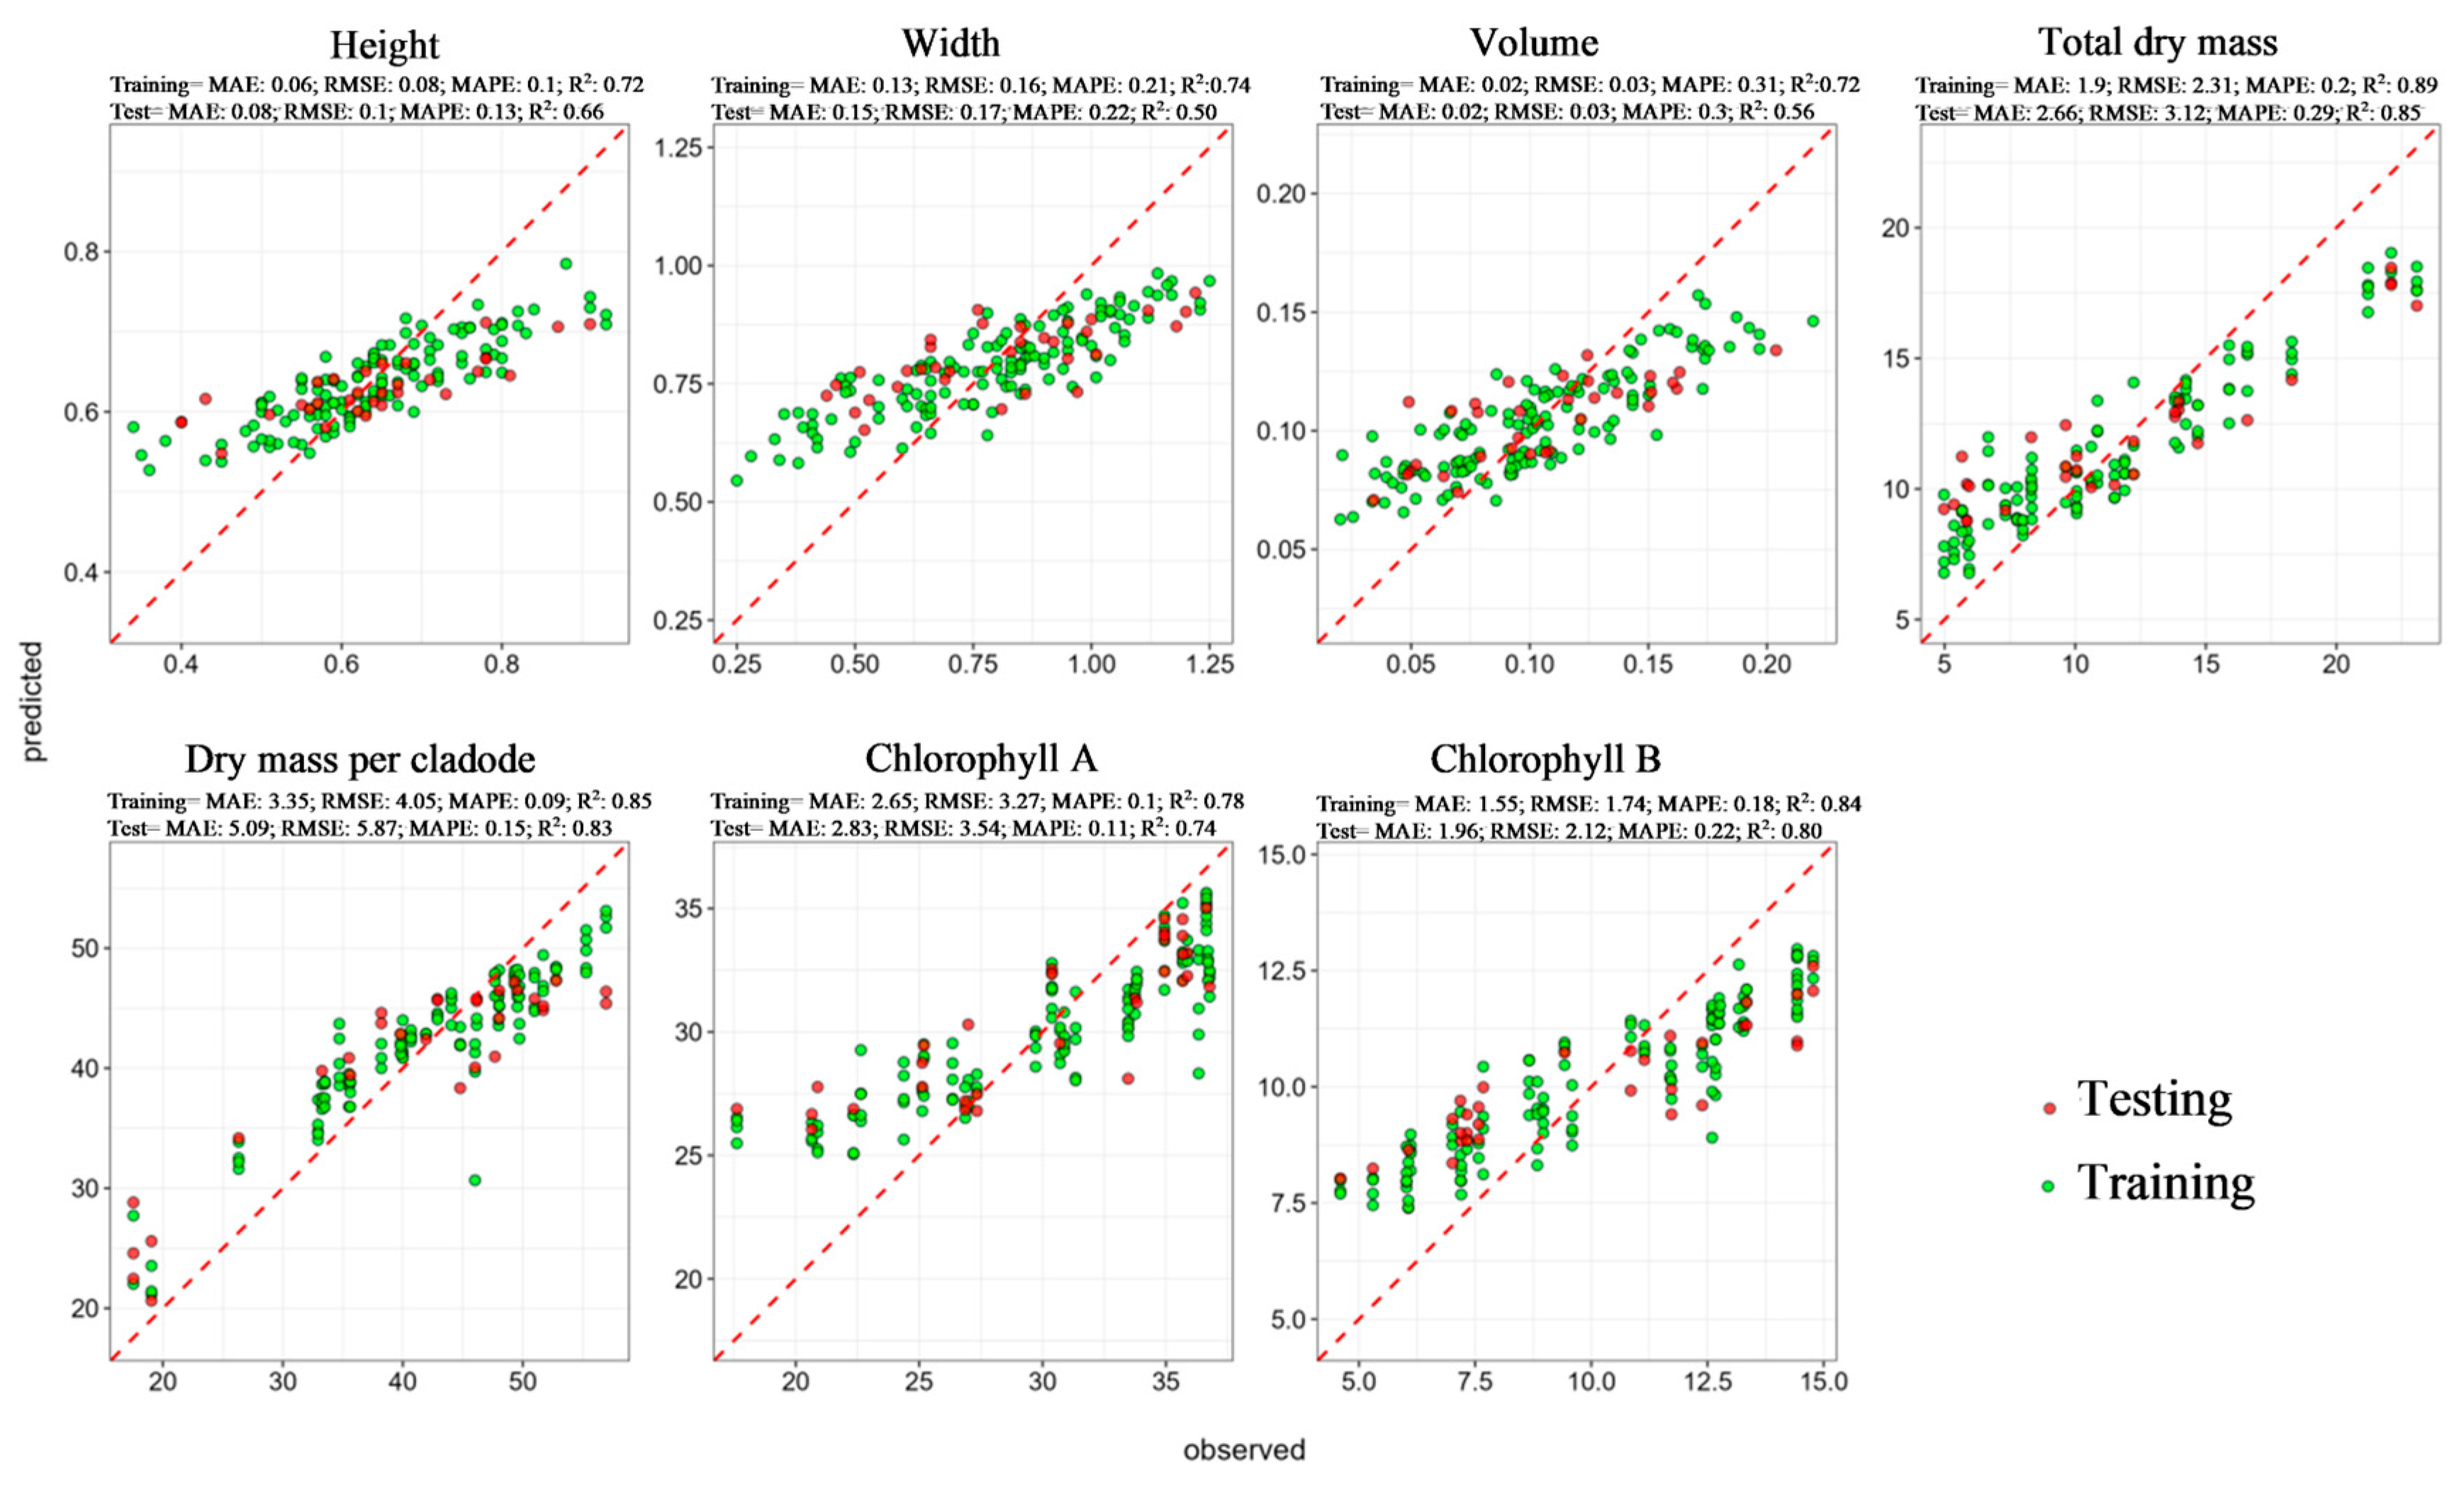
For IPA Sertânia, predicted values were close to observed values, with good performance for DMY and chlorophyll variables (Figure 7). DMY showed MAPE values of 20% in training and 27% in testing. Structural variables showed R2 values of 0.72 (training) and 0.66 (testing) for height, 0.74 and 0.50 for width, and 0.74 and 0.56 for volume. Chlorophyll A and Chlorophyll B also showed close agreement between predicted and observed values, with lower dispersion in the testing phase than that observed for width and volume. Among the structural variables, height showed the smallest reduction between training and testing, while width and volume presented lower testing performance. The distribution of points indicates that IPA Sertânia had more consistent prediction patterns for DMY and chlorophyll variables than for structural traits.
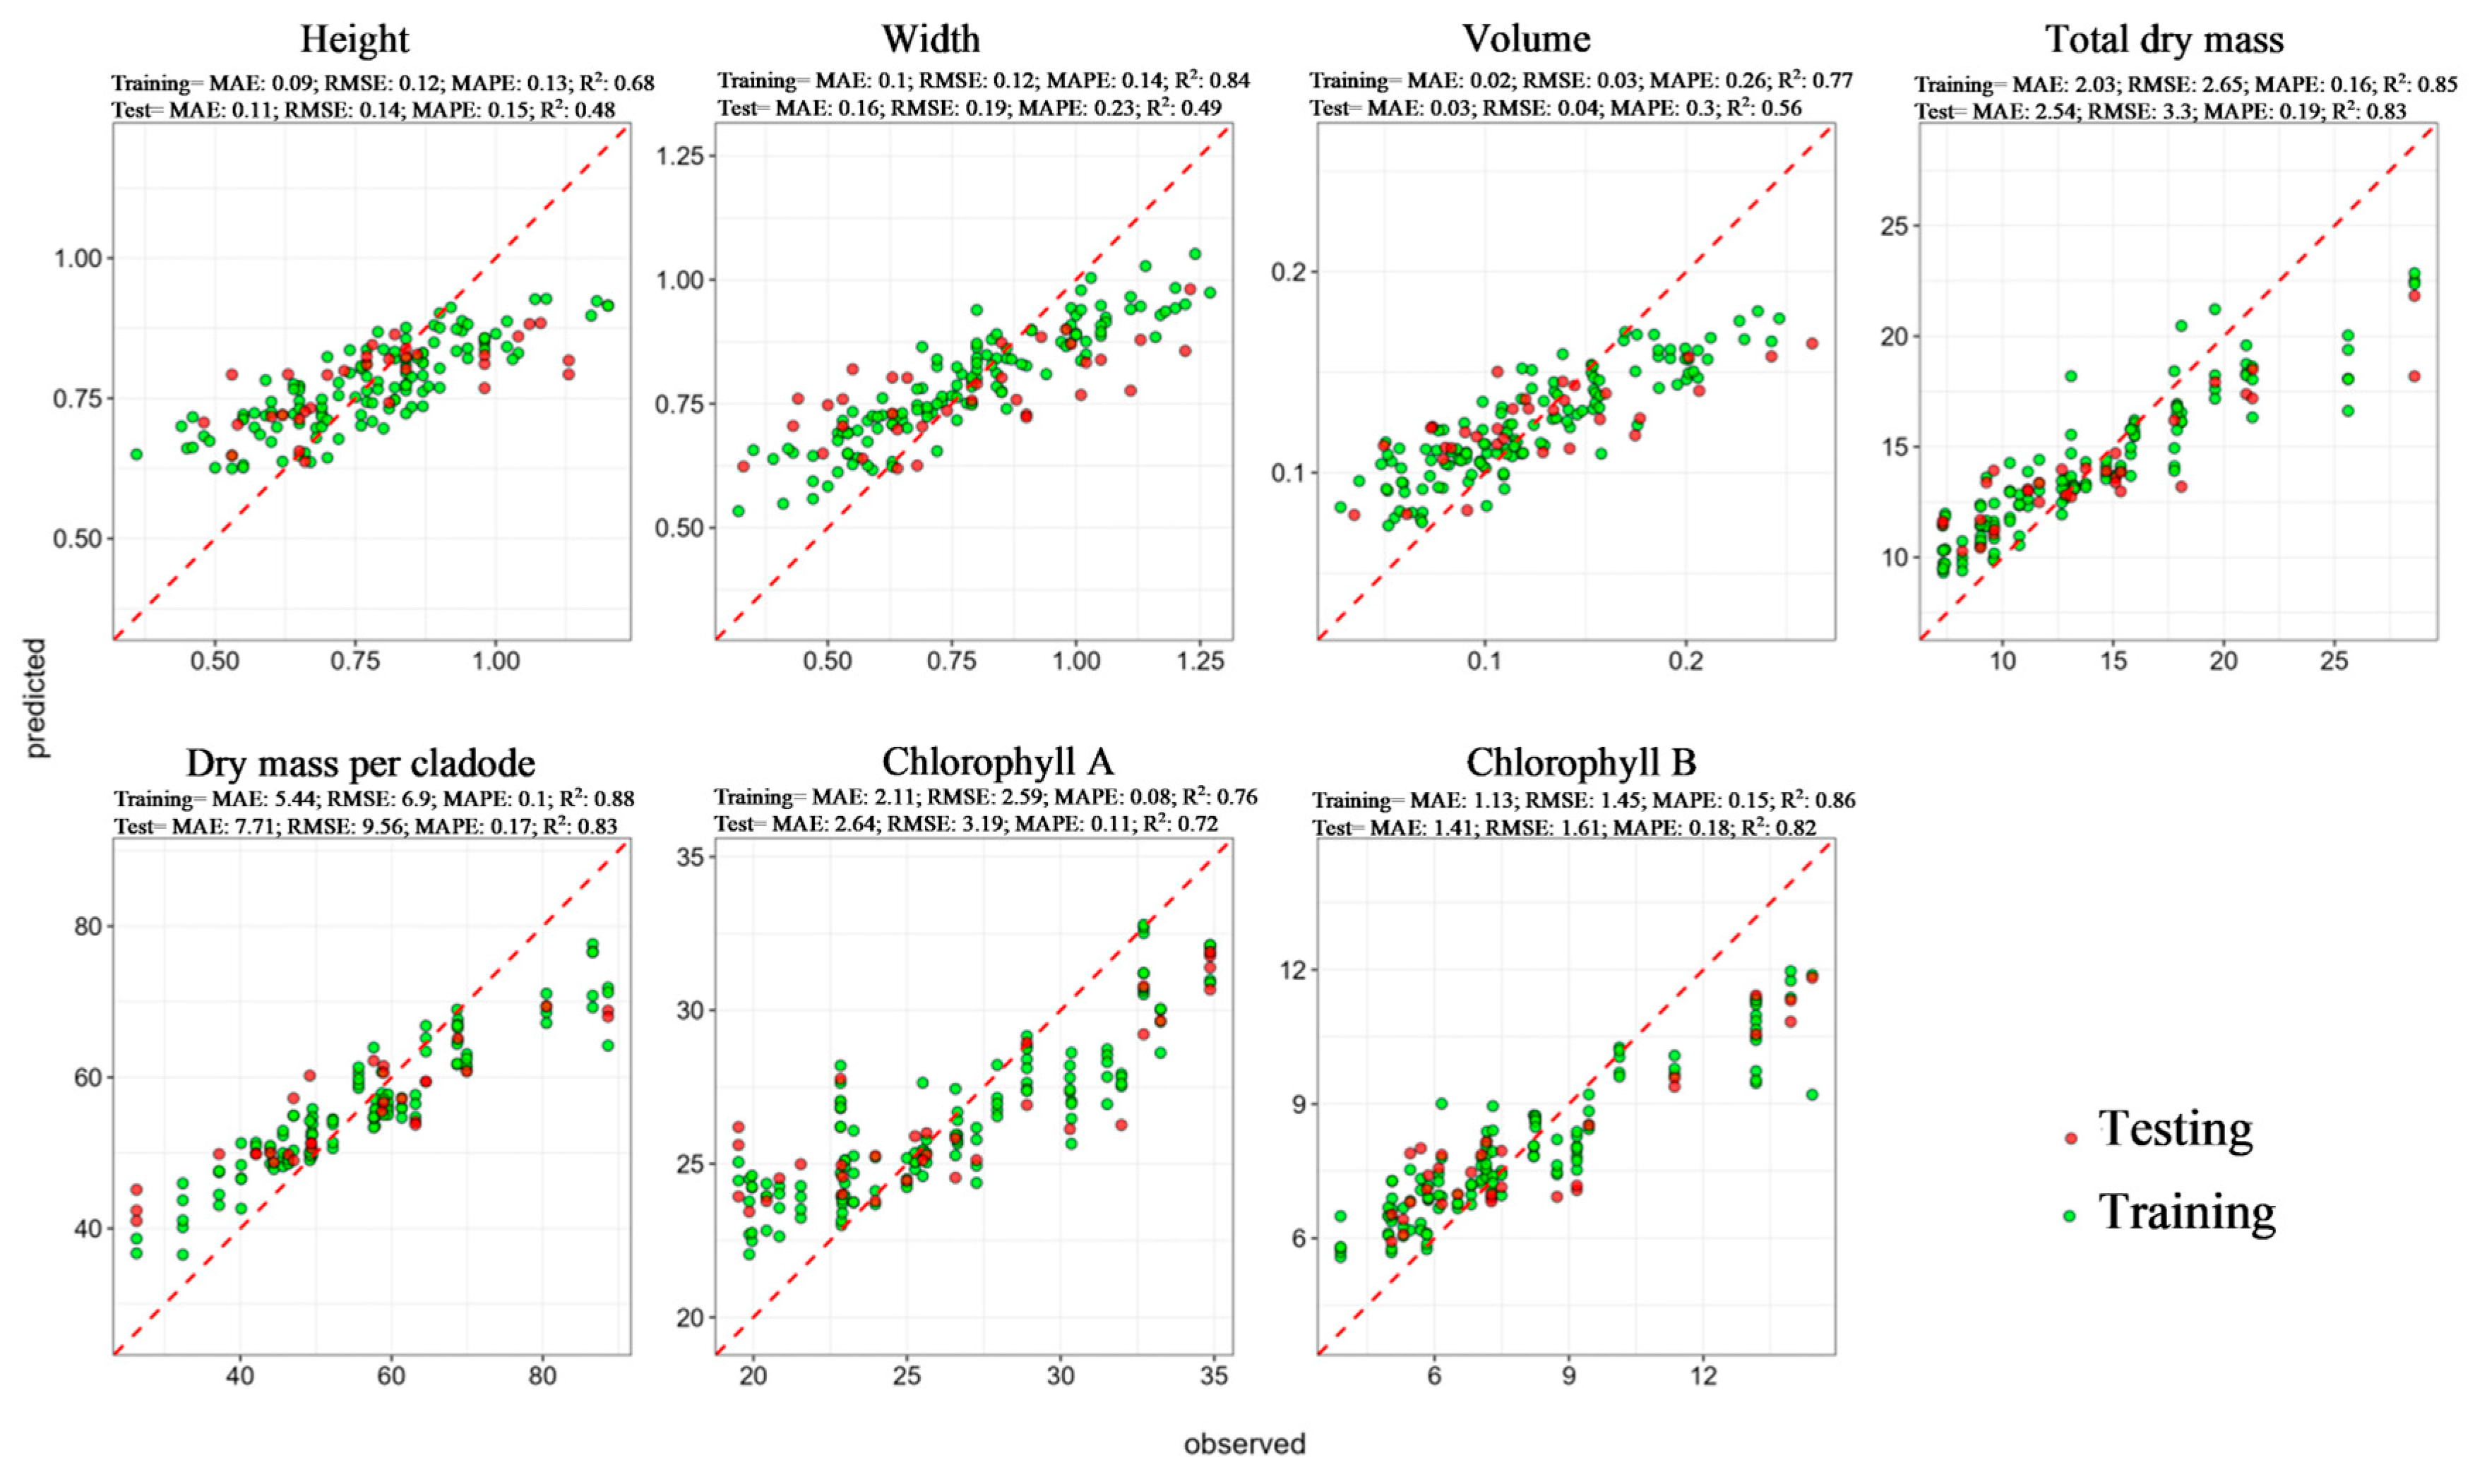
For IPA 20, DMY showed MAPE values of 16% in training and 19% in testing, with absolute mean errors of 2.03 and 2.54 t ha−1, respectively. Height showed MAPE values of 12% and 14% in training and testing, respectively (Figure 8). The difference between training and testing was small for DMY and height. The predicted and observed values for DMY were closely distributed along the 1:1 line. For height, the points also showed close distribution between predicted and observed values in both phases. Width and volume showed greater dispersion of points in the testing phase.

4. Discussion

The integration of UAV-derived imagery with Random Forest modelling showed greater potential for predicting productive and physiological variables than structural traits. Height is a structural trait commonly used in forage management, and, in forage cactus, plant height and width are closely related to CAI and yield, particularly for OEM and Miúda varieties [23]. Although the simple correlations between spectral indices and dry mass production were weak in the overall dataset, indices derived from RGB and RGNir images contributed as predictors within the multivariate model, especially when combined with structural information extracted from the images. This result indicates that the performance of this approach does not depend on a single vegetation index, but rather on the combination of different sources of information through Random Forest.
Similarly, Tueros et al. [24], when evaluating UAV-derived RGB images in potato, observed low correlations between RGB indices and yield, but reported better performance of Random Forest for yield prediction. Saltos-Alcivar et al. [25] also found that RGB images associated with vegetation indices and machine learning constituted a low-cost approach for estimating physiological traits in peanut, with Random Forest performing better than K-Nearest Neighbours (KNN).
Studies involving different crops show that the relationship between UAV-derived spectral indices and biomass or yield is not always strong when the indices are evaluated individually. Vahidi et al. [26], when estimating pasture biomass using UAV-derived RGB images, observed that the integration of spectral and structural variables was important to improve prediction, whereas the spectral response showed limitations under conditions of higher biomass due to canopy saturation and shading. In the present study, forage cactus showed weak correlations between DMY and spectral indices in the overall dataset, which may be associated with the inclined and overlapping arrangement of cladodes, the high water content of the tissues, and the absence of a continuous canopy. Therefore, spectral indices should be interpreted as complementary information for prediction, rather than as isolated indicators of productivity.
The association between dry mass production and cladode area index indicates the importance of plant structure in forage cactus productivity. Cladodes are the main photosynthetic organs of cactus pear and also contribute to water and reserve storage. Therefore, their area, number, and development are directly related to mass accumulation. Lucena et al. [27] highlighted that cactus pear production is influenced by light interception, which depends on morphological characteristics such as cladode area. The authors also indicated that cladode area and weight can be estimated using linear dimensions, showing the strong relationship between cladode morphometry and plant growth.
The relationship between spectral indices and dry mass production varied among varieties. VARI was more relevant for OEM and IPA Sertânia, whereas GLI was more associated with DMY in Miúda and IPA 20. Therefore, there was no single spectral index capable of representing all forage cactus varieties equally. Differences in architecture, number of cladodes, cladode area, growth pattern, and exposed surface can alter how each variety reflects radiation and how this response is captured by the images. In this context, variety-specific models tend to better represent the relationship between UAV-derived data and field-measured traits.
The need to fit individual models for each forage cactus variety arises from the structural differences between the genera Opuntia and Nopalea. Silva et al. [28] reported that Opuntia ficus-indica shows higher values of fresh mass (433 g), cladode length (31.2 cm), and cladode width (16.6 cm) compared with Nopalea cochenillifera, which presented 154 g, 22.6 cm, and 9.7 cm, respectively. In addition to these morphometric differences, Opuntia has higher moisture content (91 vs. 89.67%) and lower pH (4.40 vs. 4.70). These physical and chemical distinctions may influence the spectral and structural responses captured by UAV imagery.
The reduced amplitude of physiological variables such as chlorophyll A and B indicates greater uniformity among plants, whereas the wider variation observed in fresh mass per cladode and total fresh mass reflects marked structural differences among cultivars. It is important to note that, although often treated as a single group, forage cactus exhibit structural, physiological, and productive heterogeneity. These differences arise both from the distinction between the genera Opuntia and Nopalea and from the specific characteristics of each clone. The OEM clone, for example, shows higher mass accumulation and higher cladode area index (IAC). Siqueira et al. [13] reported fresh mass values of 131.7 Mg ha−1 for OEM, while IPA Sertânia and Miúda reached 44.65 and 57.60 Mg ha−1, respectively.
The lower stability of the models for the Miúda variety may be associated with its more complex architecture. Rocha et al. [29] observed that Miúda has a greater number of cladodes and lighter cladodes compared with OEM and IPA 20, as well as a higher cladode area index from eight months after planting onward. This combination of a greater number of structures, smaller individual size, and higher plant density may increase cladode overlap, internal shading, and visual heterogeneity, making it more difficult to define plant contours and reconstruct plant structure from UAV-derived images.
Thus, the lower accuracy observed for Miúda should not be interpreted only as a limitation of the algorithm, but also as a consequence of the interaction between plant architecture and image acquisition. Plants with a greater number of cladodes, smaller cladodes, and higher overlap may generate greater visual noise for the models, especially for structural variables such as height and volume. Miúda requires special attention in future modelling efforts, with strategies adjusted to its architecture, such as more refined plant segmentation, the use of higher spatial resolution, or the inclusion of textural variables.
For IPA Sertânia, the better performance for DMY and chlorophylls, together with intermediate results for structural variables, suggests that spectral and physiological signals were better captured than the three-dimensional geometry of the plant. This behaviour indicates that the prediction of productive and physiological variables may be more stable than the prediction of height, width, and volume, which depends more strongly on the quality of the digital elevation model and on its ability to represent the internal architecture of the plant. The distribution of predicted points close to the observed values for DMY, Chlorophyll A, and Chlorophyll B also suggests good linear coherence and absence of directional bias for these variables.
IPA 20 also showed good predictive performance, especially for DMY, with lower errors in the testing phase. This result may be associated with an architecture more favourable to UAV-based image acquisition, with lower visual complexity compared with Miúda and a clearer definition of the apparent plant surface. In varieties with less overlap or more clearly delimited structures, images tend to better represent the exposed surface, favouring the extraction of spectral and structural information useful for the model.
The lower performance for height, width, and volume may be related to limitations of the digital elevation model in representing the three-dimensional architecture of forage cactus. Unlike crops with continuous canopies, forage cactus has cladodes oriented at different angles, overlapping structures, and gaps between cladodes, which makes photogrammetric reconstruction of the plant more difficult. Thus, UAV imagery tends to capture the visible canopy surfaces more effectively than the internal plant structure, which may increase error in structural variables. Li et al. [30] observed that the accuracy of UAV-based monitoring depends strongly on flight altitude and spatial resolution, with better performance at lower altitudes and reduced accuracy for variables such as LAI, SPAD, plant height, and aboveground mass at higher altitudes. These findings show that the quality of spatial information plays a decisive role in the prediction of structural traits.
The Random Forest models were able to predict field variables with satisfactory performance, particularly for dry mass production and physiological indicators. Among the evaluated traits, DMY showed the highest predictive accuracy, followed by Chlorophyll A and Chlorophyll B. The physiological variables, Chlorophyll A and Chlorophyll B, and DMY per cladode exhibited high predictive accuracy, indicating that spectral attributes derived from aerial imagery are informative for characterising plant physiology and productivity. In contrast, the structural attributes estimated via UAV showed moderate performance, with reduced accuracy associated with DEM-related noise, shading, cladode inclination, and variations in canopy arrangement.
The better performance for productive and physiological traits may also be related to the greater sensitivity of spectral bands to vegetation structure and plant condition. In plants with greater overall size and larger leaf surface area, reflectance measured in the red (approximately 620–700 nm), green (approximately 500–600 nm), and especially near-infrared (NIR, 700–1100 nm) spectral bands tends to be more responsive to structural variation, such as vegetation mass density. In the NIR region, reflectance is strongly affected by internal leaf structure and total mass, making it a suitable indicator of plant vigour and size [31]. This relationship helps explain why variables associated with dry mass accumulation and chlorophyll content were more consistently predicted than traits that depend directly on three-dimensional reconstruction.
Differences among cultivars also contributed to variation in model performance. The OEM clone, for example, shows higher mass accumulation and higher cladode area index (IAC). Siqueira et al. [13] reported fresh mass values of 131.7 Mg ha−1 for OEM, while IPA Sertânia and Miúda reached 44.65 and 57.60 Mg ha−1, respectively. These differences indicate that, although forage cactus is often analysed as a single group, the crop includes materials with distinct structural and productive patterns. Such variation affects both the spectral response captured by UAV imagery and the ability of the model to represent relationships between image-derived predictors and field-measured traits.
A slight asymmetry was observed at the upper range of DMY, DMY per cladode, and observed height, with a tendency to underestimate the highest values. This pattern is typical of tree-based models, as the predictions within each node correspond to the average of the grouped observations, reducing the ability to capture extreme values [32]. Although Random Forest is robust to noise, outliers, and multicollinearity, this type of algorithm tends to shrink the extremes of the distribution and concentrate predictions near the central values [9]. Even so, RF remains suitable for this type of aerial-imagery application because it can handle non-linear relationships, interactions among predictors, and correlated variables. Studies in digital agriculture show that RF provides strong generalisation ability under complex conditions, including prediction tasks based on remote sensing data [33].
The cactus pear plants were irrigated via drip irrigation; therefore, no water stress occurred during the experimental period. Under water deficit, it is common for the concentrations of photosynthetic pigments, especially chlorophylls a and b, to decline, which alters light absorption in the visible spectrum and modifies the spectral response of plants [34]. This typically reduces the sensitivity of image-derived indices for estimating physiological attributes. Silva et al. [6], analysing OEM and Miúda under drought-prone conditions, reported marked reductions in the Soil-Adjusted Vegetation Index and leaf area index during periods of low rainfall, attributed to loss of cladode turgor, reduced photosynthetic area, and pigment degradation. Because the plants in the present study did not experience such restrictions, they maintained greater physiological stability and preserved pigment concentrations. This scenario may have contributed to better model performance in predicting Chlorophyll A and B.
The image acquisition process showed good overall quality, allowing consistent extraction of spectral indices and structural variables. The main limitation was associated with the DEM, which did not fully capture the three-dimensional geometry of cactus pear plants. This limitation is probably linked to the irregular architecture of the cladodes, their orientation in different planes, and the presence of internal shading and overlap. Therefore, the performance of UAV-based monitoring in forage cactus depends not only on sensor quality and model choice, but also on the interaction between plant architecture, spatial resolution, and the type of trait being predicted.
The results indicate that UAV imagery combined with Random Forest can support forage cactus management in semi-arid environments. The possibility of estimating dry mass availability and physiological variables allows plant growth to be monitored, areas with lower vigour to be identified, and harvest planning to be improved. This technology can reduce the need for repeated sampling and intensive manual assessments, especially in larger areas or in systems that require frequent monitoring.
Thus, the integration of UAV imagery, spectral indices, structural information, and Random Forest represents a promising strategy for monitoring forage cactus in semi-arid regions. The results suggest greater applicability for productive and physiological variables than for structural variables estimated directly from the digital elevation model. The main contribution of this approach lies in generating rapid predictive information, with lower labour demand and less need for repeated destructive sampling, provided that the models are calibrated and validated for each cultivation condition and evaluated variety.


5. Conclusions

Specific models are required for each cactus pear variety. UAV-based data combined with the Random Forest algorithm demonstrated good performance in predicting cactus pear attributes, particularly Chlorophyll A and B, DMY, and DMY per cladode, which showed high accuracy and low error margins. Structural estimates showed weaker performance, reflecting the limitations of the DEM in representing the crop’s three-dimensional architecture. IPA Sertânia and IPA 20 exhibited the best predictive response among the evaluated varieties. UAVs and machine-learning techniques are fast, non-destructive, and suitable tools for monitoring cactus pear production. Future studies should focus on improving digital elevation models and developing more robust approaches capable of capturing the structural differences among cactus pear varieties.

Author Contributions

Conceptualization, R.M.d.S. and M.A.Á.Q.; methodology, R.M.d.S. and W.M.d.S.; software, R.M.d.S., M.A.Á.Q., W.M.d.S., F.d.A.R. and J.V.E.N.; validation, R.M.d.S., M.A.Á.Q., J.C.S.S., J.C.d.S., S.A.U. and F.d.A.R.; formal analysis, R.M.d.S. and F.d.A.R.; investigation, R.M.d.S., M.A.Á.Q., J.C.S.S., J.C.d.S., S.A.U., W.M.d.S., A.L.C.G., F.P.T.d.C. and J.V.E.N.; resources, J.V.E.N.; data curation, R.M.d.S.; writing—original draft preparation, J.C.S.S.; writing—review and editing, J.C.S.S., J.C.d.S., S.A.U. and J.V.E.N.; visualization, T.G.F.d.S., J.C.d.S., S.A.U., A.L.C.G., F.P.T.d.C. and F.d.A.R.; supervision, M.A.Á.Q., T.G.F.d.S., W.M.d.S. and F.P.T.d.C.; project administration, M.A.Á.Q., S.A.U., F.d.A.R. and J.V.E.N. All authors have read and agreed to the published version of the manuscript.

Funding

This research received no external funding.

Institutional Review Board Statement

Not applicable.

Informed Consent Statement

Not applicable.

Data Availability Statement

The original contributions presented in this study are included in the article. Further inquiries can be directed to the corresponding authors.

Acknowledgments

We would like to thank the Coordination for the Improvement of Higher Education Personnel—CAPES (Financial Code 001) and the Conselho Nacional de Desenvolvimento Científico e Tecnológico (CNPq) for granting research and study aid.

Conflicts of Interest

The authors declare no conflicts of interest.

Abbreviations

The following abbreviations are used in this manuscript:
UAVUnmanned Aerial Vehicle
DEM Digital Elevation Model
OEM ‘Orelha de Elefante Mexicana’ cactus pear
IPA Sertânia ‘Mão de Moça’ or ‘IPA Sertânia’ cactus pear
IPA 20 ‘Clone IPA 20’ cactus pear
MIU ‘Miúda’ cactus pear
DMY Dry Matter Yield
VARIgreen Green-Region Atmospherically Resistant Vegetation Index
GLI Green Leaf Index
NDVI Normalised Difference Vegetation Index
CIgreen Green Chlorophyll Index
Chlo_A Chlorophyll A
Chlo_B Chlorophyll B
Hei_O Observed height
Hei_E Height estimated from DEM
Wid_O Observed width
Wid_E Width estimated from DEM
Vol_O Observed volume
Vol_E Volume estimated from DEM
CAI Cladode Area Index

Appendix A

Table A1. Tuned parameters for the Random Forest models for each experimental unit and analysed variable.
CultivarTarget VariableParameters
num.treesmtrymin.node.sizemax.depthsample.fraction
OEMHeight100710130.866666667
Width10021070.7
Volume200714110.9
Total dry mass100623100.866666667
DM_cladode10046130.633333333
Chlorophyll A100310130.666666667
Chlorophyll B400814130.633333333
MiúdaHeight1002680.666666667
Width1004270.6
Volume1004670.9
Total dry mass10062150.866666667
DM_cladode20082100.666666667
Chlorophyll A200414110.866666667
Chlorophyll B1008270.733333333
IPA SertâniaHeight100814130.666666667
Width10021470.9
Volume100418130.9
Total dry mass10026130.766666667
DM_cladode10066110.833333333
Chlorophyll A100310100.666666667
Chlorophyll B20026110.6
IPA 20Height300514100.766666667
Width10022130.6
Volume100510100.733333333
Total dry mass30086130.666666667
DM_cladode1007280.633333333
Chlorophyll A100710150.6
Chlorophyll B10026150.666666667
OEM = Orelha de Elefante Mexicana; DM_cladode = Dry mass per cladode.

References

  1. Silva, T.G.F.; Jardim, A.M.R.F.; Diniz, W.J.S.; Souza, L.S.B.; Araújo Júnior, G.N.; Silva, G.Í.N.; Alves, C.P.; Souza, C.A.A.; Morais, J.E.F. Profitability of using irrigation in forage cactus-sorghum intercropping for farmers in semi-arid environment. Rev. Bras. Eng. Agríc. Ambient. 2022, 27, 132–139. [Google Scholar] [CrossRef] [Scilit]
  2. FAO. Trees, Forests and Land Use in Drylands: The First Global Assessment—Full Report; FAO Forestry Paper No. 184; FAO: Rome, Italy, 2019. [Google Scholar]
  3. Dubeux, J.C.B., Jr.; dos Santos, M.V.F.; da Cunha, M.V.; dos Santos, D.C.; de Almeida Souza, R.T.; de Mello, A.C.L.; de Souza, T.C. Cactus (Opuntia and Nopalea) nutritive value: A review. Anim. Feed Sci. Technol. 2021, 275, 114890. [Google Scholar] [CrossRef] [Scilit]
  4. Borland, A.M.; Hartwell, J.; Weston, D.J.; Schlauch, K.A.; Tschaplinski, T.J.; Tuskan, G.A.; Yang, X.; Cushman, J.C. Engineering crassulacean acid metabolism to improve water-use efficiency. Trends Plant Sci. 2014, 19, 327–338. [Google Scholar] [CrossRef] [Scilit] [PubMed]
  5. Santos, W.R.; Souza, L.S.B.; Pacheco, A.N.; Jardim, A.M.R.F.; Silva, T.G.F. Eficiência do uso da água para espécies da Caatinga: Uma revisão para o período de 2009–2019. Rev. Bras. Geogr. Fís. 2021, 14, 2573–2591. [Google Scholar]
  6. Silva, M.V.; Pandorfi, H.; Almeida, G.L.P.; Lima, R.P.; Santos, A.; Jardim, A.M.R.F.; Rolim, M.M.; Silva, J.L.B.; Batista, P.H.D.; Silva, R.A.B.; et al. Spatio-temporal monitoring of soil and plant indicators under forage cactus cultivation by geoprocessing in Brazilian semi-arid region. J. S. Am. Earth Sci. 2021, 107, 103155. [Google Scholar] [CrossRef] [Scilit]
  7. Ramos, M.I.; Cubillas, J.J.; Córdoba, R.M.; Ortega, L.M. Improving early prediction of crop yield in Spanish olive groves using satellite imagery and machine learning. PLoS ONE 2025, 20, e0311530. [Google Scholar] [CrossRef] [Scilit] [PubMed]
  8. Santana, J.C.S.; Difante, G.S.; Euclides, V.P.B.; Montagner, D.B.; de Araújo, A.R.; Teodoro, L.P.R.; Teodoro, P.E.; de Arruda Queiróz Taira, C.; de Araújo, I.M.M.; de Aquino Monteiro, G.; et al. Comparative Analysis of Machine Learning Models for Predicting Forage Grass Digestibility Using Chemical Composition and Management Data. AgriEngineering 2025, 7, 412. [Google Scholar] [CrossRef] [Scilit]
  9. Breiman, L. Statistical modeling: The two cultures. Stat. Sci. 2001, 16, 199–231. [Google Scholar] [CrossRef] [Scilit]
  10. Marchegiani, S.; Gislon, G.; Marino, R.; Caroprese, M.; Albenzio, M.; Pinchak, W.E.; Carstens, G.E.; Ledda, L.; Trombetta, M.F.; Sandrucci, A.; et al. Smart technologies for sustainable pasture-based ruminant systems: A review. Smart Agric. Technol. 2025, 10, 100789. [Google Scholar] [CrossRef] [Scilit]
  11. Cimoli, E.; Lucieer, A.; Malenovský, Z.; Woodgate, W.; Janoutová, R.; Turner, D.; Haynes, R.S.; Phinn, S. Mapping functional diversity of canopy physiological traits using UAS imaging spectroscopy. Remote Sens. Environ. 2024, 302, 113958. [Google Scholar] [CrossRef] [Scilit]
  12. Pimentel, F.D.O.; Assis, W.L. Análise da variabilidade climática no município de Petrolina–PE entre os anos de 1973–2021. Rev. Esp. Climatol. 2022, 12, 282–303. [Google Scholar]
  13. Siqueira, J.V.G.; Freitas, H.R.; Melo Júnior, J.C.F.; Galhardo, C.X.; Silva, T.G.F.; Araújo Júnior, G.N.; Rodrigues, A.C.; Santos, J.P.A.S.; Borges, M.C.R.Z.; Maciel, I.J.; et al. Biomass production and bromatological composition of forage cactus clones subjected to sewage water irrigation and cutting management. Agric. Res. 2025, 15, 178–189. [Google Scholar] [CrossRef] [Scilit]
  14. ANAC. Regras Gerais para a Operação de Aeronaves Não Tripuladas—RBAC-E Nº 94, Emenda Nº 03. Available online: https://www.anac.gov.br/assuntos/legislacao/legislacao-1/rbha-e-rbac/rbac/rbac-e-94 (accessed on 17 April 2026).
  15. Gitelson, A.A.; Kaufman, Y.J.; Stark, R.; Rundquist, D. Novel algorithms for remote estimation of vegetation fraction. Remote Sens. Environ. 2002, 80, 76–87. [Google Scholar] [CrossRef] [Scilit]
  16. Hunt, E.R., Jr.; Doraiswamy, P.C.; McMurtrey, J.E.; Daughtry, C.S.T.; Perry, E.M.; Akhmedov, B. A visible band index for remote sensing leaf chlorophyll content at the canopy scale. Int. J. Appl. Earth Obs. Geoinf. 2013, 21, 103–112. [Google Scholar] [CrossRef] [Scilit]
  17. Rouse, J.W.; Haas, R.H.; Schell, J.A.; Deering, D.W. Monitoring vegetation systems in the Great Plains with ERTS. In Proceedings of the Third Earth Resources Technology Satellite-1 Symposium, Washington, DC, USA, 10–14 December 1973; Volume 1, pp. 309–317. [Google Scholar]
  18. Gitelson, A.A.; Gritz, Y.; Merzlyak, M.N. Relationships between leaf chlorophyll content and spectral reflectance and algorithms for non-destructive chlorophyll assessment in higher plant leaves. J. Plant Physiol. 2003, 160, 271–282. [Google Scholar] [CrossRef] [Scilit] [PubMed]
  19. Wright, M.N.; Ziegler, A. ranger: A fast implementation of random forests for high dimensional data in C++ and R. J. Stat. Softw. 2017, 77, 1–17. [Google Scholar] [CrossRef] [Scilit]
  20. R Core Team. R: A Language and Environment for Statistical Computing; R Foundation for Statistical Computing: Vienna, Austria, 2023; Available online: https://www.R-project.org/ (accessed on 17 April 2026).
  21. Xu, Y.; Goodacre, R. On splitting training and validation set: A comparative study of cross-validation, bootstrap and systematic sampling for estimating the generalization performance of supervised learning. J. Anal. Test. 2018, 2, 249–262. [Google Scholar] [CrossRef] [Scilit] [PubMed]
  22. Zhang, X.; Liu, C.A. Model averaging prediction by K-fold cross-validation. J. Econom. 2023, 235, 280–301. [Google Scholar] [CrossRef] [Scilit]
  23. Pinheiro, K.M.; Silva, T.G.F.; Carvalho, H.F.S.; Santos, J.E.O.; Morais, J.E.F.; Zolnier, S.; Santos, D.C. Correlations of the cladode area index with morphogenetic and yield traits of cactus forage. Pesqui. Agropecu. Bras. 2014, 49, 939–947. [Google Scholar] [CrossRef] [Scilit]
  24. Tueros, M.; Galindo, M.; Alvarez, J.; Pozo, J.; Condezo, P.; Gutierrez, R.; Bautista, R.; Mateu, W.; Paitamala, O.; Matsusaka, D. Varietal Identification and Yield Estimation in Potatoes Using UAV RGB Imagery in the Southern Highlands of Peru. AgriEngineering 2026, 8, 65. [Google Scholar] [CrossRef] [Scilit]
  25. Saltos-Alcivar, W.; Delgado-Marcillo, C.; Zamora-Ledezma, E.; Rivas, C.A.; Pacheco Gil, H.A. UAV-Borne RGB Imagery and Machine Learning for Estimating Soil Properties and Crop Physiological Traits in Peanut (Arachis hypogaea): A Low-Cost Precision Agriculture Approach. AgriEngineering 2026, 8, 177. [Google Scholar] [CrossRef] [Scilit]
  26. Vahidi, M.; Shafian, S.; Thomas, S.; Maguire, R. Pasture Biomass Estimation Using Ultra-High-Resolution RGB UAVs Images and Deep Learning. Remote Sens. 2023, 15, 5714. [Google Scholar] [CrossRef] [Scilit]
  27. Lucena, L.R.R.D.; Leite, M.L.D.M.V.; Simões, V.J.L.P.; Nóbrega, C.; Almeida, M.C.R.; Simplício, J.B. Estimating the area and weight of cactus forage cladodes using linear dimensions. Acta Sci. Agron. 2021, 43, e45460. [Google Scholar] [CrossRef] [Scilit]
  28. Silva, A.P.G.; Souza, C.C.E.; Ribeiro, J.E.S.; Santos, M.C.G.; Souza Pontes, A.L.; Madruga, M.S. Características físicas, químicas e bromatológicas de palma gigante (Opuntia ficus-indica) e miúda (Nopalea cochenillifera). Rev. Bras. Tecnol. Agroind. 2015, 9, 1810–1820. [Google Scholar] [CrossRef] [Scilit]
  29. Rocha, R.S.; Voltolini, T.V.; Gava, C.A.T. Características produtivas e estruturais de genótipos de palma forrageira irrigada em diferentes intervalos de corte. Arch. Zootec. 2017, 66, 365–373. [Google Scholar] [CrossRef] [Scilit]
  30. Li, Y.; Guo, S.; Jia, S.; Yan, Y.; Jia, H.; Zhang, W. Quantifying the Effects of UAV Flight Altitude on the Multispectral Monitoring Accuracy of Soil Moisture and Maize Phenotypic Parameters. Agronomy 2025, 15, 2137. [Google Scholar] [CrossRef] [Scilit]
  31. Neuwirthová, E.; Lhotáková, Z.; Albrechtová, J. The effect of leaf stacking on leaf reflectance and vegetation indices measured by contact probe during the season. Sensors 2017, 17, 1202. [Google Scholar] [CrossRef] [Scilit] [PubMed]
  32. Friedman, J.H. Greedy function approximation: A gradient boosting machine. Ann. Stat. 2001, 29, 1189–1232. [Google Scholar] [CrossRef] [Scilit]
  33. Santos, E.P.; Silva, D.D.; Amaral, C.H.; Fernandes-Filho, E.I.; Dias, R.L.S. A machine learning approach to reconstruct cloudy affected vegetation indices imagery via data fusion from Sentinel-1 and Landsat 8. Comput. Electron. Agric. 2022, 194, 106753. [Google Scholar] [CrossRef] [Scilit]
  34. Genc, L.; Inalpulat, M.; Kizil, U.; Mirik, M.; Smith, S.E.; Mendes, M. Determination of water stress with spectral reflectance on sweet corn using classification tree analysis. Zemdirb.-Agric. 2013, 100, 81–90. [Google Scholar] [CrossRef] [Scilit]
Figure 1. Meteorological data (mean, maximum, and minimum temperatures) and water balance (rainfall, reference evapotranspiration (ET0), and irrigation depths) recorded throughout the experimental period in Petrolina, Brazilian Semi-arid region.
Agriengineering 08 00261 g001
Figure 2. Orthomosaics obtained from four flights over the forage cactus experimental area (A) and digital elevation models (B) generated from images collected during the four flights over the forage cactus experimental area.
Agriengineering 08 00261 g002
Figure 3. Boxplots of forage cactus variables with and without outlier removal. Hei = height; Chlor_A = chlorophyll A; Chlor_B = chlorophyll B; Wid = width; DMY_cla = dry mass per cladode; DMY = total dry mass; Vol = volume.
Agriengineering 08 00261 g003
Figure 4. Relationship between predicted and observed values across all forage cactus cultivars. MAE = mean absolute error, RMSE = root mean squared error, MAPE = mean absolute percentage error and R2 = coefficient of determination.
Agriengineering 08 00261 g004
Figure 5. Relationship between predicted and observed values in ‘Orelha de Elefante Mexicana’.
Agriengineering 08 00261 g005
Figure 6. Relationship between predicted and observed values in Miúda.
Agriengineering 08 00261 g006
Figure 7. Relationship between predicted and observed values in ‘IPA Sertânia’.
Agriengineering 08 00261 g007
Figure 8. Relationship between predicted and observed values for ‘IPA 20’.
Agriengineering 08 00261 g008
Table 1. Structural, productive, and physiological parameters of the four forage cactus varieties in the semi-arid region.
Forage Cactus Variety
VariableUnitOEMMiúdaIPA SertâniaIPA 20
6 months
Heightm0.550.570.580.63
Widthm0.730.980.640.63
Volumem3 0.080.110.070.08
Total Dry Matter Weightton/ha12.8215.047.6811.67
Total Cladode NumberItem10.2521.007.758.25
Cladode Dry Matter Weightg/plant46.6628.0138.0050.36
Cladode Area Indexm2 m−21.040.821.040.37
Chlorophyll A 31.5329.9834.4029.83
Chlorophyll B 10.1511.8811.939.35
12 months
Heightm0.710.650.670.81
Widthm1.020.960.840.87
Volumem3 0.140.130.110.14
Total Dry Matter Weightton/ha23.5514.667.979.89
Total Cladode NumberItem17.2533.006.007.75
Cladode Dry Matter Weightg/plant48.7216.2248.9546.10
Cladode Area Indexm2 m−21.951.080.470.35
Chlorophyll A 30.3324.4026.8521.95
Chlorophyll B 11.987.839.235.85
18 months
Heightm0.680.560.670.70
Widthm0.990.980.830.78
Volumem3 0.140.110.110.11
Total Dry Matter Weightton/ha18.0712.2924.1912.01
Total Cladode NumberItem12.2526.5015.5010.00
Cladode Dry Matter Weightg/plant55.5115.4660.0643.51
Cladode Area Indexm2 m−21.120.891.210.42
Chlorophyll A 28.7026.3525.4324.70
Chlorophyll B 7.756.886.486.30
24 months
Heightm0.800.700.510.76
Widthm1.131.030.610.65
Volumem3 0.180.150.060.10
Total Dry Matter Weightton/ha32.8535.0510.5713.75
Total Cladode NumberItem17.0048.258.259.25
Cladode Dry Matter Weightg/plant70.1125.1746.1754.01
Cladode Area Indexm2 m−21.781.960.600.38
Chlorophyll A 24.6839.0534.2528.83
Chlorophyll B 7.1511.6311.607.75
Table 2. Visible spectrum vegetation indices, abbreviations and land use equations.
IndexAcronymEquationReference
Atmosphere-Resistant Vegetation Index (visible spectrum)VARIgreen(ρGreen − ρRed)/(ρGreen + ρRed − ρBlue)Gitelson et al. (2002) [15]
Green Leaf IndexGLI(2 ρGreen − ρRed − ρBlue)/(2 ρGreen + ρRed + ρBlue)Hunt Jr. et al. (2013) [16]
Normalised Difference Vegetation IndexNDVI(ρNir − ρRed)/(ρNir + ρRed)Rouse et al. (1973) [17]
Green Chlorophyll IndexCIgreen(ρNir/ρGreen) − 1Gitelson et al. (2003) [18]
Table 3. Pearson correlations among all variables evaluated for forage cactus (overall dataset).
VAmVAmaGLImGLImaNDVImNDVImaCimCimaHei_EWid_EVol_EHei_OWid_OVol_ODMYN_ClDMY_cCAIClor_AClor_BVariables
1.000.86 ** 0.36 ** 0.30 ** 0.050.14 ** 0.030.070.060.020.050.17 ** 0.080.14 ** 0.25 ** 0.13 ** 0.14 ** 0.12 ** −0.32 ** −0.16 ** VAm
1.000.28 ** 0.27 ** 0.050.11 ** 0.050.050.040.020.050.070.06 ** 0.070.16 ** 0.10 *0.050.07−0.24 ** −0.17 ** VAma
1.000.89 ** 0.030.05−0.10 ** −0.060.08 *0.010.16 ** 0.20 ** 0.13 ** 0.20 ** 0.26 ** 0.20 ** 0.09 *0.16 ** −0.12 ** 0.08 *GLIm
1.000.010.03−0.09 *−0.080.10 *0.000.17 ** 0.13 ** 0.110.14 ** 0.18 ** 0.15 ** 0.050.15 ** −0.12 ** 0.02GLIma
1.000.87 ** −0.02−0.040.11 ** 0.030.19 ** 0.09 *0.040.070.09 *−0.030.050.10 *0.08 *0.04NDVIm
1.000.040.020.040.09 *0.16 ** 0.12 ** 0.04 ** 0.08 *0.13 ** 0.020.040.11 ** 0.020.01NDVIma
1.000.88 ** 0.13 ** 0.040.13 ** 0.000.11 ** 0.060.060.050.010.16 ** 0.040.01Cim
1.000.12 ** 0.030.10 *0.050.11 *0.09 *0.070.040.050.15 ** 0.000.04Cima
1.00−0.36 ** 0.54 ** 0.16 ** 0.09 ** 0.15 ** 0.08 *0.040.11 ** 0.010.01−0.05Hei_E
1.000.17 ** 0.070.13 ** 0.12 ** 0.33 ** 0.23 ** 0.040.31 ** 0.09 *0.11 ** Wid_E
1.000.17 ** 0.26 ** 0.26 ** 0.25 ** 0.21 ** 0.030.26 ** 0.18 ** 0.04Vol_E
1.000.35 ** 0.79 ** 0.27 ** 0.050.29 ** 0.14 ** −0.14 ** 0.15 ** Hei_O
1.000.83 ** 0.24 ** 0.26 ** −0.070.33 ** −0.020.10 *Wid_O
1.000.30 ** 0.18 ** 0.13 ** 0.29 ** −0.08 *0.18 ** Vol_O
1.000.65 ** 0.28 ** 0.73 ** 0.09 *0.19 ** DMY
1.00−0.44 ** 0.64 ** 0.09 *0.11 ** N_Cl
1.00−0.06−0.08 *−0.01DMY_c
1.000.15 ** 0.24 ** CAI
1.000.59 ** Chlor_A
1.00Chlor_B
VAm and VAma: vegetation index based on the green-adjusted ratio (mean and maximum). GLIm and GLIma: green leaf index (mean and maximum). NDVIm and NDVIma: normalised difference vegetation index (mean and maximum). Ci and Cima: colour index (mean and maximum). Hei_E, Wid_E and Vol_E: height, width and volume estimated from UAV imagery. Hei_O, Wid_O and Vol_O: height, width and volume measured in the field. DMY: dry mass yield; N_Cl: number of cladodes; DMY_c: dry mass per cladode; CAI: cladode area index; Chlor_A and Chlor_B: chlorophyll A and B contents. * p < 0.05; ** p < 0.01.
Table 4. Pearson correlation matrix between dry-mass yield (DMY) and variables obtained from UAV imagery and field measurements for four forage cactus varieties.
Variable SourceVariableForage Cactus
OEMMIUDAIPA SertâniaIPA 20
Variables derived from UAV imageryVARI_mean0.32 **0.20 *0.36 **0.04
VARI_max0.29 **0.030.32 **−0.11
GLI_mean0.140.31 **0.27 **0.21 **
GLI_max0.140.27 **0.05−0.01
NDVI_mean0.25 **−0.06−0.05−0.02
NDVI_max0.24 **−0.010.050.03
Ci_mean−0.040.01−0.25 **0.04
Ci_max−0.030.1−0.19 *0.02
Hei_E−0.130.17 *−0.29 **0.14
Wid_E0.52 **0.24 **0.19 *−0.1
Vol_E0.23 **0.14−0.22 **0
Field measurements or variables derived from field dataHei_O0.110.35 **0.23 **0.53 **
Wid_O0.08−0.020.17 *0.26 **
Vol_O0.090.23 **0.23 **0.49 **
DMY1111
N_Cl0.74 **0.91 **0.82 **0.78 **
DMY_cla0.79 **0.52 **0.41 **0.48 **
CAI0.82 **0.75 **0.57 **0.86 **
Chlo_A0.030.07−0.130.32 **
Chlo_B0.050.23 **−0.130.62 **
UAV: Unmanned Aerial Vehicle. VARI_mean and VARI_max: Visible Atmospherically Resistant Index (mean and maximum). GLI_mean and GLI_max: Green Leaf Index (mean and maximum). NDVI_mean and NDVI_max: Normalised Difference Vegetation Index (mean and maximum). CI_mean and CI_max: colour index (mean and maximum). Hei_E, Wid_E and Vol_E: height, width and volume estimated from UAV imagery. Hei_O, Wid_O and Vol_O: height, width and volume measured in the field. DMY: dry-mass yield; number of cladodes; DMY per cladode; CAI: cladode area index; Chlo: chlorophyll A and B contents. * p < 0.05; ** p < 0.01.
Table 5. Pearson correlation matrix between plant height and variables obtained from UAV imagery and field measurements.
Variable SourceVariableForage Cactus
OEMMIUDAIPA SertâniaIPA 20
Variables derived from UAV imageryVARI_mean0.140.110.19 *0.21 **
VARI_max0.05−0.040.17 *0.09
GLI_mean0.040.33 **0.25 **0.13
GLI_max0.070.21 **0.18 *0.02
NDVI_mean0.090.050.060.02
NDVI_max0.040.080.030.12
Ci_mean−0.11−0.16 *−0.080.22 **
Ci_max−0.0200.030.21 **
Hei_E0.060.25 **−0.25 **0.26 **
Wid_E0.21 **0.060.18 *−0.21 **
Vol_E0.27 **0.35 **−0.05−0.1
Field measurements or variables derived from field dataHei_O1111
Wid_O0.47 **0.19 *0.53 **0.42 **
Vol_O0.82 **0.84 **0.81 **0.81 **
DMY0.110.35 **0.23 **0.53 **
N_Cl0.17 *0.38 **0.18 *0.34 **
DMY_cla0.040.080.150.37 **
CAI0.18 *0.37 **0.23 **0.40 **
Chlo_A−0.24 **0.14−0.21 **−0.03
Chlo_B0.26 **0.39 **−0.080.29 **
UAV: Unmanned Aerial Vehicle. VARI_mean and VARI_max: Visible Atmospherically Resistant Index (mean and maximum). GLI_mean and GLI_max: Green Leaf Index (mean and maximum). NDVI_mean and NDVI_max: Normalised Difference Vegetation Index (mean and maximum). CI_mean and CI_max: colour index (mean and maximum). Hei_E, Wid_E and Vol_E: height, width and volume estimated from UAV imagery. Hei_O, Wid_O and Vol_O: height, width and volume measured in the field. DMY: dry-mass yield; number of cladodes; DMY per cladode; CAI: cladode area index; Chlo: chlorophyll A and B contents. * p < 0.05; ** p < 0.01.
Disclaimer/Publisher’s Note: The statements, opinions and data contained in all publications are solely those of the individual author(s) and contributor(s) and not of MDPI and/or the editor(s). MDPI and/or the editor(s) disclaim responsibility for any injury to people or property resulting from any ideas, methods, instructions or products referred to in the content.