1. Introduction
Tea, as one of the world’s most widely consumed agricultural products, bears substantial economic, cultural, and health significance. China is the world’s largest tea producer, and its tea industry plays a vital role in the national economy and rural revitalization efforts. However, tea plants are highly susceptible to various diseases and pests throughout their growth cycle, including tea anthracnose, tea leaf spot disease, tea sooty mold, tea leaf rust, and green stink bugs, which severely affect both yield and quality [
1].
Traditional identification of tea diseases and pests relies primarily on manual expertise, supplemented by laboratory molecular testing to confirm findings [
2]. Given significant variations in cultivation scale, transport infrastructure, and management practices across tea plantations, traditional methods suffer from low efficiency, substantial subjective bias, and challenges in large-scale deployment. Accordingly, the development of an efficient, accurate, and automated technology for tea disease and pest identification has significant practical value for advancing precision management in tea plantations, enhancing tea yield and quality, and safeguarding the sustainable development of the tea industry.
In recent years, rapid advancements in computer vision and deep learning technologies have led to significant breakthroughs in crop pest and disease detection. Ferentinos et al. trained a CNN model using the PlantVillage dataset, achieving an accuracy of 99.53% [
3]. Fuentes et al. employed object detection frameworks, such as Faster R-CNN, for tomato pest and disease detection, attaining a mean average precision (mAP) of 85.98% with detection times of approximately 160 milliseconds per image, thereby enabling precise lesion localization and classification [
4]. To address lightweight model requirements, Wang et al. enhanced the YOLOv5 model by incorporating structures such as IASM and GhostNet. Compared with the original YOLOv5, this modification improved computational efficiency by 11.8% and accuracy by 3.98%, thereby accelerating inference while maintaining precision [
5]. These studies provide reliable technical pathways for crop pest and disease detection, laying a solid foundation for automated monitoring of pests and diseases in tea plants.
Within the domain of tea disease and pest identification, research has gradually shifted from traditional image processing approaches to deep learning techniques, while detection scenarios have expanded from laboratory simulations to natural field environments. Early studies primarily focused on extracting artificial features, such as leaf texture and color, using image processing techniques, which were then combined with traditional machine learning classifiers for classification. For instance, Tang et al. proposed a texture extraction method that integrates non-overlapping window local binary patterns and grey-scale co-occurrence matrices to classify fresh green tea leaves [
6]. Yang et al. proposed a rapid tea disease detection method based on infrared thermal imaging. By utilizing drones equipped with infrared cameras to capture greyscale images, they constructed a classifier from greyscale distribution curve features, combined with image processing steps including HSV color space transformation and threshold segmentation to identify disease lesions [
7]. Meng et al. proposed a hybrid feature-optimized tea disease recognition method. By extracting HOG features and Inception v3 model features, combined with PCA dimensionality reduction and a GBDT classifier, they achieved high-precision identification of tea red leaf spot and tea red star disease, with accuracies exceeding 95% [
8].
With the rise of convolutional neural networks, deep learning-based image classification methods have become mainstream. Lien, Fahad, and others researched tea leaf pest and disease classification using the TeaLeafBD dataset [
9,
10]. Ramdan et al. systematically evaluated the effectiveness of transfer learning for small-sample tea disease detection. Using a dataset from the West Java Tea Research Center, they compared different fine-tuning strategies for VGGNet, ResNet50, and Xception. They found that full-network fine-tuning with ResNet50 achieved an accuracy of 94.05%, confirming the effectiveness of transfer learning in mitigating agricultural data scarcity [
11]. Zakir Hossain et al. developed a customized CNN architecture incorporating residual blocks and batch normalization, achieving an overall accuracy of 99% [
12]. As research has advanced, data acquisition has shifted from laboratories to real-world tea plantations, leading to greater image background complexity and greater category diversity. Li et al. addressed pest and disease identification in complex environments for Yunnan large-leaf tea by adopting a “freeze-lower layers + train-upper layers” transfer learning strategy, achieving a test accuracy of 98.58%, which validates the superiority of this approach in complex scenarios [
13]. Xie et al. applied the Swin Transformer combined with transfer learning for tea disease and pest identification, achieving a recognition accuracy of 94%. They highlighted that the confusion between tea anthracnose and tea leaf spot disease stems from sample imbalance and the coexistence of multiple diseases [
14]. Notably, most of the above studies on tea disease identification based on image classification adopt an image-level annotation paradigm [
15]. Although this image classification approach achieves high accuracy, it cannot meet the object detection requirements for complex tea disease and pest scenarios.
To further meet practical application requirements, researchers have introduced object detection techniques to locate and classify diseased areas. Among these, the YOLO series of models has emerged as a mainstream benchmark architecture due to its favorable balance between real-time performance and accuracy. Studies [
16,
17,
18,
19,
20,
21] adopted YOLO as a baseline model and conducted systematic optimizations to address the challenges of tea disease detection in complex natural environments. Xue et al. proposed the YOLO-Tea model that incorporates ACmix attention, CBAM, and RFB modules. Experiments conducted on natural environment datasets captured by drones and mobile phones demonstrated that the model achieved an mAP@0.5 of 79.3%, representing a 7.6% improvement over the original model [
19]. Yao et al. addressed the challenges of small-sample and small-object detection by introducing ternary attention and a Wasserstein distance loss based on YOLOv7 tiny. Using a dataset of 182 small sample images, their model improved mAP@0.5 from 85.7% to 91.5% [
20]. Ye et al. proposed BRA-YOLOv7 by integrating FasterNet and dual-level routing attention into YOLOv7, further enhancing large-leaf disease detection capabilities [
21].
Although the aforementioned studies have achieved significant progress in the identification of tea diseases and pests, providing crucial technical references for automated pest control in tea plantations, further optimization is still required for real-world applications. Specifically, several challenges remain: (1) Existing public datasets, such as TeaLeafBD, mostly collect images from laboratory environments. These images differ significantly from real field scenes in terms of background complexity. (2) Most existing datasets adopt a lesion-level annotation strategy. Although this approach simplifies the detection task, it ignores the overall pathological patterns of entire leaves. In actual agricultural production, plant protection personnel usually make decisions based on the health status of the entire leaf. Therefore, lesion-level annotation cannot directly serve the management needs at the whole-leaf level. (3) Most existing methods are designed for only one or two types of diseases. They often rely on large-scale pre-training or complex data augmentation strategies. Under the conditions of a small sample, multiple categories, and whole-leaf annotations, these methods are prone to overfitting. Their model generalization capability is therefore limited. Therefore, the development of an efficient, robust, and lightweight target detection model for tea diseases and pests in complex natural environments remains of substantial research significance and application potential.
To address these challenges, this paper proposes an adaptive feature enhancement detection network based on YOLO11. The principal contributions of this paper are summarized as follows: (1) We present a leaf-level annotated tea disease and pest dataset. This dataset covers images of six types of tea diseases and pests captured in natural scenarios. It preserves real occlusions, lighting variations, and background complexity. Compared to laboratory datasets such as TeaLeafBD, it offers complementary scene characteristics. A comprehensive comparison with existing mainstream datasets is conducted, highlighting new challenges and providing research directions for future research in tea disease and pest recognition. (2) Through systematic experiments and error analysis, we evaluate the performance of mainstream detection models, revealing the inherent challenges of tea disease and pest detection under the conditions of dense occlusion and complex backgrounds. These findings offer valuable insights for future research. (3) We propose GatedFCA-YOLO, a detection network based on YOLO11n. It incorporates a small object detection layer to preserve high-resolution edge details and improve recall for minute lesions. In addition, we design the GatedFCA module, which combines spatial gating with channel attention to suppress background interference through dynamic feature enhancement. Compared with general attention modules such as CBAM [
22], the GatedFCA module introduces a non-learnable edge prior into its spatial gating mechanism. This prior guides the model to focus on lesion boundaries in complex scenes. It thereby prevents the model from overfitting to the background.
2. Materials and Methods
2.1. Overview of Tea Leaf Disease Dataset
This study investigates tea plantations in Guizhou Province, China, with a focus on prevalent pest and disease issues during tea cultivation in the region. The primary objective is to understand the local occurrence of tea diseases and pests, providing efficient and implementable monitoring methods for agricultural production practices in this area. To ensure alignment with real-world agricultural scenarios and reduce model training errors associated with discrepancies between laboratory simulations and field conditions, data were collected using mobile phones (OnePlus, Honor, etc.) directly within natural tea plantation environments. A total of 614 clear and complete images were obtained, accurately capturing the characteristics of typical pests and diseases. Following researcher screening and classification assistance from plant pathologists, 549 images were selected to form a tea disease and pest dataset. This dataset includes tea leaf samples affected by 6 typical diseases and insect pests in Guizhou tea plantations, specifically: Leaf Beetle, Tea White Scab, Tea Blister Blight, Tea Blister Blight (Leaf Perforation), Apolygus Lucorum, and Tea Plant Anthracnose. Furthermore, the images encompass samples of leaves under dense, sparse, and isolated conditions, as well as diverse scenarios with subtle variations in background and illumination. This provides a comprehensive representation of real-world field environments, offering more representative data for subsequent model training.
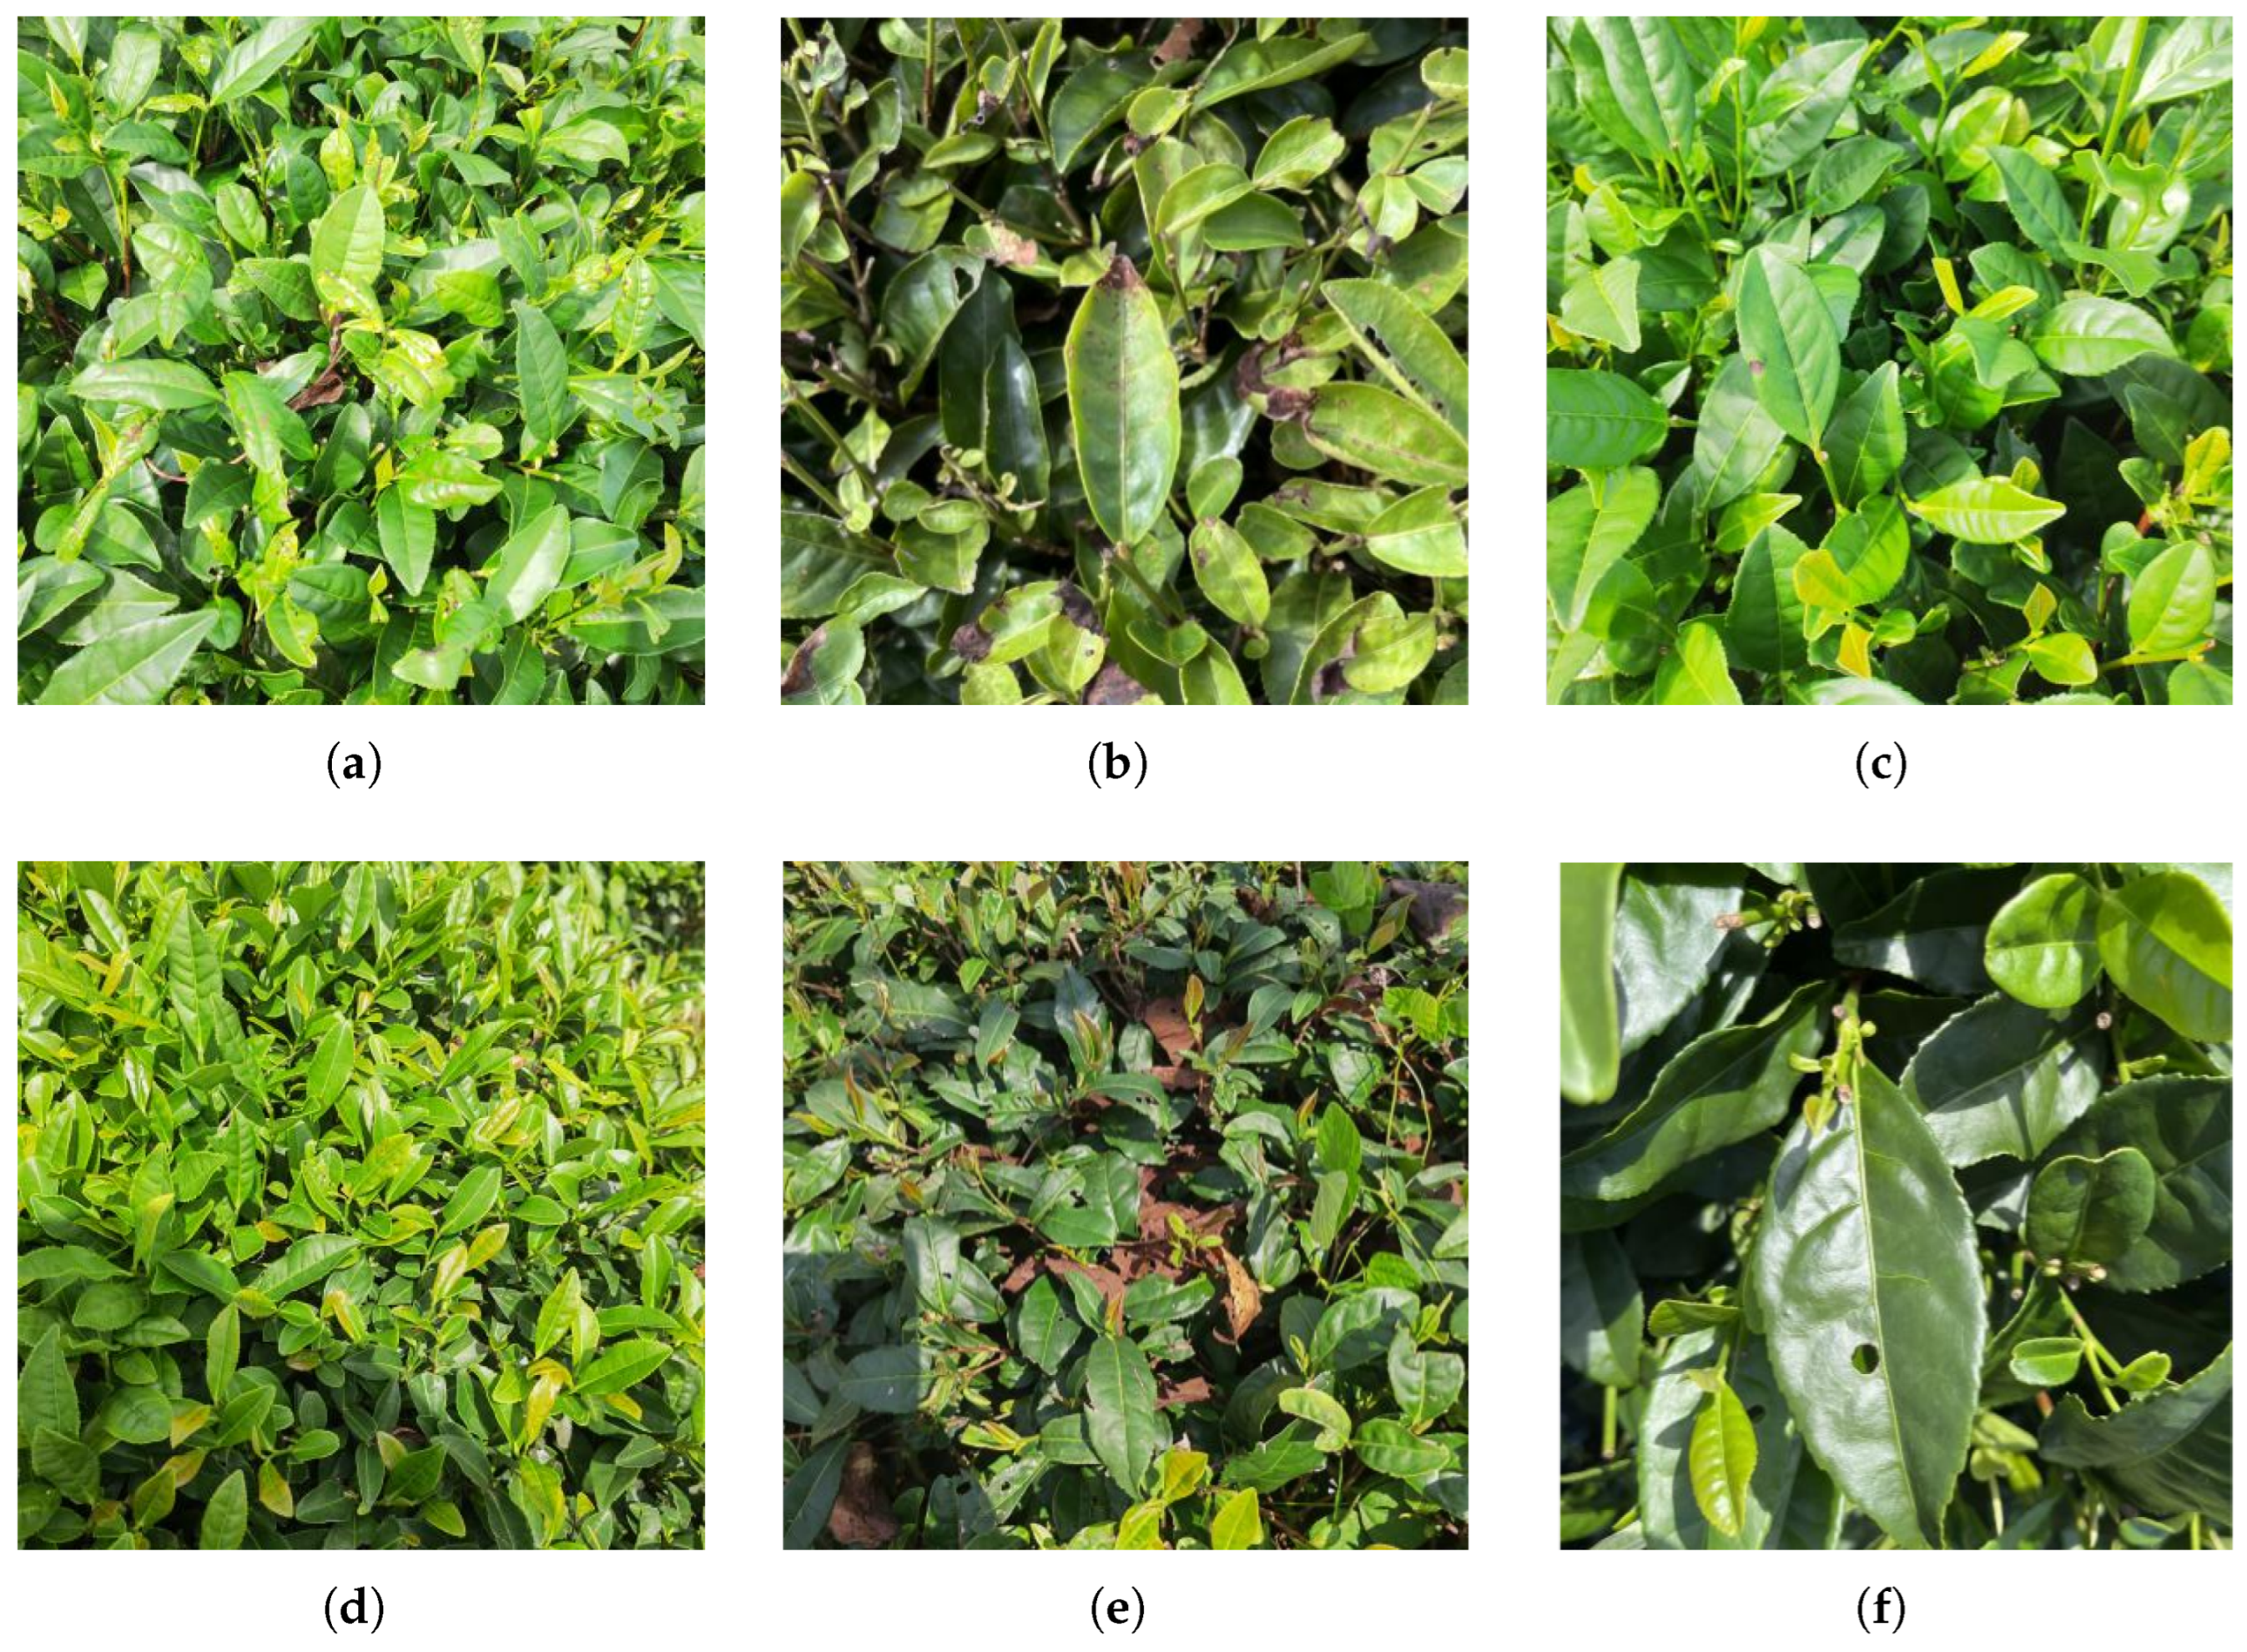
Figure 1 presents several representative samples from our dataset.
To better understand the visual characteristics and detection challenges of each category, we describe the typical symptoms and inherent difficulties for the six tea disease and pest classes as follows.
Tea White Scab: In the early stage, the lesion appears as a tiny light brown dot about the size of a pinhead. In the later stage, it develops into a round, concave spot measuring 1–2 mm in diameter. This spot has a grayish-white center and a raised purplish-brown margin.
Tea Plant Anthracnose: The lesion often starts from the leaf tip or leaf margin. It initially appears as a small, yellowish-green, water-soaked spot. In the middle and late stages, it expands into a dark brown to deep brown necrotic spot. This lesion often exhibits concentric rings.
Tea Blister Blight: In the early stage, the lesion appears lemon-yellowish-green and translucent. It has very low contrast with the surrounding healthy tissue. In the middle stage, the lesion forms white blister-like protrusions on the lower leaf surface. In the later stage, the center of the blister becomes necrotic and turns brown. When multiple lesions merge, they can cause the leaf to become twisted and shriveled.
Tea Blister Blight (Leaf Perforation): Necrotic tissue detaches and forms irregular perforations. This leads to leaf damage. The irregular shape of the perforation margins is highly similar to the holes left by leaf-feeding insect damage.
Apolygus Lucorum: The affected leaves become shriveled. The waxy ornamentation changes from flat to ridge-like. In severe cases, the young shoots wither and die, and the leaves curl upward.
Leaf Beetle: The beetles feed on the underside of young leaves. They create small round holes about 2–3 mm in diameter. Multiple holes may merge into larger irregular holes. In severe cases, the entire leaf becomes tattered.
Based on the surface characteristics of these six typical pests and diseases, we can identify the main difficulties in detection: (1) Most lesion scales are very small, so they are easily missed or mistaken for background noise in standard-resolution images. (2) The visual contrast between early-stage lesions and healthy leaf tissue is often low, especially for Tea Blister Blight and Tea Plant Anthracnose. (3) The dense distribution of lesions and the fusion of adjacent lesions create highly irregular boundaries, and this complicates bounding box regression.
Subsequently, low-quality samples, such as those with severe blurring or occlusion by people, were manually removed, resulting in a final dataset comprising 549 images. Image annotation was performed using LabelImg, following a leaf-level annotation strategy. Under this approach, each infected leaf was annotated with a bounding box and assigned a corresponding pest or disease category label. This strategy was chosen for three reasons: first, pest and disease control decisions in tea cultivation are typically made at the leaf level; second, leaf-level annotation improves efficiency and reduces the time and cost of manual labeling; and third, it avoids the technical difficulties associated with small object detection, thereby allowing greater emphasis on disease classification accuracy. For occluded leaves, visible parts were annotated to the greatest extent possible, resulting in some overlapping bounding boxes. Finally, all images were uniformly resized to a resolution of 2000 × 2000 pixels to facilitate subsequent model training.
Table 1 presents the distribution of object counts across all categories in the dataset. A considerable class imbalance is evident: the top three categories constitute 82% of the total object count, while the bottom three categories represent only 12%. These bottom three categories were defined as data scarcity categories, including Leaf Beetle, Tea Blister Blight (Leaf Perforation), and Tea Plant Anthracnose.
Table 2 presents the distribution of object sizes within the dataset, categorized as small, medium, and large. At a resolution of 2000 × 2000, 93.8% of the objects are large objects (larger than 96 × 96 pixels), with very few medium-sized objects and no small objects. Such a scale distribution significantly increases the risk of model overfitting to large objects, leading to reduced detection accuracy for medium-sized objects. In the data-scarce categories, only 0–1% of objects are medium-sized, which slightly mitigates detection difficulty compared to the top categories.
2.2. Comparative Analysis of Public Datasets
We compared our dataset with existing mainstream tea disease and pest datasets, TealeafBD [
23] and tea-leaf-diseases [
24]. The key indicators are summarized in
Table 3. As shown in
Table 3, our dataset is the first tea disease and pest dataset to employ leaf-level annotation. Unlike the lesion-level annotation used in tea-leaf diseases, leaf-level annotation designates the entire pest- or disease-infected leaf as the annotation unit, with each bounding box encompassing both the lesion area and the healthy tissue of the leaf. This annotation strategy better aligns with the actual identification logic used by field plant protection personnel. However, this annotation approach introduces new technical challenges. For categories with very small lesion areas, healthy tissue dominates the bounding box, making the model prone to missed detections or false positives. In contrast, lesion-level annotation focuses on the diseased area, making the target features more prominent, but it ignores the manifestation patterns at the whole-leaf scale. By implementing leaf-level annotation, our dataset addresses this gap in existing datasets regarding whole-leaf symptom modeling, providing a data foundation for developing detection models that better align with agricultural practice.
Based on the above analysis, this study chooses the leaf-level annotation strategy for the following three reasons. (1) It aligns well with agricultural application needs. Leaf-level annotation directly serves the practical logic of determining whether a leaf is diseased, what type of disease it has, and whether control intervention is needed. This aligns the model’s output naturally with agricultural decision-making requirements. (2) It offers optimal efficiency under limited annotation budgets. High-quality data annotation is a core bottleneck in data-scarce scenarios. Leaf-level annotation can obtain a larger number of annotated samples with the same human effort. This provides sufficient data support for model training under data scarcity. (3) It introduces a stronger contextual learning constraint for the model. Using the entire diseased leaf as the detection unit forces the model to extract discriminative features from the global context of the leaf.
In terms of total image count and overall number of objects, our dataset is smaller than both TealeafBD and tea-leaf-diseases. However, a smaller scale does not imply limited significance. All images in our dataset were captured in real-world tea plantation environments under natural lighting conditions and complex backgrounds, without any form of background processing. In contrast, some images in the comparative datasets were collected in controlled environments or subjected to background removal. Models trained on such data often exhibit limited generalization capability when applied to real-world field scenarios. Furthermore, the object density in our dataset is significantly higher than that of the other two datasets. Individual images frequently contain multiple diseased leaves, often coexisting with mutual occlusion between leaves and interwoven with healthy branches and foliage. This combination of high object density and complex backgrounds presents severe challenges in both dense object detection and occlusion handling, placing greater demands on the model’s feature extraction capability and contextual modeling ability.
The six categories of tea diseases and pests included in our dataset possess distinct regional ecological characteristics. Among these, White Scab and Blister Blight are typical high-altitude cloud-mist-associated diseases, often occurring in tea-growing regions characterized by higher altitudes and greater humidity, and are particularly prevalent in Guizhou Province, China. In contrast, the other two datasets primarily reflect pest and disease pressures in tropical tea-growing regions, such as Red Spider and Helopeltis, which thrive under high-temperature and high-humidity conditions. These two types of datasets demonstrate geographical and ecological complementarity in terms of tea disease and pest species. Their integration can provide more comprehensive data support for the development of tea disease and pest identification models across ecological zones, ultimately enhancing model generalization capability.
2.3. Image Augmentation
To address data scarcity, three data augmentation methods were used: noise injection, blur enhancement, and weather simulation. These methods are designed to simulate sensor noise, camera shake, and defocus interference, as well as natural weather conditions such as rain, snow, and fog, respectively, thereby increasing data diversity.
Imbalanced category distributions can introduce bias during model training, leading to overfitting on majority classes with abundant samples while failing to achieve sufficient recognition accuracy for minority classes with scarce samples. To address this issue, a hierarchical augmentation strategy was adopted to selectively augment minority-class samples, using the 75th percentile of the total object count as the benchmark. The specific augmentation rules are as follows: (1) If the number of objects in a given class is less than the median, the class is augmented to 1.5 times the 75th percentile; (2) If the number of objects is between the median and the 75th percentile, the class is augmented to 1.2 times the 75th percentile; (3) Classes with object counts exceeding the 75th percentile are not further augmented. This hierarchical augmentation strategy is designed to improve data diversity and balance object counts across categories while preventing excessive expansion of minority classes, thereby avoiding model overfitting caused by sample redundancy and ensuring stable training and recognition accuracy. The final dataset comprises 1384 images and 5847 objects.
2.4. Method
2.4.1. YOLO11
YOLO11 is a real-time object detection model formally released by Ultralytics in September 2024 [
25]. Its core design philosophy emphasizes a balance between parameter efficiency and adaptability for multi-platform deployment. YOLO11 follows the classic YOLO design paradigm, with its overall architecture comprising a backbone, neck, and detection head. The model incorporates several key innovations within its local components, including the C3k2 module, the C2PSA module, and an asymmetric lightweight reconstruction strategy for the detection head. The C3k2 module, an enhanced version of the CSP bottleneck, serves as the fundamental building block in both the backbone and neck networks. By integrating optional C3k bottleneck layers, this module improves upon C2f to enable finer-grained, multi-scale feature extraction and fusion.
To further enhance the model’s ability to capture global contextual information and address the inherent localization bias of deep convolutional neural networks, YOLO11 introduces the C2PSA module after the SPPF module at the end of the backbone network. This module incorporates a Multi-Head Spatial Attention mechanism into the C2f framework, enabling the model to more effectively distinguish features in complex scenes with background interference or object occlusion, thereby improving its detection robustness.
For the detection head, YOLO11 retains the classic Decoupled Head architecture, which separates the feature flows for classification and regression tasks. This design effectively avoids the common feature conflicts in multi-task learning. A key improvement over YOLOv8 is the incorporation of Depthwise Separable Convolution (DWConv) into the classification branch, resulting in a lightweight detection head. Since classification tasks are less sensitive to spatial position than regression tasks, this asymmetric design reduces the number of parameters and FLOPs without compromising accuracy, making the model more suitable for edge devices. Furthermore, YOLO11 adopts a fully Anchor-Free strategy, directly predicting the distances from each grid point to the four sides of the corresponding bounding box. This approach eliminates the reliance on predefined anchors and simplifies training hyperparameters.
Regarding the loss function, YOLO11’s total loss comprises three components: bounding-box regression loss, classification loss, and distribution loss. The model employs a Task Alignment Learning (TAL) strategy to dynamically assign positive and negative samples. These three losses are subsequently weighted and summed to balance gradient backpropagation, enabling end-to-end optimization.
2.4.2. Adaptive Fine-Grained Channel Attention
The Adaptive Fine-Grained Channel Attention (FCAttention) module was initially developed for image defogging [
26]. It enhances a network’s capacity to perceive and integrate both global and local information. In contrast, traditional Squeeze-and-Excitation (SE) [
27] channel attention mechanisms rely on fully connected layers to capture global information, but lack interaction with local information. This limitation leads to less accurate feature weight allocation, especially in structurally complex scenes.
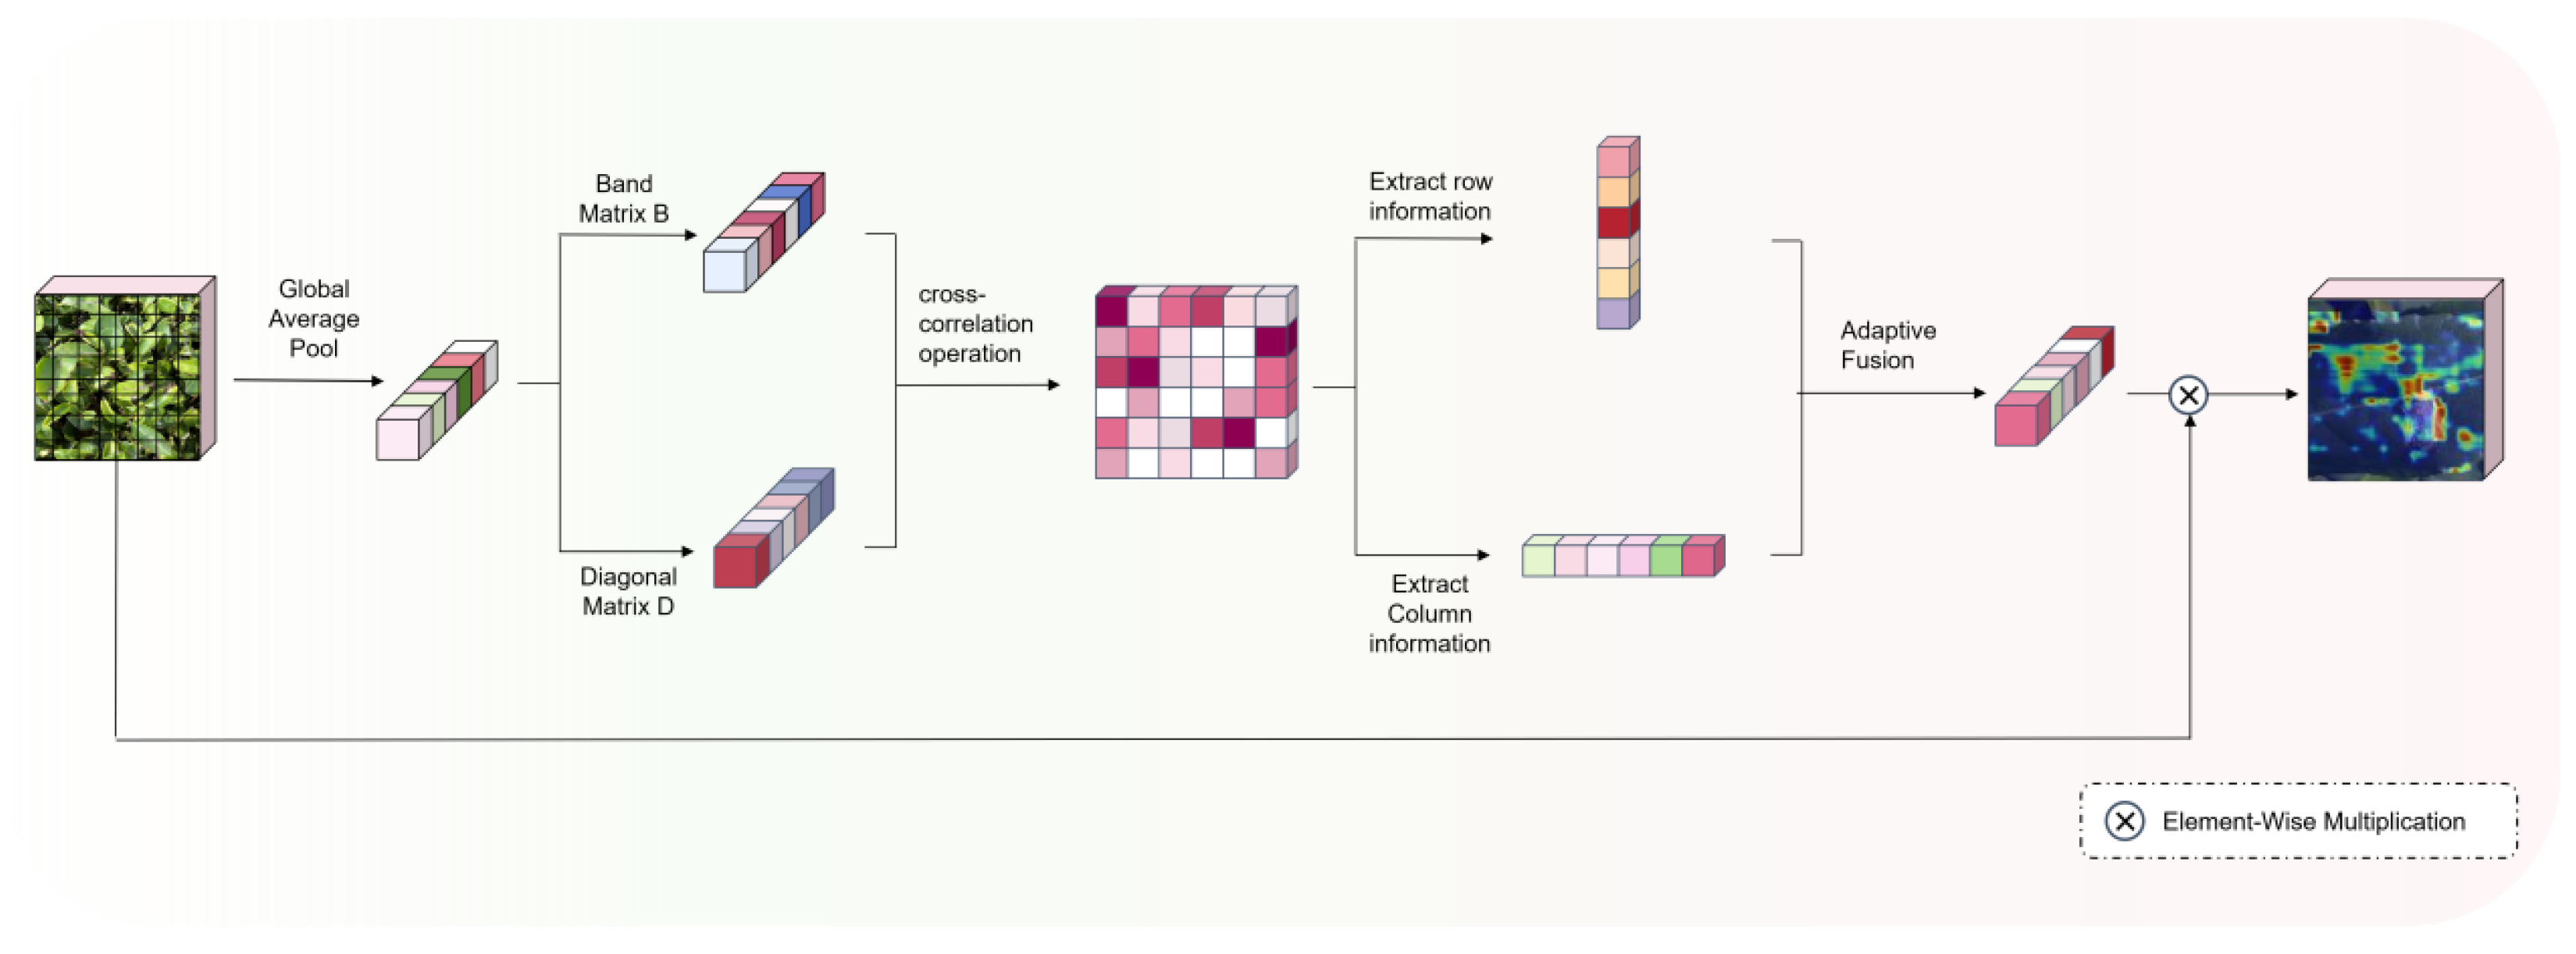
In contrast, the FCAttention module adopts a dual-path architecture. It uses a correlation matrix to model relationships between global and local information at varying granularities. This design facilitates interaction between global and local features, enabling more efficient feature-weight allocation. The computational workflow is illustrated in
Figure 2.
As shown in Equation (
1), the module first applies Global Average Pooling to spatially compress the input feature map
, thereby extracting the channel descriptor
.
In Equations (
2)–(
4), the module utilizes a diagonal matrix
D and a banded matrix
B to respectively capture the global dependencies and
and local interactions
among neighboring channels. It further constructs a correlation matrix through cross-correlation calculations.
Subsequently, in Equation (
5), row and column information is extracted from the correlation matrix
M. A learnable factor
is introduced to adaptively integrate global and local features, generating the final channel attention weights
W.
where
denotes the sigmoid activation function. The final step shown in Equation (
6) performs a channel-wise multiplication between the attention weights
W and the original feature map
X, yielding the adaptively selected feature map
.
In dense, occluded, and multi-scale tea pest detection tasks, various interference factors often affect performance, including uneven lighting, shadow interference, and structural background noise. Pest and disease features are frequently highly coupled with such noise. Traditional SE attention mechanisms rely exclusively on fully connected layers to capture global information. However, they lack effective interaction with local information, which may result in biased distribution of feature weights.
FCAttention addresses this limitation by constructing a global-local correlation matrix through cross-correlation operations. The local interaction branch captures subtle spatial variations within images, while the global branch suppresses background information. This fine-grained feature processing enables the model to focus computational resources on target pest regions, reducing both false-positive and false-negative rates in densely occluded scenarios. Consequently, FCAttention overcomes the limitations of traditional attention mechanisms in feature-level interaction.
Furthermore, the module’s learnable factors enable the model to dynamically select feature preferences. For large-scale objects, it automatically increases the proportion of global feature weights. For minute targets, it retains more local detail features from neighboring channels. Despite the imbalance in target size and category distribution within the dataset, the model demonstrates robust detection performance in complex tea pest tasks and adapts to feature learning in small-sample scenarios.
2.4.3. The GatedFCA-YOLO Network Model
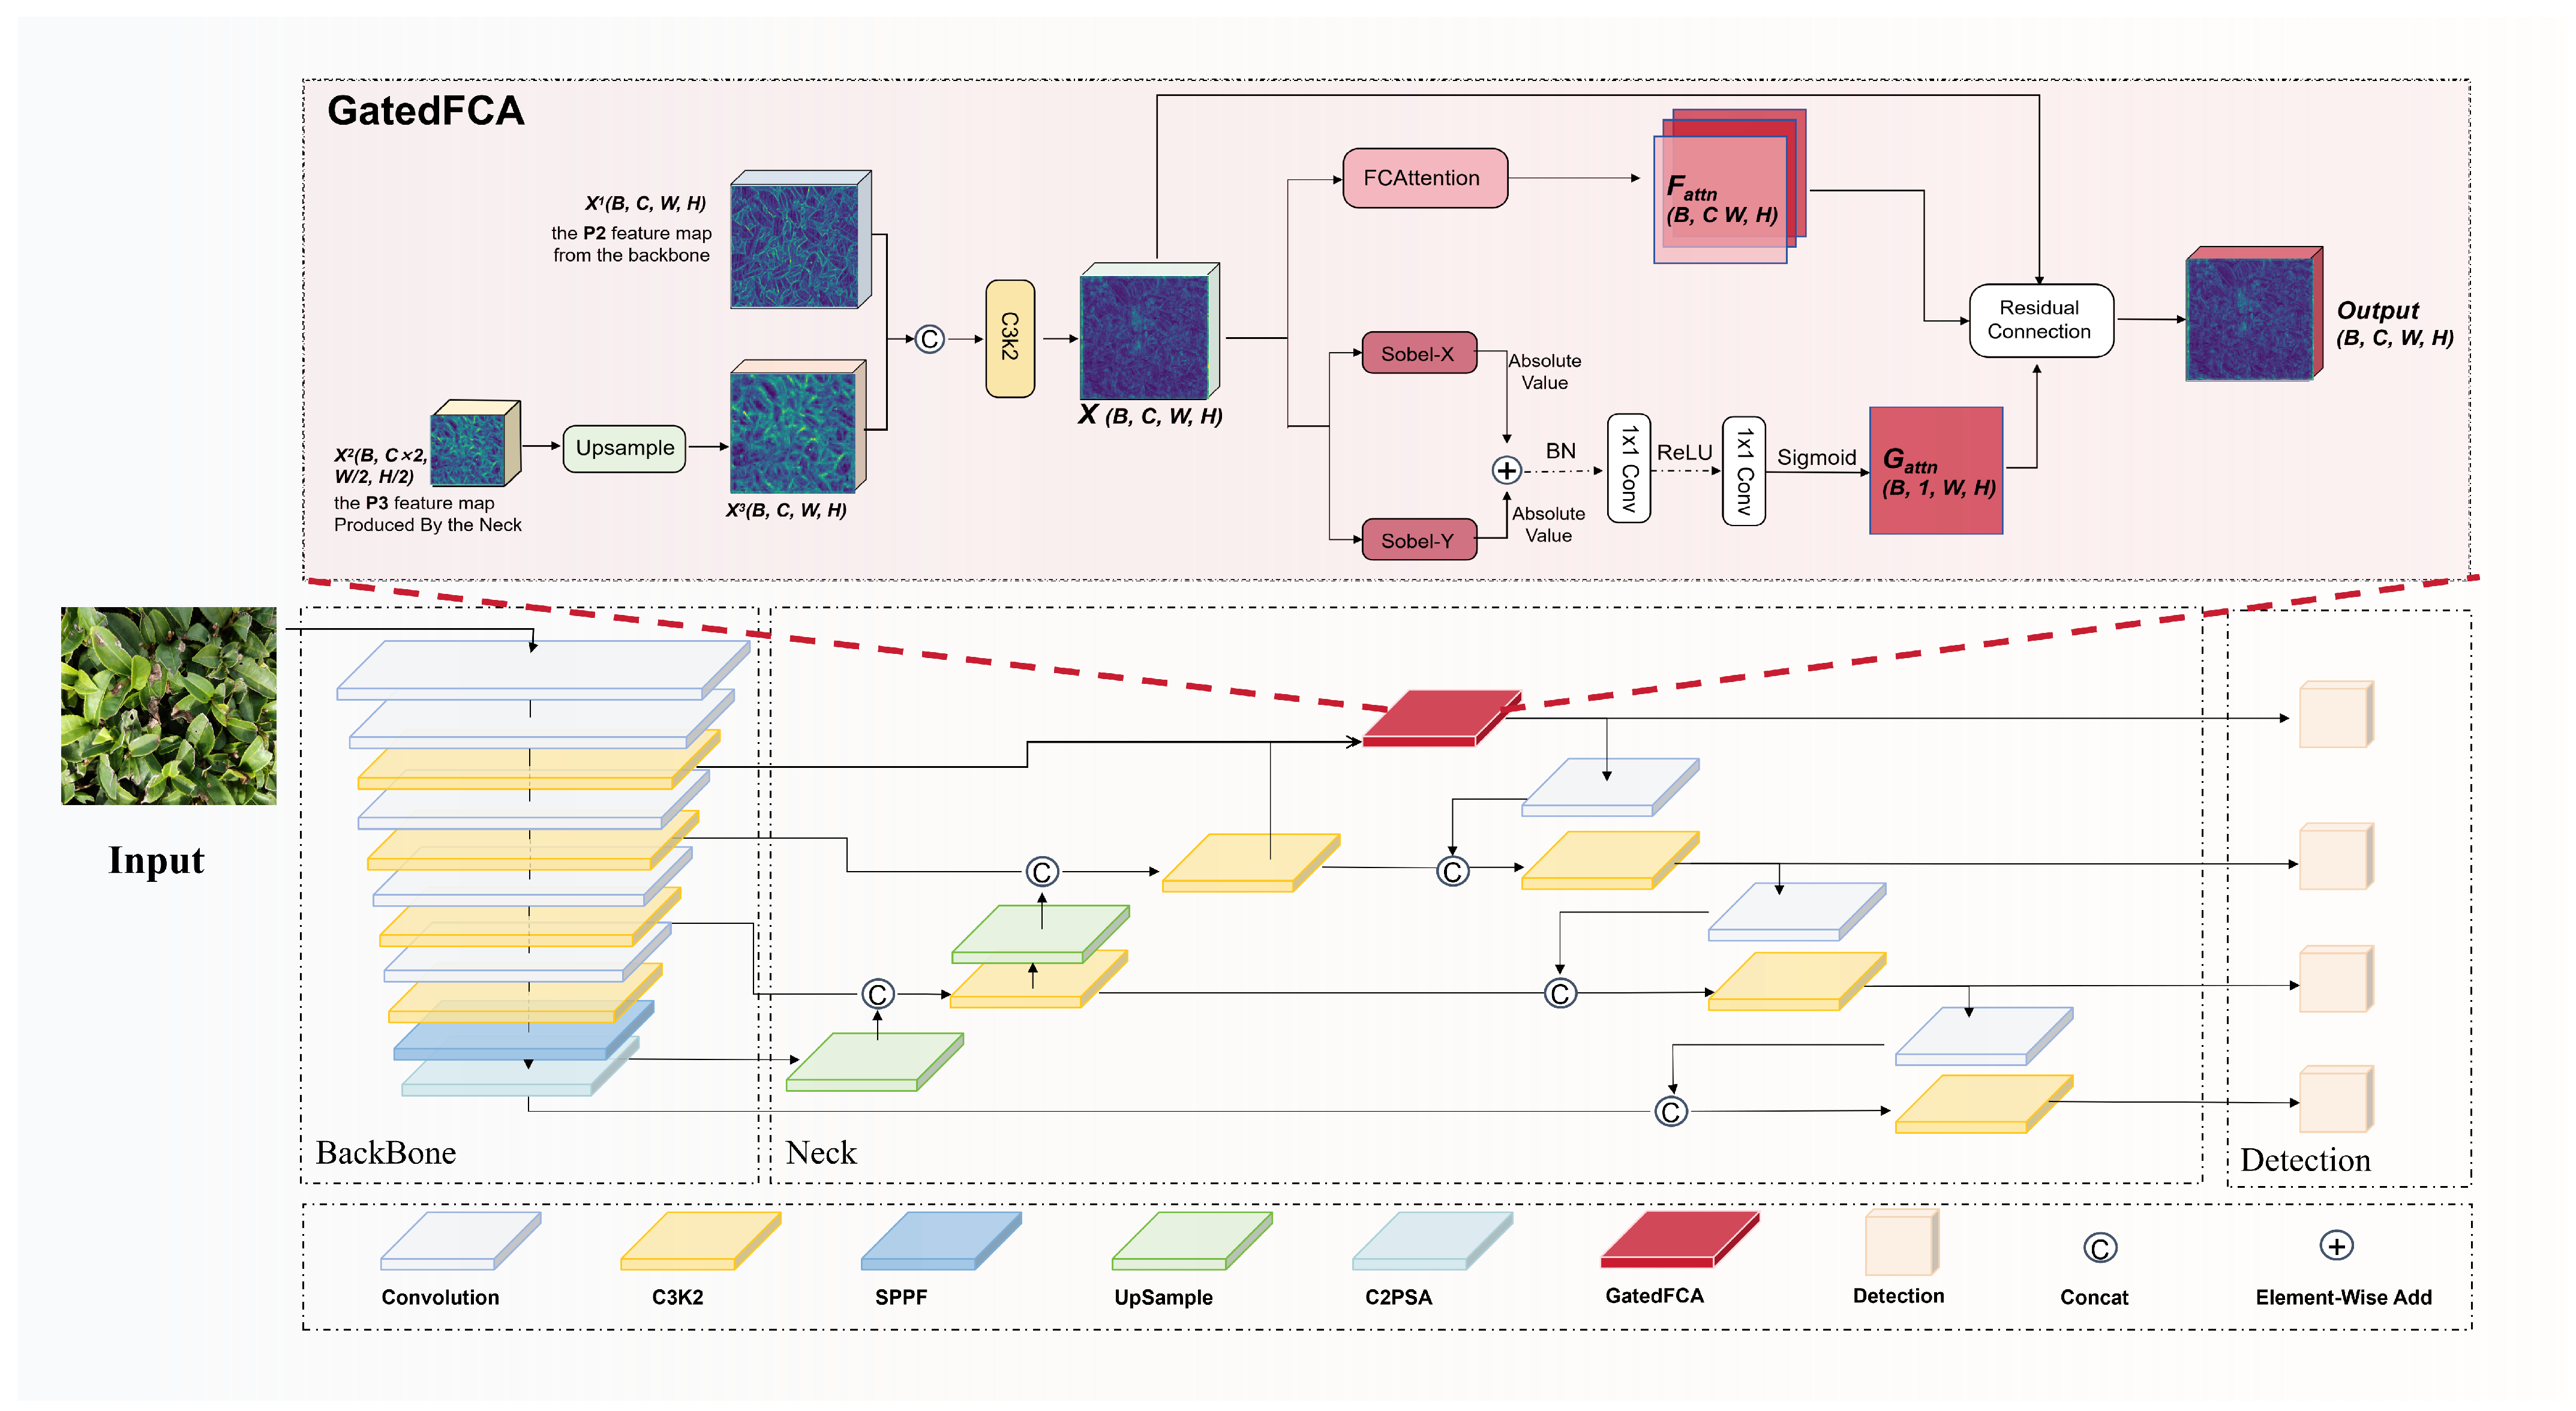
Tea disease and pest detection faces several challenges, including dense occlusion, uneven category distribution, and significant scale variation. To address these limitations, this study proposes an enhanced detection scheme based on the YOLO11 baseline model to improve detection accuracy. The architecture of the proposed model is illustrated in
Figure 3.
In the YOLO series models, the feature pyramid typically constructs multi-scale feature maps based on scales of 1/8, 1/16, and 1/32 of the input image. Among these, the highest-resolution feature map (the P3 layer) corresponds to a stride of 1/8 of the original image. This layer can capture a certain level of detailed information. However, for the tiny lesions or puncture holes commonly seen in tea disease and pest images, which are only 1–3 mm in diameter, the feature map with a 1/8 stride still struggles to preserve clear edge and texture information. Therefore, we introduce a small object-detection layer into YOLOv1. Specifically, we add a high-resolution feature map with a stride of 1/4 (the P2 layer) to the feature pyramid. This layer performs an additional upsampling operation and fuses it with early feature maps from the backbone network that contain rich spatial details. This operation effectively refines the model’s effective receptive field from the original 1/8 granularity to 1/4 granularity, preserving edge and texture information that deep networks struggle to capture. This improvement directly enhances the model’s ability to perceive fine details of small objects. It helps to more accurately localize and classify very small lesions and insect damage, thereby improving both the recall rate and detection accuracy for small targets.
However, this small object-detection layer integrates shallow texture information from the backbone network with deep semantic features from the path-aggregation network. The semantic gap between these two components introduces substantial redundancy, hindering adaptation to the feature representation requirements of this study.
To overcome this limitation, an adaptive feature enhancement strategy based on the FCAttention module is proposed. Based on the P2 detection layer, we add a spatial gating branch and an FCAttention branch. Specifically, in the channel branch, we use the FCAttention module to enhance the P2 feature map
X, generating an enhanced feature map
. This module effectively fuses deep semantic information with shallow details through a global-local correlation matrix. It highlights disease-related features and suppresses background interference to some extent. In the spatial gating branch, we first apply a fixed Sobel operator to the P2 feature map
X to compute the gradient magnitude. This step extracts spatial structural information such as edges and textures. We then use a 1 × 1 convolutional layer to compress the channel dimension of the resulting gradient magnitude map
G to one. A Sigmoid function is applied to activate the map, producing a spatial attention gating map
. Finally, we dynamically mix the gating map
, the original feature
X, and the enhanced feature map
through a soft residual operation. The fusion process is formally expressed as Equation (
7). The introduction of the spatial attention gating map allows the model to adaptively decide which spatial positions should retain the original features and how much of the FCAttention-enhanced features should be introduced. In high-gradient regions such as lesion boundaries, the gating value is close to 1. The output then mainly consists of the FCAttention-enhanced features, which strengthen the details in the feature map. In flat background regions, the gating value is close to 0. The output retains the original P2 features, thereby preventing excessive gating from causing a loss of original feature information.
In addition, in complex and dense scenes, the model can easily overfit to the overall leaf shape or background texture. It may then ignore the true lesion features. GatedFCA effectively alleviates this problem in two ways. (1) The gating branch uses a non-learnable Sobel operator to extract edge information. This prior is independent of the data volume. It allows the model to focus on lesion-edge structures in the early stage of training. Even with limited samples, the model can automatically focus on discriminative regions instead of learning the entire leaf features indiscriminately. (2) In whole-leaf annotations, healthy regions account for a large proportion and can easily become a source of noise. The selective mechanism prevents the model from blindly learning from the background. It improves the model’s classification discrimination capability to some extent. Therefore, GatedFCA can more stably improve detection accuracy and recall under complex and dense tea disease and pest conditions.
Compared to traditional channel attention mechanisms that rely exclusively on fully connected layers, this approach achieves an adaptive balance between computational efficiency and detection accuracy through feature quality awareness. It demonstrates robust detection performance in tea disease and pest detection tasks while adapting to feature learning requirements in complex scenarios.
2.5. Training Environment and Evaluation Metrics
This study divides the dataset into training, validation, and test sets at a ratio of 8:1:1. This division facilitates model training, hyperparameter tuning, and evaluation. During the training process, we use the validation set to evaluate model performance. It helps us select the optimal parameters and adjust the training strategy. The test set serves as an independent dataset for final evaluation. It assesses the model’s generalization ability and its practical application effectiveness.
The detailed experimental hardware and software environment employed in this study is presented in
Table 4.
To evaluate model performance, this study adopts the COCO evaluation framework as the primary assessment metric. Its core indicators—mean precision and mean recall—measure detection performance across multiple dimensions and granularity levels. The key metrics used in this study are summarized in
Table 5. In addition to detection accuracy, inference speed is assessed using FPS, GFLOPS, and latency. The formulas for calculating
precision,
recall,
AP and
AR are shown in Equations (
8)–(
11).
In these definitions,
TP (True Positive) represents the number of samples that the model predicts as a certain tea disease and that actually belong to that category.
FP (False Positive) represents the number of samples that the model predicts as a certain tea disease but that do not actually belong to that category.
FN (False Negative) represents the number of samples that the model predicts as background but that actually belong to a certain tea disease category. In Equation (
10),
r denotes the recall variable used to compute the integral of the product of precision and recall over the interval from 0 to 1. In Equation (
11),
C represents the number of tea disease categories.
In the ablation experiments, the TIDE (Tool for Identifying Detection Errors) is also employed to assess model performance deficiencies [
28]. This diagnostic tool systematically analyzes the sources of object detection errors by decomposing overall prediction errors into six major categories: classification errors, localization errors, classification and localization errors, background misclassifications, duplicate detections, and missed ground truth. The definitions of these six error types are provided in
Table 6. By progressively addressing specific error types and observing the corresponding performance improvements, we quantify the actual impact of each error category. This approach not only calculates the proportions of each error type among total errors but also enables precise diagnosis of model weaknesses by aggregating the performance losses caused by various errors. The resulting analysis offers clear guidance for subsequent model optimization.
3. Results and Discussion
3.1. Comparison with Multiple Mainstream Models
We systematically compared our model with mainstream models from the YOLO series.
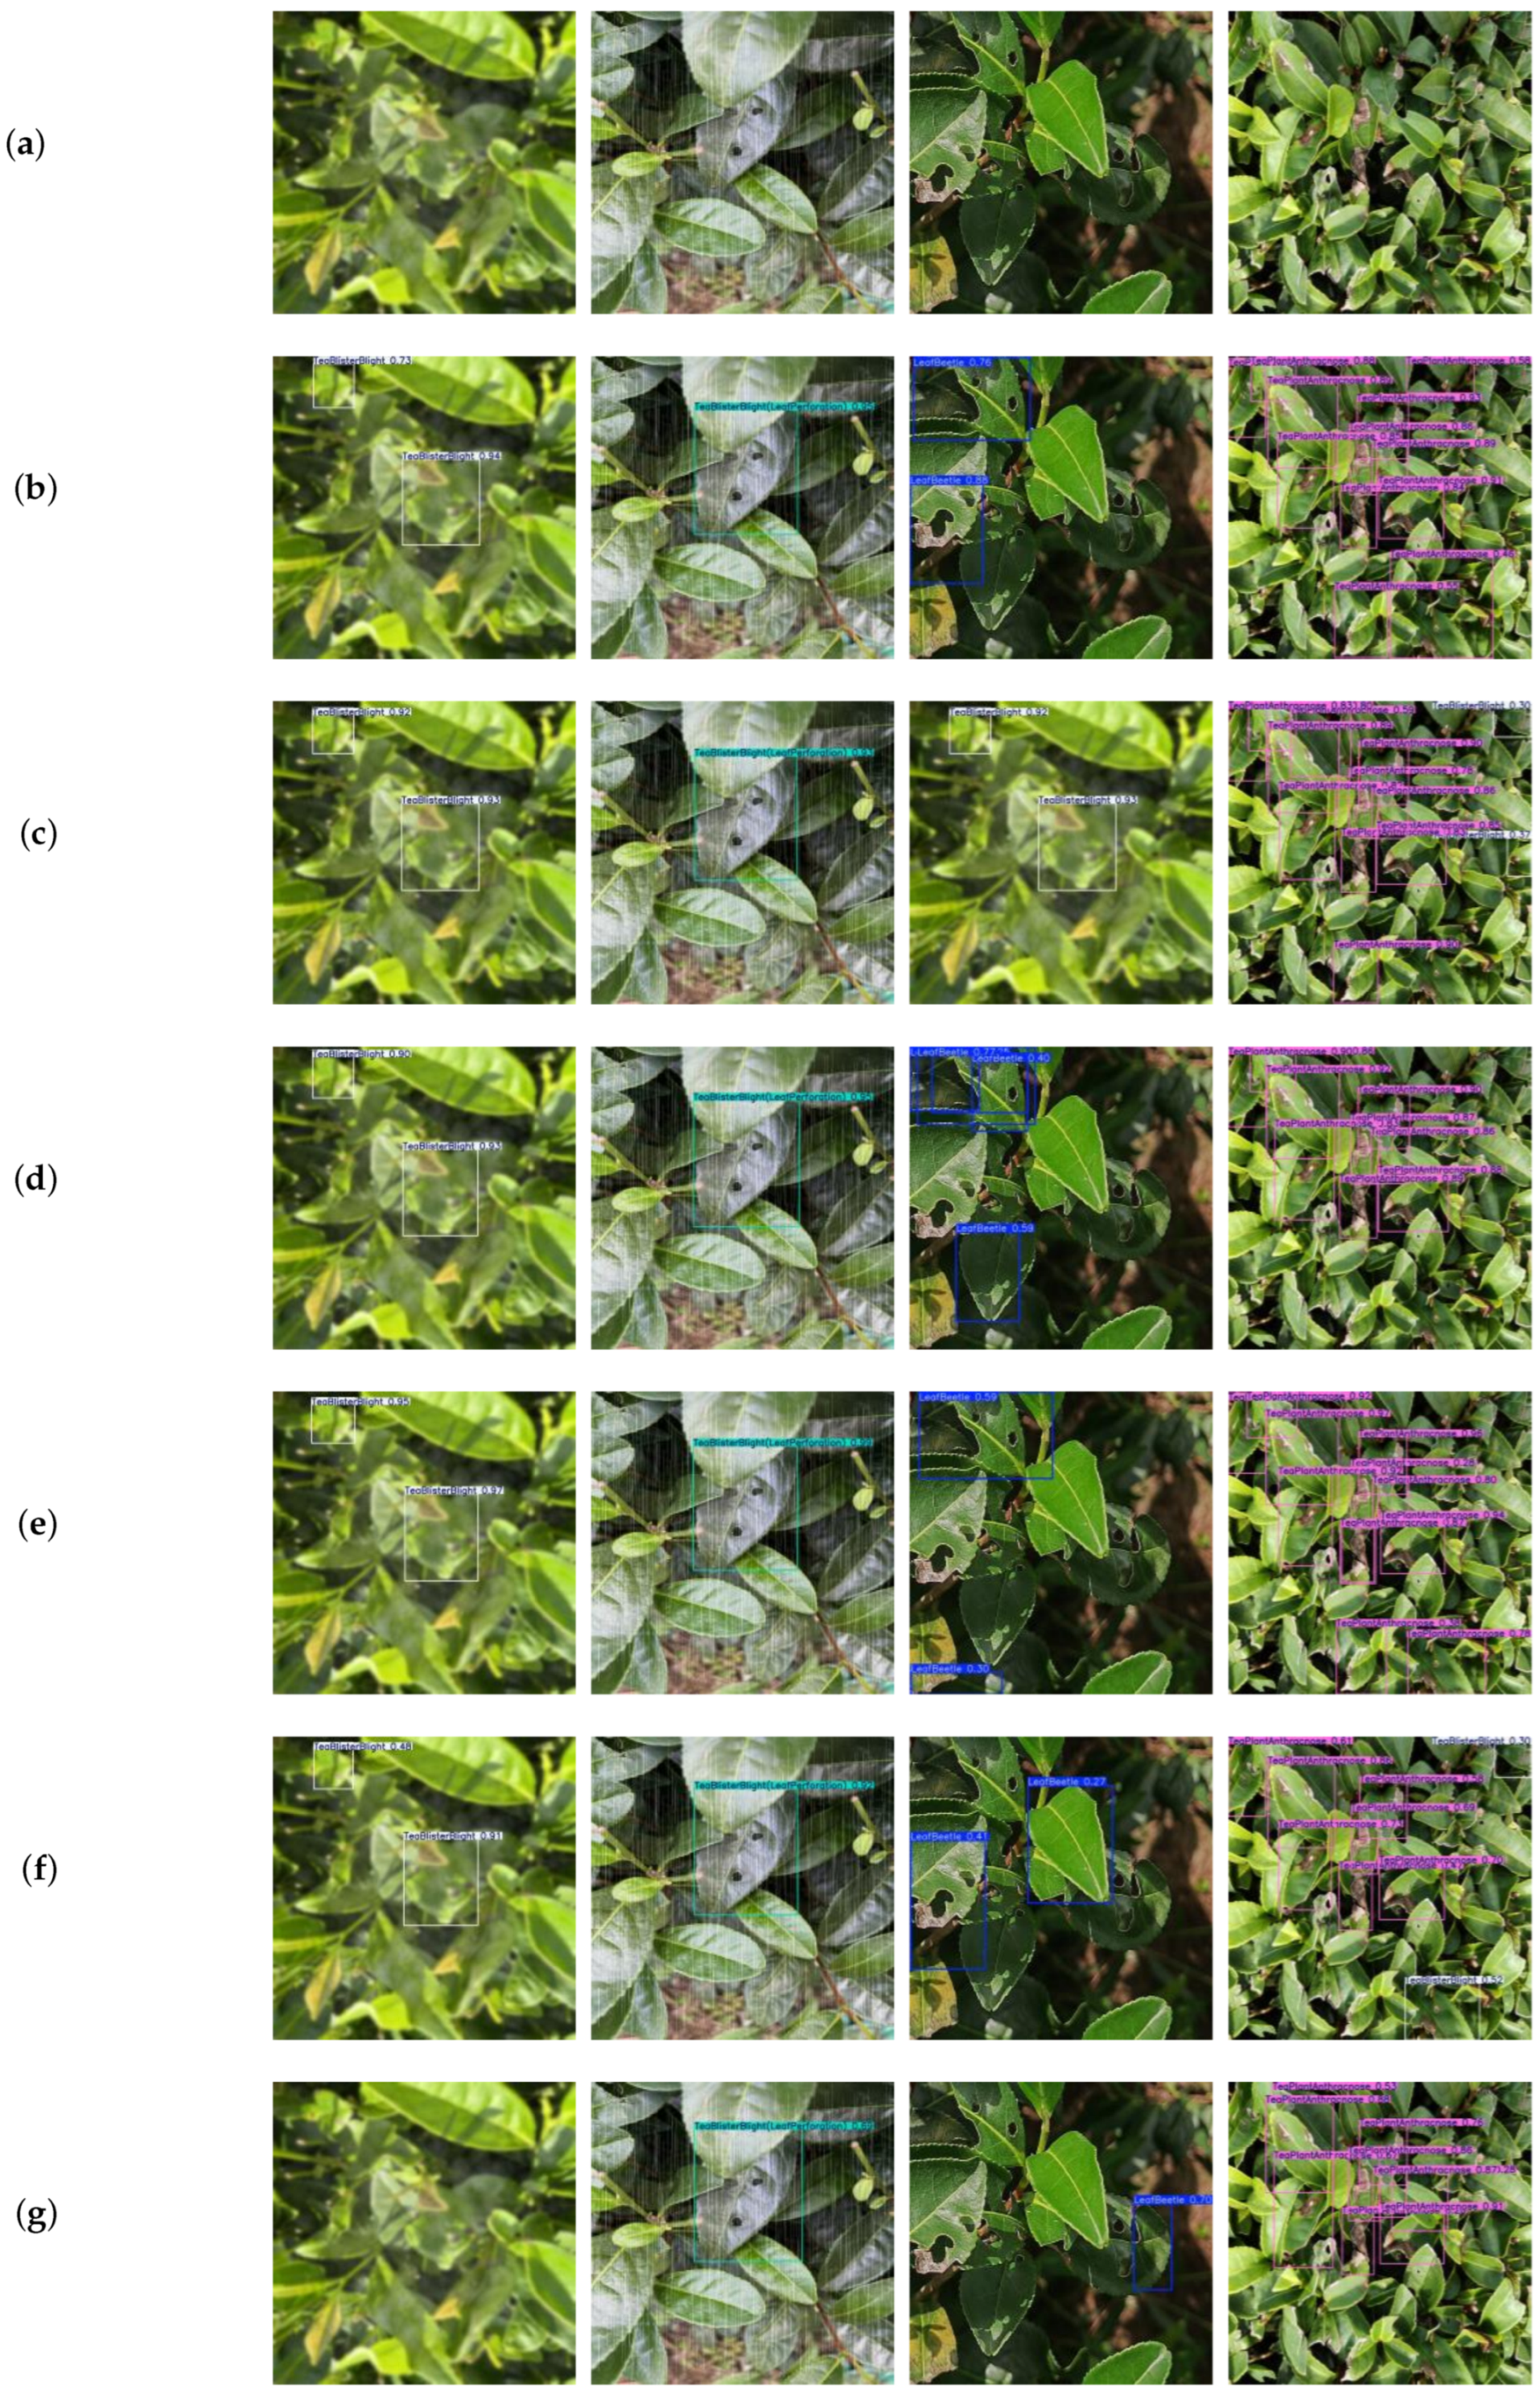
Table 7 presents the performance of all models on the test set, while their detection results are presented in
Figure 4. Our proposed model demonstrates the best detection performance when the random seed is set to 42, outperforming all comparison models in terms of mAP@0.5, mAP@0.5:0.95, and AR@100. Compared to the baseline YOLOv11n, it achieves improvements of 3.0%, 3.7%, and 0.9%, respectively. In
Appendix A, we provide the comparative experimental results of YOLO11n and GatedFCA-YOLO under different random seeds.
This improvement, although relatively modest, still demonstrates the effectiveness of the synergy between the two core modules. First, the P2 small object detection layer preserves high-resolution edge and texture details. This enables the model to capture the fine structure of lesions. As a result, the model achieves more accurate localization under strict IoU constraints. Second, the spatial gating mechanism in the GatedFCA module uses the Sobel gradient prior. It assigns higher weights to lesion boundary regions. This fully activates the discriminative features extracted by the FCA channel attention. At the same time, it suppresses background noise from leaf tissues. Although the whole-leaf annotation strategy yields a high proportion of healthy regions within each bounding box, thereby increasing intra-class variance, the proposed gating-attention synergy still guides the network to focus on a few critical lesion areas. It thereby achieves stable accuracy gains under data-scarce conditions. These results indicate that GatedFCA-YOLO not only improves recall but also significantly enhances the joint accuracy of localization and classification for small-target disease detection in complex field backgrounds. This verifies the effectiveness of the proposed modules for the whole-leaf annotation scenario.
In terms of inference efficiency, our model achieves 495 FPS on an NVIDIA RTX 4090, with a latency of 0.129 s per frame. Compared to the baseline YOLO11n, these values represent a decrease of approximately 26% and 36%, respectively. This performance drop mainly comes from two sources. First, the introduction of the P2 small object detection layer adds a set of high-resolution feature maps to the feature pyramid. This significantly increases the computational cost of upsampling, concatenation, and subsequent convolution operations. Second, the GatedFCA module adds extra computational overhead from Sobel gradient computation, multi-branch convolutions, and spatial gating fusion. Nevertheless, the inference speed of 495 FPS still meets real-time detection requirements. The per-frame latency of about 0.13 s is fully acceptable for field tea disease and pest detection, which is not an extreme low-latency scenario. Moreover, our model has only 5.9 million parameters, which is only 0.6 million more than YOLO11n. It thus retains the advantage of being lightweight and suitable for deployment on edge devices such as Jetson Orin. Future work can further optimize inference speed through channel pruning or knowledge distillation.
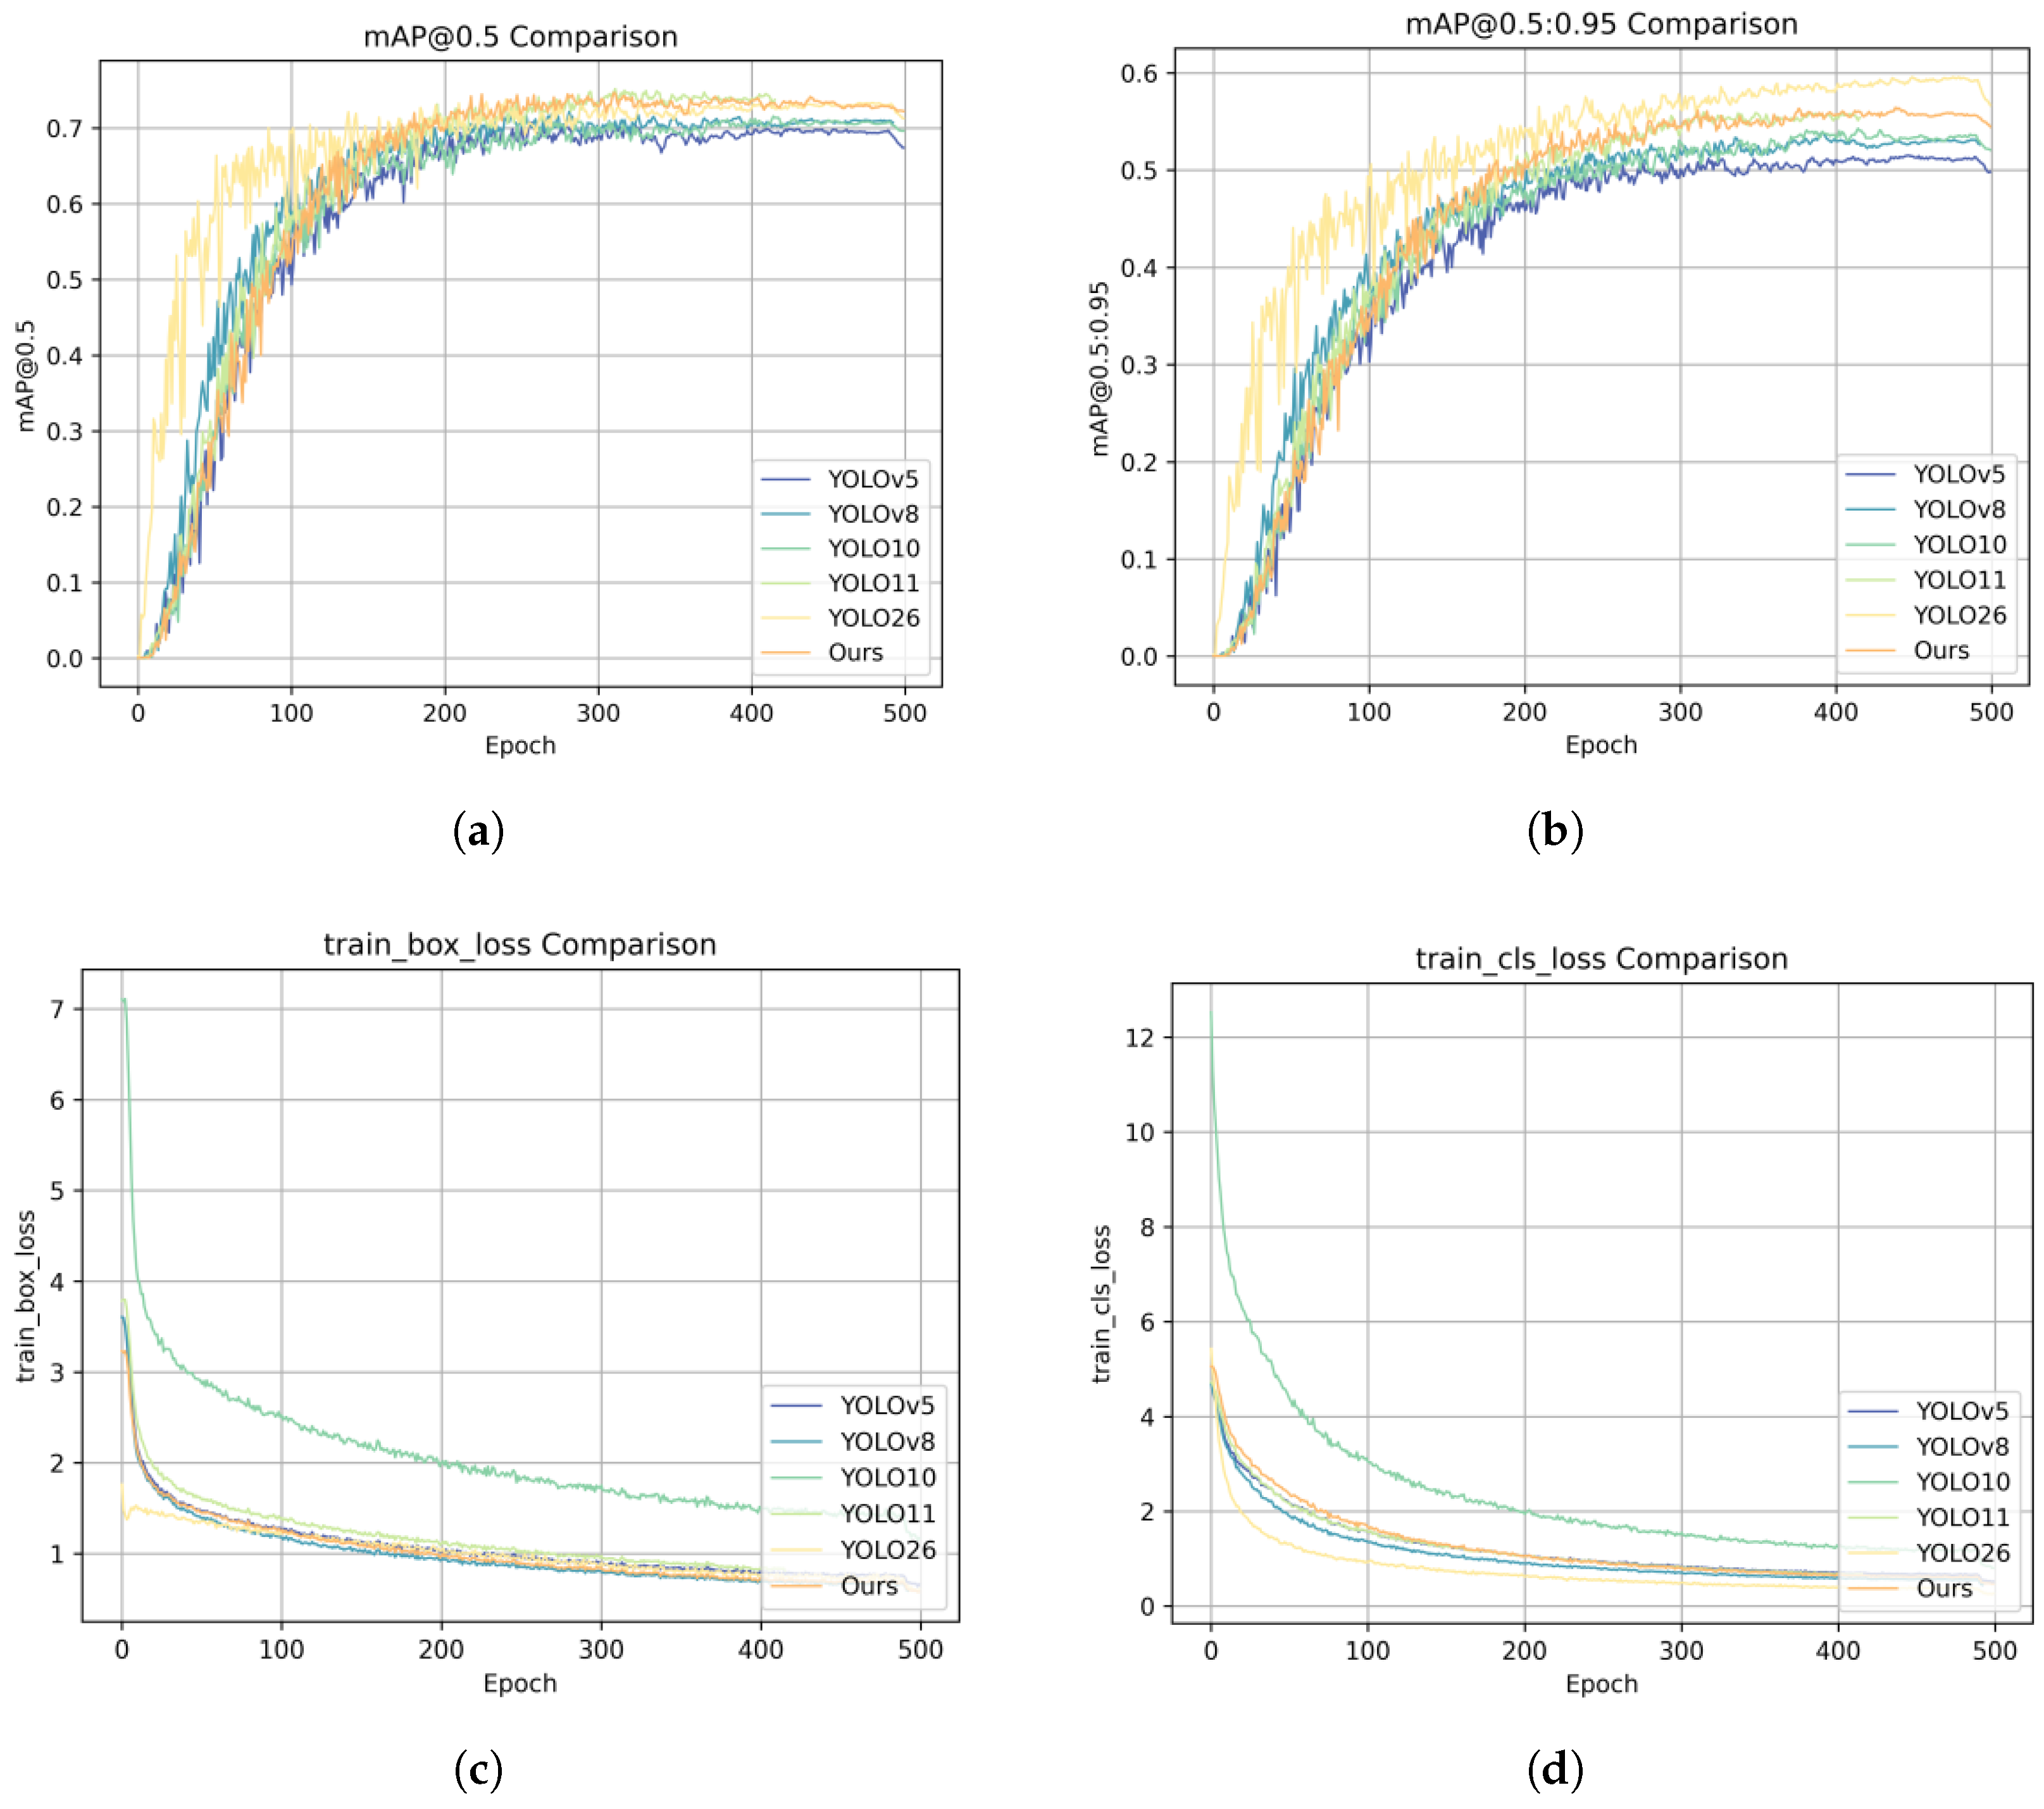
Figure 5a,b present the mAP@0.5 and mAP@0.5:0.95 performance curves during training. Notably, during the initial training stages, the mAP of our model was slightly lower than that of some comparison models, likely because the additional modules require more iterations to adapt to learning fine-grained features. As training progressed, the curves stabilized, achieving performance comparable to leading models in later stages. Evaluation on the test set indicates the model exhibits strong generalization capability.
Figure 5 also reveals that, although YOLO26 achieves reasonable performance on the training set, its mAP is substantially lower on the test set. This underscores the risk of overfitting inherent in small-sample datasets. In the absence of regularizing components such as NMS inference, models are more prone to overfitting background noise in the training set rather than learning the essential features of tea diseases and pests.
Figure 5c,d illustrate the reduction of bounding box loss and classification loss during training. The loss curves of our model decrease much faster than those of other models and eventually stabilize around 0.8, indicating strong fitting capabilities for both localization and classification tasks. However, given the magnitude of improvement on the test set, the rapid decline in training loss may partially stem from overlearning specific patterns in the training data, which does not fully translate into corresponding performance gains on the test set. Therefore, future work should explore stronger regularization strategies or more diverse data augmentation techniques to further improve the model’s generalization performance.
Compared with tea disease detection models such as YOLO-Tea [
19] and BRA-YOLOv7 [
21], our GatedFCA-YOLO achieves 78.9% mAP@0.5 under similar complex field conditions. This performance is at a mainstream level. However, unlike most methods that rely on large-scale transfer pre-training or complex data augmentation, our model achieves stable improvements through a combination of architectural design and data augmentation under the small-sample condition of only 549 raw images. Nevertheless, compared to the 95% accuracy reported in controlled laboratory environments [
11,
12], the performance gap in field scenes remains substantial. This reflects the inherent difficulties posed by real occlusions, lighting variations, and class imbalance. Relying solely on feature enhancement still cannot fully overcome the detection challenges caused by tiny lesions and occlusions.
To address the above bottlenecks, future improvements can be pursued in the following directions. First, multi-scale training can be adopted to enhance the model’s adaptability to objects of different scales, especially to improve the recall of medium-sized lesions. Second, a lightweight backbone network or knowledge distillation can be introduced to improve the model’s inference efficiency while maintaining accuracy. Third, the gating generator can be optimized by replacing the fixed Sobel kernel with deformable convolution, allowing gradient perception to adapt to lesion deformation. These improvements are expected to achieve a better balance between detection accuracy and inference speed.
3.2. Model Detection Results and Analysis
Table 8 summarizes the model’s overall mean average precision (mAP) and category-specific mAP. The enhanced model achieves an mAP@0.5 of 78.4% and an mAP@0.5:0.95 of 60.5%. These results demonstrate that the model maintains reliable recognition capability under small-sample and densely occluded conditions, while also performing robustly under stricter IoU threshold constraints, thereby meeting the fundamental requirements for tea disease and pest detection.
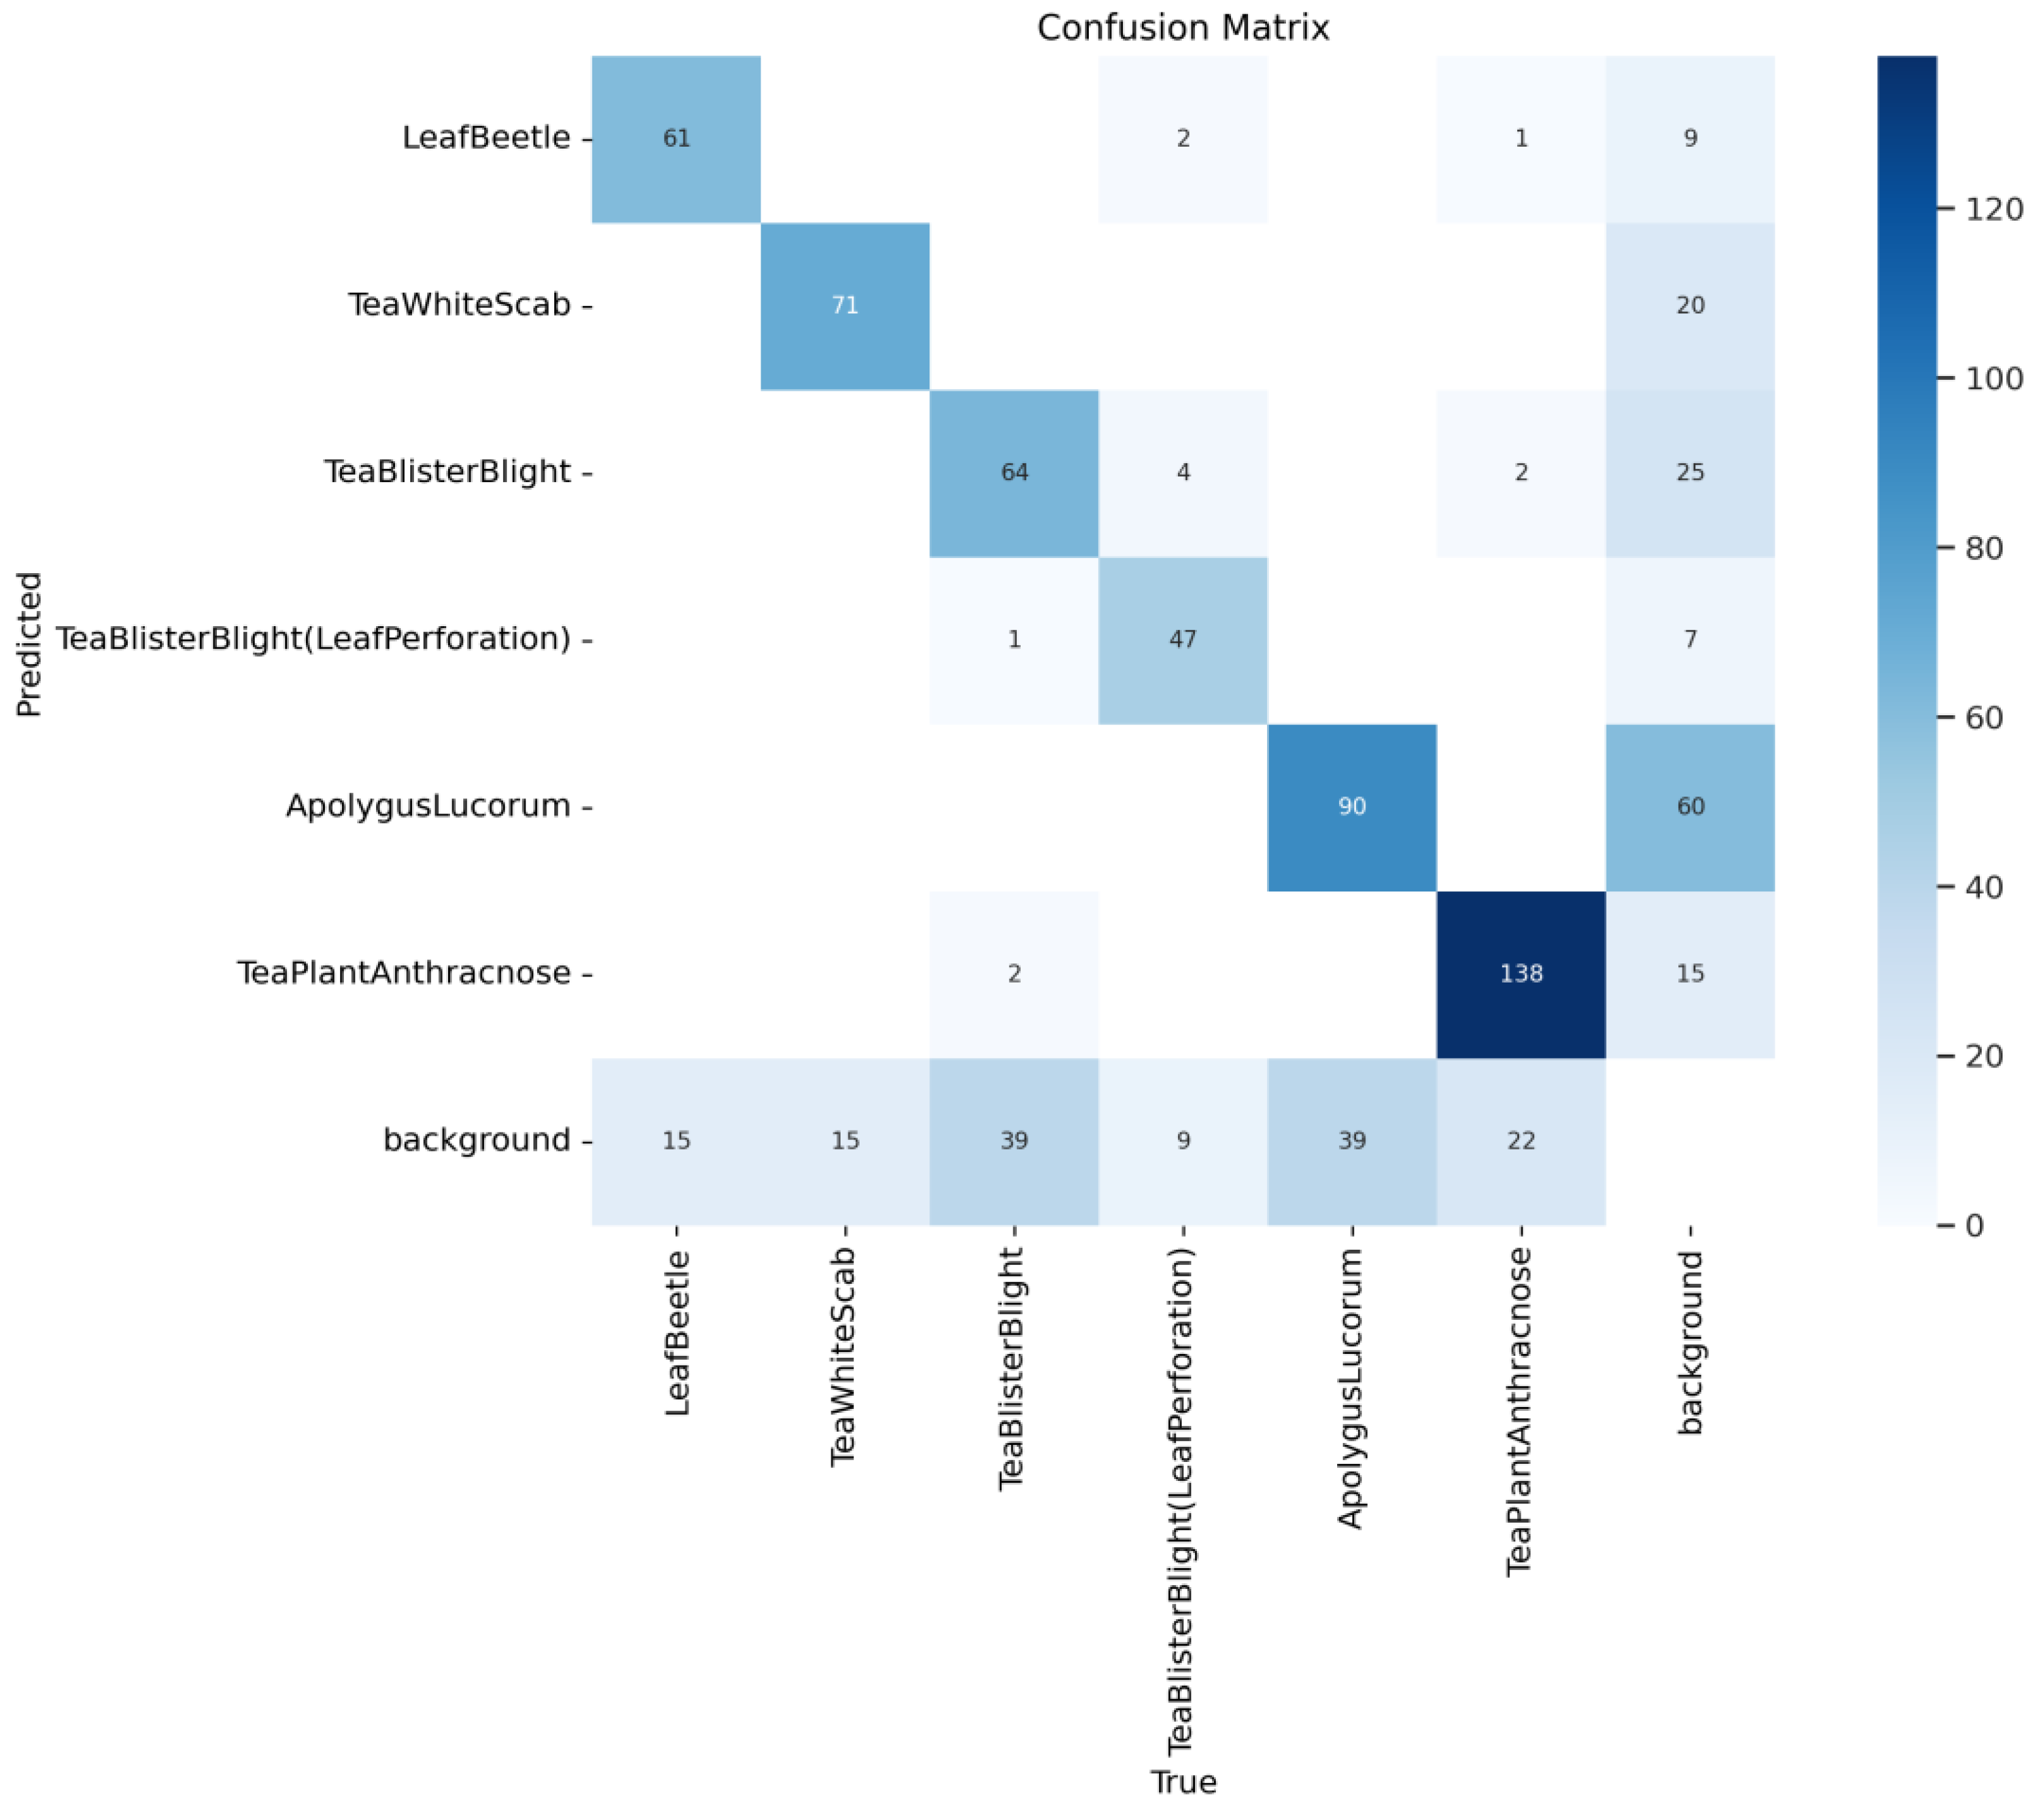
The main performance decline is observed in the Tea Blister Blight and Apolygus Lucorum categories, where average precision remains at 59.5% and 65.8%, respectively, even at an IoU threshold of 0.5. The confusion matrix presented in
Figure 6 illustrates the model’s classification performance for these categories.
Analysis suggests that the model’s errors primarily arise from misclassification and missed detections in background regions, particularly for Apolygus Lucorum and Tea Blister Blight. This is evidenced by a high proportion of false positives (FP), where background regions are incorrectly identified as these two categories, along with their low true negative (TN) recognition rates. Consequently, both precision and recall for these categories are markedly lower than those of other categories.The primary cause is the relatively small key lesion features of Apolygus Lucorum and Tea Blister Blight. Under conditions of dense occlusion, the blurred boundaries of these objects further exacerbate classification confusion and increase the likelihood of missed detection.
Furthermore, the model’s performance varies across target scales. It achieves an mAP of 32.5% for medium-sized objects and 62.1% for large-sized objects, indicating that further improvement is needed in multi-scale detection capability. A closer examination of category-specific performance reveals notable disparities. For medium-sized objects, the model achieves an AP of 80% for the Leaf Beetle category. However, performance declines sharply for the White, Tea Blister Blight (Leaf Perforation), and Apolygus Lucorum categories, where medium-sized objects are also present. This suggests that although the model demonstrates some ability to detect medium-sized objects, it is constrained by the imbalanced distribution of these objects across categories in the training set. The model tends to overfit to Leaf Beetle, resulting in insufficient feature learning for medium-sized objects in other categories.
For large-scale objects, the model demonstrates stronger detection performance. It achieves an mAP@large of 76.8% for Tea Plant Anthracnose and maintains AP scores above 60% for Tea Blister Blight (Leaf Perforation), White, and Leaf Beetle. In contrast, the mAP@large for Apolygus Lucorum and Tea Blister Blight both fall below 55%. This further confirms that the features of Apolygus Lucorum and Tea Blister Blight are less distinguishable in complex backgrounds.
3.3. Ablation Studies
To evaluate the effectiveness of the proposed components and identify the optimal configuration, a series of ablation experiments was conducted on the tea leaf disease test set. Using YOLOv11n as the baseline, we evaluated module effectiveness, hyperparameter sensitivity, attention mechanism comparison, and ablation of the data augmentation module under identical training settings. The analysis quantifies the contribution of the small object detection layer and the GatedFCA module to overall performance, while also identifying current efficiency bottlenecks and potential for accuracy improvement.
3.3.1. Module Ablation
Four progressive ablation experiments were designed: the baseline model YOLO11n, an enhanced model incorporating a small-object detection layer, an enhanced model incorporating a GatedFCA module, and a final model integrating both the small-object detection layer and the GatedFCA module. The results of these experiments are summarized in
Table 9.
In terms of detection accuracy, the introduction of the small object detection layer increased mAP@0.5 from 75.9% to 76.8% and mAP@0.5:0.95 from 58.0% to 60.9% compared to the baseline. These results indicate that the small object detection layer enhances the model’s perception of minute lesions by incorporating high-resolution, fine-grained features, with more pronounced gains under the stricter mAP@0.5:0.95 metric. However, AR@100 decreased from 70.8% to 70.3%, suggesting that, while high-resolution features improved detection accuracy, they also introduced more shallow-layer noise. This led to missed detections of objects that had previously been correctly identified, as reflected in the miss rate increasing from 4.03% to 7.23%.
After integrating GatedFCA alone, mAP@0.5 increases to 77.7%, and AR@100 stabilizes at 70.2%. Meanwhile, AP@medium jumps from 26.8% to 34.0%. This significant gain confirms the synergy between the gating mechanism and channel attention. Specifically, the spatial gating effectively suppresses background noise. This allows FCA to more accurately amplify the discriminative features of medium-sized lesions. At the same time, mAP@0.5:0.95 reaches 60.8%, which is on par with the +P2 version. However, no further improvement is observed, indicating that the gating-attention combination alone still has limitations under strict localization requirements.
The GatedFCA-YOLO model achieves the best performance across all metrics. Its mAP@0.5 rises to 78.9%, representing a 3.0% increase over the baseline. Its mAP@0.5:0.95 increases to 61.7%, a 3.7% improvement, while AR@100 recovers to 71.7%. Notably, although GatedFCA alone greatly improves medium-sized object accuracy, its combination with the P2 layer causes AP@medium to drop back to 29.9%. This counter-intuitive result stems from the interference of shallow noise introduced by the P2 layer on medium-sized lesion detection. Even though GatedFCA can suppress some of this noise, it remains difficult to fully restore the original accuracy in high-resolution feature maps. Nevertheless, the full model achieves the best overall balance among all evaluation metrics. This validates the effectiveness of the “detail enhancement + noise suppression” design philosophy. Future work can explore lighter feature fusion strategies to further improve the stability of medium-sized object detection.
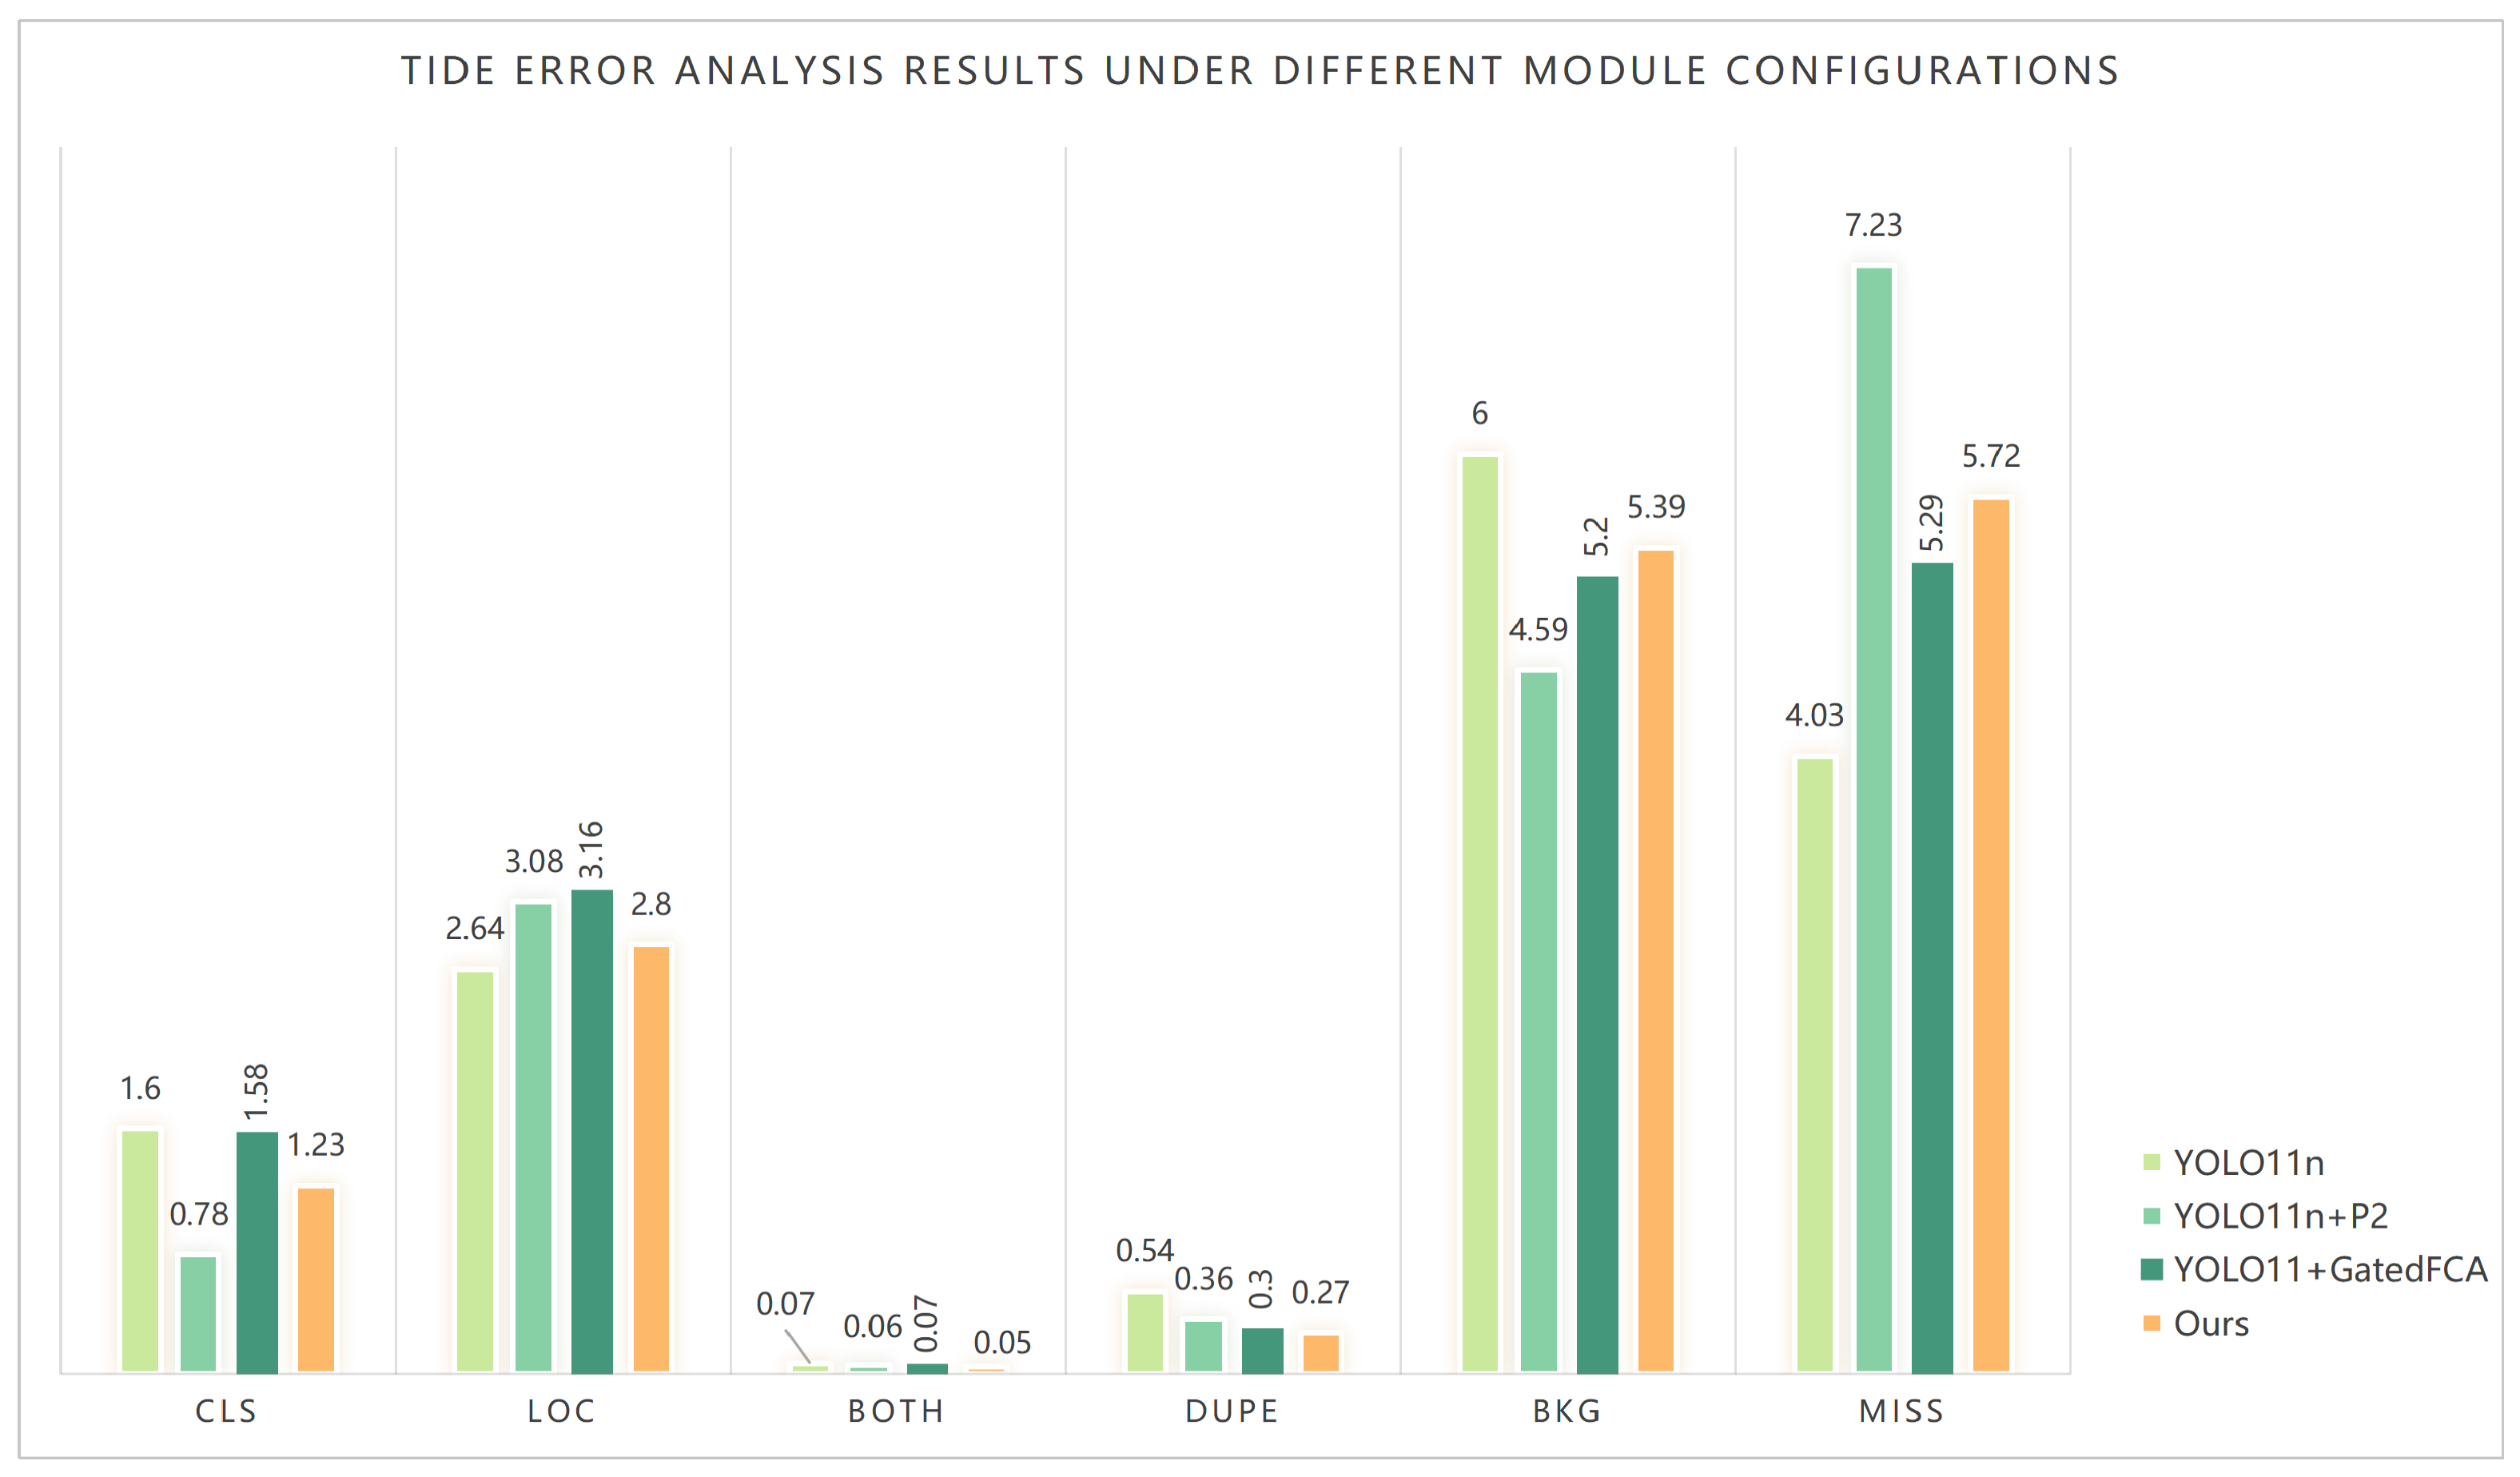
Figure 7 presents the TIDE error analysis results from the ablation experiments. The analysis further reveals the mechanisms of operation for each module. After introducing the P2 layer alone, the classification error drops sharply to 0.78. This indicates that high-resolution features provide rich, detailed information for classification and effectively alleviate category confusion. However, the miss rate increases to 7.23, and the background false positive rate drops to 4.59. This shows that the P2 layer enhances details but also introduces shallow noise, which causes some targets to be missed.
After introducing the GatedFCA module alone, the classification error decreases only slightly to 1.58 compared to the baseline. The localization error rises to 3.16. The miss rate increases to 5.29, while the background false-positive rate drops to 5.2. These results indicate that although GatedFCA suppresses some background noise through spatial gating, it does not provide high-resolution details. Therefore, its improvement in classification and localization is limited. The increase in missed detections may be due to the gating mechanism over-suppressing weak edge regions, which causes some real targets not to be activated.
When the P2 layer and GatedFCA are used together, the errors achieve the best balance. The classification error is 1.23. The localization error drops to 2.8. Duplicate detections fall to 0.27. The miss rate returns to 5.72. The background false positive rate rises slightly to 5.39. Compared to the P2-only version, the miss rate decreases by 1.51 percentage points. This demonstrates that GatedFCA effectively suppresses the shallow noise introduced by P2. Compared to the GatedFCA-only version, the classification error decreases by 0.35, and the localization error decreases by 0.36. This validates the positive synergy between high-resolution features and the gating mechanism. The slight rebound in background false positives suggests that when the gating mechanism enhances target responses, it may produce overly strong responses to lesion-like backgrounds, such as withered leaves and shadow edges.
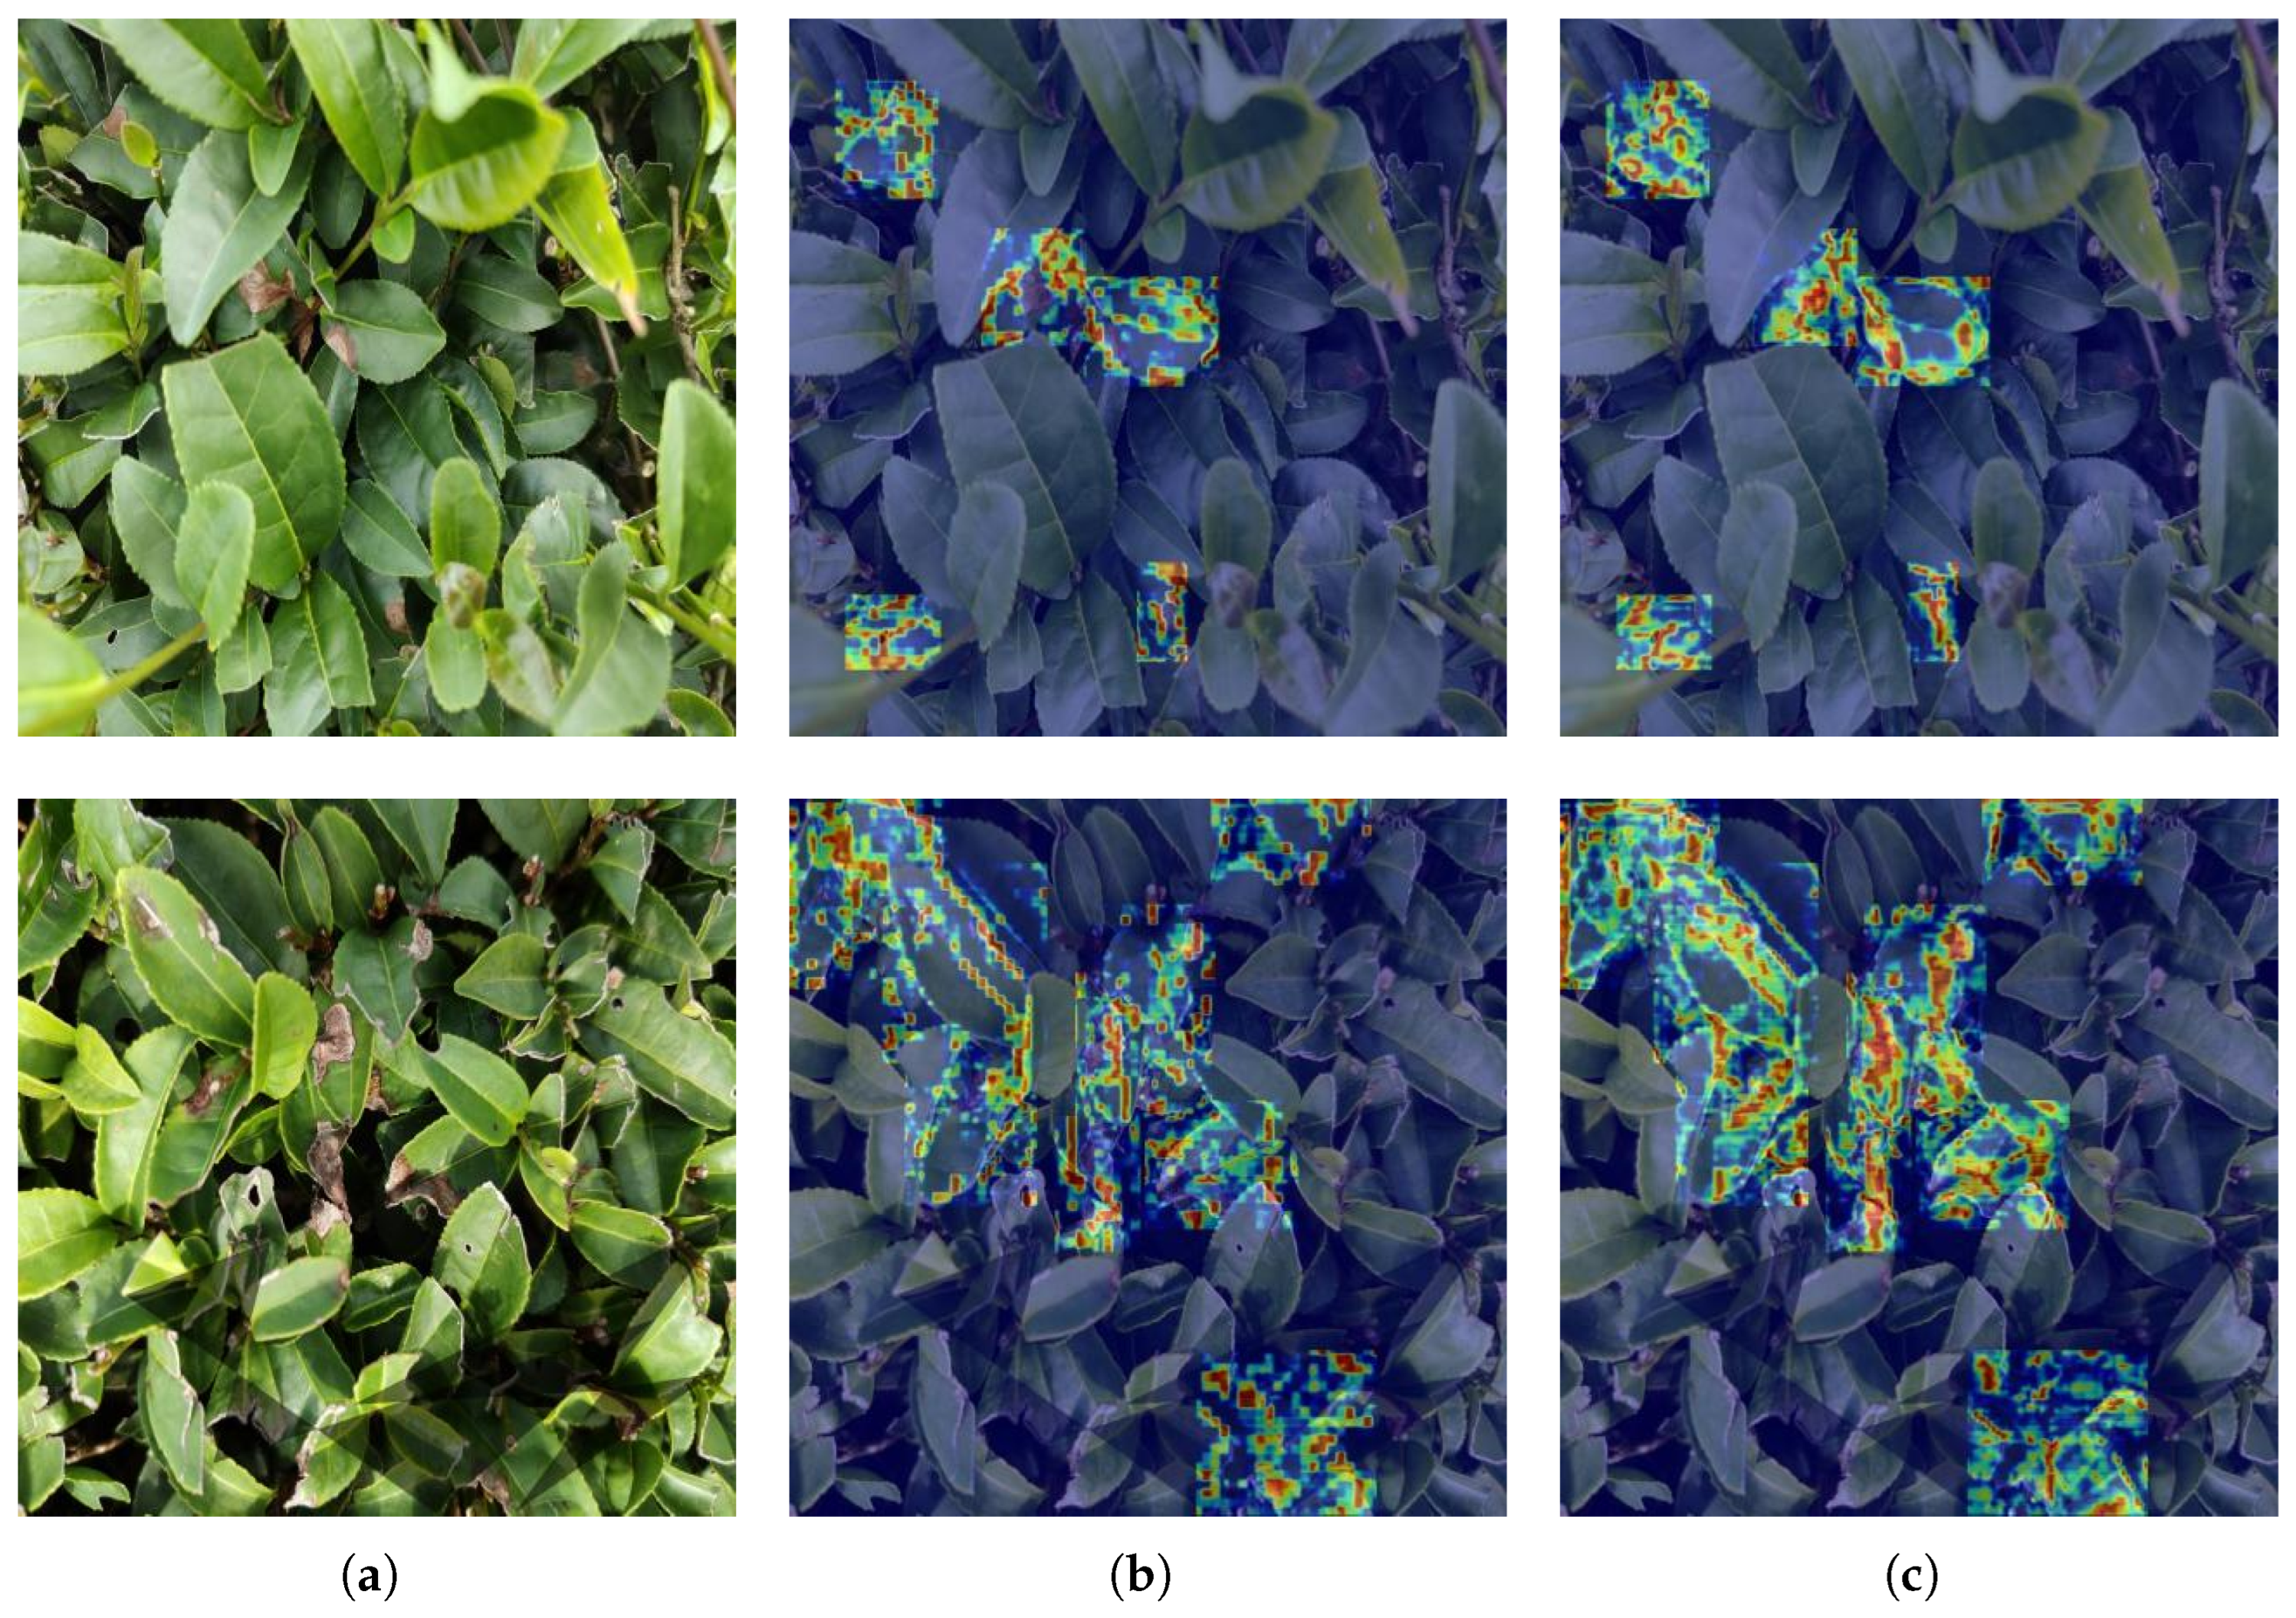
Figure 8 presents a heatmap comparison of feature maps before and after the introduction of the GatedFCA module. The visualization indicates that, prior to GatedFCA, the model localized some lesion areas, but activation responses were dispersed and cluttered with substantial background noise. After the introduction, the model’s response to diseased leaves became more focused, with healthy leaves, shadows, and other irrelevant backgrounds effectively suppressed. This visual evidence corroborates the reduction in background and duplicate false detections, confirming that the GatedFCA module contributes to feature selection and noise suppression. Overall, the collaboration between the two modules achieves an optimal balance between detection accuracy and stability. However, missed detections and background false positives remain the core bottlenecks that we need to further address in the future.
3.3.2. Hyperparameter Ablation Experiments
To systematically assess the influence of hyperparameters on model performance and identify the optimal training strategy, we performed grid searches and sensitivity analyses on five key hyperparameters: optimizer, initial learning rate, learning rate scheduling strategy, bounding box loss weight, and classification loss weight. These experiments were complemented by an analysis of classification loss versus bounding box loss curves. All experiments employed the fixed model architecture described in
Section 2.3. The results are summarized in
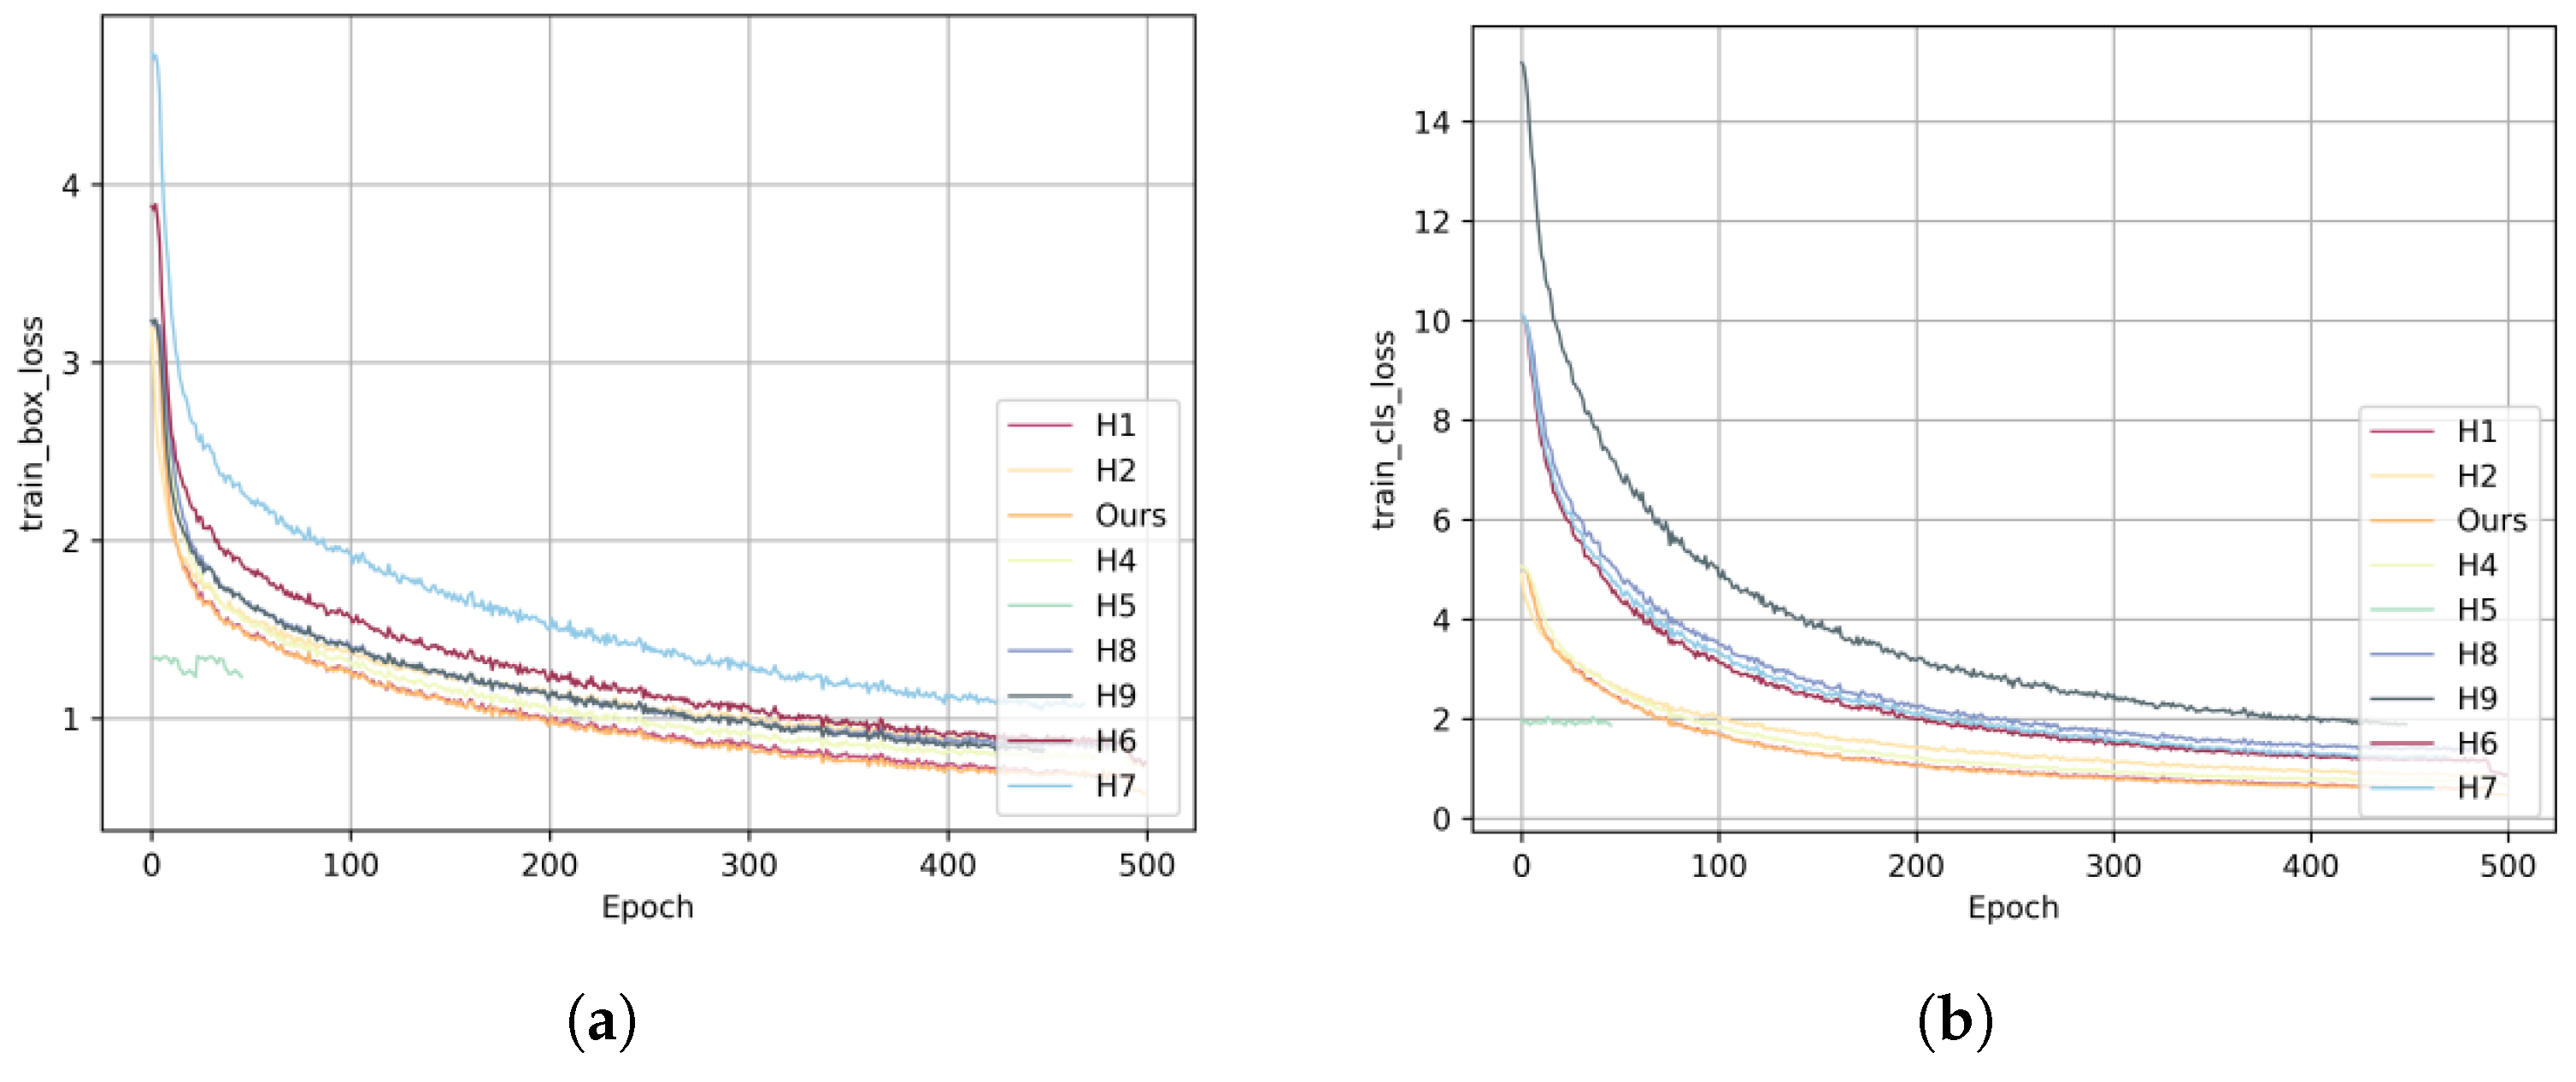
Table 10, and the corresponding loss curves are presented in
Figure 9.
The experiments show that the SGD optimizer, when combined with cosine learning rate scheduling, substantially outperforms AdamW in detection accuracy. Although AdamW maintains high recall, it achieves lower classification accuracy, as its adaptive learning rate mechanism is prone to becoming trapped in local optima under complex scenarios. The cosine scheduling, by periodically adjusting the learning rate, enables fine-tuning of parameters during the later stages of training. This allows the model to escape local plateaus, thereby improving detection accuracy, with the loss curves demonstrating a more stable convergence process.
The initial learning rate was identified as the most sensitive hyperparameter. An initial learning rate of 0.01 allows the model to rapidly approach the optimal region and achieve stable convergence. Conversely, excessively low rates result in slow convergence, a sharp decline in accuracy, sluggish reduction of the loss curve, and ultimately higher final loss values.
The bounding box loss weight achieves an optimal balance between localization and classification at moderate values. Excessively high weights do not further improve localization accuracy while suppressing classification loss, leading to a decline in overall accuracy. In this case, the loss curve shows a slight decrease in localization loss but a rebound in classification loss. Increasing the classification loss weight causes the model to overemphasize category discrimination, introducing a risk of overfitting. The persistent decline in recall indicates increased false negatives, with the loss curve showing a rapid decrease in classification loss while localization loss remains stagnant.
Based on the preceding analysis, the optimal hyperparameter configuration for our proposed method is as follows: SGD optimizer, cosine learning rate scheduling, an initial learning rate of 0.01, a bounding box loss weight of 7.5, and a classification loss weight of 0.5. Under this configuration, the model achieves an optimal balance between accuracy and recall, with the loss curve exhibiting synchronous and stable decline, validating the rationality of the hyperparameter selection. Future research may explore more refined loss weighting strategies to further enhance the model’s performance.
3.3.3. Comparison with Other Attention Mechanisms
We use YOLO11 + P2 layer as the baseline and conduct an ablation study on attention mechanisms. We compare GatedFCA with three classical attention mechanisms: SE (Squeeze-and-Excitation), CBAM (Convolutional Block Attention Module), and ECA (Efficient Channel Attention) [
29].
Table 11 presents the comparison results. Compared to the baseline YOLO11 + P2, both CBAM and ECA improve all evaluation metrics, while SE shows a decrease.
SE compresses spatial information through global average pooling. It then generates channel weights using two fully connected layers. This design captures only global channel dependencies and completely ignores local spatial context. In tea disease detection, lesions often appear as small, local texture anomalies. Their discriminative information depends heavily on contrast with surrounding pixels. SE’s global pooling operation mixes the feature response of lesion regions with large areas of healthy leaves. This causes the channel weights to shift toward the background, making it difficult to effectively highlight lesion-related channels. Therefore, SE does not bring stable improvement over the baseline. In fact, it may even harm the detailed representation of medium and large objects due to excessive smoothing.
CBAM adds a spatial attention branch to SE. It first recalibrates features through channel attention. It then performs max pooling and average pooling along the channel dimension and generates a spatial weight map through convolution. This design simultaneously models “which channels are important” and “which positions are important”. In theory, it is more suitable for tea disease detection than SE. However, CBAM’s spatial attention relies on statistics after channel compression. Its receptive field is limited. In addition, its sequential structure may cause insufficient information exchange between the channel and spatial dimensions. Experiments show that CBAM achieves some improvement on medium objects, but its gain on large objects remains insignificant. As a result, the overall mAP improvement is limited.
ECA replaces the fully connected layers in SE with one-dimensional convolution. It achieves local cross-channel interaction and avoids information loss caused by dimension reduction. This lightweight design models the dependencies between adjacent channels more finely while maintaining low computational cost. In tea disease data, different channels often encode texture features at different scales. ECA can more effectively capture multi-scale responses related to lesions through local channel interaction. Therefore, ECA shows a clear advantage in detecting medium objects. Its overall mAP is also better than CBAM and SE. However, ECA still only focuses on the channel dimension and lacks explicit modeling of spatial positions. In densely occluded scenes, the channel responses of foreground and background heavily overlap. Relying only on channel recalibration cannot effectively separate them, which limits the improvement on large objects and recall.
In summary, GatedFCA achieves the best overall detection accuracy, large-object detection, and recall. This validates the effectiveness of global-local fine-grained interaction for tea disease detection. Although ECA performs well on medium objects, its insufficient modeling of global context limits its generalization ability. SE and CBAM are constrained by their design flaws and struggle to achieve substantial breakthroughs under complex backgrounds and data-scarce conditions. Therefore, GatedFCA serves as the default attention module in our method, achieving the best balance between accuracy and robustness.
3.3.4. Impact of Data Augmentation
To quantify the contribution of the hierarchical augmentation strategy described in
Section 2.3, we trained both the baseline YOLO11n and the proposed GatedYOLO under two conditions. The first condition uses only the original 549 images without any augmentation (denoted as “Original only”). The second condition uses the full augmentation pipeline (denoted as “Full augmentation”).
Table 12 reports the results. For YOLO11n, full augmentation increases mAP@0.5 from 53.9% to 75.9% and AR@100 from 55.3% to 70.8%. This significant improvement demonstrates that the augmentation pipeline effectively alleviates the data scarcity and class imbalance issues in our small-scale field dataset.
For GatedYOLO, the gains are even more substantial. Its mAP@0.5 rises from 53.9% to 78.9%, and its AR@100 increases from 60.0% to 71.7%. Notably, even without data augmentation, GatedYOLO slightly outperforms YOLO11n. This indicates that the proposed GatedFCA module provides a modest advantage even on limited data. However, only with the full augmentation pipeline can both models reach their full potential. GatedFCA-YOLO achieves the best overall performance, suggesting that combining our adaptive feature enhancement with effective data augmentation is essential for robust tea disease detection under complex field conditions. These results also justify the use of the data augmentation strategy in our main experiments.
4. Conclusions
This paper presents a systematic study of tea disease and pest detection under natural field conditions, addressing challenges such as dense, small targets, complex backgrounds, and severe occlusion. The study focuses on three principal aspects: dataset construction, benchmark analysis, and model design. First, we introduce a tea disease and pest dataset comprising images captured in real-world field scenes and annotated using a leaf-level strategy. A multi-dimensional comparison with mainstream datasets, such as TeaLeafBD and tea-leaf-diseases, highlights the uniqueness of our dataset in terms of scene authenticity, object density, and regional disease coverage, presenting new challenges and research directions for tea disease and pest recognition. Second, through systematic experiments and error analysis, we evaluate the performance of mainstream detection models under conditions of dense occlusion and complex backgrounds. This assessment identifies the inherent difficulties and performance bottlenecks of existing methods, providing a valuable reference for future research.
Building on these insights, we propose GatedFCA-YOLO, an adaptive feature enhancement network. The model incorporates a small object detection layer to preserve high-resolution detail features, effectively improving the recall of minute lesions. Simultaneously, it incorporates the GatedFCA module, which combines a spatial gating mechanism with channel attention to achieve adaptive feature enhancement, suppressing background noise while reinforcing target-region responses.
Experimental results demonstrate that the proposed model achieves 78.9% mAP@0.5, 61.7% mAP@0.5:0.95, and 71.7% AR@100, outperforming current mainstream YOLO-series models. Ablation studies further validate the effectiveness of each component: the small object detection layer provides rich fine-grained features but introduces background noise, while the GatedFCA module dynamically suppresses this noise through feature selection, reducing the false negative rate from 7.23% to 5.72%. Nevertheless, the limited improvement in accuracy underscores the inherent difficulty of the task—factors such as dense occlusion, extremely small lesion scales, and background interference collectively constrain the upper bound of detection performance.
Future work will focus on hard example mining and the optimization of multi-scale fusion strategies to further enhance the model’s generalization capability and deployment efficiency in complex scenarios.




 ,
,