1. Introduction
China is the world’s largest wheat producer in terms of both cultivated area and output. As one of China’s primary staple crops, enhancing wheat yield per unit area and achieving high and stable wheat production are crucial measures for ensuring food security [
1,
2]. Precision seeding is the primary step in ensuring high-quality production, with the seeding rate being a critical factor within precision seeding. The seeding rate determines crop distribution density in the field and significantly impacts final crop yield. Real-time monitoring of seeding rate is fundamental to its precise control and represents an inevitable trend in smart agriculture development [
3,
4]. Precision wheat seeding involves high seed placement frequency, where multiple seeds pass through the detection zone simultaneously, forming a high-throughput seed stream. The interlacing and overlapping of seeds pose the primary challenge of accurate detection in such high-throughput conditions [
5,
6]. Under high-speed seeding conditions, the high-frequency, disordered distribution of seeds further complicates the precise detection of seed flow. Therefore, developing a real-time detection device for high-throughput wheat seed flow can enhance seeding quality, reduce production costs, minimize seeding losses, and significantly contribute to building big data for wheat seeding operations and advancing the intelligence level of seeding [
7].
Seed flow detection methods worldwide can be primarily categorized into capacitive sensing [
8], piezoelectric sensing [
9,
10], machine vision [
11], and photoelectric sensing [
12]. Depending on the detection target, the detection system’s adaptability and stability in complex working environments vary. Capacitive sensing systems offer strong operational stability and possess a certain degree of interference resistance in complex conditions. However, they detect only minimal capacitance changes from individual lightweight seeds, making them unsuitable for single-seed precision detection. Additionally, factors like temperature, humidity, and electromagnetic interference significantly impact the detection accuracy of capacitive sensors. Thus, detecting granular flows like wheat requires establishing relatively ideal testing environments. Piezoelectric sensors achieve precise detection at low seeding frequencies and offer cost advantages. However, they are susceptible to vibration, and high seeding frequencies cause overlapping vibration signals from multiple seeds. They also demand complex connection structures, making them unsuitable for high-frequency wheat seeding detection. Machine vision sensors are not limited by seed size and offer high detection accuracy. However, due to their high cost, stringent environmental requirements, and complex structure, they are currently largely confined to the laboratory stage and are difficult to integrate into seeders for field sowing detection.
Photoelectric seed detection systems are currently the most technically mature and widely used type of system [
13,
14,
15,
16]. Most seed monitoring systems installed on precision seeders manufactured by major international agricultural machinery companies employ photoelectric detection principles. Developed countries began exploring intelligent monitoring and control technologies for precision seeding early on and have conducted numerous experiments in this field. In 1982, Australia’s A.E.E. Ltd. developed a seeding detection device that utilized infrared sensors to monitor seeds. This device employed infrared sensors mounted on the seed tubes of each row to monitor the flow of seeds within the seed tubes. If a blockage occurred, the monitor immediately activated warning lights and displayed the fault status, thereby effectively capturing seeding information during the seeding process. Karimi et al. developed an infrared sensing system based on photodiodes, capable of detecting the mass flow rate of seeds passing through the seed guide tube during the seeding process [
17]. HADI et al. constructed a field seeding monitoring device and system using an infrared laser diode array sensor based on seed flow monitoring, thereby enabling the calculation of seed flow rates [
18]. Rajeev et al. arranged infrared LEDs in a ring configuration to ensure that infrared light covered the entire cross-section of the seeding tube; however, this method yielded unsatisfactory detection results for small-sized seeds such as wheat [
19]. Anil et al. employed an opposed-beam fiber-optic sensor for seeding flow detection, which can detect large, medium, and small-sized seeds; however, this study was limited to single-seed sowing [
20].
With the continuous advancement of science and technology, intelligent monitoring and control technologies for precision seeders capable of handling crops of various particle sizes—from large to small—have gradually matured in developed countries worldwide. These machines feature a high degree of intelligence and precision in operation, and some seed-planting monitoring devices have already been commercialized. Notable examples include Sweden’s Vaderstad, whose precision wheat seeder employs an optical detection system that counts passing seeds via a light-sensing array [
21]. This system achieves detection frequencies up to 300 Hz with over 97% accuracy. MC Electronics of Italy has developed an infrared-based through-beam seed detection system capable of accurately detecting medium- and large-sized seeds such as wheat [
22]. The system works by detecting changes in the voltage signal at the receiver when seeds block the infrared beam emitted from the transmitter as they fall. The control system collects and processes these voltage changes to achieve precise detection of large, medium, and small-sized seeds such as wheat, soybeans, and corn. Additionally, the accompanying display unit provides real-time data on total seed output, skipped seed rate, planted area, plant spacing, and seed rate per unit area, while issuing voice alerts for blockages or malfunctions.
In China, quality inspection of intelligent precision seeders used in domestic production has primarily focused on large-seeded crops such as corn and soybeans. While monitoring and alarm systems for faults such as seed tube blockages and broken seed rows have been implemented for small- and medium-seeded crops like wheat, rice, and rapeseed, there is a lack of high-throughput seed flow detection technologies and devices, and few seeders are equipped with seed quality inspection systems. Compared to large-seeded crops, small- and medium-seeded crops have a higher seed discharge frequency (e.g., rapeseed at approximately 20–40 Hz and wheat at approximately 100–300 Hz). When inspecting small- and medium-seeded crops, the high discharge frequency of the seed sequence is irregular, making it difficult to accurately distinguish individual seeds. Additionally, challenges arise from the weak signals generated by small seeds as they pass through the sensing area and the potential for detection blind spots. These factors make it difficult to achieve precise detection of small- and medium-sized seeds. Currently, the issue of high-throughput detection of overlapping small- and medium-sized seeds remains a hot topic of research both domestically and internationally.
In response to the aforementioned challenges, Chinese researchers have actively explored the application of photoelectric detection principles in recent years for precision seed flow monitoring during the planting of small-seeded crops like wheat. Ding Youchun et al. employed a 1 mm thick thin-film laser emitter for seed flow monitoring, effectively identifying seeds with longitudinal distances exceeding 1 mm and thereby enhancing sensor resolution to some extent. However, this approach failed to fundamentally resolve the detection of overlapping seeds [
23]. Ding Youchun and colleagues also attempted to divert high-throughput seed streams into four parallel detection channels. By integrating technologies such as thin-film laser-silicon photovoltaic cells, they developed a highly efficient, high-throughput detection device for small-diameter seed streams. Within the rapeseed discharge frequency range of 20.00–61.68 Hz, the detection accuracy of this device reaches a minimum of 96.1%, with the maximum detection error controlled within 3.9%; however, during high-speed sowing, when the seed discharge frequency reaches up to 130 Hz, the detection accuracy of the device decreases [
24]. Recently, he has also researched and designed a solar-powered high-speed rapeseed sowing stream-splitting and synchronous detection device. This device divides the high-speed seed stream into eight low-throughput channels, incorporating an LED array light source and a silicon photodiode detection structure, with the system integrated onto an eight-channel ring-shaped surface-mount detection circuit board. Bench tests indicate that at seeding rates of 60–130 Hz, the 8-channel detection device achieves a detection accuracy of over 97.63% for rapeseed seeding rates, with the minimum detection accuracy improved by 10.03 percentage points compared to the original 4-channel detection device [
25]. Xu Chunbao et al. transformed high-throughput into low-throughput multi-channel parallel synchronous detection. They proposed a method using “LED beads + narrow slits” to generate a thin light layer, combined with convex lens refraction principles to expand the effective detection area. They designed a thin-layer light refraction-based multi-channel parallel detection device for wheat seed flow. At wheat seeder operating speeds of 2–9 km/h, the detection device achieved an accuracy rate exceeding 95.28% [
26]. These methods apply the principle of seed flow reconstruction to detect high seeding rates in row planting. They use a flow-splitting device to reduce seed flow density, followed by detection based on the optoelectronic principle; however, this approach is not conducive to maintaining the original uniformity of the seed flow. Wang Zaiman et al. developed an area-source photoelectric sensor that determines seed quantity via pulse width modulation, enabling detection of rice hole numbers and seeds per hole. The average detection error range for seeds per hole was 7.99% to 24.07% [
27]. Jiang Meng et al. designed a seeding rate sensor based on infrared detection principles, proposing peak and average value algorithms for determining overlapping seed counts. The developed seeding rate detection system achieved high accuracy, meeting detection requirements for seeding rates of 120–180 kg/hm
2 at operating speeds of 2.5–4.6 km/h [
28]. Zhang Tian et al. designed a fiber-optic counting-based seed flow detection system for a rapeseed precision seeder using a reflective photoelectric sensing method, enabling real-time counting of the seed flow. Field trials showed that the relative deviation in rapeseed seeding rate detection did not exceed 8%, indicating that the system has a low overall error rate [
29].
Practice demonstrates that photoelectric detection is a widely adopted and mature detection method with extensive application in seeding [
30,
31,
32]. Photoelectric sensor-based detection devices feature low cost, non-contact sensing, and rapid signal response. However, in complex field conditions, dust accumulation on photosensitive components may reduce their responsiveness, thereby diminishing detection accuracy. Additionally, limitations in the optical layer thickness of the photosensitive area can cause signal aliasing from multiple seeds, further compromising detection precision.
In recent years, China has made some progress in the research and development of seed flow detection devices for crops such as wheat. While drawing on international design experience and incorporating innovations, certain challenges remain. For instance, there are few devices capable of single-seed precision sowing on mechanical wheat seeders and few pieces of equipment capable of maintaining stable sowing during high-speed operations. Most seed count detection devices are only capable of handling low-throughput, low-frequency detection; they exhibit significant errors during high-throughput sowing. Additionally, issues such as detection blind spots or missed counts caused by overlapping seeds remain unresolved and require urgent breakthroughs. Wheat seeds are relatively small with high seeding frequencies. During high-throughput seeding, seed overlap and interlacing may occur, causing conventional detection devices to experience double detection or missed detection. Seed flow seeding rate detection requires more precise equipment [
24,
33].
It should be noted that major developed countries in Europe and the United States currently use pneumatic-conveyor wheat seeders. These seeders offer advantages such as wide working widths, high operational efficiency, and fast working speeds. Through years of innovative research, foreign companies and researchers have developed comprehensive hardware and software support systems, including online monitoring systems for seeding and fertilizer application rates [
34]. These countries primarily rely on large-scale farm production, whereas China’s domestic fields are generally smaller. The national context of a vast country with small-scale farming operations limits the use of pneumatic-conveyance seeders. China has adopted precision wheat seeding as its primary development model, increasing wheat yields by improving traditional seeding practices and machinery. However, the performance of current seeders fails to meet the precision requirements of modern agricultural practices. Key issues include low seeding accuracy, poor uniformity, slow operating speeds, and a lack of monitoring mechanisms for seeding and fertilizer application rates, all of which limit further increases in wheat yields. In terms of precision seed metering, the market remains dominated by mechanical seed meters such as external groove wheels and dimple wheels [
35]. Pneumatic seed meters are often modified from those used for corn or vegetables, resulting in a lack of precision seed meters specifically designed to match wheat planting practices [
36]. Sensors for detecting wheat seeding rates have not yet become widespread, and there is a lack of effective monitoring methods during the seeding process. Wheat seeds are small, and existing sensors have low recognition rates for them. Furthermore, since precision sowing of wheat requires a lower single-seed rate, the probability of seed overlap is high, making it difficult for sensors to accurately detect the seeding rate. Most existing detection methods are still in the laboratory research stage, and no mature products have emerged. Due to differences in detection environments and specific conditions, a “ready-made” approach is not suitable for China. Additionally, developed countries do not disclose specific technical details, and the high cost of these technologies makes their application in China quite challenging.
Therefore, this study addresses the challenges associated with high-throughput seeding in Chinese wheat seeders—specifically, the rapid descent speed of seeds and the resulting overlapping and interlacing patterns that make effective and precise detection difficult. Building upon a four-row staggered hook-tooth seed dispenser previously designed by the research team for high-throughput seeding, this study developed a corresponding seed flow detection device [
37]. A dual-layer orthogonal photoelectric detection method was proposed, and bench tests were conducted to investigate the detection accuracy of the device at different dispenser rotational speeds. The aim is to provide a reference for achieving precise detection of high-throughput wheat seed flows, thereby offering technical and equipment support for stable and high wheat yields in China.
2. Materials and Methods
2.1. Structure and Working Principle of the Detection Device
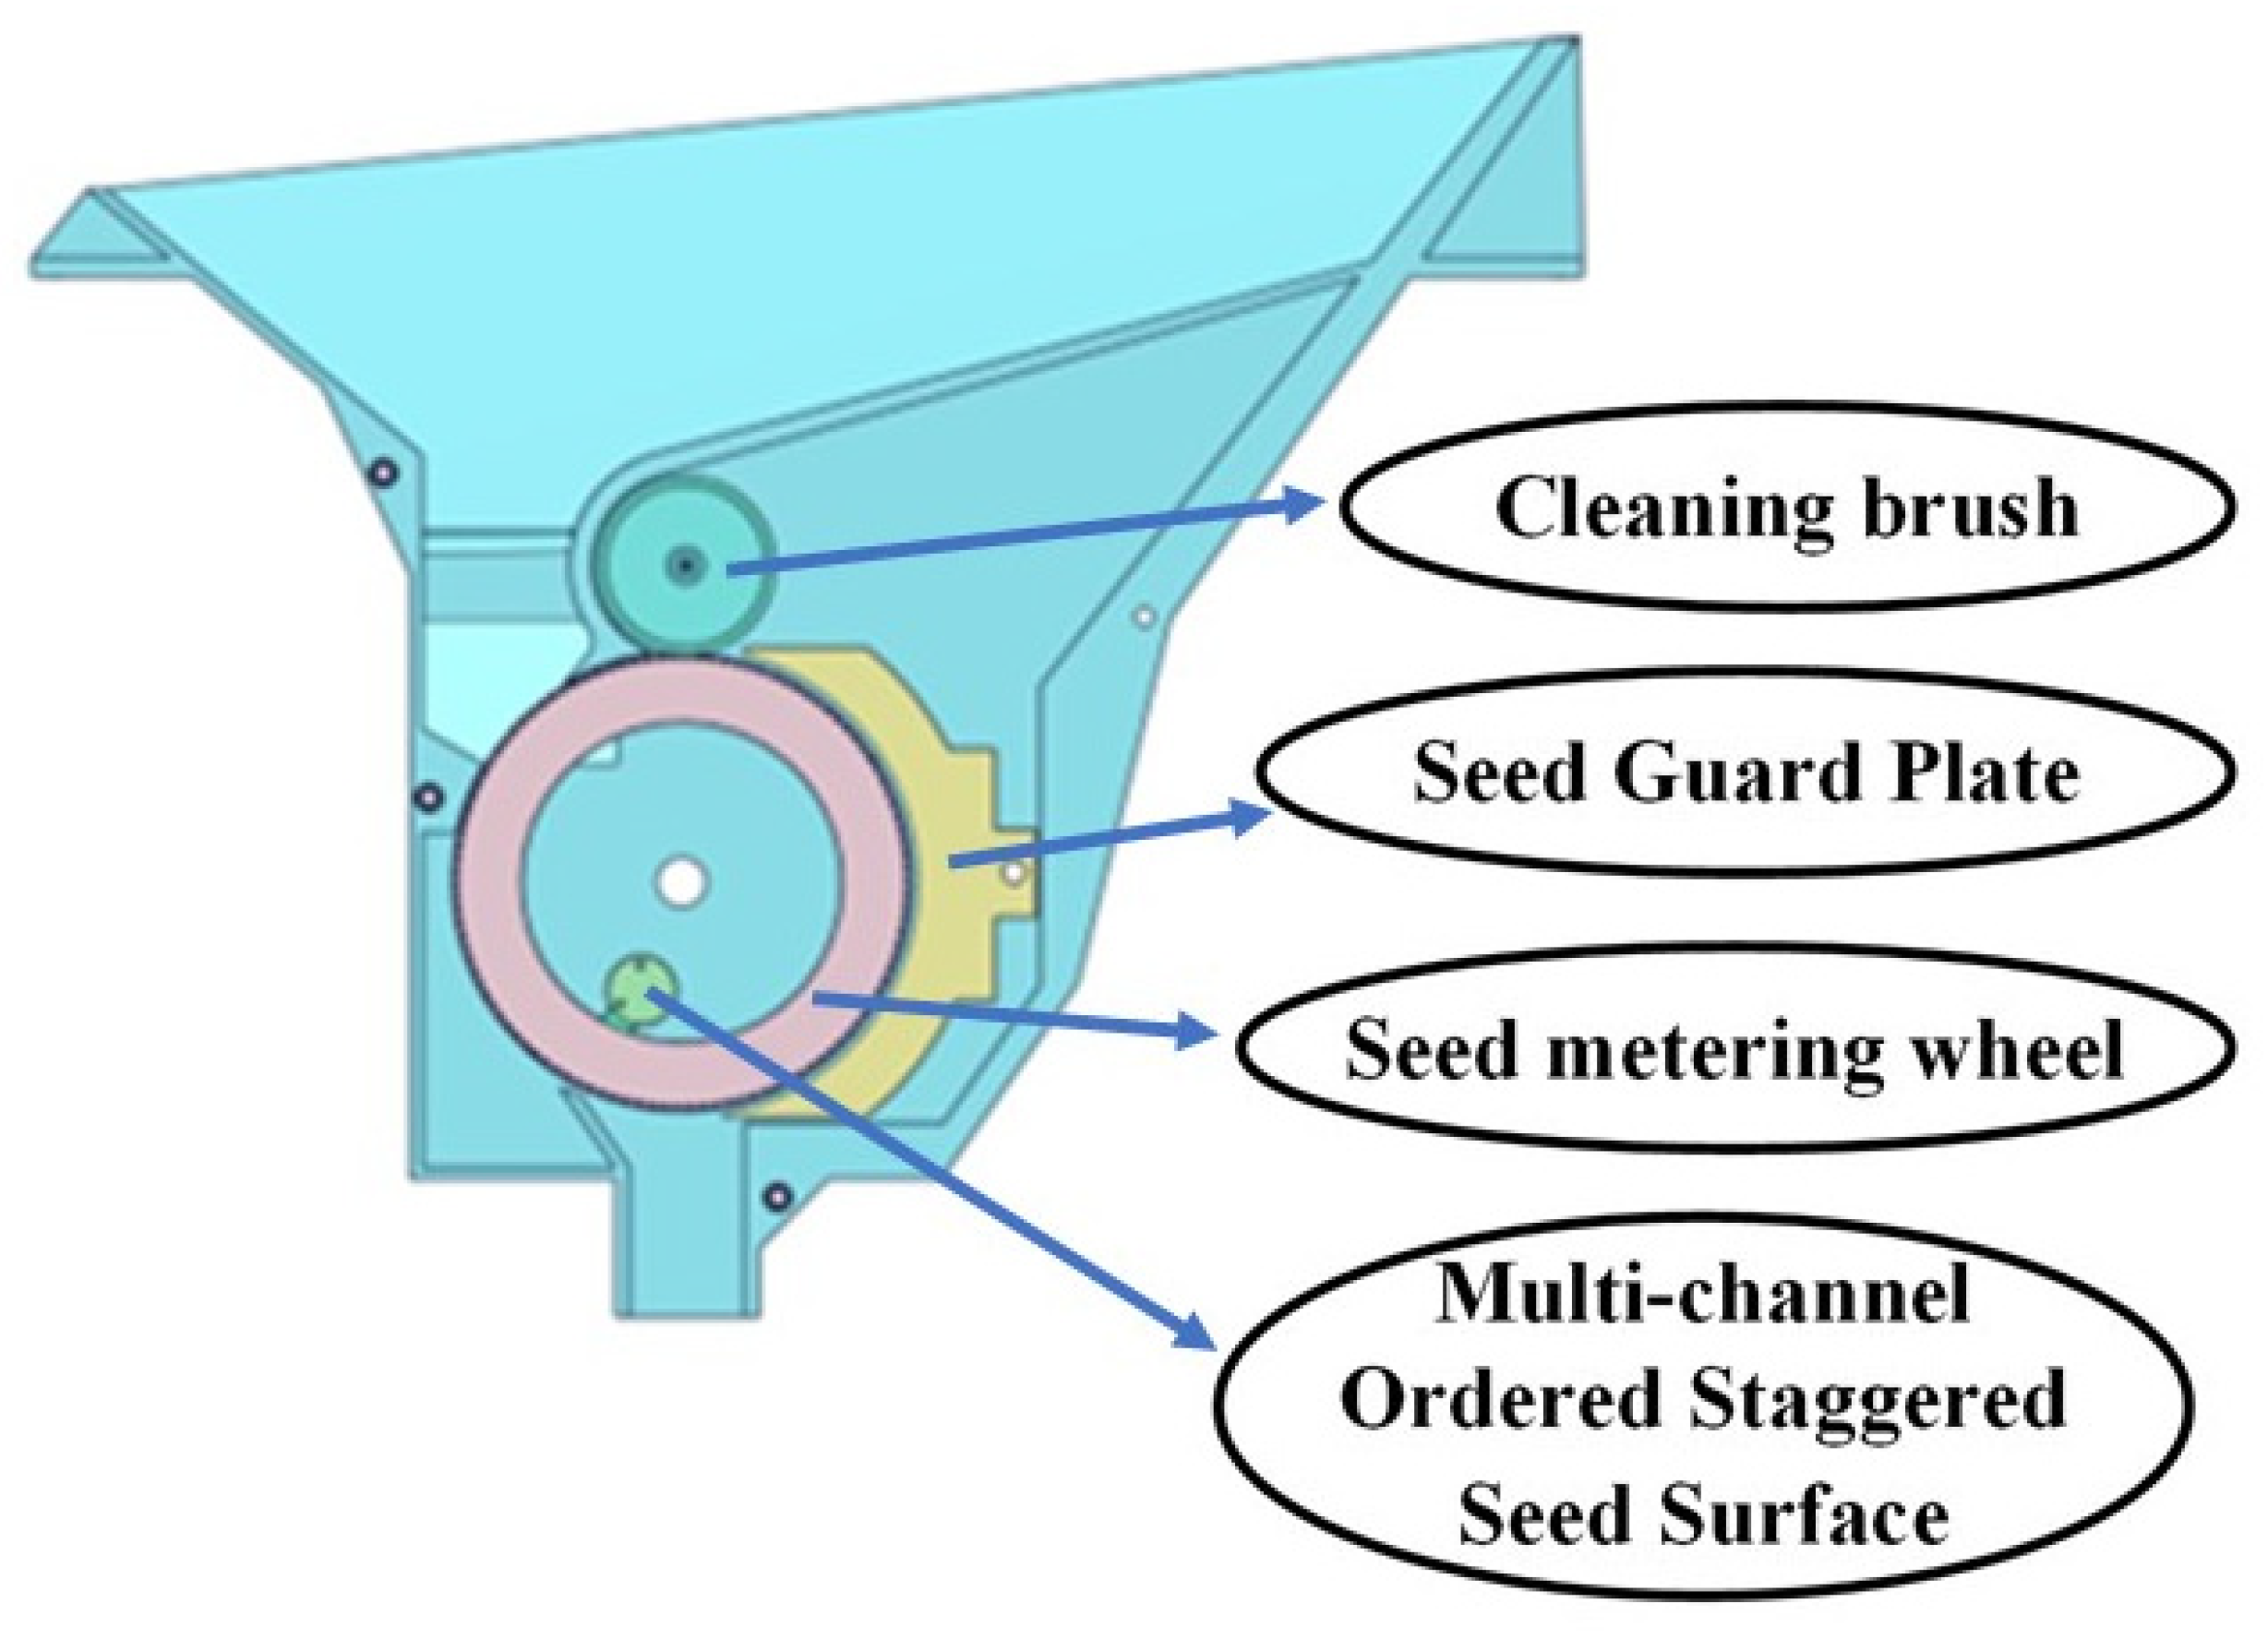
In this study, a four-layer staggered hook-tooth seed metering device developed previously by the research group was used as the carrier. This metering device achieves single-seed filling by means of hook-tooth holes. The staggered arrangement of hook teeth forms an interlaced and orderly seed surface in the falling seed flow, reduces collision and overlapping among seeds, and effectively improves seed orderliness. Its working principle is shown in
Figure 1.
The four-layer interlocking-tooth precision seed dispenser originally designed by the research team can inherently reduce seed drop density per unit time to some extent, forming a seed stream with defined time intervals. However, under high-throughput seeding conditions, the large volume of seeds falling within a concentrated timeframe can cause seeds passing through the sensor in rapid succession to form a curtain-like obstruction effect. Furthermore, during the process of entering the seed guide tube and detection device, seeds still exhibit a certain degree of overlap and interlacing, affecting detection accuracy and even making detection difficult.
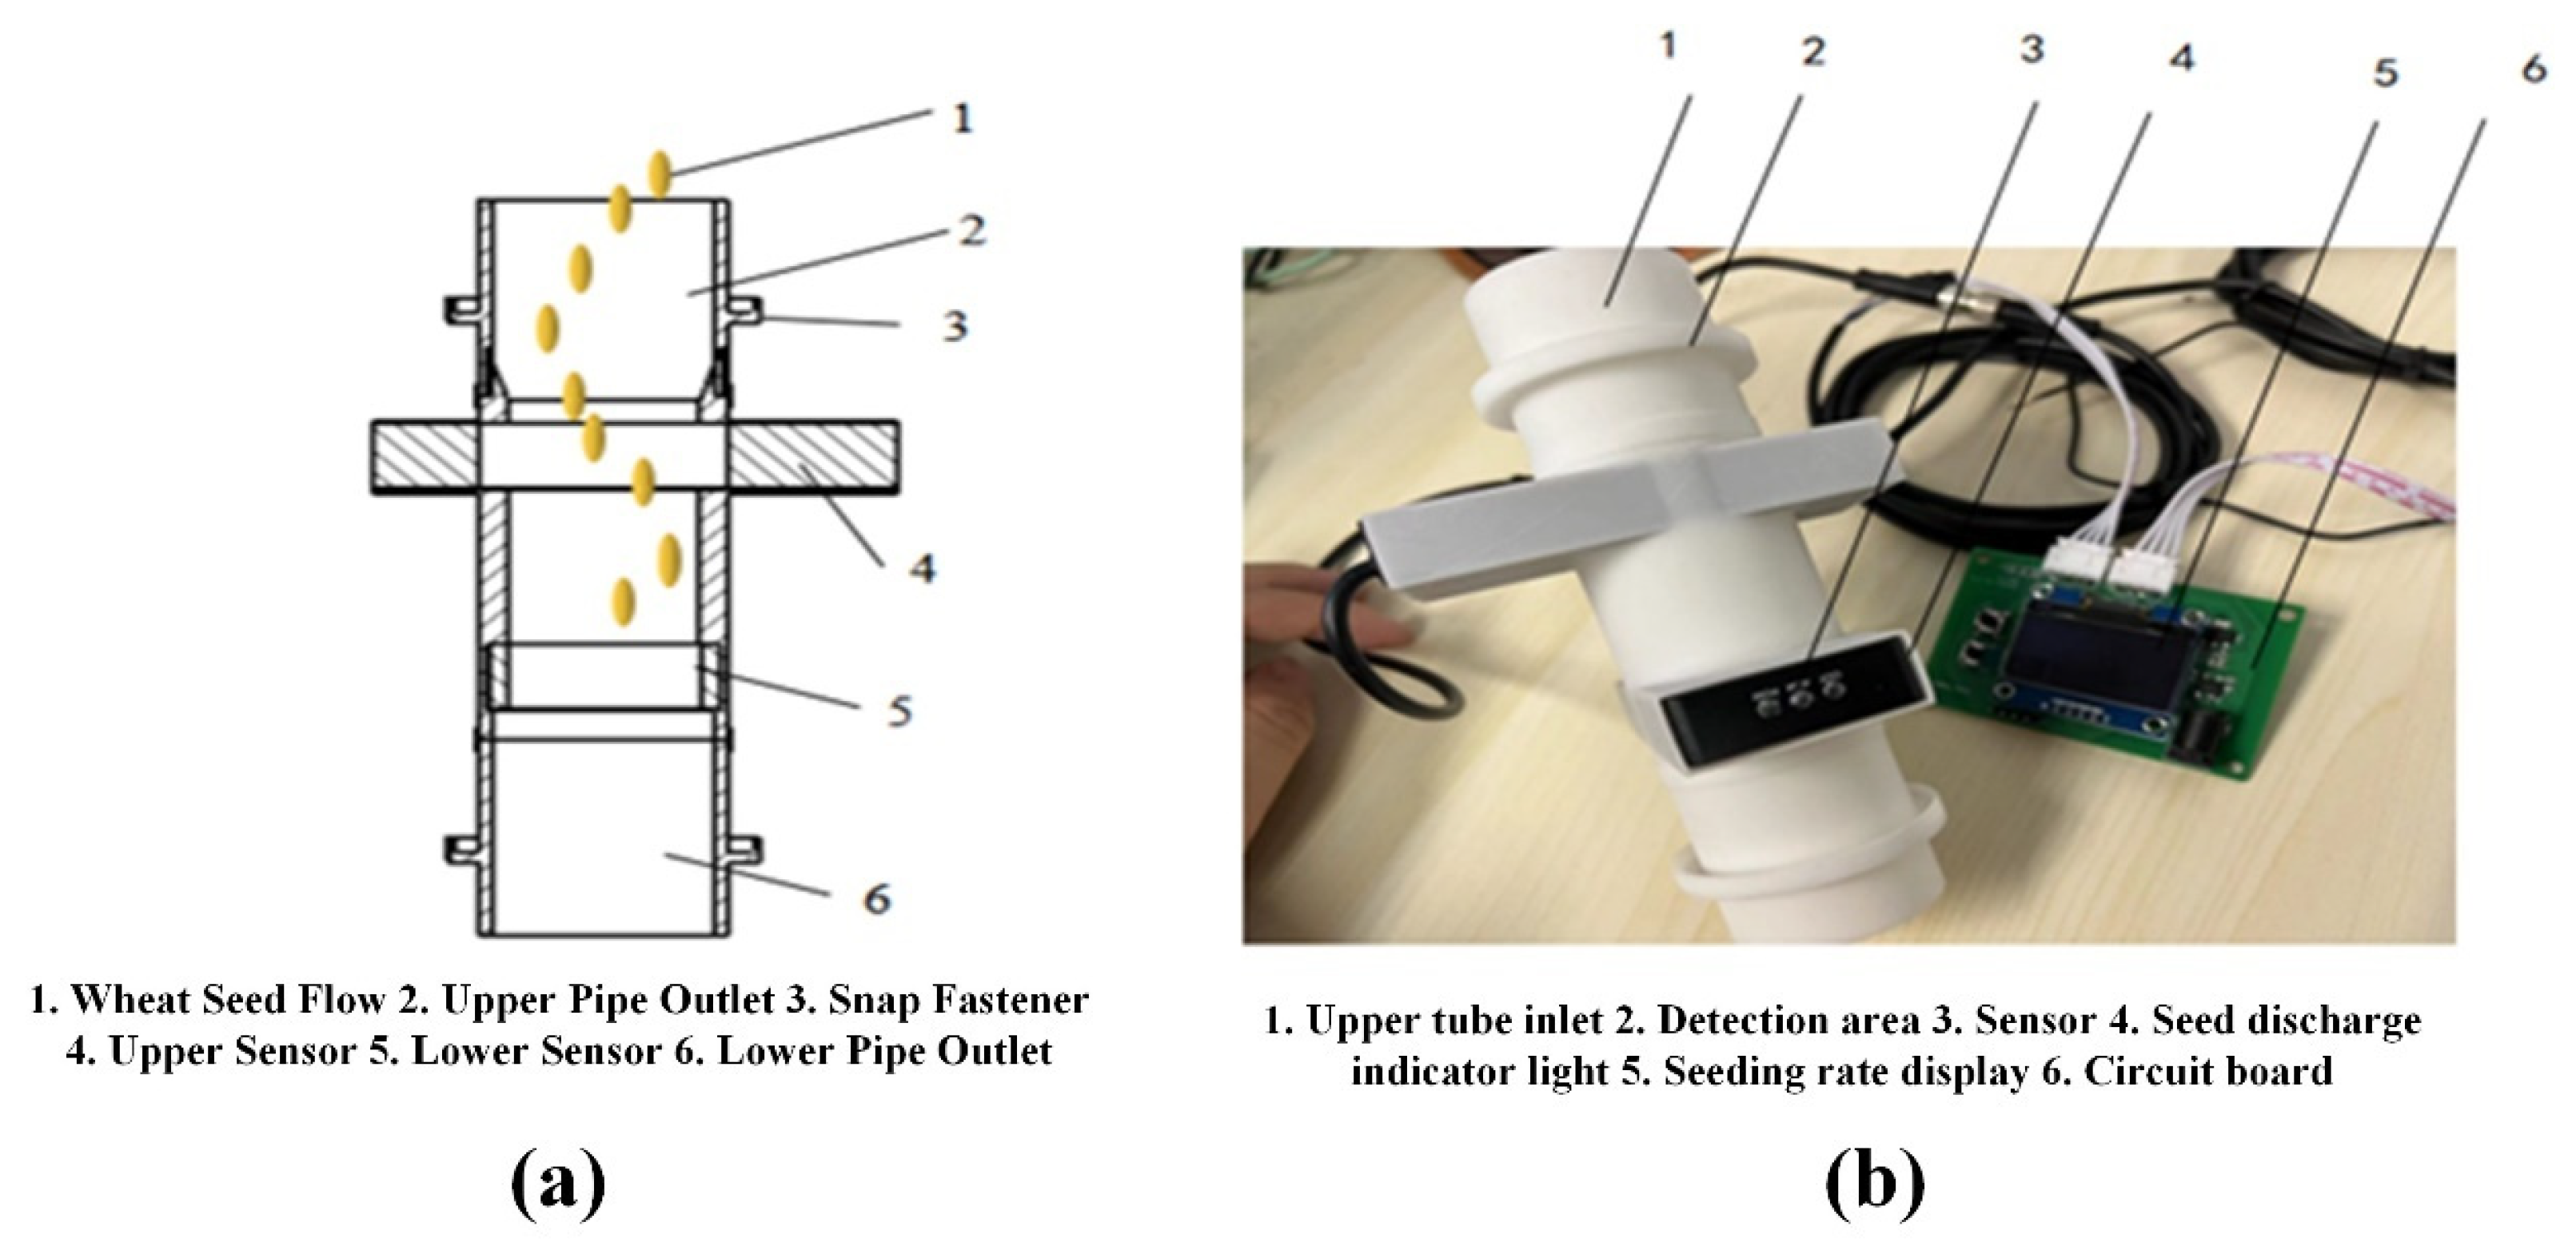
This study designed an orthogonal dual-layer photoelectric sensing detection device that performs two-stage detection on different planes of the same seed stream using two sets of sensors, thereby enabling effective identification of overlapping seeds. The detection device consists of three parts: an upper tube port, a detection zone, and a lower tube port, all of which are secured via snap-fit connectors. The upper tube port interfaces with the seed feeder of the seeder, while the two sets of sensors are embedded in the upper and lower mounting slots of the detection zone, respectively. This configuration forms a dual-layer, orthogonal detection optical path, allowing seeds to pass through the detection zone smoothly and without collision, thereby enabling the collection of signals from both surfaces. The detection device employs a BG-AG15N through-beam multi-beam infrared photoelectric sensor, which is manufactured by Shenzhen Boyi Jingke Technology Co., Ltd., Shenzhen City, Guangdong Province, People’s Republic of China. This sensor consists of a transmitter and a receiver; the transmitter integrates multiple parallel infrared emitter tubes, while the receiver corresponds to independent receiver tubes. The spacing between individual beams is 1.5 mm, and the effective detection distance between the transmitter and receiver is 40 mm, making it suitable for through-beam detection of small-diameter seeds. It employs an NPN open-collector output with amplification, cutoff, and saturation operating modes [
38]. A low-level signal is output when a seed passes through the optical path to trigger the sensor; the circuit is open when there is no obstruction, enabling precise detection of seed drop events. It operates on 10–30 VDC, features built-in short-circuit protection, and is equipped with three-color status indicator lights (power/operation/fault). With a response time of <1 ms, it meets the real-time data acquisition requirements of high-throughput seed dispensing scenarios. The overall structure of the detection device and a physical model are shown in
Figure 2, while the overall dimensions and performance parameters are listed in
Table 1.
The detection device operates as follows: As seed streams traverse the detection zone, varying seed orientations and quantities cause seeds to block light when passing through the first sensor layer, triggering corresponding electrical signal changes. As seeds continue falling through the second sensor layer—arranged orthogonally to the first—they are detected from another angle, generating corresponding voltage signals. Both signals are stored in the microcontroller. By comparing and analyzing these signals against predefined characteristics for single-seed, multi-seed, and different seed orientation patterns as they pass through the sensors, the system ultimately calculates the number of seeds passing per unit time, achieving precise counting of wheat seed streams. Additionally, to minimize errors caused by repeated detection of the same seed by different sensors due to seed length, a specific interval is maintained between the two sensor sets.
2.2. Design of Key Structural Parameters for Detection Devices
The detection device connects to the seed guide tube of the seed dispenser. Its upper tube opening has an outer diameter of 40 mm and an inner diameter of 36 mm, matching the dimensions of the guide tube for seamless connection. The upper inner surface of the intermediate seat features a conical convergence structure with an inner cone height of 8 mm. The cone surface forms a 72.68° angle with the upper pipe opening end face, guiding falling seeds to minimize collision and bounce effects on detection accuracy. The sensor’s effective detection area is a 31 mm × 40 mm rectangle, with both transmitter and receiver faces measuring 31 mm in length. Through a dual-layer orthogonal arrangement, the upper and lower layers form an equivalent square detection surface of 31 mm × 31 mm, enhancing detection coverage and stability.
Based on the application scenario of the seed dispenser designed in this paper, our research group selected Ningmai No. 9 seeds—commonly used in the middle and lower reaches of the Yangtze River—as the study subject. A random sample of 300 seeds was taken, and their length, width, and thickness were measured using a vernier caliper (accuracy 0.01 mm). The measurement results yielded the three-axis dimensions of Ningmai No. 9 seeds as 6.32 mm × 3.29 mm × 2.71 mm. Given the seed’s maximum length of 6.32 mm, overlapping during descent is possible. To ensure seeds are not detected by both sensors simultaneously and to account for sensor response time, the sensor spacing was set to 30 mm. This spacing guarantees the detection of seeds in identical descent postures across different time intervals within the sensors’ response time. The optical layer thickness at the emitter end is 2 mm, and each sensor has a response time of 1 ms. Therefore, the seed fall process must be analyzed to verify whether the transit time meets requirements. To understand seed fall behavior, EDEM software Version 24 was used to simulate the state of seeds passing through the sensor monitoring area [
39].
The simulation parameters are described below. The wheat seed is modeled as an ellipsoid, simplified to a major axis of a = 6.32 mm and a minor axis of b = 3.00 mm. Since wheat seeds have a smooth surface and no adhesion, a non-slip contact model is selected. The discrete element model (DEM) for the wheat grains was constructed using a combination of five spheres. During the simulation, wheat seed dimensions are generated according to a normal distribution. Based on available data, the material properties of the wheat seeds and the seeding wheel, as well as their interaction parameters, are determined as shown in
Table 2.
The simulation setup involved seeds flowing from a four-layer interlocking gear feeder, with 1000 seeds and a simulation duration of 10 s. The initial velocity of seeds entering the detection zone was calculated based on the maximum seeding speed, yielding a value of 0.154 m/s. Since seeds possess initial velocity upon exiting the feeder, they undergo accelerated motion within the detection zone, as described by Equation (1).
In the equation, is the distance from seed tube outlet to first sensor, m; is the distance between the detection surfaces of the first and second sensors, m; is the initial velocity, m/s; is the time from seed exit of seed tube to first sensor, s; is the seed velocity within the detection zone, m/s; and is the time to traverse the detection zone, s.
To verify whether the sensor response time meets detection requirements, a kinematic analysis of the seed descent process was conducted. The distance from the seed outlet to the first detector’s sensing plane is known to be 50 mm, and the spacing between the two sensor sensing planes is 30 mm. Calculations show the time from seed exit to the first sensor is 0.086 s, and the time traversing both detection surfaces is 0.027 s, resulting in a total traversal time of approximately 113 ms. This duration significantly exceeds the sensor’s 1 ms response time, ensuring seeds are detected within the sensor’s response window and meeting detection requirements.
2.3. Signal Processing Circuit Design
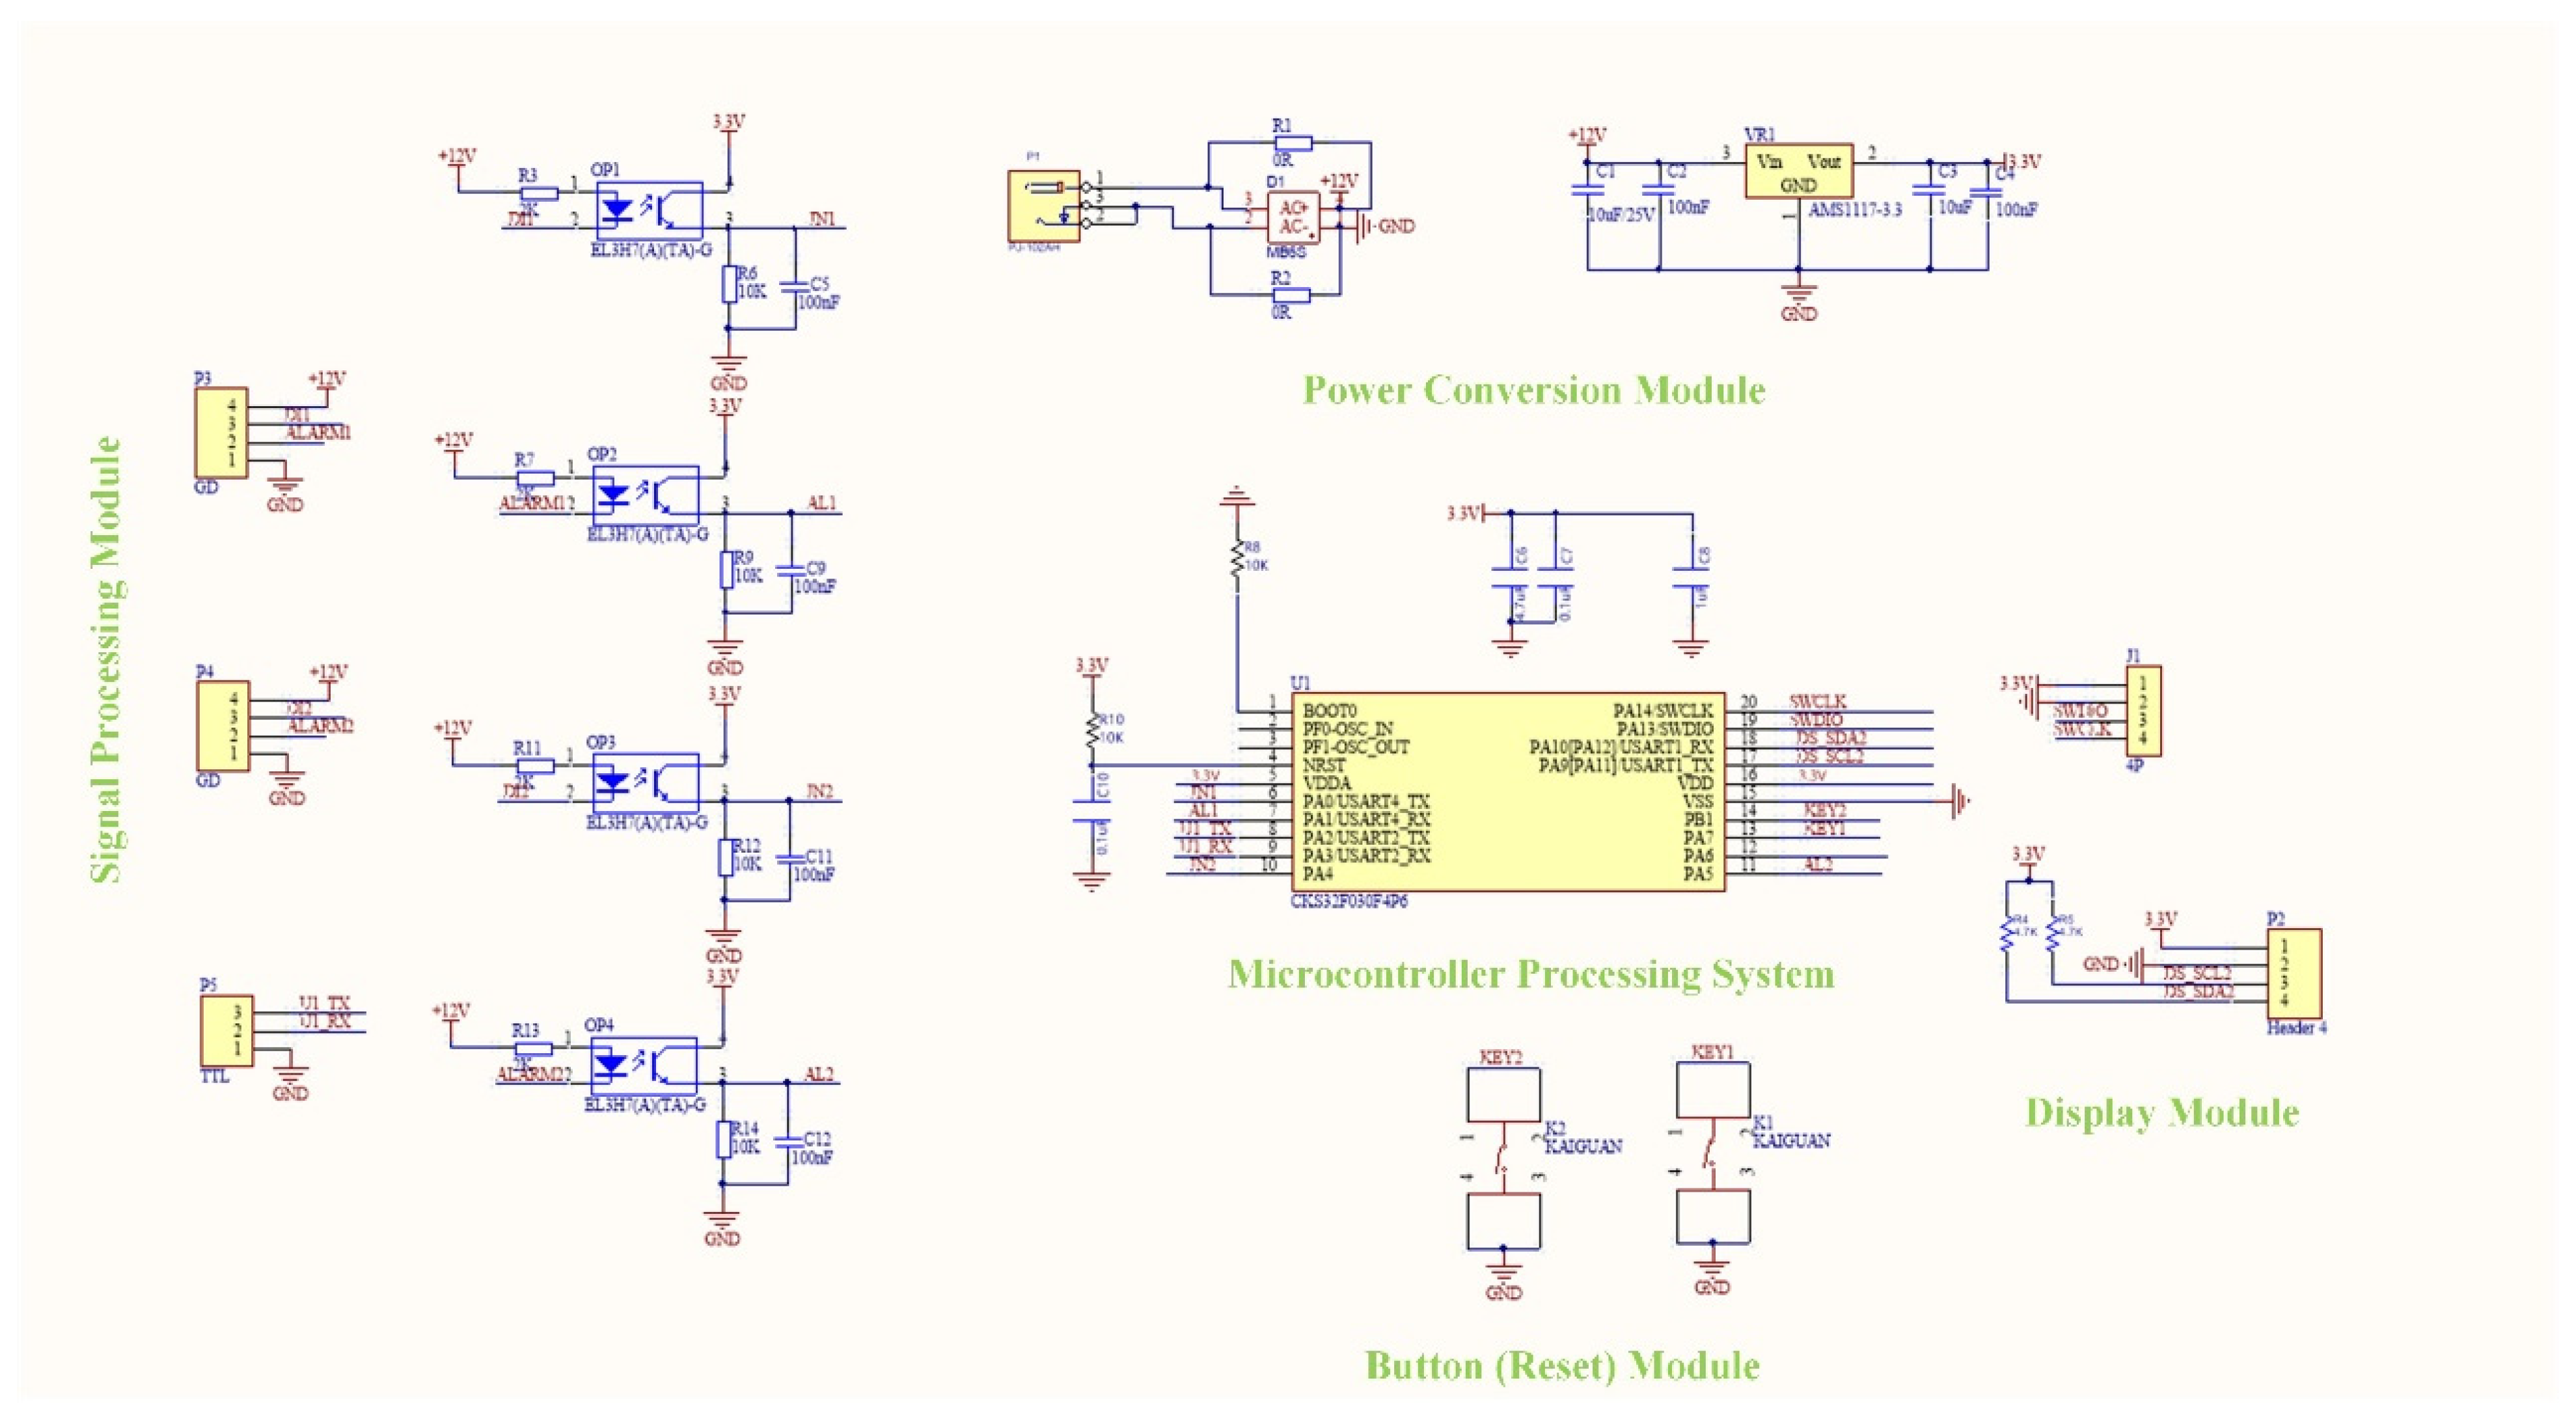
To analyze and process wheat seed collection signals, an orthogonal dual-layer signal acquisition system circuit was designed. This circuit primarily consists of a power conversion circuit, a signal processing module circuit, and a display module circuit. During operation, sensors detect partial obstructions caused by wheat seeds of varying quantities and orientations crossing the sensing plane, generating distinct signals. After optocoupler isolation, these signals are input to separate interrupt pins of the microcontroller. The microcontroller processes and compares the signals before transmitting them to the display module. Real-time results are shown on the OLED screen. The overall system circuit is illustrated in
Figure 3.
The power module utilizes a 12 V external lithium battery connected to the circuit board via a power interface. The sensor features an NPN output type, requiring its signal line to share ground with the negative terminal. As the circuit board incorporates an internal power supply, the 12 V lithium battery is connected in reverse polarity. This input is converted to +3.3 V through a power conversion circuit, providing stable power to all board components. In the signal processing and display module, optocouplers utilize light as a medium for signal coupling transmission. They offer advantages such as compact size, long lifespan, contactless operation, and strong anti-interference capabilities. They enable electrical isolation between input and output while ensuring unidirectional signal transmission, thereby stabilizing microcontroller input signals to enhance processing accuracy [
40]. This design adopts the EL3H7(A)(TA)-G optocoupler manufactured by Everlight Electronics Co., Ltd., Taipei, Taiwan, China, which is capable of processing signals from two sensors. The display module employs a 1.3-inch four-pin OLED screen. Pins 1–4 connect to the microcontroller’s 3.3 V, GND, DS SCL2, and DS SDA2 pins, respectively, providing a real-time display of detected seed flow counts. The reset button module clears test data and switches display interfaces. After each signal processing cycle, the recorded data is displayed. A new test cycle requires resetting via this module to restart counting. Since both sensors can operate independently, three display interfaces are configured: upper sensor detection data, lower sensor detection data, and upper–lower comparison detection data.
2.4. Program Design
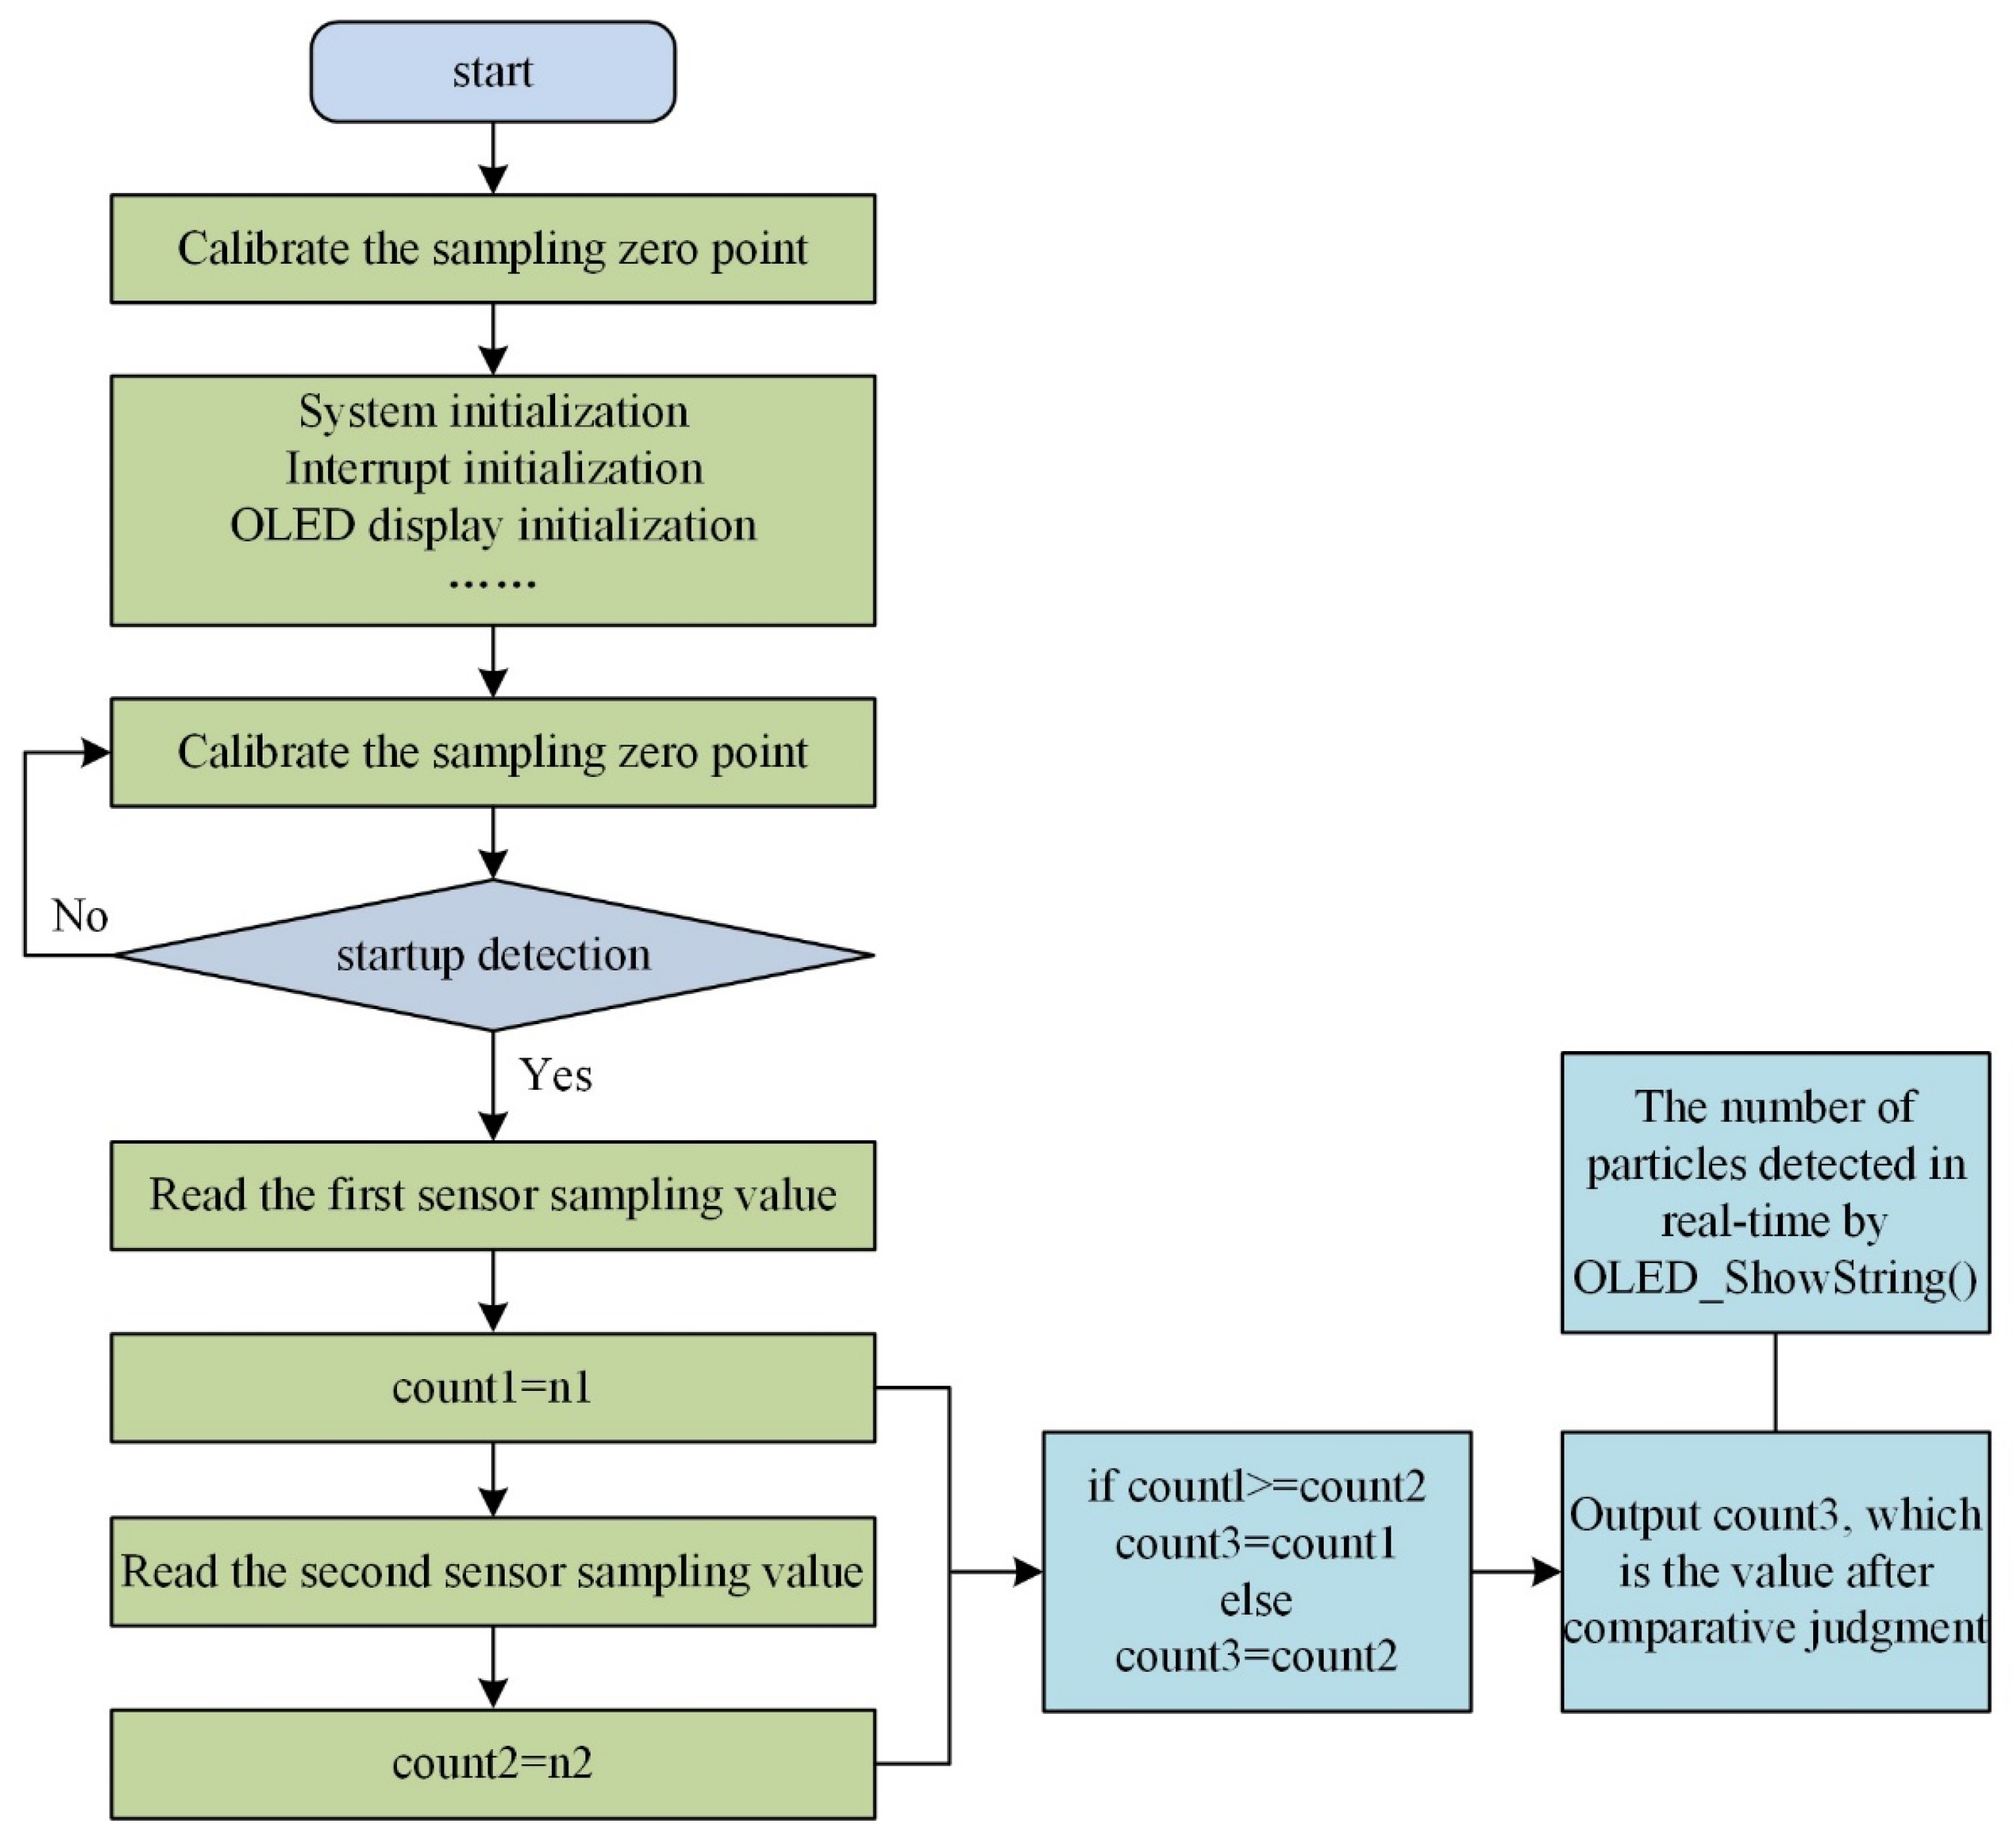
The signal processing system program for the orthogonal dual-layer sensor is crucial for achieving seed flow detection and counting. Designed to enable precise detection of wheat seed flow, this software program first completes zero-point calibration, system initialization, interrupt initialization, and OLED display initialization upon startup before entering a continuous detection state. The system employs dual-layer interleaved sensors for detection, utilizing isolated input circuits to ensure independent operation and mutual interference-free functioning of both sensor channels. As seeds sequentially pass through both sensors, their output signals are separately acquired and stored. Within a unit time interval, the two signals are compared and evaluated. If the counts match, the result is directly displayed. If they differ, the higher value is selected as the final count. Should the difference between the two detection values exceed 4, the alarm light flashes and detection pauses. The final count result is displayed in real time via the OLED screen. The wheat seed flow counting program is illustrated in
Figure 4.
2.5. Signal Propagation Analysis
Based on preliminary test results and agronomic requirements, the wheat seed rate is 15 kg per mu. The selected Ningmai 9 variety has a thousand-grain weight of 40.1 g, and the specified travel speed must reach 6–8 km/h. During the same time interval, no more than four seeds pass through the sensor, with most passing the detection surface in pairs. Accordingly, this detection device prioritizes enhancing recognition accuracy and counting stability for 1–4 seeds.
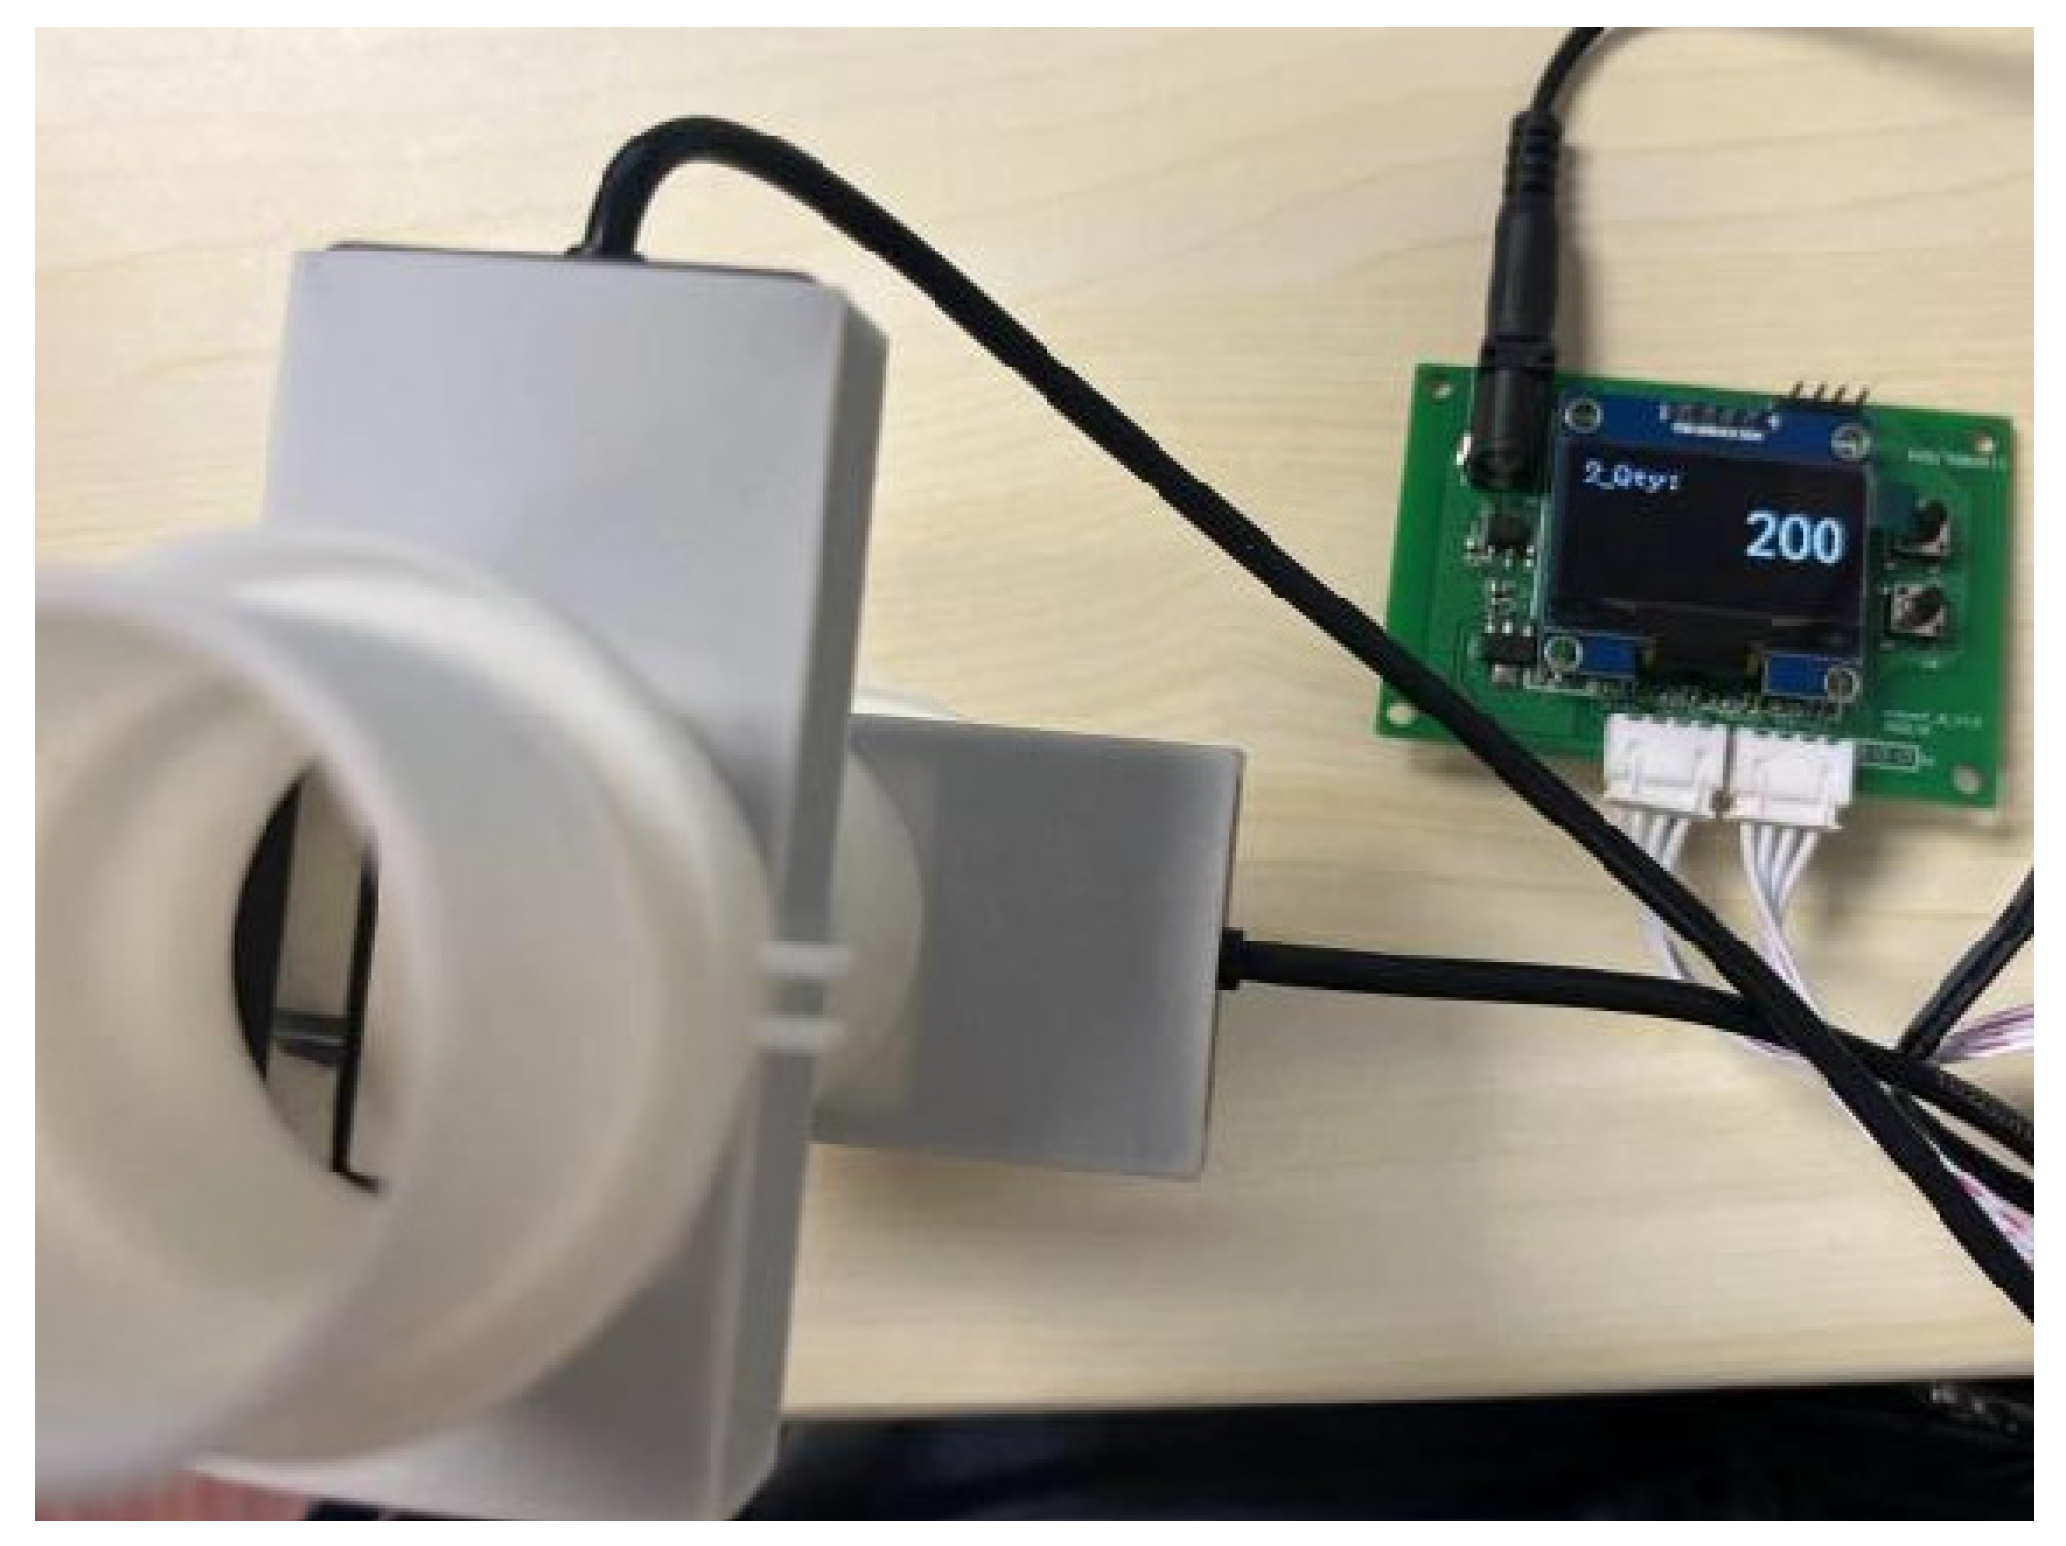
To verify whether the sensor exhibits missed detection or blind spots, a low-frequency single-seed drop test was conducted on the assembled detection device. Well-formed, undamaged wheat seeds were selected for testing. Single-seed tests were performed at varying drop heights and orientations, with all 200 seeds effectively detected. Counting results were recorded in real time via the display screen to determine whether each seed was correctly identified. Test results confirmed no missed detections under low-frequency single-seed testing conditions, validating the rationality of the device’s structural design and detection reliability. The low-frequency single-seed detection test is illustrated in
Figure 5.
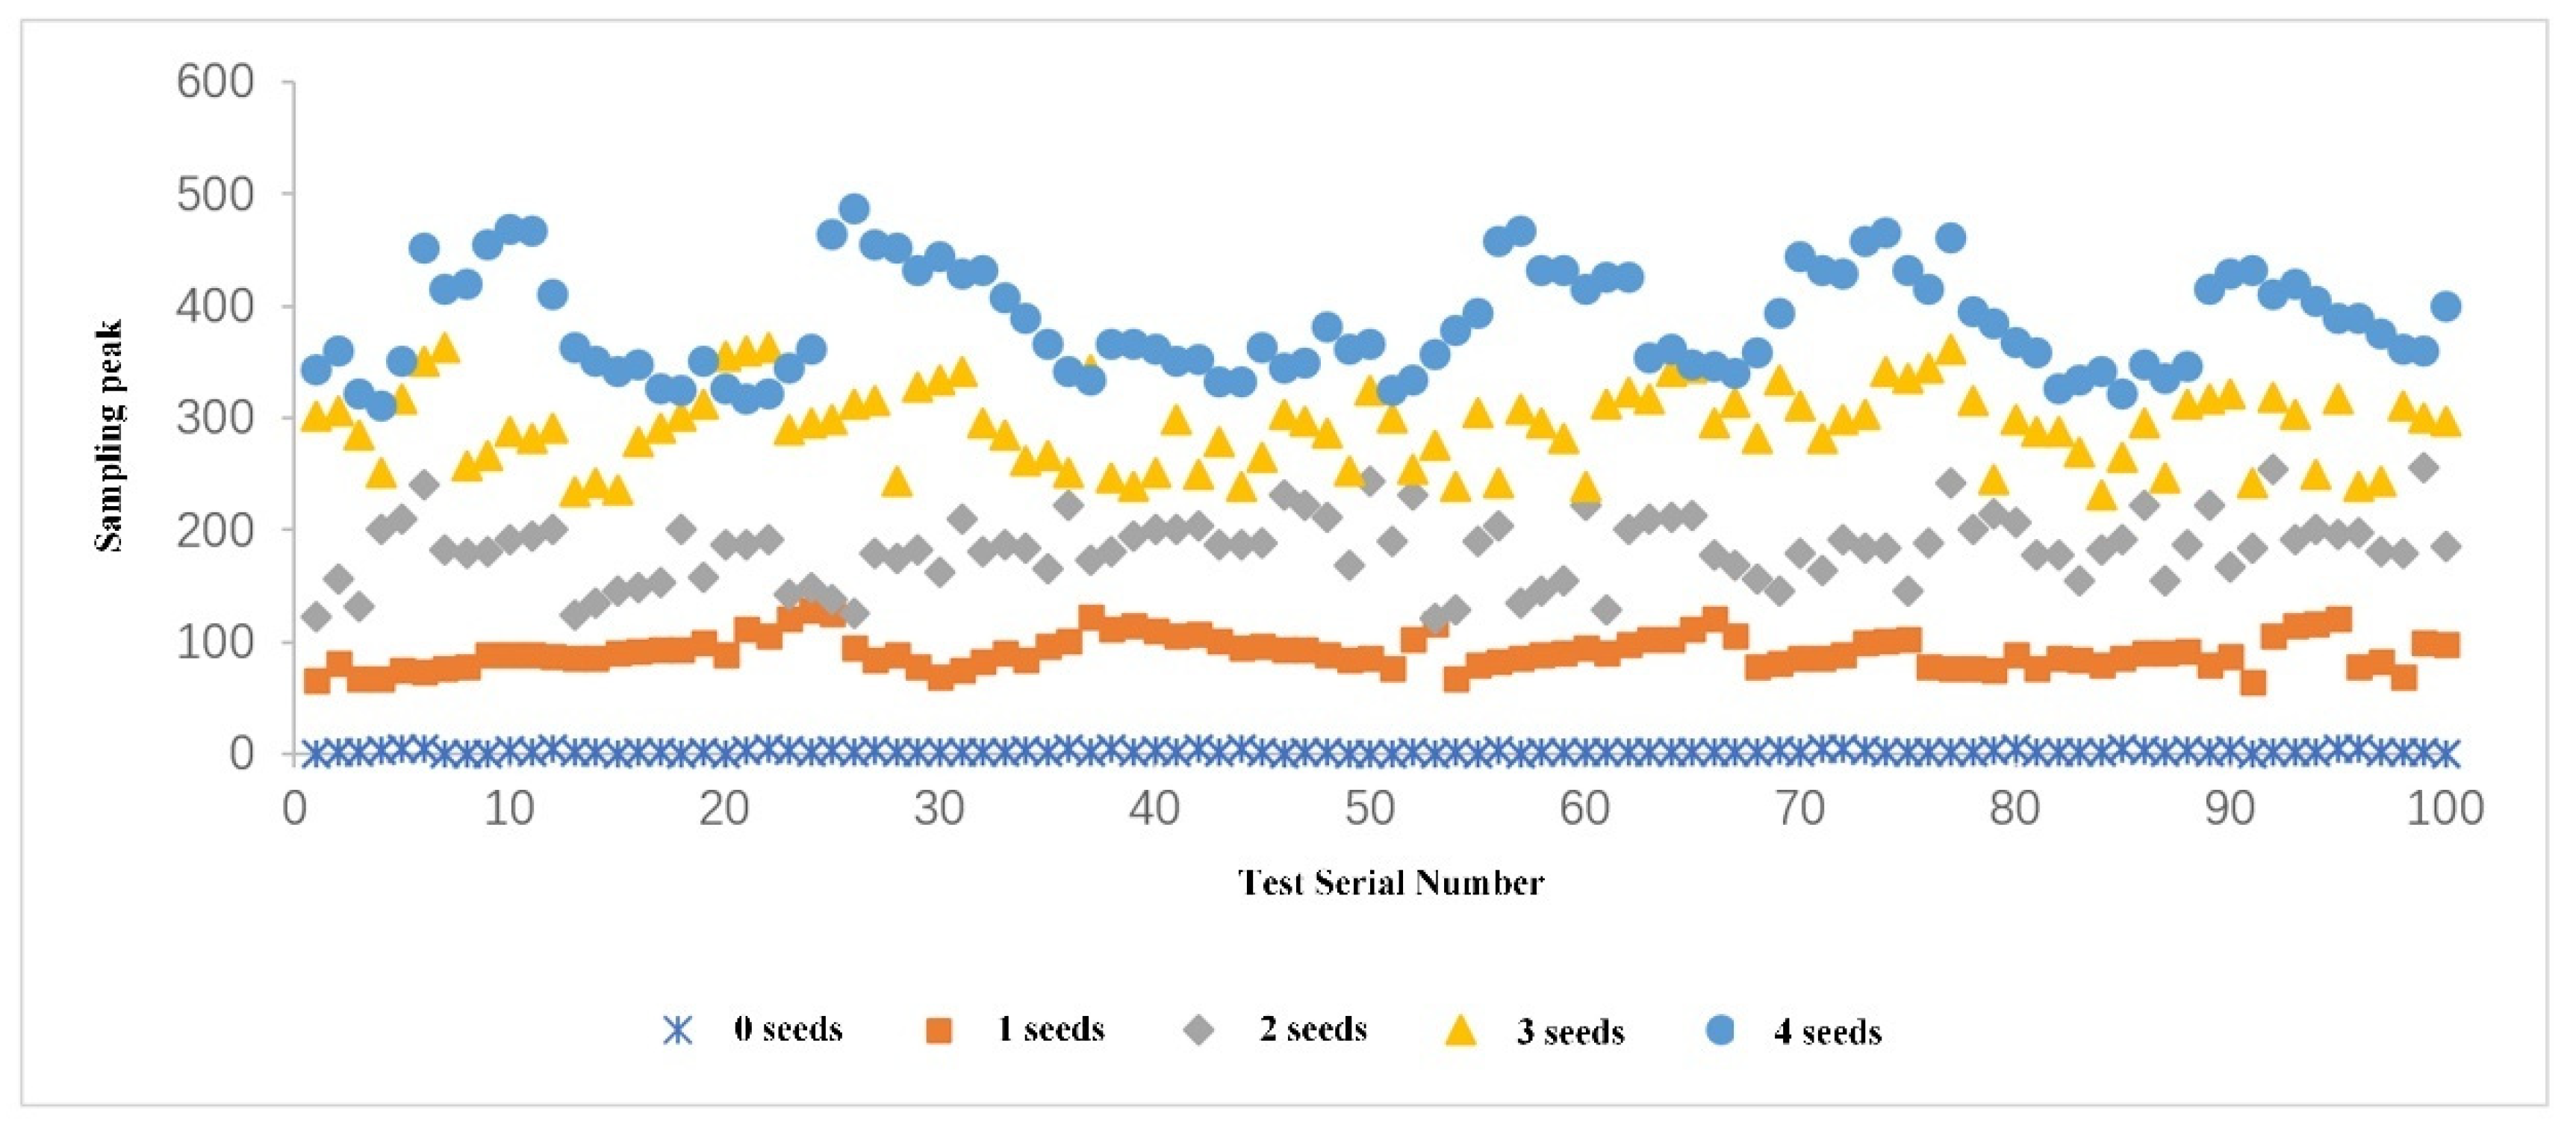
To investigate how the sensor detects seeds of varying quantities and orientations, experimental analysis was conducted on the signal changes caused by the fall of 1, 2, 3, and 4 seeds. The experiment involved collecting voltage signal values altered by the fall of single to four seeds through the detection device. The test was divided into four groups, each comprising falls of 1 to 4 seeds. Since seeds assume different orientations during fall, resulting in varying signals, a single sensor array was used for testing. Each group of tests was repeated 100 times.
2.6. Bench Testing
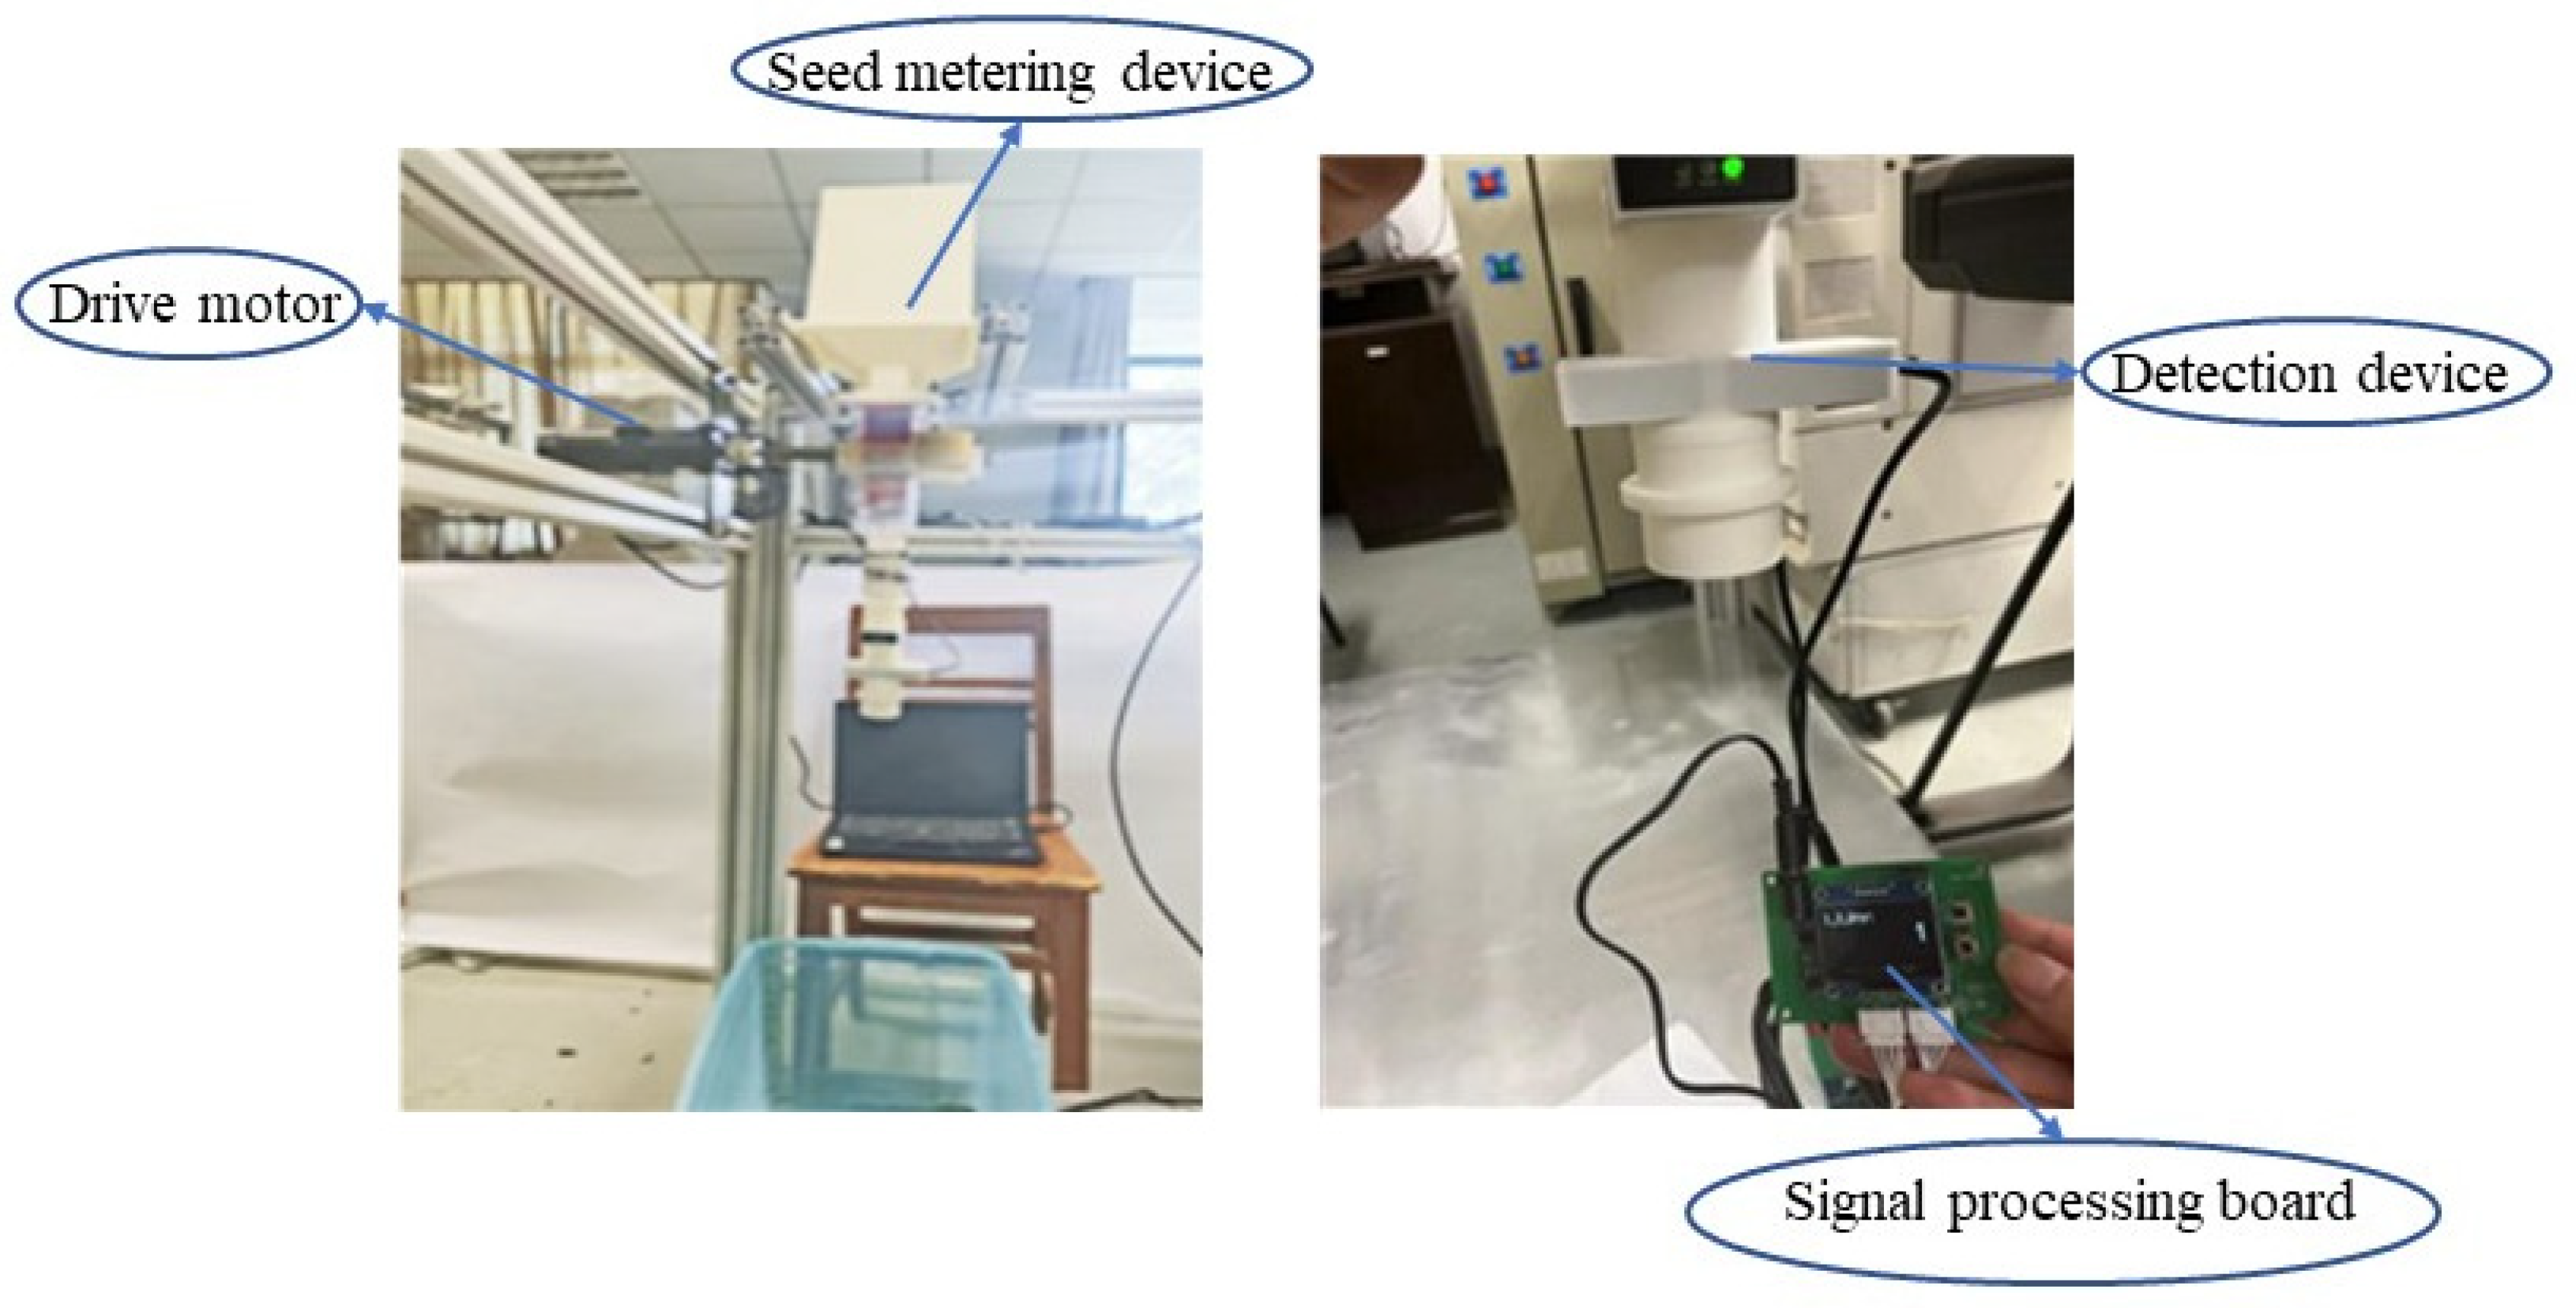
This study used Ningmai 9 wheat seeds as the experimental material. Before the experiment, damaged and shriveled seeds were manually removed. The research was conducted using a four-layer interlocking-tooth wheat seed dispenser developed by the research team and a seed flow detection apparatus test rig, as shown in
Figure 6.
To investigate whether the performance of the designed detection device meets the seeding frequency of the seed dispenser, bench tests were conducted on the wheat seed flow detection device at different frequencies using the constructed test rig to evaluate its performance. Combined tests were performed with the detection device and seed dispenser to verify the detection accuracy at various rotational speeds of the seed dispenser.
The specific bench test methodology is as follows:
- (1)
Before testing, intact wheat seeds without damage were selected to prevent detection errors caused by seed defects. An automatic seed counter simulated the seeder’s operation, setting two tiers of sowing frequencies: low frequency (20 Hz, 25 Hz, 30 Hz) and high frequency (80 Hz, 100 Hz, 120 Hz). The sowing rate was 15 kg, with an operating speed of 6–8 km/h. Each seeding cycle lasted 10 s, and each frequency setting was repeated three times.
- (2)
Connect the detection device to the seed distributor to evaluate detection accuracy at different distributor wheel speeds. Set the seed distributor to a uniform seed layer height of 65 mm. Test five distributor wheel speed settings: 14 rpm, 16 rpm, 18 rpm, 20 rpm, and 22 rpm. Seed for 10 s at each speed, repeating each speed setting three times.
- (3)
Collect seeds dispensed at different frequencies and seeder speeds into pre-labeled bags. After testing, verify the actual number of seeds dispensed.
4. Conclusions
Based on an analysis of the current status and development trends of wheat seed flow detection technology at home and abroad, this paper carries out innovative design and experimental research on a high-throughput wheat seed flow detection device. Currently, foreign advanced systems focus on large-scale precision seeding with high detection accuracy, but they are expensive, poorly compatible with domestic planters, and their technical details are not publicly disclosed. Domestically, there are few breakthroughs in high-throughput overlapping detection for small-grain seeds, and the main research trends focus on high-throughput adaptability, anti-interference ability, and compatibility with local agricultural machinery. Future research on high-throughput seed flow overlapping detection can focus on high-speed precision detection, universal detection of multiple seed varieties, establishment of detection standards, integration of cutting-edge technologies, and in-depth mining of detection information. In particular, for high-speed precision detection, efforts can be made to further tackle the ordered shunting and seeding of high-throughput seed flow and surface source detection technology based on multi-channel light beams, so as to solve the problem of missing records caused by overlapping high-throughput seed flow or passing through detection blind areas and improve detection accuracy.
Relying on the four-layer interleaved hook-tooth seed metering device independently developed by the research team, this study designed an orthogonal double-layer photoelectric wheat seed flow detection device. This device can effectively identify interleaved and overlapping wheat seeds and realize stable detection of the high-throughput seed descent process. This study completed the structural design of the detection device, built a signal detection system, and verified it through bench tests. The main conclusions are as follows:
(1) A dual-layer orthogonal photoelectric wheat seed flow detection device was developed, capable of reliable docking with the seed feeder’s seed guide tube to enable real-time monitoring of seeding rates. By optimizing the housing structure, seeds enter the detection zone smoothly without collision, ensuring uninterrupted seed delivery. This effectively addresses challenges in high-throughput seeding, such as large seed volumes, high frequency, and seed overlap. The dual-layer orthogonal photodetectors capture seeds falling simultaneously at different planes. Seed quantity is determined by voltage changes caused by light blockage at each plane, with dual-plane signal comparison enhancing counting accuracy.
(2) A dual-layer orthogonal photoelectric wheat seed flow signal detection system was established. To address signal overlap in multi-seed sampling, signal penetration characteristics were analyzed to identify voltage peak distribution patterns for different seed counts. Using least squares optimization, differentiation thresholds for adjacent seed counts were derived, and a multi-seed misjudgment error calculation model was established, effectively resolving misjudgments caused by signal overlap.
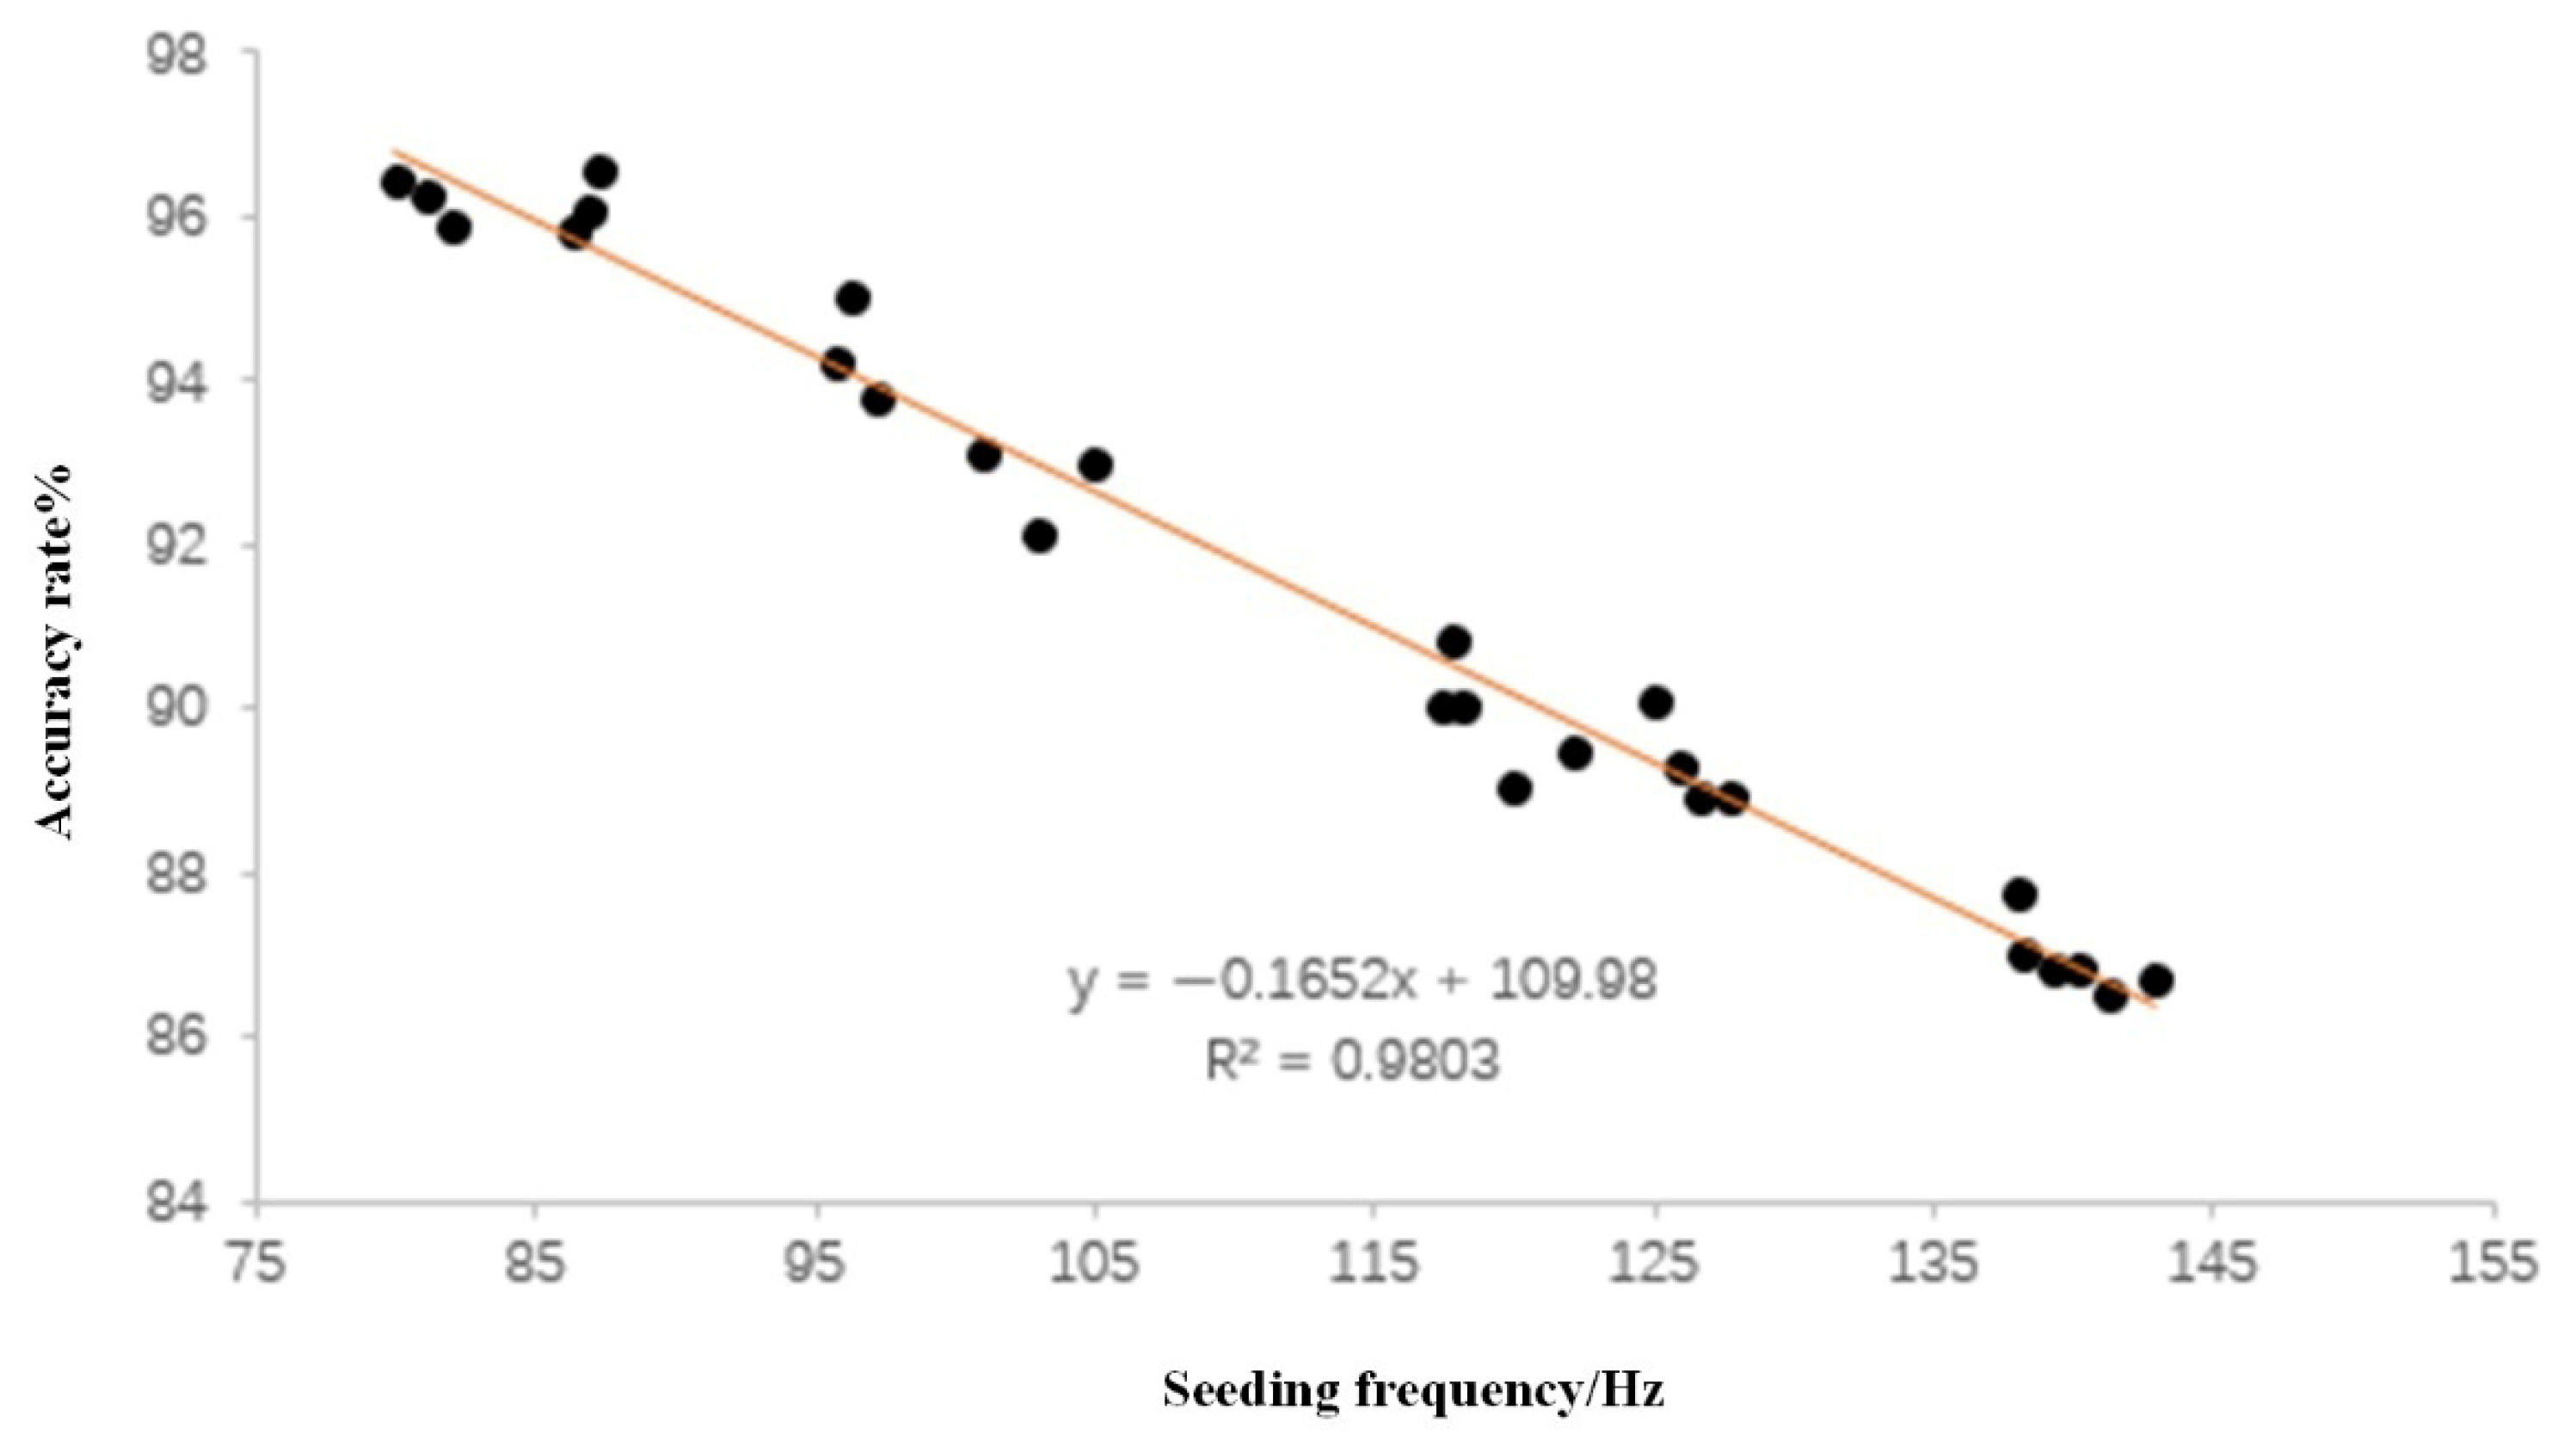
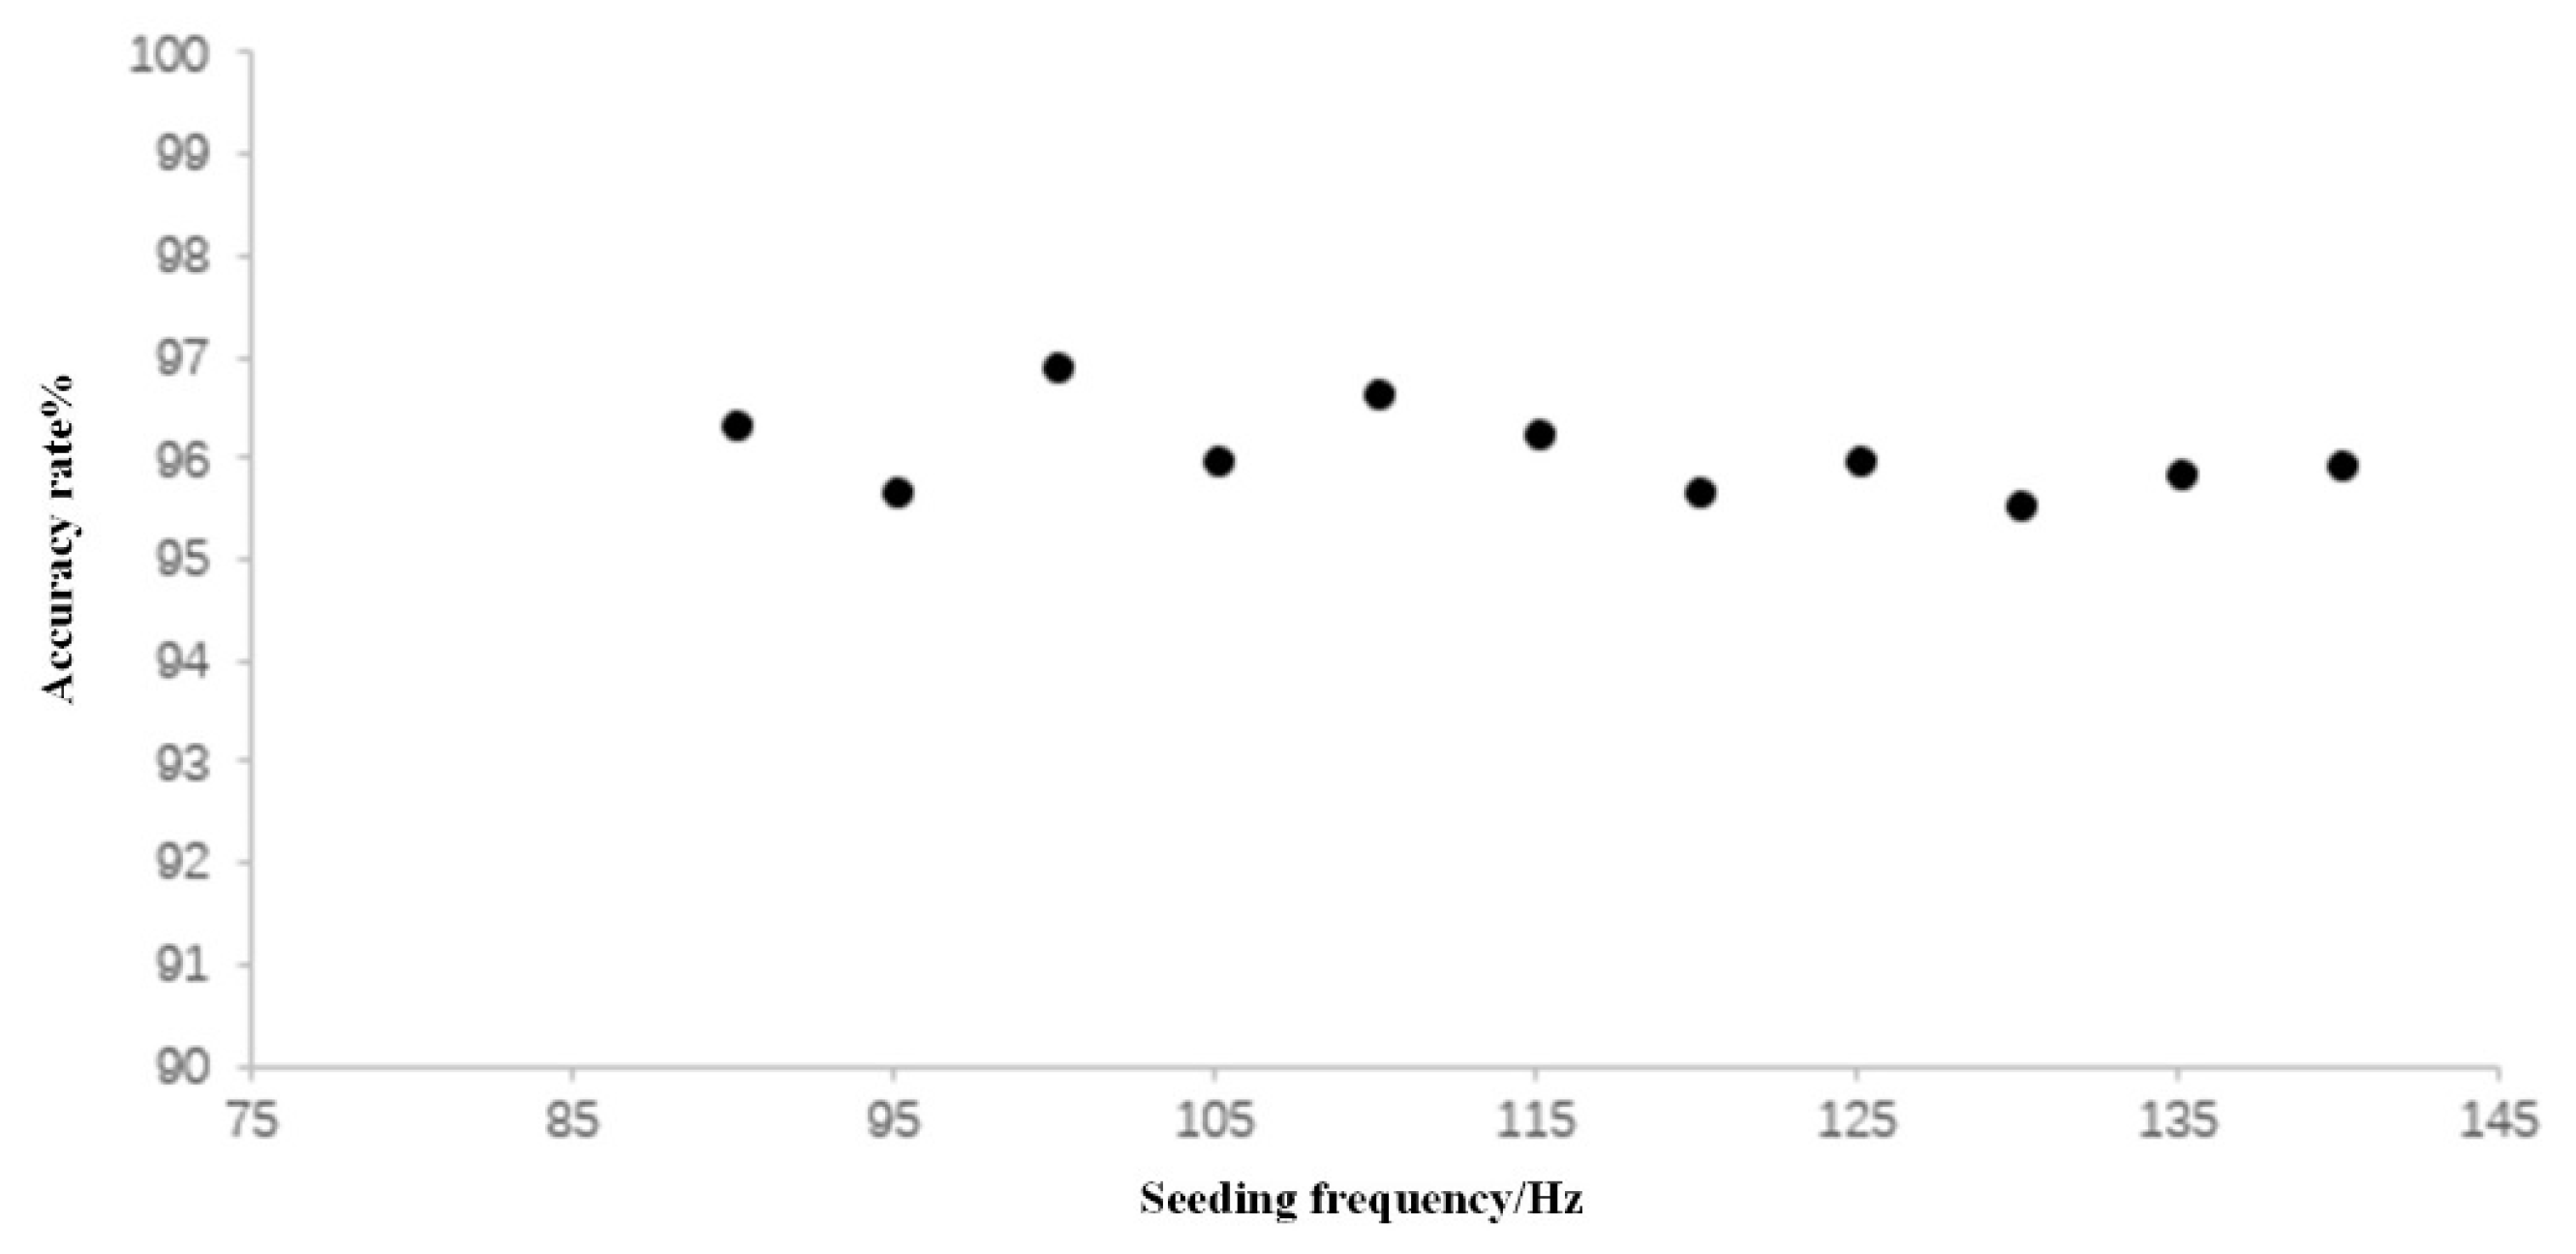
(3) Bench test results indicate that the detection device’s performance is influenced by seeding frequency. At medium–low frequencies (20–40 Hz), detection accuracy remains stable above 97%, meeting conventional seeding requirements. When the seeding frequency increases to 80–120 Hz, the detection accuracy drops to 89.05% due to increased seed flow density. After introducing the compensation model, detection accuracy remained stable above 95% within the high-frequency range of 90.2–140.2 Hz. This represents a maximum improvement of nearly 10 percentage points compared to the uncompensated state, significantly enhancing detection reliability under high-frequency conditions.