1. Introduction
In response to the increasing demand for poultry production, ensuring optimal environmental conditions within poultry housing systems is essential. Such conditions are fundamental to safeguarding avian health, enhancing production efficiency, and promoting the overall economic sustainability of poultry enterprises [
1,
2]. Air quality in poultry farms, in the form of the concentration of gases such as Carbon Dioxide (
), Methane (
), and Ammonia (
), is one of the most critical factors that affect chickens’ health and meat and egg production. Long-term exposure to these gases can lead to respiratory ailments, stunted growth, and reduced productivity by 30% [
3]. Also, extended exposure to these gases can cause severe respiratory issues among farm workers and birds [
4].
Traditional methods of gas sensing using manual sampling or handheld detectors are manpower- and time-consuming, with the disadvantage of missing the real-time variation in gas concentration [
5,
6], and they also are not well-suited to modern large-scale farming systems. Manual systems are time-demanding, intermittent, subject to human error, and unable to identify acute peaks in gas concentration or log real-time fluctuations [
7]. Furthermore, most poultry farms are located in rural or remote areas and lack access to sophisticated environmental monitoring technologies, further exacerbating the issue of prompt detection and alleviating poor air quality conditions [
8].
With the recent advances in Internet of Things (IoT) [
9] and machine learning (ML) [
10,
11] technologies, real-time monitoring of gas concentration is becoming visible at a relatively low cost, especially in economically disadvantaged poultry farms in rural areas [
12]. This paper presents the implementation of an IoT-based real-time air quality monitoring system, particularly tailored for poultry farm settings. The developed system utilizes a Raspberry Pi Single-Board Computer (SBC) integrated with several low-cost calibrated gas sensors strategically placed to measure the concentration of toxic gases at preset intervals in perpetuity. The collected data is processed locally by the Raspberry Pi and transmitted securely to a cloud-based platform via the RESTful Application Programming Interface (API), enabling centralized storage, real-time visualization, and historical analysis [
13].
A web-based Graphical User Interface (GUI) application was developed to provide users with a dynamic and welcoming dashboard to utilize the system conveniently. System users can view real-time gas levels through animated color-coded gauges and historical trends categorized by time intervals, and can download custom CSV reports. The GUI also supports in-depth analysis through gas-specific views that allow the granular filtering and analysis of sensor readings across selected time intervals (e.g., daytime, nighttime). Also, gas levels crossing safe thresholds trigger automatic alerts. Live monitoring, cloud analytics, and machine learning-based forecasting are integrated into the developed system, offering an end-to-end solution for managing poultry air quality.
We trained an ML prediction model using historical sensory feeds to foretell gas concentration levels in the next 24 h, giving poultry farm operators an early warning device to anticipate and act against adverse air quality events. The predictive model aids in informed decision-making by enabling farm managers to undertake preventive measures against factors such as settings on ventilation systems or modifications to farm management strategies before their occurrence. The ML model archived acceptable prediction results, enabling the operators to ventilate and avoid gas buildup preemptively.
The rest of the paper is organized as follows:
Section 2 presents related work.
Section 3 presents the design and prototype implementation of the system.
Section 4 experimentally evaluates the system in terms of performance and accuracy. Finally,
Section 5 summarizes the results of this work.
2. Background and Related Work
The intensive poultry production in enclosed housing systems contributes significantly to the emission of various gases, including
,
, and
. These gases not only affect the health and welfare of the birds and farm workers but also pose broader environmental concerns related to air quality and greenhouse gas emissions [
3,
14,
15]. Among these,
is mainly generated through bird respiration that has a safe limit of less than 1000 ppm,
results from the microbial degradation of uric acid in manure with a safe limit emission of 25 ppm, and
originates from the anaerobic fermentation of organic matter in litter and feces with a safe limit of 50 ppm [
16,
17]. Previous studies have documented that gas emissions in poultry houses are not constant throughout the day but follow distinct diurnal patterns influenced by factors such as ventilation rates, temperature fluctuations, bird activity, and manure conditions [
4,
18]. Recent investigations have emphasized the temporal variability of gas concentrations within layer facilities.
Kilic and Yaslioglu [
19] observed that both
and
concentrations were significantly higher during the daytime compared to nighttime, correlating with bird metabolic activity and reduced ventilation efficiency during peak heat periods. Similarly, Liu et al. [
20] reported that ammonia emissions varied across production systems and time of day, with cage systems generally exhibiting higher levels due to manure accumulation and ventilation patterns. These findings highlight the importance of monitoring gas concentrations over time rather than relying on single-point measurements, as diurnal fluctuations can substantially influence both short- and long-term air quality assessments. However, traditional manual sampling methods often lack the sensitivity and frequency needed to capture such fine-scale temporal changes.
Several works utilized Raspberry Pi boards integrated with DHT22 temperature and humidity sensors and MQ-series gas sensors (e.g., MQ-2, MQ-135) for basic gas monitoring. A few of these systems were interfaced with cloud platforms like the AWS IoT Core or Blynk and had limited remote monitoring functionality [
7]. While there were enhancements, most systems did not have predictive forecasting models, and most interfaces were technical or rudimentary and not amenable to farm workers who needed actionable, easy-to-use dashboards.
ML models such as Support Vector Regression (SVR) [
21] and Long Short-Term Memory (LSTM) neural networks [
22] have been extensively studied in predictive analytics to forecast urban air pollution levels and environmental parameters [
8]. Their application in poultry farm environments—with their specific gas emission profiles, microclimate conditions, and operational constraints—is, nevertheless, limited in the literature [
4,
20,
23]. Most present-day research targets large industrial poultry compounds. It overlooks the need to serve small- and medium-sized poultry farms that comprise most of the world’s poultry business [
1].
To address these research gaps, this paper employs advanced IoT-based gas sensors to monitor gas concentrations in real time continuously. These IoT sensors enabled high-resolution, automated data collection at multiple time points (i.e., morning, afternoon, and evening), thereby enhancing the precision and consistency of measurements under partially controlled environmental conditions. The objective of the present study is to investigate the diurnal dynamics of gaseous emissions using Lohmann LSL Lite laying hens over a 3-week period. By integrating IoT technology into poultry research, this study aims to provide accurate insights into emission profiles and inform better ventilation and environmental management strategies in modern layer production systems.
3. Design and Implementation
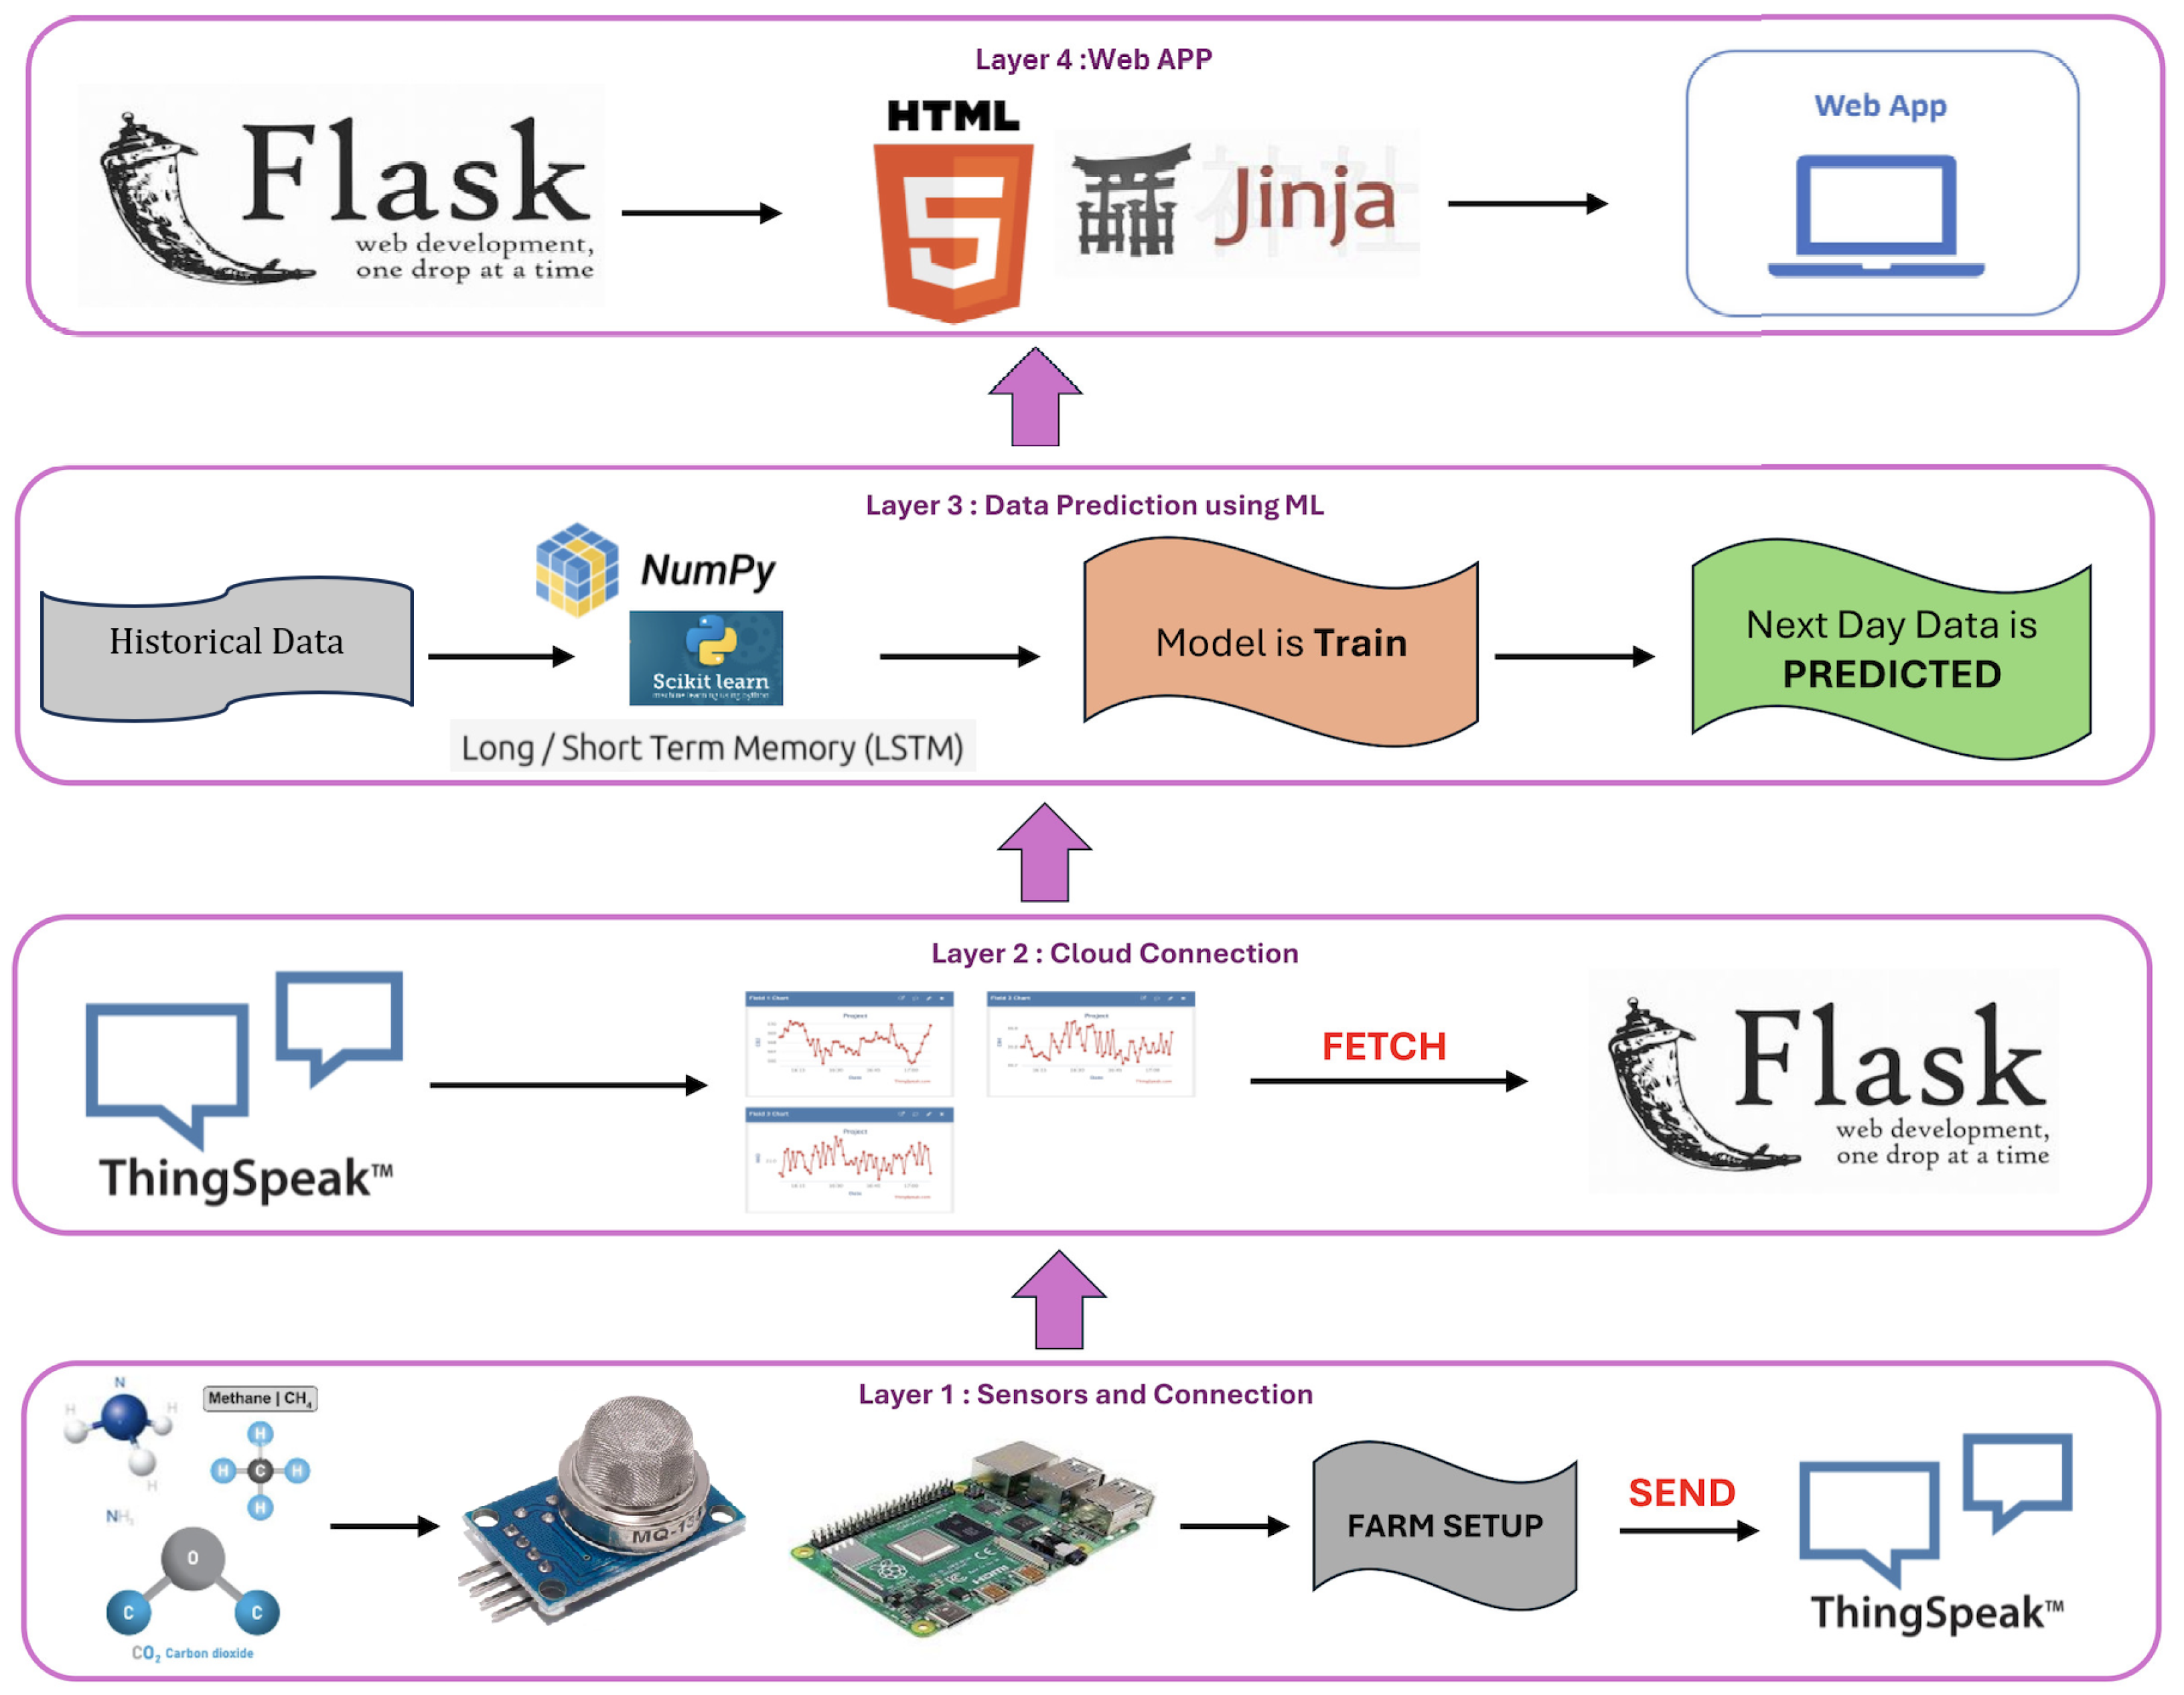
Figure 1 shows the developed distributed system comprised of IoT sensors (i.e., MQ-135 sensors) connected to edge computing devices (i.e., Raspberry Pi 4 micro-controller) and centralized servers in the cloud. The figure shows that the four-layer architecture provides an end-to-end, modular, and scalable system that seamlessly integrates real-time data acquisition, cloud connectivity, threshold-based alert generation, predictive analytics, and ease of visualization, thereby facilitating proactive farm management.
In Layer 1, the Raspberry Pi uses real-time gaseous emissions (i.e., , , and ) from the MQ-135 sensors deployed in the poultry farm and communicates them to a cloud-based platform (i.e., ThingSpeak), which is an open-source IoT analytics platform, via RESTful APIs powered by JSON formatting, enabling centralized storage, real-time visualization, and historical analysis. As shown in Layer 2, ThingSpeak streams log gas concentration feeds, displays dynamic graphs, and provides dashboards for system users. We used the Flask Python framework, version 3.1.1, to retrieve the logged gas readings from ThingSpeak and train our ML models.
Layer 3 (i.e., ML layer) pre-processes the collected data from ThingSpeak using NumPy and Scikit-learn Python libraries. A Long Short-Term Memory (LSTM) model is trained using historical gas concentration values to predict near-future trends, focusing on gas level predictions for the next day. This forecasting capability enables the early detection of possible environmental threats and allows for preventive measures within the poultry farm.
We built a GUI for real-time interaction and monitoring (see Layer 4). The web-based application is developed using the Flask framework, HTML, JS, and Jinja engine. The GUI displays real-time sensor readings, graphs of historical data, and ML-based predicted next-day gaseous emissions in a structured visual display. It gives farm operators a user-friendly, easy-to-use interface that places all relevant information on one platform.
3.1. Experimental Design and Setup
The experiment was conducted over a continuous three-week period in May 2025, a time selected to ensure stable ambient environmental conditions in Prairie View, Texas, which minimized external fluctuations that could influence gas emissions. The study was conducted at the Poultry Center, Cooperative Agricultural Research Center (CARC), Prairie View A&M University (PVAMU), Prairie View, Texas, USA, in a dedicated research facility equipped to simulate commercial layer housing in a controlled and replicable manner. At the start of the experiment, 120 Lohmann LSL Lite laying hens, 30 weeks of age, were randomly assigned to 12 identical wooden layer pens (10 birds/pen).
All birds were housed under uniform environmental conditions, and standard management practices were followed throughout the study. The hens were housed under semi-open wooden pens with natural ventilation, allowing for consistent airflow and exposure to ambient light. The temperature during the experimental period was maintained between 21–24 °C, and relative humidity ranged from 55–65%. A 16-h light:8-h dark photoperiod was maintained. Each pen was equipped with fresh wood shaving bedding, which was regularly cleaned to reduce ammonia buildup. Birds had ad libitum access to water and feed, and all pens followed identical routines for feeding, cleaning, and monitoring to ensure consistency across replicates.
All pens were maintained under similar environmental and management conditions, including standardized feed and water routines, daily cleaning of wood shaving bedding, and regular health checks. While small fluctuations in ambient temperature and humidity naturally occurred, their range was minimal and consistent across all pens. These minor deviations were considered normal and did not affect the data integrity meaningfully, as the experimental design ensured replication and controlled measurements. Measurements were taken under consistent housing and management conditions across all 12 pens, located in a semi-open poultry facility with a lateral orientation and natural ventilation. Ventilation was provided via sidewall openings in an east–west airflow direction, which allowed for passive air movement across all pens. While slight environmental variations existed due to natural airflow, the housing layout and measurement schedule (fixed daily time points) were designed to minimize temporal and spatial variability, thereby ensuring the reliable comparative analysis of gas emissions.
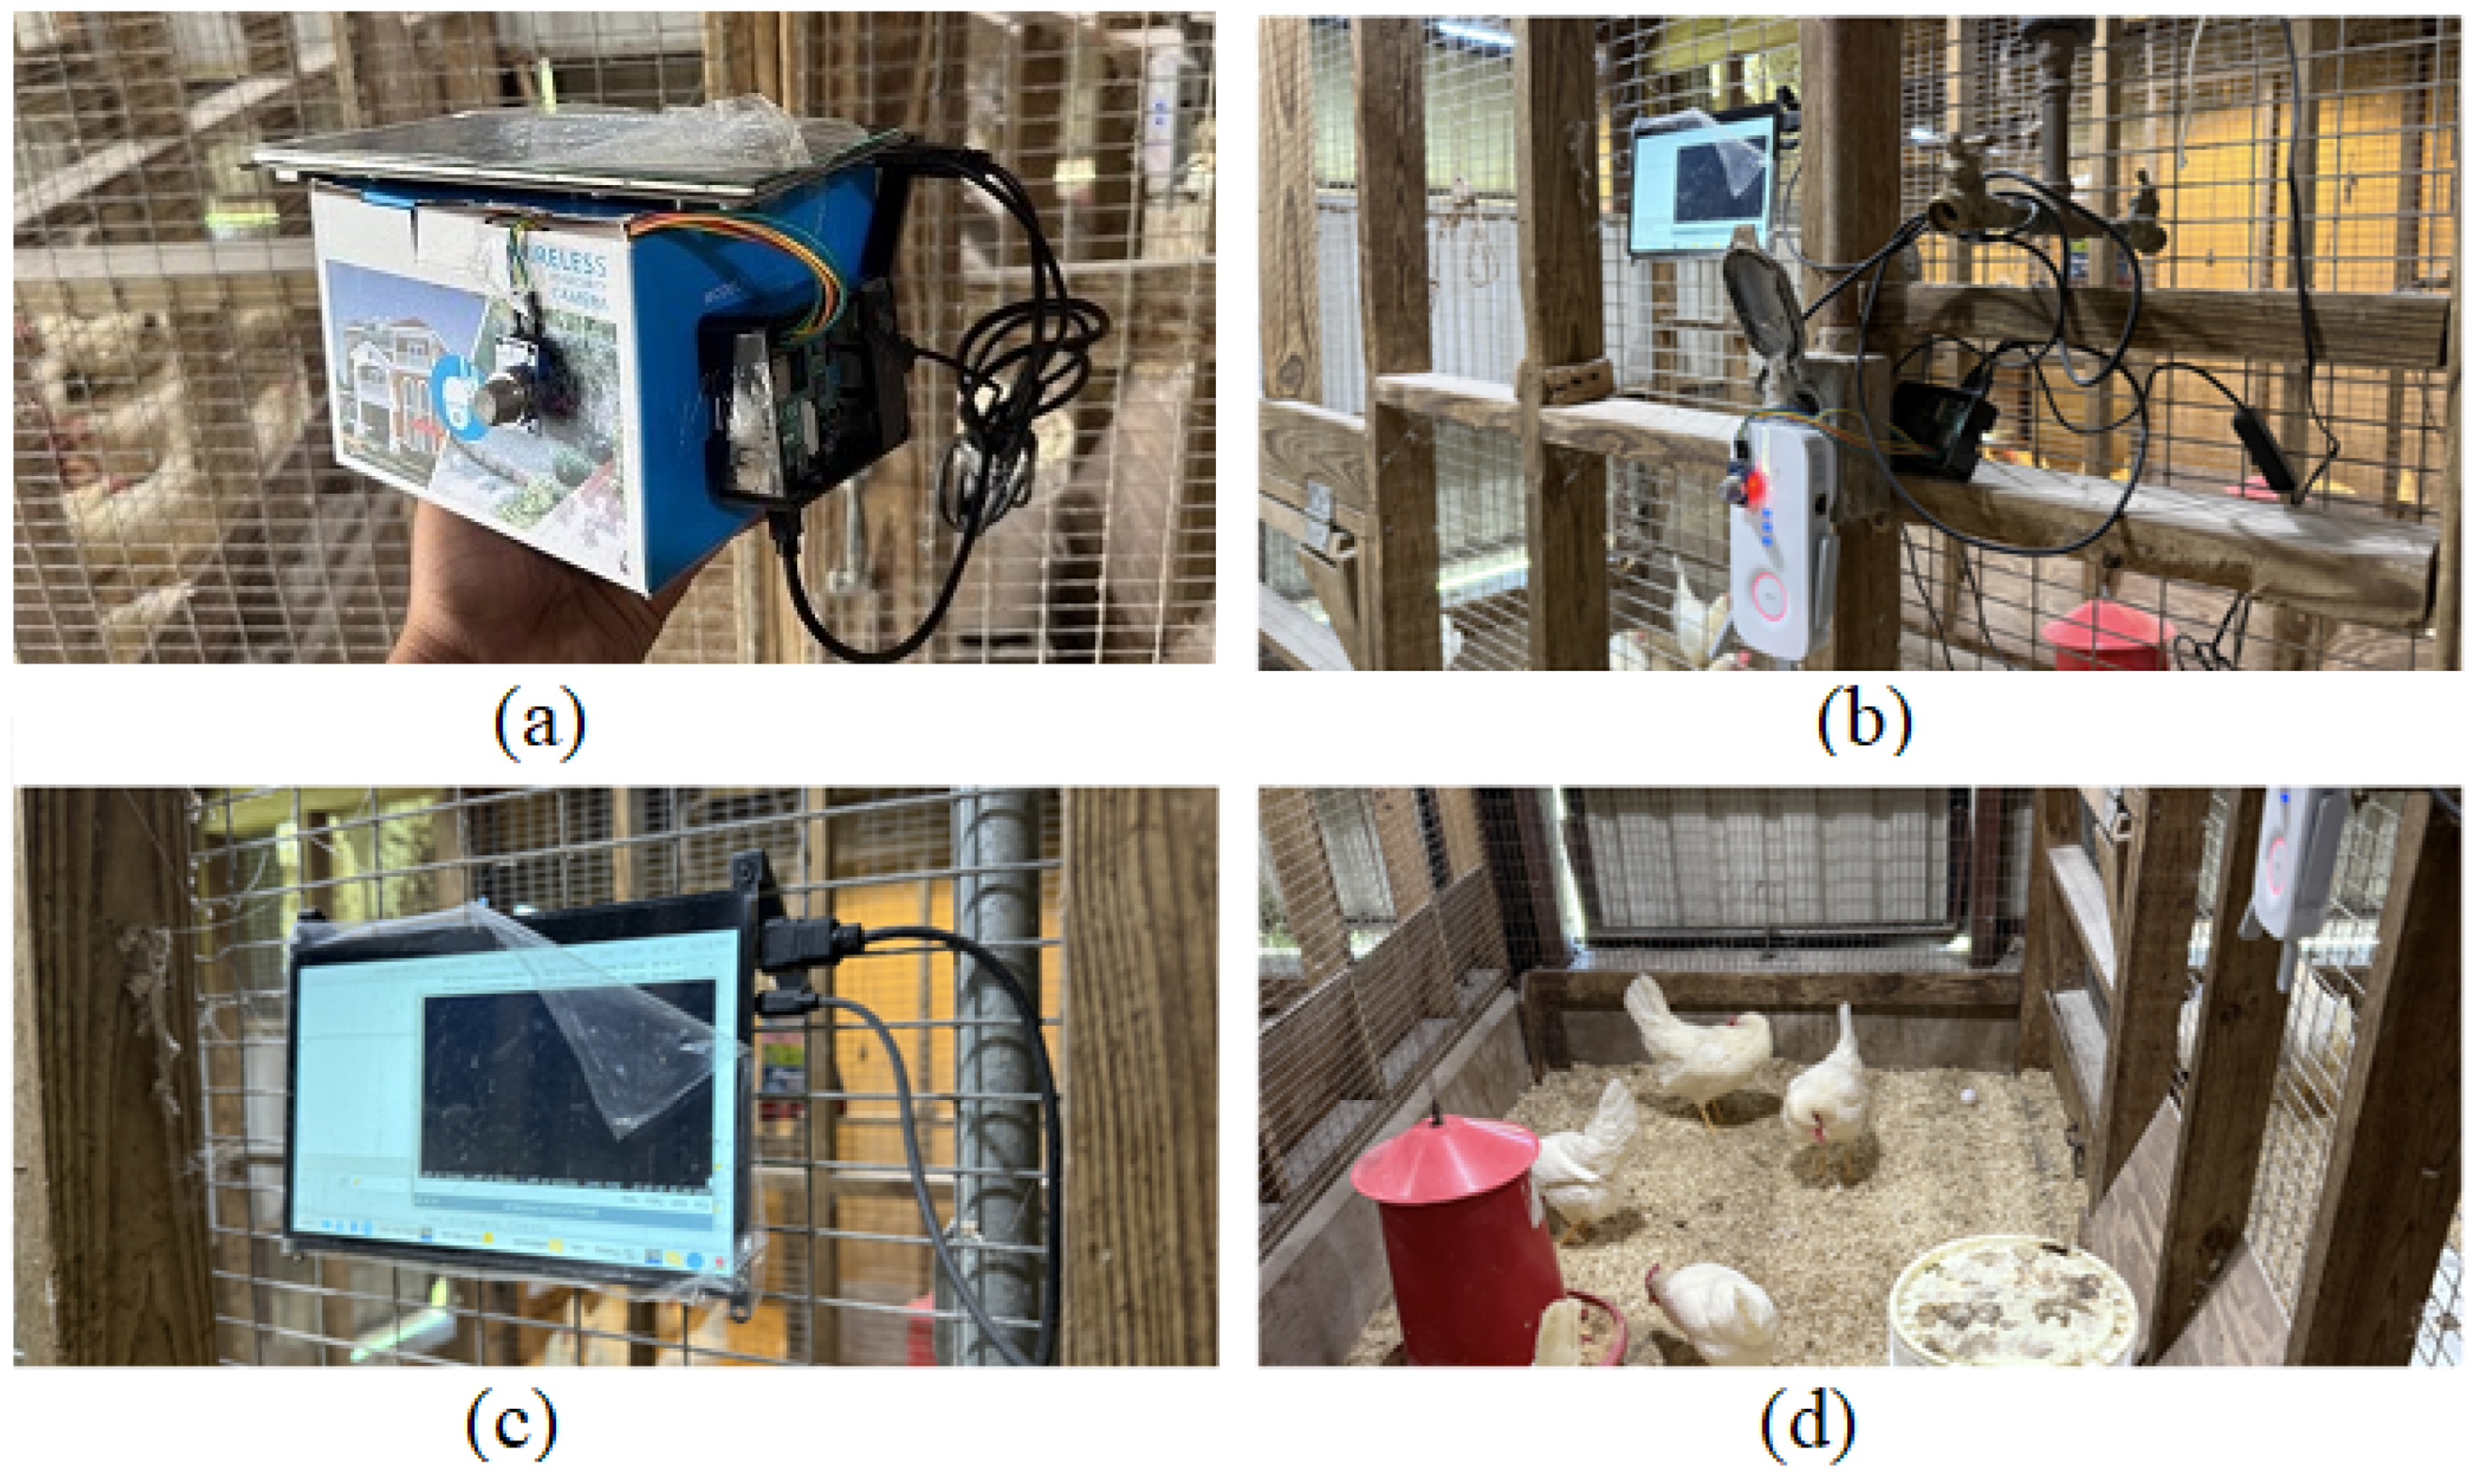
Figure 2 shows the experiment setup of the developed system at PVAMU. A single gas sensing unit, comprising an MQ-135 gas sensor, ADS1115 analog-to-digital converter, and Raspberry Pi SBC, was rotated systematically among the 12 pens at each designated time point (6:00 a.m., 2:00 p.m., and 10:00 p.m.) for 21 days, resulting in 756 total data points per gas type (12 pens × 3 time points × 21 days). The sensor was consistently placed at bird head-height (approximately 0.5 m above the floor) and positioned centrally within each pen, away from feeders and drinkers, to obtain representative air samples and minimize measurement bias. Only one sensing unit was used throughout the study, with calibration checks conducted regularly.
The experimental design followed a completely randomized design (CRD), and the focus was placed on monitoring gaseous emissions over time. The CRD was used because gas concentration was measured at the pen level, not on individual birds, and treatments (time of day) were not repeated on the same unit but were independently observed across multiple replicates. Given that the study objective was to assess temporal variation under uniform housing conditions, a CRD was deemed appropriate. However, we recognize the merit of repeated measures designs as a potential enhancement for future longitudinal studies.
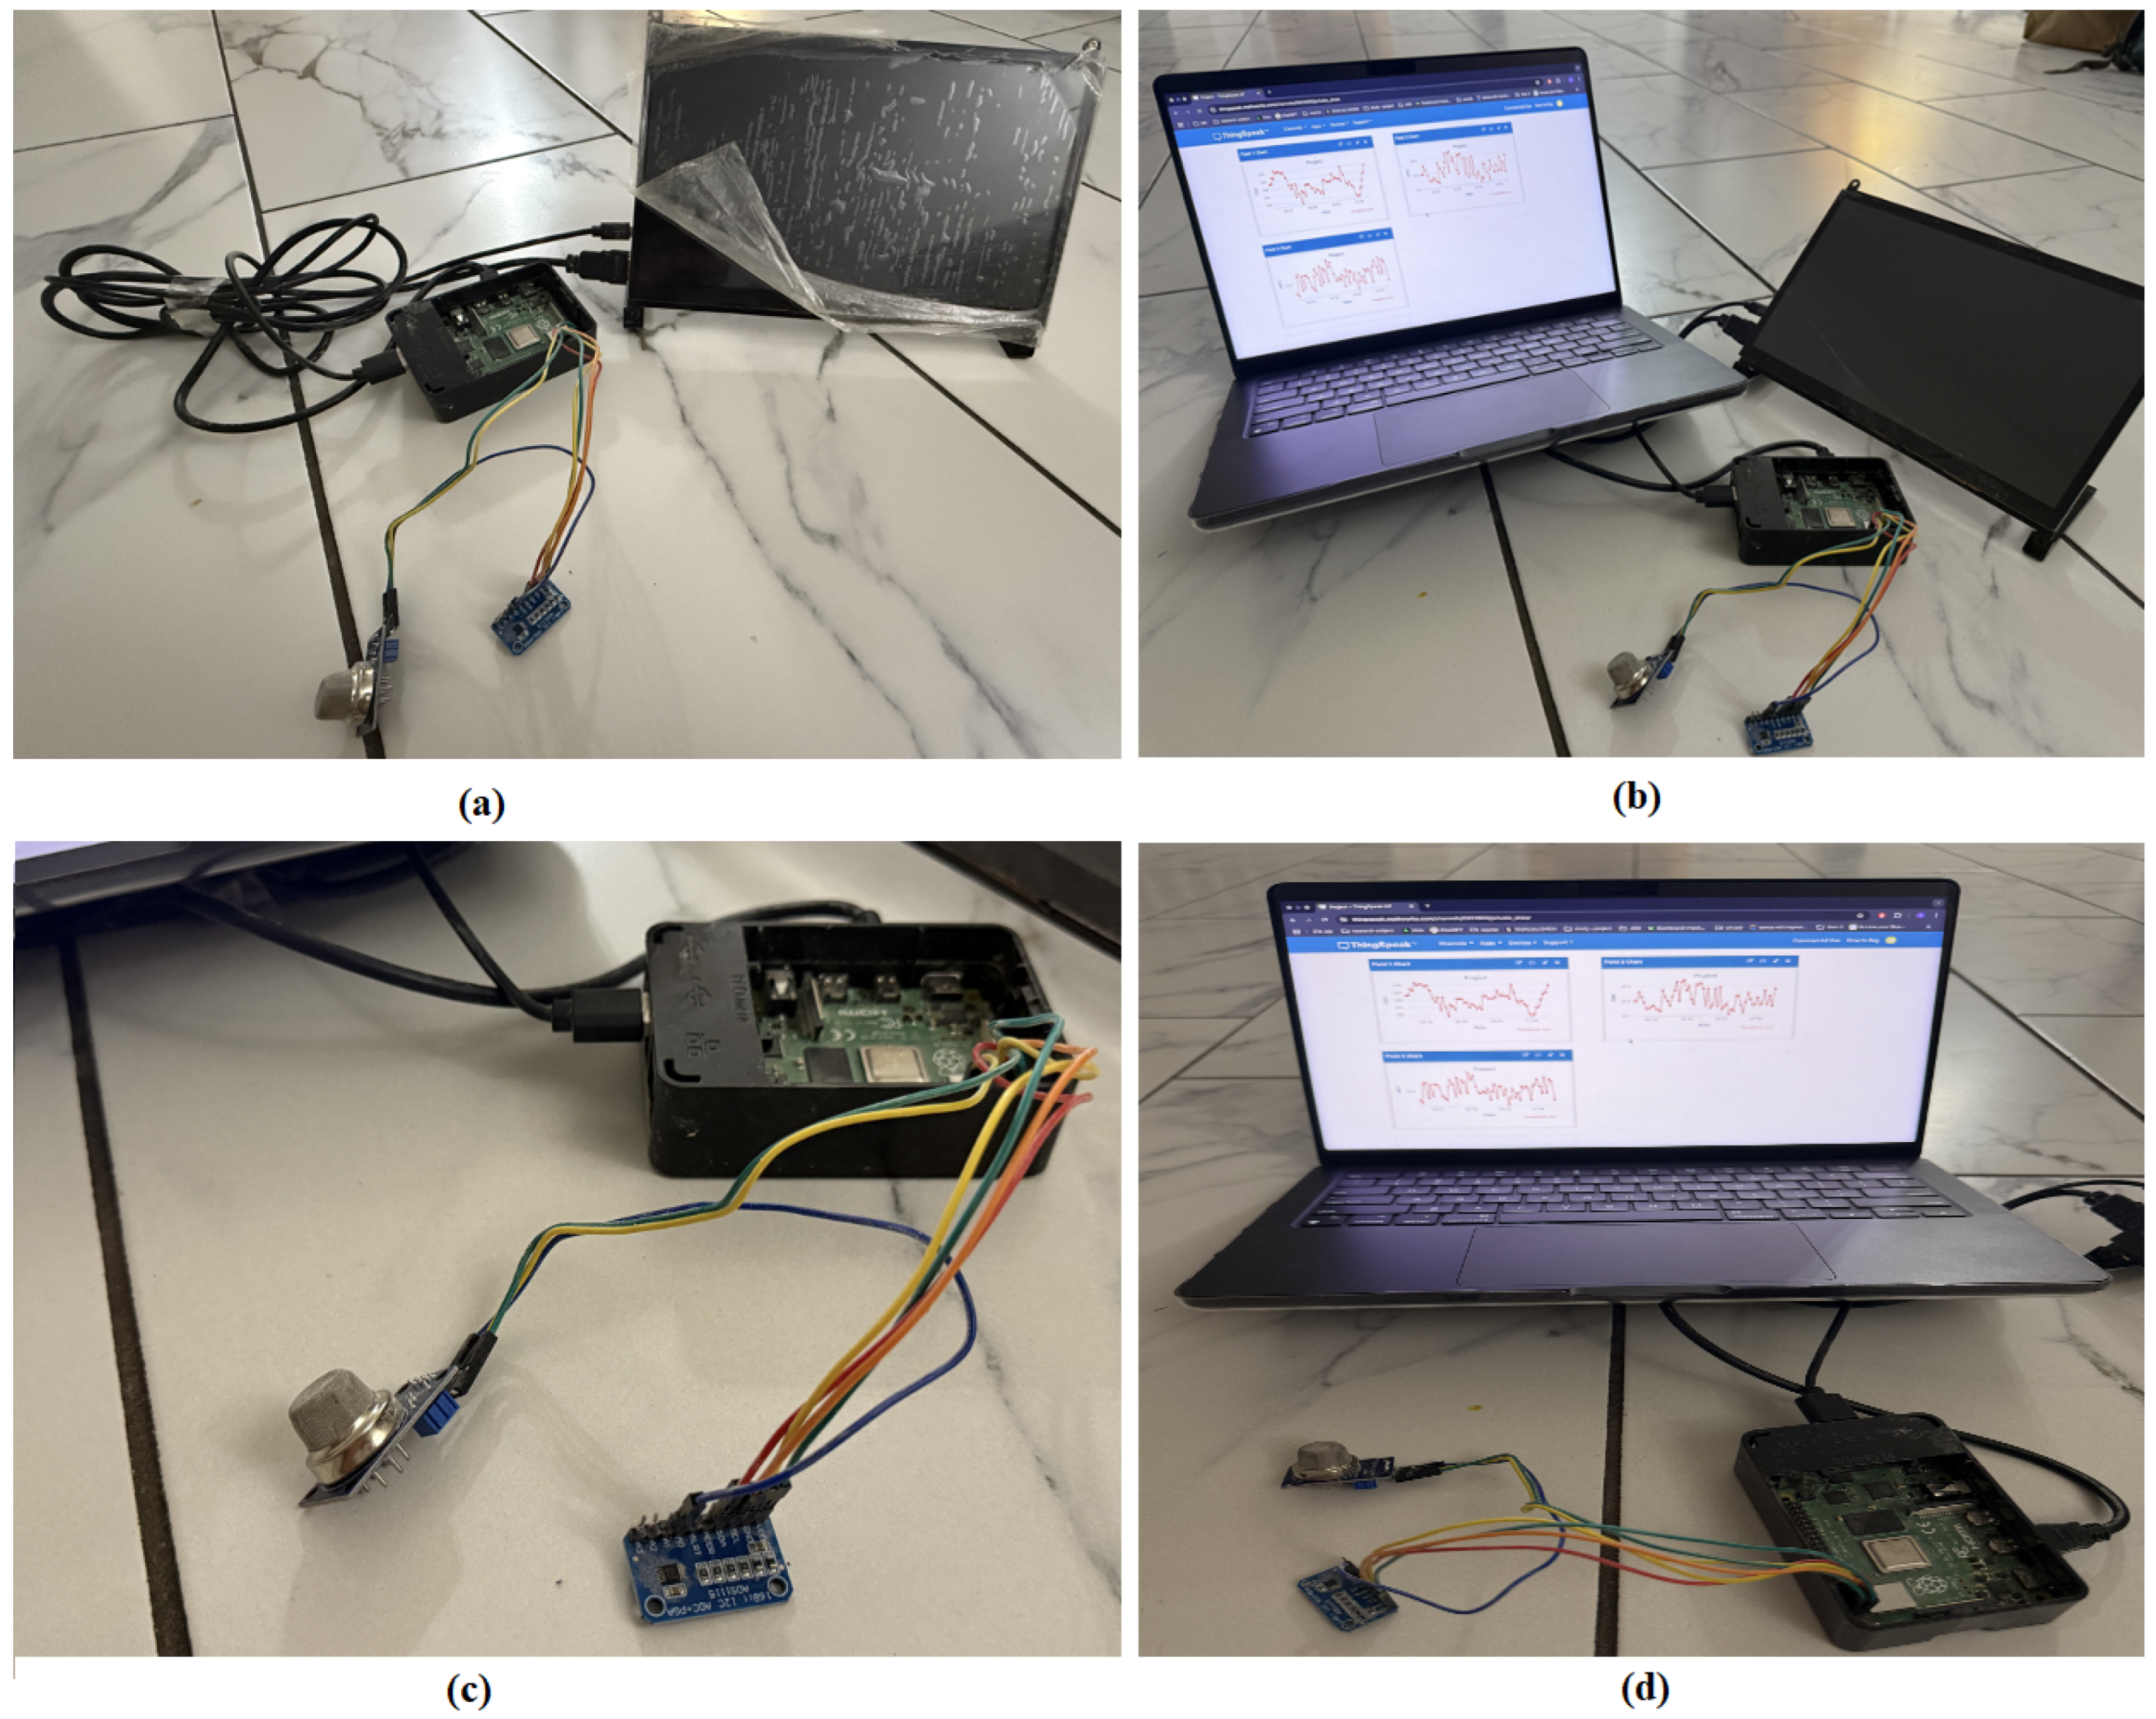
Gas measurements were recorded three times daily (i.e., morning, afternoon, and evening) across all pens to assess the temporal dynamics of gas production under consistent housing and feeding conditions. Statistical analysis was planned to compare gas emissions across these three time points per day over the course of the 3-week trial. Gaseous emissions, specifically
,
, and
, were measured and recorded using a Raspberry Pi SBC, an ADS1115 analog-to-digital converter (ADC) module, and an MQ-135 gas sensor, connected using jumper wires and a breadboard setup—see
Figure 3. The MQ-135 sensor was calibrated to detect and quantify levels of
,
, and
.
Over three consecutive weeks, gas concentrations were recorded daily (morning at 6:00 a.m., afternoon at 2:00 p.m., and evening at 10:00 p.m.), aligned with observed patterns in poultry metabolic activity and ventilation conditions. This schedule was selected to observe peak bird activity periods (i.e., morning/evening), track midday heating effects (i.e., afternoon), and ensure uniformity across all measurement days. Each log was triggered by automated time-based scripts running on the Raspberry Pi, synchronized with the ThingSpeak platform to ensure timestamped, structured, and consistent data capture. These data were used to evaluate daily and temporal fluctuations in gas emissions and to statistically compare emissions across different time points within and across days.
3.2. Data Acquisition and Storage
The sensory data collection process is initiated by configuring the MQ-135 sensors for measuring the , , and gas concentrations, which are connected to the Raspberry Pi via GPIO and communication interfaces. Each sensor is calibrated to achieve accuracy, and the Raspberry Pi is configured to poll sensor data at regular intervals (typically every 60 s). This setup the enables around-the-clock recording of real-time gas concentration levels from the poultry house.
Calibrating the MQ-135 gas sensor for measuring gas emissions in poultry farms (e.g.,
,
,
, etc.) is crucial for accurate and reliable readings. We first preheat the MQ-135 sensor for a 24–48 h burn-in time to stabilize the sensor. We then placed it in outdoor clean air. Using the following formula, we calculated the sensor resistance,
, in the poultry house environment.
where
is the supply voltage to the MQ-135 sensor circuit,
is the analog voltage output from the sensor, and
is the load resistor (typically 10 kΩ).
We then calculated the sensor resistance in clean outdoor air condition,
, using the following formula.
where
is the ratio for clean air measured to be approximately 3.6 at the Poultry Center, PVAMU.
To improve the accuracy and reliability of gas concentration measurements using the MQ-135 sensor in poultry farms, the system performs pre-processing steps, including noise filtering, outlier removal, and converting analog signals to readable parts per million (ppm) measurements. Given that the sensor output is analog and highly sensitive to environmental noise, we implemented various strategies to help reduce false or erratic readings. We used the Moving Average Filter (MAF) to smooth out the short-term fluctuations and keep computation lightweight, especially for the Raspberry Pi devices. We also utilized the Exponential Moving Average (EMA) technique to give more weight to the most recent sensor values. The median filter removes extreme outliers, collects samples, sorts them, and picks the middle value. We used the Interquartile Range (IQR) statistical dispersion measure for outlier removal, a robust mechanism for adjusting skewed data, storing a sample sensor data window, and sorting it. The
metric is calculated using this formula.
where
is the first quartile representing the 25th percentile of our sensory dataset,
is the third quartile representing the 75th percentile of our sensory dataset, and
L and
U are the lower and upper outlier bounds, receptively. In other words, any value outside this range (
L–
U) is considered an outlier.
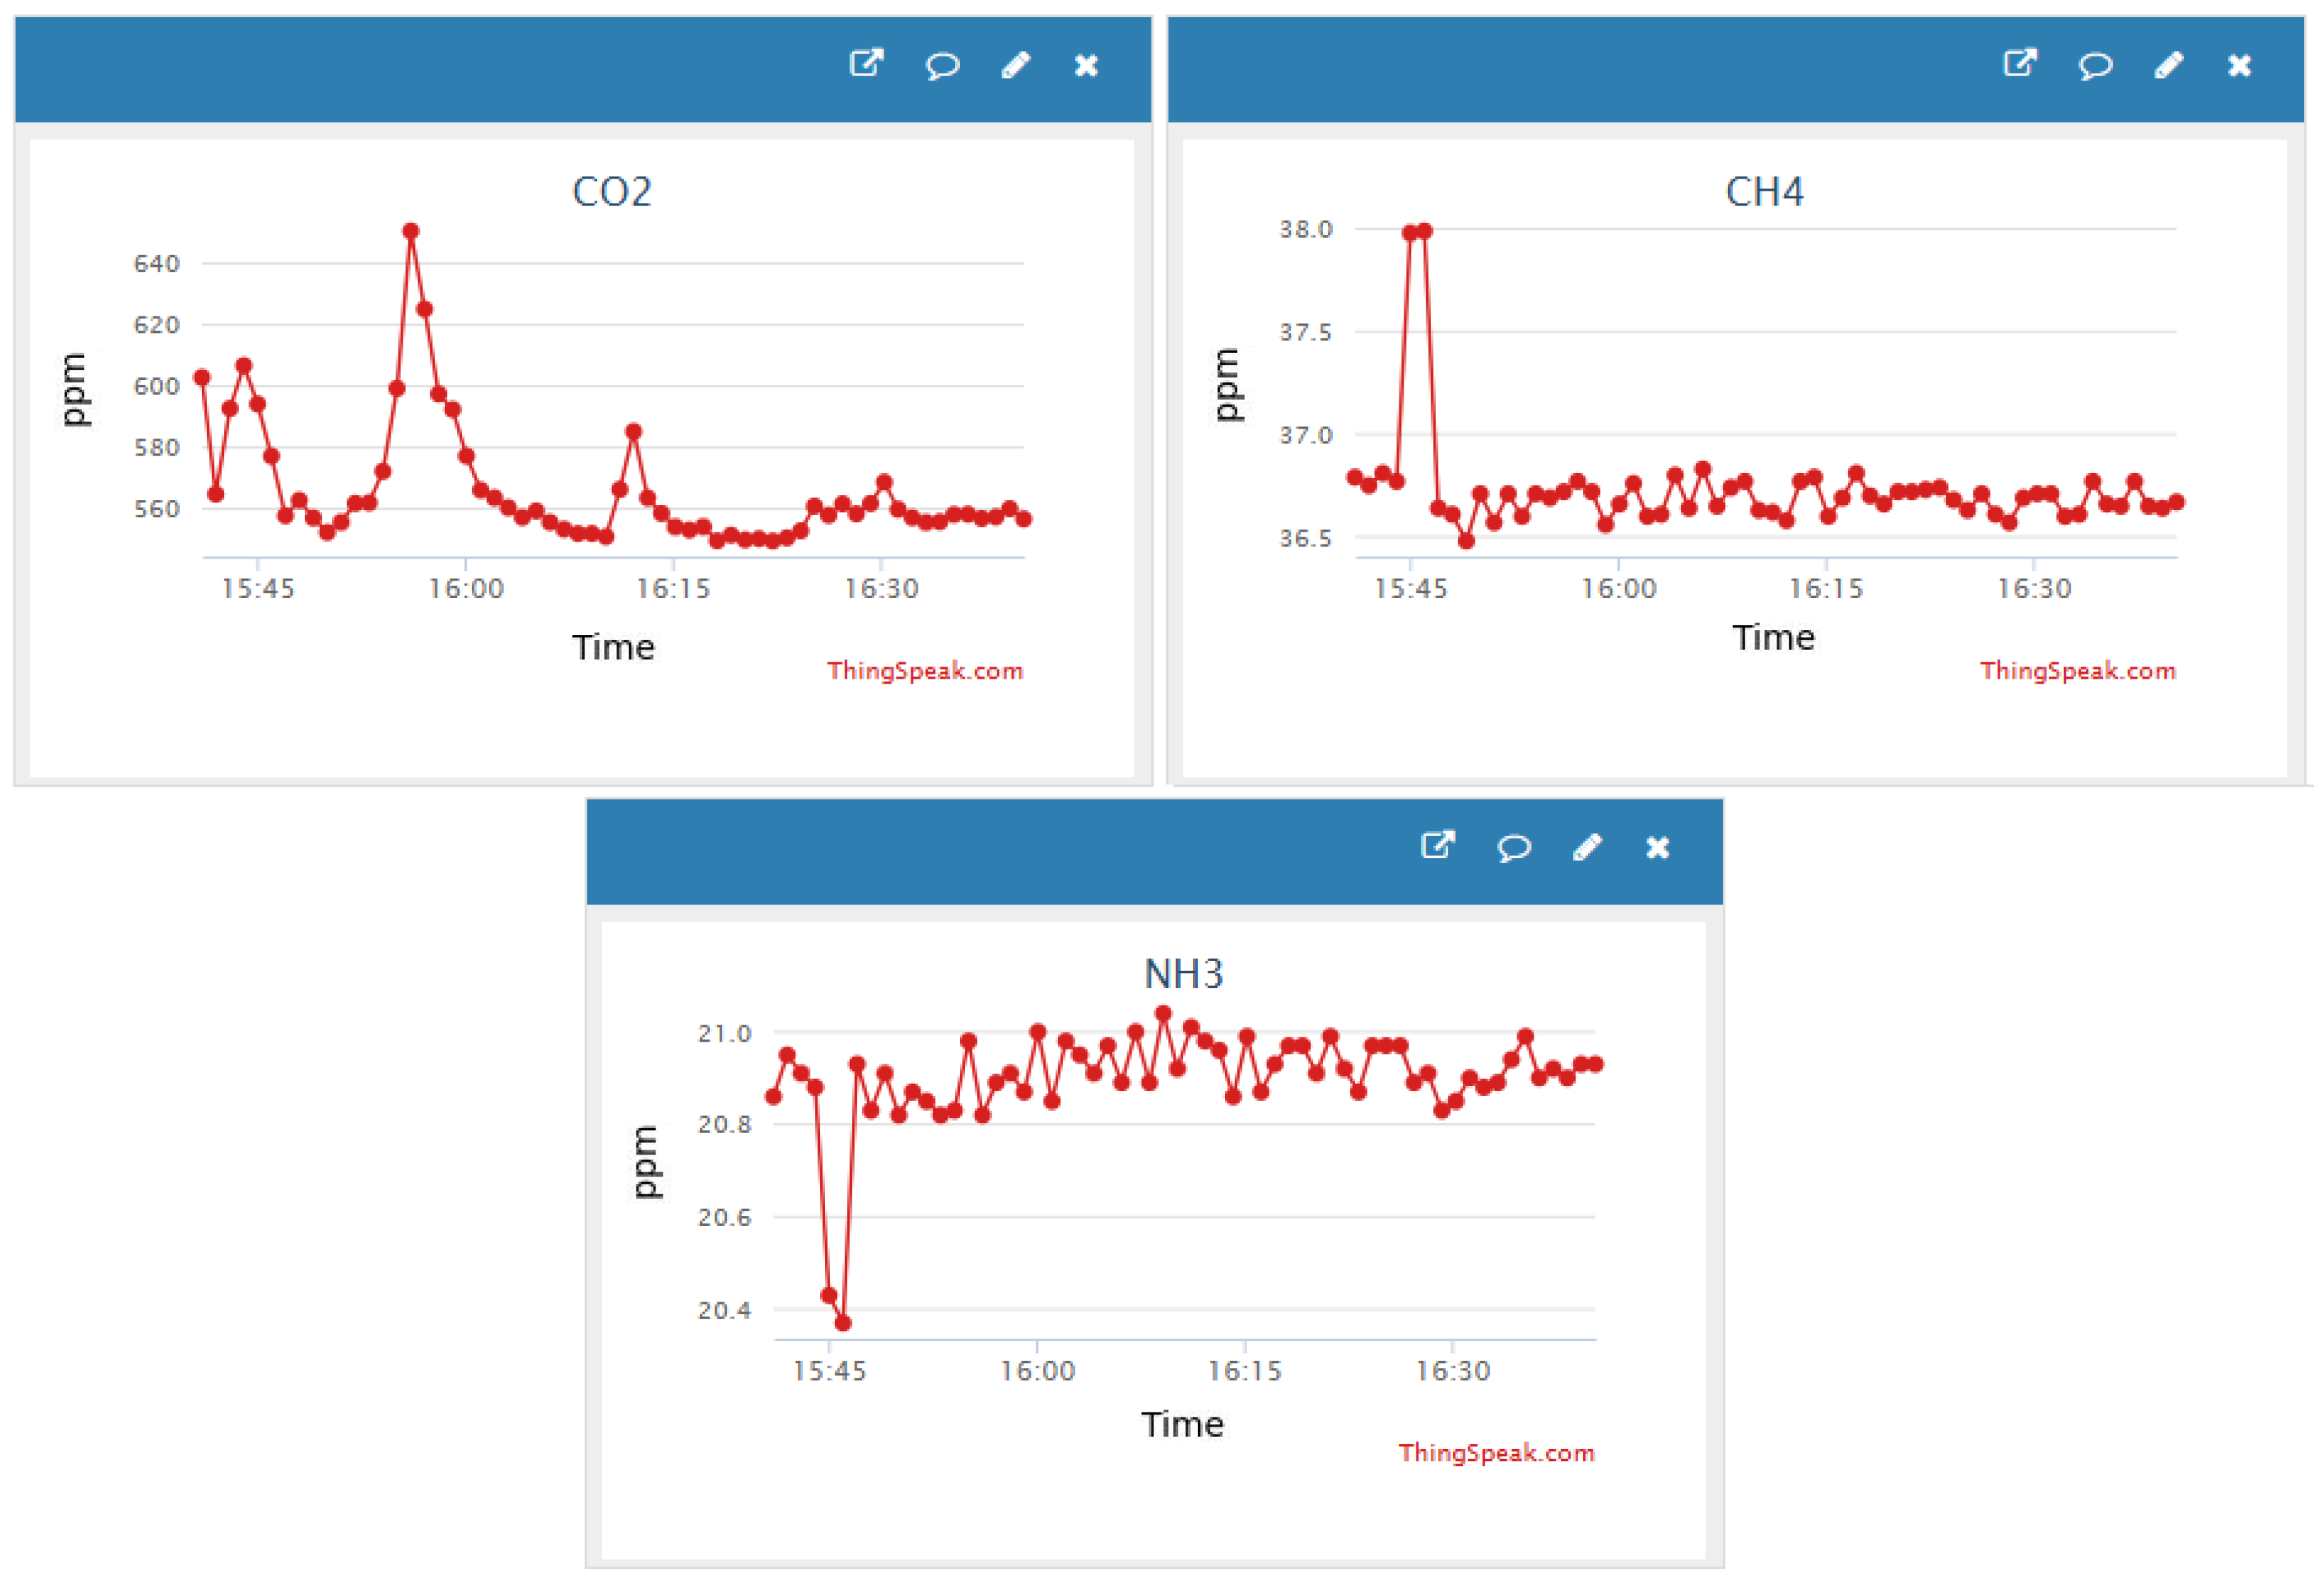
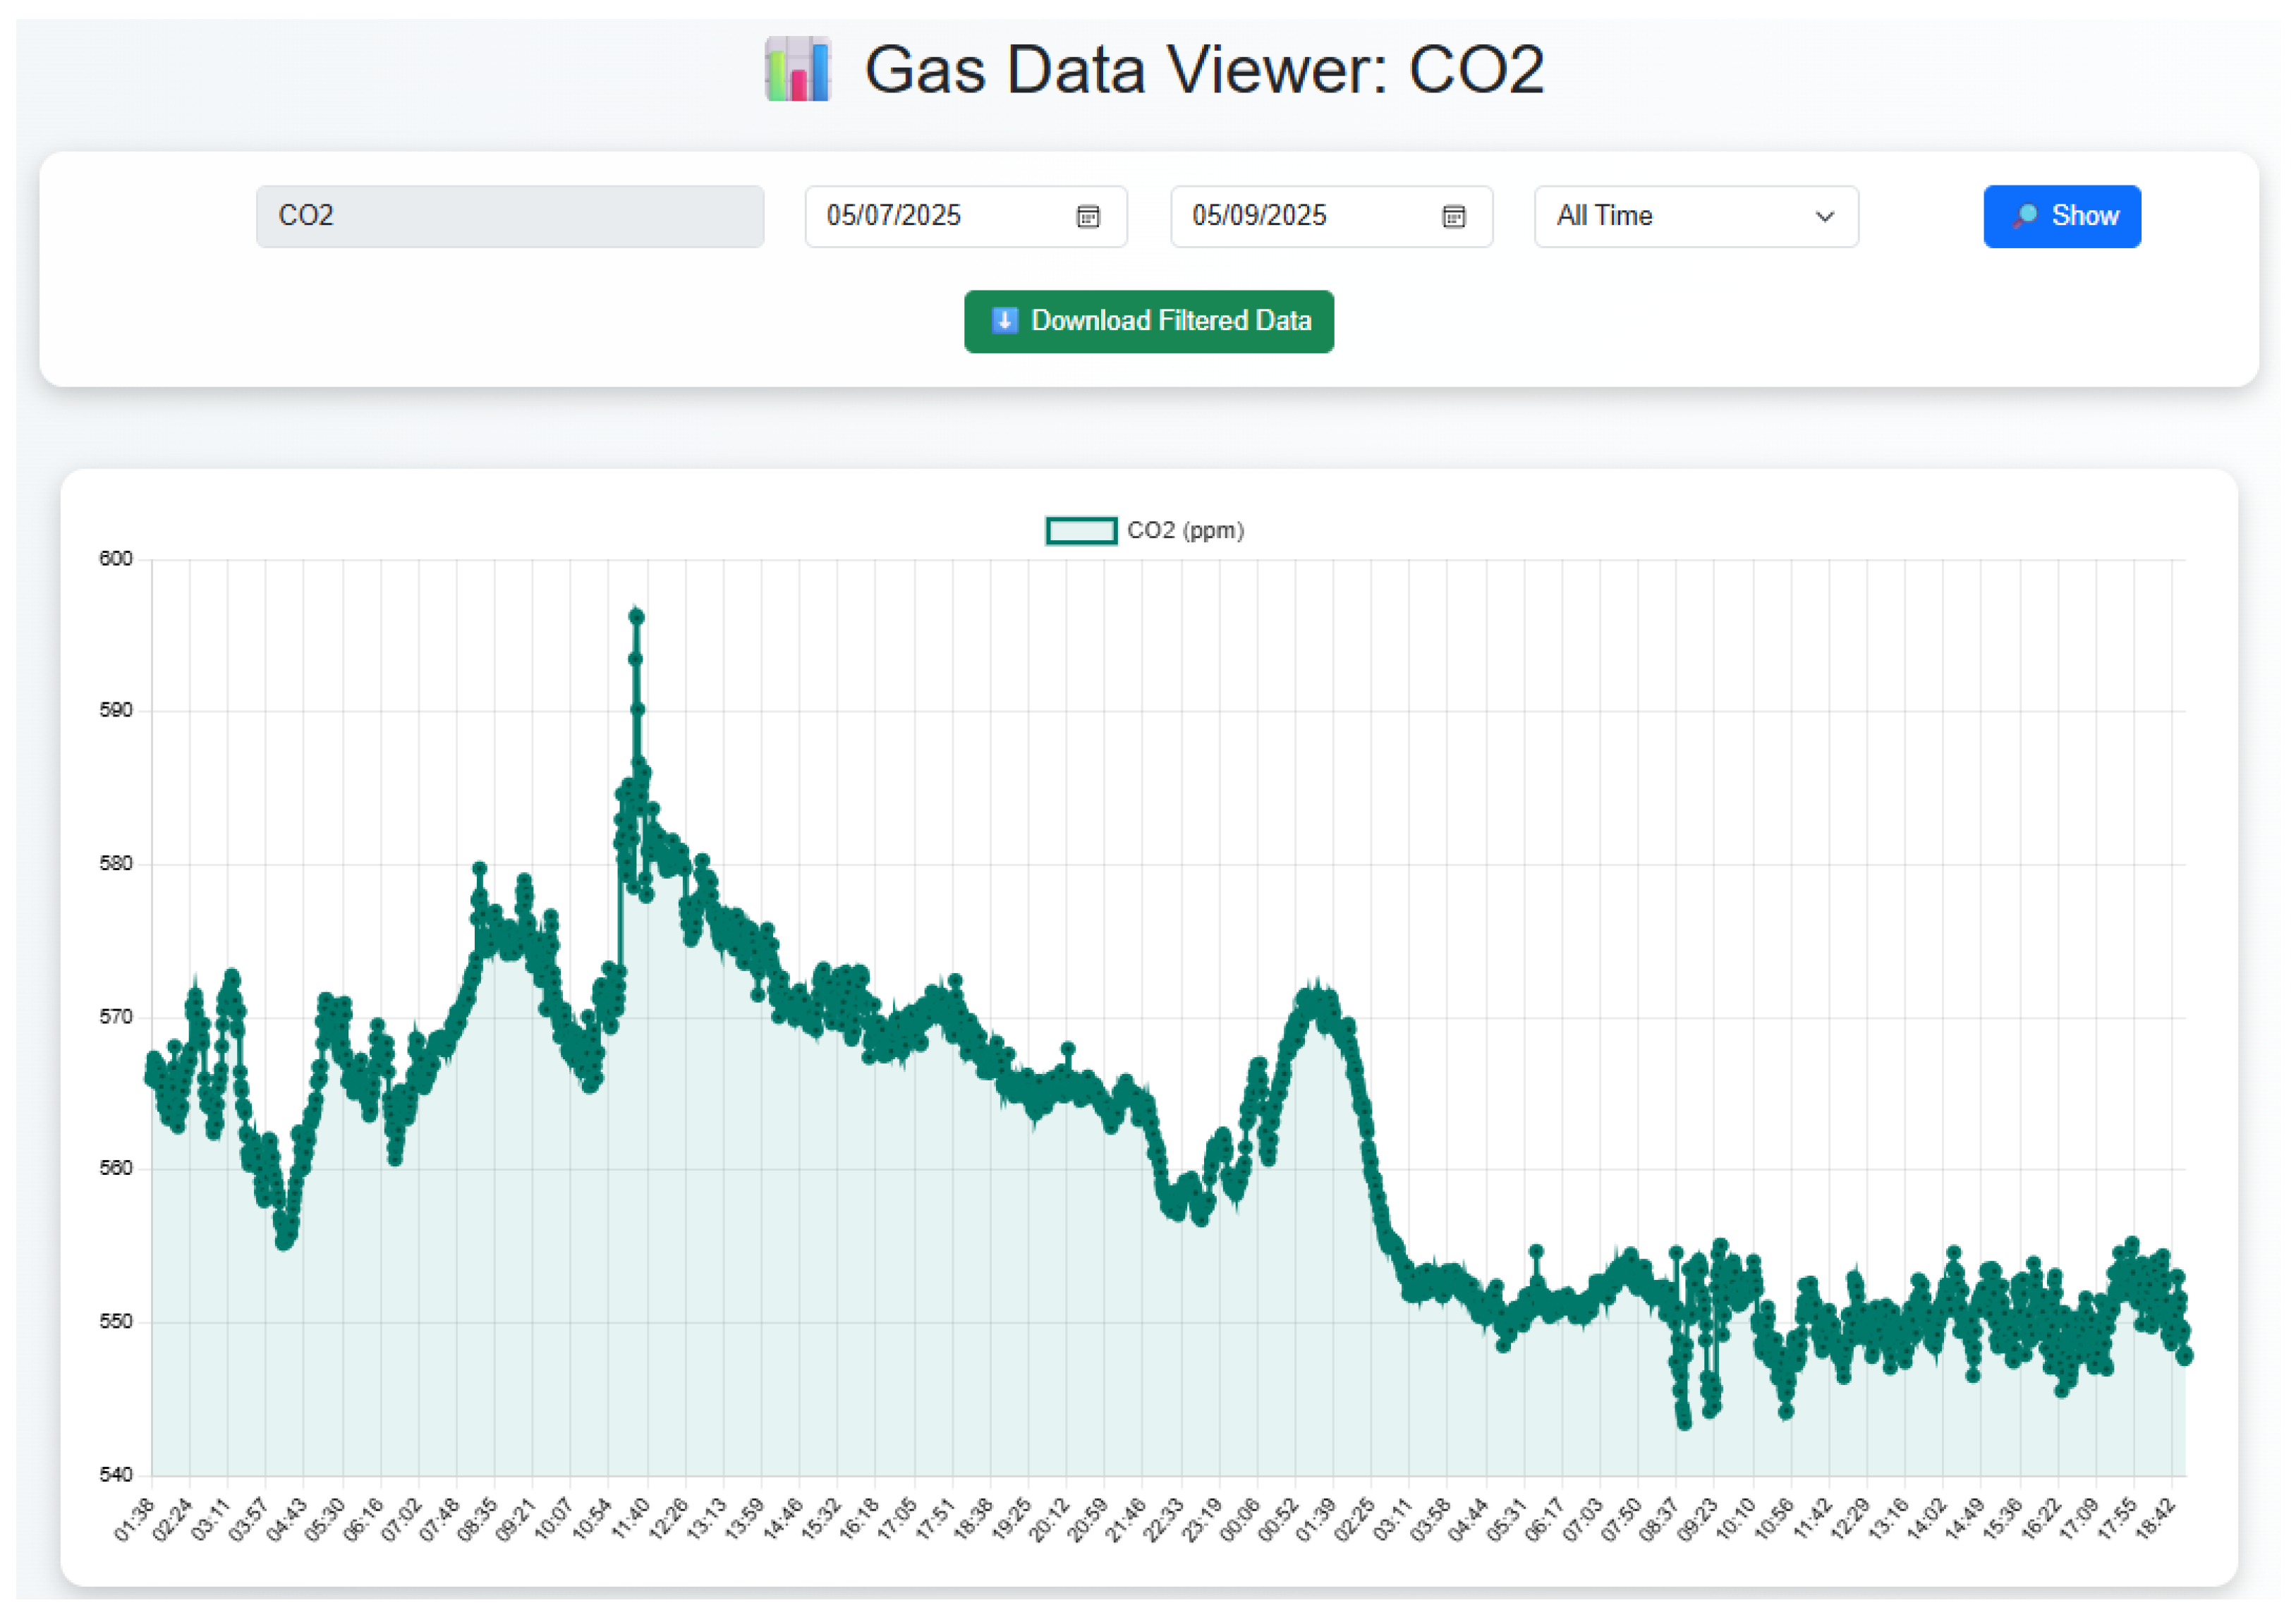
The cleaned data is time-stamped and formatted into a JSON string. The data packets are transmitted to the ThingSpeak cloud platform via RESTful API calls, where they are stored for real-time access and historical analytics, as shown in
Figure 4 and
Figure 5. This organized data stream sustains the operation of the Flask-based web dashboard, which pulls and plots the sensor data for monitoring, alerting, and predictive forecasting. This orchestrated communication mechanism guarantees that the system will be operated with high reliability, minimal latency, and constant accuracy, accomplishing the primary requirements of real-time poultry air quality monitoring. At the same time, the backend also compares each reading of the gases with pre-defined safety levels (e.g.,
> 1000 ppm) in real-time, which preserves the bird’s health and performance [
7]. If the reading is above its threshold, the system flags the alert dynamically and provides a visual notification on the dashboard to alert the user in real-time.
We used the following formula to convert the analog voltage of the MQ-135 sensor to gas concentration,
.
where
is the sensor’s analog output voltage,
is the input voltage (typically 5
V), and a and b are sensor-specific calibration constants derived experimentally.
3.3. GUI
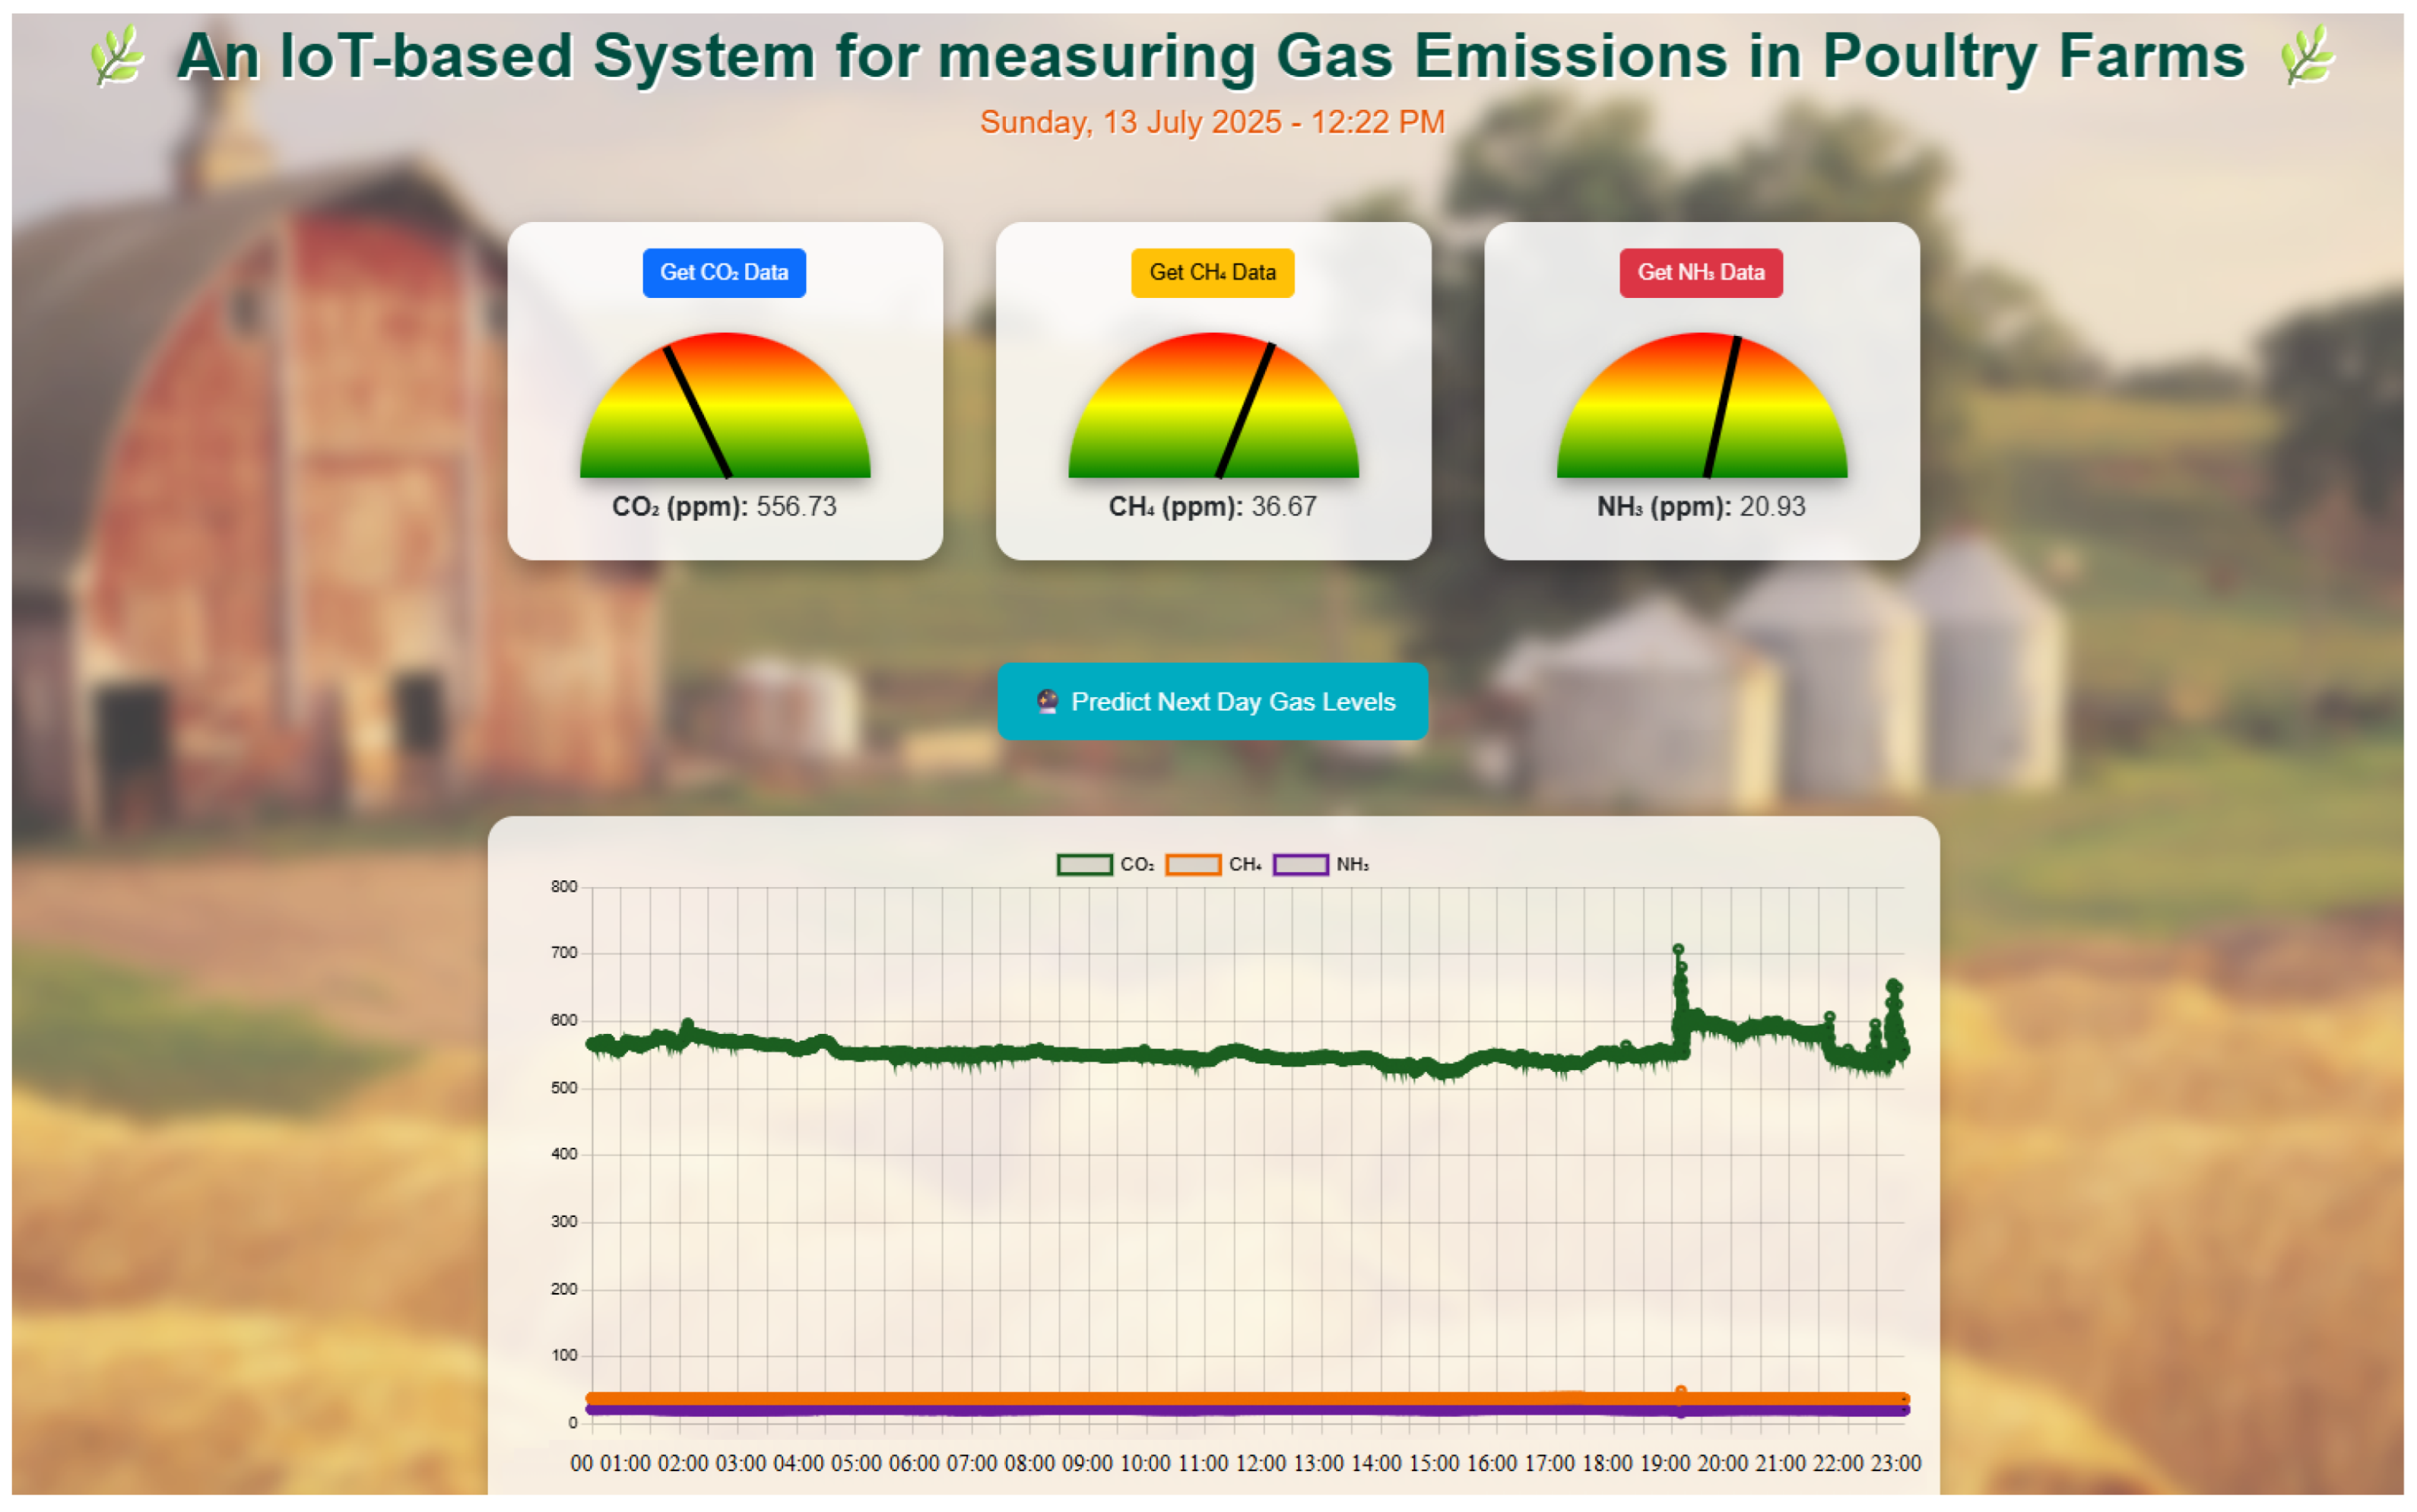
The web-based dashboard enables farm operators to interact with the system and track real-time and historical sensory data using any internet-enabled device (see
Figure 6). It was developed on top of the Flask web framework, which makes the dashboard responsive, lightweight, and completely integrated with the ThingSpeak cloud platform. Our system periodically fetches the latest gas concentration values by making GET calls on ThingSpeak’s REST API. The parsed data is passed on to the dashboard using Flask’s Jinja2 template engine, and the sensory data is dynamically rendered in real time.
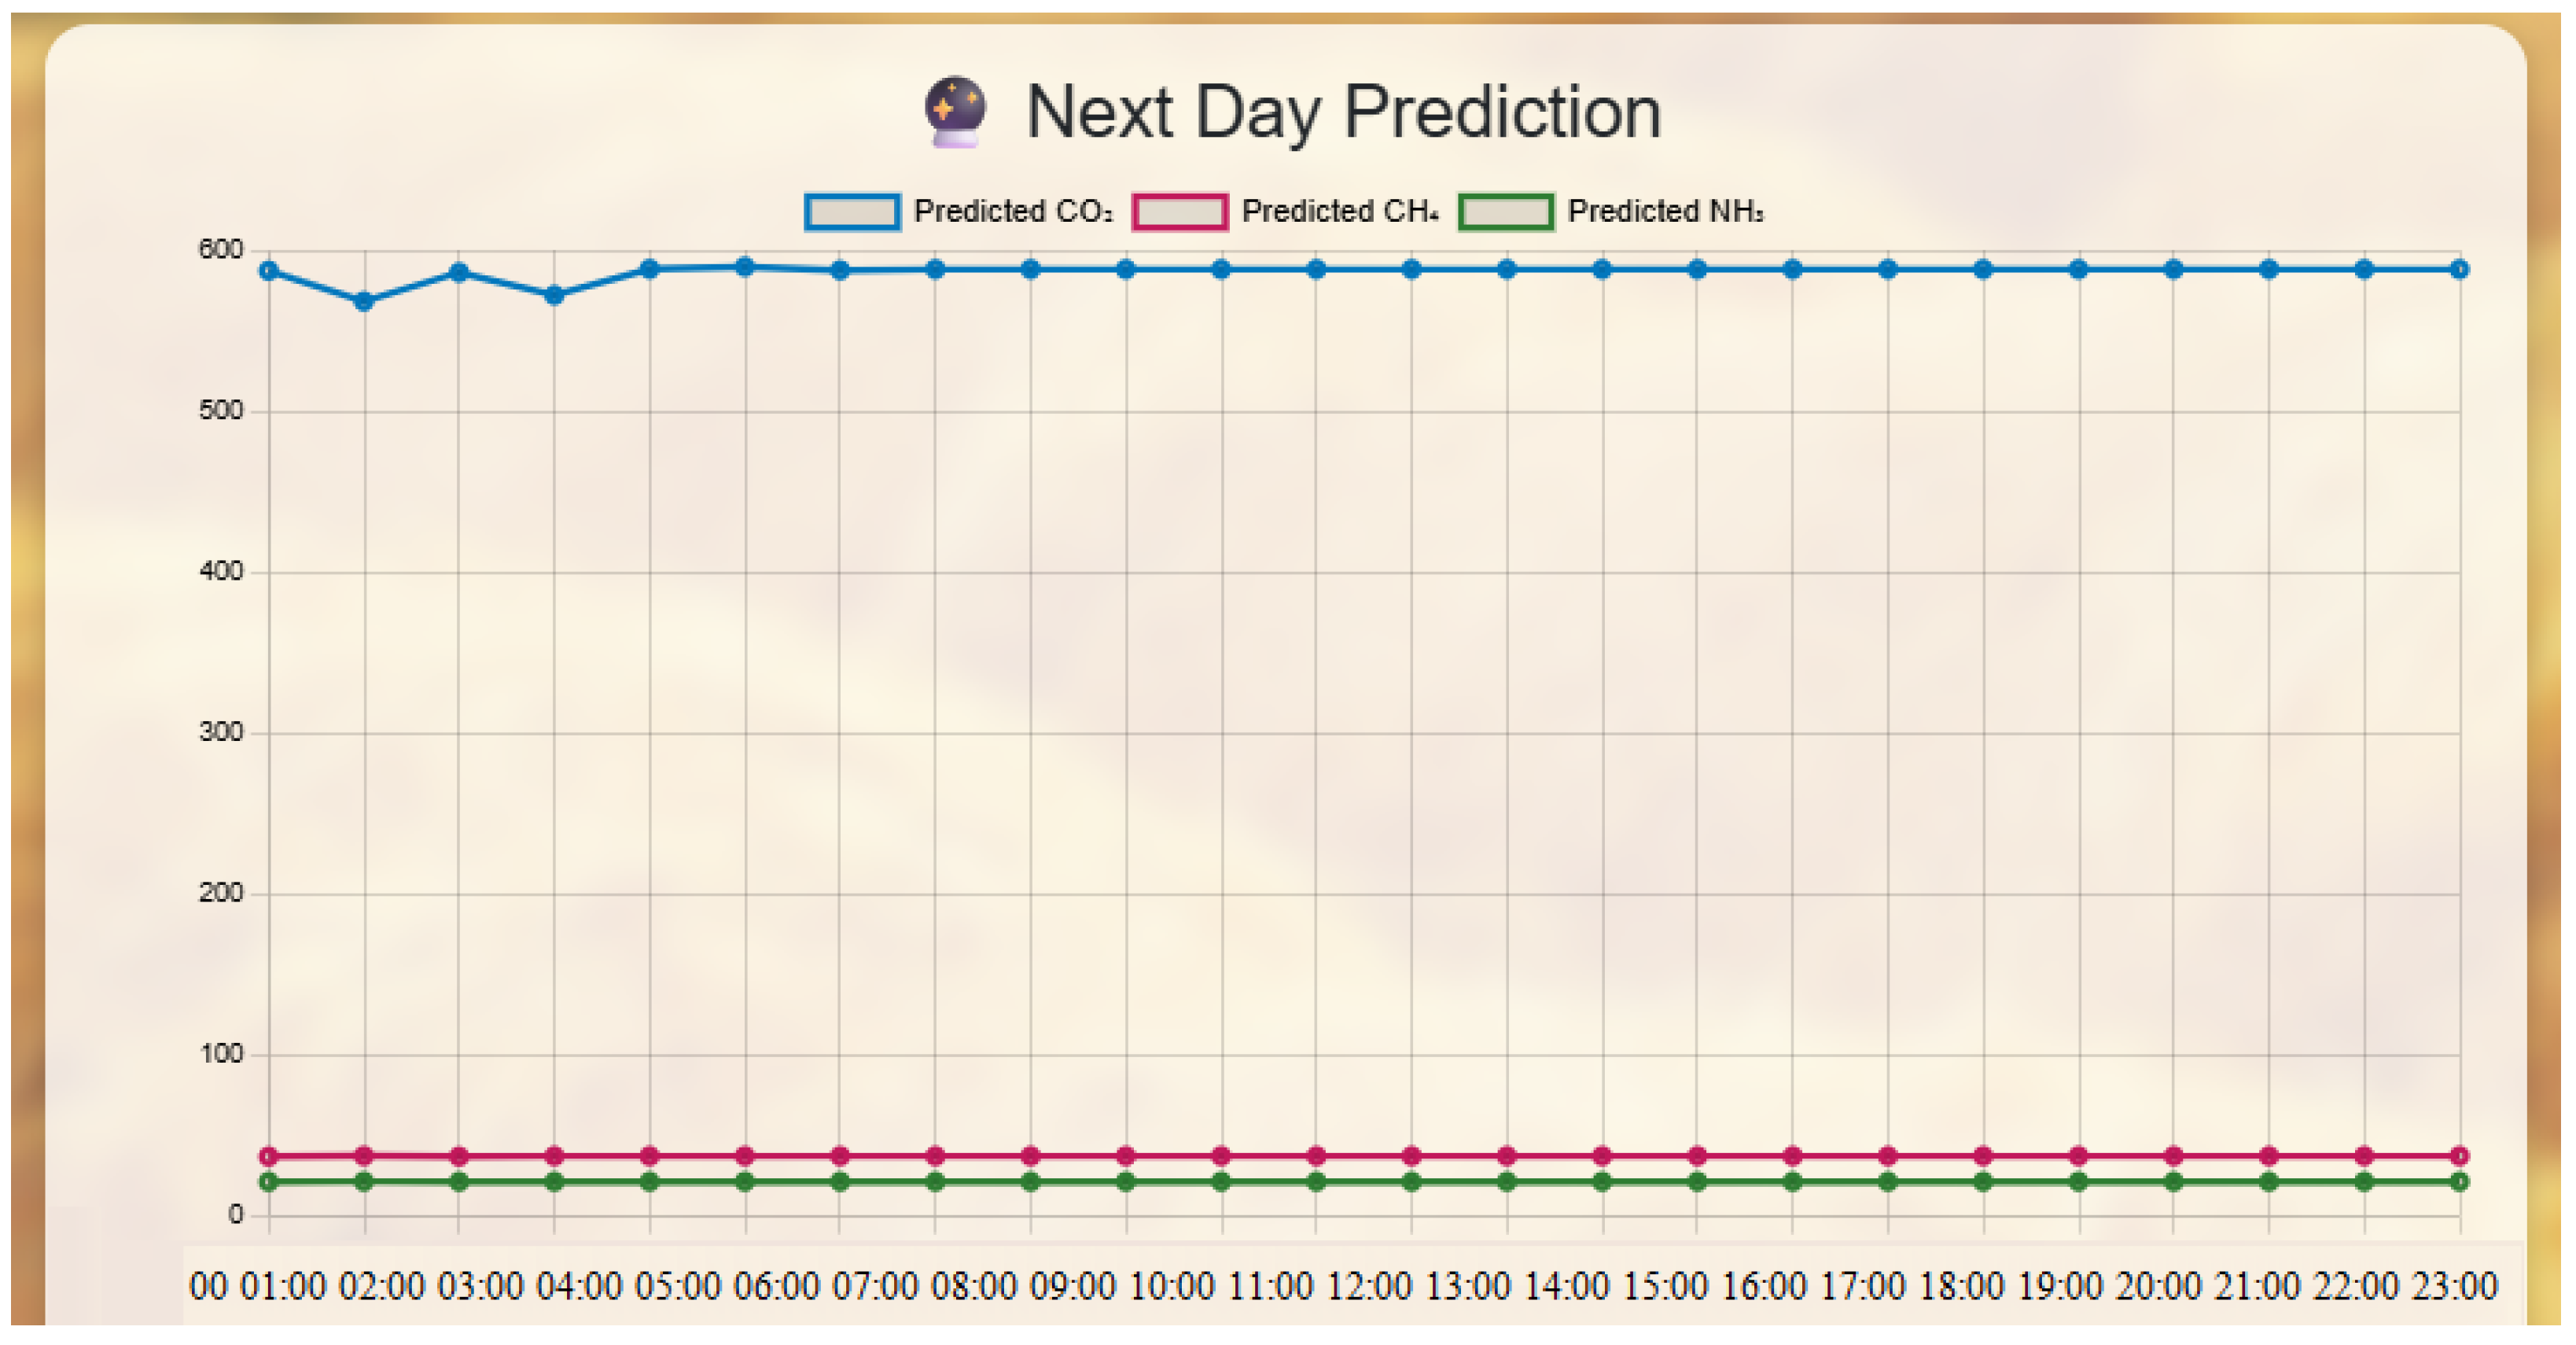
The dashboard offers several functionalities to farm operators, including live gauges that show the real-time gas concentrations through color-coded animation gauges for defining safe, caution, and danger zones, data export in CSV format, gas-specific analysis pages that allow users to do time-of-day filtering (i.e., morning, afternoon, evening), and date-range selections. The dashboard uses the LSTM model to predict the next-day gas volumes using historical patterns. Predicted values are shown in the form of bar charts on the dashboard.
3.4. ML Model
The ML-based prediction module utilizes historical gas sensory data stored and accessed in ThingSpeak to train an LSTM neural network. The model can predict gas concentration values with a high temporal resolution for the next 24 h period. This allows farm operators to be prepared for deteriorating air quality conditions in advance and act ahead, for instance, by modifying ventilation or changing waste management routines. The ML model was trained and installed in the Flask engine, which retrieves the historical data at regular intervals, processes it, and feeds it through the LSTM model.
The LSTM model was trained using historical gas concentration data recorded in May 2025 and collected from a Raspberry Pi 4 device installed in the experimental poultry facility at Prairie View A&M University. The dataset contained continuous time-stamped readings for three gases—, , and —recorded at roughly 1 min intervals. This resulted in a total of 1440 records per gas over the measurement period. The dataset was split as follows: Training (80%), 1152 records; Validation (10%), 144 records; and Testing (10%), 144 records. This approach ensured a balanced temporal distribution while preserving chronological order to prevent data leakage in time-series prediction.
The LSTM model was implemented using the Scikit-learn and Keras-TensorFlow libraries, with the following configuration: (1) input features are time-stamped , , and concentrations; (2) the target is the next-day prediction for each gas type; (3) the architecture is one LSTM layer with 64 units, followed by a dense output layer; (4) the activation function is the ReLU for hidden layers, linear for output; (6) the loss function is Mean Squared Error (MSE); (7) the Optimizer (Adam); (8) the number of training epochs is 100; and (9) the batch size is 16. This configuration was determined after basic tuning using the validation dataset. Due to the relatively small dataset size, deeper architectures were avoided to prevent overfitting.
As shown in
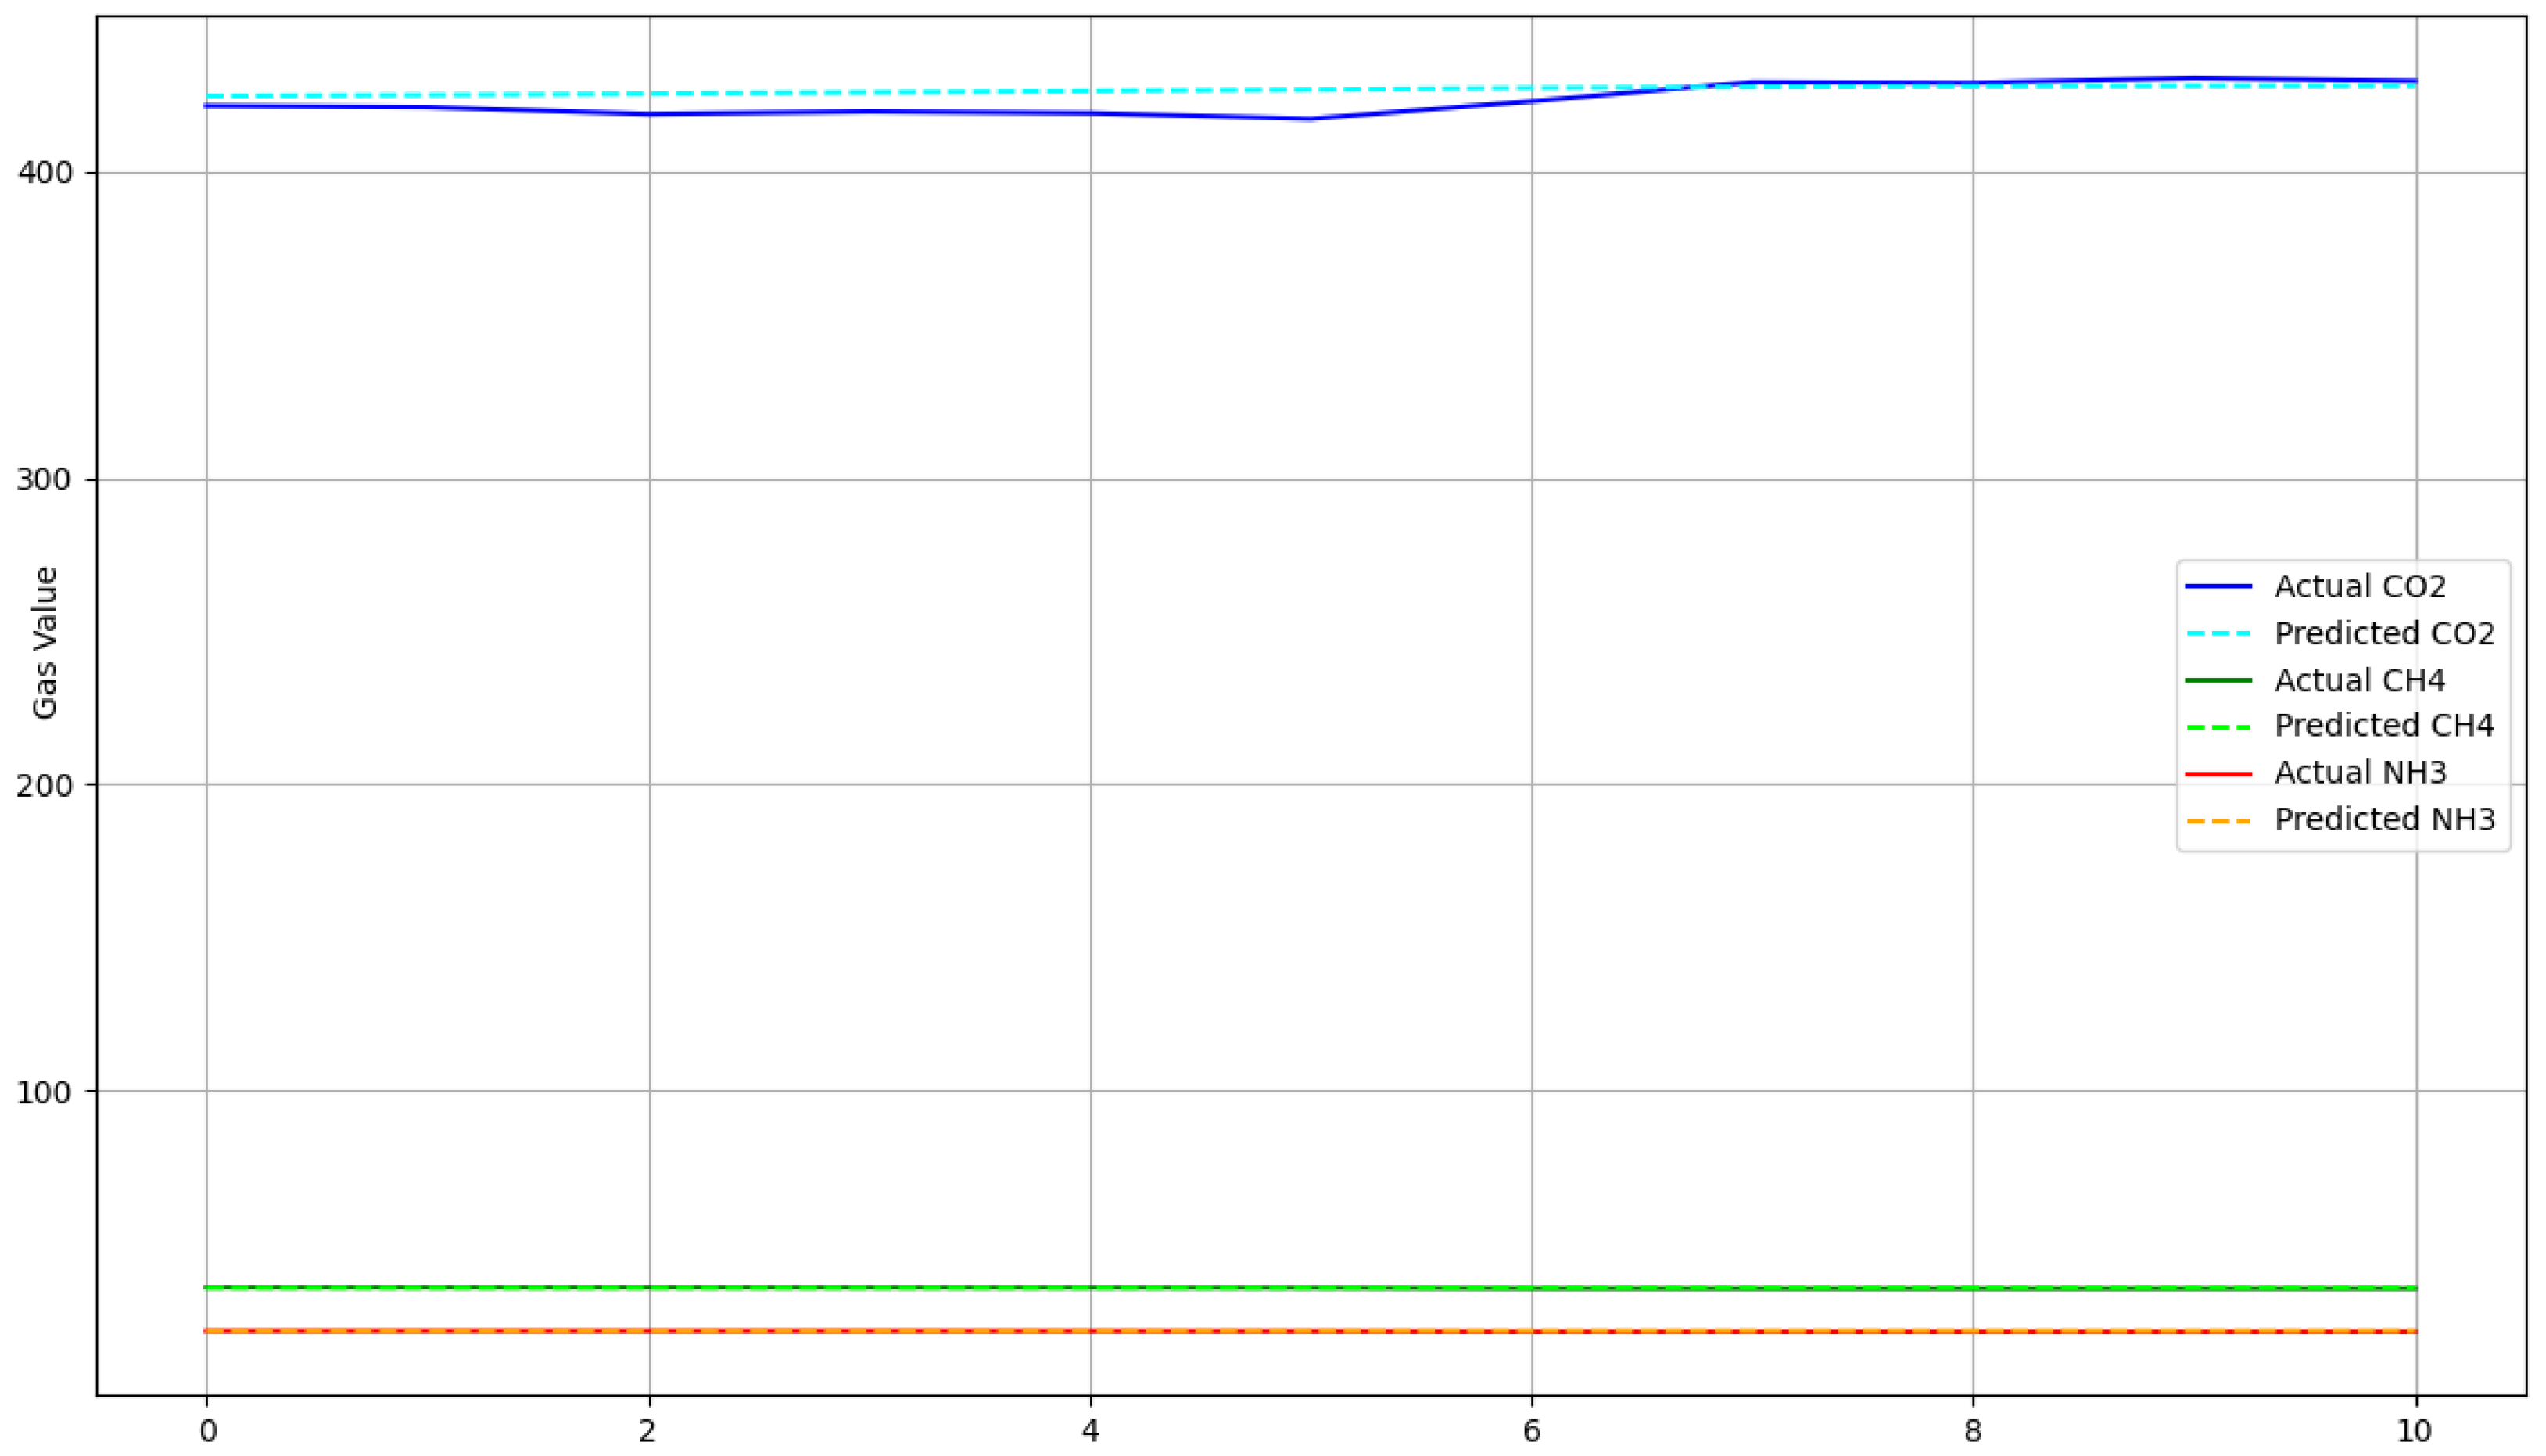
Figure 7, the predicted values are displayed as a grouped bar chart on the web dashboard and are available for CSV download. This smooth integration guarantees that users get real-time monitoring features and future-oriented information, making the system more useful as a decision-support tool in intelligent poultry farming settings. The figure shows the hourly prediction of gas concentrations for the next day from the LSTM model. The bar chart enables a time-based daily assessment of air quality trends. The line graph compares the actual and predicted values over time for the
,
, and
gas emissions. The lines’ proximity indicates the ML model’s high prediction accuracy.
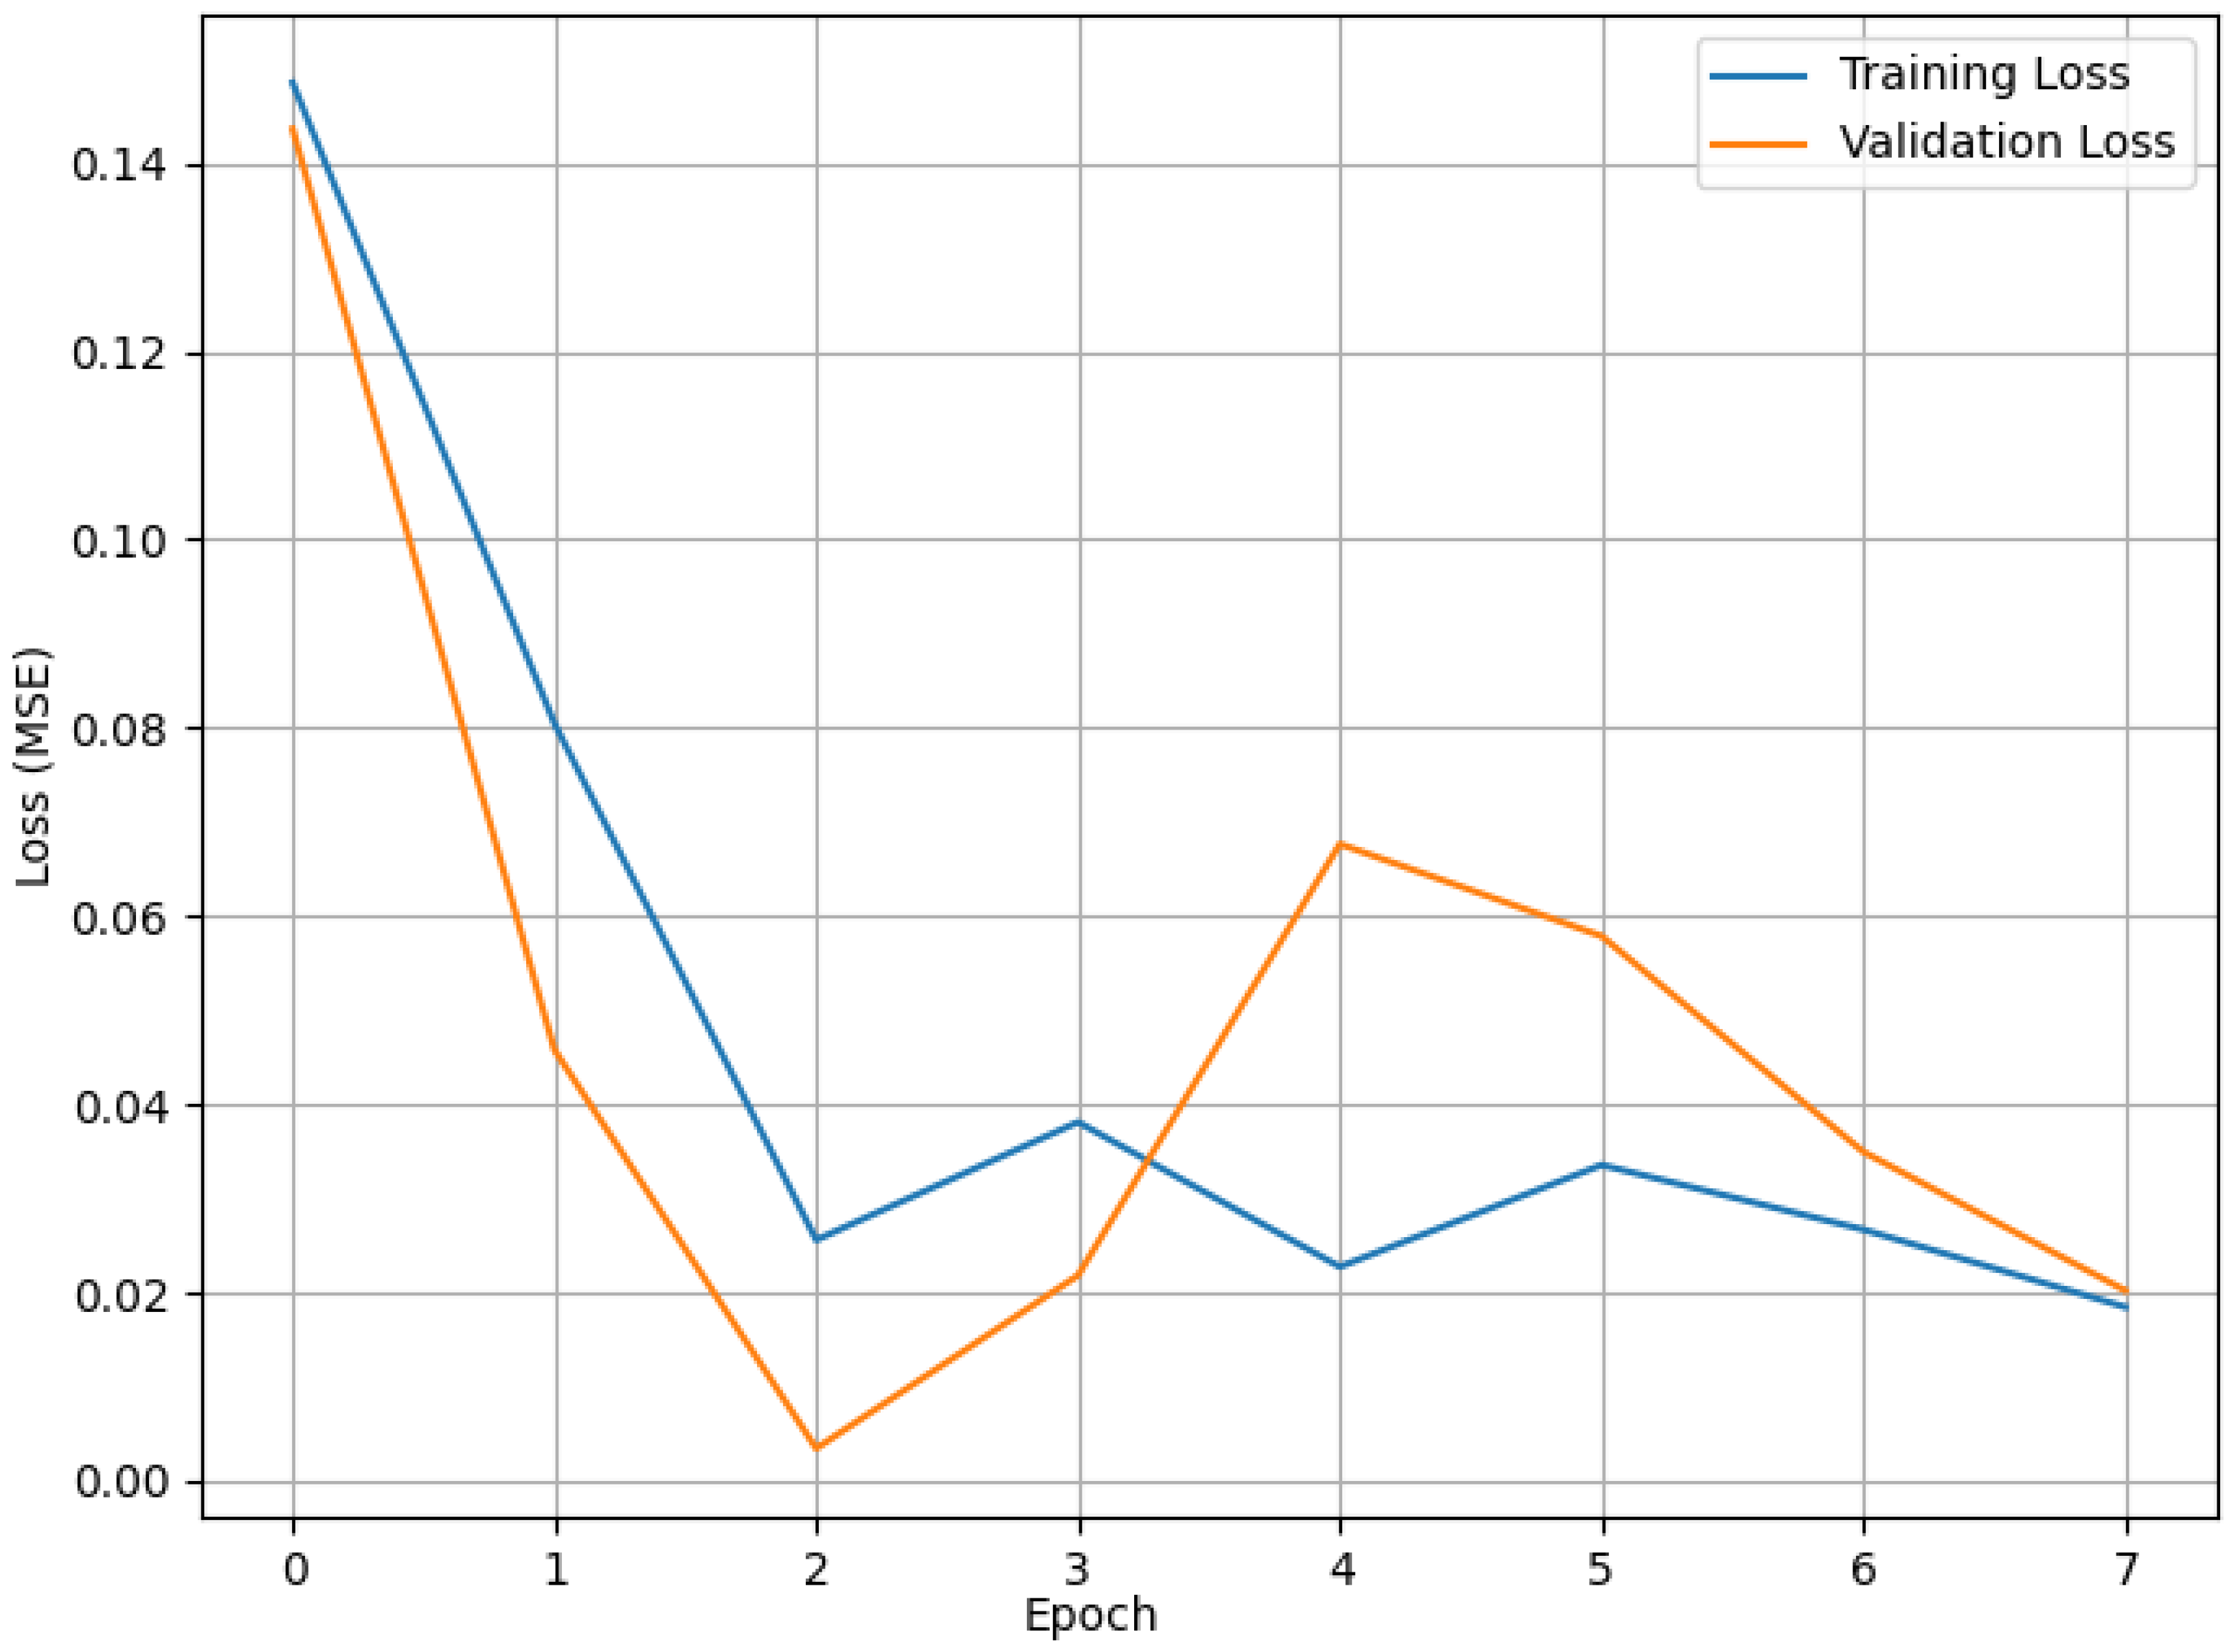
Figure 8 shows the model’s performance in the training and validation phases. As shown in the figure, the Mean Squared Error (MSE) loss for training and validation sets across epochs proves the model’s convergence and elimination of overfitting. The MSE is calculated using this formula.
where
is the ground truth value and
is the predicted value.
To predict the next day’s gas concentration, a regression model was used, which is mathematically represented as follows:
where
is the predicted gas concentration value in ppm,
is the
historical gas reading (i.e., feature vector), and
is the
weight value learned during the training process.
4. Evaluation and Result Analysis
We evaluated our system experimentally regarding performance and accuracy, in addition to conducting statistical analysis.
4.1. Performance and Prediction Accuracy
System responsiveness and latency are the key performance parameters for real-time monitoring systems. The Raspberry Pi SBC, connected with the calibrated gas sensors, could read and transmit sensor data to ThingSpeak in a very short latency. Real-time transmission was achieved with an average delay of less than 5 s from reading the sensor to data visibility on the dashboard online. The Flask-based web application periodically sends requests to ThingSpeak’s API within a range of 15–30 s, giving real-time indications of the gas concentration level on the GUI.
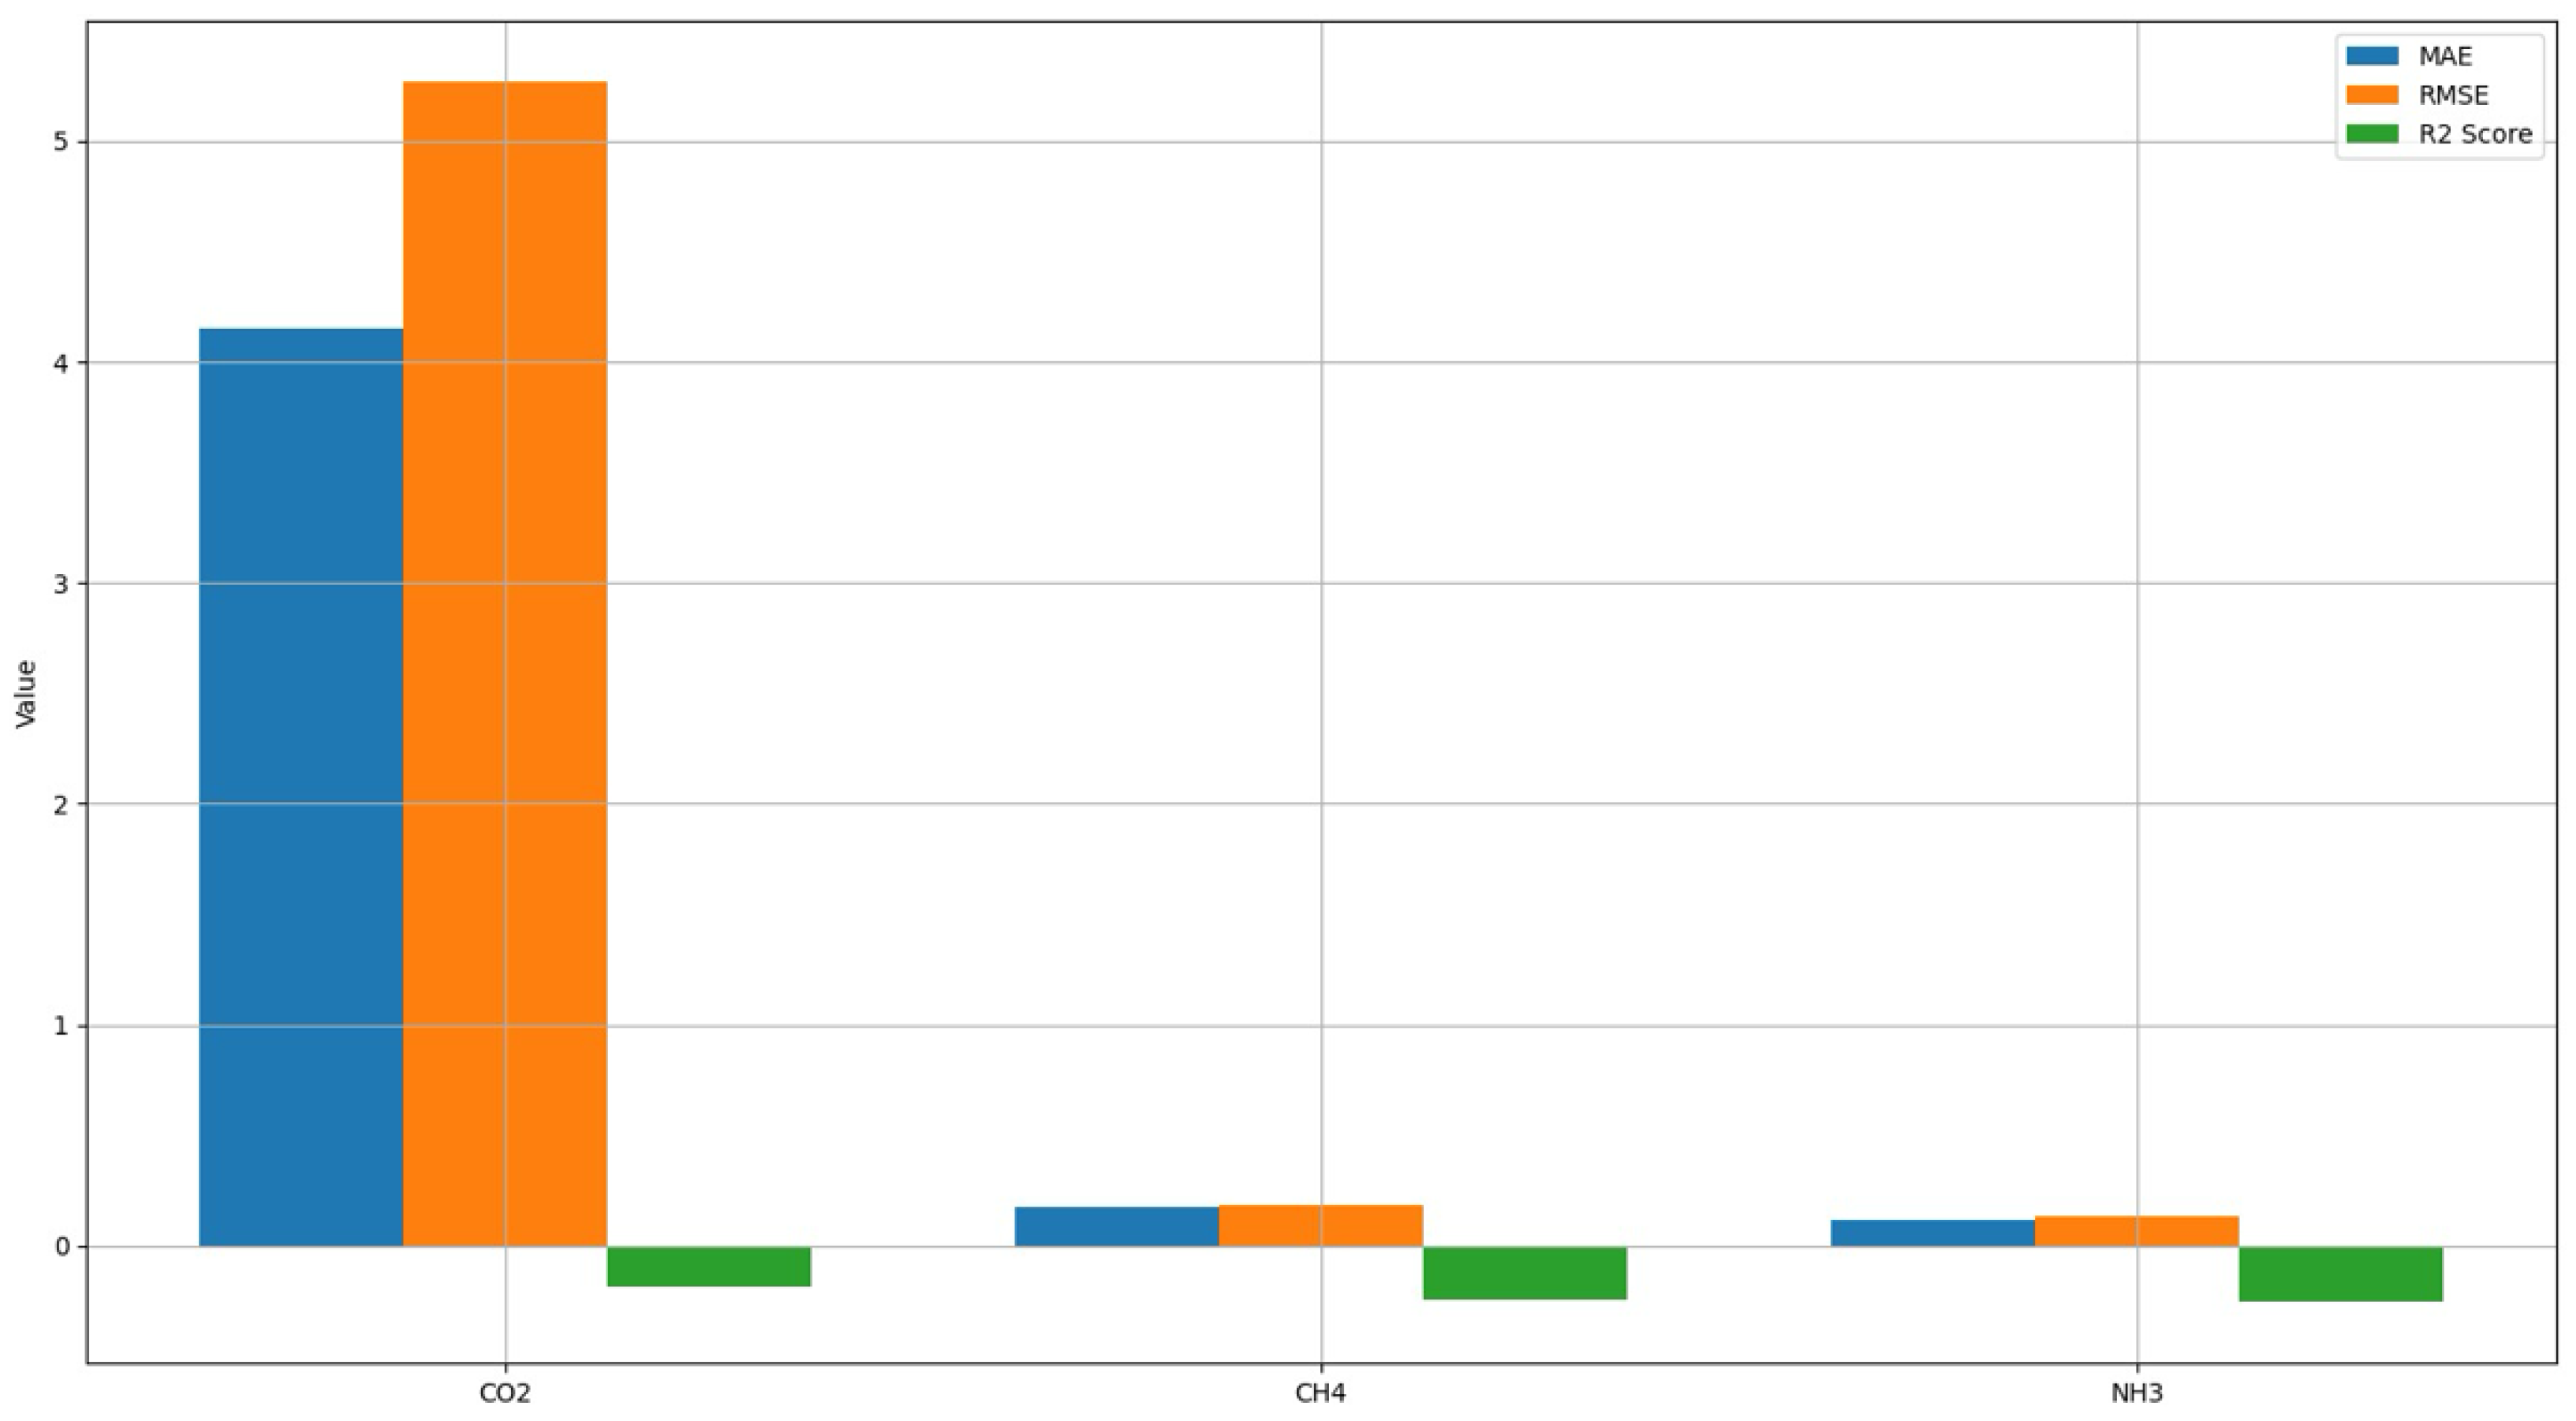
The ML predictive model was evaluated using standard performance metrics to determine its ability to predict near-future gas concentrations. The trained model, utilizing hourly resampled historical data, performed well on unseen data and demonstrated good generalization capability. Evaluation metrics of interest include Mean Absolute Error (MAE), Root Mean Squared Error (RMSE), and
. As shown in
Figure 9, the model generated an average MAE of 3.47 ppm, an RMSE of 4.12 ppm, and an
of 16.98 ppm on the
,
, and
gases, respectively. The coefficient of determination
score is calculated mathematically as follows:
where
is the mean of the ground truth (actual) values.
Figure 10 compares the actual and predicted values over time for the
,
, and
gaseous emissions. The lines’ proximity indicates the ML model’s high prediction accuracy. These results indicate a negligible prediction error range, confirming the model’s validity in predicting environmental conditions in the short term for poultry farms. The forecasting system enables intelligence-based decision-making by allowing farm operators to act proactively before an increase in dangerous gas levels, contributing to proactive and intelligence-based environmental management.
4.2. Statistical Analysis
Sensor data were collected and analyzed to compare gas emissions across different times of day (morning, afternoon, and evening). Statistical analysis was performed using the General Linear Model (GLM) procedure in SAS software (version 9.2; SAS Institute Inc., Cary, NC, USA) based on a one-way analysis of variance (ANOVA) under a completely randomized design. Time of day was considered as a fixed effect. When significant differences were observed (), treatment means were separated using Duncan’s Multiple Range Test. Data are presented as means ± standard error of the mean (SEM). All graphical representations were generated using GraphPad Prism software (version 9; GraphPad Software, La Jolla, CA, USA).
4.2.1. Carbon Dioxide Emissions
The concentration of
in the laying hens at 30 weeks of age differed significantly across the three time points measured in the facility during the day (
; see
Figure 11a). The highest
levels were recorded in the afternoon, followed by the evening, while the lowest concentrations occurred in the morning. Specifically,
levels reached approximately 570 ppm in the afternoon, which was significantly higher (
) than the levels observed in the evening (~560 ppm) and morning (~555 ppm). These findings indicate a distinct diurnal pattern in
accumulation, with peak concentrations occurring during the warmer afternoon hours.
4.2.2. Methane Emissions
concentrations showed significant diurnal variation throughout the day
; see
Figure 11b). The highest
levels were recorded in the morning (~18 ppm), followed by the evening (~17.5 ppm), while the lowest values were observed in the afternoon (~17 ppm). Statistically,
levels in the morning were significantly higher than in both the afternoon and evening, and evening levels were also significantly greater than those in the afternoon. These findings suggest that methane emissions peaked during the early hours and declined slightly during the warmer afternoon period before rising again in the evening.
4.2.3. Ammonia Emissions
concentrations also varied significantly across the day (
; see
Figure 11c). The highest
levels were observed in the morning and evening, both of which were significantly higher than the levels recorded in the afternoon. Specifically,
concentrations in the morning and evening averaged around 21 ppm, while afternoon values were slightly lower at approximately 20 ppm. Despite the relatively small numerical differences, the statistical variation suggests that ammonia levels were subject to subtle but significant diurnal fluctuations, with a slight dip during the afternoon period.
4.3. Discussion
In the current study, significant diurnal fluctuations were observed in all gases measured (p < 0.001). concentrations peaked in the afternoon, followed by evening and morning periods, reflecting increased metabolic activity or ventilation during warmer hours. Ammonia levels were highest in the morning and evening, with a slight decrease in the afternoon, indicating subtle shifts in microbial activity or ventilation dynamics. Methane emissions exhibited a similar pattern, peaking in the morning, declining in the afternoon, and rising again in the evening. These findings highlight the importance of the time of day in evaluating gaseous emissions from poultry housing and suggest potential windows for targeted mitigation strategies to reduce environmental impact.
concentrations showed a significant diurnal trend, peaking in the afternoon, followed by the evening, and reaching their lowest levels in the morning. These observations are consistent with those reported by Huang and Guo [
4], who examined gas emissions from commercial broiler and layer barns and found a similar increase in
levels during the daytime, especially in the afternoon. This trend is typically attributed to increased bird activity and ambient temperature, which raise the metabolic rate and, subsequently, the respiratory
output. Additionally, Kilic and Yaslioglu [
19] documented elevated
levels during warmer periods of the day in Turkish layer houses, further confirming the correlation between environmental conditions and gas accumulation.
A possible explanation for the peak
concentrations in the afternoon is the reduced ventilation efficiency during the hottest hours of the day. Poultry houses often experience altered ventilation cycles to limit heat stress on birds during peak heat periods, which inadvertently slows the removal of metabolically produced
[
5].
can also be produced due to the breakdown of the organic matter and manure in the floor pens, due to the microbial decomposition and combustion of fuels that are used, like propane or natural gas, in heaters to maintain heat in the houses for birds.
Ni et al. [
18] highlighted that ventilation management significantly influences gas accumulation, particularly in manure-belt systems. If air exchange rates are not adequately adjusted during high metabolic periods,
may build up quickly, especially when combined with limited diffusion due to stagnant air layers and higher stocking densities [
3,
15,
17,
24]. Furthermore, higher ambient temperatures in the afternoon can increase the birds’ respiration rates due to thermal stress. As birds pant to regulate their body temperature, they exhale more
, further contributing to elevated indoor concentrations. This biological response, combined with suboptimal ventilation during the hottest periods, creates a compounding effect, leading to the afternoon peak. By evening, although ambient temperatures may decline, residual
may remain trapped in the house due to inertia in air exchange and the accumulation from the prior period of increased production [
3,
14,
15]. These findings suggest that optimizing ventilation rates based on bird activity and temperature fluctuations could help mitigate
buildup and improve air quality in poultry houses.
levels in the current study followed a distinct diurnal pattern, with the highest concentrations occurring in the morning and evening, and significantly lower values observed in the afternoon. This pattern is consistent with the findings of Liu et al. [
20], who reported that ammonia emissions in North China layer systems were influenced by both the ventilation pattern and time of day. Their findings showed that morning and late-day emissions were elevated, likely due to manure accumulation and reduced ventilation rates. Similarly, Ni et al. [
18] emphasized that
emissions are highly dependent on-air exchange rates, manure characteristics, and the degree of microbial degradation occurring on the manure surface.
The elevated
levels observed in the morning could be attributed to overnight accumulation when ventilation is generally minimized to conserve heat or energy. During this time, ammonia generated from the microbial decomposition of uric acid in manure volatilizes and builds up within the enclosed space. Kilic and Yaslioglu [
19] also observed that morning ammonia levels often reflect the residual concentration from the night when gas dispersion was limited. As temperatures rise and ventilation increases in the afternoon, ammonia concentrations typically drop due to the enhanced gas exchange and drying of the litter surface, which reduces microbial activity and ammonia release [
15,
16]. In the evening, as ventilation slows again and manure begins to rehydrate slightly due to moisture cycling and reduced airflow, ammonia emissions increase. The presence of moisture is a key factor in ammonia volatilization, as the hydrolysis of uric acid is enhanced under moist conditions. Ni et al. [
18] confirmed that increased humidity and temperature synergistically elevate
release from manure. Therefore, the evening spike in
observed in the present study likely reflects a combination of declining ventilation efficiency and the reactivation of microbial processes. These patterns highlight the importance of maintaining consistent ventilation strategies, especially during transitional times such as dawn and dusk, to minimize ammonia accumulation and ensure better air quality for both birds and workers.
emissions in this study followed a clear diurnal rhythm, with the highest levels detected in the morning, followed by the evening, and the lowest values observed in the afternoon. This pattern is in agreement with the findings of Huang and Guo [
4], who reported similar
fluctuations in commercial broiler and layer barns. Methane in poultry houses is primarily produced via the anaerobic microbial fermentation of organic matter in manure. The observed increase in
during the early hours of the day may be explained by the accumulation of emissions overnight, when microbial activity continues but ventilation is reduced or inactive, allowing methane to concentrate within the housing environment [
3,
14,
15]. In the afternoon, methane levels dropped significantly, which could be due to both improved ventilation and the drying effect of elevated ambient temperatures. According to Ni et al. [
18], higher airflow rates reduce anaerobic zones on the manure surface and disperse built-up gases more efficiently. Additionally, the heat and air movement may lead to the crusting or drying of the manure, which impairs the anaerobic conditions necessary for methanogenic microbial populations to thrive. This natural inhibition of methanogenesis during the warmer and more ventilated parts of the day leads to a measurable reduction in
emissions.
Evening concentrations of methane rose again, though not as high as the morning peak. This secondary increase may be associated with the transition to cooler temperatures and a corresponding decrease in ventilation rates. As airflow slows and manure surface moisture returns via condensation or humidity cycling, anaerobic microenvironments can re-establish, permitting renewed methane production [
16,
17]. This finding is consistent with that of Liu et al. [
20], who noted that even minor changes in manure moisture and air movement could significantly influence microbial gas emissions. Overall, the observed diurnal patterns of
suggest that effective manure management and stable ventilation control are crucial in minimizing methane accumulation and its environmental impact.
5. Conclusions
This paper presented an end-to-end architecture—from sensor-level data acquisition to web-based visualization and prediction—offering a low-cost, scalable, and intelligent environmental monitoring system. The developed system allows poultry farmers to maintain ideal air conditions, reduce bird health hazards, and increase productivity through data-driven decision-making. The system accurately measures crucial gas concentrations, of , , and , utilizing a Raspberry Pi SBC and MQ-135 gas sensors. Real-time data transfer to the ThingSpeak cloud-based platform and visualization using an interactive, design-oriented web dashboard keeps farm operators informed continuously about prevailing air quality trends.
This study demonstrated clear diurnal variations in gaseous emissions from laying hens housed under standardized conditions. Carbon dioxide concentrations peaked during the afternoon, likely due to higher metabolic rates and ambient temperatures, while ammonia and methane emissions were highest in the morning and evening, reflecting complex interactions between bird activity, microbial processes, and ventilation patterns. The significant temporal fluctuations observed for all gases emphasize the need to consider the time of day when monitoring emissions to obtain accurate and representative data. Understanding these patterns is crucial for developing effective environmental management practices in poultry production. Based on the observed diurnal emission trends, it is recommended that poultry housing ventilation and environmental control systems be optimized to target peak emission periods, particularly during the afternoon for and during the morning and evening for and .
To analyze emission patterns, we applied one-way ANOVA using the GLM procedure in SAS with time of day as a fixed effect. Significant differences (p < 0.05) were detected and separated using Duncan’s test. Results are presented as means ± SEM. We also trained a regression model for next-day gas prediction. Model performance was evaluated using MSE, RMSE, and MAE, with strong results (e.g., MSE = 35.2, R2 = 0.87), indicating high accuracy without overfitting.
Future research should explore mitigation strategies such as enhanced ventilation timing, dietary adjustments, and manure management tailored to these critical periods to reduce gaseous emissions and improve air quality. Further data processing on the network edge and communication protocol optimization are needed to support wide-scale deployment across several poultry farms with multi-barn management features and load-balanced cloud infrastructure using multi-node deployments and employing seasonal studies. We also plan to integrate more sophisticated ML models, such as Gated Recurrent Unit (GRU) networks, SVR, and ARIMA models, to improve accuracy in forecasting gas concentration and detecting anomalies or sensor failure. Cross-validation to assess the ML model’s generalizability and the sensitivity testing of input feature variations on output accuracy are some other directions we will investigate in the future. We are currently working on utilizing automated sensor diagnostic features to detect sensor degradation or failure online, with the provision of data integrity and facilitated proactive maintenance. Finally, we plan to expand the sensor array to include the detection of other such important gases like Hydrogen Sulfide (), Carbon Monoxide (CO), and Volatile Organic Compounds (VOCs) to achieve an even more holistic view of poultry barn air.
