Article

Prediction of Subcutaneous Fat Thickness (SFT) in Pantaneiro Lambs: A Model Based on Adipometer and Body Measurements for Android Application

by
Adrielly Lais Alves da Silva
1,
Marcus Vinicius Porto dos Santos
1,
Marcelo Corrêa da Silva
1,
Hélio Almeida Ricardo
1,
Marcio Rodrigues de Souza
2,
Núbia Michelle Vieira da Silva
1 and
Fernando Miranda de Vargas Junior
1,*
1
Faculty of Agrarian Sciences, Federal University of Grande Dourados, Rodovia Dourados–Itahum, km 12, Dourados 79804-970, MS, Brazil
2
Federal Institute of Education Science and Technology of Mato Grosso do Sul, Campus Dourados, Dourados 79833-520, MS, Brazil
*
Author to whom correspondence should be addressed.
AgriEngineering 2025, 7(8), 251; https://doi.org/10.3390/agriengineering7080251
Submission received: 3 May 2025 / Revised: 24 July 2025 / Accepted: 28 July 2025 / Published: 7 August 2025

Abstract

The increasing adoption of digital technologies in the agriculture sector has significantly contributed to optimizing on-farm routines, especially in data-driven decision-making. This study aimed to develop an application to determine the slaughter point of lambs by predicting subcutaneous fat thickness (SFT) using pre-slaughter parameters such as body weight (BW), body condition score (BCS), and skinfold measurements at the brisket (BST), lumbar (LST), and tail base (TST), obtained using an adipometer. A total of 45 Pantaneiros lambs were evaluated, finished in feedlot, and slaughtered at different body weights. Each pre-slaughter weight class showed a distinct carcass pattern when all parameters were included in the model. Exploratory analysis revealed statistical significance for all variables (p < 0.001). BW and LST were selected to construct the predictive equation (R2 = 55.44%). The regression equations were integrated into the developed application, allowing for in-field estimation of SFT based on simple measurements. Compared to conventional techniques such as ultrasound or visual scoring, this tool offers advantages in portability, objectivity, and immediate decision-making support. In conclusion, combining accessible technologies (e.g., adipometer) with traditional variables (e.g., body weight), represents an effective alternative for production systems aimed at optimizing and enhancing the value of lamb carcasses.

Graphical Abstract

1. Introduction

Determining the ideal slaughter point for animals represents a significant zootechnical challenge. When poorly defined, it can compromise meat quality by reducing desirable attributes such as tenderness and juiciness, or result in economic losses due to excess fat trimming [1,2]. Carcass finishing, characterized by adequate subcutaneous fat thickness (SFT), is directly related to the quality of the final product, impacting key factors such as chilling losses, rigor mortis effectiveness, meat tenderness, and color-critical attributes to meet consumer expectations and market demands [3,4,5].
SFT is associated with carcass finishing and physiologically reflects the growth rate and the accumulation of muscle, bone, and adipose tissues. However, high SFT values do not necessarily translate into a greater yield of commercial cuts [6]. Moreover, excessive fat in lamb carcasses is directly related to increased production time and cost [7] and negatively affects carcass weight, commercial yield, and market value [8]. Given these physiological and economic implications, selecting the right slaughter point requires a multifactorial approach that takes into account breed characteristics, nutrition, age, and desired meat quality outcomes [9,10]. Indeed, recent studies emphasize that slaughter timing significantly influences carcass composition and economic returns [11].
Traditionally, SFT assessment has been performed using ultrasonography [12,13,14,15], or post-mortem analysis, considered the gold standard method, but this is not feasible for real-time assessments. Although accurate, these techniques are costly and require specialized technical knowledge, limiting their use in small-scale production systems. As alternatives, body condition scoring (BCS) and skinfold measurements have been used, both of which are more accessible and non-invasive. However, BCS remains a subjective measure prone to evaluator bias, and skinfold measurements still lack validated predictive equations for locally adapted genetic groups such as Pantaneiro sheep.
In addition, most studies focus on specialized breeds, failing to take into account the phenotypic variability of local animals or even large weight amplitudes, which leaves them unable to integrate the different physiological stages of tissue deposition that occur within the same race and similar weights.
Numerous scientific studies are undertaken daily, generating a substantial volume of information with the potential to transform productive practices [16]. However, there remains a significant gap between the generation of academic knowledge and its direct application in productive systems, particularly in the industrial and agricultural sectors [17]. In this context, the development and implementation of predictive models have emerged as essential tools for operationalizing generated knowledge, enabling the anticipation of scenarios and facilitating more assertive decision-making by leveraging relevant historical data and variables [18]. Nevertheless, even when such models are applied, many exhibit limitations regarding their accessibility and comprehension by non-specialized users, thereby compromising their practical effectiveness and the broader democratization of scientific advances in production processes [17].
To address these limitations, mobile technologies offer a promising alternative for bridging this gap. The increasing availability of smartphones and low-cost sensors has facilitated the development of real-time, user-friendly applications for animal health monitoring, weight estimation, and carcass evaluations [19]. Nevertheless, many current solutions are tailored to intensive systems, creating a gap in applicability for extensive, small-scale farming operations [20].
Therefore, the objective of this study was to develop a mobile (Android) application to assist producers in determining the ideal slaughter point for Pantaneiro lambs. The system is based on the creation and validation of predictive equations for subcutaneous fat thickness (SFT) using pre-slaughter variables such as body weight, body condition score, and skinfold measurements (brisket—BST; lumbar—LST; and tail—TST), obtained using a digital adipometer. By combining accessible phenotypic measures with predictive modeling, the proposed tool seeks to enhance decision-making, improve carcass quality outcomes, and contribute to the sustainable intensification of sheep production in tropical environments.

2. Materials and Methods

2.1. Experimental Location

The experiment was conducted at the feedlot sector of the Sheep Research Center (CPO) of the Faculty of Agricultural Sciences (FCA) at the Federal University of Grande Dourados (UFGD), located in Dourados, Mato Grosso do Sul, Brazil. The geographic coordinates are 22°11′38″ S latitude, 54°55′49″ W longitude, and 479 m altitude, 478.626 m, according to the Geodetic System of the Brazilian Institute of Geography and Statistics [21]. The region’s climate is classified as Cwa (humid mesothermal), with rainy summers and dry winters. The average temperature of the experimental period was 22 °C, with a maximum of 32 °C and a minimum of 12 °C. The study was approved by the Animal Ethics Committee of the Federal University of Grande Dourados (protocol nº. 018/2013).

2.2. Experimental Animals and Diets

A total of 45 locally adapted, uncastrated male Pantaneiro lambs were used in this study [22]. The animals were weaned and housed in individual pens (2 m2) equipped with nipple drinkers and individual troughs. The average initial body weight was 12.78 ± 2.03 kg. Before the experimental period, all lambs underwent a 14-day adaptation phase to the experimental facilities, diet, and handling procedures. Figure 1 shows the experimental housing facilities used during the feeding trial.
The parameters tested for the subcutaneous fat thickness (SFT) prediction model were measured in vivo using a Prime Med Digital DG+ skinfold adipometer (Prime Me, São Paulo, Brazil) and an electronic scale. These included measurements of body weight (BW), body condition score (BCS), and skinfold thickness in the brisket (BST), lumbar (LST), and tail (TST) regions, all recorded in millimeters (Figure 2). The BCS values were determined as the average of assessments conducted by two trained evaluators, following the palpation method described by Russel et al. [23].
The total diet was formulated to achieve an average daily weight gain of 300 g based on the nutrient requirements established by the NRC [24] (Table 1). The diet was offered as a complete mixed ration with a 20:80 ratio of forage to concentrate, consisting of 20% oat hay and 80% commercial concentrate. The concentrates consisted of ground corn, a soybean-based meal, and a mineral premix, which were mixed manually in the feed troughs as described by Hirata et al. [22].
Feed intake was monitored and adjusted daily, allowing for an excess of 15% compared to the previous day’s total intake to ensure ad libitum consumption.
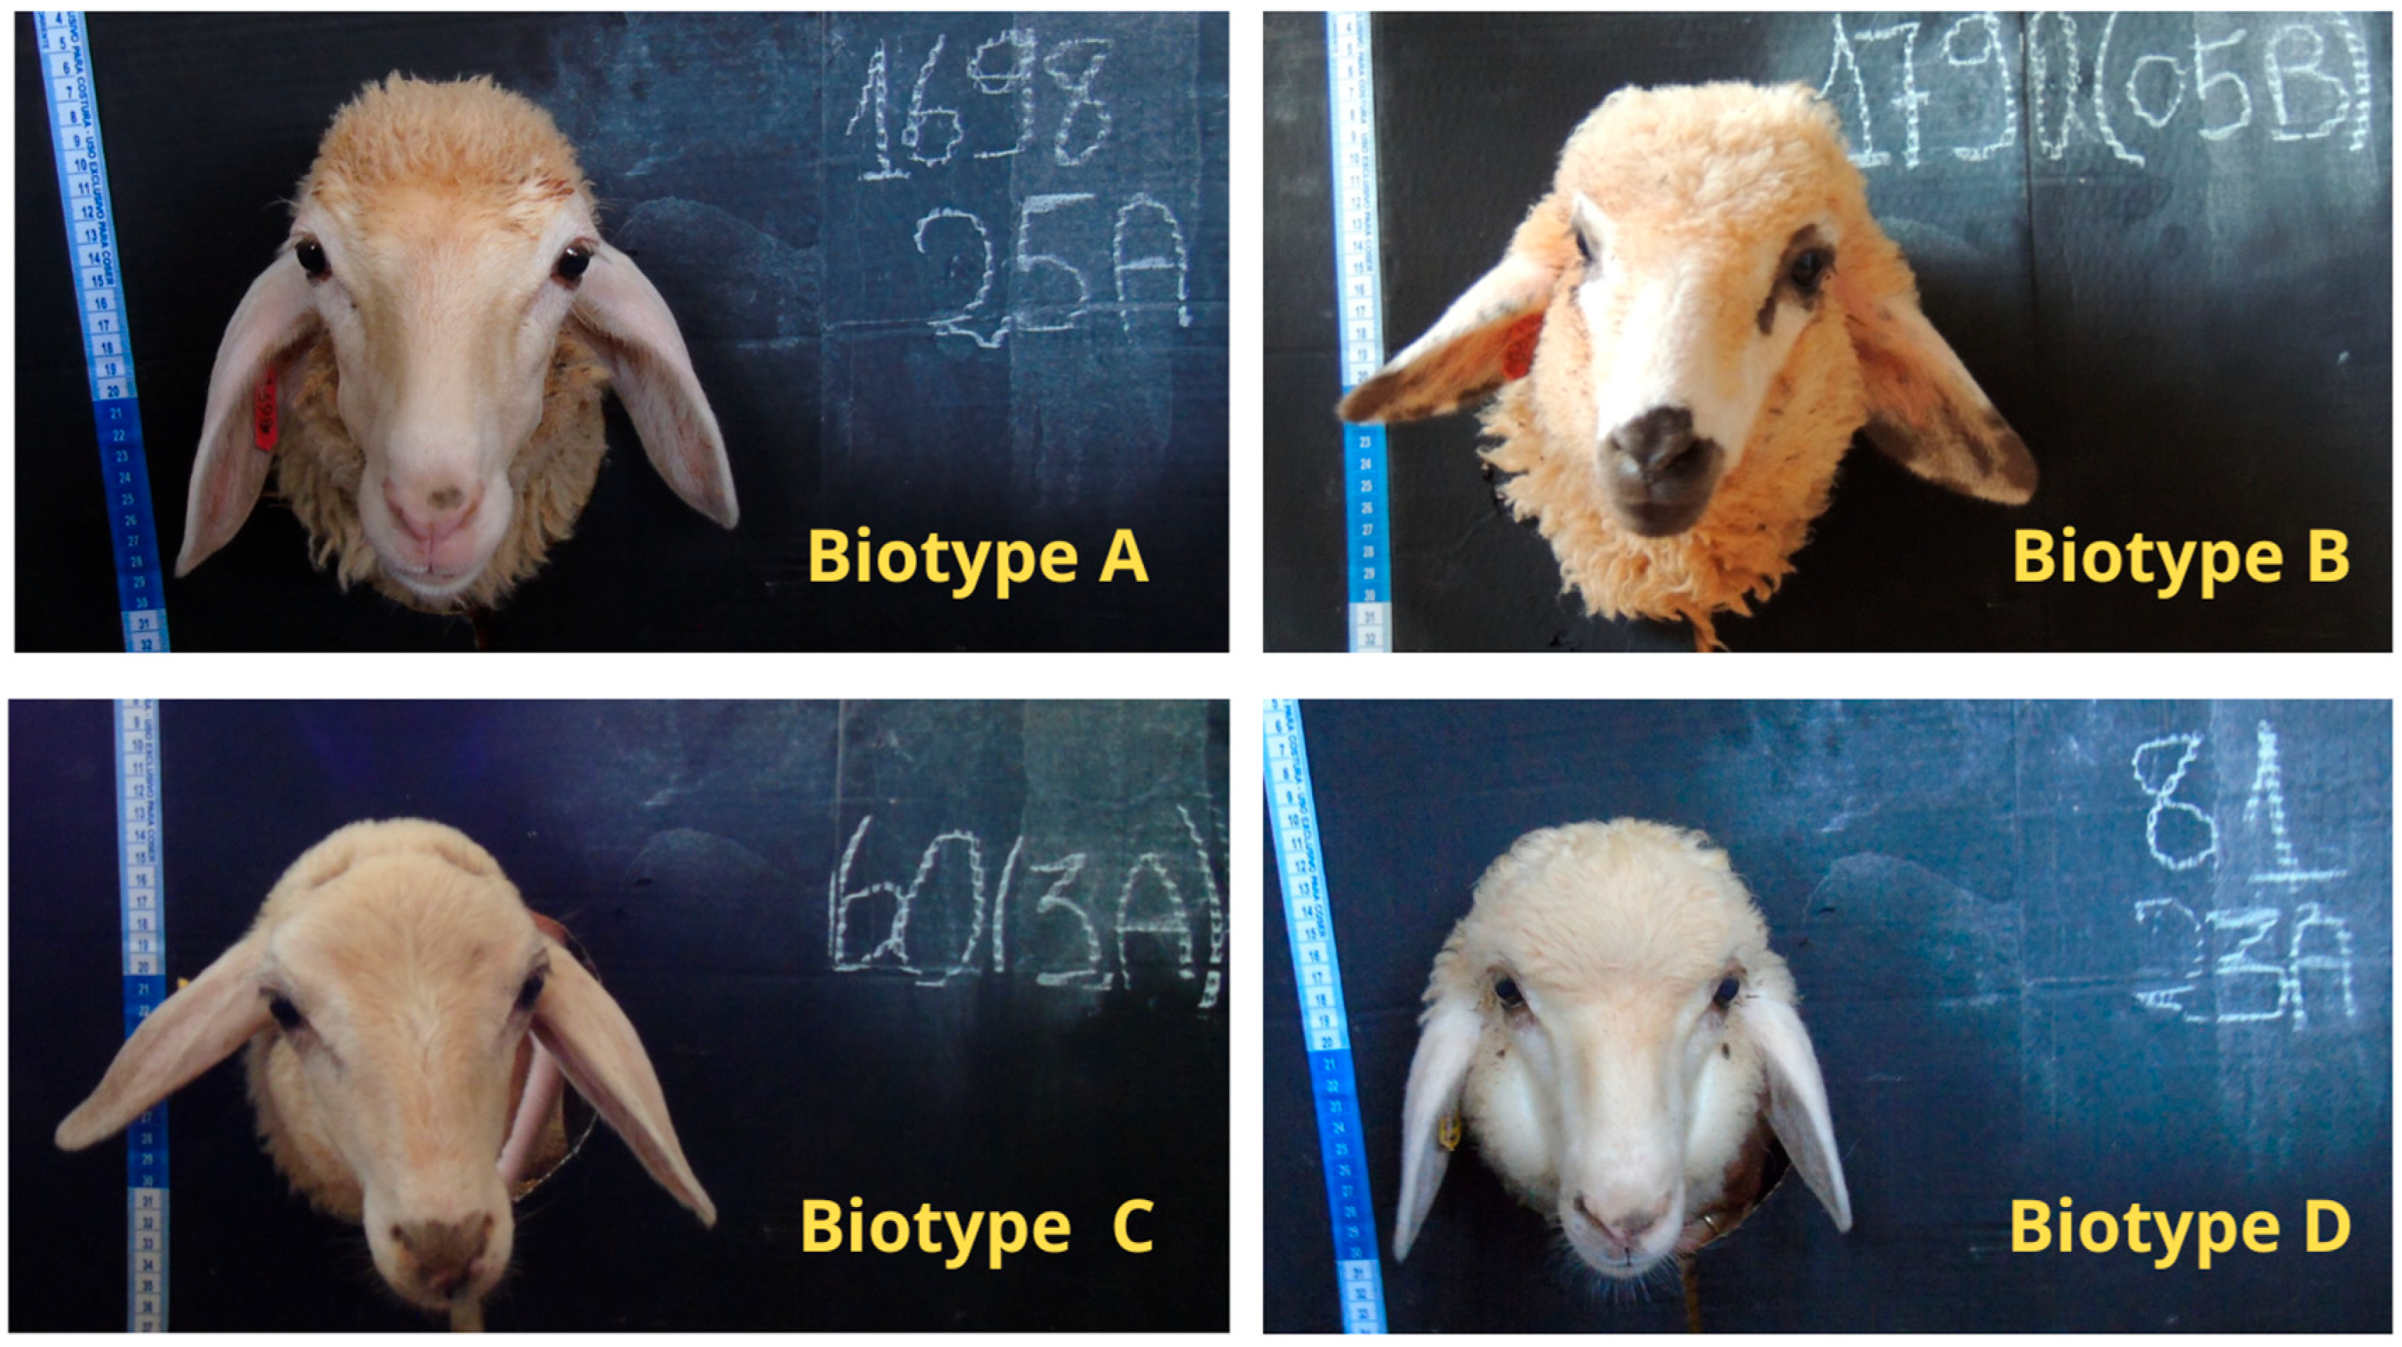
Four distinct biotypes of Pantaneiro lambs were identified and classified before the experimental period, as shown in Figure 3.

2.3. Animal Slaughter

Lambs were slaughtered at the Meat Technology Laboratory of the Federal University of Grande Dourados. Before slaughter, the animals were subjected to 16 h of solid feed withdrawal, with water available ad libitum, to standardize gastrointestinal contents.
Animals were classified into four slaughter weight classes: A = 16.7 ± 1.5 kg; B = 20.9 ± 1.1 kg; C = 27.2 ± 1.4 kg; and D = 34.4 ± 2.6 kg. For slaughter, the lambs were stunned by electronarcosis, followed by exsanguination through the sectioning of the carotid arteries and jugular veins. All slaughter procedures complied with the standards established by the Technical Regulation on Stunning Methods for the Humane Slaughter of Livestock [25] issued by the Ministry of Agriculture, Livestock, and Supply.
SFT data were measured directly on the cold carcass (after 24 h at 4 °C in a cold chamber) using a digital caliper (NOVOTEST.BR, São Paulo, Brazil) at the insertion point between the 12th and 13th thoracic vertebrae. All measurements were performed by the same trained technician to minimize variation.

2.4. Statistical Analysis

An exploratory analysis was conducted using both multivariate and univariate approaches to identify differentiation patterns among lambs and characterize the established lamb classes. The animals were divided into classes to ensure four groups with a similar number of individuals and distinct body weight ranges. The defined groups were as follows: A (n = 10) (<20 kg), B (n = 9) (≥20 and <25 kg), C (n = 12) (≥25 and <30 kg), and D (n = 14) (≥30 kg).
In the multivariate approach, data were standardized and evaluated using discriminant analysis and cluster analysis, performed with the STANDARD, DISCRIM, and TREE procedures [26]. The univariate statistical approach was conducted through mean comparison tests, analysis of variance (ANOVA), and correlation estimates using the MEANS, GLM, and CORR procedures.
Multiple regression tests were performed in MINITAB ® version 16 [27] to develop predictive models for SFT. The dependent variable was SFT, with BW, BCS, BST, LST, and TST used as independent variables in different combinations. Model selection was based on the highest adjusted R2. In addition, scatterplot analyses were performed using MINITAB software to assess the strength of relationships or dependencies between variables.

2.5. Mobile App Development

Following the selection of predictive equations for subcutaneous fat thickness (SFT), we developed an Android application called Slaughter Point Lambs (SPL) using Android Studio version 2.2 on a Linux platform (Ubuntu 16.04.1 LTS), with Java as the programming language. The application was registered with the Brazilian National Institute of Industrial Property (INPI) under number BR 51 2017 000490 0 and made freely available on the Play Store for carcass evaluation purposes.
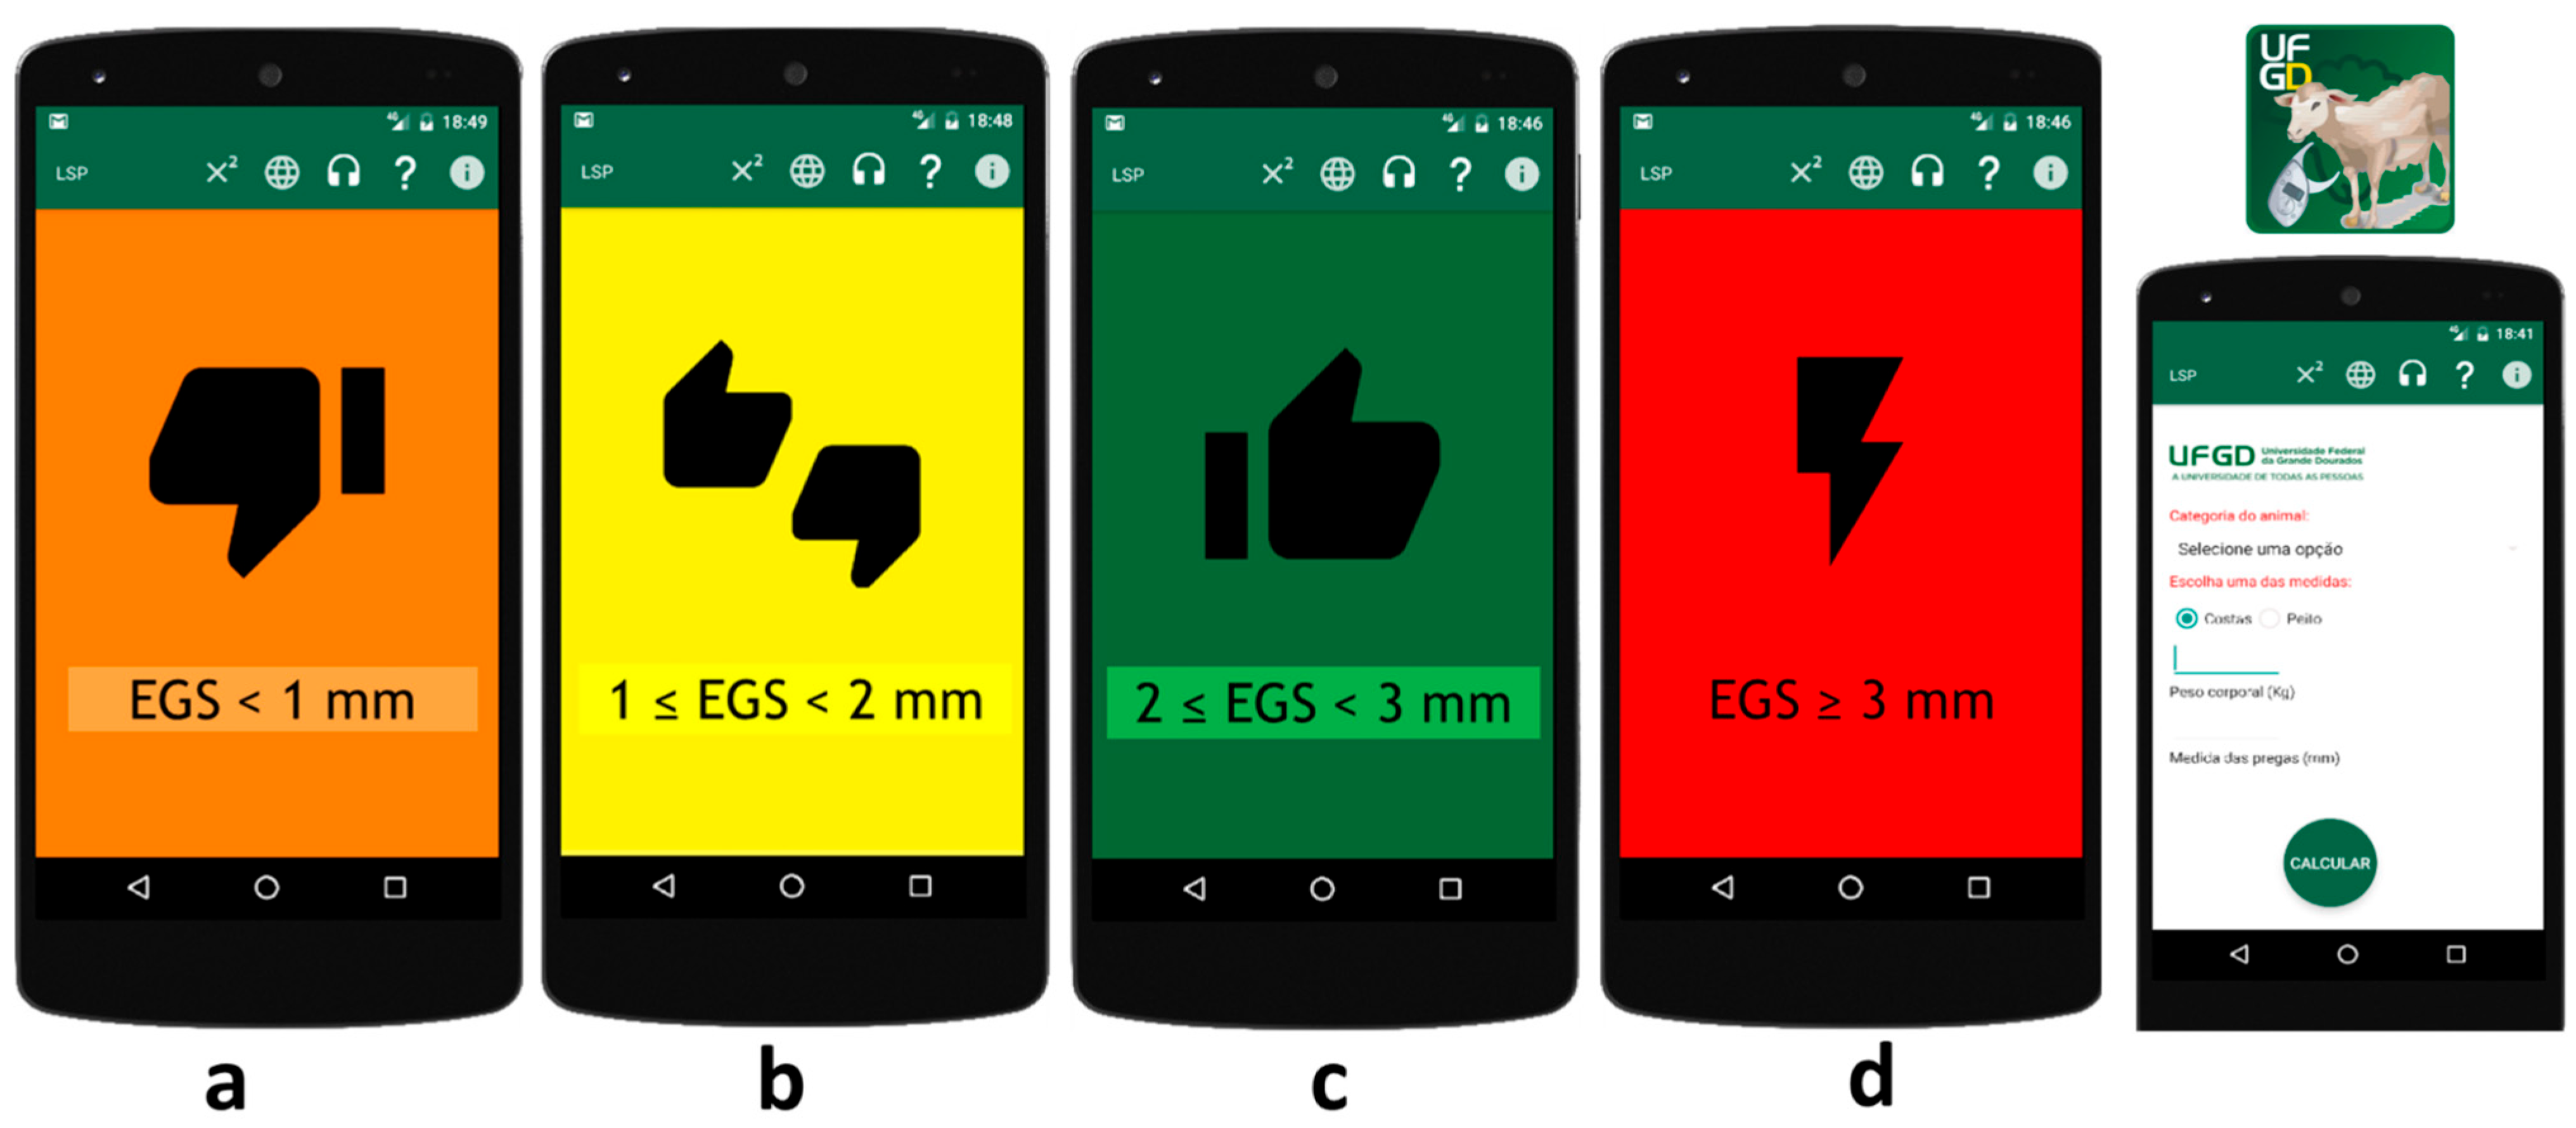
As shown in Figure 4, the application features an intuitive interface that classifies SFT measurements into four distinct categories: below target (SFT < 1 mm, indicating insufficient fat), intermediate (1–2 mm, marginal adequacy), ideal (2–3 mm, optimal for slaughter), and above target (≥3 mm, excessive fat). The color-coded visual design and logical layout enable farmers to interpret results and make informed management decisions quickly.
The mobile application was entirely developed from scratch and was not based on any pre-existing or analogous application. Its operation is based on a multiple linear regression model derived from field-collected data, using body weight (BW) and lumbar skinfold thickness (LST) as predictors of SFT. Users input these values manually, and the app calculates the predicted SFT instantly, providing real-time decision support. The system was specifically designed to support precision livestock farming in low-input systems by delivering a portable and user-friendly technological solution.

3. Results

3.1. Multivariate

The multivariate analysis using the variables BW (body weight), BCS (body condition score), SFT (subcutaneous fat thickness), BST (brisket skinfold thickness), LST (lumbar skinfold thickness), and TST (tail skinfold thickness) demonstrated effective discrimination among lambs from the four classes. In this analysis, only one lamb from class A was misclassified into class B, while all others were correctly classified (100%).
When BW and BCS were excluded, retaining only SFT, BST, LST, and TST, greater classification homogeneity was observed for class A (80%) and class D (78.5%), whereas class B (66.6%) and class C (68.3%) showed higher misclassification rates. A similar pattern was observed when using only BST, LST, and TST in the analysis.
The use of a single variable to discriminate lambs among all classes proved effective only for BW (body weight), which showed high accuracy rates for classes A, B, C, and D (80%, 100%, 100%, and 92.8%, respectively). In contrast, BCS (body condition score) effectively discriminated only lambs from class A (90%), with lower accuracy for classes B, C, and D (66.6%, 25%, and 64.2%, respectively). When used alone, SFT (subcutaneous fat thickness) demonstrated limited effectiveness in discriminating between classes (50%, 44.4%, 58.3%, and 21.4% for classes A, B, C, and D, respectively).
The cluster analysis revealed the existence of two distinct lamb groups: the first comprising classes A and B and the second consisting of classes C and D (Figure 5). The observed inter-group distances (C and D = 0.3337; A and B = 0.0468) were consistent with the results obtained through Mahalanobis distance metric analysis, which also indicated greater separation between classes C and D (14.2) compared to classes A and B (7.3).

3.2. Univariate

The means of BW (body weight), BCS (body condition score), SFT (subcutaneous fat thickness), BST (briskest skinfold thickness), LST (lumbar skinfold thickness), and TST (tail skinfold thickness) differed significantly among lamb classes (Table 2). Notably, no lambs in class A showed means equal to those in class D for any analyzed variable (p < 0.001).

3.3. Regression Models for Predicting Subcutaneous Fat Thickness (SFT)

Initial analysis revealed the significance of the independent variables BW (body weight), BCS (body condition score), BST (brisket skinfold thickness), LST (lumbar skinfold thickness), and TST (tail skinfold thickness) in regression models predicting the dependent variable SFT (subcutaneous fat thickness). When all independent variables were included simultaneously, only BW and LST remained in the final model (R2 = 55.44%; p < 0.001), as the others were excluded due to lack of statistical significance. Consequently, the first predictive equation was derived using BW and LST (Table 3).
Although BCS (body condition score) showed a strong correlation with BW (r = 0.82), this variable was not significant in any of the tested multiple regression models and was consequently excluded from predictive analyses. In a model simultaneously incorporating BST, LST and TST, only LST remained in the final model (R2 = 20.38%). While correlation estimates between skinfold measurements ranged from strong to moderate, LST demonstrated superior predictive capacity for SFT.
Considering the practical advantages of BST measurement in live animals, a second predictive equation was tested using BW and BST as predictor variables (R2 = 43.73%; p < 0.001). Overall, models incorporating skinfold data generated more consistent prediction equations compared to weight-only simple regression models (R2 = 38.73%; p = 0.002). Simple regression equations were ultimately rejected due to their low determination coefficients, despite showing statistical significance: BCS (R2 = 17.02%; p = 0.005), BST (R2 = 17.00%; p = 0.005), LST (R2 = 20.38%; p = 0.002), and TST (R2 = 5.26%; p = 0.13).

3.4. Mobile Application for Predicting the Slaughter Point

To make the predictive equations developed in this study accessible to both technical professionals and livestock producers, a mobile application named Slaughter Point Lambs was developed. It is freely available on the Play Store for Android devices. The tool allows users to input variables such as live weight and thoracic or lumbar skinfold thickness and provides, as output, the predicted subcutaneous fat thickness (SFT). Figure 4 illustrates the main interface of the application.
The application was built based on the regression equations generated from multiple regression analyses (Table 3), prioritizing models with higher R2 values and practical field applicability. This technological solution aims to support more accurate decision-making regarding the optimal slaughter time of lambs.
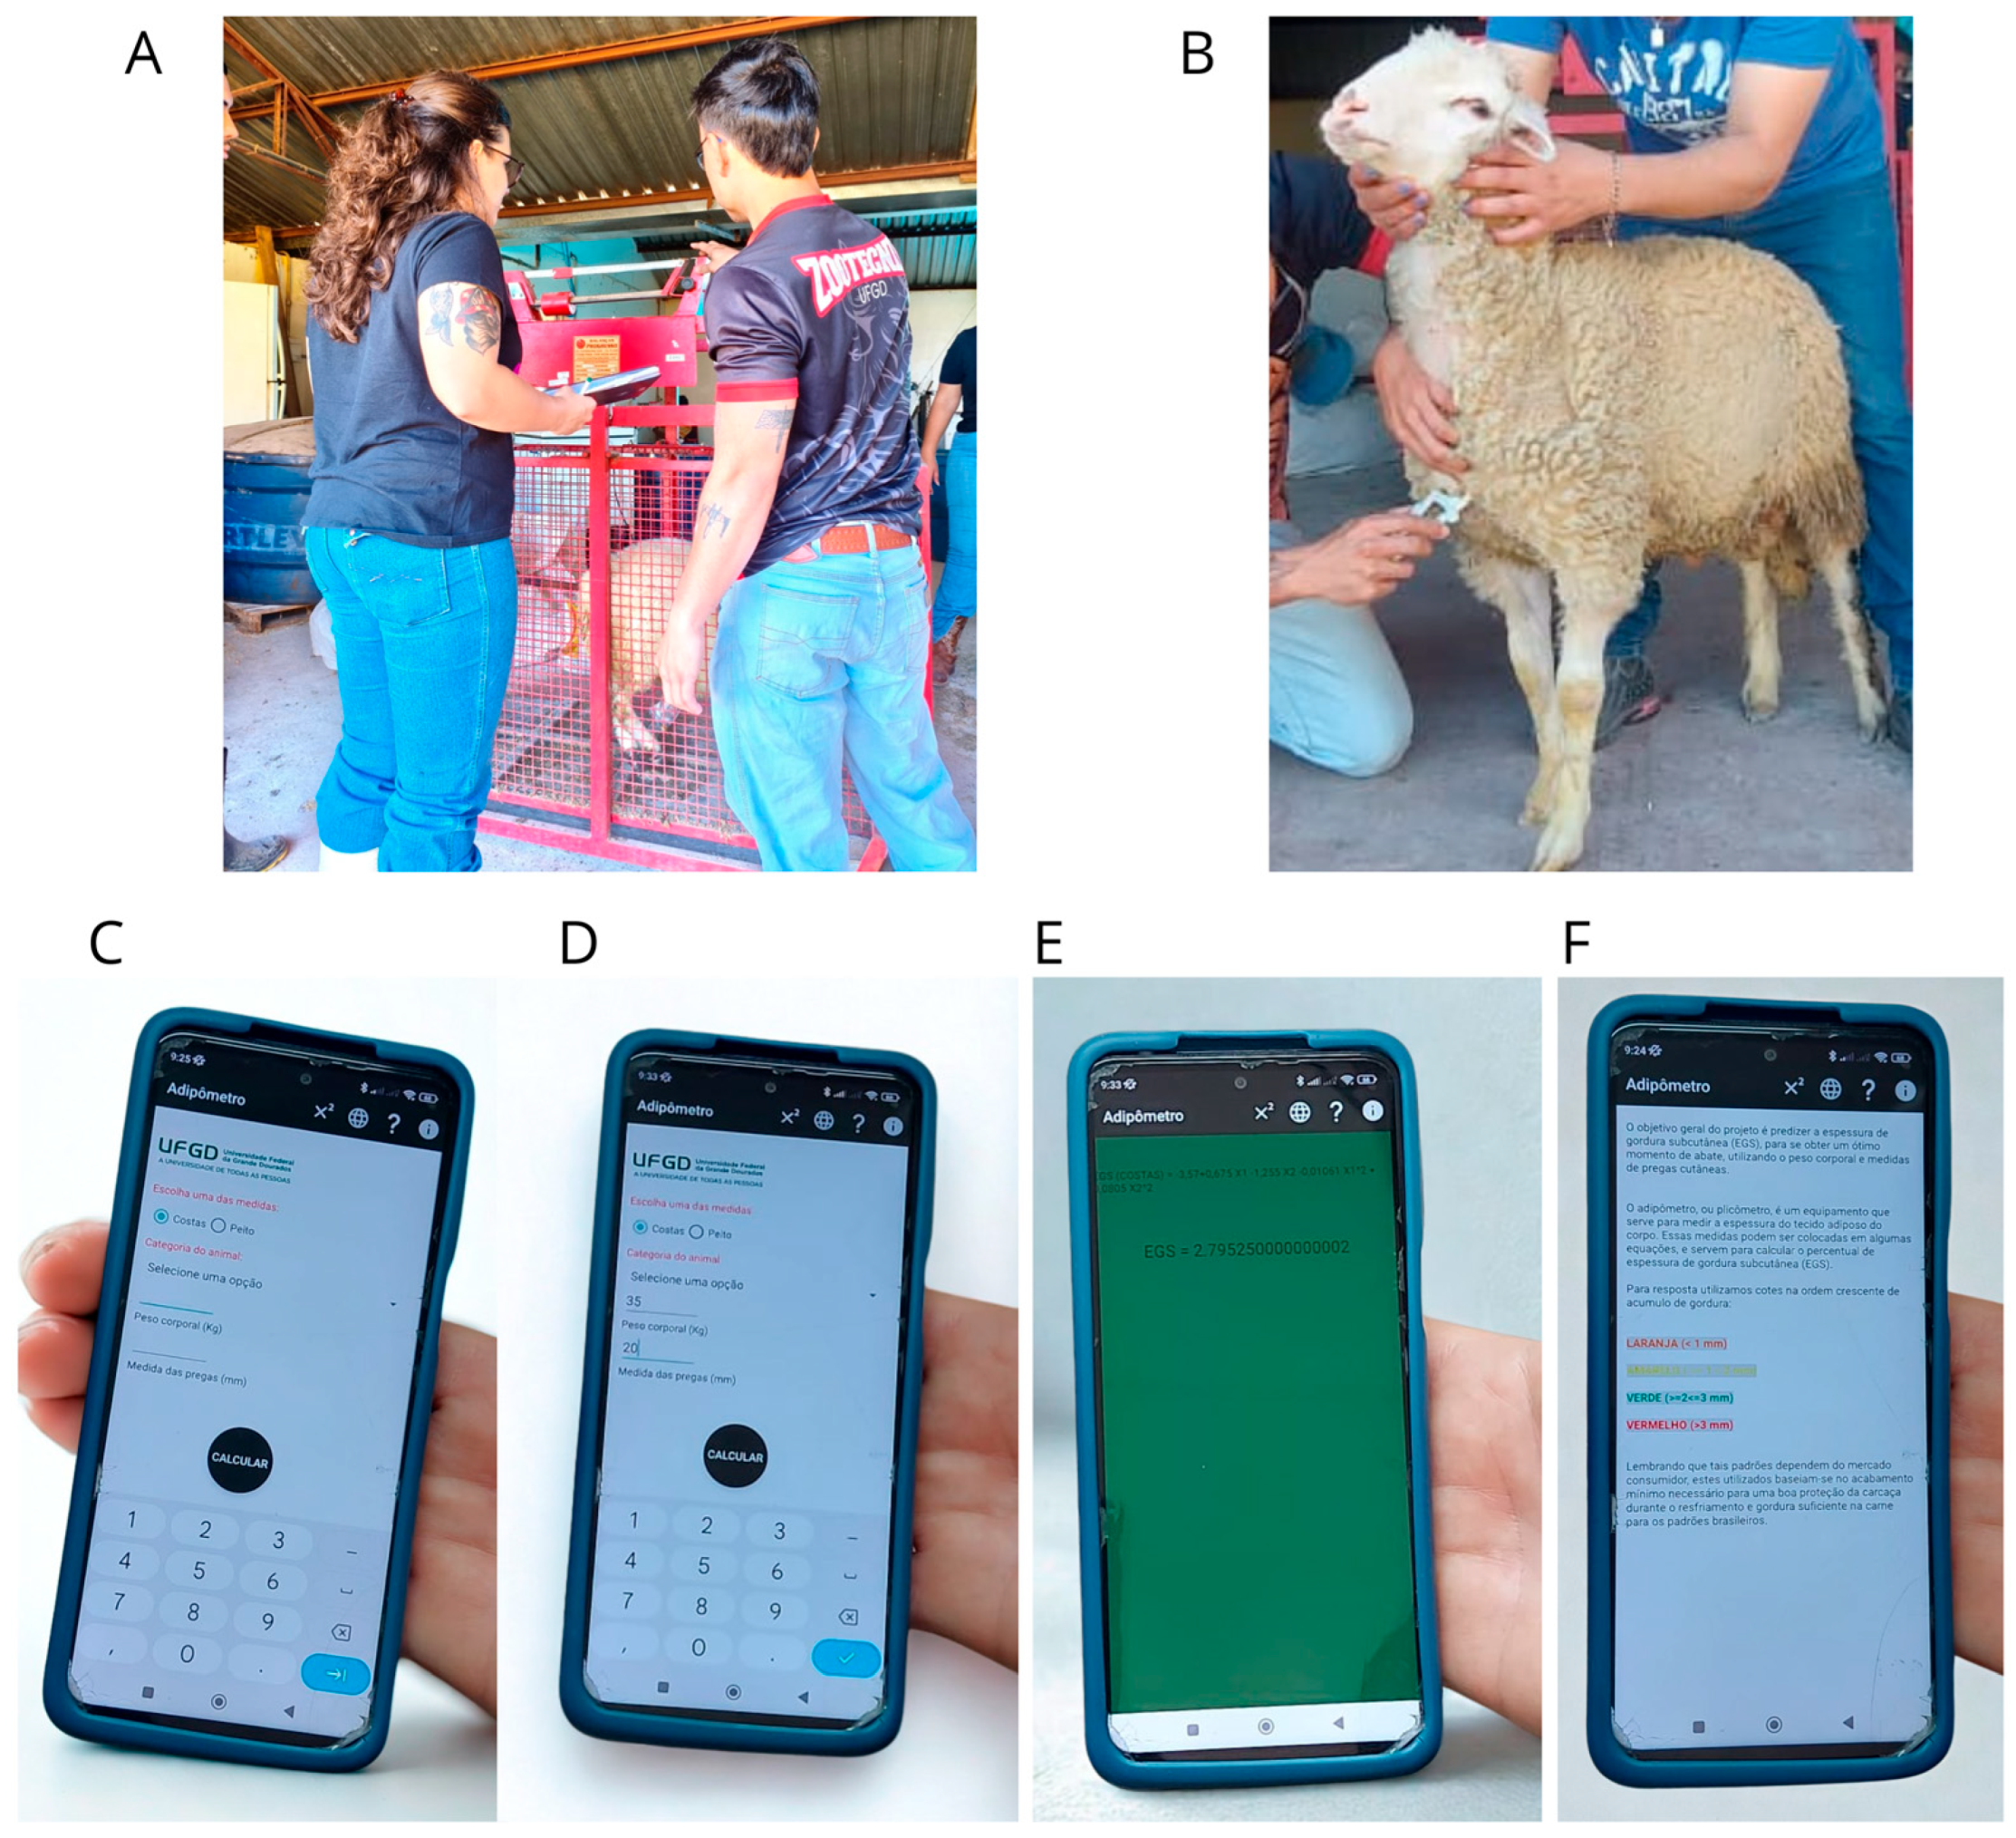
Additionally, Figure 6 illustrates the real interface of the mobile application along with the field measurement procedures performed on Pantaneiro lambs to generate the predictive models (Table 3). To assist users in using the application, an informational message was included explaining the meaning of the color codes displayed in the results, which indicate different categories of subcutaneous fat thickness for slaughter decision-making.

4. Discussion

4.1. Multivariate

Multivariate analysis serves as a valuable tool for phenotypic characterization of animals, particularly because it allows for the simultaneous consideration of multiple variables, providing a more comprehensive understanding of phenotypic profiles than univariate approaches [28].
In this study, multivariate analysis proved robust in separating Pantaneiro lambs based on weight classes, demonstrating its effectiveness for phenotypic characterization of these animals. Among the evaluated variables, body weight (BW) showed particularly high discriminatory power between classes when considered independently and emerged as the primary predictor variable.
In contrast, the body condition score (BCS) and subcutaneous fat thickness (SFT) were insufficiently sensitive as standalone measures for group discrimination. Although BCS is widely used as a subjective indicator of body fat reserves [29], it can be influenced by factors such as age, physiological state (tissue deposition), and structural development [30,31], which limits its discriminatory power in young lambs. Similarly, SFT exhibited substantial variation during the early growth stages, reducing its sensitivity for classification purposes.
The hierarchical clustering pattern (Figure 5) supports growth progression occurring in adjacent class pairs (A-B and C-D), which is likely associated with distinct tissue physiological phases. In summary, the four-class lamb classification system remained consistent when either body weight (BW) alone or all variables combined were considered in the analysis, with BW emerging as the key determinant of intra-group homogeneity and inter-group heterogeneity. These factors were only noticed because the design of this research included a wide range of body weights of different animals in its sampling, very different from what is found in the literature, the studies in which generally work with a final body weight and very similar ages, resulting in models with a good termination coefficient but practical limitations in use due to the small sample range used.
It is important to emphasize that this study represents a pilot approach, and the primary objective was to evaluate the applicability of multivariate exploratory methods and predictive models for subcutaneous fat thickness (SFT) in young Pantaneiro lambs, a category that holds significant relevance for the meat market due to its favorable characteristics related to carcass quality and consumer preference for younger animals. The Pantaneiro breed was intentionally selected as a biological model, given its recognized genetic variability and adaptive traits [32,33], which make it particularly suitable for exploratory studies aimed at developing generalizable analytical frameworks. The formation of distinct clusters, even within a relatively narrow age range, further reinforces the intrinsic phenotypic diversity of this population, providing a robust testing ground for validating statistical approaches.

4.2. Univariate

Statistically significant differences between group means validated the effectiveness of the adopted classification system. The absence of significant differences in subcutaneous fat thickness (SFT) between specific class pairs indicates that fat deposition does not linearly follow weight gain during early growth stages.
The weak correlation between SFT and body weight (BW), particularly in lighter lambs, may be attributed to the caudal fat deposition pattern, which typically occurs during later developmental stages. In woolless sheep breeds (e.g., African genotypes), fat accumulation is more pronounced [34,35], whereas in wooly Iberian breeds, the process tends to be delayed and less evident in young animals.
Given the high genetic variability of this population, weight-based stratification revealed distinct growth responses. Understanding tissue growth curves is essential for production optimization, as it enables the determination of the optimal slaughter time based on muscle, bone, and fat development rates [36]. Growth curves demonstrate that while muscle and bone growth occur at proportionally slower rates relative to carcass weight, fat accumulation accelerates during the later phases [2].
Most variable correlations were statistically significant (p < 0.01), with moderate-to-strong magnitudes. The exception was the BW-SFT correlation, which showed a low magnitude and no significance (p > 0.05), likely reflecting limited subcutaneous fat deposition during early growth. This supports the hypothesis that SFT alone has limited sensitivity in young lambs. Further evidence comes from BW means, which were similar across classes A, B, and C (p > 0.001) but differed significantly in class D (p < 0.001), suggesting more pronounced physiological changes occur only during final growth stages.
It is worth highlighting that the biological patterns observed here are consistent with the expected growth physiology of lambs, where lean tissue develops (muscle and bone) predominantly during early stages of life, since these are tissues classified as early maturing tissues. Muscle growth is characterized by the fact that the number of muscle fibers is determined prenatally, while postnatal growth occurs primarily through hypertrophy, i.e., an increase in the size of existing fibers [37,38].
Similarly, bone growth is more intense during the early life stages, supporting skeletal development to sustain subsequent tissue accretion. In contrast, fat deposition (adipogenesis) is a late-maturing process, becoming more expressive as the animal approaches physiological maturity. Although the number of adipocytes increases mainly from prenatal development until approximately one year of age, the substantial accumulation of fat occurs predominantly in later growth phases, when the animal’s metabolic priority shifts from lean tissue growth to energy reserve deposition [38,39].

4.3. Predictive Regressions

The exclusion of body condition score (BCS) from the regression models highlights its limitation as an isolated predictor of subcutaneous fat thickness (SFT), particularly in young lambs. On the other hand, the combined use of variables such as body weight (BW), lumbar skinfold thickness (LST), and brisket skinfold thickness (BST) allowed for the development of more accurate models. The first equation, based on BW and LST, showed a higher coefficient of determination (R2), indicating a better statistical fit. However, the second equation, which includes BW and BST, favors field application due to the greater ease of measuring the brisket region in wool-bearing sheep.
The selection of two equations based on skinfold measurements is aimed at balancing precision and practical applicability. This approach aligns with the findings of Thapar et al. [40], who, in studying body weight prediction in pigs, emphasized that more complex models with multiple predictors tend to provide greater accuracy, whereas simpler models may be preferable in contexts where speed and ease of application are prioritized. Similarly, studies such as Ref. [41] demonstrated that equations developed using digital image analysis in Pelibuey sheep, although of moderate accuracy, were effective in field settings because of their emphasis on non-invasive and low-cost methods. Thus, the decision to adopt two models, one more precise and one more practical, is well supported.
The applicability of these equations was enhanced by the development of the “Slaughter Point Lambs” app (Figure 2), a free and open access tool that enables in-field prediction of subcutaneous fat thickness (SFT) in lambs. The availability of this technology contributes to the modernization of production systems, promotes the valorization of regional biotypes, and supports the rational use of local genetic resources, aligning scientific advancement with sustainable livestock production.
Although some simple regression models showed statistical significance, their coefficients of determination were considered low (e.g., BST, R2 = 17.00; LST, R2 = 20.38), reinforcing the superiority of the multiple regression models adopted. The equation based on BW and LST showed the best performance (R2 = 55.44), whereas the equation using BW and BST (R2 = 43.73) stood out because of its practicality for field application. These findings emphasize the relevance of skinfold measurements, especially when combined with body weight, for predicting subcutaneous fat thickness in Pantaneiro lambs.
Despite its potential, the current version of the “Slaughter Point Lambs” application remains in a preliminary stage and requires further development to improve robustness and usability. Although the predictive models employed are statistically reliable, external validation using independent datasets and diverse production environments is necessary to ensure their generalizability across different genetic groups. Additionally, the app currently assumes that users have access to precise live weight and skinfold thickness measurements, which may limit its practical use among small-scale or resource-limited producers. Future versions should incorporate offline functionality and allow for real-time data acquisition through digital scales or imaging technologies. As user accessibility plays a critical role in the successful adoption of predictive tools [42], enhancements such as voice assistance, pictorial interfaces, and multilingual support would further facilitate adoption in extensive systems.
In summary, this study should be understood as a methodological prototype, whose primary contribution lies in demonstrating the feasibility of combining phenotypic measurements and predictive modeling to support precision livestock practices. The insights gained here form the basis for scaling the approach to broader populations and integrating complementary technologies in future iterations. While the Pantaneiro breed serves as a valuable biological model in this initial stage, the long-term goal is to support the development of decision-support systems that are applicable to diverse production systems, enhancing the efficiency and sustainability of sheep farming in different contexts.
Overall, the application demonstrates a valuable contribution to precision livestock farming, and its broader impact will depend on iterative refinement, participatory feedback from end-users, and integration with comprehensive decision-support systems.

5. Conclusions

Technologies combined with traditional measures, such as body weight, often used as the sole parameter for determining slaughter readiness, represent a promising alternative for production systems aimed at optimizing and enhancing the value of sheep carcasses.
The Slaughter Point Lambs tool, developed based on the findings of this study, contributes to the democratization of technology access in rural areas, enabling more accurate, objective, and accessible decision-making. Future updates to the app, including variables such as age category, breed, and even its adaptation to other species, could significantly broaden its impact within the production sector, further strengthening the interface between science and livestock practice.

Author Contributions

Conceptualization, A.L.A.d.S., H.A.R. and F.M.d.V.J.; methodology, A.L.A.d.S., H.A.R., M.V.P.d.S., M.R.d.S. and F.M.d.V.J.; software, A.L.A.d.S., M.C.d.S. and M.V.P.d.S.; validation, A.L.A.d.S., M.C.d.S., H.A.R., M.R.d.S., N.M.V.d.S. and F.M.d.V.J.; formal analysis, A.L.A.d.S. and M.V.P.d.S.; investigation, A.L.A.d.S., M.C.d.S., M.V.P.d.S., M.R.d.S. and F.M.d.V.J.; resources, F.M.d.V.J.; data curation, A.L.A.d.S.; writing—original draft preparation, A.L.A.d.S.; writing—review and editing, A.L.A.d.S., N.M.V.d.S. and F.M.d.V.J.; visualization, A.L.A.d.S., N.M.V.d.S. and F.M.d.V.J.; supervision, F.M.d.V.J.; project administration, F.M.d.V.J.; funding acquisition, F.M.d.V.J. All authors have read and agreed to the published version of the manuscript.

Funding

This work was supported by Coordination for the Improvement of Higher Education Personnel—CAPES (Scholarship, PNPD, PROAP); the Foundation for the Support of Education, Science, and Technology Development in the State of Mato Grosso do Sul—FUNDECT (Edital Chamada Fundect Nº 31/2021—Universal 2021—Processo Nº:71/039.195/2022, Projeto FUNDECT Nº 355/2022, Nº SIAFEM 32366); and the National Council for Scientific and Technological Development—CNPQ (IC Scholarshipand, PQ Research).

Data Availability Statement

The data collected and the analyses performed may be made available upon request directly to the corresponding author of this article.

Acknowledgments

The authors thank the Ovinotecnia research group of the Federal University of Grande Dourados and extend their thanks to Wagner Silva, who developed the APP and the SISPEC network (Network of Smart and Sustainable Livestock Systems, funded by CYTED ref. 125RT0167).

Conflicts of Interest

The authors declare that they have no known competing financial interests or personal relationships that could have appeared to influence the work reported in this paper.

References

  1. Khan, R.; Li, A.; Raza, S.H.A. Editorial: Genetic Regulation of Meat Quality Traits in Livestock Species. Front. Genet. 2023, 13, 1092562. [Google Scholar] [CrossRef] [PubMed]
  2. da Silveira Osório, J.C.; Osório, M.T.M.; Fernandes, A.R.M.; de Oliveira Seno, L.; de Almeida Ricardo, H.; Rossini, F.C.; Junior, M.A.P.O. Revista Agrária Critérios para abate do animal e a qualidade da carne Critérios para abate de animais e qualidade da carne. Agrarian 2012, 5, 433–443. [Google Scholar]
  3. Alves, L.G.C.; Cunha, C.M.; da Fernandes, A.R.M.; de Vargas Junior, F.M.; Hirata, A.S.O.; Paes, M.R.S.; Messa, R.S. Perfil do consumidor de carne ovina na cidade de Dourados—MS. Agrarian 2017, 10, 289–293. [Google Scholar] [CrossRef]
  4. Alves, L.G.C.; de Azambuja Ribeiro, E.L.; Fernandes, A.R.M.; de Vargas Junior, F.M.; Hirata, A.S.O.; da Cunha, C.M. Predição das características na carne de cordeiros comerciais e pantaneiros por meio das medidas in vivo e na carcaça. Agrarian 2021, 14, 244–259. [Google Scholar] [CrossRef]
  5. Junior, F.M.V.; Martins, C.F.; Feijó, G.L.D.; Teixeira, A.; Leonardo, A.P.; Ricardo, H.d.A.; Fernandes, A.R.M.; Reis, F.A. Evaluation of genotype on fatty acid profile and sensory of meat of indigenous Pantaneiro sheep and Texel or Santa Inês crossbred finished on feedlot. Small Rumin. Res. 2019, 173, 17–22. [Google Scholar] [CrossRef]
  6. Mora, N.; Macedo, F.; Mexia, A.; Dias-Senegalhe, F.; Oliveira, E.; Radis, A. Características de carcaça de cordeiras Pantaneiras abatidas com diferentes espessuras de gordura subcutânea. Arq. Bras. Med. Vet. Zootec. 2015, 67, 290–298. [Google Scholar] [CrossRef]
  7. Osório, J.D.S. Produção de Carne Ovina: Técnicas de Avaliação ”In Vivo” e na Carcaça; Universidade Federal de Pelotas: Pelotas, Brazil, 2003. [Google Scholar]
  8. Amaral, R.M.; Fonseca de Macedo, F.; Alcalde, C.R.; Lino, D.A.; Bánkuti, F.; De Macedo, F.; Dias, F.; Gualda, T. Desempenho produtivo e econômico de cordeiros confinados abatidos com três espessuras de gordura. Rev. Bras. Saúde E Produção Anim. 2011, 12, 1948. [Google Scholar]
  9. Zabelina, M.V.; Amiyan, A.A. Evaluation of the slaughter indicators of the Edilbaevsky sheep breed depending on the milk productivity of sheep. Agrar. Sci. 2024, 1, 112–117. (In Russian) [Google Scholar] [CrossRef]
  10. Begeyeva, M.K.; Alseitova, M.A. Innovative technologies in sheep breeding: Economic efficiency. Probl. AgriMarket 2021, 2, 108–115. [Google Scholar] [CrossRef]
  11. Wang, D.; Jia, H.; Du, Y.; Liu, Y. Effects of sodium humate and glutamine on growth performance, diarrhoea incidence, blood parameters, and faecal microflora of pre-weaned calves. J. Anim. Physiol. Anim. Nutr. 2023, 107, 103–112. [Google Scholar] [CrossRef] [PubMed]
  12. McManus, C.; Paim, T.D.P.; Louvandini, H.; Dallago, B.; Dias, L.T.; Teixeira, R.A. Avaliação ultrasonográfica da qualidade de carcaça de ovinos santa inês. Cienc. Anim. Bras. 2013, 14, 8–16. [Google Scholar] [CrossRef]
  13. Grill, L.; Ringdorfer, F.; Baumung, R.; Fuerst-Waltl, B. Evaluation of ultrasound scanning to predict carcass composition of Austrian meat sheep. Small Rumin. Res. 2015, 123, 260–268. [Google Scholar] [CrossRef]
  14. Hosseini Vardanjani, S.M.; Ashtiani, S.R.M.; Pakdel, A.; Shahrbabak, H.M. Accuracy of real-time ultrasonography in assessing carcass traits in Torki-Ghashghaii sheep. J. Agric. Sci. Technol. 2014, 16, 791–800. [Google Scholar]
  15. de Vargas, F.M.; Fernandes, T.; de Matos, A.T.; Fernandes, A.R.M.; Alves, L.G.C.; Rossatti, J.A.; Britez, G.D.V.; Zagonel, N.G.T. Evaluator effect on the ultrasound measurement of subcutaneous fat deposition and loin eye area from weaning to slaughter lambs. Vet. World 2021, 14, 259–264. [Google Scholar] [CrossRef]
  16. Vărzaru, A.A. Digital Revolution in Agriculture: Using Predictive Models to Enhance Agricultural Performance Through Digital Technology. Agriculture 2025, 15, 258. [Google Scholar] [CrossRef]
  17. Cavazza, A.; Dal Mas, F.; Paoloni, P.; Manzo, M. Artificial intelligence and new business models in agriculture: A structured literature review and future research agenda. Br. Food J. 2023, 125, 436–461. [Google Scholar] [CrossRef]
  18. Swain, K.P.; Mohapatra, S.K.; Sahoo, S.K. Enhancing predictive modeling across industries with automated machine learning: Applications in insurance and agriculture. Discov. Sustain. 2025, 6, 167. [Google Scholar] [CrossRef]
  19. Arshad, M.F.; Burrai, G.P.; Varcasia, A.; Sini, M.F.; Ahmed, F.; Lai, G.; Polinas, M.; Antuofermo, E.; Tamponi, C.; Cocco, R.; et al. The groundbreaking impact of digitalization and artificial intelligence in sheep farming. Res. Vet. Sci. 2024, 170, 105197. [Google Scholar] [CrossRef] [PubMed]
  20. Cramer, C.; Sender, J.; Oqubay, A. African Economic Development: Evidence, Theory, Policy, by Christopher Cramer, John Sender Arkebe Oqubay; Oxford University Press: Oxford, UK, 2020; Available online: https://library.oapen.org/handle/20.500.12657/41802 (accessed on 17 June 2025).
  21. IBGE (2024) Municipal Livestock Research, Statistics, I.B.d.G.e.E, Brazil. Available online: https://cidades.ibge.gov.br/brasil/ms/dourados/panorama (accessed on 17 June 2025).
  22. Hirata, A.S.O.; Fernandes, A.R.M.; Fuzikawa, I.H.d.S.; Junior, F.M.d.V.; Ricardo, H.D.A.; Cardoso, C.A.L.; Alves, L.G.C.; Zagonel, N.G.T. Meat quality of Pantaneiro lambs at different body weights. Semin. Cienc. Agrar. 2019, 40, 427–442. [Google Scholar] [CrossRef]
  23. Russel, A.J.F.; Doney, J.M.; Gunn, R.G. Subjective assessment of body fat in live sheep. J. Agric. Sci. 1969, 72, 451–454. [Google Scholar] [CrossRef]
  24. National Research Council (NRC). Nutrient Requirements of Small Ruminants: Sheep, Goats, Cervids, and New World Camelids; The National Academies Press: Washington, DC, USA, 2007. [Google Scholar] [CrossRef]
  25. Ministério da Agricultura e do Abastecimento (MAPA). Instrução Normativa nº 3, de 17 de janeiro de 2000. Aprova o Regulamento Técnico de Métodos de Insensibilização para o Abate Humanitário de Animais de Açougue. Diário Oficial da União, Brasília, DF, 24 jan. 2000. Seção 1. pp. 14–16. Available online: https://www.gov.br/agricultura/pt-br/assuntos/defesa-agropecuaria/animal/bem-estar-animal/arquivos/arquivos-legislacao/in-03-de-2000.pdf/view (accessed on 17 June 2025).
  26. SAS Institute Inc. SAS User´s Guide for Windows Environment, 9th ed.; SAS Institute Inc. SAS: Cary, NC, USA, 2002. [Google Scholar]
  27. Minitab, version 16. Minitab INC Minitab 16 Statistical Software. Minitab Inc.: State College, PA, USA, 2010.
  28. de Barros Nascimento de Medeiros, R.; Arandas, J.K.G.; Cavalcante, P.O.S.; da Silva, N.M.V.; de Oliveira, J.C.V.; Ribeiro, M.N. Is multivariate analysis a useful tool to assess the morphometric profile of endangered goats? Small Rumin. Res. 2020, 190, 106175. [Google Scholar] [CrossRef]
  29. Sood, V.; Rodas-González, A.; Valente, T.S.; Li, C.; Vinsky, M.; Lam, S.; López-Campos, Ó.; Segura, J.; Basarab, J.; Juárez, M. Estimation of genetic parameters for primal tissue component traits in commercial crossbred beef cattle. Meat Sci. 2023, 202, 109200. [Google Scholar] [CrossRef]
  30. Gao, K.; Han, S.; Li, Z.; Luo, Z.; Lv, S.; Choe, H.M.; Paek, H.J.; Quan, B.; Kang, J.; Yin, X. Analysis of metabolome and transcriptome of longissimus thoracis and subcutaneous adipose tissues reveals the regulatory mechanism of meat quality in MSTN mutant castrated male finishing pigs. Meat Sci. 2024, 207, 109370. [Google Scholar] [CrossRef] [PubMed]
  31. Bautista-Gómez, L.; Martínez-Castañeda, S. Identification of mitochondrial DNA transfer in canine transmissible venereal tumours obtained from dogs in Mexico. Mitochondrial DNA Part A 2016, 28, 645–649. [Google Scholar] [CrossRef]
  32. de Sousa, L.A.; de Araujo, A.M.; Sobrinho, F.d.A.D.; Bajay, M.M.; Juliano, R.S.; Reis, F.A.; Ferreira, M.B.; Vega-Britez, G.D.; Junior, F.M.d.V. SNP Markers: Analysis of Genetic Diversity and Identification of Genomic Regions in Pantaneiro Sheep and Texel Sheep Under Natural Selection. Front. Biosci. 2024, 16, 18. [Google Scholar] [CrossRef]
  33. Crispim, B.; Grisolia, A.; Seno, L.; Egito, A.; Junior, F.V.; Souza, M. Genetic diversity of locally adapted sheep from Pantanal region of Mato Grosso do Sul. Genet. Molecul. Res. 2013, 12, 5458–5466. [Google Scholar] [CrossRef]
  34. Nigussie, H.; Pal, S.K.; Diriba, S.; Mekasha, Y.; Kebede, K.; Abegaz, S. Phenotypic variation and protein polymorphism of indigenous sheep breeds in eastern Ethiopia. Livest. Res. Rural. Dev. 2016, 28, 139. [Google Scholar]
  35. Lérias, J.R.; Kilminster, T.; Scanlon, T.; Milton, J.; Oldham, C.; Greeff, J.C.; Martins, L.L.; Mourato, M.P.; Almeida, A.M. The fat-tail of Damara sheep: An assessment of mineral content as influenced by weight loss. Anim. Prod. Sci. 2016, 56, 1492–1495. [Google Scholar] [CrossRef]
  36. Hashimoto, J.H.; Osório, J.C.d.S.; Osório, M.T.M.; Bonacina, M.S.; Lehmen, R.I.; Pedroso, C.E.d.S. Carcass quality, parts and tissue development of lambs finished in three systems. Rev. Bras. Zootec. 2012, 41, 438–448. [Google Scholar] [CrossRef]
  37. Al-Sherwany, D.A.O.; Alkass, J.E.; Prof, A. Allometric growth patterns of body and carcass component in docked and intact Karadi lambs. Iraqi. J. Agric. Sci. 2023, 54, 1163–1172. [Google Scholar] [CrossRef]
  38. Bonnet, M.; Cassar-Malek, I.; Chilliard, Y.; Picard, B. Ontogenesis of muscle and adipose tissues and their interactions in ruminants and other species. Animal 2010, 4, 1093–1109. [Google Scholar] [CrossRef] [PubMed]
  39. Pannier, L.; Pethick, D.; Geesink, G.; Ball, A.; Jacob, R.; Gardner, G. Intramuscular fat in the longissimus muscle is reduced in lambs from sires selected for leanness. Meat Sci. 2014, 96, 1068–1075. [Google Scholar] [CrossRef]
  40. Thapar, G.; Biswas, T.K.; Bhushan, B.; Naskar, S.; Kumar, A.; Dandapat, P.; Rokhade, J. Accurate estimation of body weight of pigs through smartphone image measurement app. Smart Agric. Technol. 2023, 4, 100194. [Google Scholar] [CrossRef]
  41. Chay-Canul, A.J.; González, J.T.; Canul-Solís, J.; Casanova-Lugo, F.; Piñeiro-Vázquez, Á.T.; Portillo-Salgado, R.; García-Herrera, R.; Vargas-Bello-Pérez, E. Predictive biometrics of hair sheep through digital imaging. Vet. Mex. OA 2023, 10, 11. [Google Scholar] [CrossRef]
  42. Wang, S.; Veldhuis, R.; Brune, C.; Strisciuglio, N. A Survey on the Robustness of Computer Vision Models against Common Corruptions. arXiv 2023, arXiv:230506024. [Google Scholar] [CrossRef]
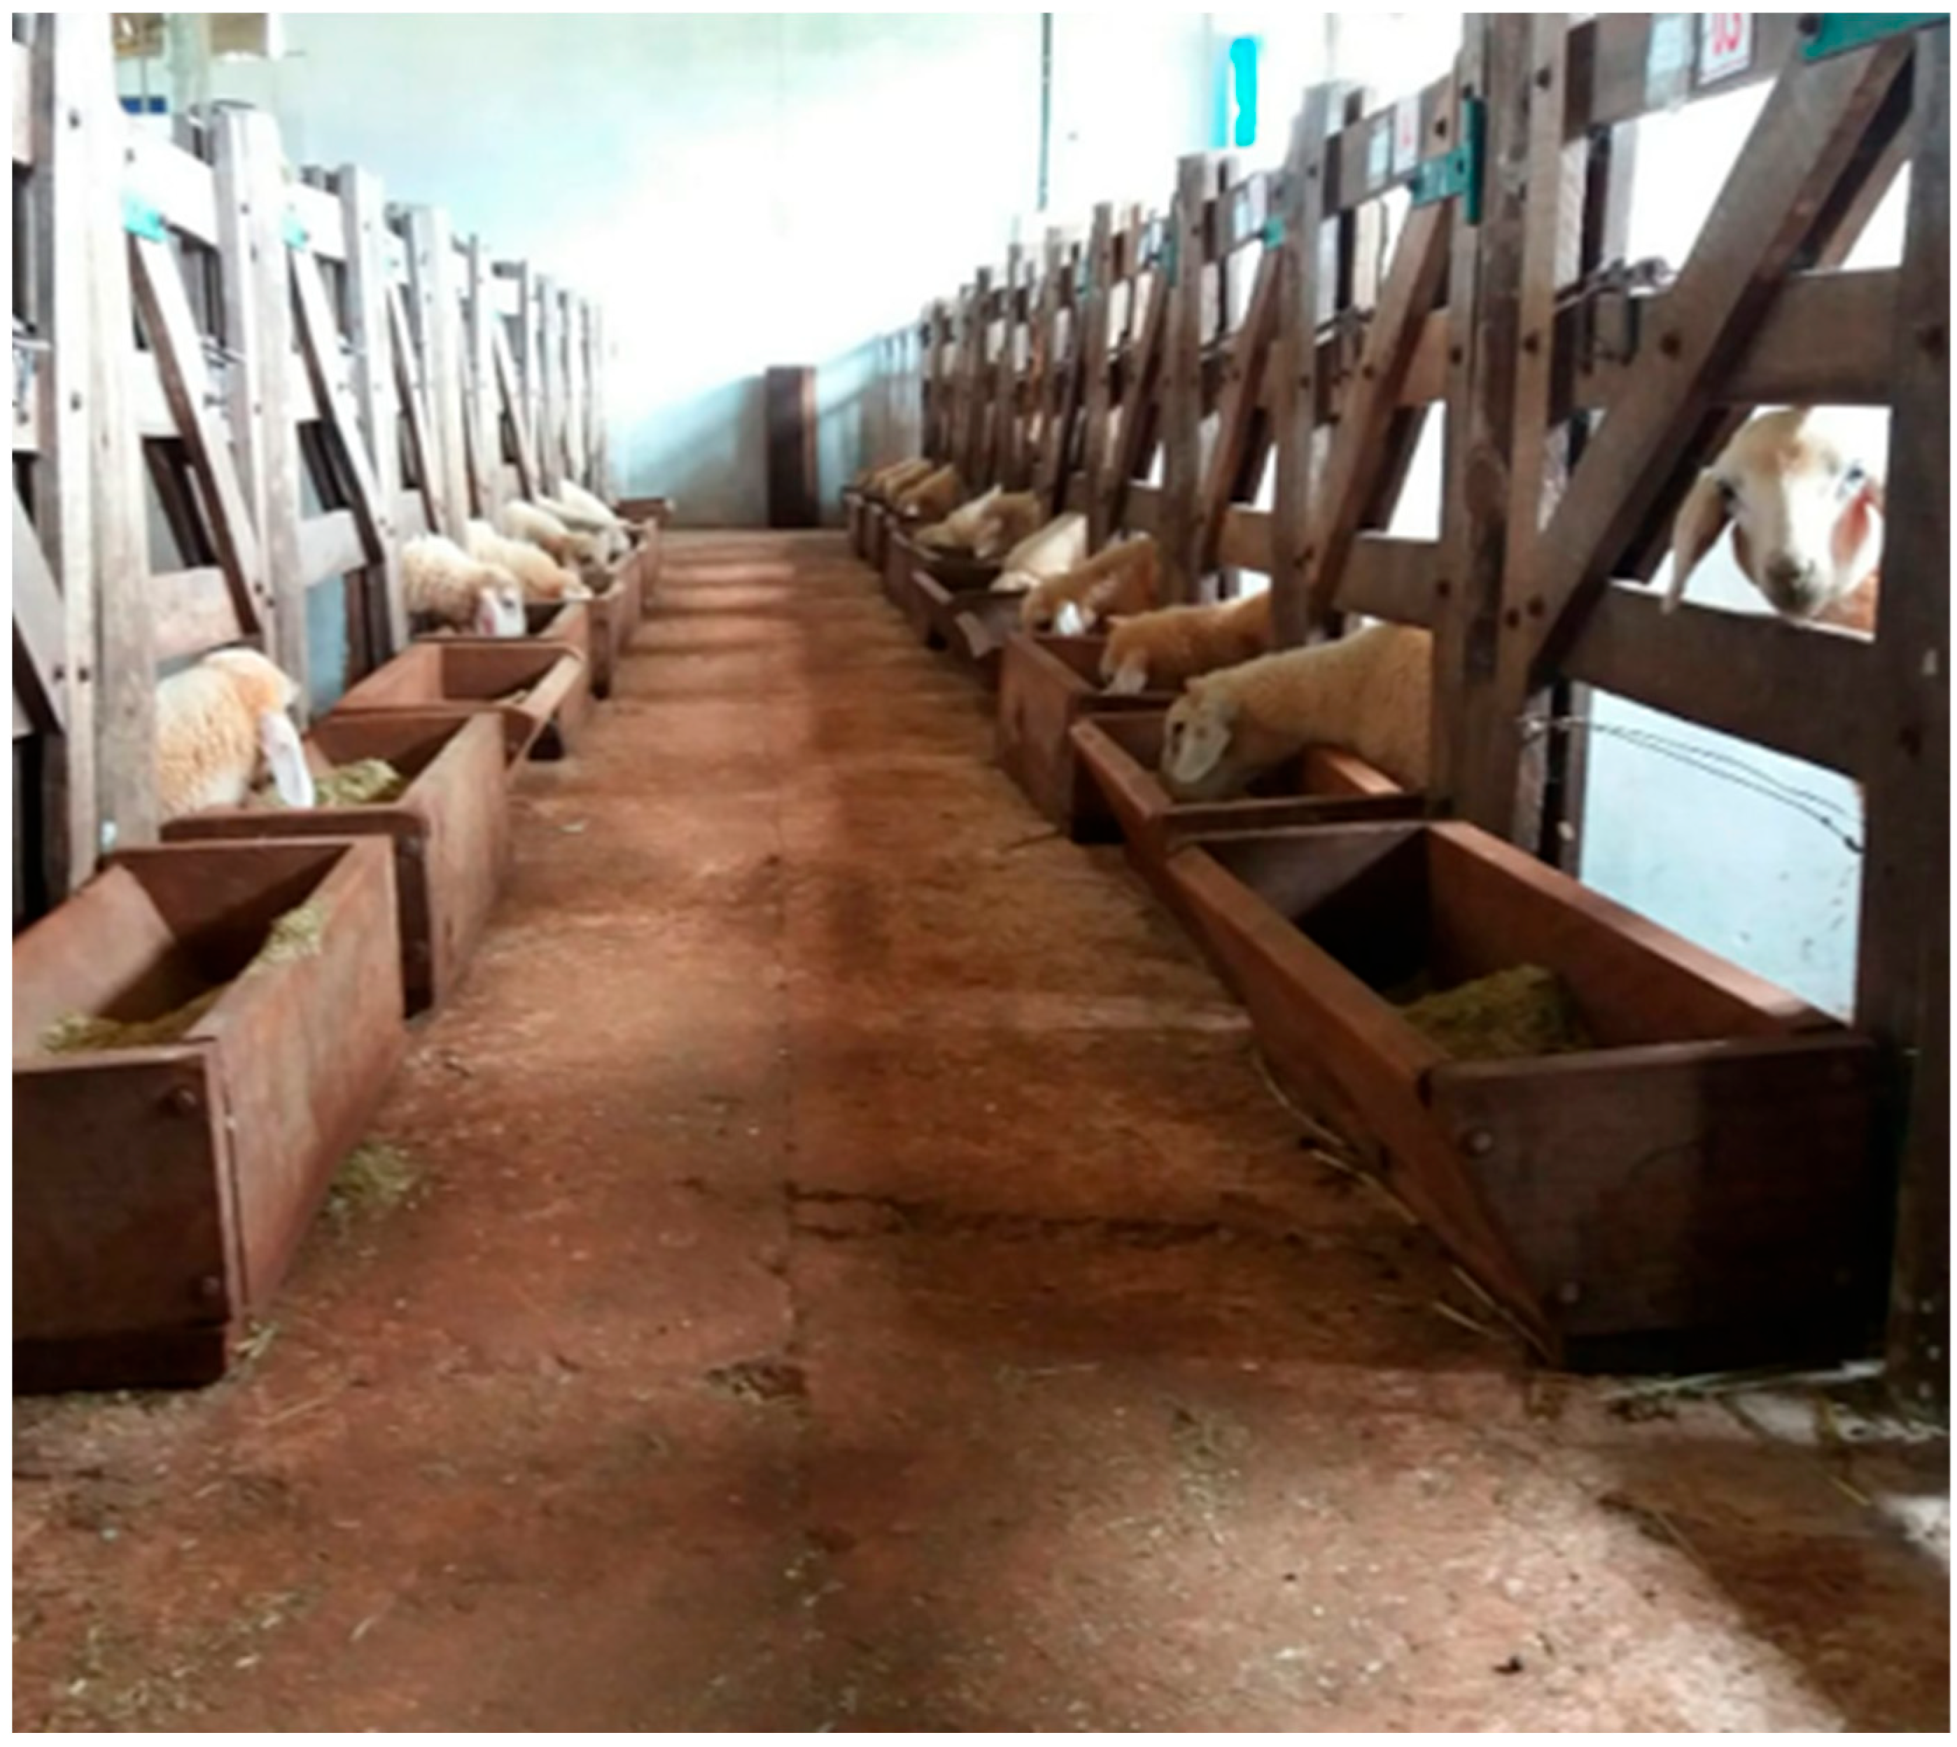
Figure 1. Pantaneiro lambs housed in individual pens (2 m2 each) with individual feeders and nipple drinkers during the feeding trial at the Sheep Research Center, Federal University of Grande Dourados (UFGD), Brazil.
Agriengineering 07 00251 g001
Figure 2. Instruments and measurement sites for subcutaneous fat thickness (SFT): (a) Prime Med DC + digital adipometer for in vivo measurement; (b) anatomical measurement sites (as shown in the image: lumbar region, brisket, and tail base); (c) caliper used for direct SFT measurement on the carcass.
Agriengineering 07 00251 g002
Figure 3. Morphological classification of Pantaneiro lamb biotypes used in the experimental evaluation: Biotype A, Biotype B, Biotype C, and Biotype D. Photos taken during pre-slaughter biometric characterization.
Agriengineering 07 00251 g003
Figure 4. Interface of the Slaughter Point Lambs mobile application. Predicted SFT (subcutaneous fat thickness, mm) classification outputs. (a) Below target range: SFT < 1 mm; (b) intermediate range: 1 ≤ SFT < 2 mm; (c) optimal range: 2 ≤ SFT < 3 mm; and (d) above target range: SFT ≥ 3 mm. Note: The application interface is currently in Portuguese.
Agriengineering 07 00251 g004
Figure 5. Dendrogram of the distance between body weight classes in Pantaneiros lambs.
Agriengineering 07 00251 g005
Figure 6. Field procedures and screenshots of the mobile application used to predict slaughter point in Pantaneiro lambs. (A) Body weight measurement using a scale; (B) measurement of subcutaneous fat thickness in the brisket region using a skinfold caliper; (C) slaughter Point Lambs application home screen; (D) data input interface for body weight and skinfold thickness; (E) output screen displaying predicted subcutaneous fat thickness (SFT); (F) information screen explaining the color codes used in the results, where each color indicates different recommended management decisions for the ideal slaughter point.
Agriengineering 07 00251 g006
Table 1. Ingredients and chemical composition of experimental diet (% DM).
Ingredients (%)Diet
Ground oat hay 20.0
Ground corn grain55.0
Wheat bran 16.0
Soybean meal 4.0
Urea 2.0
Mineral premix + Ionophore 3.0
Chemical composition (%)
Dry matter87.4
Crude protein 15.9
Ether extract 3.2
Ash 3.5
Neutral detergent fiber 32.9
Acid detergent fiber11.6
Total digestible nutrients 71.7
Manufacturer’s warranty levels (per kg): Calcium (Min/Max) 12.0/18.0 g, Cobalt (Min) 1.4 mg, Copper (Min) 20 mg, Sulfur (Min) 1500.0 mg, Phosphorus (Min) 6000.0 mg, Iode (Min) 3.6 mg, Manganese (Min) 39.6 mg, Sodium Monensin 50.0 mg, Selenium (Min) 0.48 mg, Sodium (Min) 3700.0 mg, Zinc (Min) 143.23 mg, Saccharomyces cerevisiae 6.25 × 10⁶ CFU. Source: [15].
Table 2. Mean weight, body condition, skinfold measurements, and subcutaneous fat thickness in Pantaneiros lambs of different classes.
Classes
VariableABCDEPMp-Value
Body weight (kg)16.79 ± 1.56 d20.91 ± 1.19 c27.23 ± 1.56 b34.43 ± 2.78 a3.91<0.0001
BCS1.68 ± 0.17 d2.08 ± 0.25 c2.58 ± 0.3 b2.91 ± 0.45 a0.11<0.0001
BST5.27 ± 1.06 c6.14 ± 0.85 b7.84 ± 2.48 b9.46 ± 2.16 b3.51<0.0001
LST4.26 ± 0.78 d6.06 ± 1.13 c6.74 ± 2.47 b9.10 ± 1.80 a3.06<0.0001
TST2.55 ± 0.48 b2.61 ± 0.61 b2.74 ± 0.51 b3.46 ± 0.51 a0.27<0.0001
SFT0.97 ± 0.31 b1.04 ± 0.42 b2.78 ± 1.25 a2.45 ± 1.07 a0.83<0.0001
BCS = body condition score; BST = skinfold of the brisket; LST = lumbar skinfold; TST = skinfold of the tail; SFT = subcutaneous fat thickness. EPM = standard error of the mean. Means followed by different letters, in the same line, differ by Duncan’s test (p < 0.001).
Table 3. Subcutaneous fat thickness prediction equations (EGS) chosen to be incorporated into an android application obtained from multiple regressions with weight, breast, skinfold, and lumbar data available online *.
Predictive Equations
(i) SFT = −4.16 + (0.717·BW) − (1.257·LST) − (0.01133·BW2) + (0.0805·LST2) R2 = 55.44 (p < 0.001)
(ii) SFT = −3.99 + (0.588·BW) − (0.716·BST) − (0.00958·BW2) + (0.0473·BST2) R2 = 43.73 (p < 0.001)
BW = body weight; LST = lumbar skinfold; BST = brisket skinfold. * the app is available online via download from the Play Store; it is titled “Slaughter Point Lambs”.
Disclaimer/Publisher’s Note: The statements, opinions and data contained in all publications are solely those of the individual author(s) and contributor(s) and not of MDPI and/or the editor(s). MDPI and/or the editor(s) disclaim responsibility for any injury to people or property resulting from any ideas, methods, instructions or products referred to in the content.