Abstract
In this study, we evaluated the spatial variability in droplet deposition in herbicide applications using a remotely piloted aircraft (RPA) in pasture areas. The investigation was conducted in a square grid (50.0 m × 50.0 m), with 121 sampling points, at two operational flight heights (3.0 and 4.0 m). Droplet deposition was quantified using the fluorescent dye rhodamine B, and the droplet spectrum was characterised using water-sensitive paper tags. Geostatistical analysis was implemented to characterise spatial dependence, complemented by multivariate statistical analysis. Droplet deposition ranged from 1.01 to 9.02 and 1.10–6.10 μL cm−2 at 3.0 and 4.0 m flight heights, respectively, with the coefficients of variation between 19.72 and 23.06% for droplet spectrum parameters. All droplet spectrum parameters exhibited a moderate to strong spatial dependence (relative nugget effect ≤75%) and a predominance of adjustment to the exponential model, with spatial dependence indices ranging from 12.55 to 47.49% between the two flight heights. Significant positive correlations were observed between droplet deposition and droplet spectrum parameters (r = 0.60–0.79 at 3.0 m; r = 0.37–0.66 at 4.0 m), with the correlation magnitude decreasing as the operational flight height increased. Cross-validation indices demonstrated acceptable accuracy in spatial prediction, with a mean estimation error ranging from −0.030 to 0.044 and a root mean square error ranging from 0.81 to 2.25 across parameters and flight heights. Principal component analysis explained 99.14 and 85.72% of the total variation at 3.0 and 4.0 m flight heights, respectively. The methodological integration of geostatistics and multivariate statistics provides a comprehensive understanding of the spatial variability in droplet deposition, with relevant implications for the optimisation of phytosanitary applications performed using RPAs.
1. Introduction
Phytosanitary management constitutes an essential pillar of contemporary agricultural production, as it ensures satisfactory levels of productivity and crop quality. An efficient application of phytosanitary products presents a constant challenge, particularly in terms of balancing agronomic efficacy, economic viability, and environmental sustainability. Historically, this application has been predominantly performed using conventional ground equipment, which, despite its widespread use, presents considerable operational restrictions in specific scenarios, such as terrain with irregular topography, soils with high moisture content, or areas with restricted access [1]. Additionally, this equipment frequently causes undesirable effects, such as soil compaction and mechanical damage to crops, compromising the sustainability of production systems [2].
In this evolving scenario, remotely piloted aircrafts (RPAs), also known as unmanned aerial vehicles or drones, have emerged as a promising technological alternative for the application of phytosanitary products, offering distinctive advantages. These advantages include a high operational capacity, the preservation of the physical structure of the soil, facilitated access to areas with topographical restrictions, and a significant reduction in operator exposure to potentially toxic compounds [3,4].
The precision agriculture paradigm has substantially transformed agricultural practices in recent decades by introducing technological approaches that enable localised and precise interventions, optimise input use, and minimise negative environmental impacts [3]. In this evolving scenario, RPAs have emerged as a promising technological alternative for applying phytosanitary products, offering distinctive advantages. These advantages include a high operational capacity, the preservation of the physical structure of the soil, facilitated access to areas with topographical restrictions, and a significant reduction in operator exposure to potentially toxic compounds [4,5].
The adoption of RPAs for phytosanitary applications has shown significant global growth, particularly in countries such as China, Japan, and Brazil, where certain characteristics, including rugged terrain and extensive cultivation, impose considerable limitations on conventional ground applications [6,7]. According to [8], the global market for agricultural RPAs is projected to expand at a compound annual growth rate of 31.1% between 2021 and 2026, driven by the increasing demand for precision technologies and the need to optimise productive resources.
Despite their evident advantages, the application of phytosanitary products using RPAs presents specific technical challenges, primarily associated with spatial heterogeneity in droplet deposition. This variability is impacted by multiple interrelated factors, including operational parameters, such as flight height and speed [8,9], technical characteristics of the equipment, including nozzle type and droplet size, meteorological conditions, and morphophysiological attributes of the target crop [10,11]. An in-depth elucidation of this spatial variability is essential for optimising application efficiency, ensuring the adequate coverage of biological targets, and minimising losses due to drift [12].
The spatial heterogeneity in droplet deposition in applications performed by RPAs represents a complex multifactorial phenomenon that is significantly influenced by the specific aerodynamic aspects of the equipment [13]. Unlike conventional ground sprayers, RPAs generate a downward airflow (downwash) produced by rotors, which substantially modifies the behaviour of the sprayed droplets. This phenomenon, termed the vortex effect, determinantly impacts the formation, dispersion, and deposition of droplets on a target [14]. Additionally, the interaction between the rotor generated airflow and local atmospheric conditions produces turbulence patterns that result in a spatially heterogeneous distribution of droplets, requiring appropriate characterisation and modelling to optimise application efficiency [15].
The spatial distribution patterns of droplets in RPA applications are fundamentally governed by complex interactions between the rotor-induced airflow dynamics and atmospheric boundary layer conditions [16]. Recent investigations have revealed that the downwash velocity field exhibits significant spatial heterogeneity, creating preferential deposition zones that vary according to flight altitude, forward speed, and nozzle positioning relative to the rotor plane [17]. The magnitude of the spatial variability in droplet deposition has been quantified based on coefficient of variation values ranging from 15 to 45% under typical operational conditions, with higher variability observed at increased flight heights than at low flight heights owing to enhanced atmospheric turbulence interactions [16]. Furthermore, the three-dimensional nature of the droplet distribution pattern necessitates comprehensive spatial characterisation methodologies that account for both horizontal and vertical deposition gradients, particularly in heterogeneous canopy structures, where penetration efficiency becomes a critical factor for biological efficacy [18].
The geostatistical approach has demonstrated significant relevance in characterising and modelling spatial heterogeneity in herbicide droplet deposition for agricultural applications [13]. Methodologies such as semivariographic analysis enable the quantification of the spatial dependence of deposition parameters, providing a critical foundation for the development of relatively more efficient application strategies [16,17]. Recent investigations have employed these methodologies to evaluate the spatial variability in droplet deposition in various crops and under different operational conditions, thereby significantly advancing knowledge in this field [8,13,18].
Despite recent scientific advances, significant gaps persist in the understanding of spatial heterogeneity in droplet deposition during applications involving RPAs. Most investigations have prioritised specific crops such as cereals and fruit trees, with few studies addressing their applications in pastures or areas of natural vegetation. Additionally, methodological integration between multivariate statistical analysis and geostatistics remains limited, representing a significant opportunity for the development of more comprehensive and robust approaches for characterising the spatial variability in droplet deposition.
In this study, we aimed to evaluate the spatial heterogeneity in droplet deposition in simulated herbicide applications using an RPA in a pasture area. Specifically, we sought to (i) characterise the spatial variability in deposition parameters and the characteristics of sprayed droplets, (ii) identify the interrelationships between deposition parameters and droplet characteristics, (iii) evaluate the impact of flight height on the spatial heterogeneity of deposition, and (iv) develop geostatistical models for predicting droplet deposition in nonsampled areas.
2. Materials and Methods
For a better understanding, this section has been subdivided into topics and organised as follows: (i) description of the experimental area, (ii) specifications of the RPA, (iii) field experiment design, (iv) quantification of deposits, (v) climatic conditions, (vi) statistical analysis, (vii) geostatistical analysis, and (viii) supporting artificial intelligence.
2.1. Description of the Experimental Area
The experiment was performed on flat terrain, previously used as a pasture, belonging to the Experimental Farm of the University Center of Northern Espírito Santo, Federal University of Espírito Santo (CEUNES/ UFES), located at the São Mateus Campus, in the northern region of Espírito Santo State, Brazil (latitude 18°40′25′′ S, longitude 40°51′23′′ W and altitude of 37.0 m above sea level) (Figure 1). The experimental area was situated within the Atlantic Forest biome. The climate of the region is classified as a hot and humid type Aw, according to the Köppen classification, characterised by a dry season from autumn to winter and a rainy season from spring to summer, with an annual average temperature of 24.2 °C and annual precipitation exceeding 1240 mm.
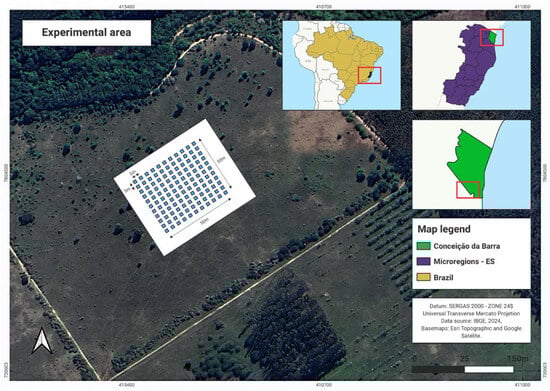
Figure 1.
Location of the experimental area at the Fazenda Experimental of the Federal University of Espírito Santo, Campus São Mateus/ Espírito Santo/ Brazil.
2.2. Specifications of the RPA Used in This Study
The RPA used in this study was from Joyance (model JT-10; Shandong Joyance Intelligence Technology Co., Ltd., Weifang, China), with a 10 L tank capacity, and was calibrated and adjusted for spraying according to the experimental conditions (Figure 2c). In addition to the tank for storing the spray mixture, the RPA is equipped with a hydraulic pump, a piping system for liquid circulation, centrifugal emitters for droplet distribution, an electronic valve control system, and other operational components. The centrifugal emitters were arranged equidistantly and perpendicularly to the longitudinal axis of the aircraft, with a spacing of 0.75 m between them. For all applications, a spray application rate of 10 L ha−1 was adopted.
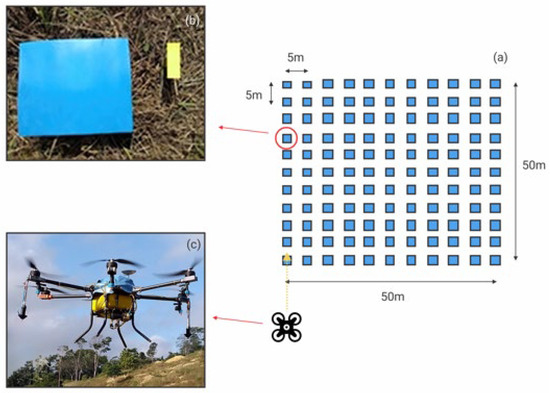
Figure 2.
(a) Distribution of the experimental mesh for collecting deposition data; (b) PVC plate and sensitive paper label positioned at each point of the mesh; (c) aircraft used during the experiment.
The selection of the 10 L ha−1 application rate was based on technical recommendations for RPA applications under ultra-low volume (ULV) conditions, which typically range from 5 to 15 L ha−1 for aerial applications. This rate was chosen considering three primary factors: (1) operational advantages for RPA systems, including enhanced flight autonomy owing to a reduced payload weight and minimised drift risk associated with lower spray volumes; (2) suitability for systemic herbicide applications in pasture environments, where complete surface coverage is less critical than in contact herbicide applications; and (3) efficacy demonstrated in previous studies, with Liu et al. [19] reporting comparable biological effectiveness between low- and high-volume applications for systemic herbicides in grassland systems. The 10 L ha−1 rate represents an optimal balance between application efficiency, equipment performance, and biological efficacy for RPA-based phytosanitary treatments in pasture areas.
The main technical specifications of the aircraft are presented in Table 1.

Table 1.
Specifications of the remotely piloted aircraft used in this study.
2.3. Field Experiment Design
In the area selected for the experiment, a square grid of 50.0 m × 50.0 m, consisting of 121 sampling points regularly spaced every 5.0 m (Figure 2a), was demarcated. The 5.0 m sampling interval was selected based on comprehensive technical considerations to ensure the adequate spatial characterisation of the droplet deposition variability. This interval corresponds to the swath width (5.0 m) used for spraying, enabling the proper characterisation of transversal variability across the spray pattern and facilitating the identification of edge effects and overlapping zones. This selection was further supported by previous semivariographic studies, particularly by Zhu et al. [20], who demonstrated that sampling intervals of 3–7 m were adequate for capturing the spatial dependence structure in RPA applications without compromising the detection of short-range spatial variability. Preliminary semivariogram analyses indicated that this interval allowed for the identification of the spatial dependence range while maintaining computational efficiency for geostatistical modelling. Additionally, the 5.0 m interval represents an optimal compromise between spatial resolution and experimental feasibility, resulting in 121 sampling points that provide adequate density for robust geostatistical analyses while remaining within the practical constraints of field data collection.
The grid was oriented in the north–south direction. The RPA flight pattern was designed to ensure the uniform coverage of the experimental area following standardised procedures for aerial applications. The flight strips were oriented in the north–south direction, maintaining parallel trajectories with a swath width of 5.0 m, corresponding to the effective spray width of the centrifugal distributors. A 10% overlap between adjacent flight strips was implemented to minimise potential gaps in coverage and ensure adequate deposition uniformity across the strip boundaries. The flight direction was alternated between consecutive passes (alternating north-to-south and south-to-north directions) to optimise operational efficiency and reduce turnaround time. Each flight strip began 10 m before the experimental grid boundary and extended 10 m beyond the opposite boundary to ensure the complete coverage of all the sampling points and eliminate edge effects. The RPA maintained a constant altitude and speed throughout each pass with stabilisation periods of 5 s at the beginning and end of each strip to ensure steady-state conditions during data collection. This flight pattern configuration, illustrated in Figure 2 (schematic diagram), was consistently applied across all four application times to maintain experimental standardisation and enable reliable comparisons between the treatments. At each sampling point and before the start of each application, polyvinyl chloride (PVC) collector plates with the dimensions of 0.20 m × 0.20 m, as well as water-sensitive paper tags (76 mm × 26 mm) (WS Paper; Presidente Prudente, São Paulo, Brasil), were positioned to quantify the deposition and characterise the spectrum of sprayed droplets (Figure 2b). Although water-sensitive paper tags have limitations in detecting extremely fine droplets, their use is justified by the practicality of obtaining and analysing droplet spectrum data.
Applications were performed at four distinct times (Table 2) and two operational flight heights: 3.0 and 4.0 m. The operational flight speed was maintained at 5.0 m s−1, with a deposition swath of 5.0 m and the rotation speed of the centrifugal distributors at 10,500 rpm, as described by Güneş and Hasegawa [1]. The selection of the operational flight parameters was based on technical recommendations for RPA applications and previous research findings under similar experimental conditions. The flight speed of 5.0 m s−1 was chosen, as it represents an optimal balance between application quality and operational efficiency, falling within the recommended range of 3–7 m s−1 for RPA phytosanitary applications, as established by Ahmad et al. [16] and Chen et al. [17]. This speed ensured adequate droplet formation and distribution while maintaining sufficient flight stability for precise navigation. The flight heights of 3.0 m and 4.0 m were selected to evaluate the influence of altitude on spatial deposition patterns, with these values corresponding to typical operational ranges for RPA applications in pasture environments. These heights are consistent with the technical recommendations that suggest maintaining flight altitudes between 2.0 and 5.0 m above the target to optimise the balance between spray drift minimisation and adequate canopy penetration [19]. The comparative evaluation of two distinct heights allowed for a comprehensive assessment of the effects of altitude on the spatial variability in droplet deposition, providing insights for operational optimisation in similar agricultural scenarios. For data analysis, the averages of the deposition parameters and droplet characterisation obtained during the four application times and at different flight heights were considered.
Table 2.
Climatic conditions at the time of spraying.
2.4. Quantification of Deposits
The droplet deposits were captured using PVC collector plates positioned at each point of the experimental grid, which was fixed at a height of 0.10 m from the ground on wooden stakes to avoid interference from vegetation during the collection of deposits. The sprayed mix contained the fluorescent dye rhodamine B (tetraethyl rhodamine; Sigma-Aldrich Company, São Paulo, SP, Brazil) at a concentration of 800 mg ha−1, a value commonly used in sprays with low application rates. After droplet collection, the PVC collectors were properly stored in plastic bags, placed in a thermal container, and transported to the Laboratory of Agricultural Pesticide Application Technology at CEUNES/ UFES, where they remained under refrigeration (5 °C) and protected from light until the measurements to prevent the dye from degradation.
To extract the marker deposited on each collector plate, 100 mL of distilled water containing a 0.1% non-ionic surfactant (polysorbate 80) was added. Subsequently, the samples were agitated for 15 min at 120 rpm on a pendulum shaker. The extracted solution was allowed to rest for 10 min and then transferred to plastic cups, wherein the concentration of the marker was measured using a fluorometer. All extraction steps were conducted with the samples protected from light to prevent the degradation of rhodamine B.
From the fluorometer reading, calibration curve data, and the area of the collector plates, the amount of spray deposit per unit area could be calculated in the unit of a microlitre per square centimetre (Equation (1)) as follows:
where ßdeposit is the spray deposit on the leaves, µL cm−2; ρsample represents the fluorometer reading of the sample; ρblank is the fluorometer reading of the ‘blank’ test; Fcalibra represents the calibration factor, µg L−1; Vdeposit is the volume of dilution liquid, L; ρspray represents the sprayed concentration, g L−1; and Apl is the area of the collector plate.
2.5. Acquisition and Processing of Sprayed Droplet Data
Water-sensitive paper tags were used to characterise the spectra of the sprayed droplets. The tags were positioned at each of the 121 points of the rectangular grid, which was fixed at a height of 0.10 m from the ground on wooden stakes to avoid interference from vegetation during the collection of deposits.
The quantification and characterisation of impacts on each water-sensitive paper tag were performed immediately after each application and after the tags had dried, using the DropScope® wireless system (SprayX, São Carlos, Brazil), composed of specific applications and a wireless digital microscope, equipped with a high-resolution image sensor (above 2500 dpi) (Figure 3). This system enabled the estimation of partially overlapping droplets with the diameters of approximately 35 µm. The following parameters were evaluated: volume median diameter (VMD, µm), droplet density (droplets cm−2), coverage (%), diameter at which 10% of the sprayed volume is composed of smaller droplets (D0.1, µm), and diameter at which 90% of the sprayed volume is composed of smaller droplets (D0.9, µm).
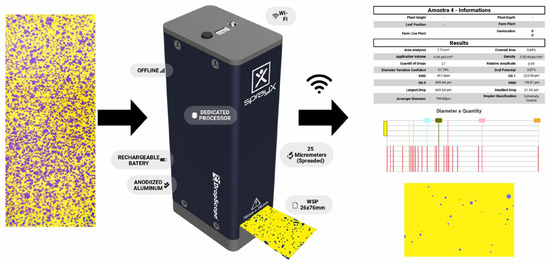
Figure 3.
Image of the wireless system (DropScope®; SprayX, São Carlos, Brazil) used to digitise the water-sensitive paper labels.
2.6. Meteorological Conditions
The climatic conditions during the applications were monitored and recorded using a meteorological station from Sigma Sensors® (São José dos Campos, São Paulo, Brazil), model EMI-RX-500, as presented in Table 2. In addition to the monitoring at the time of application, climatic variables were also tracked on the days and at times preceding the applications to ensure uniformity in the experimental conditions. Temperature ranges below 30 °C, relative air humidity between 55 and 80%, and wind speed between 0.5 and 2.5 m s−1 were considered adequate.
2.7. Statistical Analyses
Data normality was verified using the Kolmogorov–Smirnov test and by analysing the coefficients of skewness and kurtosis, considering the deposition parameters and characteristics of the sprayed droplets. When necessary, the data were logarithmically transformed to meet the assumptions of normality. Decision criteria for data transformation were established based on comprehensive normality assessment protocols. The Kolmogorov–Smirnov test was applied with a significance level of α = 0.05, where p-values < 0.05 indicate significant deviation from normal distribution. Additionally, coefficients of skewness and kurtosis were evaluated using specific threshold values: skewness coefficients with absolute values greater than 1.0 (|skewness| > 1.0) and kurtosis coefficients with absolute values greater than 3.0 (|kurtosis| > 3.0) were considered indicative of a substantial departure from normality. Variables that failed to meet the normality assumptions based on these criteria were subjected to logarithmic transformation [log(x + 1) for variables containing zero values or log(x) for strictly positive variables]. Logarithmic transformation was selected because of its effectiveness in stabilising the variance, reducing the influence of extreme values, and improving the symmetry of the positively skewed distributions commonly observed in deposition and droplet spectrum data. Following the transformation, normality verification was repeated using the same statistical tests to confirm that the transformed variables met the distributional assumptions required for subsequent parametric analyses. Variables that required logarithmic transformation included droplet density (Den) and specific droplet spectrum parameters (D0.1 and D0.9), whereas deposition (Dep) and coverage (Cov) maintained acceptable normality in their original scale. Descriptive statistics were calculated, including the mean, standard deviation, maximum and minimum values, and the coefficient of variation.
The correlation between the deposition parameters and characteristics of the sprayed droplets was determined using Spearman’s correlation analysis. Possible interrelationships between variables were explored using principal component (PC) analysis (PCA), which allowed the extraction of relevant information from the multivariate dataset. Specific packages of the R software were used for statistical analyses.
2.8. Geostatistical Analyses
For geostatistical analyses, theoretical semivariograms were calculated and fitted with spherical, exponential, and Gaussian models. The theoretical models were adjusted for each experimental variogram based on the coefficient of determination (R2) to obtain model parameters (nugget effect, range, and sill). The degree of spatial dependence (DSD) of the deposition parameters and characteristics of the sprayed droplets was verified using the classification cited in [1]: DSD = (Co/[Co + C]) × 100, where Co is the nugget effect, and (Co + C) is the sill. The root mean square error (RMSE) was used to estimate prediction accuracy. The variograms of the deposition parameters and characteristics of the sprayed droplets were modelled together under the restriction of the positive semi-definiteness of the regionalisation matrices. The gstatR package was used for geostatistical analyses.
2.9. Artificial Intelligence Tools
In the development of this manuscript, artificial intelligence tools were employed as support at different stages of research. Litmaps assists in the discovery and mapping of the relevant literature, identifying the connections between key articles and thematic trends. SciSpace was used for the analysis and interpretation of scientific texts, facilitating the extraction of insights and the understanding of complex concepts. DeepSeek contributed to the organisation of ideas, reformulation of passages for greater textual clarity, and suggestions for logical structures of the manuscript. The content generated by these tools has been reviewed, adapted, and validated by the authors, ensuring the originality and academic rigour of the manuscript.
3. Results
The results presented in this section are based on comprehensive statistical and geostatistical analyses designed to characterise the spatial variability in droplet deposition and the associated parameters in RPA applications. The analytical framework integrates descriptive statistics, correlation analysis, PCA, and geostatistical modelling through semivariogram fitting and spatial interpolation. Geostatistical analyses involve the adjustment of theoretical semivariogram models (spherical, exponential, and Gaussian) to quantify the spatial dependence structure with model parameters, including the nugget effect (representing measurement error and microscale variability), range (indicating the distance of spatial influence), and sill (total variance of the phenomenon). Cross-validation indices, including the mean estimation error (MEE) and RMSE, were employed to evaluate the predictive accuracy of the fitted models and ensure robust spatial estimation. PCA was implemented to identify the underlying patterns in the multivariate dataset and quantify the relationships between the deposition parameters and droplet characteristics. This integrated analytical approach enables the comprehensive interpretation of spatial patterns, quantification of operational height effects, and development of predictive models for optimising RPA application strategies. The following subsections present detailed results from each analytical component, with an emphasis on the physical interpretation of the statistical parameters in the context of the droplet deposition processes.
The variables related to application quality, in this case, Dep and Cov, did not present a wide range of variations during spraying in the study area, regardless of the flight height of the RPA, with the Dep variable ranging from 1.01 to 9.02 and 1.10 to 6.10 µL cm−2 at the flight heights of 3.0 and 4.0 m, respectively. However, when observing the variables related to Den and droplet spectrum, a greater amplitude of results was observed, with D0.5 presenting values between 180.0 and 500.0 µm at a flight height of 3.0 m, and between 200 and 442 µm at a flight height of 4.0 m, with similar behaviour for the parameters D0.1 and D0.9 at both flight heights (Table 3).
Table 3.
Descriptive statistics of the analysed variables.
The parameters that characterize the droplet spectrum (D0.5, D0.1, and D0.9) and Cov showed a significant positive correlation with Dep at a flight height of 3.0 m with an ‘r’ value between 0.60 and 0.79; the same was observed at a height of 4.0 m, except for D0.1, which presented a low correlation (r = 0.37) (Table 4). By analysing the same flight height, it was observed that as the droplet spectrum and target coverage increased, the deposited volume also increased. As the flight height increased, the correlation tended to decrease, although it remained positive.
Table 4.
Spearman rank correlation coefficients among spray variables.
The PCA results demonstrated that the first and second PCs (PC1 and PC2) had eigenvalues greater than 1 at both flight heights and explained 99.14 and 85.72% of the total variation at the flight heights of 3.0 and 4.0 m, respectively (Table 5).
Table 5.
Eigenvalues, percentage of variance, and cumulative variance retained by each principal component.
The parameters Dep, D0.5, D0.1, and D0.9, were strongly correlated with PC1 at both flight heights, whereas Den was highly correlated with PC2 (Figure 4). The PCA results demonstrated a trend similar to the results observed in the correlation matrix, indicating the importance of the parameters Dep, D0.5, D0.1, D0.9, and Den in the spray quality, regardless of the flight height. However, it is worth noting that as the application height increases, there is a tendency for the eigenvalues observed in the PCA to decrease, as well as the cumulative variability.
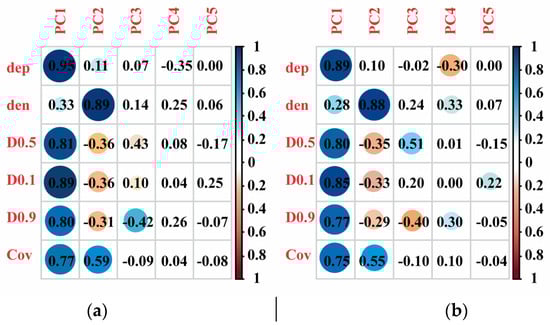
Figure 4.
Correlation between spray parameters and principal components. (a) Flight height 3.0 m; and (b) flight height 4.0 m.
The spatial dependence of the attributes was quantified using geostatistical analysis by adjusting the semivariograms. Data normality is not a requirement of geostatistics; however, it is convenient that the data distribution does not present very elongated tails, which could compromise the kriging estimates based on the mean values. The exponential model adjusted and best represented the variables related to the application quality studied, regardless of the operational flight height. (Table 6).
Table 6.
Model variables of the fitted variograms models for spray parameters.
In general, the degree of spatial dependence decreased as the operational flight height increased from 3.0 to 4.0 m for the variables Dep, Cov, and Den, and increased for the variables D0.5, D0.1, and D0.9. Thus, at the operational flight height of 4.0 m, the degree of spatial dependence increased for the first three variables and decreased for the last three, following the classification established by Güneş and Hasegawa [1]. Based on this classification, semivariograms that exhibit a nugget effect ≤25% of the sill are considered to have strong spatial dependence, moderate spatial dependence when the nugget effect is between 25 and 75%, and weak spatial dependence when the effect exceeds 75%. The classification of the degree of spatial dependence remained unchanged for the variables Dep, Cov, Den, and D0.9 (25%< relative nugget effect [RNE] ≤75%) under the two operational flight heights. Increasing the operational flight height from 3.0 to 4.0 m, it was observed that the degree of spatial dependence decreases, changing from strong (RNE = 4.70%) to moderate (51.32%) for the variable D0.5; the same trend was observed for the variable D0.1, in which the RNE changed from 12.55 to 47.49% for operational flight heights from 3.0 to 4.0 m, respectively.
The Dep variable presented the highest range values of 30.75 and 30.01 m at both the operational flight heights of 3.0 and 4.0 m, respectively. The Cov variable had the lowest range, which was 11.28 and 12.32 m for operational flight heights of 3.0 and 4.0 m, respectively. The range value increased with the increase in operational flight height, which was 12.62 to 16.14 m, 13.08 to 13.33 m, and 21.18 to 29.94 for variables D0.5, D0.1, and D0.9, respectively.
Table 7 presents the cross-validation indices for the spray parameters at two operational flight heights. These indices are fundamental for evaluating the predictive quality of the adjusted geostatistical models, enabling the quantification of the precision of the spatial estimates of the evaluated variables.
Table 7.
Cross-validation indices for spray variables for flight height.
The cross-validation indices for the spray parameters at the two operational heights are listed in Table 7. At the operational height of 3.0 m, the MEE values ranged between −0.021 (for D0.9) and 0.035 (for Dep), whereas at the height of 4.0 m, this variation was from −0.030 (for D0.9) to 0.044 (for Dep). The RMSE values at the operational height of 3.0 m ranged between 0.81 (for Dep) and 1.88 (for Den), whereas at the height of 4.0 m, this variation was from 0.89 (for Dep) to 2.25 (for Cov).
The interpretation of the cross-validation indices provided critical insights into the predictive accuracy and reliability of the fitted geostatistical models. MEE values close to zero (ranging from −0.030 to 0.044) indicate the absence of systematic bias in spatial predictions, demonstrating that the models do not consistently overestimate or underestimate the deposition values across the experimental area. This characteristic is fundamental to ensure unbiased spatial interpolation and reliable prediction maps. The RMSE values, representing the standard deviation of prediction errors, ranged from 0.81 to 2.25 across parameters and flight heights, corresponding to relative errors of 8–15% of the respective parameter means. These values are considered acceptable for geostatistical modelling in agricultural applications and are comparable to those reported in similar studies involving the spatial variability in spray deposition [21,22]. The combination of low MEE and moderate RMSE values indicated that the exponential and spherical models adequately captured the spatial dependence structure of the evaluated parameters, providing sufficient accuracy for practical field applications. The slightly higher RMSE values observed for droplet density (Den) and coverage (Cov) at a 4.0 m height reflect the increased spatial heterogeneity associated with a greater flight altitude, suggesting that prediction uncertainty increases with operational height. These findings have important practical implications for precision agricultural applications because the validated models can be used for spatial interpolation, the identification of application zones with different deposition characteristics, and the optimisation of RPA flight patterns to achieve a more uniform spatial distribution.
Figure 5 shows that the droplet deposition (Dep, map a) presents a relatively homogeneous spatial pattern, with higher values in the central and northeastern regions of the experimental area and lower values in the peripheral regions, particularly in the southwestern portion.
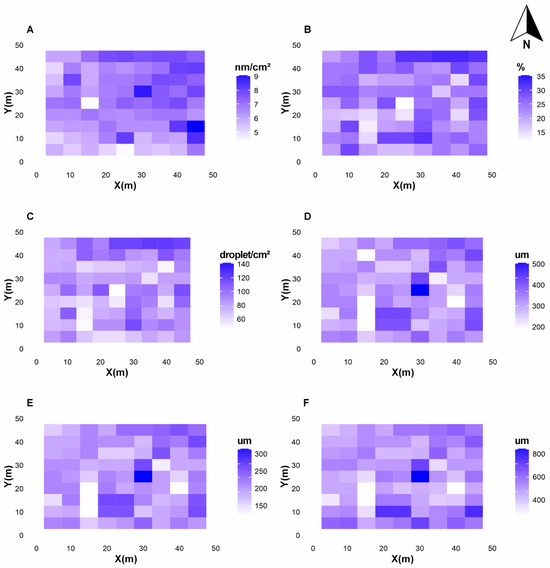
Figure 5.
Spatial distribution for the studied spray parameters at flight height 3 m. (A) Dep: spray deposition (µL cm−2); (B) Cov: spray coverage (%); (C) Den: droplet number density (droplet cm−2); (D) D0.5: diameter of the volumetric median (µm); (E) D0.1: droplet diameter with volume below 10% (µm); and (F) D0.9: droplet diameter with volume below 90% (µm). Please note the different scales for different properties.
Spray coverage (Cov, map b) presented a spatial pattern similar to that of deposition, with higher values in the central and northeastern regions, which is consistent with the significant positive correlation between these parameters (r = 0.79). Droplet density (Den, map c) exhibited a distinct spatial pattern, with relatively greater heterogeneity and high values distributed in patches throughout the experimental area. The parameters related to the droplet spectrum (D0.5, D0.1, and D0.9, maps d, e, and f, respectively) exhibited spatial patterns with greater continuity, particularly D0.5 and D0.9. Higher values were observed in the central and northern regions of the experimental area, with a decreasing gradient toward the edges, especially in the southern portion.
6As shown in Figure 6, corresponding to the operational height of 4.0 m, significant changes were observed in the spatial patterns of all the evaluated parameters, indicating the impact of flight height on the spatial variability in spraying.
Figure 6.
Spatial distribution for the studied spray parameters at flight height 4 m. (A) Dep: spray deposition (µL cm−2); (B) Cov: spray coverage (%); (C) Den: droplet number density (droplet cm−2); (D) D0.5: diameter of the volumetric median (µm); (E) D0.1: droplet diameter with volume below 10% (µm); and (F) D0.9: droplet diameter with volume below 90% (µm). Please note the different scales for different properties.
Droplet deposition (Dep, map a) presented a more fragmented and heterogeneous spatial pattern compared to the height of 3.0 m, with a reduction in the area of high values and an increase in the area of intermediate values. Spray coverage (Cov, map b) exhibited a spatial pattern significantly distinct from that observed at a height of 3.0 m, with relatively greater heterogeneity and a reduction in the area of high values, consistent with the reduction in the correlation between Dep and Cov (from r = 0.79 to r = 0.59). The droplet density (Den, map c) maintained a heterogeneous spatial pattern, but with alterations in the distribution of patches of high values, which predominantly shifted to the northern portion of the experimental area. The parameters related to the droplet spectrum (D0.5, D0.1, and D0.9, maps d, e, and f, respectively) present spatial patterns with a greater range compared to the height of 3.0 m, particularly D0.5 and D0.9, whose ranges increased from 12.62 to 16.14 m and from 21.18 to 29.94 m, respectively.
4. Discussion
The low amplitude of variation observed in the indicators related to application quality (Dep and Cov), regardless of the operational height, partially diverged from the observations reported by Güneş and Hasegawa [1], who identified greater heterogeneity in deposition as a function of different operational altitudes. In contrast, the greater amplitude verified in the indicators associated with the droplet spectrum (D0.5, D0.1, and D0.9) corroborates the investigations of [18], who established droplet sizing as a preponderant factor in determining the deposition density, coverage, uniformity, and penetration in applications performed using RPAs.
It is important to distinguish between the nominal application rate and effective deposition measured at the sampling points to avoid the misinterpretation of the results. The nominal application rate of 10 L ha−1 (equivalent to 0.1 μL cm−2) represents the total volume applied per unit area based on equipment calibration and operational parameters. However, the effective deposition measured in the PVC collectors (ranging from 1.01 to 9.02 μL cm−2) represented the actual amount collected at specific sampling points, which can vary considerably because of several factors inherent to spraying applications using RPAs. The measured deposition values can exceed the nominal rate because of (1) deposition concentration in certain areas resulting from the nozzle distribution pattern and centrifugal distributor characteristics, (2) overlapping effects between adjacent application swaths that create zones of higher deposition, (3) the influence of rotor downwash that can concentrate droplets in specific regions through complex airflow patterns, and (4) spatial variability inherent to RPA applications caused by atmospheric conditions and equipment dynamics. This variation between nominal and effective deposition is expected and well documented in the literature for aerial applications [21,22], representing a fundamental characteristic of RPA spray systems rather than a calculation error.
The predominance of adjustment to the exponential model and the moderate to strong spatial dependence verified for all evaluated parameters align with the observations of Koo et al. [8,13], who similarly identified these characteristics in studies on droplet deposition in applications performed using RPAs. The range represented the maximum distance at which the spatial correlation between samples was verified, constituting an essential parameter for sampling planning and interpolating values in unsampled locations. The significant variation in range values among the different parameters (from 12.32 m for Cov to 30.01 m for Dep) indicates that these present different scales of spatial variability, which has important implications for planning sampling strategies and management in phytosanitary applications.
The moderate to strong spatial dependence verified in this investigation suggests that the spatial heterogeneity of deposition parameters and droplet attributes does not manifest a purely random character, but presents a defined spatial structure amenable to modelling and use for prediction in unsampled locations, which represents a significant advance in the optimisation of phytosanitary applications performed using RPAs.
The distinct spatial patterns observed in the variability maps reflect the complexity of the processes involved in droplet deposition in applications performed using RPAs. These differences are influenced by multiple factors, including the technical characteristics of the equipment, operational parameters, and environmental conditions [16,19].
The more pronounced spatial heterogeneity in the droplet spectrum parameters (D0.5, D0.1, and D0.9), as evidenced by the coefficients of variation between 19.72 and 23.06%, can be attributed to the influence of the vortex effect generated by aircraft rotors, which significantly modifies the behaviour of the droplets during application. As highlighted by Güneş and Hasegawa [1] and Xing et al. [14], the downward airflow generated by the rotors produces complex turbulence patterns, causing distortions in the droplet spectrum and altering the spatial distribution of droplets. This phenomenon is particularly relevant in applications performed using RPAs, differentiating them from conventional ground equipment.
Spearman’s correlation analysis revealed significant associations between the deposition parameters and droplet attributes, with distinct patterns for different operational heights. At the flight height of 3.0 m, we verified statistically significant positive correlations between deposition (Dep) and droplet spectrum parameters (D0.5, D0.1, and D0.9), with ‘r’ coefficients between 0.60 and 0.66, as well as between Dep and coverage (Cov), with r = 0.79. These findings indicate that at this operational height, the increase in droplet size and coverage is associated with an increase in deposition, corroborating the observations of Zhu et al. [20] and Martinez-Guanter et al. [21], who similarly identified positive correlations between these parameters in applications performed by RPA on banana crops [2].
At the operational height of 3.0 m, although the correlations between the deposition (Dep) and droplet spectrum parameters maintained a positive character, we verified a reduction in the magnitude of these correlations, particularly for D0.1 (r = 0.37). This decrease in the intensity of the correlations with an increase in operational height can be attributed to the greater influence of meteorological conditions, especially wind speed, and to the fact that droplets need to travel a greater distance to reach the target, as highlighted by Silva et al. [22] and Xue et al. [23]. These researchers demonstrated that the drift characteristics in applications performed by RPA were significantly influenced by droplet size and application volume, with a greater impact at higher operational heights.
Crosswinds significantly influence spatial deposition in RPA applications, causing a lateral drift that disrupts uniformity and generates asymmetric patterns perpendicular to flight paths. The interplay between flight height and wind reveals that higher altitudes prolong droplet exposure to atmospheric forces, thereby intensifying trajectory deviations. Wind speed exhibited a non-linear effect, i.e., speeds below 1.0 m s−1 often led to poor mixing and localised deposits, whereas speeds above 3.0 m s−1 increased drift and reduced deposition efficiency. The wind direction shapes distinct spatial outcomes; headwinds and tailwinds affect the droplet travel time and vertical spread, whereas crosswinds laterally shift the deposition zone by several meters. Even under moderate wind (1.5–2.5 m s−1), as observed in this study, spatial heterogeneity was observed, particularly for fine droplets (D0.1) relatively more prone to drift. Future studies should adopt factorial designs to assess wind speed (0.5–1.0, 1.0–2.0, and 2.0–3.0 m s−1), direction (head, tail, and crosswind), and their interactions with flight height, speed, and nozzle type. This supports predictive models and real-time adjustment protocols, advancing the precision of RPA spraying under various meteorological conditions.
The implementation of PCA provided additional perspectives on the interrelationships between the evaluated parameters, confirming the patterns observed in the correlation matrix. PC1 and PC2 explained 99.14 and 85.72% of the total variation at the operational heights of 3.0 and 4.0 m, respectively, indicating that most of the data variability can be represented by these two dimensions. At an operational height of 3.0 m, the parameters Dep, D0.5, D0.1, and D0.9, showed strong correlations with PC1, whereas the droplet density (Den) showed a greater correlation with PC2. This pattern suggests that deposition and droplet spectrum share a common source of variability, possibly related to the technical characteristics of the equipment and operational conditions, whereas droplet density is affected by other factors, e.g., application rate and travel speed [24,25].
Although the general pattern was maintained at the operational height of 4.0 m, we demonstrated a reduction in the eigenvalues and cumulative variability explained by PC1 and PC2. This reduction suggests that with an increase in the operational height, other factors not represented by the analysed PCs begin to impact the variability in the deposition parameters and droplet attributes. These findings align with observations that identified complex interactions between operational height, travel speed, and droplet sizing in applications performed using RPAs [26,27,28].
A comparison between the two evaluated operational heights revealed significant differences in the spatial heterogeneity of the deposition parameters and droplet attributes. The higher mean deposition observed at an operational height of 3.0 m corroborates the findings of Baio et al. [27] and Desa et al. [28], who similarly identified a reduction in deposition with an increase in the operational height in applications performed by RPA.
In addition to the reduction in the mean deposition, an increase in the operational height also influenced the spatial dependence of the evaluated parameters. At an operational height of 4.0 m, we verified an increase in RNE for most parameters, indicating a greater contribution of random variability (not spatially structured) to the total variability. This increase in RNE suggests that with an increase in operational height, random factors such as atmospheric turbulence and wind fluctuations begin to exert a greater influence on the spatial heterogeneity of deposition, reducing the predictability of spatial patterns [14,18].
Interpreting changes in spatial dependence requires distinguishing between deposition parameters (Dep and Cov) and droplet spectrum parameters (Den, D0.1, D0.5, and D0.9), as these groups exhibit distinct responses to flight height variations owing to different physical mechanisms. RNE is a key indicator of spatial structure, with higher RNE values indicating reduced spatial dependence and increased random variability. Dep and Cov maintained moderate spatial dependence (25% < RNE ≤ 75%) at both flight heights (3.0 and 4.0 m), indicating structural stability. In contrast, D0.1 and D0.5 showed a marked reduction in spatial dependence, shifting from strong to moderate levels (RNE from 12.55 to 47.49% and from 4.70 to 51.32%, respectively). Den and D0.9 retained their moderate classifications. These distinct responses reflect different governing mechanisms: Dep and Cov are primarily influenced by gravitational settling and canopy interception and remain relatively stable across altitudes. However, the droplet spectral parameters are more sensitive to atmospheric turbulence and rotor-induced airflow, which intensify at higher altitudes. These factors particularly impacted smaller droplets (D0.1, D0.5), which were relatively more susceptible to perturbation because of their lower inertia; however, larger droplets (D0.9) and density patterns (Den) remained more stable, owing to their greater mass and reduced sensitivity to turbulent airflow.
The range of spatial dependence was also influenced by the operational height, with a tendency of reduction for most parameters at a height of 4.0 m. This reduction in range indicates that the spatial correlation between sampling points decreased more rapidly with distance at higher operational heights, reflecting the greater spatial heterogeneity of the deposition patterns. As highlighted by Güneş and Hasegawa [1], the reduction in the range of spatial dependence with an increase in operational height can be attributed to the greater dispersion of droplets and the greater impact of atmospheric turbulence, which increases spatial heterogeneity at small scales [29].
The spatial variability maps for the two operational heights revealed significant differences in the spatial patterns of the evaluated parameters. At the operational height of 2.0 m, we verified more defined and continuous patterns with clearly delimited zones of high and low deposition. In contrast, at the operational height of 3.0 m, the spatial patterns appeared more fragmented and irregular, reflecting the greater influence of random factors on spatial heterogeneity. These findings align with the observations of Zhang et al. [18] and Divazi et al. [29], who similarly identified greater fragmentation in the spatial patterns of deposition with an increase in operational height in applications performed by a remotely piloted agricultural aircraft.
The positive correlation between deposition and droplet size, particularly at a lower operational height, suggests that the selection of nozzles that produce medium to large droplets may increase the application efficiency in terms of target deposition. However, it is essential to consider that larger droplets may result in less coverage and penetration in the crop canopy, as highlighted. Therefore, the selection of droplet size must take into account the balance between deposition, coverage, and drift risk, considering the morphophysiological characteristics of the target crop and environmental conditions [30,31].
5. Conclusions
The results of this study provide a comprehensive understanding of the spatial heterogeneity in droplet deposition during herbicide applications performed using RPAs in grassland areas, achieved through the methodological integration of geostatistical analysis and multivariate statistics. The main conclusions are as follows:
- The indicators related to application quality (deposition and coverage) did not show a significant range of variation during spraying, regardless of the operating height of the RPA, whereas the parameters associated with the droplet spectrum showed greater heterogeneity.
- All evaluated parameters showed moderate to strong spatial dependence, with a predominant fit to the exponential model, indicating a defined spatial structure that can be modelled and used for prediction in unsampled locations.
- A significant positive correlation was observed between the deposition and droplet spectral parameters, particularly at the lowest operating height, with a reduction in the magnitude of the correlation as the operating height increased.
- PCA revealed that deposition and droplet spectrum share a common source of variability, whereas droplet density is impacted by other factors with a reduction in its variability explained by PC1 and PC2 at the highest operating height.
- The increase in operating height negatively influenced the average deposition and the structure of the spatial dependence of the parameters evaluated, with an increase in the relative nugget effect and a reduction in the range, resulting in more fragmented and irregular spatial patterns.
- These findings support precision agriculture protocols for RPA operations. Spatial variability maps can inform route planning by identifying areas that require slower speeds or greater overlap (15–20%). Variable-rate systems can adjust spray volumes in real time. Application monitoring should include geostatistical validation using sampling grids and cross-validation metrics (MEE < 0.1, RMSE < 15%). Integration into precision systems allows automated flight adjustments to optimise efficiency and efficacy.
The scientific novelty of this study lies in the pioneering methodological integration of geostatistical analysis and multivariate statistics for characterising droplet deposition in pasture applications using RPAs, representing the first comprehensive approach to spatial variability assessment in this specific agricultural context. This research introduces four key innovations: (1) the first application of integrated geostatistical and multivariate analytical frameworks for the spatial characterisation of droplet deposition in pasture environments with RPAs, addressing a significant gap in the literature where most studies focus on annual crops; (2) the specific evaluation of spatial heterogeneity in ultra-low volume applications (10 L ha−1) with RPAs, providing critical insights for precision agriculture in extensive grazing systems; (3) the development of robust predictive spatial models for droplet deposition in pasture areas, enabling the optimisation of application strategies through spatial interpolation and uncertainty quantification; and (4) the comprehensive characterisation of flight height influence on the spatial dependence structure of both deposition parameters and droplet spectrum characteristics, revealing the complex interactions between operational variables and spatial patterns. The methodological framework developed in this study establishes a new paradigm for spatial analysis in RPA applications, providing a foundation for future research in precision agriculture and contributing to the advancement of knowledge in agricultural aviation technology. Despite the robustness of the study, some limitations must be considered to define its applicability. The inability of WSP to detect droplets <35 μm may lead to the underestimation of droplet density and overestimation of mean diameter. Fluorescence data, which capture all droplet sizes, help quantify this bias and refine the interpretation. The strong correlation between the methods (r > 0.75) suggests that the WSP remains valid for spatial trend analysis. Trials were conducted under specific conditions (24–25 °C, 65–75% RH, and 1.5–2.5 m s−. wind), limiting extrapolation to other climates, as droplet behaviour varies with weather. Only two flight heights (3.0 and 4.0 m) were tested, limiting conclusions for the full operational range (2.0–6.0 m). These results are specific to herbicide use in pastures, which differs from other crops or canopies. The single-season timeframe also limits the assessment across phenological stages. These limitations do not undermine the findings but define their scope and highlight areas for future research. These conclusions have significant implications for the optimisation of phytosanitary applications of RPA, contributing to the development of more efficient, economically viable, and environmentally sustainable application strategies.
Author Contributions
Conceptualisation, E.L.d.V. and L.F.O.R.; methodology, E.L.d.V., L.F.O.R., I.G. and F.R.P.; software, E.L.d.V., A.J.B.C. and I.G.; validation, E.L.d.V., F.R.P. and M.R.F.J.; formal analysis, L.F.O.R. and I.G.; investigation, E.L.d.V., F.d.A.F., J.V.O.R. and M.E.d.S.B.; resources, E.L.d.V., F.R.P., I.G., L.F.O.R. and J.W.D.M.M.; data curation, E.L.d.V.; writing—original draft preparation, E.L.d.V.; writing—review and editing, L.F.O.R., I.G., F.R.P. and A.J.B.C.; visualisation, F.d.A.F. and J.W.D.M.M.; supervision, E.L.d.V.; project administration, E.L.d.V.; funding acquisition, F.R.P. All authors have read and agreed to the published version of the manuscript.
Funding
This research received no external funding.
Data Availability Statement
The original contributions of this study are included in this article. Further enquiries can be directed to the corresponding authors.
Acknowledgments
The authors would like to thank the following research support agencies: Conselho Nacional de Desenvolvimento Científico e Tecnológico (CNPq) and Fundação de Amparo a Pesquisa do Espirito Santo (FAPES). The authors would like to thank the editors and reviewers for their valuable constructive comments.
Conflicts of Interest
The authors declare that they have no known competing financial interests or personal relationships that could have appeared to influence the work reported in this paper.
Abbreviations
The following abbreviations are used in this manuscript:
| Dep | Spray deposition | (µL cm−2) |
| Cov | Spray coverage | (%) |
| Den | Droplet number density | (droplets cm−2) |
| D0.5 | Volume median diameter | (µm) |
| D0.1 | Droplet diameter with volume below 10% | (µm) |
| D0.9 | Droplet diameter with volume below 90% | (µm) |
| MEE | Mean estimation error | (dimensionless) |
| RMSE | Root mean square error | (dimensionless) |
| RNE | Relative nugget effect | (%) |
| GDE | Degree of spatial dependence | (%) |
| RPA | Remotely piloted aircraft | - |
| CV | Coefficient of variation | (%) |
| PCA | Principal component analysis | - |
| PC1 | First principal component | - |
| PC2 | Second principal component | - |
References
- Güneş, D.; Hasegawa, H. Optimizing UAV sprayer performance using field data and machine learning approaches. Smart Agric. Technol. 2025, 11, 101013. [Google Scholar] [CrossRef]
- Yu, J.; Xu, X.; Duan, J.; Jiang, Y.; Yuan, H.; Liang, H.; Jing, S.; Yang, Z. Effect of operational parameters on droplet deposition characteristics using an unmanned aerial vehicle for banana canopy. Front. Plant Sci. 2024, 15, 1491397. [Google Scholar] [CrossRef]
- Saini, A.K.; Yadav, A.K. A Comprehensive review on technological breakthroughs in precision agriculture: IoT and emerging data analytics. Eur. J. Agron. 2025, 163, 127440. [Google Scholar] [CrossRef]
- Lan, X.; Wang, J.; Chen, P.; Liang, Q.; Zhang, L.; Ma, C. Risk assessment of environmental and bystander exposure from agricultural unmanned aerial vehicle sprayers in golden coconut plantations: Effects of droplet size and spray volume. Ecotoxicol. Env. Saf. 2024, 282, 116675. [Google Scholar] [CrossRef] [PubMed]
- Liu, Q.; Ding, M.; Zhang, H.; Wu, L.; Zhang, L.; Bao, H.; Lan, Y. Optimization of Flight Mode and Coupling Analysis of Operational Parameters on Droplet Deposition and Drift of Unmanned Aerial Spraying Systems (UASS). Agronomy 2025, 15, 367. [Google Scholar] [CrossRef]
- Gatkal, N.R.; Sachin, M.N.; Girishkumar, B.B.; Ramesh, K.S.; Avdhoot, A.W.; Pravin, B.K.; Ali, M. Review of UAVs for efficient agrochemical spray application. Int. J. Agric. Biol. Eng. 2025, 18, 1–9. [Google Scholar] [CrossRef]
- Moraes, H.M.F.E.; Furtado, M.R.; Vitória, E.L.D.; Martins, R.N. A bibliometric and scientometric analysis on the use of UAVs in agriculture, livestock and forestry. Cienc. Rural. 2023, 53, e20220130. [Google Scholar] [CrossRef]
- Koo, D.; Gonçalves, C.G.; Askew, S.D. Agricultural spray drone deposition, Part 2: Operational height and nozzle influence pattern uniformity, drift, and weed control. Weed Sci. 2024, 72, 824–832. [Google Scholar] [CrossRef]
- Silva, J.E.; Silva, W.H.B.D.; Ferraz, M.A.J.; Menezes, E.A.S.; Costa, O.P.D.; Inácio, F.D.; Barboza, T.O.C.; Melo, C.A.D.; Carvalho, G.R.; Santos, A.F. Impact of spray volume and flight speed on the efficiency of drone applications in coffee plants of different ages. Smart Agric. Technol. 2024, 9, 100694. [Google Scholar] [CrossRef]
- Li, H.; Li, Y.; Zeeshan, M.; Yang, L.; Gao, Z.; Yang, Y.; Zhang, G.; Wang, C.; Han, X. The Influence of Unmanned Aerial Vehicle Wind Field on the Pesticide Droplet Deposition and Control Effect in Cotton Fields. Agronomy 2025, 15, 1221. [Google Scholar] [CrossRef]
- Semenišin, M.; Steponavičius, D.; Kemzūraitė, A.; Savickas, D. Optimizing UAV Spraying for Sustainability: Different System Spray Drift Control and Adjuvant Performance. Sustainability 2025, 17, 2083. [Google Scholar] [CrossRef]
- Ye, K.; Hu, G.; Tong, Z.; Xu, Y.; Zheng, J. Key Intelligent Pesticide Prescription Spraying Technologies for the Control of Pests, Diseases, and Weeds: A Review. Agriculture 2025, 15, 81. [Google Scholar] [CrossRef]
- Koo, D.; Godara, N.; Cubas, J.R.R.; Askew, S.D. A method to spatially assess multipass spray deposition patterns via UV fluorescence and weed population shifts. Crop Sci. 2025, 65, e21377. [Google Scholar] [CrossRef]
- Xing, H.; Liu, Z.; Huang, T.; Dong, M.; Lv, J.; Tang, F. Wind Vortex Target Control of a Plant Protection UAV Based on a Rice Wind Vortex–Flight Parameter Model. Agriculture 2024, 14, 1413. [Google Scholar] [CrossRef]
- Guo, Q.; Zhu, Y.; Tang, Y.; Hou, C.; Fang, M.; Chen, X. Numerical simulation of the effects of downwash airflow and crosswinds on the spray performance of quad-rotor agricultural UAVs. Smart Agric. Technol. 2025, 11, 100940. [Google Scholar] [CrossRef]
- Ahmad, F.; Qiu, B.; Dong, X.; Ma, J.; Huang, X.; Ahmed, S.; Chandio, F.A. Effect of operational parameters of UAV sprayer on spray deposition pattern in target and off-target zones during outer field weed control application. Comput. Electron. Agric. 2020, 172, 105350. [Google Scholar] [CrossRef]
- Chen, P.; Lan, Y.; Huang, X.; Qi, H.; Wang, G.; Wang, J.; Wang, L.; Xiao, H. Droplet deposition and control of planthoppers of different nozzles in two-stage rice with a quadrotor unmanned aerial vehicle. Agronomy 2020, 10, 303. [Google Scholar] [CrossRef]
- Zhang, H.; Dorr, G.J.; Hewitt, A.J.; Huang, Y.; Lan, Y.; Sun, M.; Zheng, J. Numerical simulation of airflow field from a six-rotor unmanned aerial vehicle and its influence on droplet deposition distribution. Aerosp. Sci. Technol. 2019, 88, 84–97. [Google Scholar] [CrossRef]
- Xue, X.; Tu, K.; Qin, W.; Lan, Y.; Zhang, H. Drift and deposition of ultra-low altitude and low volume application in paddy field. Int. J. Agric. Biol. Eng. 2014, 7, 23–28. [Google Scholar] [CrossRef]
- Zhu, H.; Salyani, M.; Fox, R.D. A portable scanning system for evaluation of spray deposit distribution. Comput. Electron. Agric. 2011, 76, 38–43. [Google Scholar] [CrossRef]
- Martinez-Guanter, J.; Agüera, P.; Agüera, J.; Pérez-Ruiz, M. Spray and economics assessment of a UAV-based ultra-low-volume application in olive and citrus orchards. Precis. Agric. 2020, 21, 226–243. [Google Scholar] [CrossRef]
- Silva, V.; Mol, H.G.J.; Zomer, P.; Tienstra, M.; Ritsema, C.J.; Geissen, V. Pesticide residues in European agricultural soils–A hidden reality unfolded. Sci. Total Environ. 2019, 653, 1532–1545. [Google Scholar] [CrossRef]
- Xue, X.; Tian, Y.; Yang, Z.; Li, Z.; Lyu, S.; Song, S.; Sun, D. Research on a UAV spray system combined with grid atomized droplets. Front. Plant Sci. 2024, 14, 1286332. [Google Scholar] [CrossRef] [PubMed]
- Murata, H.; Masui, S.; Tsuchida, Y. Efficacy evaluation of low-volume concentrate application of pesticides by unmanned aerial vehicle (UAV) using an indoor spraying device. Appl. Entomol. Zool. 2024, 59, 103–110. [Google Scholar] [CrossRef]
- Taseer, A.; Han, X. Advancements in variable rate spraying for precise spray requirements in precision agriculture using Unmanned aerial spraying Systems: A review. Comput. Electron. Agric. 2024, 219, 108841. [Google Scholar] [CrossRef]
- Yang, J.; Li, L.; Tang, Q.; Hu, P.; Yan, W.; Zhang, R. Modeling the Droplet Size Distribution of Atomizers with Different Cage Diameters for Large-Payload Unmanned Aerial Vehicles (UAVs). Agronomy 2025, 15, 647. [Google Scholar] [CrossRef]
- Baio, F.H.R.; Oliveira, J.T.D.; Alves, M.E.M.; Teodoro, L.P.R.; Cunha, F.F.D.; Teodoro, P.E. Characterization of the Droplet Population Generated by Centrifugal Atomization Nozzles of UAV Sprayers. AgriEngineering 2025, 7, 15. [Google Scholar] [CrossRef]
- Desa, H.; Azizan, M.A.; Ishak, N.; Hang, T.X. Experimental Analysis of Flight Altitude for Enhanced Agricultural Drone Spraying Performance. J. Robot. Netw. Artif. Life 2023, 10, 71–76. [Google Scholar] [CrossRef]
- Divazi, A.; Askari, R.; Roohi, E. Experimental and numerical investigation on the spraying performance of an agricultural unmanned aerial vehicle. Aerosp. Sci. Technol. 2025, 160, 110083. [Google Scholar] [CrossRef]
- Kong, F.; Qiu, B.; Dong, X.; Yi, K.; Wang, Q.; Jiang, C.; Zhang, X.; Huang, X. Design and Development of a Side Spray Device for UAVs to Improve Spray Coverage in Obstacle Neighborhoods. Agronomy 2024, 14, 2002. [Google Scholar] [CrossRef]
- Tang, Y.; Hou, C.J.; Luo, S.M.; Lin, J.T.; Yang, Z.; Huang, W.F. Effects of operation height and tree shape on droplet deposition in citrus trees using an unmanned aerial vehicle. Comput. Electron. Agric. 2018, 148, 1–7. [Google Scholar] [CrossRef]
Disclaimer/Publisher’s Note: The statements, opinions and data contained in all publications are solely those of the individual author(s) and contributor(s) and not of MDPI and/or the editor(s). MDPI and/or the editor(s) disclaim responsibility for any injury to people or property resulting from any ideas, methods, instructions or products referred to in the content. |
© 2025 by the authors. Licensee MDPI, Basel, Switzerland. This article is an open access article distributed under the terms and conditions of the Creative Commons Attribution (CC BY) license (https://creativecommons.org/licenses/by/4.0/).