1. Introduction
Sugarcane is a crucial industrial crop in Thailand, as the country is the world’s second-largest sugar exporter after Brazil. Currently, more than 1.76 million hectares of sugarcane are planted in the area, producing over 134 million tons in the 2017–18 production year. However, Thailand’s average sugarcane output per acre is lower than that of Brazil and Australia. According to statistics, Brazil generates more than 81.25 tons per hectare of sugarcane, while Australia produces 93.75 tons per hectare. In comparison, Thailand produces an average output of 62.50 tons per hectare [
1]. Thailand has a greater cost of production than its rivals. Due to the slow adoption of precision agricultural technology [
2,
3], Thailand has a low average output per hectare. New technology, including machinery, drones, and automation systems, improves agricultural production efficiency. Managing resources, such as temperature, air, water, and aerial photographs, is crucial for successful agriculture. Sensors gather and analyze data to help farmers make informed decisions about soil preparation, watering, fertilizing, and harvesting. Improving sugarcane fertilization is key to increasing yield per planting area.
An analysis of the practical application shortcomings of variable rate spraying systems in sugarcane fields has revealed significant improvements in the efficiency, reliability, and accuracy of agricultural equipment. This progress can be attributed to the growing recognition that robots serve as an effective solution to the shortage of skilled labor in crop production [
4]. The digitization and transformation of the agricultural sector, particularly in sugarcane-related operations, has been emphasized, especially regarding the application of information and communication technology (ICT) [
5]. Remote sensing technologies, including light measurement, vegetation indexes, and cameras, are valuable tools for monitoring sugarcane crops. One of the main challenges in fertilizer application is accurately measuring the soil nutrient needs for replacement. In the area of spraying, sensors play a crucial role in detecting pests and weeds. Research indicates that integrating sensors with different physical principles allows for better measurement of plant and soil characteristics [
6]. Additionally, a specially designed robotic spot sprayer that utilizes computer vision and deep learning can significantly reduce the application of herbicides in sugarcane fields [
7]. Targeting technologies that employ images and remote sensing influence pesticide selection, dosage calculation, spray timing, and spraying methods, leading to more precise pesticide application and prescriptions for specific areas [
8]. As a result, precision agriculture can greatly benefit from the use of autonomous vehicles and drones. With the support of machine learning, these technologies enhance precision in planting, harvesting, and crop monitoring [
9]. This highlights a crucial gap in future research: the development of more machine learning-driven autonomous spraying systems, which could facilitate a transition toward smarter and more environmentally friendly farming practices [
10].
The driverless tractor, a dynamic model combining both tractor and trailer, has been developed to accurately calculate lateral slip by considering lateral force and slip angle [
11]. A three-wheel model, assuming equal lateral forces on the left and right wheels, has been utilized to derive the motion equations for the tractor-trailer system, aiming to enhance the use of agricultural machinery in Malaysia. The Kubota hydrostatic tractor, an agricultural tractor, has been modified with an electromechanical system for automation. The modified parts include the steering, transmission, engine ignition and stop systems, and acceleration systems [
12,
13]. A computer control system has been designed and installed on the tractor to enable automatic movement according to the operator’s commands. The tractor’s navigation is controlled using the ICP-Con electromechanical module and mechanical relay [
14,
15]. To fully automate agricultural operations, it is essential to address the issue of robot path planning to ensure that all crucial points within the area of interest can be covered. While current planning algorithms have effectively determined the optimal path, they do not take into account path construction using start distance, end distance, and dynamic path distance [
16]. The combination of GNSS and INS positioning technology has become increasingly popular in the automatic navigation of agricultural machinery. A new automatic rice planting machine has been developed using RTK-GNSS and IMU. Experimental results demonstrate that the directional error of linear path tracking is less than 10 cm [
17,
18,
19].
Using a webcam and real-time image processing, the robot can identify simulated weeds in sugarcane fields. This is achieved by using a real-time fuzzy classifier to classify leaf surfaces. It is a significant challenge for farmers to differentiate between weeds, plant density, and weed control, especially when it comes to weed detection using a simulated robot that operates using a Raspberry Pi control system installed in a moving vehicle. The automatic image classifier system is designed to separate leaf surfaces and utilizes a real-time fuzzy classifier technique [
20,
21]. The use of 3D motion capture systems and real-time visualization through customized software has become widespread. However, this technique demands high expertise and the procurement cost of 3D motion capture systems [
22,
23]. In agricultural applications, the use of agrochemicals with conventional sprayers leads to the wastage of chemicals, resulting in economic losses and environmental pollution [
24]. To enhance the accuracy of sugarcane crop detection models, it is crucial to gather data on geographic area, soil type, lighting conditions, camera resolution, and image quality, as indicated by research from the researchers [
25,
26]. However, it is not sufficient to simply create a dataset covering a wide distribution to train sugarcane crop detection models for multiple cropping areas. Research by them [
27,
28] demonstrates that the number of images and the variability in the dataset’s breadth also play a significant role. With the advancement of farm machinery, agriculture has become more scientific. In this regard, image processing algorithms utilizing Raspberry Pi cameras and real-time plant location tracking aim to improve yield and quality based on various biological and abiotic factors. This system helps reduce the risk of crop damage resulting from careless management by capturing high-precision images [
29,
30,
31].
This paper discusses solutions for effectively managing sugarcane foliar fertilization. The proposed solution involves using an Agri–Garmin smartphone link and a variable-rate sprayer mounted on an unmanned tractor to precisely manage the fertilization process. The development of a fertilizer spraying system with variable rates is expected to benefit the nation’s sugarcane crop by increasing production efficiency, reducing labor requirements, lowering costs, and ultimately boosting national output. The study aimed to develop a prototype for an adjustable liquid fertilizer spraying system and evaluate its functionality. Additionally, the density of sugarcane leaves was measured using a webcam. The
Section 2 of the study involved examining the precision and effectiveness of the movement direction control of an unmanned tractor prototype.
2. Materials and Methods
The research involves designing and fabricating a remote-controlled variable-rate sprayer mounted on a driverless tractor. This system is specifically tailored for use in sugarcane fields. It utilizes a webcam and real-time image processing to monitor the size and density of sugarcane plants, adjusting the spray rate accordingly.
2.1. Field Experiments and Procedural Steps
The experimental field for sugarcane cultivation as shown in
Table 1 was located in the Petchabun province of Thailand (16.4718° N, 101.2528° E). The method of planting included embedding the cane into the soil to a depth of 25 cm, using a roller to cover the soil surface, and planting sugarcane in 4 rows with a distance of 20 cm. This method resulted in fewer weeds while underground moisture still existed due to the rolled-over soil. The cane grew to about 0.60 m high in three months. The planting method only requires vertically laid sugarcane.
2.2. Hardware and System Configuration
In the hardware and system configuration section, the research will focus on three main areas:
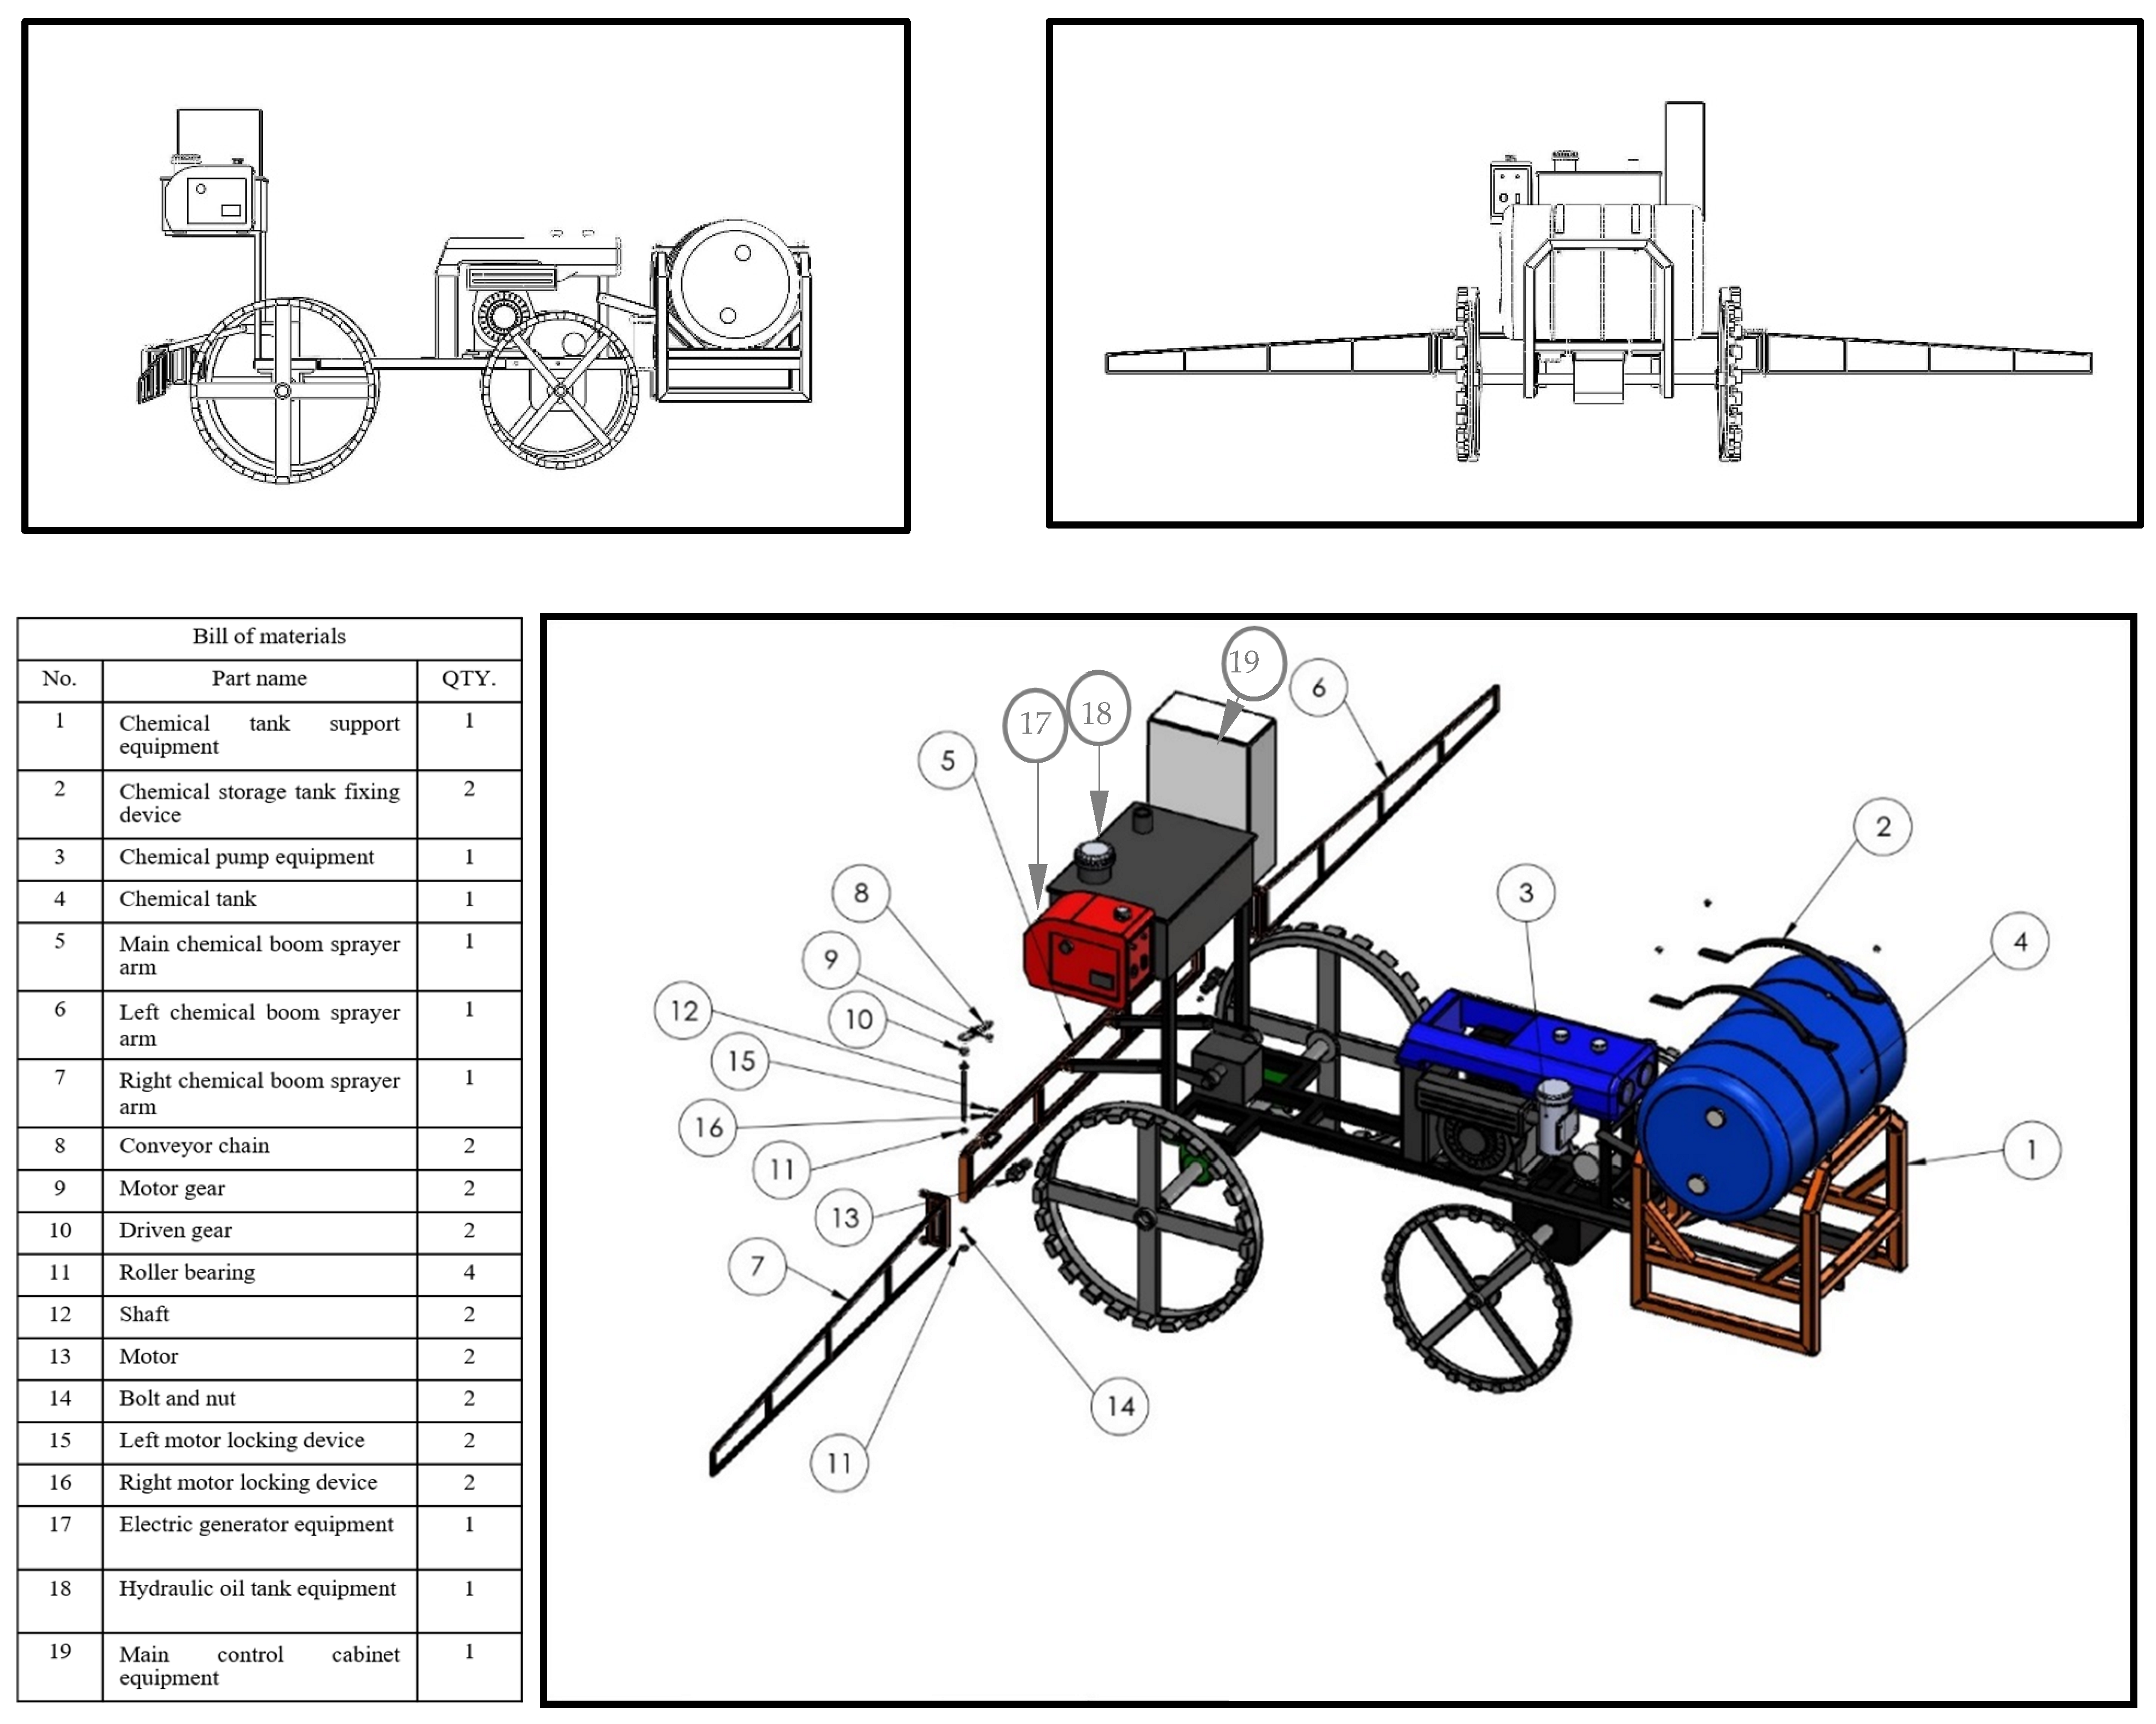
Designing and fabricating a low-cost unmanned remote-controlled tractor
Designing and fabricating a variable rate chemical sprayer with a remote monitoring system
Developing an image processing algorithm
2.2.1. Design and Fabrication of a Low-Cost Unmanned Remote-Controlled Tractor
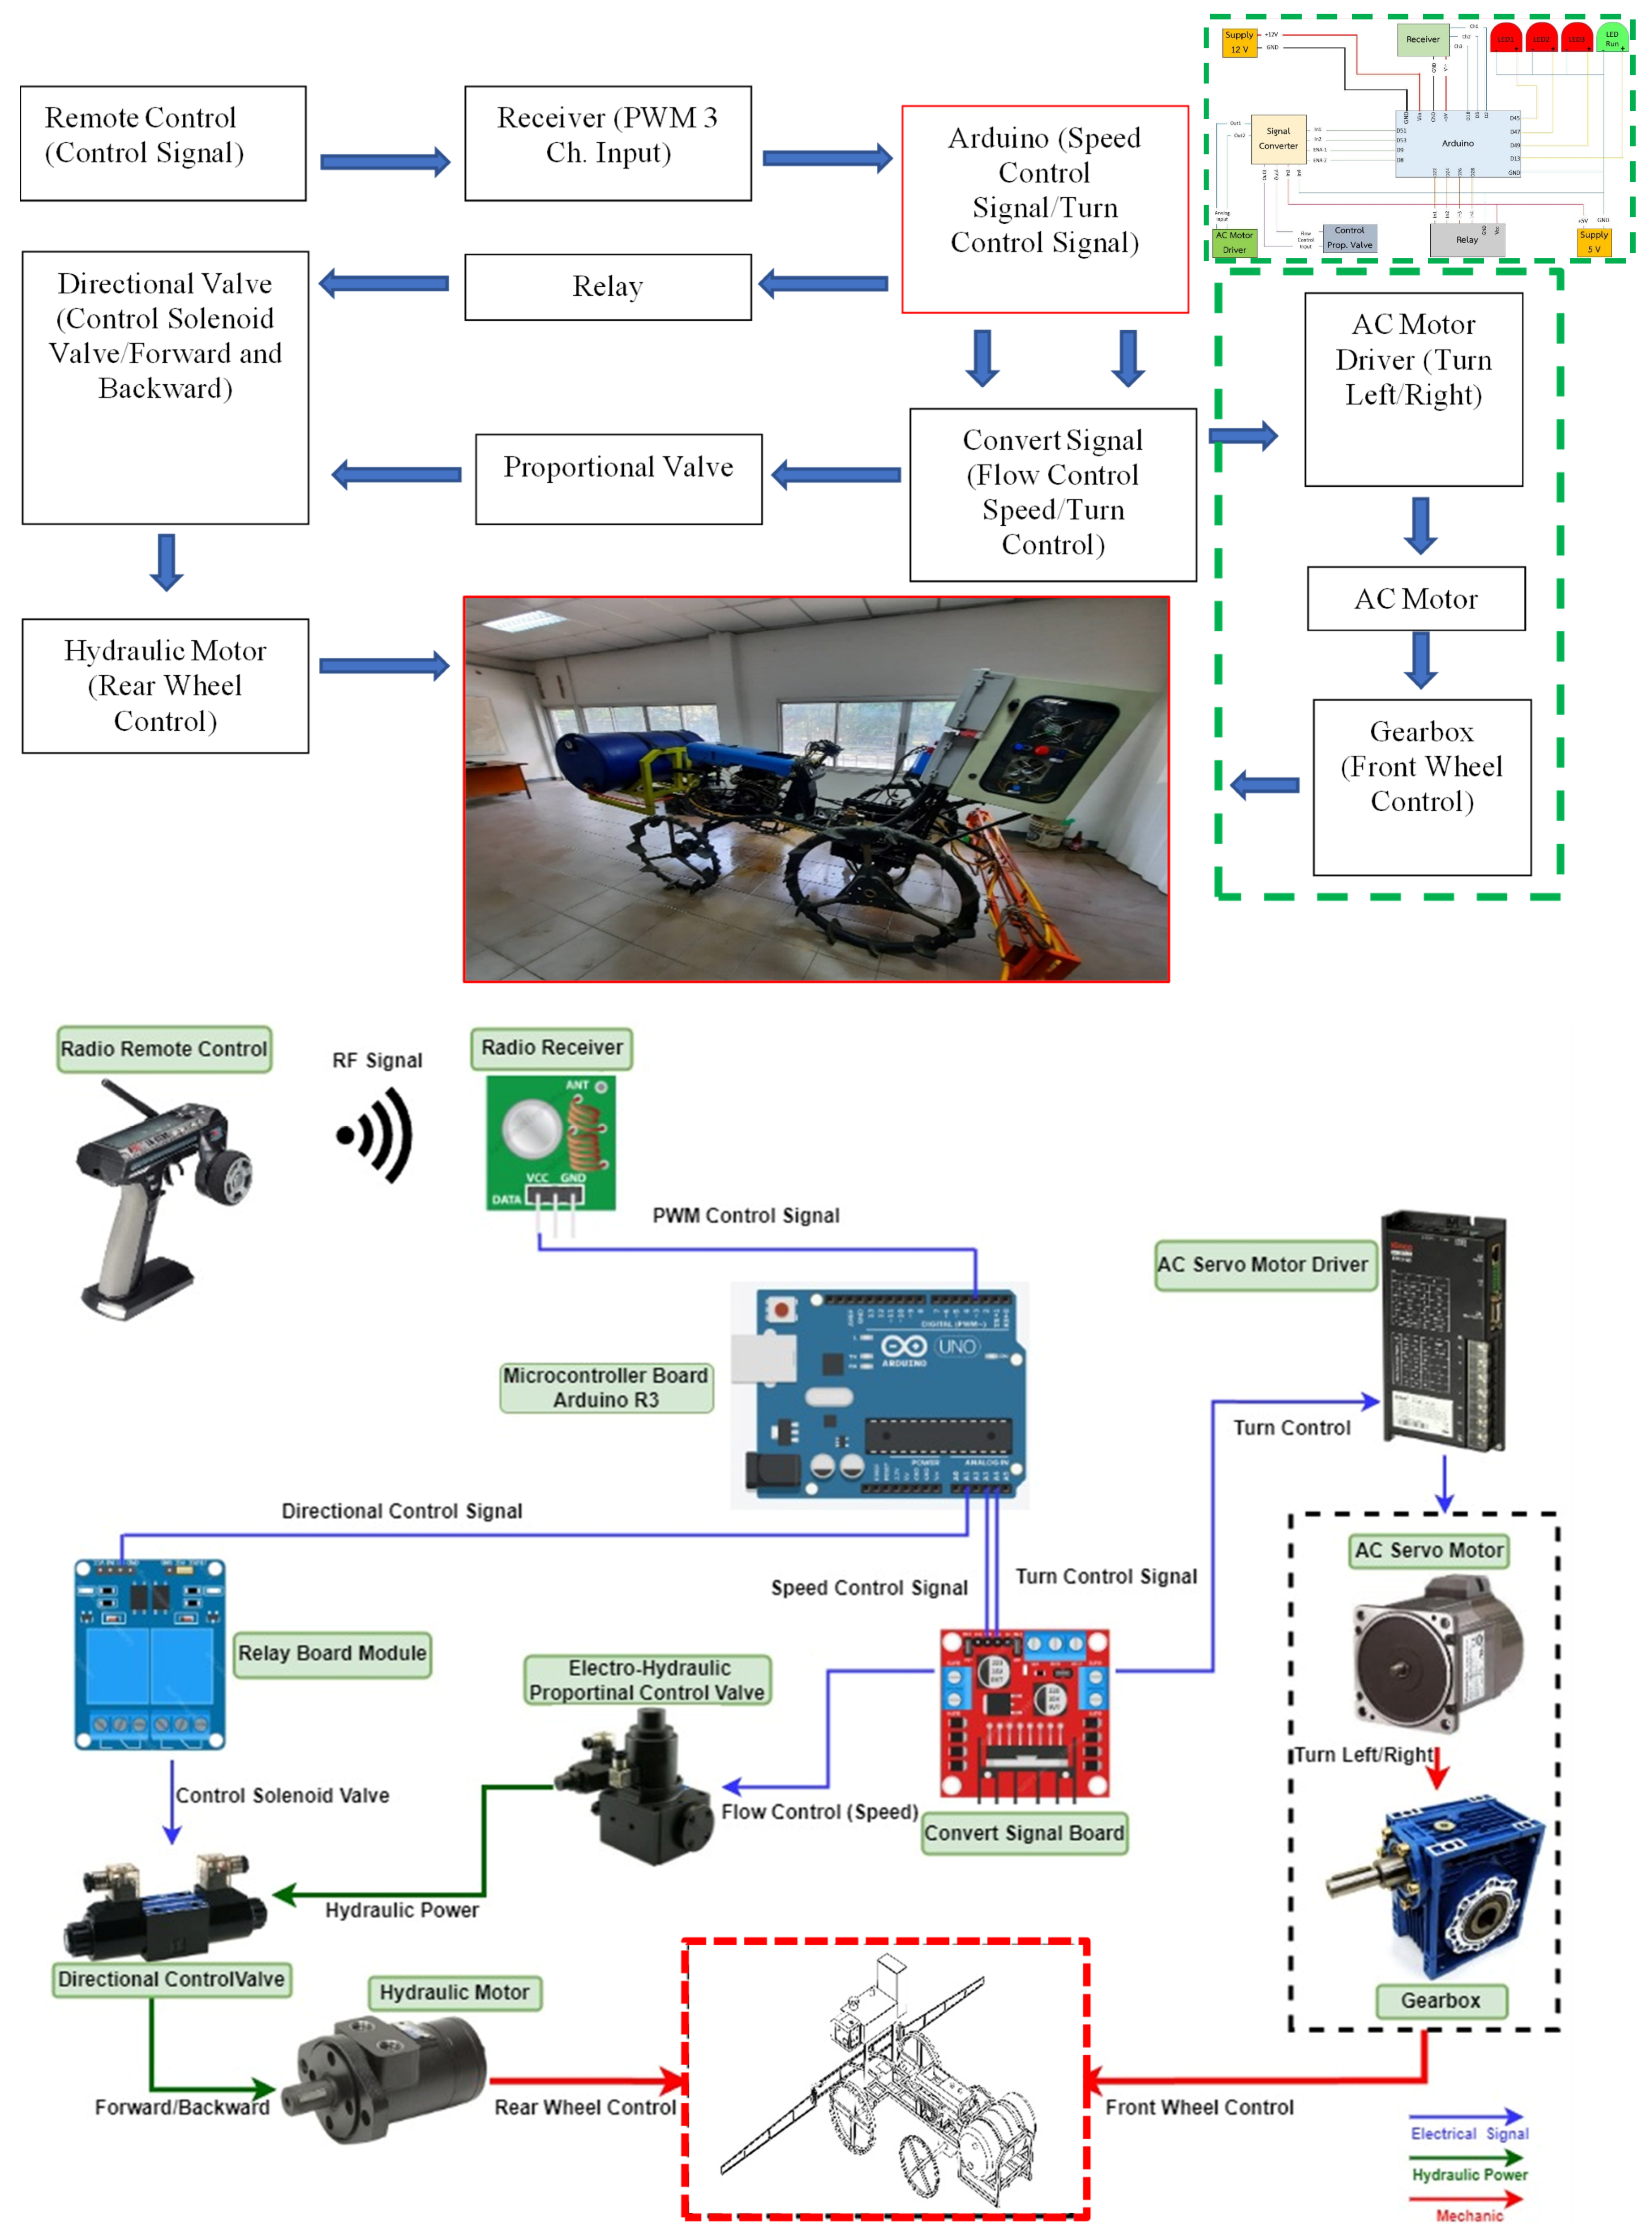
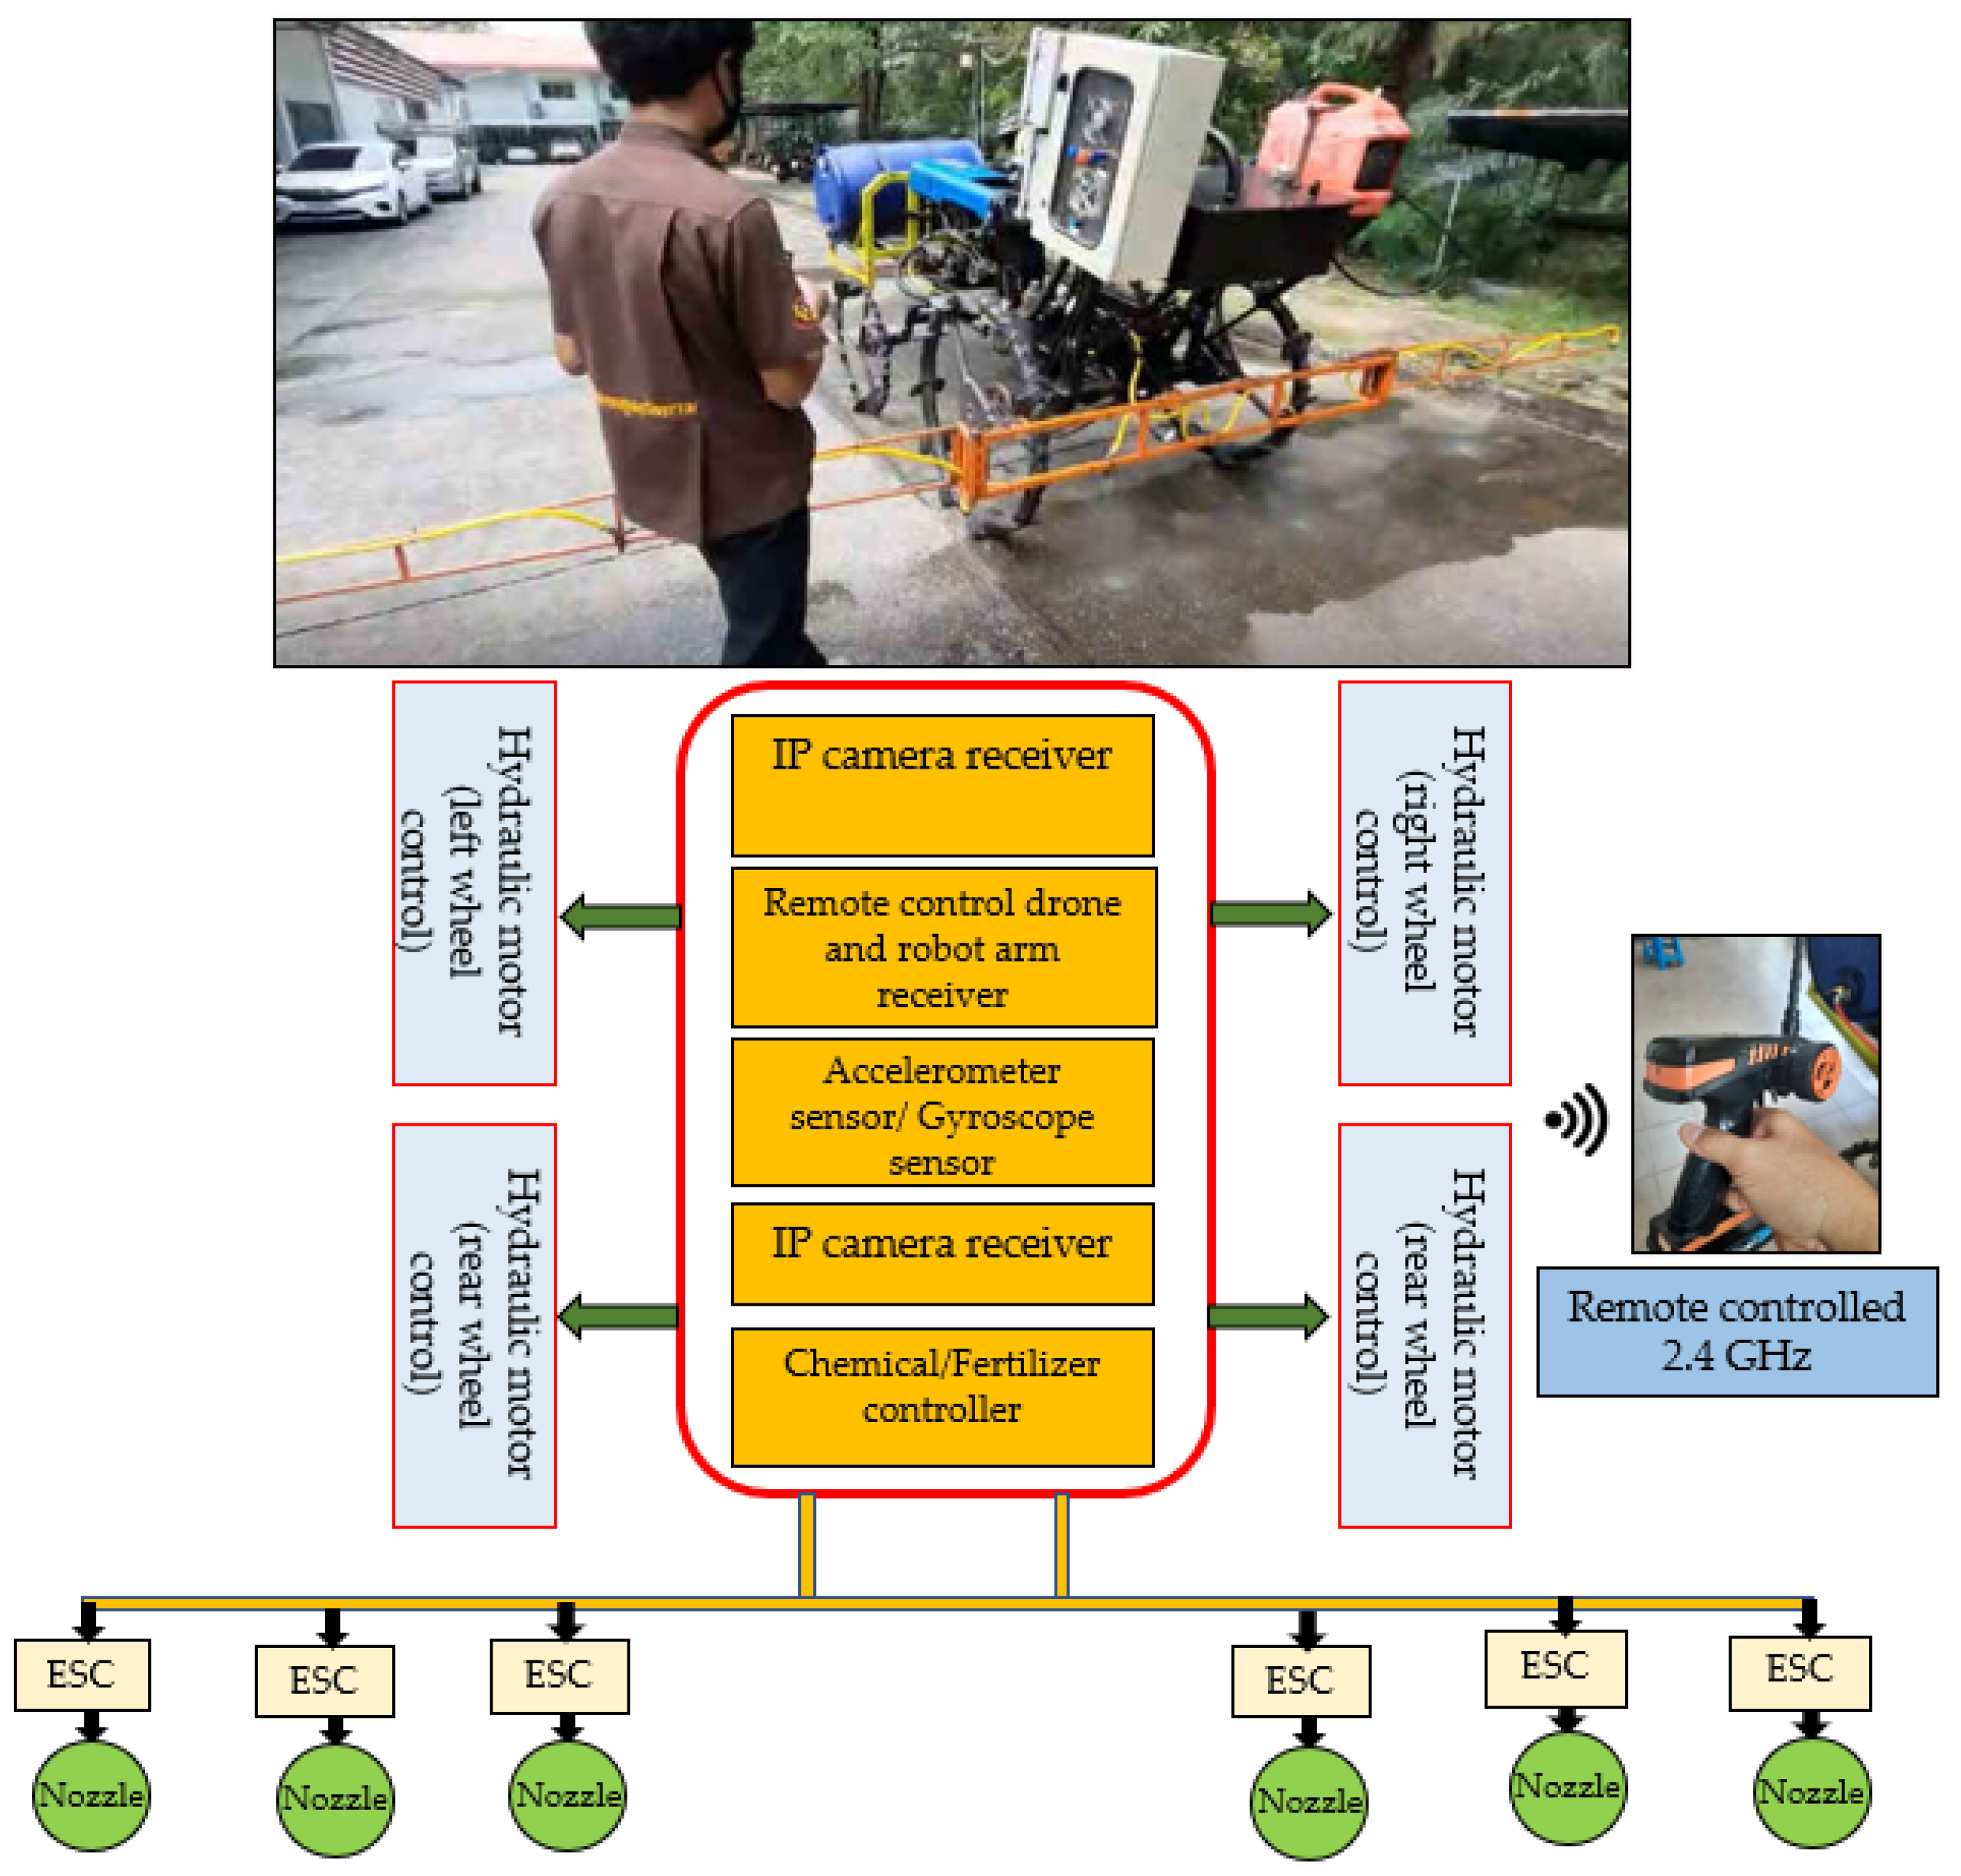
In this research, a remote-control tractor with a radio control signal was designed and fabricated. The selected tractor has 15 horsepower. The drive pattern was controlled by the Arduino control board (Microcontroller ATmega328; Shenzhen Shanghai Technology Co., Ltd. (Shenzhen, China)), which receives the command signal from the remote control and then orders the tractor’s speed and steering to turn left or right as shown in
Figure 1. Later, it starts with the converted signal device to convert the signal sent from the control board to control the forward and backward. When the conversion is complete, it will be sent to the flow control device through the proportional valve device, which will be forwarded to the control solenoid valve device, which will control the forward and reverse movement of the hydraulic motor device. Finally, the steering turn from left to right was designed. It starts by receiving the command signal from the control board. The turn control signal transmits a signal to the AC motor driver device, which controls the operation of the gearbox in the AC motor to turn left or right at the front wheel control area.
2.2.2. Design and Fabrication of the Variable Rate Chemical Sprayer with Remote Monitoring System
The workflow of the remote-control spray system in this study is from 10:30 a.m. to 12:30 p.m. local time, and the image data of the top of the sugarcane tree will be collected under cloudless conditions. Wimicro USB 2.0 UVC PC Camera, SWIFT-TECH Electronics Co., Ltd., Beijing, China (Tokyo Dongfang Electric Machinery Co., Ltd., Tokyo, Japan), through the development and calibration of a precision remote control spray prototype with the best parameters, which are the size of the nozzle, the length of the boom arm and the appropriate connection of control units to achieve accurate injection volume per cycle, covering ROI. Later, an algorithm was created to control the amount of spray per cycle. The algorithm is designed based on the ratio of sugarcane density to growth level in pixel area (pixel to pixel). The field testing of the sugarcane plantation was carried out together with the automatic spraying system. The prototype was improved until its performance was found satisfactory. The key parameters affecting the operation of the spray system are the relationship between density and area of sugarcane, the ratio of injection volume, and the relationship between spraying frequency and spray chemical concentration. The spraying system is composed of a nozzle (Green Water Atlantis Technology (Thailand) Co., Ltd. in Nonthaburi, Thailand), an electric pump (LEE SAE imported (1975) limited series, Bangkok, Thailand), a microcontroller board (Shenzhen Shanhai Technology Co., Ltd., Shenzhen, China), 8 Relay Module (Bangkok Electronics Co., Ltd., Bangkok, Thailand), etc.
2.2.3. Image Processing Algorithm Created
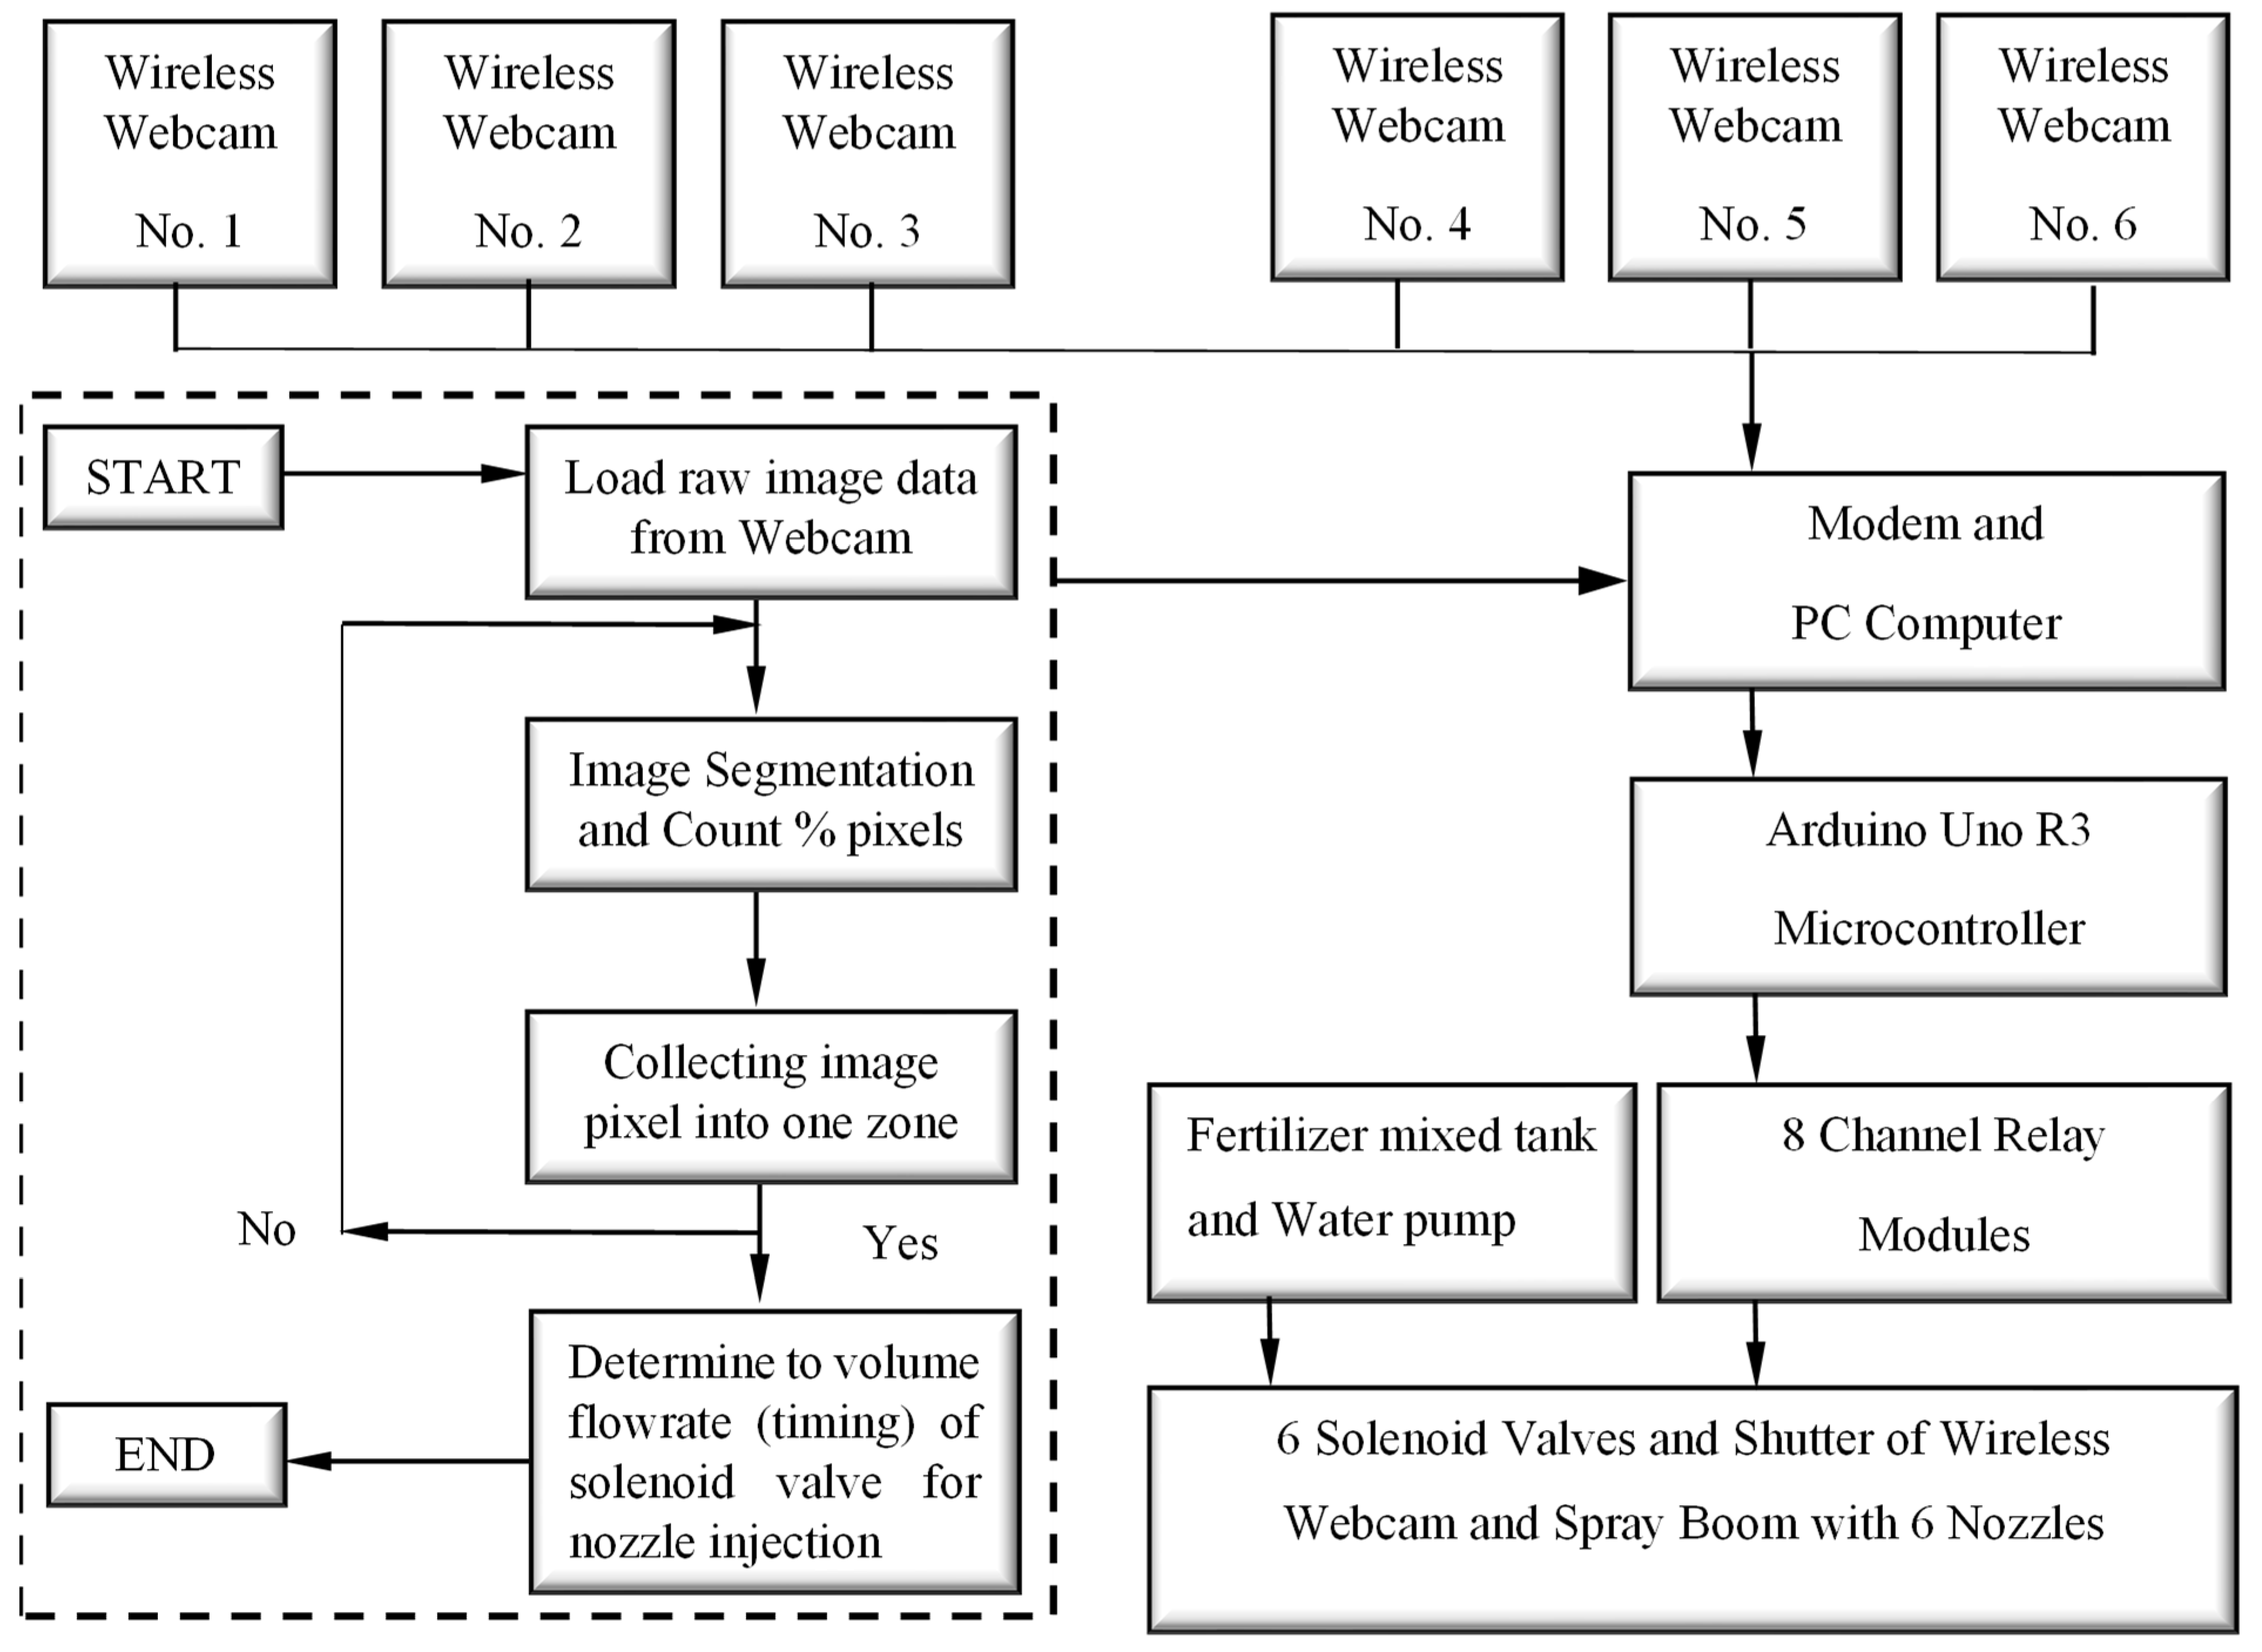
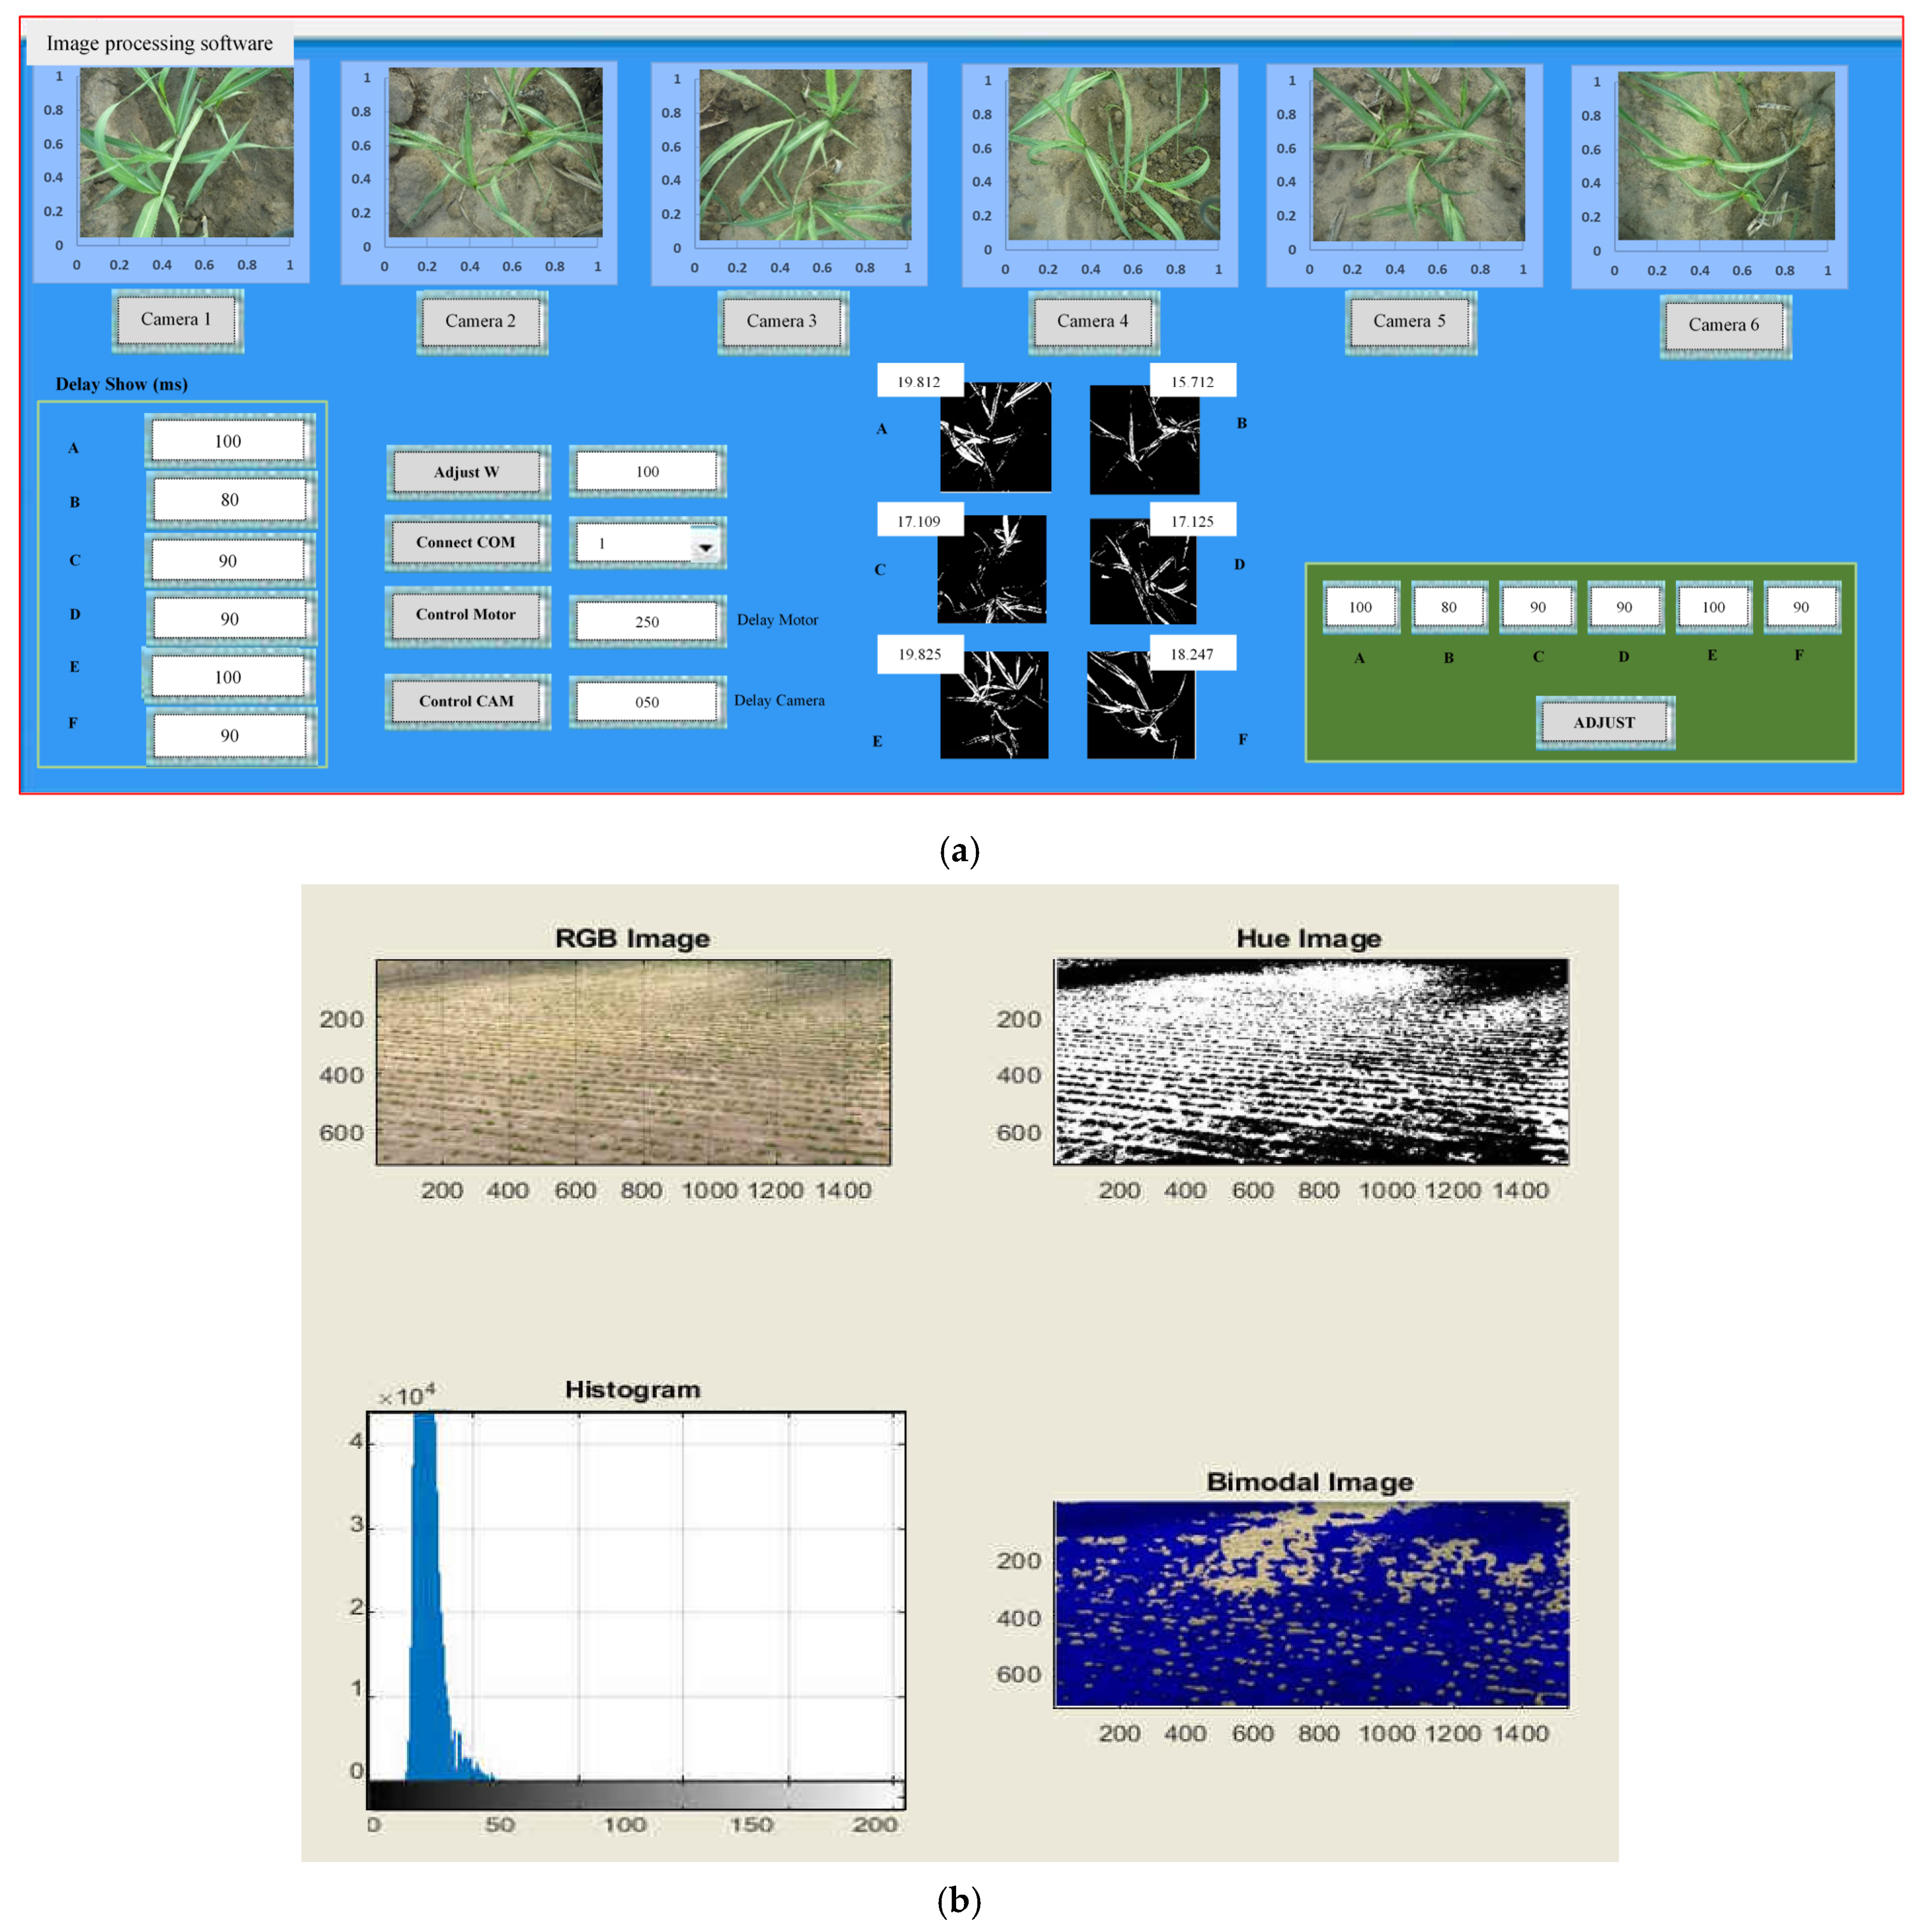
This research focuses on an algorithm designed for processing aerial images to separate the target object from the background. The software utilizes aerial images of sugarcane captured by a wireless webcam mounted on the chemical spraying arm. It then calculates the percentage of sugarcane density per area. The results are displayed on the program’s screen, and the color images are converted to grayscale, yielding a digital value. If the calculated value indicates “Yes,” this information is relayed to the sprayer’s flow rate control via a solenoid valve, which adjusts the timing of chemical spraying for each cycle. The system implements a variable rate spraying approach. The algorithm translates pixels into digital numbers and modifies the pump’s operation based on the delay time of the solenoid valve device. The system’s accuracy and quality rely heavily on the algorithm’s ability to convert aerial images into digital values, as illustrated in
Figure 2. Conversely, if the result is “No,” the algorithm reprocesses the image by performing segmentation and pixel counting again, saving the processed images on the computer’s hard disk.
2.3. Field Testing and Performance Evaluation
In general, the unmanned radio-controlled tractor movement can be classified into two patterns: linear trajectory (while spraying) and curve trajectory (while turning) [
32]. In this research, the unmanned radio-controlled tractor trajectory was created using the coordinate system.
The researcher chose a DC servo motor to control the direction and position of the tractor’s steering wheel. Additionally, two sensors were used: a Garmin GPS 72S with 12 channels (GARMIN International, Inc, Olathe, KS, USA), a high-sensitivity GPS receiver by SiRF (San Jose, CA, USA), and an error of not more than 10 m RMS. This GPS can display coordinates in both UTM coordinate systems and the Polulu CHR-6dm IMU sensor, which combines an accelerometer, gyroscope, and compass to measure values in 3 axes: X, Y, and Z at a 300 MHz frequency signal. The IMU sensor has a built-in EKF (Extended Kalman Filter; Beitian RTK Module ZED-F9P, GPS GNSS BT-F9P; BEITIAN Official Store, Guangdong, China) system and is connected via UART using 3.3 V current to power the circuit, making it a high-precision sensor. The trajectory equations are described below.
2.3.1. Linear Trajectory
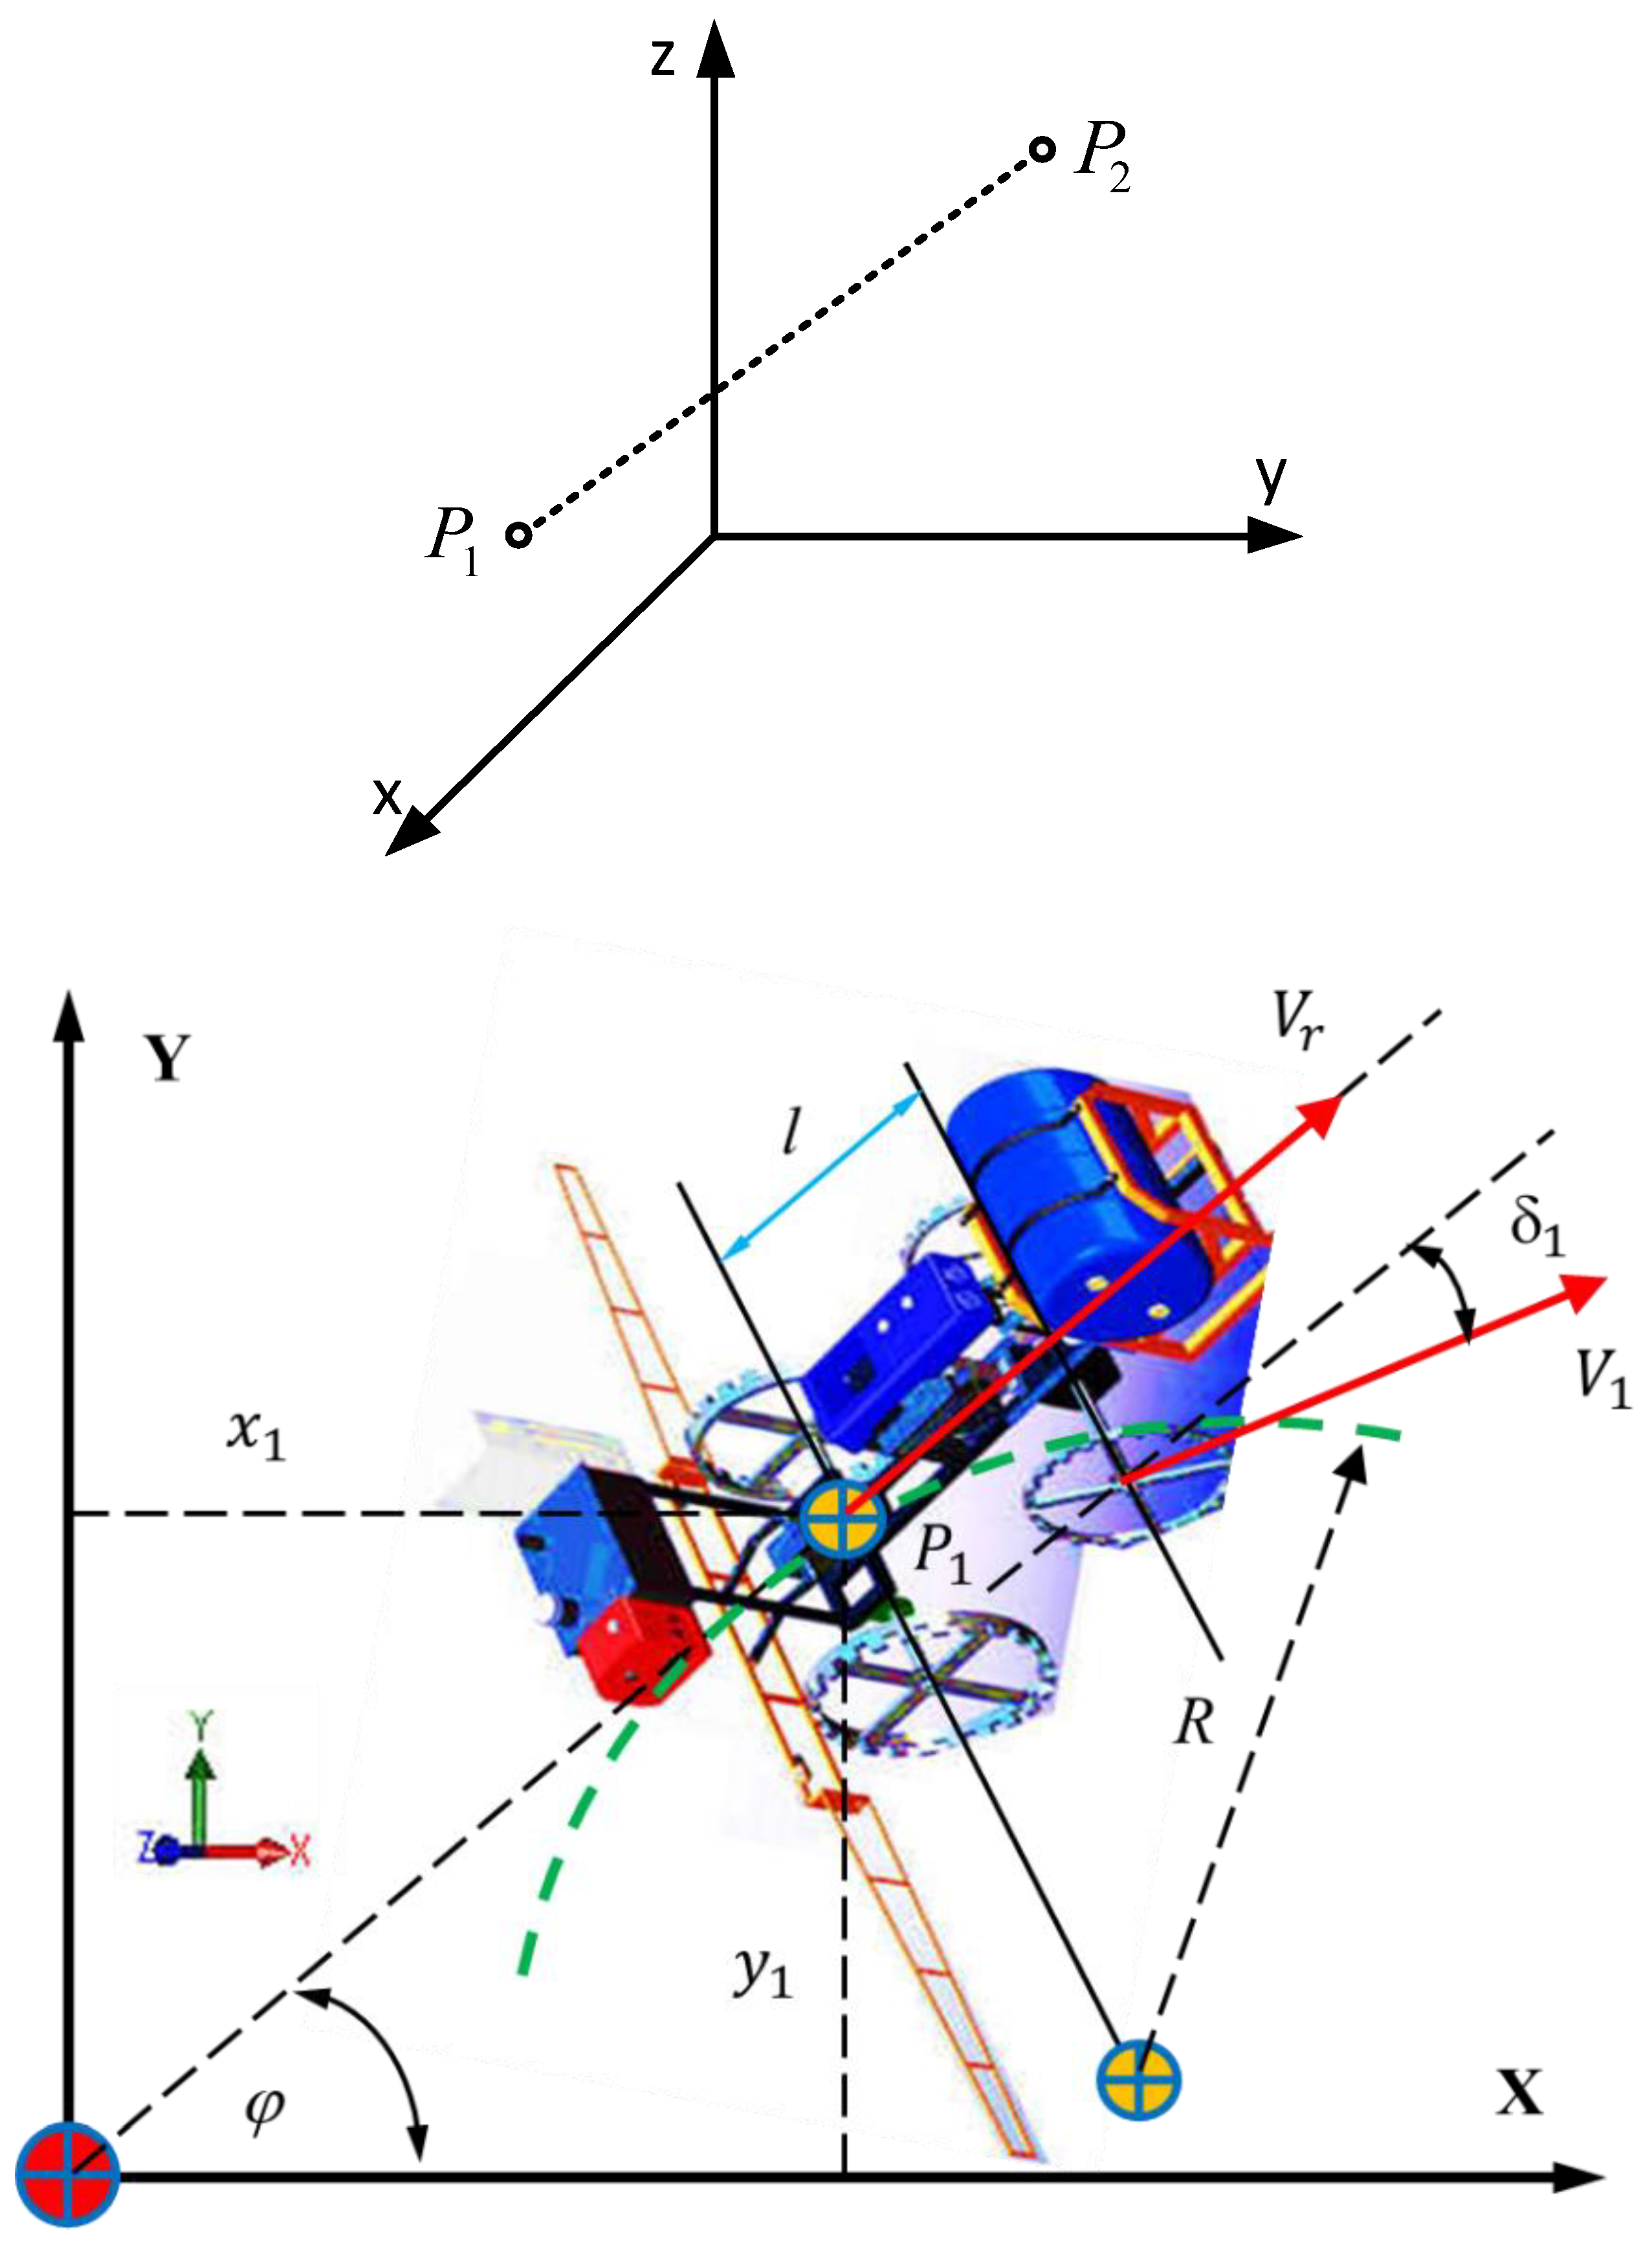
To let the unmanned radio-controlled tractor, move linearly as shown in
Figure 3, the points were marked so that
P1 was the starting point and
P2 was the finish point. The distance between
P1 and
P2 was calculated using the following equation:
Parameter s in Equation (1) showed the ratio of position to traveling distance of the unmanned radio-controlled tractor, which was calculated using Equation (2).
where
l = linear distance that the unmanned radio-controlled tractor traveled.
d = variable, which is the function of time that controlled the velocity profile of the tractor’s linear movement
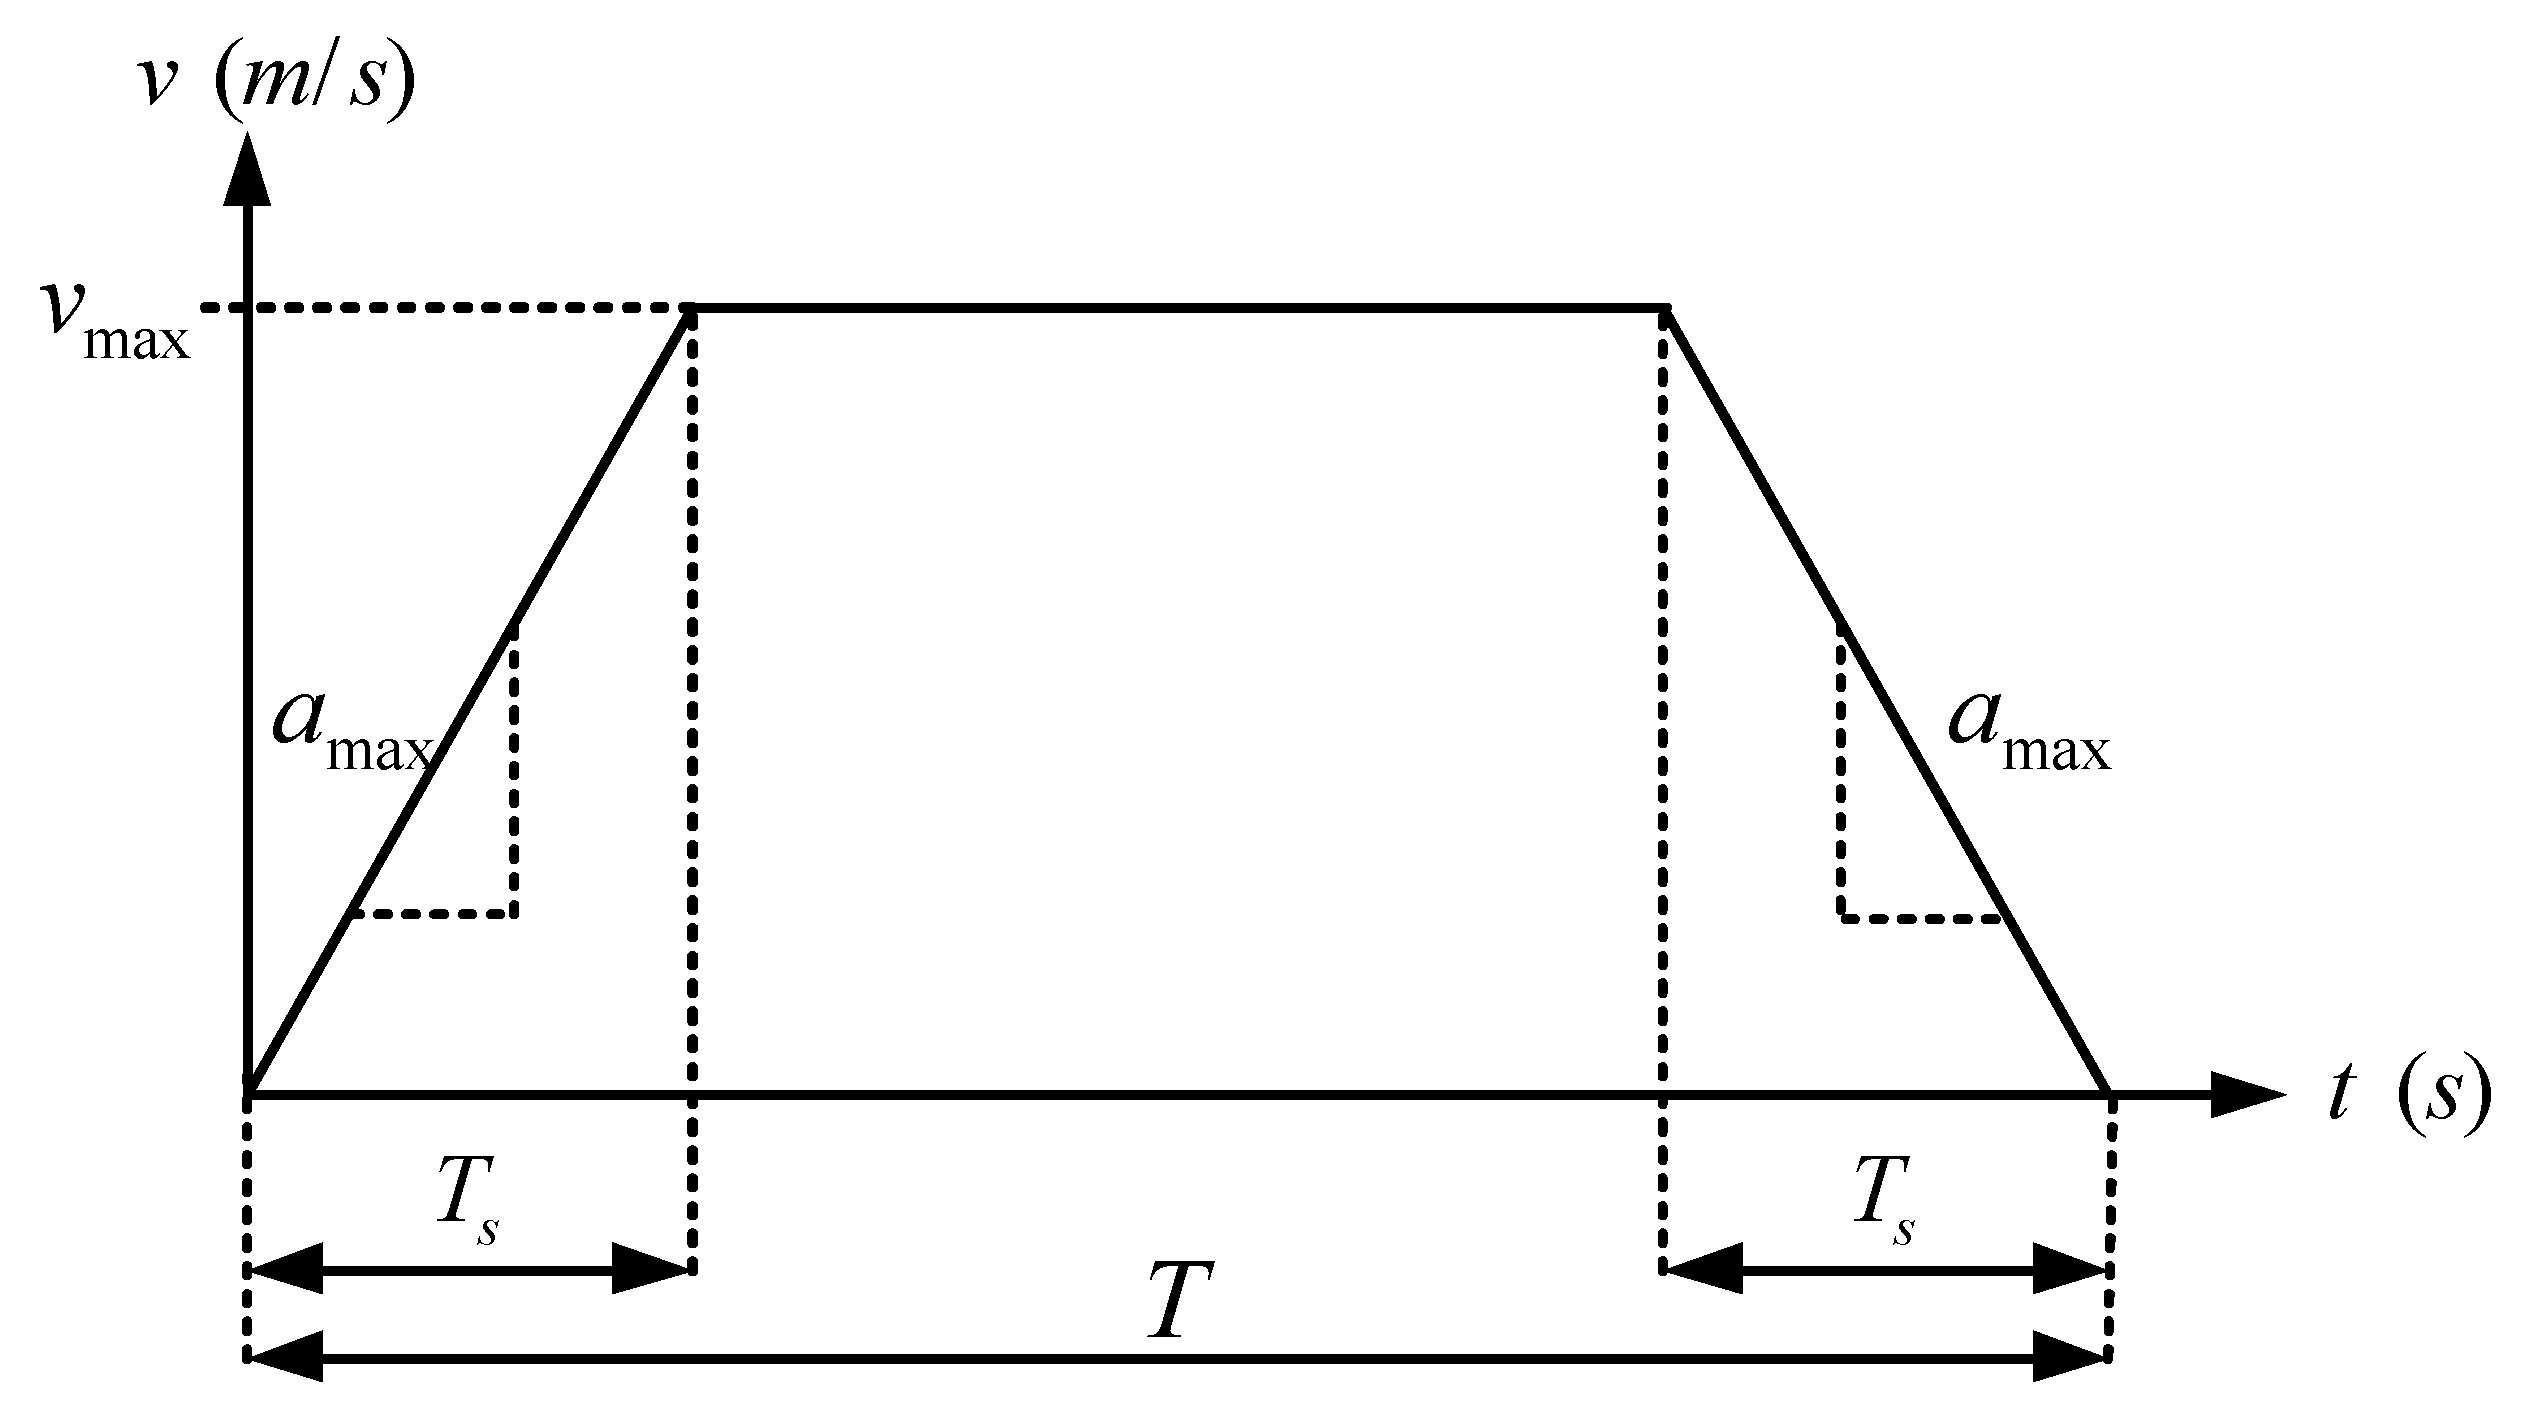
In this study, the velocity profile was set as a trapezoidal velocity profile, as shown in
Figure 4.
Variable
d was calculated using the following time-period equations:
where
t and
T were time and time tractor traveled from
P1 to
P2 (s), respectively. In addition,
vmax and
amax were the tractor’s maximum velocity (m/s) and maximum acceleration (m/s
2), respectively.
2.3.2. Curve Trajectory
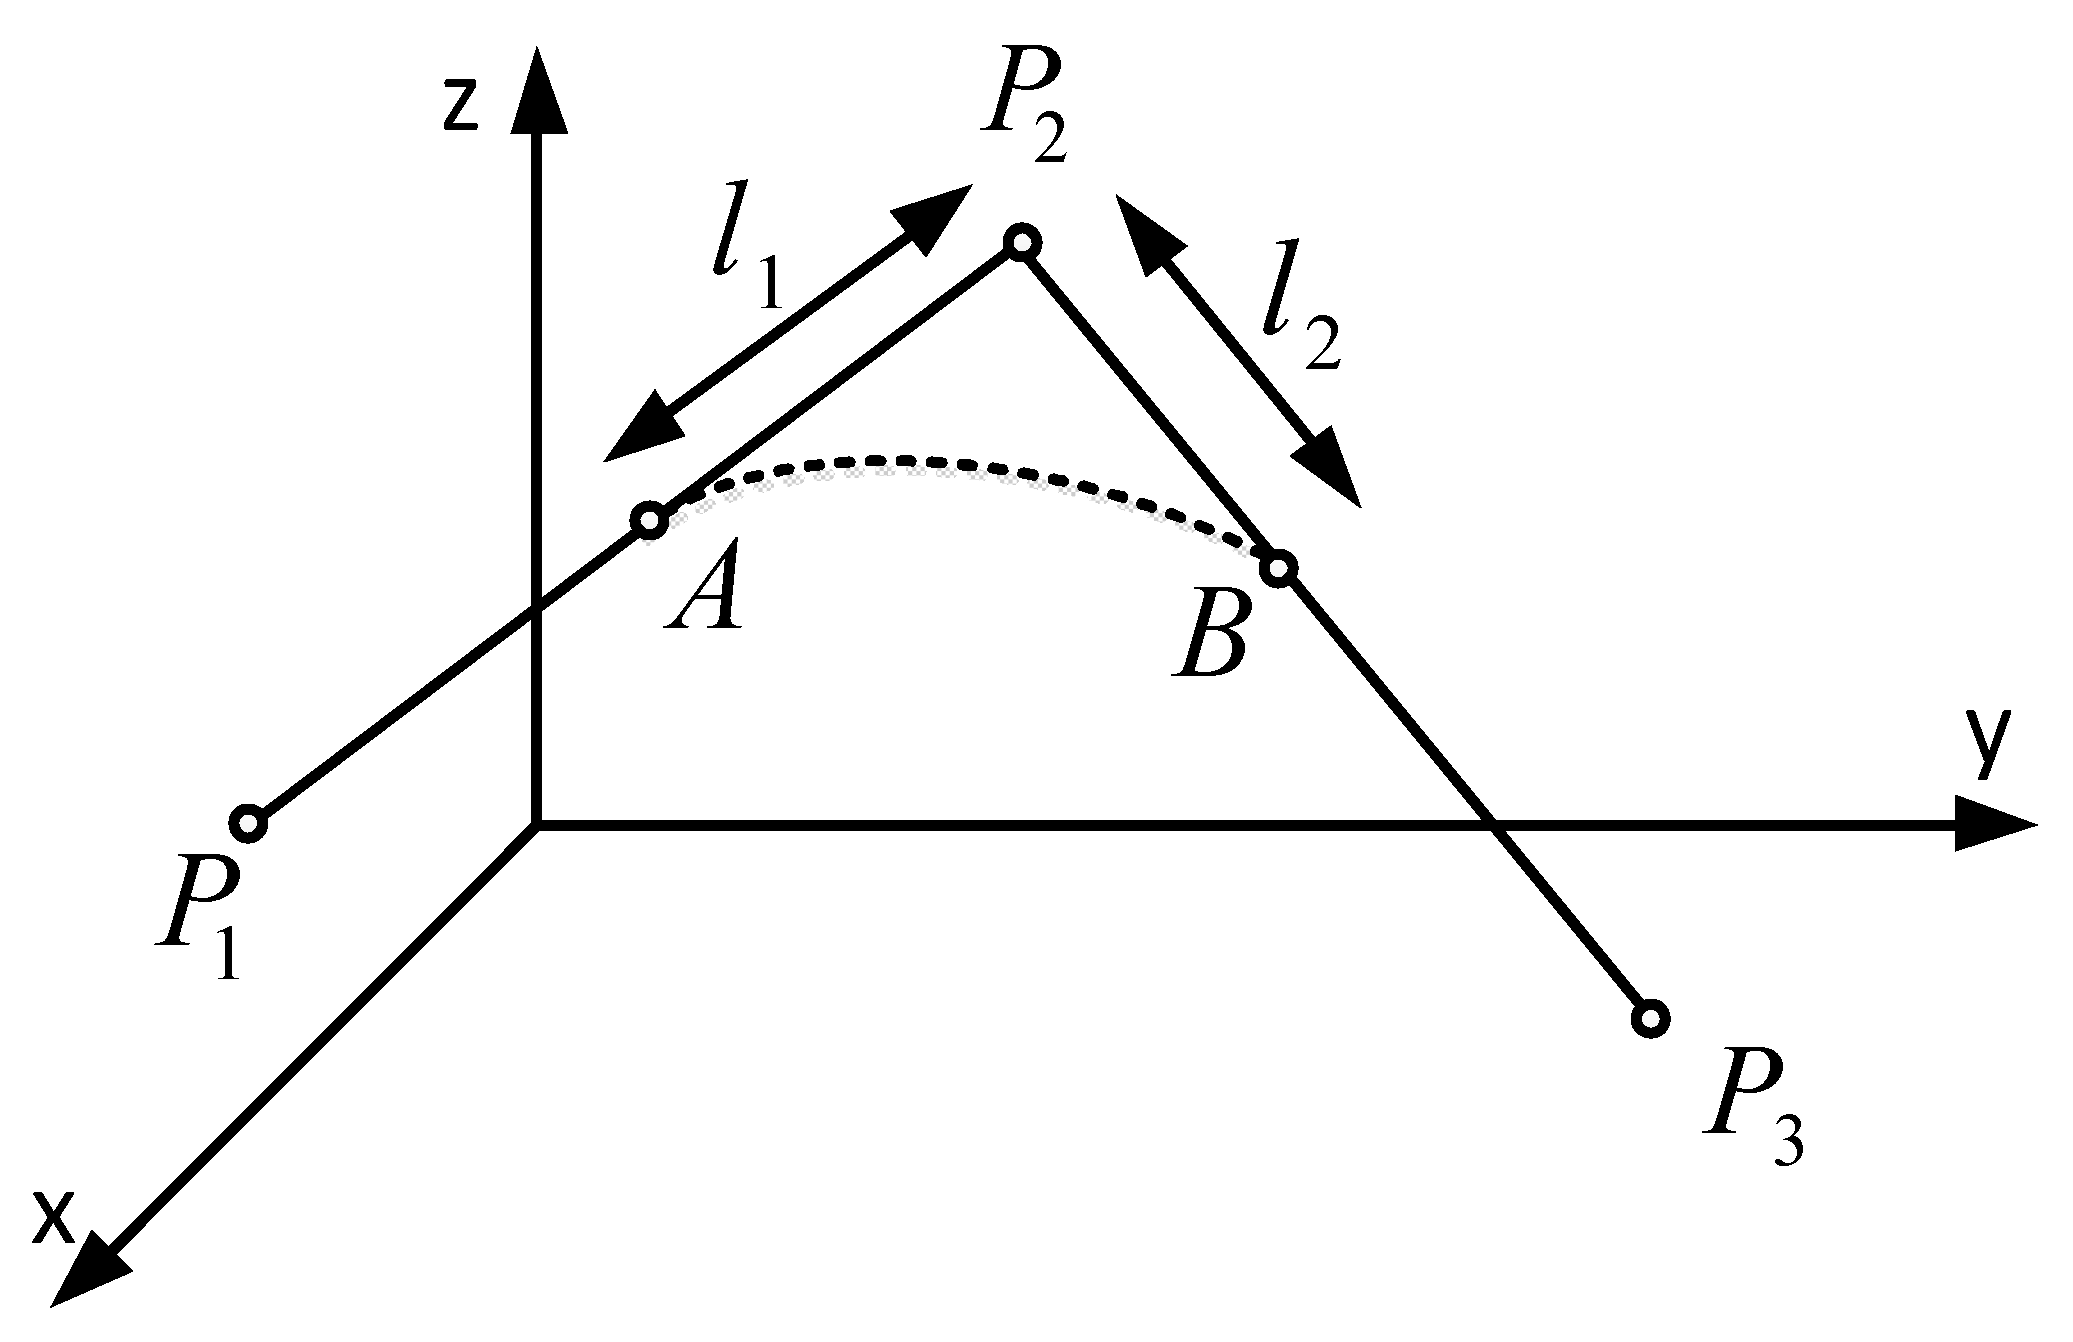
The unmanned radio-controlled tractor follows a curved trajectory composed of two straight lines connected by a dashed line, as shown in
Figure 5. The dashed line starts at point A on the first straight line and ends at point B on the second straight line. The point between A and B on the curve is calculated using an equation [
33].
Equation (4) gives the velocities of the unmanned radio-controlled tractor on the first and second straight lines as
V1 and
V2, respectively. The directional vectors are
n12 and
n23, and the time difference (Δ
t) is calculated using Equations (5)–(7).
2.4. Testing of a Variable Rate Sprayer (VRT) with Unmanned Remote-Control Tractor Mounted for Actual Performance, Fuel Consumption Rate, Electricity Consumption Rate
2.4.1. Slip Test
We measured the traveling distance of a variable rate sprayer (VRT) on an unmanned remote-control tractor-mounted wheel by counting wheel revolutions and multiplying by the circumference. To calculate the percentage slip, we measured the actual traveling distance with a measuring tape and steel markers at the starting and finishing points and repeated the test three times for one plot.
2.4.2. Working Speed
The study measured the speed of a VRT with an unmanned remote-control tractor by recording the time taken to pass two poles placed 10 m apart. This process was repeated five times per plot.
2.4.3. Fuel Consumption
Before starting work, the fuel tank was fully charged. Fuel consumption per plot was measured using a volumetric beaker. The objective of the test was to evaluate the performance of the unmanned remote-control tractor-mounted variable rate sprayer (VRT) within a 10 m radius. The factors considered in the test were competency, fuel consumption rate, and electricity consumption rate. The specifics are as follows:
- (a)
Actual working performance of a variable rate sprayer (VRT) with unmanned remote-control tractor mounted (ha/h).
- (b)
Fuel consumption rate of a variable rate sprayer (VRT) with unmanned remote-control tractor mounted (L/h).
- (c)
Electricity consumption rate of a variable rate sprayer (VRT) with unmanned remote-control tractor mounted (kWh).
where I = electricity current (Ampere)
V = electromotive force (Volt)
2.4.4. Calibration
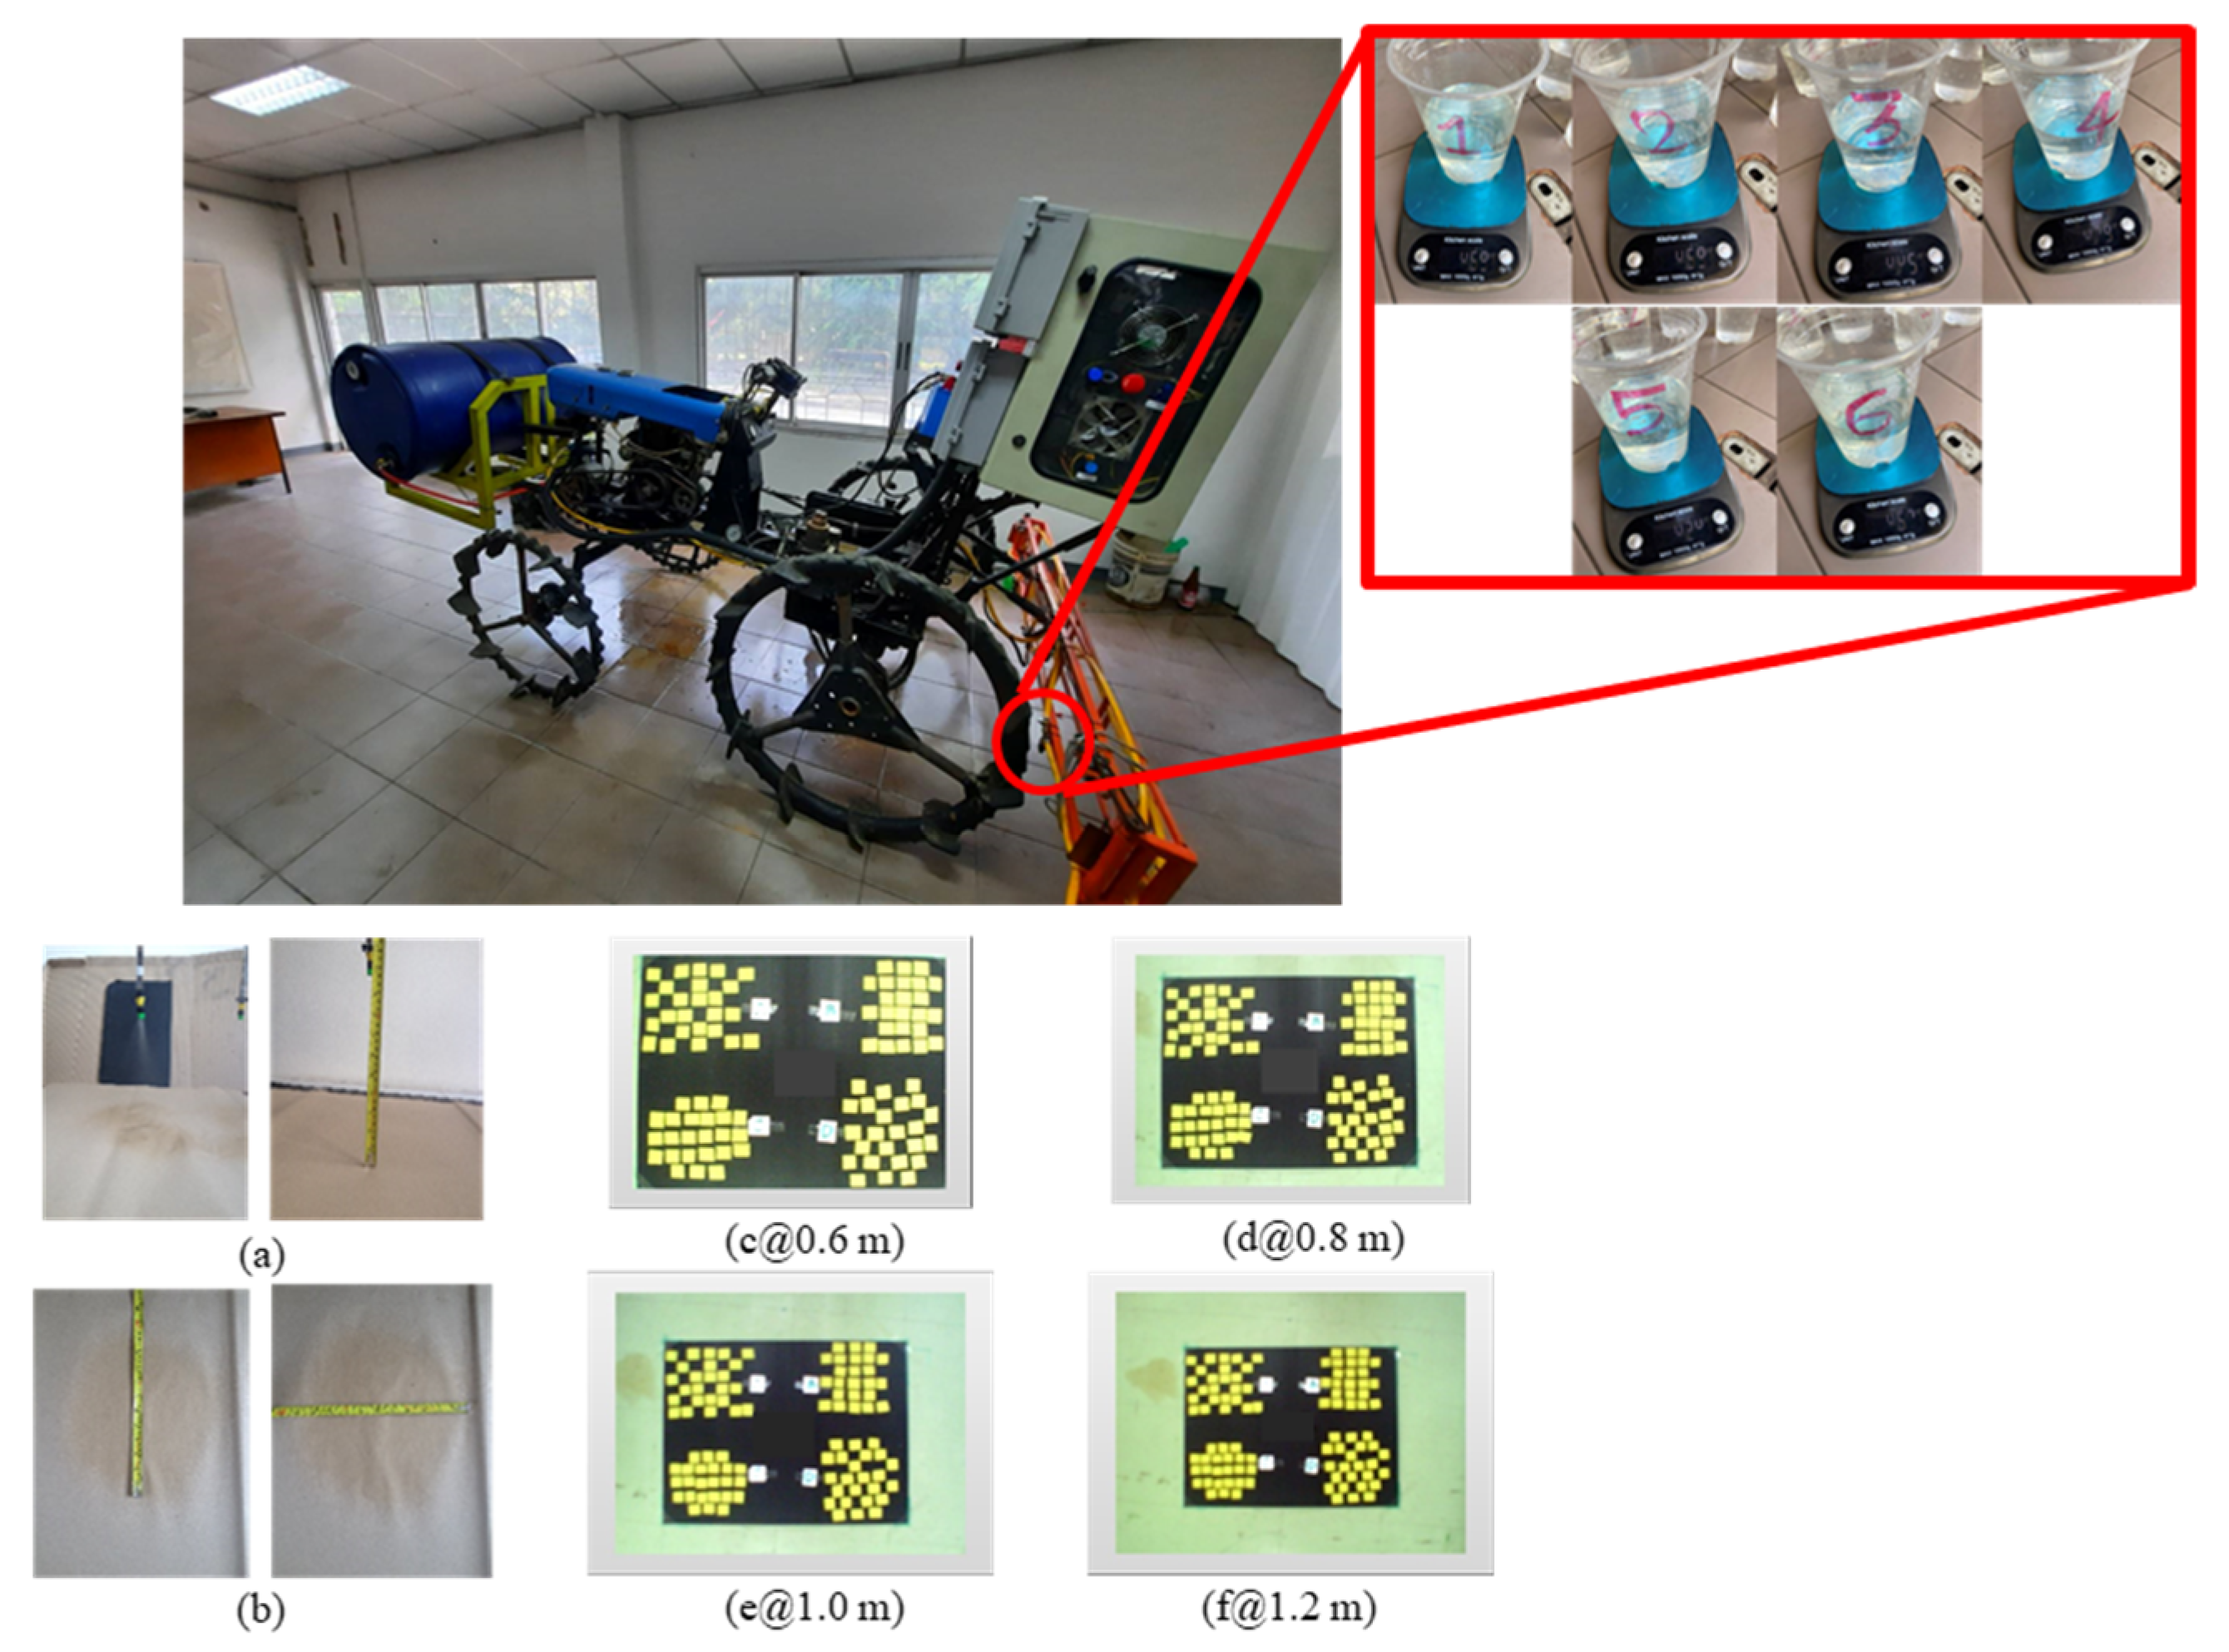
For a suitable spraying footprint (diameter, cm) and altitude levels of the nozzle (m), the accuracy of a target covered by spray was assessed using a standard reference frame of 50 cm by 50 cm. Different samples were kept in the reference frame to represent the sugarcane density area, comprising yellow cards with 2.54 cm by 2.54 cm dimensions. Trials were made with sheets of three sample color groups (100 pieces), which were kept at different heights from the nozzle (0.25 m, 0.50 m, and 0.75 m), as shown in
Figure 6. This calibration included variations in illumination levels with the time of day, as images were collected under cloud-free conditions between 10:30 and 12:30 standard local time.
2.5. Statistical Analysis
To collect test results, three measurements will be taken each time. The data will be analyzed using SPSS 11.5 software. An analysis of variance (ANOVA) will determine the significance between treatments by using factorial experiments in CRD (completely randomized design) to determine the effects of simulated stages of sugarcane growth (5, 10, 15, and 20%) and webcam altitude levels (0.6, 0.8, 1.0, and 1.2 m) and the interactions of these variables on the segmented object. Mean values will be compared using Duncan’s multiple range test (DMRT) with a 95% confidence level [
3,
34].
2.6. Mapping and Geostatistical Analysis
In this research, we will create an agricultural application map, namely spraying rate (L/h), moisture content (% db.), and sugarcane density (%) maps. GPS coordinates for latitude and longitude data acquisition (Garmin Legend H Handheld GPS Navigator, 24 MB of internal memory, high-sensitivity, WAAS-enabled GPS receiver in a rugged case, Garmin Ltd., Kansas, MO, USA) were used to store the location data. In practice, grid soil samples were collected in plots at a coordinate distance of 10 m × 10 m. It is possible to determine the moisture content of the soil by taking a soil sample of sufficient weight to dry at 105 °C for 24 h until the soil has dried and has a constant weight. After that, the moisture content was calculated as a percentage (% db.). After that, we will take the information collected by location coordinates and import it into ArcGIS
® software (ArcMap 10.4.1, Esri (Thailand) Co., Ltd., Nanglinchee Road, Bangkok, Thailand). To calculate cell values for geostatistical analysis, a linearly weighted combination of a set of sample points was combined with the inverse distance weighted (IDW) interpolation procedure. The inverse distance was a factor in determining the weight. An interpolated surface should represent a location-dependent variable. Finally, we will provide sugarcane growers with agricultural application maps for the next crop [
3,
34].
3. Results and Discussion
The performance of a variable-rate sprayer mounted on an unmanned remote-controlled tractor for sugarcane plantations depends on fertilizer and crop conditions in
Figure 7. The tests must clearly state the fertilizer conditions, including type, concentration, and formulation, as well as the field conditions, such as the area, shape, and moisture content of the soil, and the type of nozzle used [
5,
6,
7,
8]. Firstly, the condition of the fertilizer, the name of the fertilizer as foliar fertilizer, and the concentration and type of formulation were 18.75 L/ha and 25–0–0 +0.5% B. Secondly, the condition of the kind of field was lowland, and the area and shape of the test field were 40 m × 40 m on the type and character of clay soil. The moisture content of the soil was 22% db. In addition, the name and variety were Khon Kaen 3, which is currently released as a new sugarcane cultivar for the Northeast and a hybrid between clones 85–2–352 and K 84–200 that gives a yield of around 125 tons per hectare. The planting method was a double-row planter, and the age after planting and crop height were 3 months and 40–60 cm, with row spacing and hill distance of 40 cm and 190 cm, respectively. Finally, the condition of implementation with adjustment of discharge rate was 12–60 L/h. spraying rate at 1 bar of pressure, and the type of nozzle was a full cone with the forward speed of the operator being 0.9–2.7 km/h [
9,
10].
3.1. Calibration of the Image Processing Algorithm
The calibration accuracy of image data processing was evaluated by using digital image processing with specific commands designed to process a sample sheet in green shades. These shades of color were represented by the surface area at the top of the sugarcane that grows in the modern plantation. The calibration data was studied at a specified height (0.6 m, 0.8 m, 1.0 m and 1.2 m) with different densities of a sample at 5%, 10%, 15%, and 20%, as illustrated in
Table 2, respectively. The quality of the calibration can be acceptable to process images from a wireless webcam camera that looks at different altitude levels of 0.6 m, 0.8 m, 1.0 m and 1.2 m, respectively. The densities of the sample sheets of the green color were 5% (25 pieces), 10% (50 pieces), 15% (75 pieces), and 20% (100 pieces), as shown in the densities in the data below in
Figure 8 and
Figure 9 [
24,
25]. The table below shows the effect of height on image processing data from a wireless webcam. The image processing data was found to have a significant difference at a 95% confidence level, with the best accuracy at 0.6 m to 0.8 m. Separating image areas involves distinguishing the object of interest from the background or any unwanted elements. This can be achieved using various techniques, one of which is thresholding. The basic principle of thresholding is to convert a grayscale image into a binary image with values of either 0 or 1 based on a defined threshold. If a pixel’s value is greater than or equal to the threshold, it is assigned a value of 0 (black). Conversely, if the pixel’s value is less than the threshold, it is assigned a value of 1 (white). Finding the optimal threshold value typically requires analyzing the image histogram, which can be challenging in real-world situations. Variations in lighting can complicate the establishment of a consistent threshold. To address this issue, we can use Otsu’s Thresholding method, which automatically determines the appropriate threshold value. Once the threshold is identified, we can count the pixels of the object of interest and use this information to inform our decisions regarding variable rate spraying.
The green color represents the percentage of sugarcane crop growth stages. The color sample range includes 5%, 10%, 15%, and 20%, while the height range (m) of the webcam is 0.6, 0.8, 1.0, and 1.2. The statistical significance of these values is related to the algorithm quality of segmented objects, with a confidence level of 95%.
As the density and height of the camera increase, the number of segmented objects also increases. The green sample of 20% is provided when the webcam altitude is 1.0 m, which leads to the highest number of segmented objects (16.289) due to the best focal length. In contrast, the green sample rate of 5% is provided at the webcam altitude of 0.6 m, resulting in the lowest number of segmented objects (3.997) due to the minimum focal length and clarity of the webcam [
28,
29,
30].
Based on the information provided, it is apparent that the simulated stage of infected sugarcane is represented by the color yellow. The sample ranges from 5% to 20%, and the height range of the webcam is from 0.6 to 1.2. This has a significant impact on the quality of segmented object algorithms, with a statistical significance of 95%, as illustrated in
Table 3. As the height of the camera increases, the number of segmented objects also increases, and the density range turns yellow. At a rate of 20%, segmented object accuracy is achieved at a height of 1.0 m, which is the optimal height for a webcam with a focal length of 13.234. At a height of 0.6 m, a rate of 5% of the color samples provides segmentation accuracy. The smallest object (3.756) can be attributed to the webcam’s minimum focal length and clarity [
29,
31].
The percentage values represent different stages of sugarcane maturity, ranging from 5%, 10%, 15%, and 20% in brown color samples, and webcam altitude levels in meters ranging from 0.6, 0.8, 1.0, and 1.2, which had a statistically significant effect on the segmented object with a 95% confidence level as illustrated in
Table 4. When the density is higher, higher camera heights produce more segmented objects, except at camera heights of 0.6 and 0.8. At 20% density, the segmented object is low due to the quality and focus distance of the camera used [
28]. The test is below the distance recommended by the company.
3.2. Calibration of the Chemical Spraying
The effect of the nozzle height levels (m) on the scatter distance of chemicals during spraying as illustrated in
Table 5. The data indicates a significant difference at a 95% confidence level, with higher height levels resulting in greater scatter distances. Optimal accuracy was achieved at a height of 0.25–0.75 m, which can help prevent fertilizer and chemical/pesticide loss.
3.3. Tractor’s Linear Trajectory Test
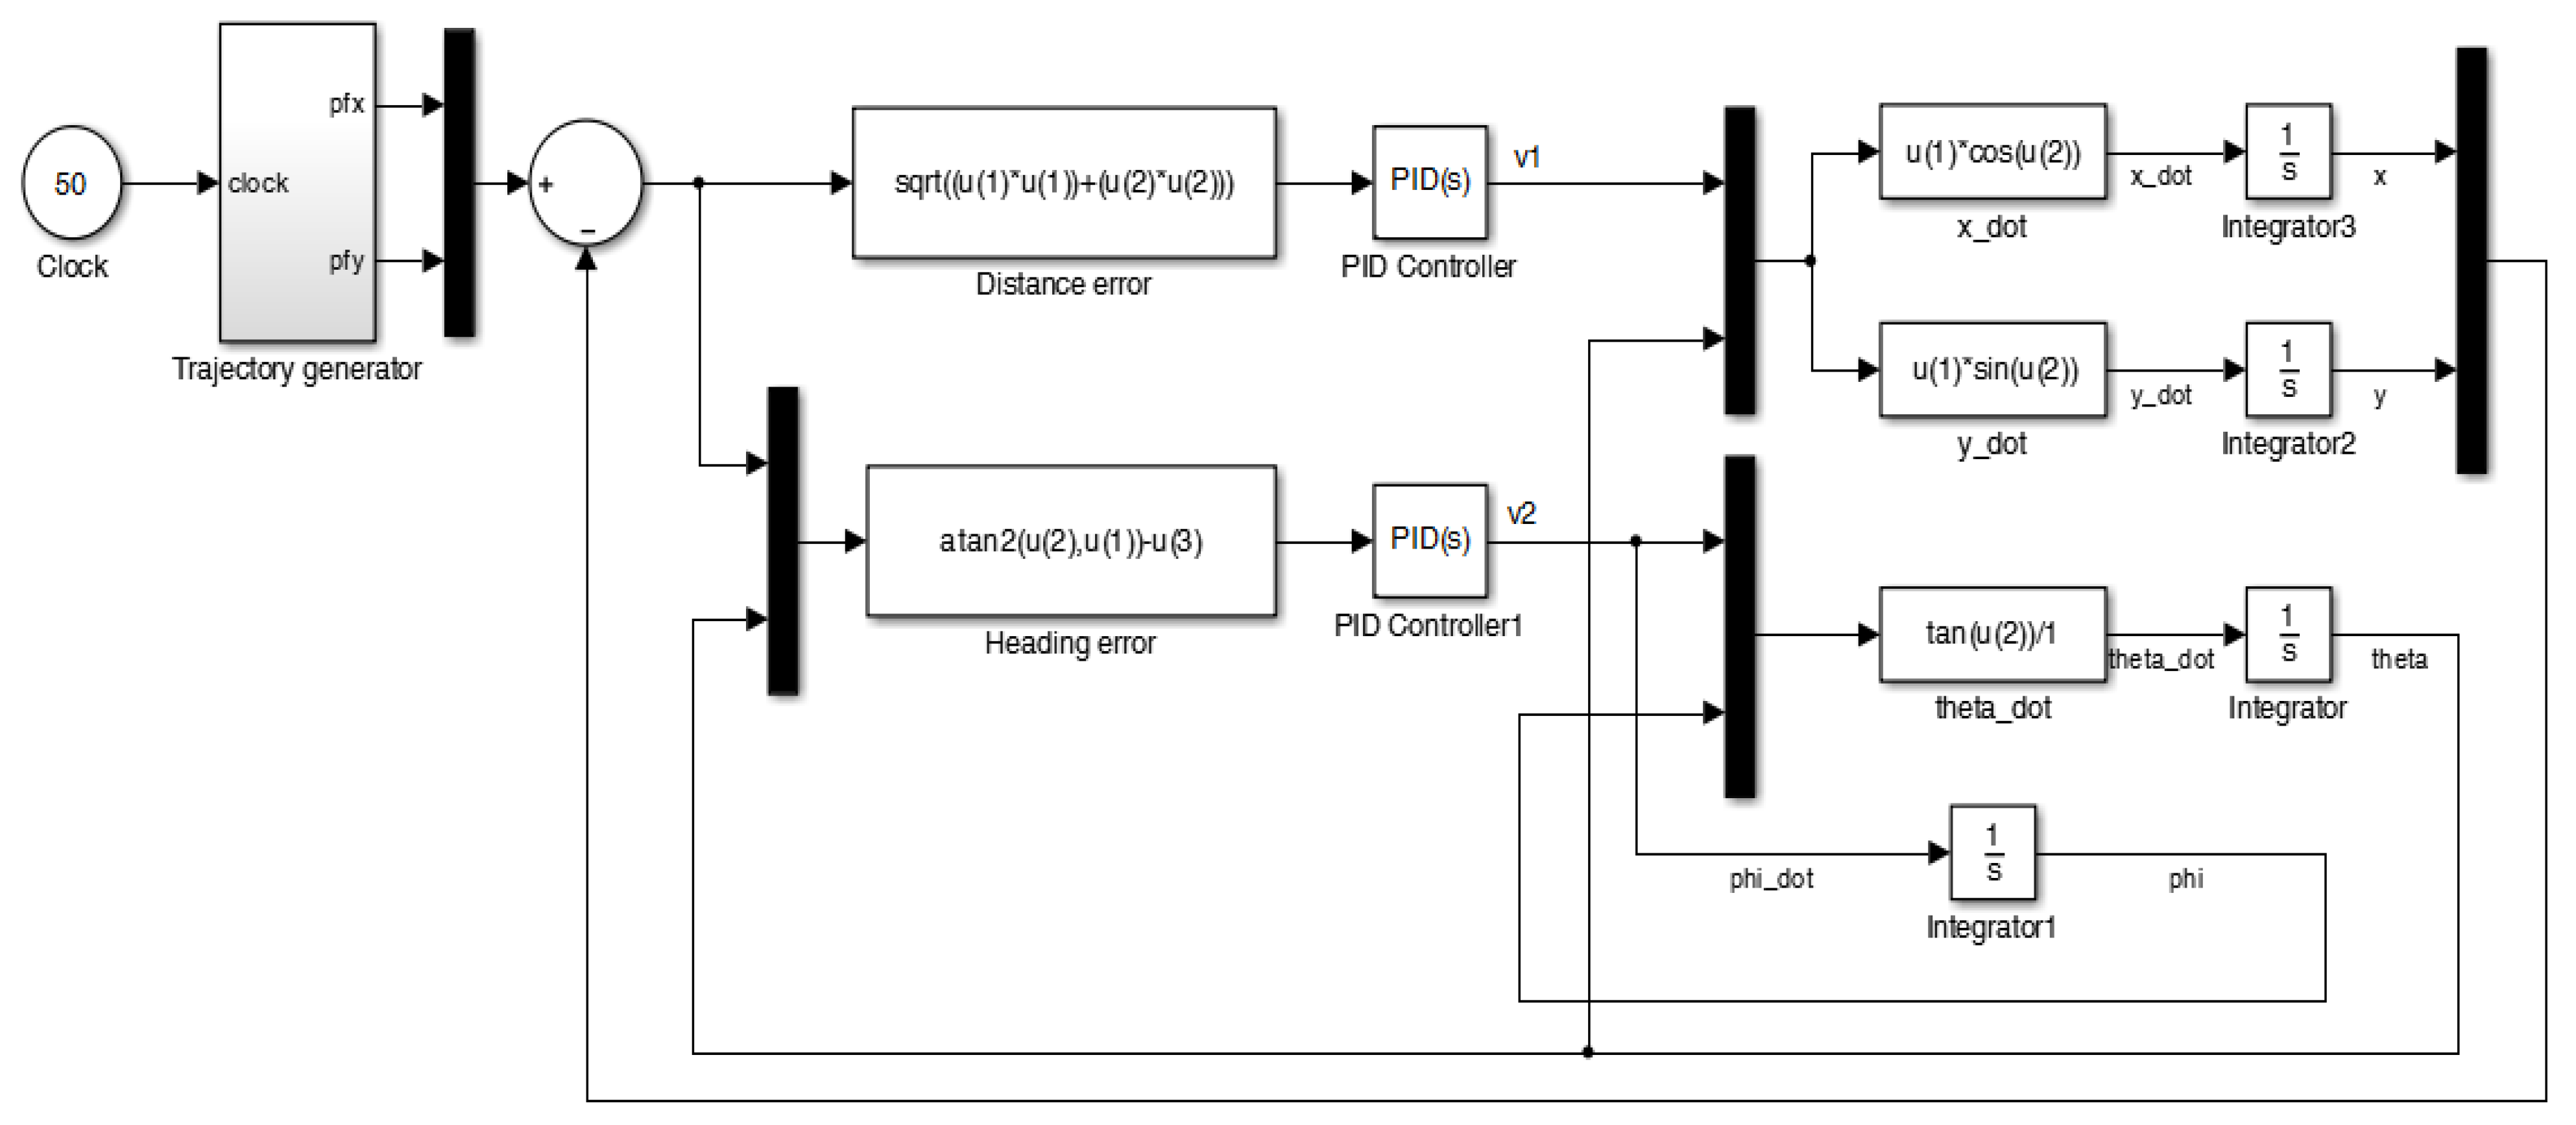
Results of the tractor’s linear trajectory test, the kinematic model simulation, and the tractor PID controller were created using the Simulink program, as shown in
Figure 10. The tractor simulation included linear and curved trajectories, with a wheelbase length (L) of 1 m.
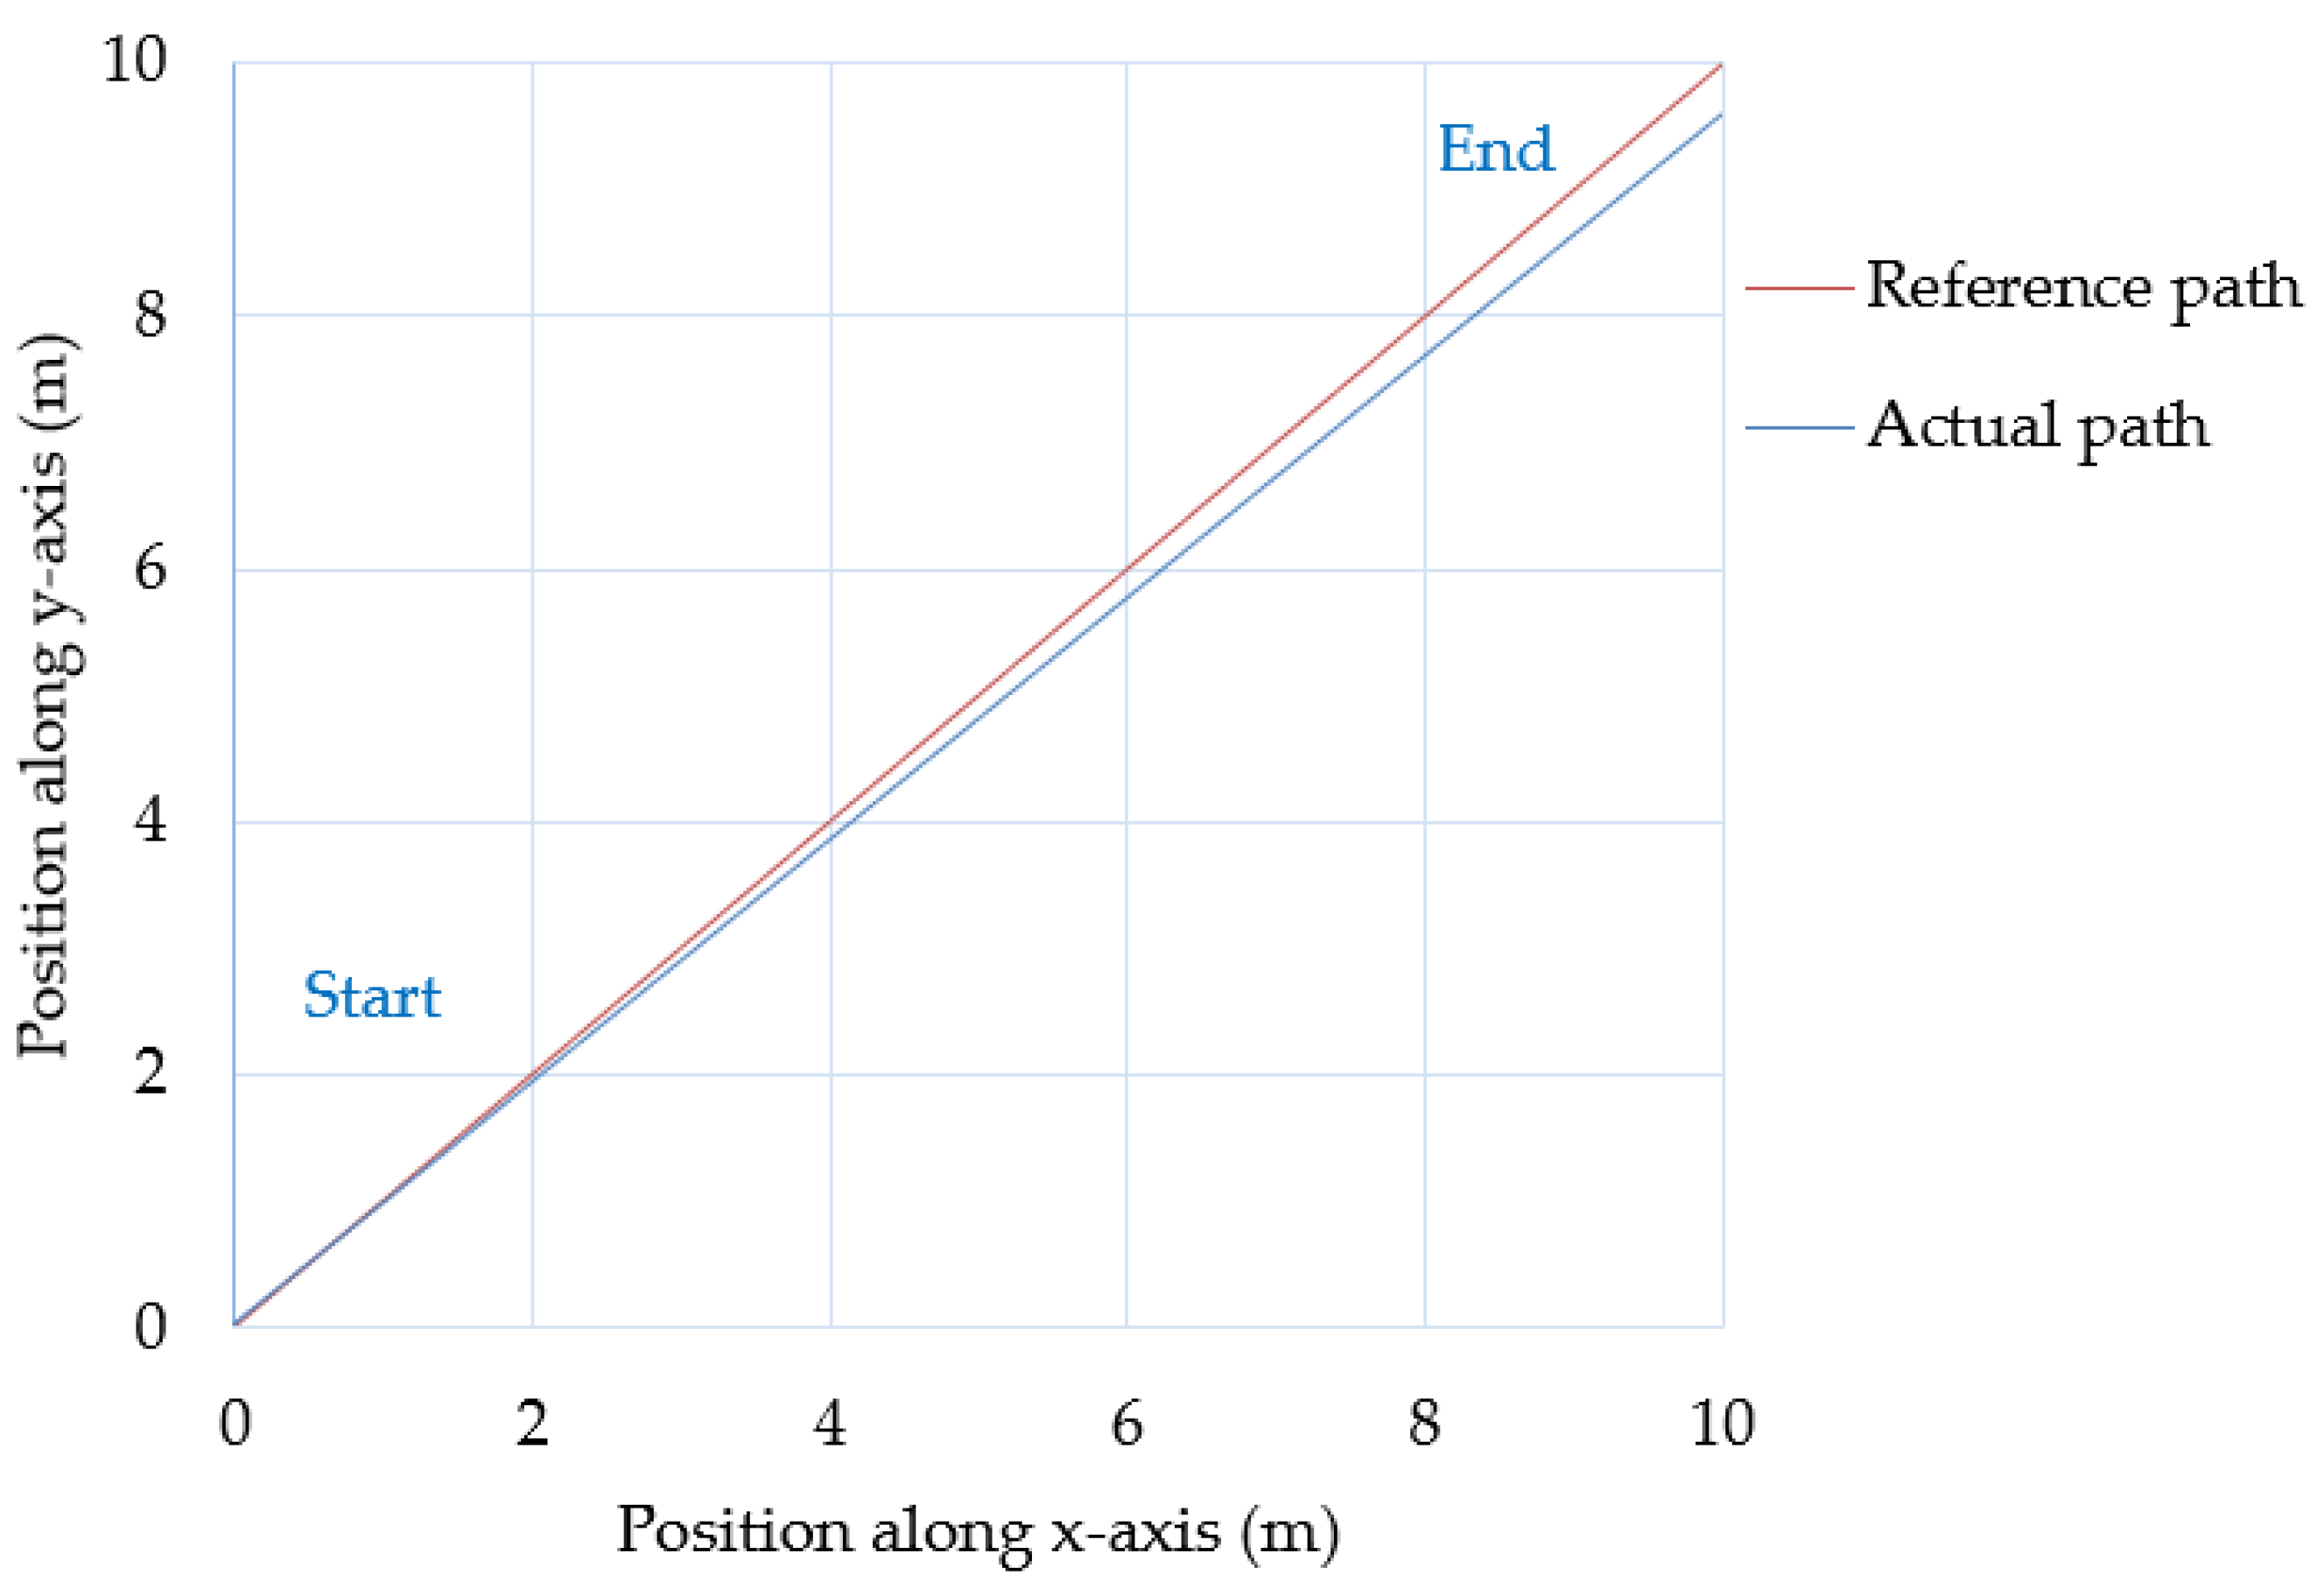
According to the linear trajectory in this study, the starting point was at (0,0) and the endpoint was at (10,10) with a maximum speed of 1 m/s and maximum acceleration of 1 m/s
2. The heading angle began at θ = 0 degrees (relative to the x-axis). The PID position controller had gain values of [insert values], while the PID heading angle controller had gain values of [insert values]. Results are presented in
Figure 11 and
Figure 12.
3.4. Machine Performance, Field Efficiency, Fuel/Electric Consumption
As illustrated in
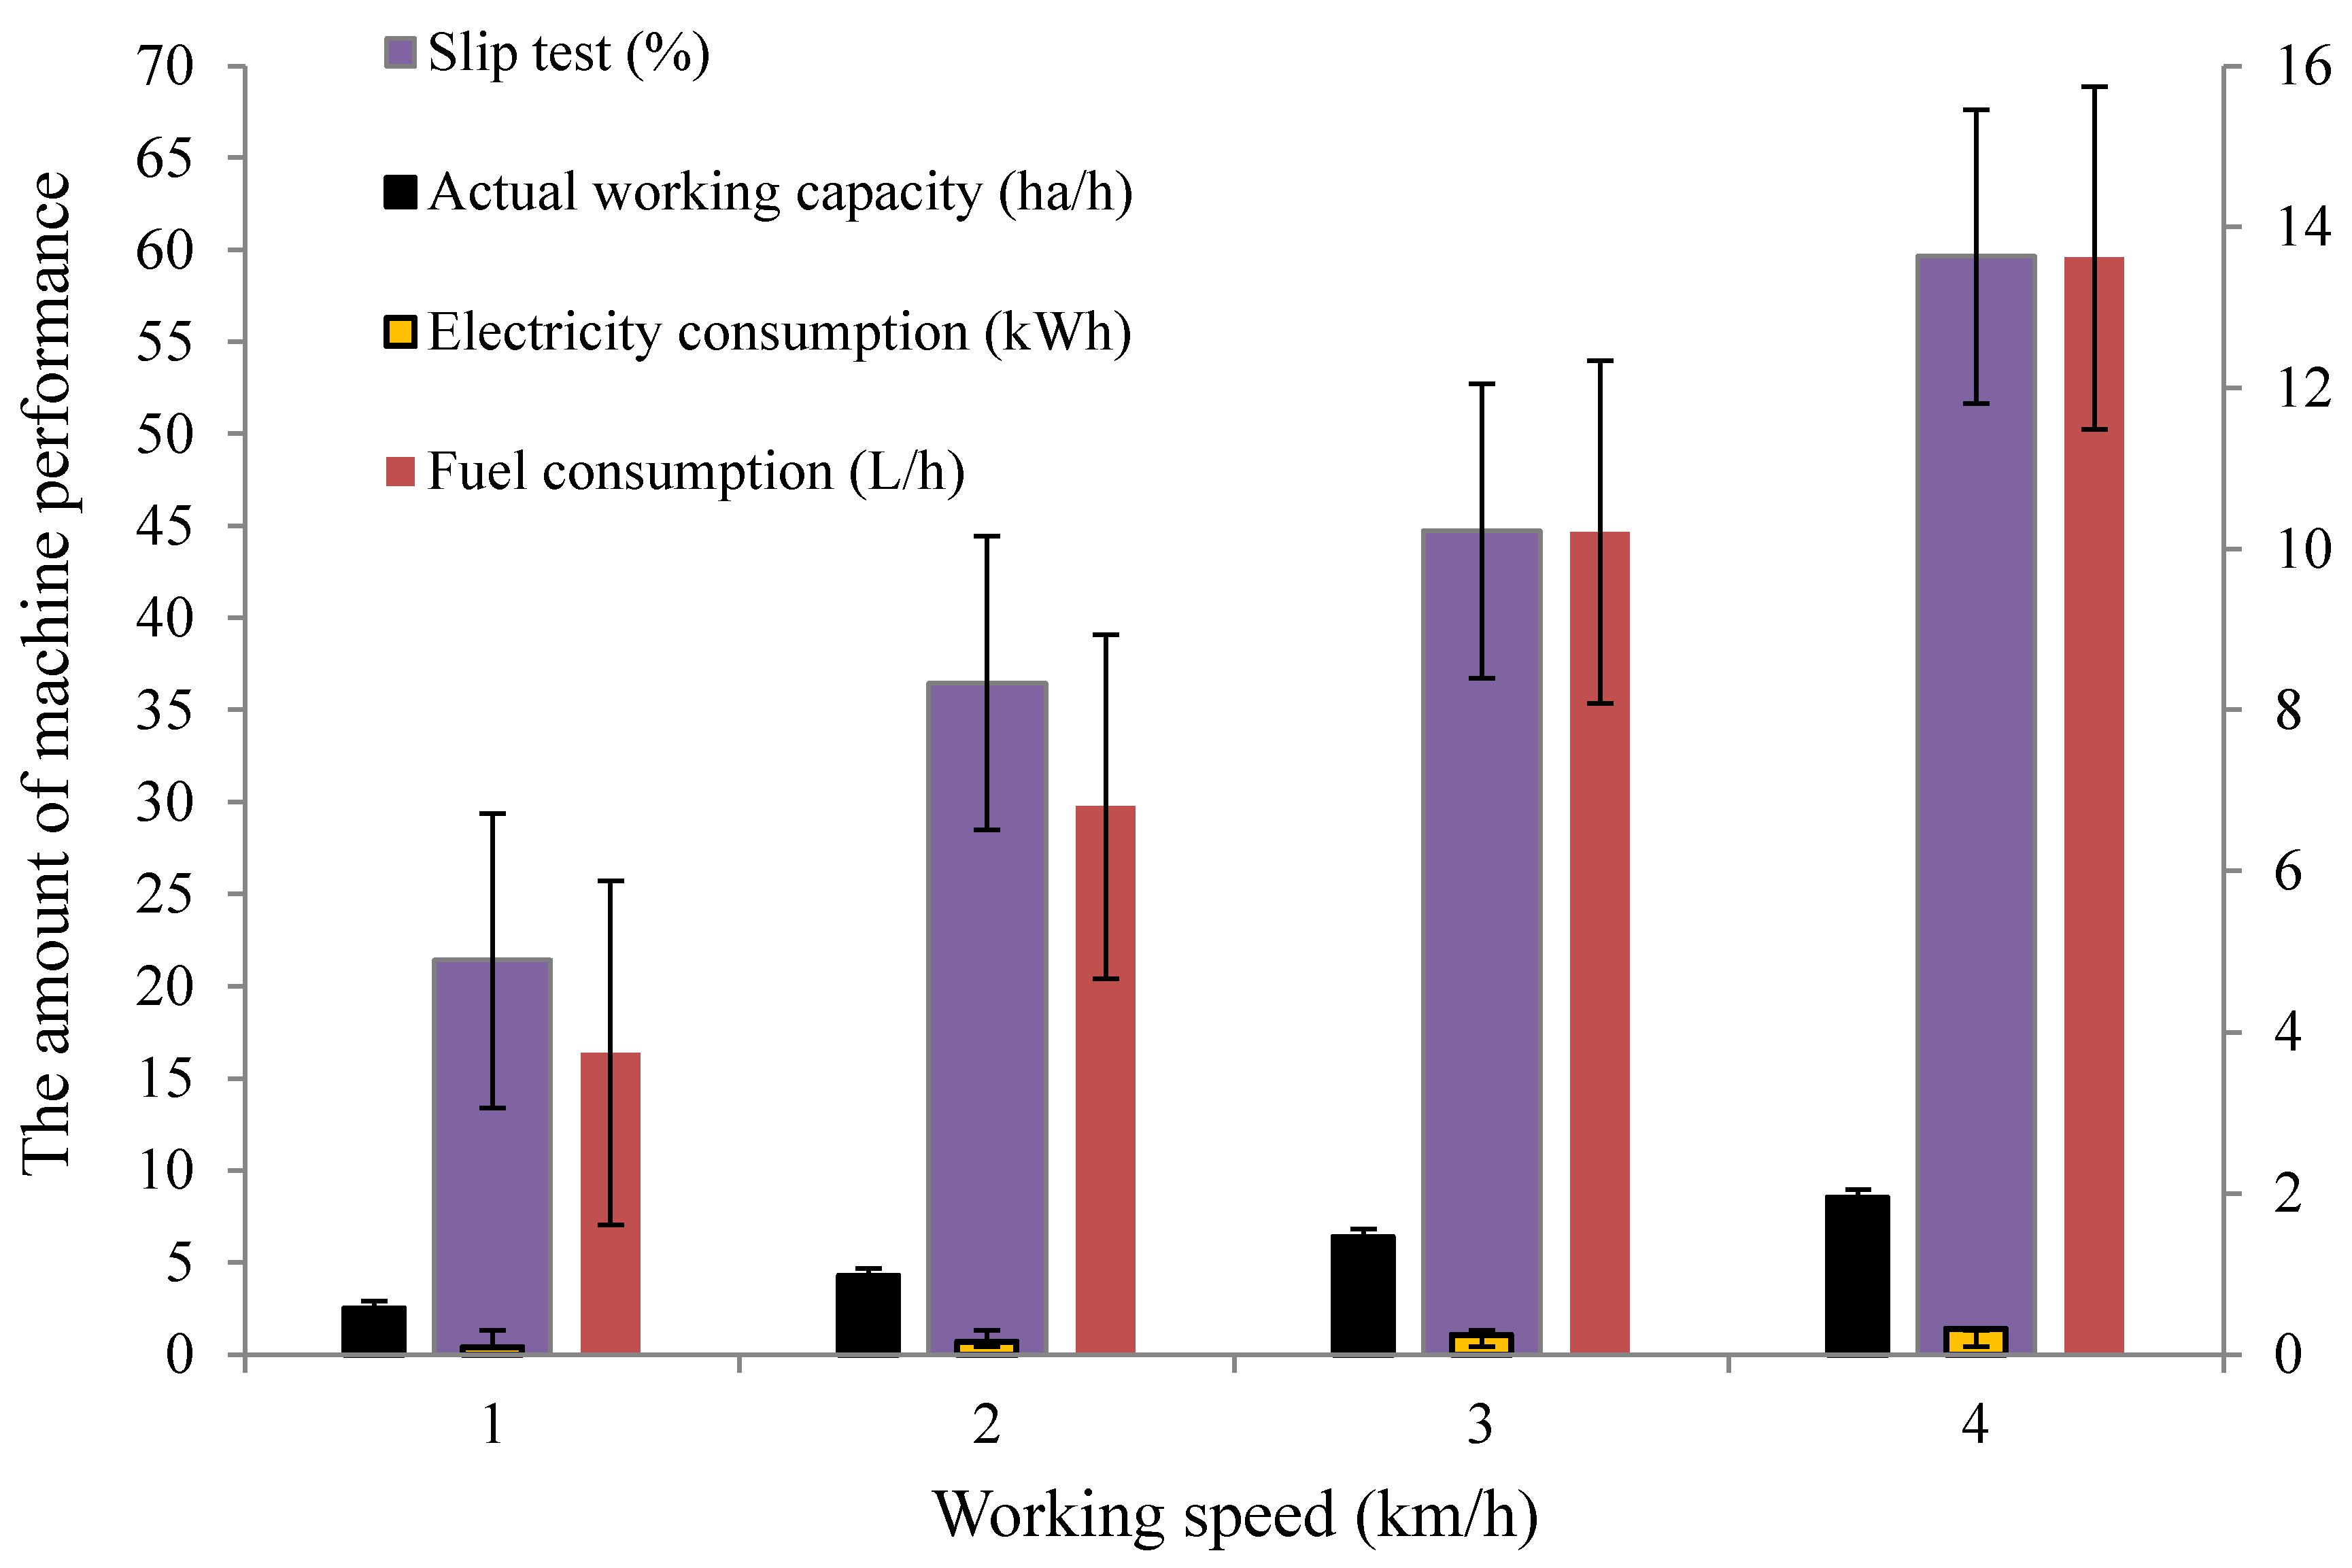
Table 6, it can be seen that when the working speed (km/h) increases (0.9–2.7), the actual working capacity (ha/h) may significantly increase. Fuel consumption (L/h) and electricity consumption (kWh) are 3.746–10.211 and 0.094–0.241, respectively. The sliding test (%) in the experimental plot was within the range of 21.41–44.73 in
Figure 13, consistent with previous studies [
28,
29,
30,
35].
The relationship between the input voltage value, input current and control pressure of the unmanned tractor-driven automatic is illustrated in
Table 7.
3.5. Relationship Between the Chemical Scatterable Distance (m) and the Nozzle Height (m)
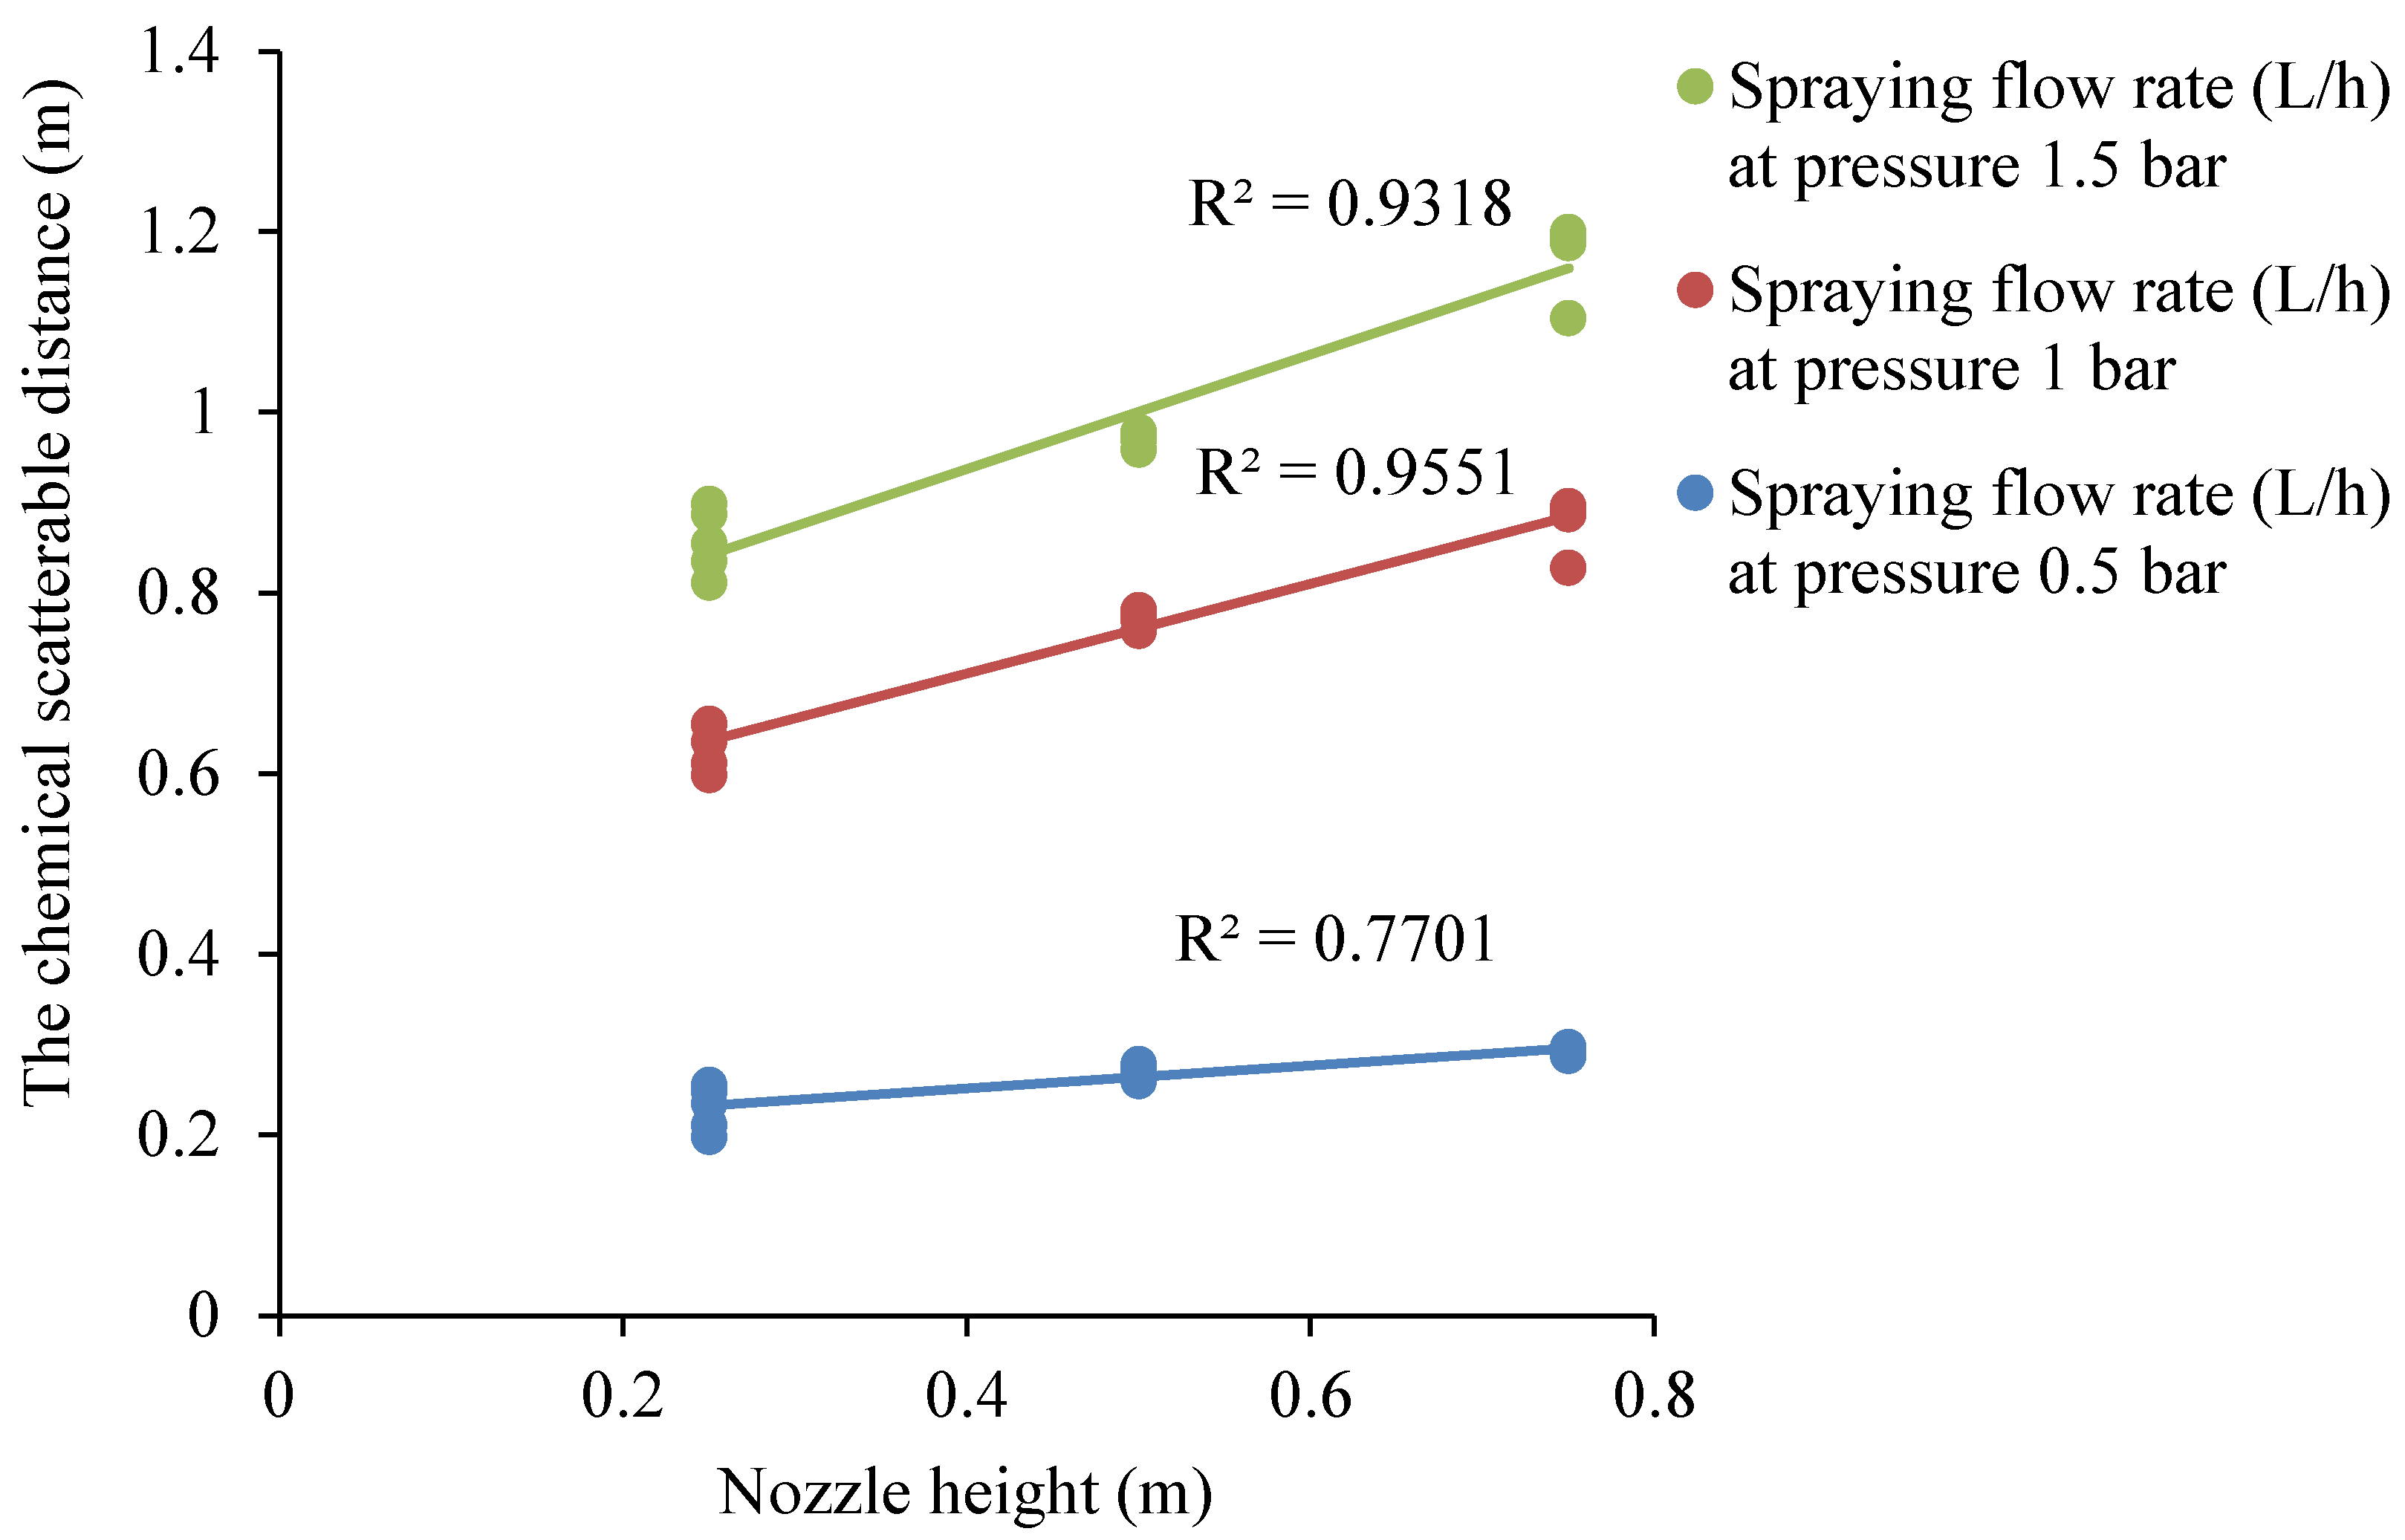
As illustrated in
Figure 14, it can be seen that it plots the tendency of the relationship between the nozzle height (m) and the chemical and pesticide spraying width (m) of spraying rates with different pressure values of 0.5, 1, and 1.5 bar, respectively. It was found that when the nozzle height (m) increased from 0.25, 0.50, and 0.75, the chemical scatterable distance (m) tended to increase, divided into the range of 0.248–0.297 at the level of pressure 0.5 bar, values in the range of 0.654–0.828 at pressure 1 bar and in the range of 0.887–1.104 at pressure 1.5 bar, respectively, which is consistent with similar previous relevant studies [
23,
24,
36]. The appropriate height of the nozzle (m) is 0.5 m. The chemical scatterable distance (m) is suitable and covers most of the cane canopy. The correlation between height levels (m), and chemical spraying width (m) is illustrated in
Table 8. The difference in image data acquisition and height levels (m) with green sample density as illustrated in
Table 9.
3.6. Relationship Between the Density (%) of 3-Month-Old Sugarcane Crops and the Elevation (m) of the Webcam
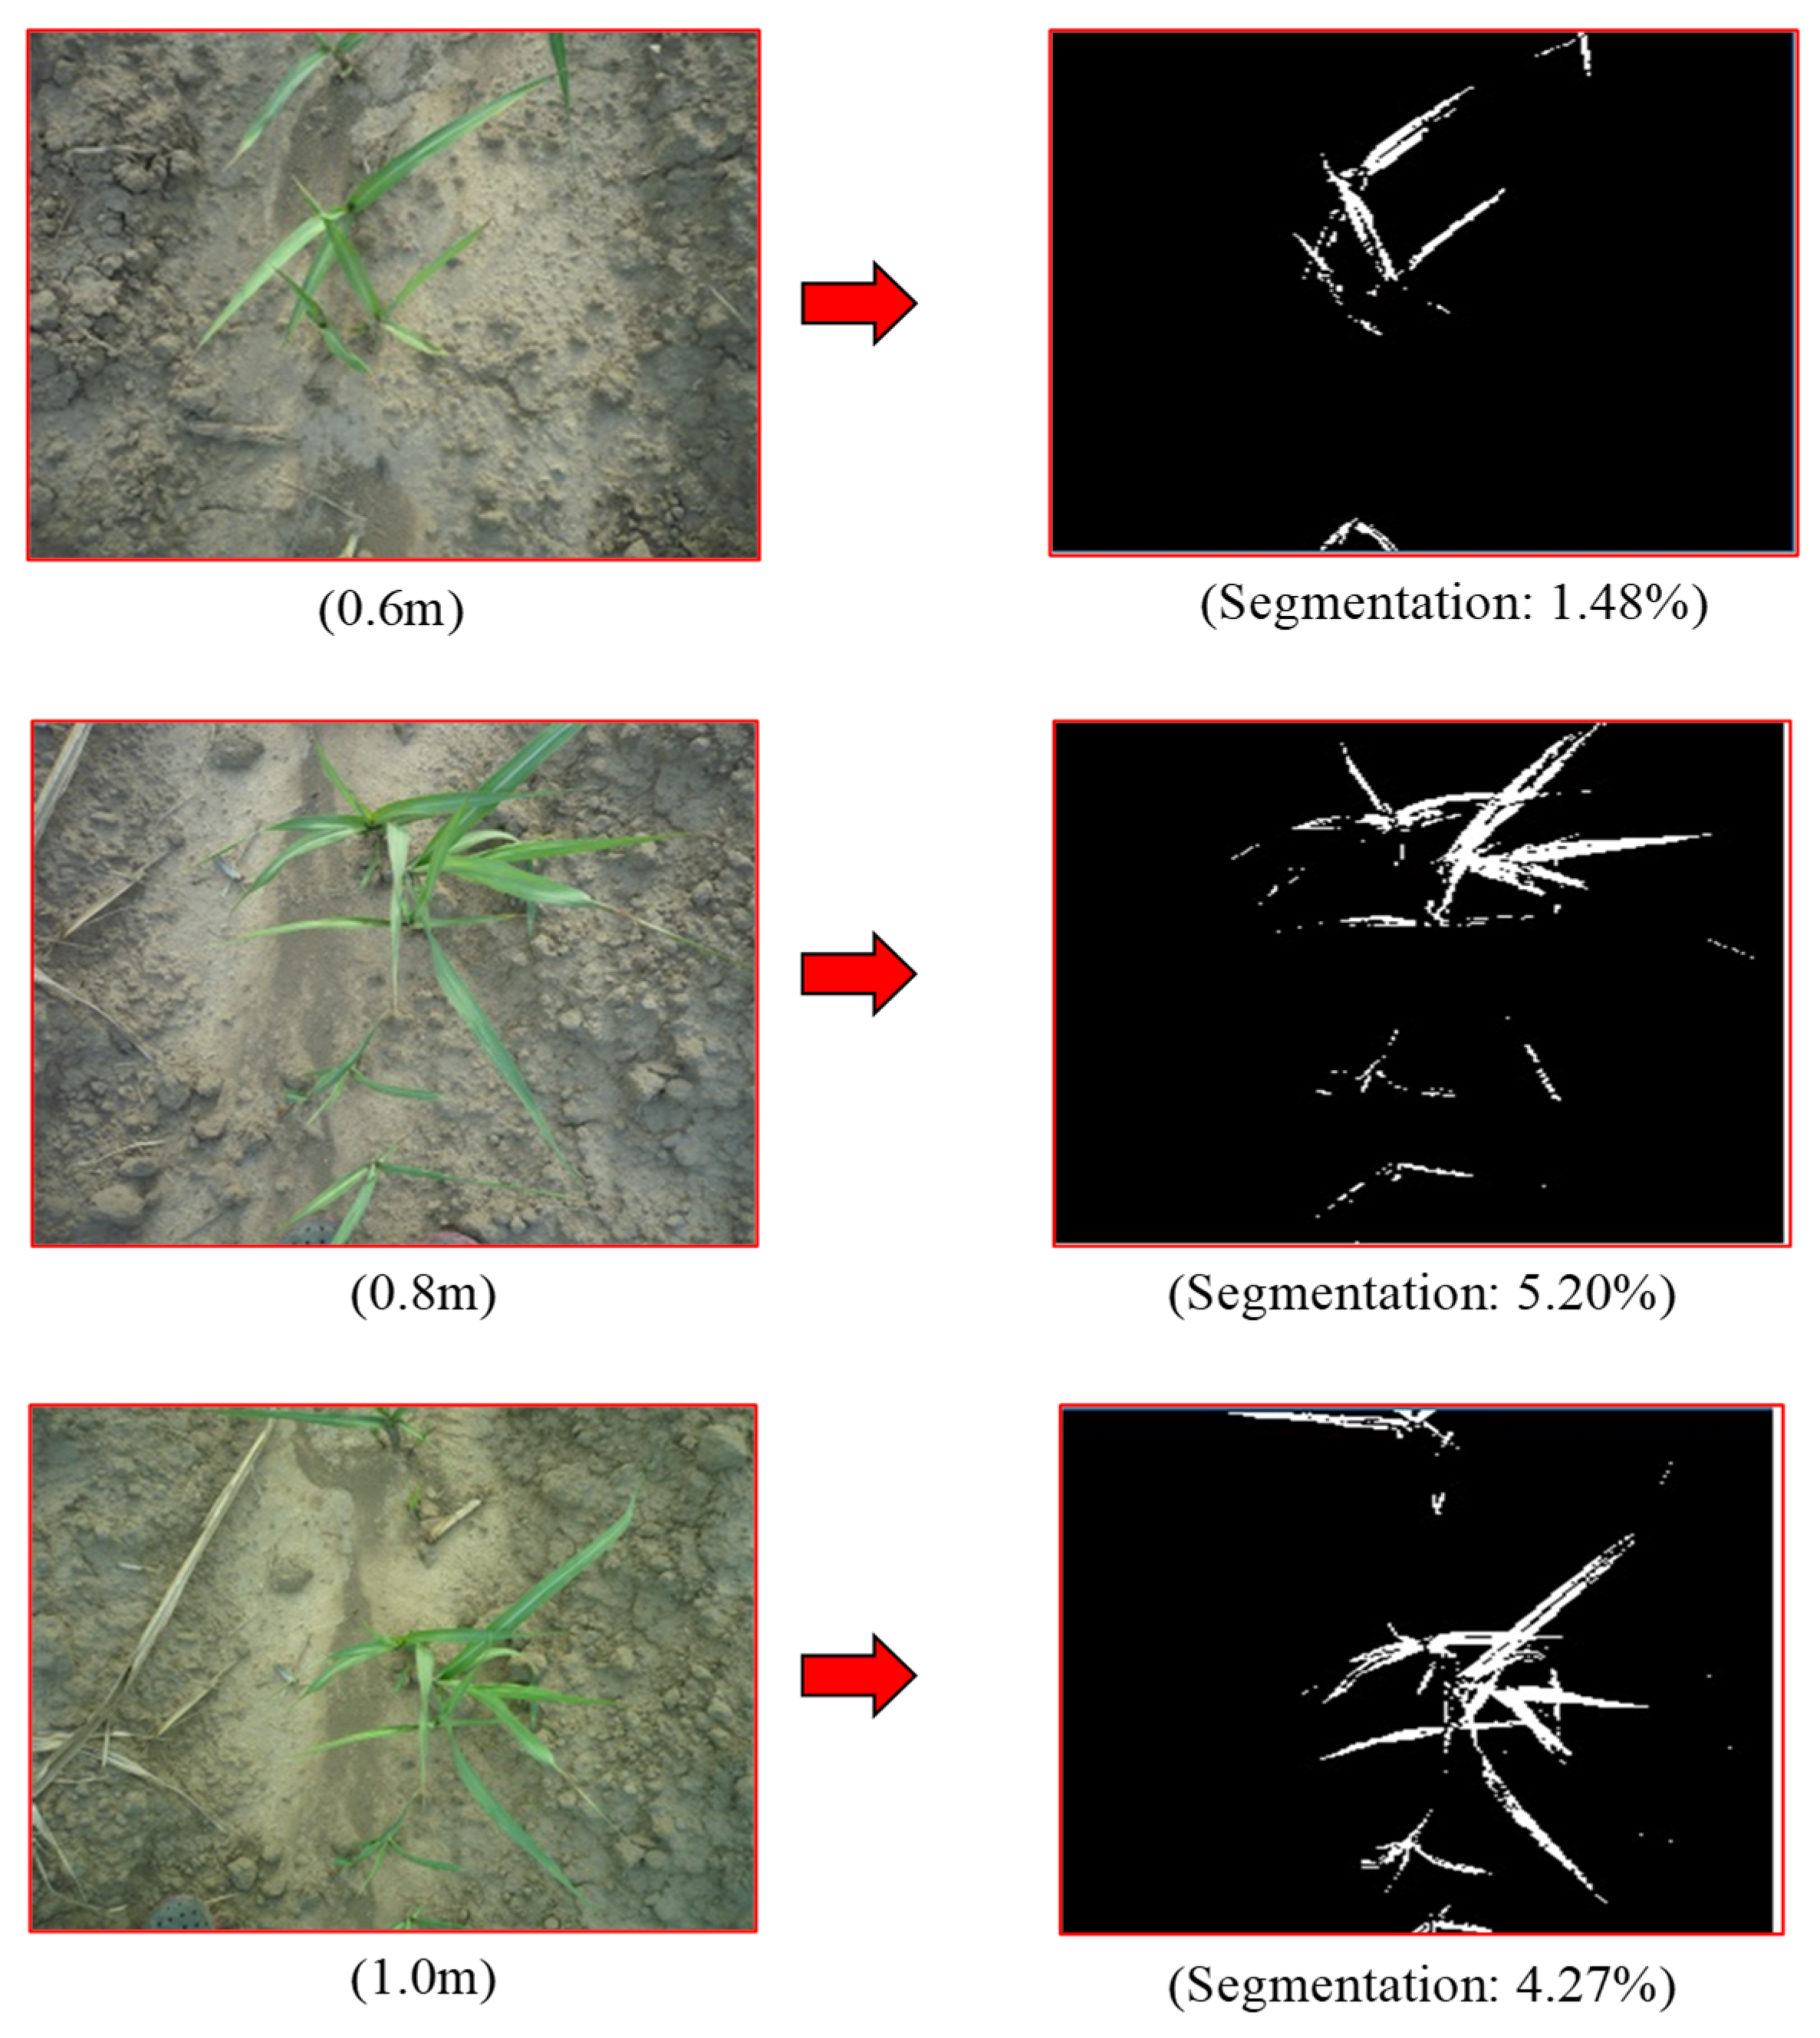
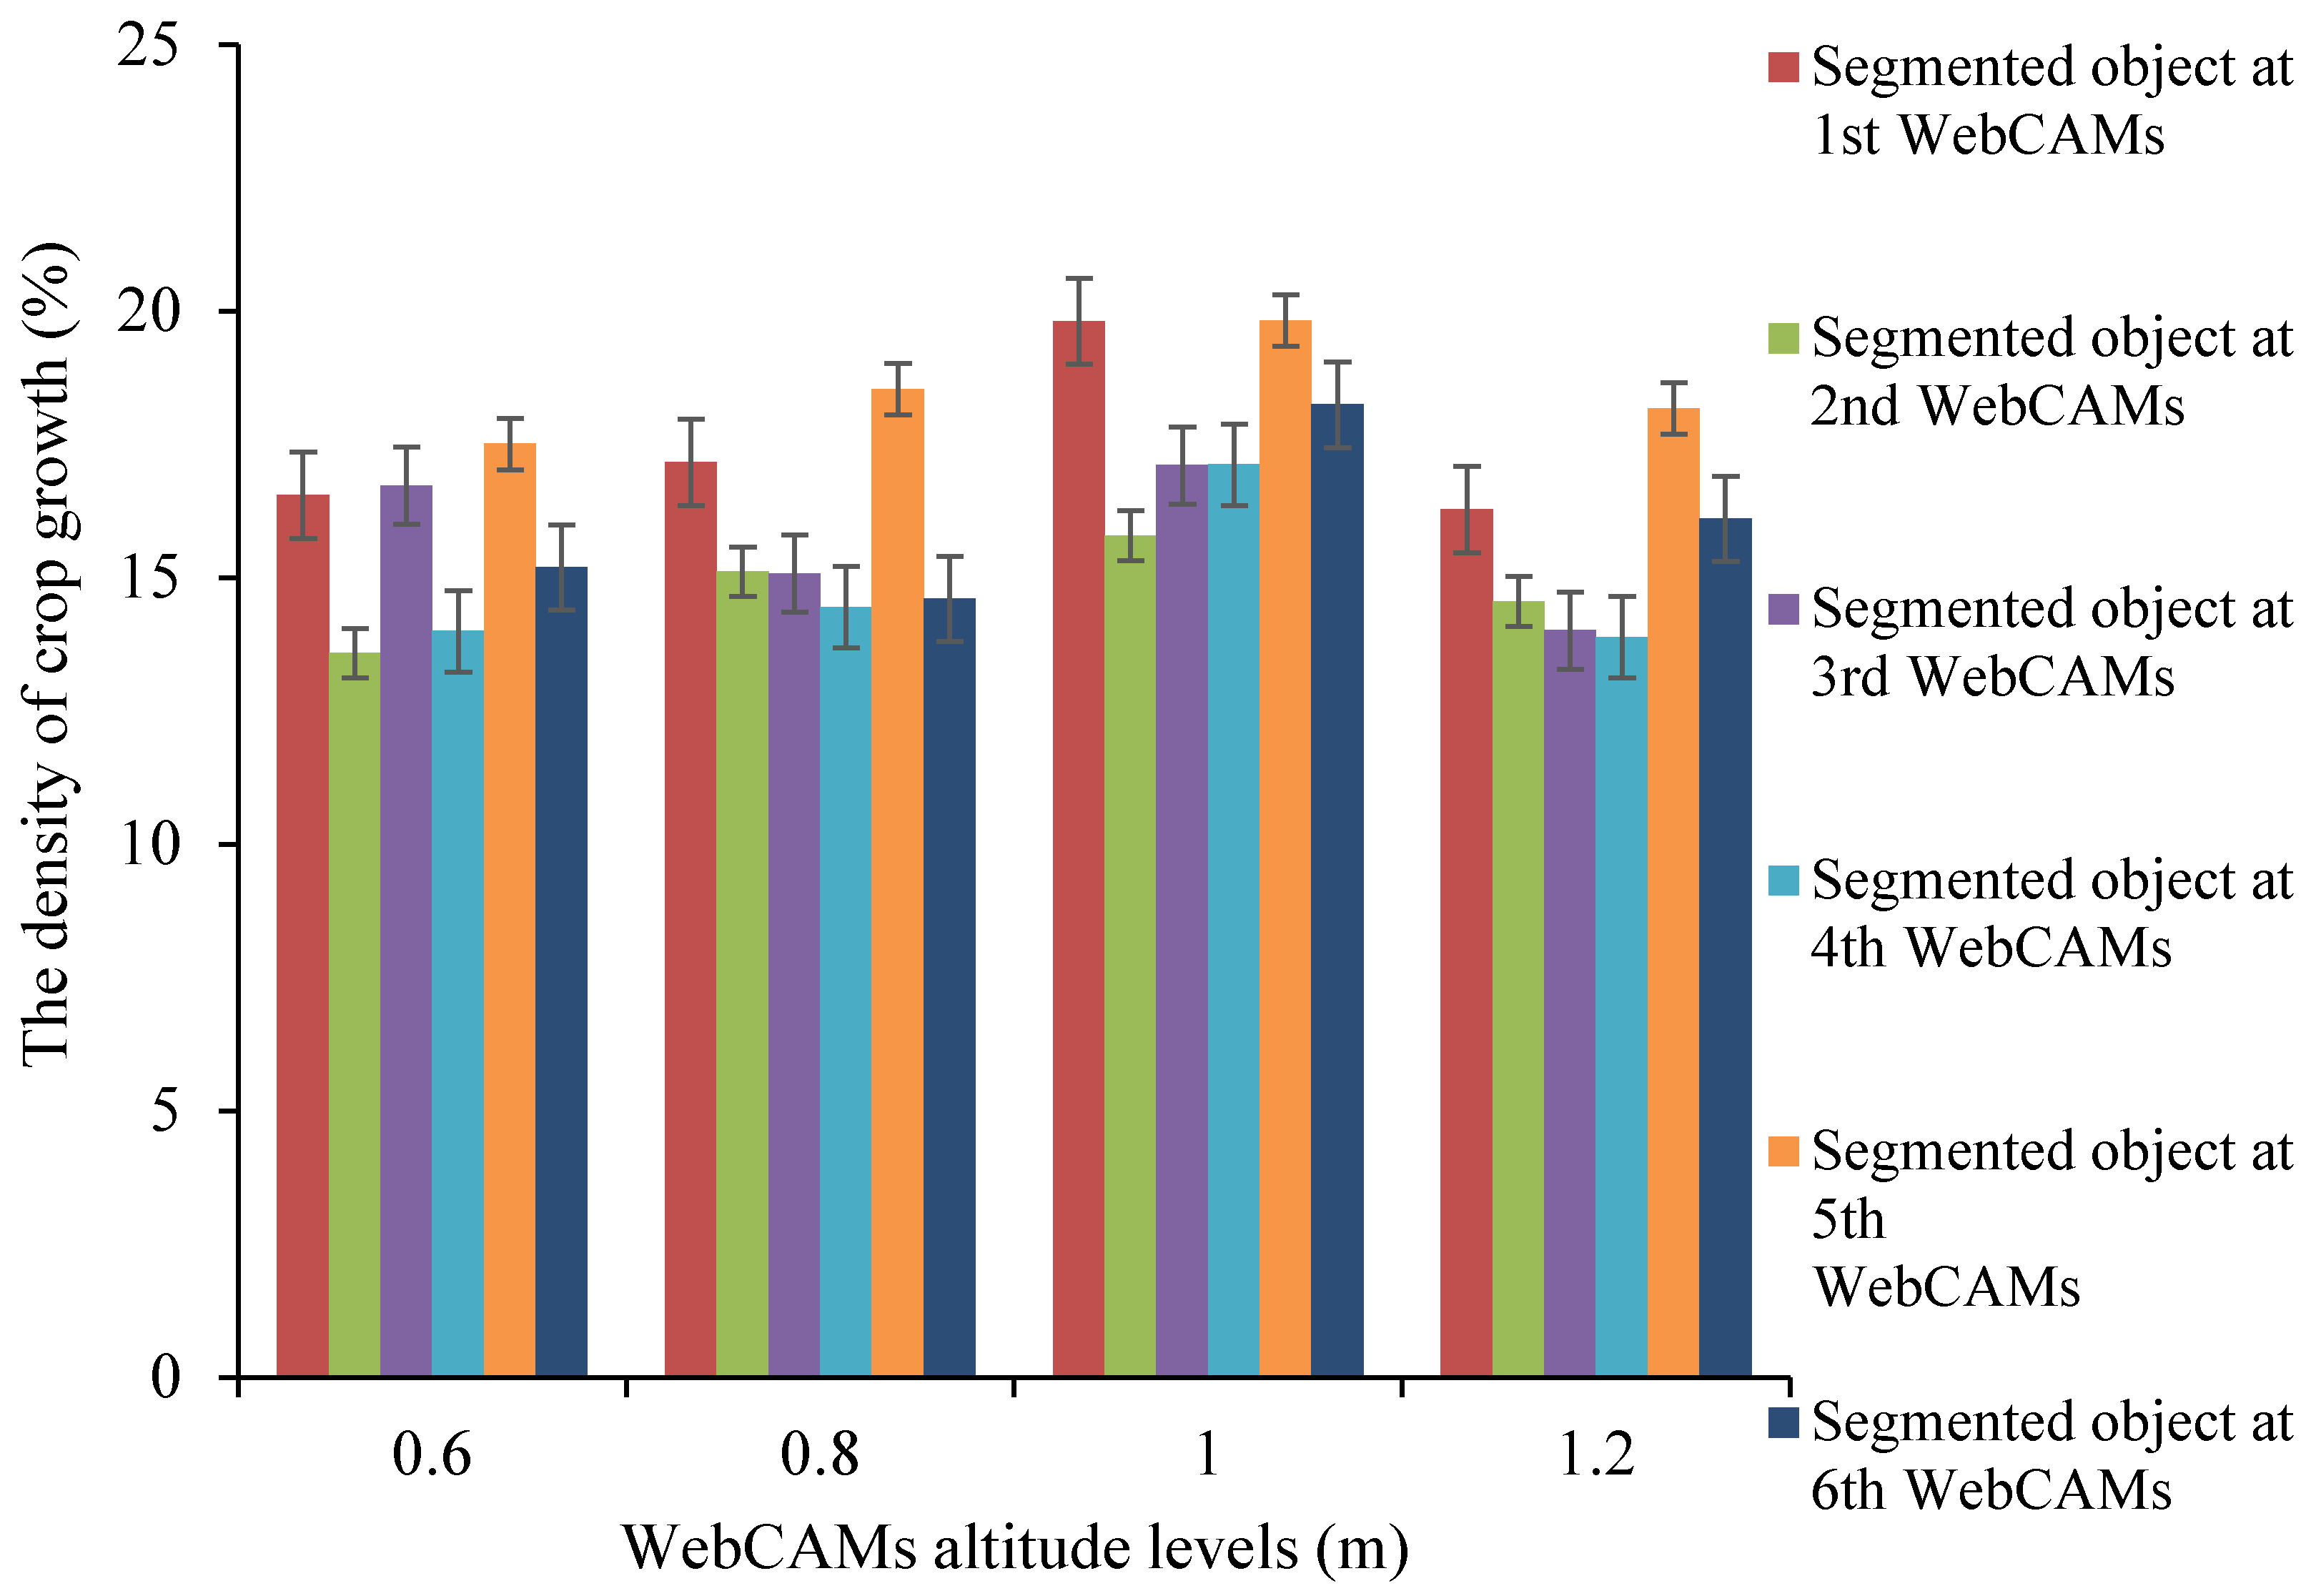
The relationship between segmented objects installed on webcams 1–6 at the rear of the tractor, the height of the webcam (m), and crop growth density (%) as illustrated in
Figure 15. When the height of the webcam (m) is increased, it improves the image processing accuracy and quality of each camera position. The elevation of the webcam at 1 m provides the most suitable segmentation object for each webcam position, as this is the height at which the camera has the best focal length. The percentage of segmented objects was in ranges between 15.789 and 19.825 and 1 and 6 webcams, respectively [
23,
24].
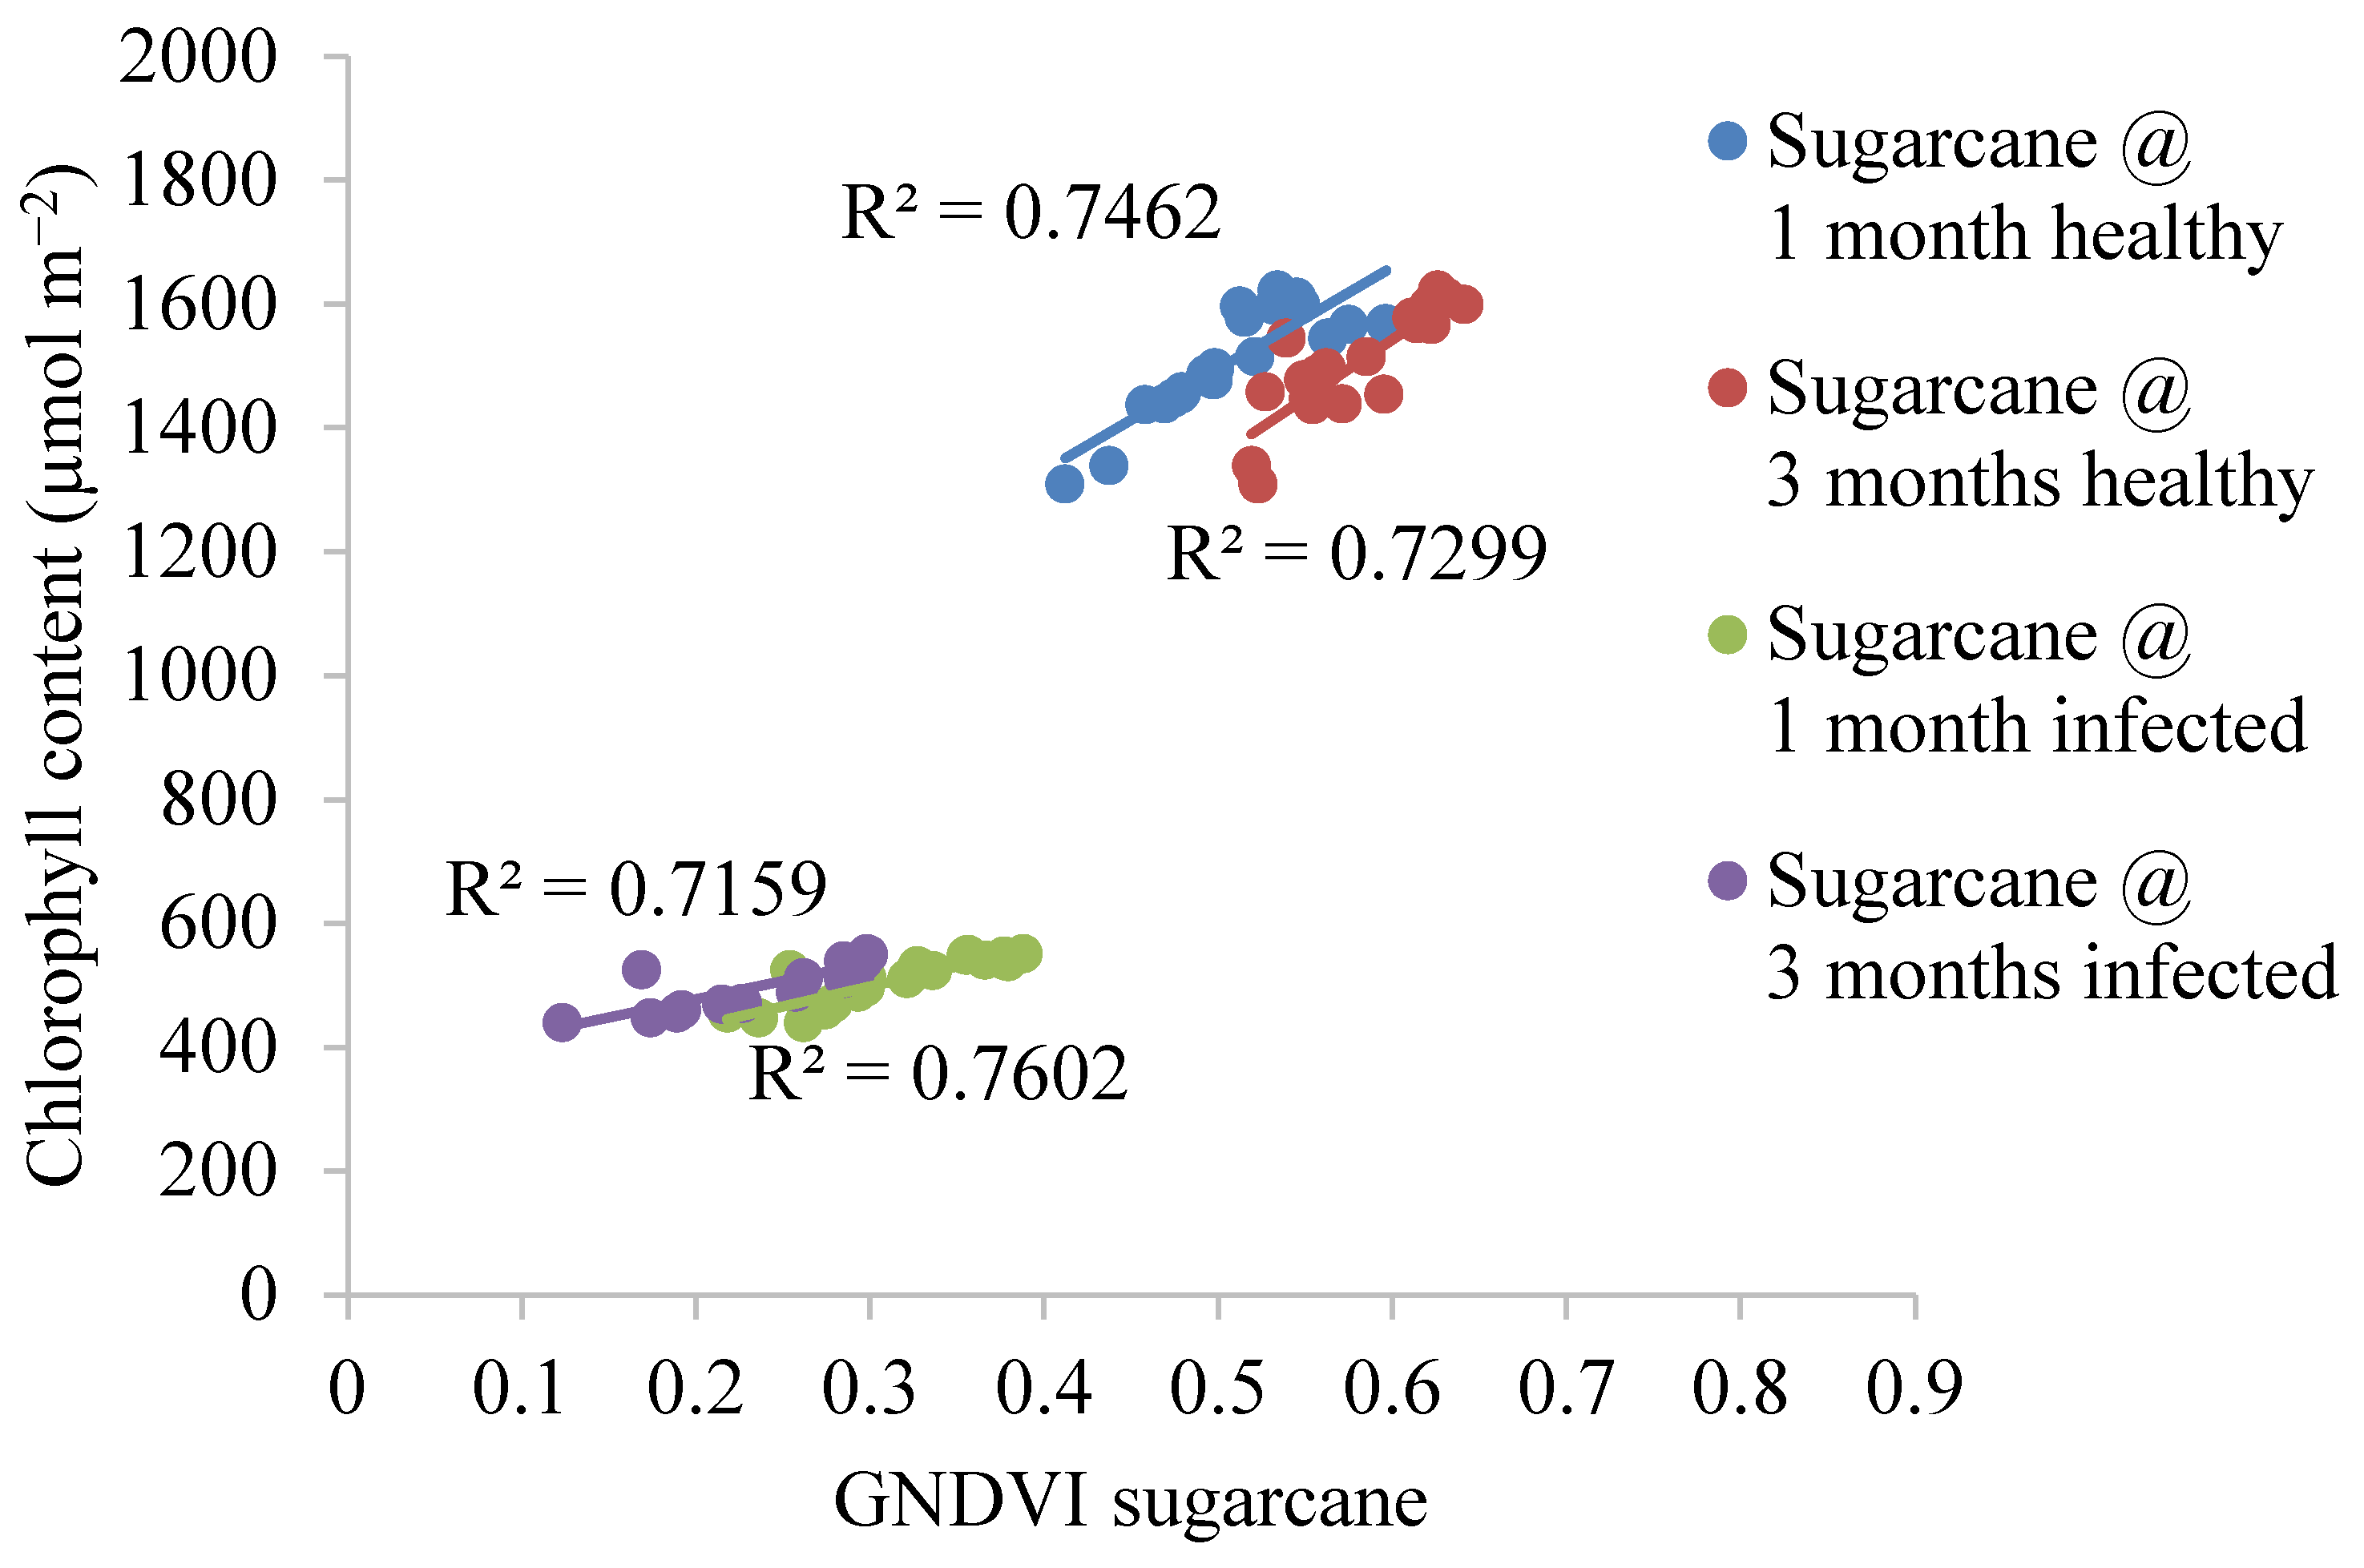
3.7. Relationship Between 1-Month and 3-Month-Old Sugarcane (Healthy/Infected) and Chlorophyll Content (µ mol m−2)
The relative trend of GNDVI values and the chlorophyll content (µ mol m
−2) of 1–3-month-old sugarcane plantations that are healthy or infected is illustrated in
Figure 16, respectively. The chlorophyll content levels of healthy and infected sugarcane (µ mol m
−2) were between 1310 and 1623 and 440 and 551, respectively. It was also found that the sugarcane cultivation period was 1–3 months, and the GNDVI values range from 0.412 to 0.596 and 0.519 to 0.641 for healthy sugarcane, respectively. The GNDVI values of infected sugarcane ranged from 0.218 to 0.388 and 0.123 to 0.299 between GNDVI molasses and chlorophyll content (µ mol m
−2), R
2 = 0.7602 (1-month infection), and R
2 = 0.7159. Sugarcane (infected at 3 months) aged less than 1–3 months is characterized by healthy R
2 = 0.7462 and R
2 = 0.7299, respectively [
30,
32].
3.8. Discussions
3.8.1. Algorithm’s Structure, Parameters, or Decision-Making Process
The image data obtained from the wireless webcams was processed using a designed algorithm to determine the variable rate spraying and create a GIS application map for variable rate spraying, based on big data for modern sugarcane cultivation. Young and healthy canes exhibited lower healthiness with R
2 values compared to older and healthy canes. Despite potential errors caused by a smaller canopy resulting in less planted surface coverage, the wireless webcam images provided near real-time results and were accurate enough to develop a plant index and distinguish between growth density rates and infected plants, regardless of growth stage, compared to other techniques. This methodology will be useful for medium- to large-scale sugarcane growers and also shows potential for application to other crops [
3,
34,
35].
3.8.2. Error in the Movement of the Tractor When Moving Straight and Curved Lines
To control the movement of the tractor along a specified path, it is necessary to control at least two variables:
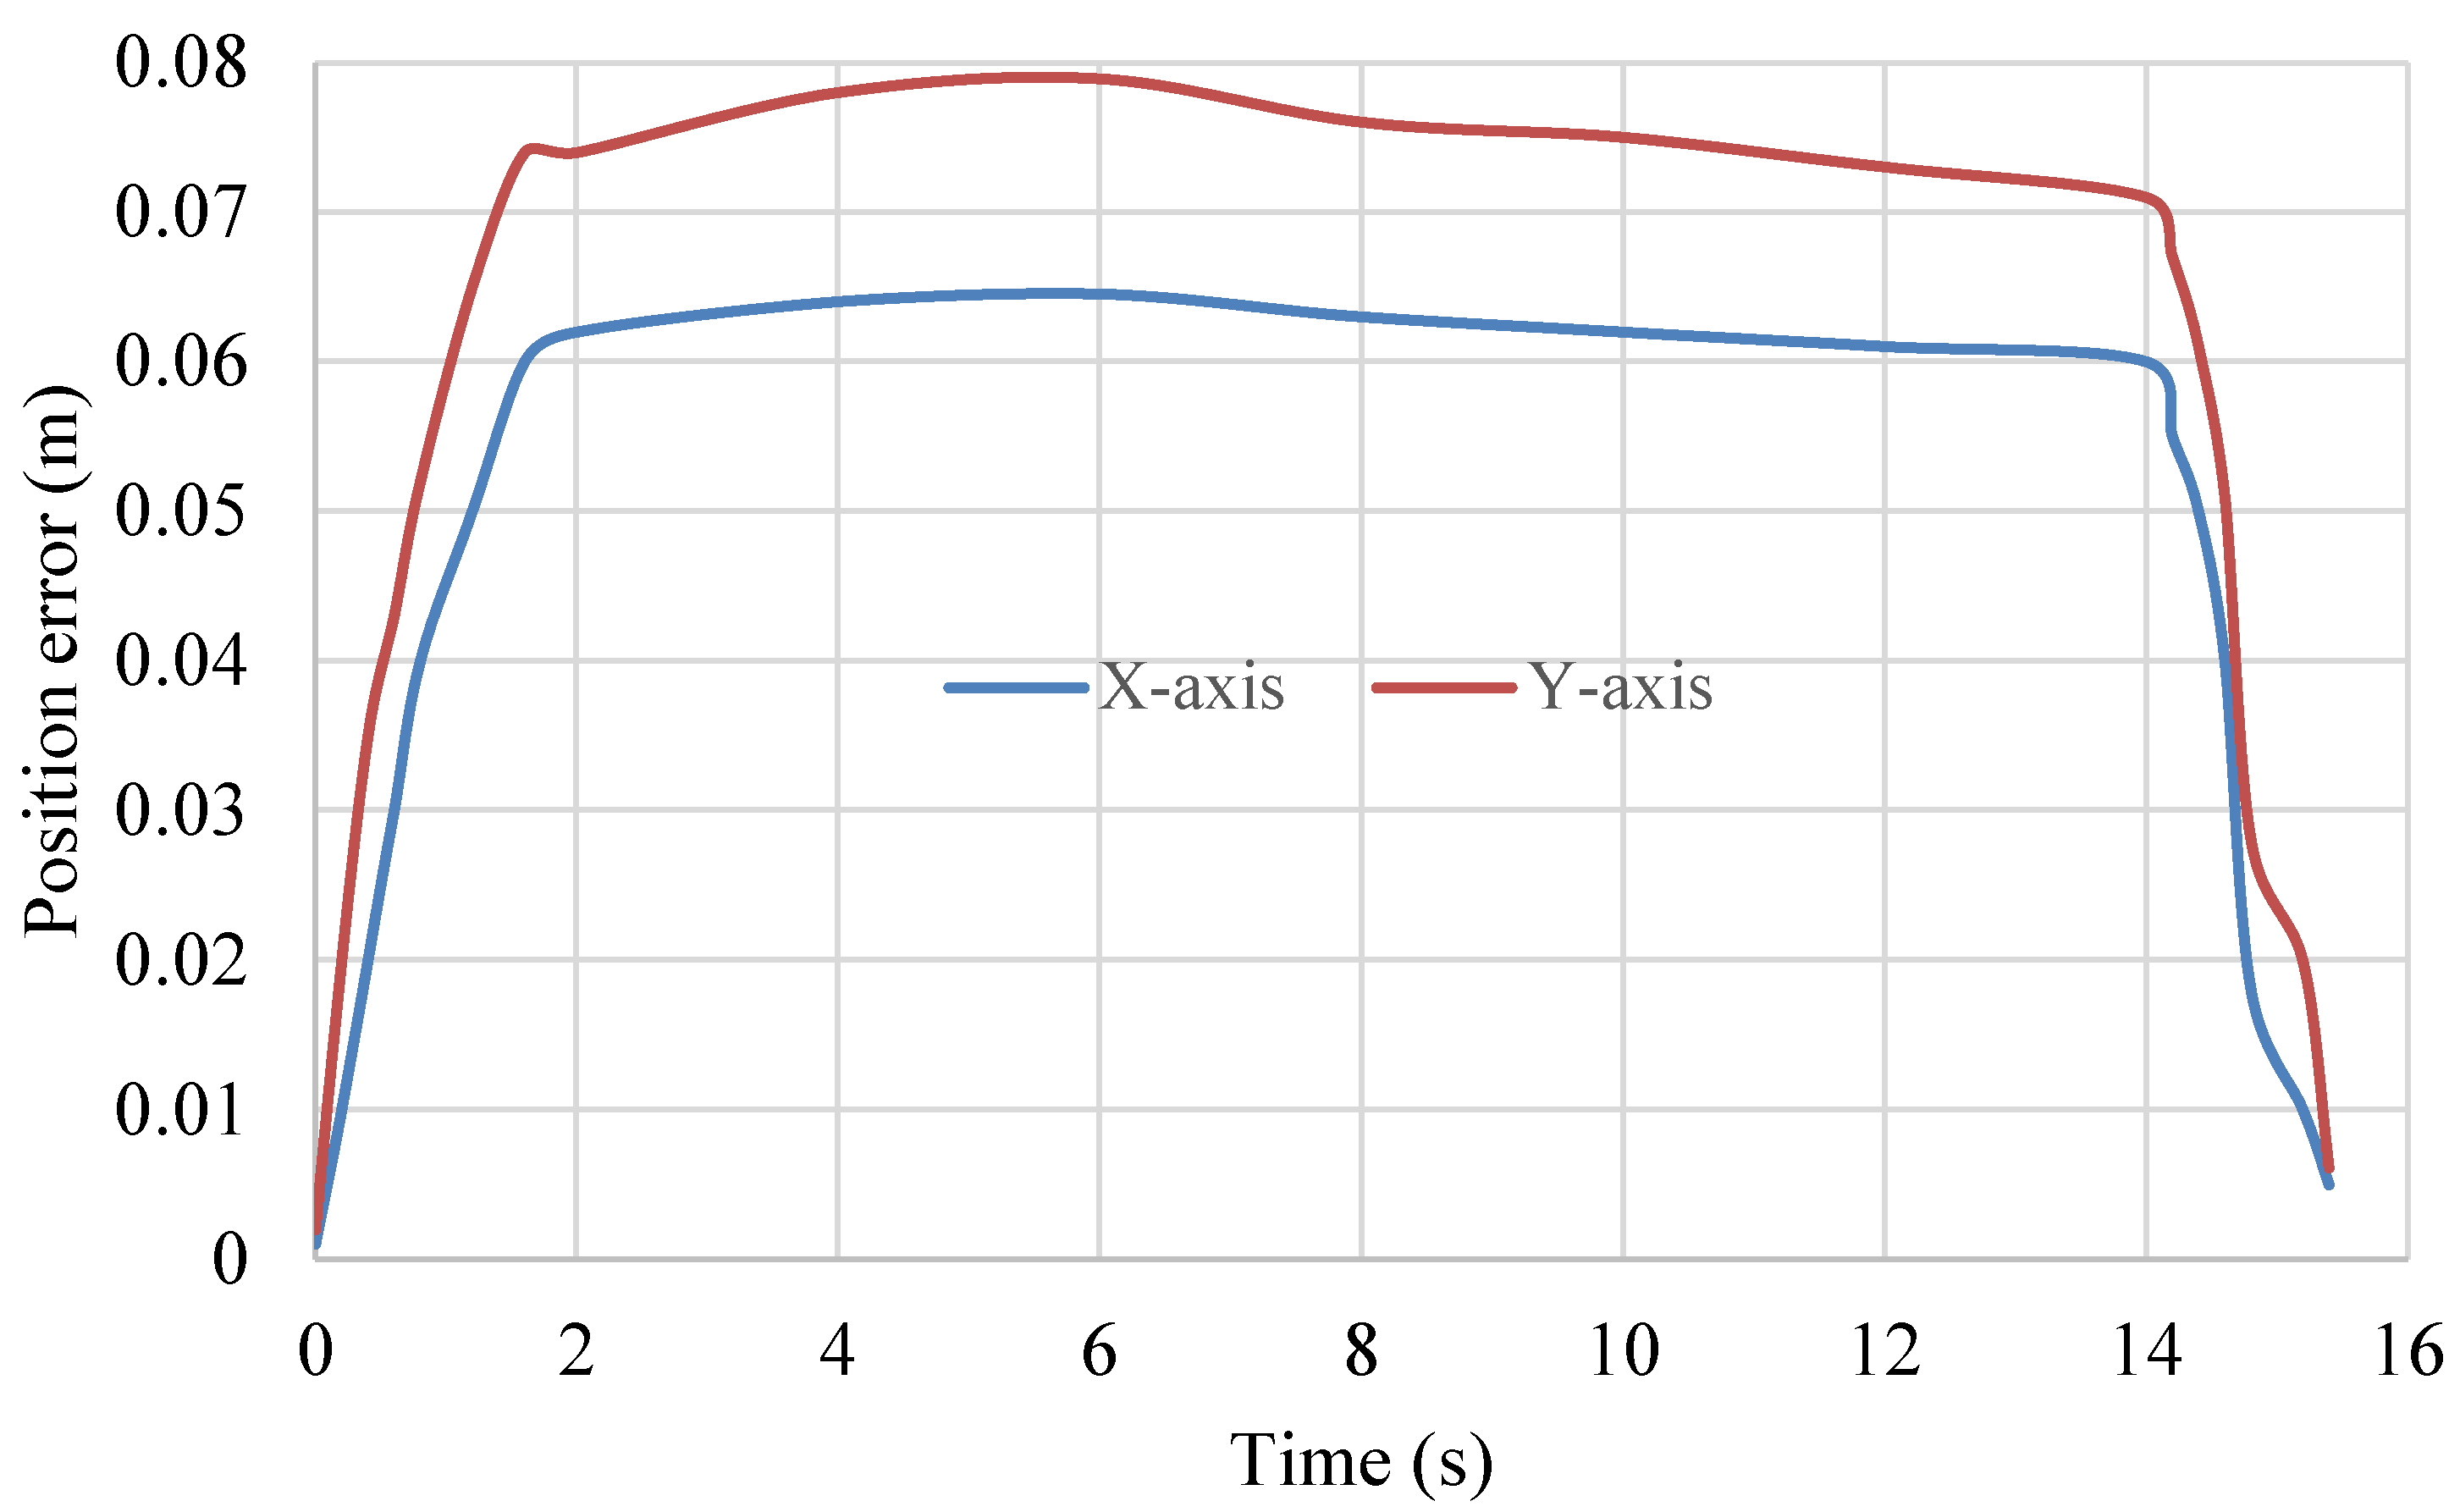
Therefore, the control loop is designed to have two loops according to the variables to be controlled. The first loop is to control the position of the tractor’s movement. The error value of the movement distance (distance error) by the time that the tractor moves in the first straight line (period 0 s to 15.5 s) shows that the error value in the y-axis will be higher than in the x-axis because the tractor moves in the y-axis only. During the time that the tractor moves in a curve (period 2 s to 14 s), the error value in the y-axis will change quite high but in a linear manner.
This is because the tractor moves up and down in the y-axis direction, while the x-axis direction remains constant. When the tractor moves in the last straight line (period 2 s to 14 s), it can be seen that the error value in the y-axis direction is greater than that in the x-axis direction (same as the first result), with the maximum error value when the tractor moves in a straight line and a curve at 0.075 m and the error at the end of the movement at 0.06 m, respectively [
16,
18,
33].
3.8.3. Analyze the Source of System Errors
A study on Thai agriculture revealed that the height of a webcam significantly affects recognition accuracy, especially when adjusting the camera height from 0.6 m to 1.0 m. At 1.0 m, both image processing accuracy and sharpness were very high, as this height offers the optimal high-angle focus range.
The research also investigated the impact of tractor slip rate on spray uniformity. It was found that the slip test percentage increased with higher vehicle speeds. A greater slip test percentage results in increased costs due to the higher spraying rate (liters per hour) of chemicals needed, as the area must be sprayed multiple times over a longer duration.
In a comparison between modern spraying methods and traditional techniques, significant energy savings were observed when utilizing modern sprayers. It is common for the wage rate for spraying in sugarcane fields to be calculated per hectare, encompassing both labor and chemical costs. The total cost for spraying herbicides (including chemicals) is approximately USD 96.25 per hectare (source:
https://www.singburi.doae.go.th; accessed on 9 November 2024). The labor costs for spraying can be combined with chemical expenses or calculated separately, depending on the agreement between the employer and the contractor.
While traditional sprayers have a working capacity of 0.16 hectares per hour, the spraying system developed in this study boasts a capacity of 0.975 hectares per hour. It is important to note that, as a prototype developed at a low cost, further refinements are necessary. Consequently, real-time image processing is not yet feasible; instead, the system operates in cycles. Once the algorithm completes image processing, it sends the object data as digital numbers to the solenoid valve, which then delays the spraying action [
7,
30,
33].
3.8.4. Spraying Rate GIS Application Mapping
In this research, to collect data for agricultural mapping, test plots measuring 40 m × 40 m should be divided into smaller sections of 5 m × 5 m. Latitude and longitude coordinates were collected using a handheld GPS navigator with high sensitivity and a WAAS-enabled GPS receiver, the Garmin Legend H, in a rugged case. A GIS application map, which included geographic information about the fields, was created using ArcGIS software [
35].
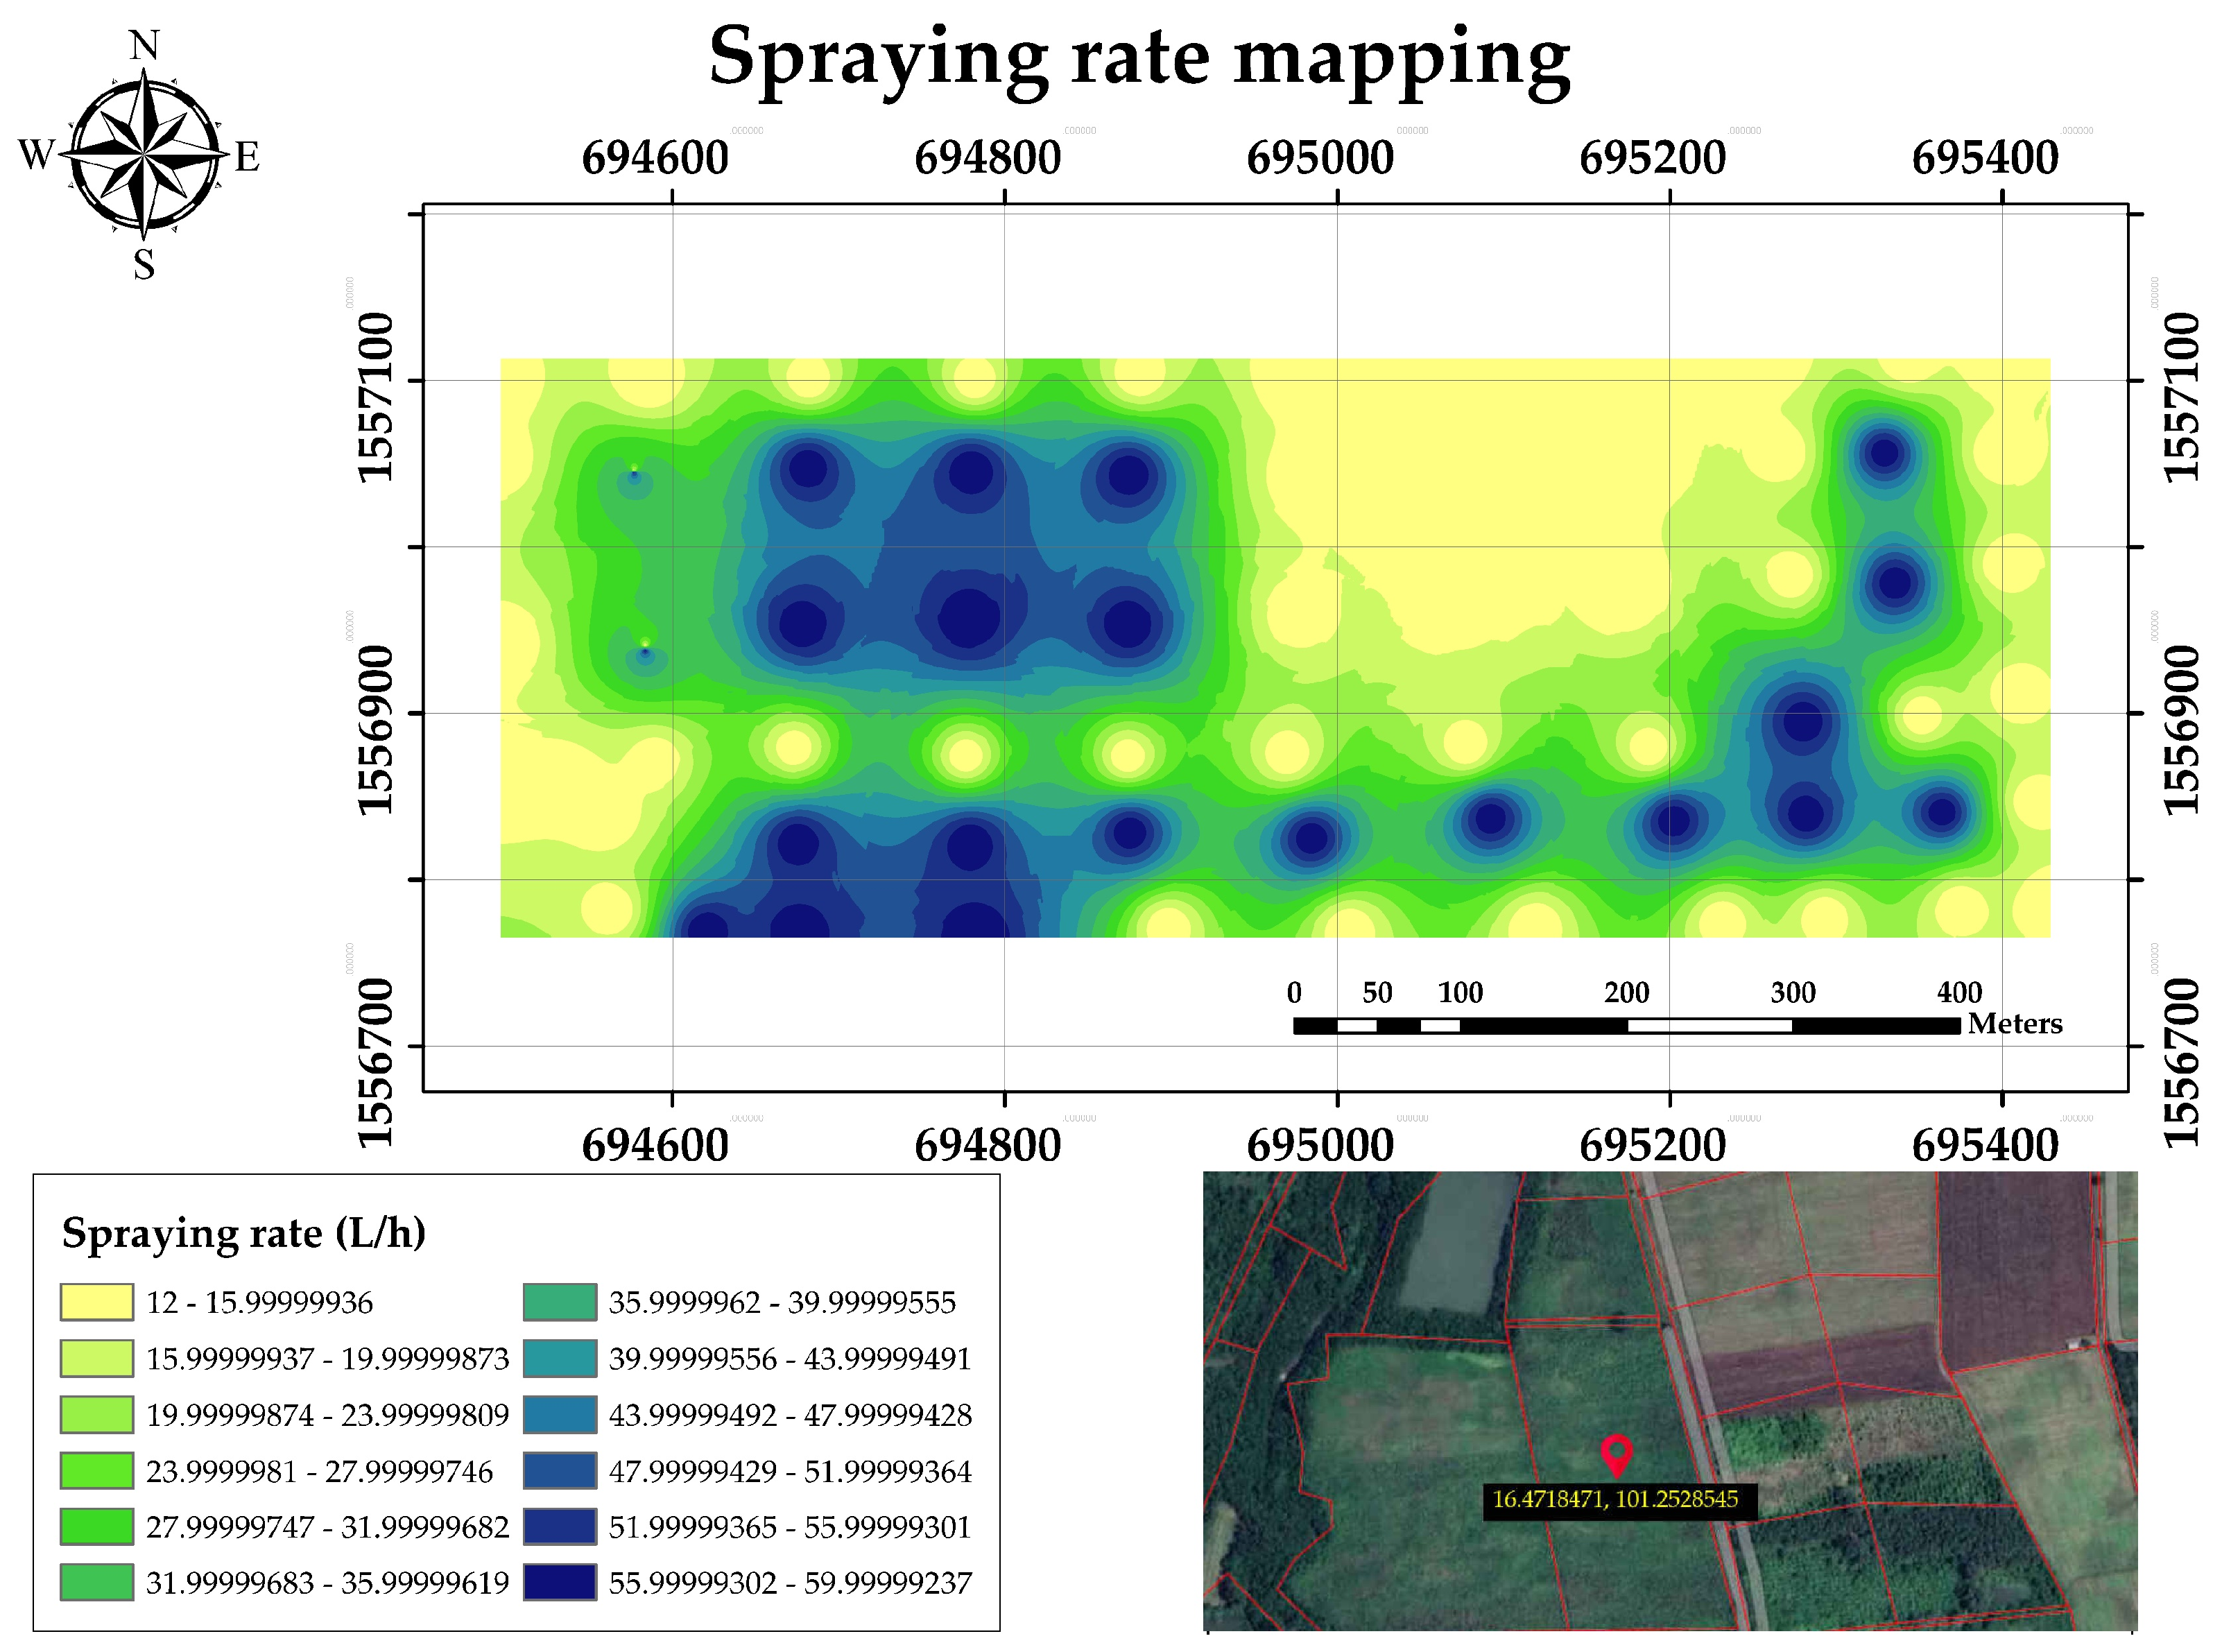
As illustrated in
Figure 17, the map shows the spray rate distribution in the test area. Blue indicates the highest rate (47–59 L/h); yellow (12–15 L/h). Data analysis shows the spraying rate is proportional to sugarcane growth, allowing farmers to save costs by reducing fertilizer in areas with good growth [
3,
20,
24].
3.8.5. Soil Moisture Contents GIS Application Mapping
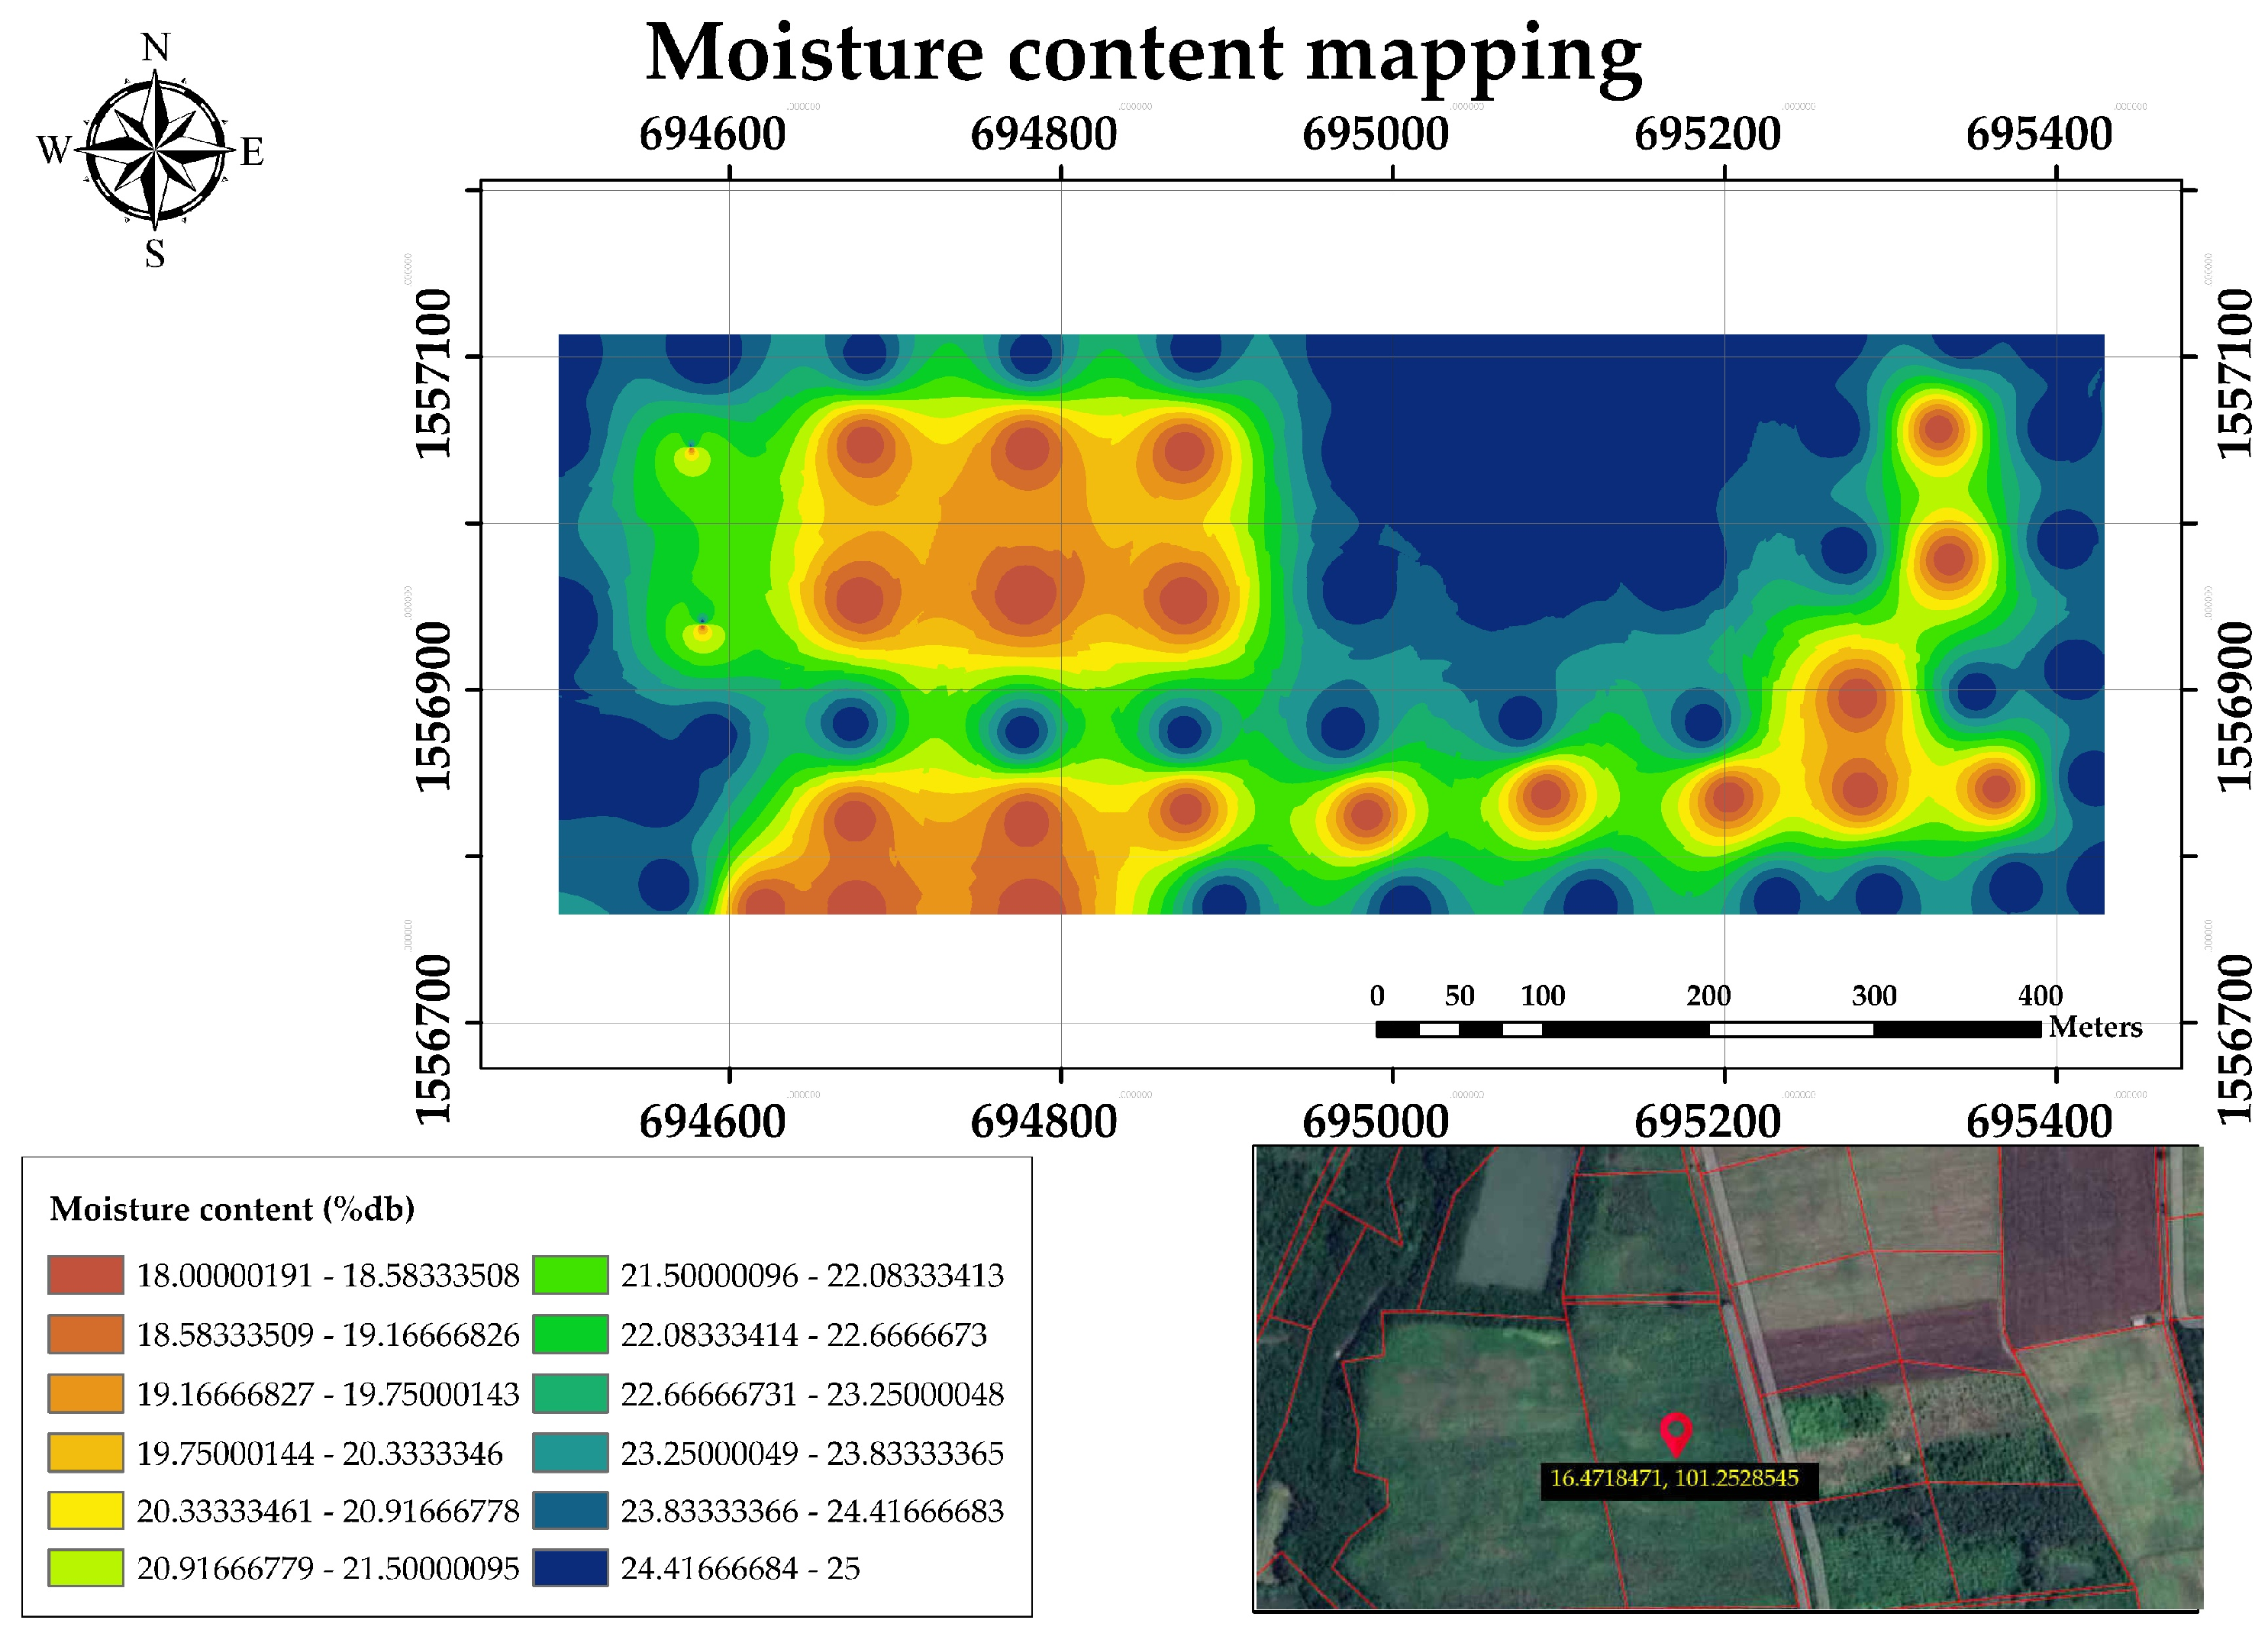
As illustrated in
Figure 18, the map displays soil moisture values for test plots, with blue indicating the highest values (23–25% dB) and yellow the next highest (18–20% dB). Moisture varies due to soil quality and elevation, but farmers can use the map to identify optimal planting locations by latitude and longitude. Shale plowing is also recommended for optimal results [
34,
35].
3.8.6. Sugarcane Density GIS Application Mapping
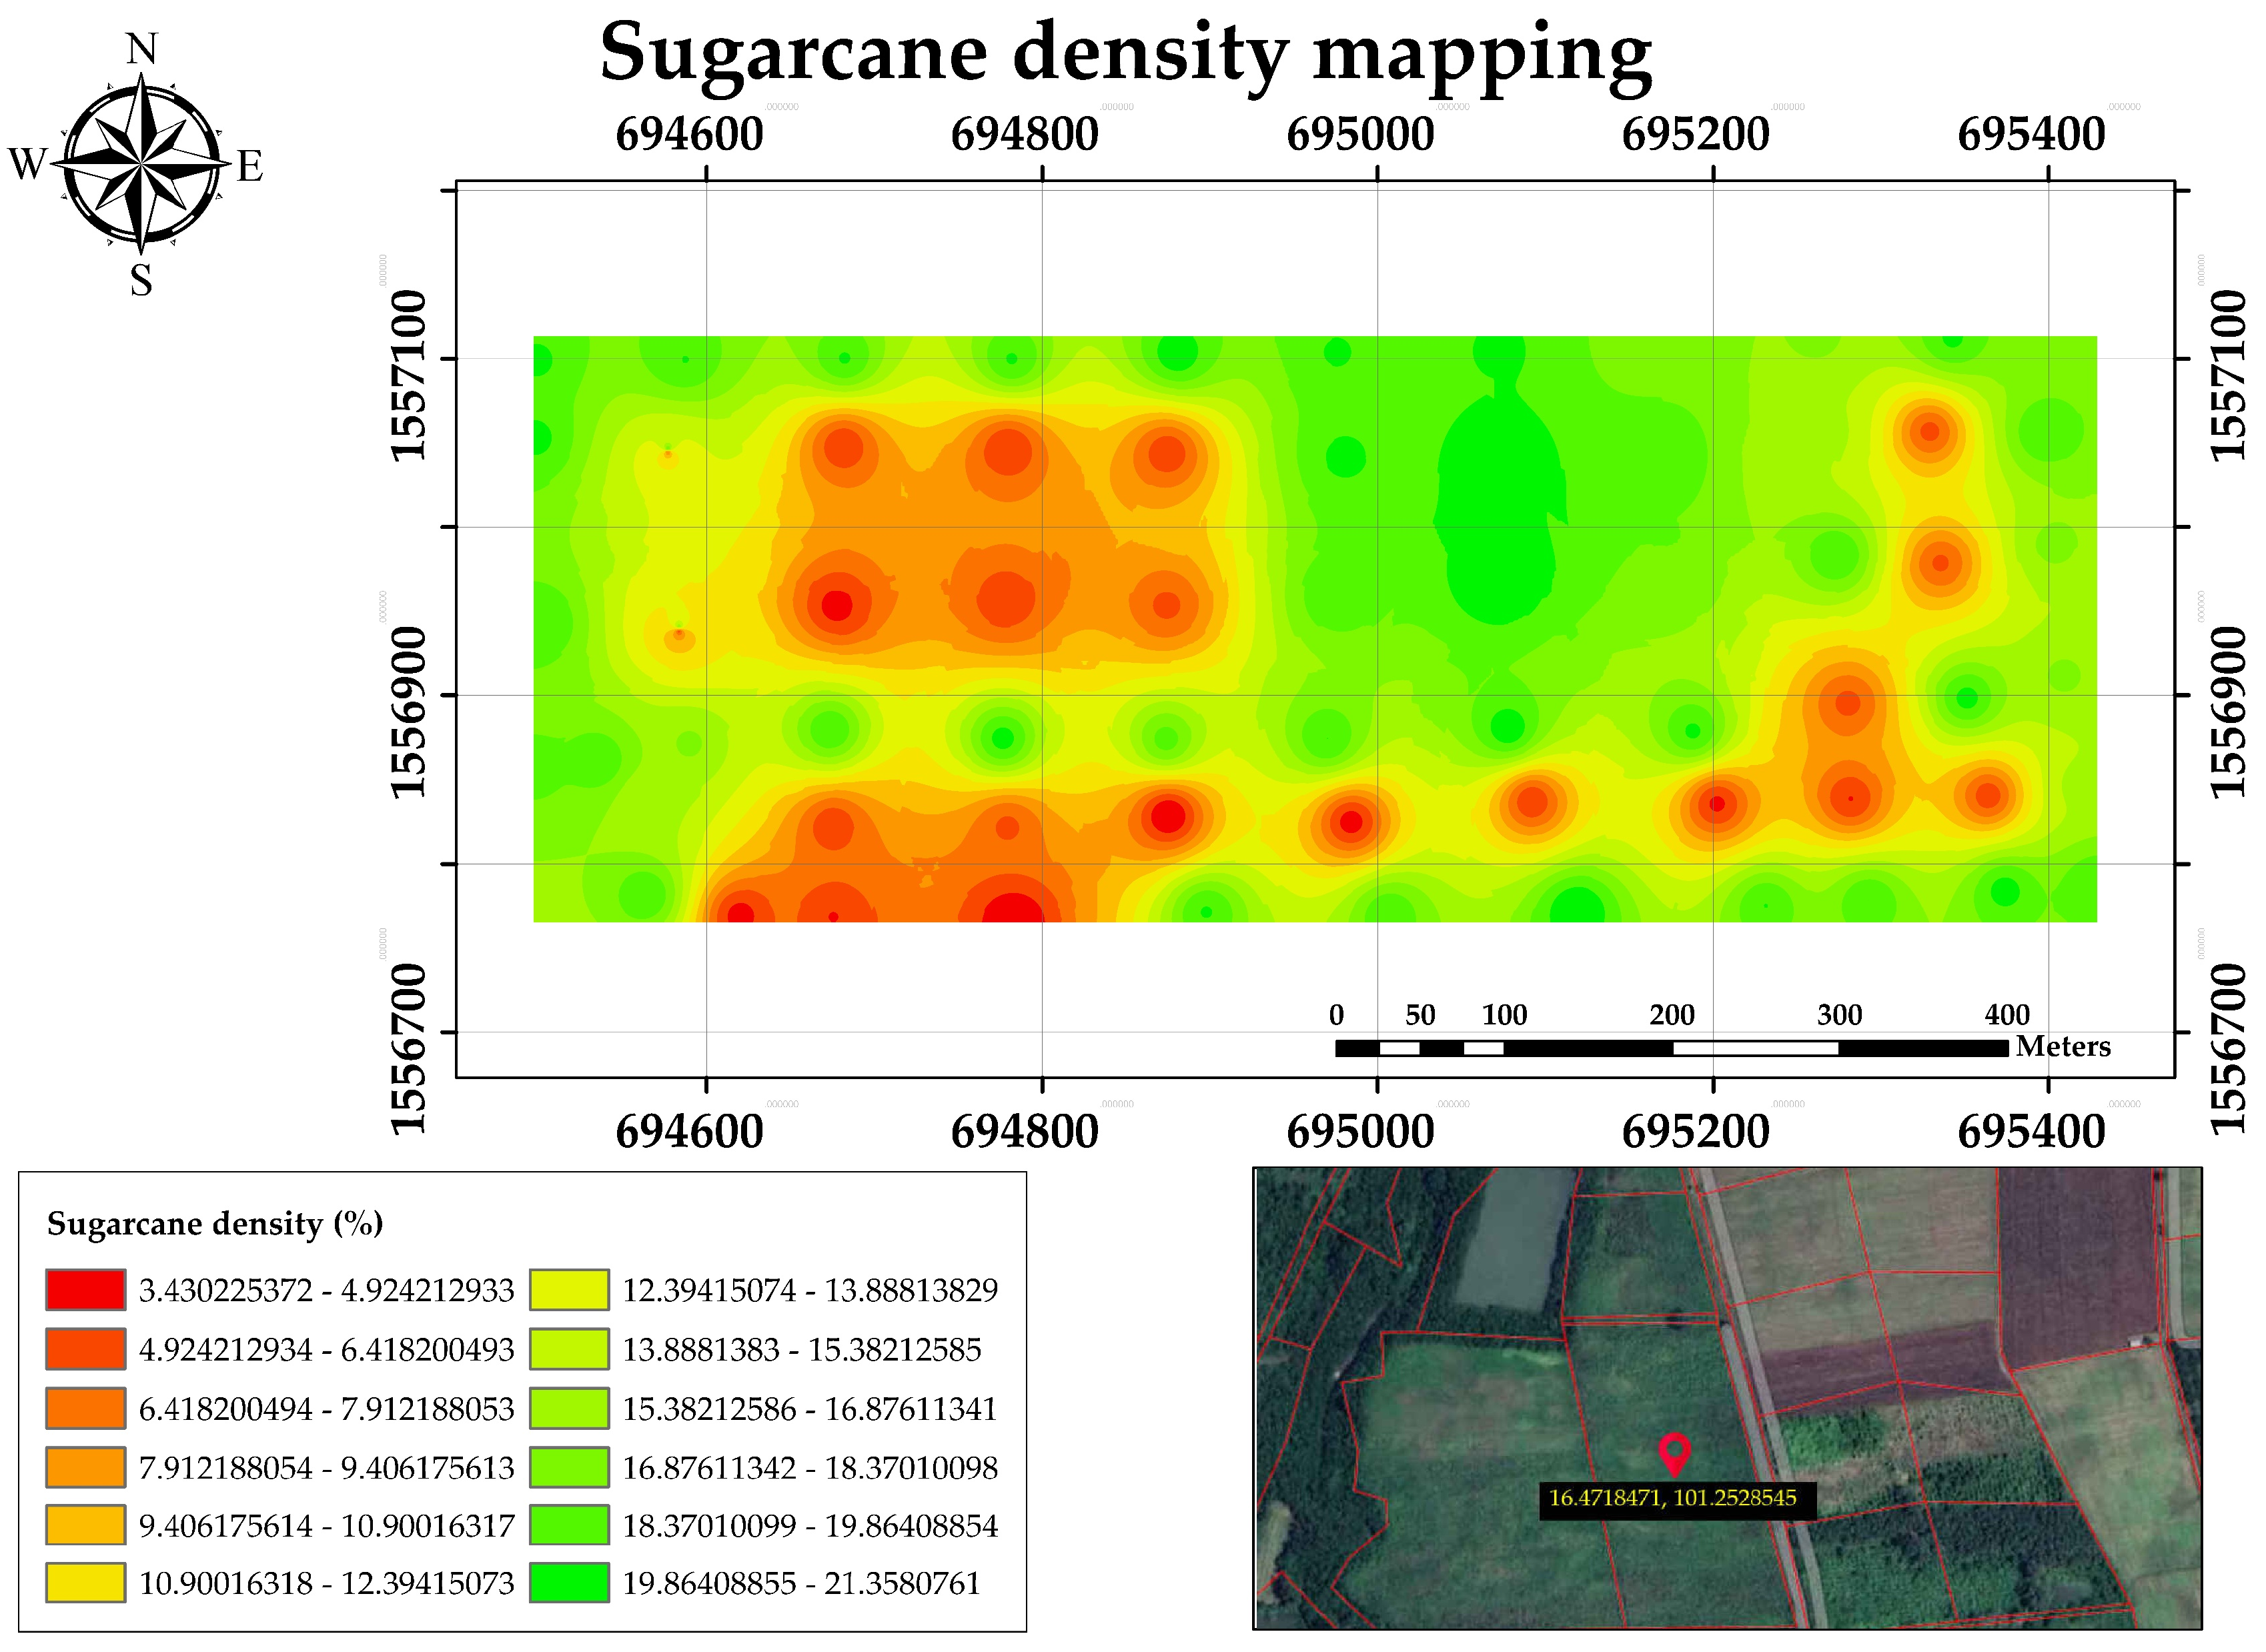
As illustrated in
Figure 19, The growth rates of sugarcane in test plots were mapped by analyzing webcam photos to determine the density of sugarcane leaves. A resulting map indicates areas of high and low growth rates in shades of green (15–21%) and red (3.4–9.4%), respectively. This information can be used by farmers to make immediate adjustments to improve growth [
19,
20].
4. Conclusions
The driverless tractor is equipped with a ground remote control system to operate a variable-rate sprayer. This system is designed to increase efficiency, reduce labor shortage, and save costs while accurately spraying chemicals in sugarcane fields. An unmanned tractor with a 400 m radio remote control needs a motion position controller and a trajectory design. The trajectory is linear in the orthogonal coordinate system. The PID controller with two loops is used for controlling the movement position and yaw angle of the tractor. The program Simulink is used for simulation. The experiment is divided into two parts: the tractor moves along the route and moves in a straight line. The results show that the designed control system can successfully control the tractor from a distance and move it along the designated path. However, there are constant positional errors when the tractor follows a straight-line trajectory at a constant speed, indicating that the proposed controller still has limitations.
For the laboratory test, the percentage representing the simulation stage of sugarcane crop growth is green. The color sample range is 5%, 10%, 15%, and 20%, and the height (m) range of the webcam is 0.6, 0.8, 1.0, and 1.2, respectively. This has statistical significance for the algorithm quality of segmented objects, with a confidence level of 95%.
As the density and height of the camera increase, segmented objects will increase. In the field test, it displayed the chemicals and tested nozzles at different heights of 0.25 m, 0.5 m, and 0.75 m, with an average efficiency of 85.30% at 1 bar of pressure, the system spraying 36 L/h and having a working capacity of 0.975 ha/h, resulting in 0.161 kW-hr of electricity consumption and 6.807 L/h of fuel consumption.
During the variable rate chemical spraying test in the sugarcane plantation, a relationship was discovered between the growth rate, soil moisture, and soil compaction values. It was observed that areas with high moisture levels exhibited higher sugarcane growth rates, reducing the need for chemical spraying, and leading to cost savings. Conversely, areas with low moisture and high soil compaction values experienced significantly lower sugarcane growth rates, necessitating increased chemical spraying.
Furthermore, through a comprehensive research process and the application of the correct methodology, this study suggests that academic progressions could be pertinent to the adoption of intelligent precision agriculture. Notably, the research provided in-depth analysis, presenting new knowledge that extends beyond the original work and can be widely used to evaluate the advantages of an aging economy and society.
