Article

The Future of Cotton in Brazil: Agroclimatic Suitability and Climate Change Impacts

by
João Antonio Lorençone
1,2,
Pedro Antonio Lorençone
1,2,
Lucas Eduardo de Oliveira Aparecido
3,
Guilherme Botega Torsoni
2,
Glauco de Souza Rolim
1 and
Fernando Giovannetti Macedo
2,*
1
Department of Exact Sciences, School of Agricultural and Veterinary Sciences, São Paulo State University (UNESP), Jaboticabal 14884-900, SP, Brazil
2
Federal Institute of Mato Grosso do Sul (IFMS), Naviraí 79950-000, MS, Brazil
3
Federal Institute of Sul de Minas (IFSULDEMINAS), Muzambinho 37890-000, MG, Brazil
*
Author to whom correspondence should be addressed.
AgriEngineering 2025, 7(6), 198; https://doi.org/10.3390/agriengineering7060198
Submission received: 29 April 2025 / Revised: 6 June 2025 / Accepted: 17 June 2025 / Published: 19 June 2025

Abstract

:
Cotton is the most widely consumed natural fiber globally and emits fewer greenhouse gases compared to synthetic alternatives. Brazil is currently the largest cotton exporter, and understanding its potential for sustainable expansion is crucial. This study developed agroclimatic zoning maps for cotton (Gossypium hirsutum L.) across Brazil under current and future climate conditions using data from the World-Clim and MapBiomas platforms. Four climate change scenarios (SSP1-2.6, SSP2-4.5, SSP3-7.0, SSP5-8.5) were assessed over multiple time periods. Results showed that rising temperatures and reduced rainfall will likely reduce cotton suitability in traditional producing regions such as Bahia. However, areas with potential for cotton cultivation, especially in Mato Grosso, which currently accounts for 90% of national production, remain extensive, with agroclimatic conditions indicating a theoretical expansion potential of up to 40 times the current cultivated area. This projection must be interpreted with caution, as it does not account for economic, logistical, or social constraints. Notably, Brazilian cotton is cultivated with minimal irrigation, low fertilizer input, and high adoption of no-till systems, making it one of the least carbon-intensive globally.

Graphical Abstract

1. Introduction

Cotton (Gossypium hirsutum L.) is the most widely consumed natural fiber globally [1]. Its production provides essential raw materials for various industries, including textile, pharmaceutical, cosmetic, and food industries (both human and animal). Human utilization of cotton dates back to at least 3000 BC, with the earliest known fabrics found in India [2], although the origin of cotton predates these records [3]. For centuries, cotton was the predominant fiber worldwide, but in recent times, the consumption of synthetic fibers has surpassed that of cotton nearly threefold [4].
Synthetic fibers, primarily derived from petroleum, contribute significantly to environmental issues such as climate change [5]. Cotton, on the other hand, offers superior fiber quality and has potential benefits for carbon sequestration, particularly when conservation agricultural practices, such as no-till farming and crop rotation, are employed [6].
Several international studies have assessed the impacts of climate change on cotton production using crop simulation models and CMIP6 scenarios. For instance, projections in China have shown significant variability in cotton yield and water use across different regions, highlighting the need for region-specific adaptation strategies [7]. In India, studies have utilized the AquaCrop model to simulate future cotton yields under various climate scenarios, providing insights into potential yield changes in semi-arid regions [8]. Similarly, research in China has employed the AquaCrop model to evaluate the effects of climate change on cotton growth, emphasizing the importance of model calibration for accurate projections [9].
Additionally, agroclimatic zoning approaches similar to the one adopted in this study have been successfully applied in different regions and for various crops. For instance, Assad et al. [10] developed climate risk zoning for cotton in Brazil using historical thresholds. Internationally, Thornton et al. [11] applied agroclimatic zoning to assess maize suitability under climate change scenarios in sub-Saharan Africa, while Ovalle-Rivera et al. [12] used bioclimatic variables and spatial modeling to project future suitability of Arabica coffee in major producing countries. These studies, based on climate projections and spatial datasets such as WorldClim, highlight the versatility and relevance of agroclimatic zoning as a tool for agricultural planning and climate adaptation.
Despite these advances, there remains a lack of detailed agroclimatic zoning studies for cotton in Brazil using updated CMIP6 scenarios. This gap limits the formulation of robust adaptation strategies to guide sustainable expansion and resilience of cotton farming in the country.
Despite the decline in its global dominance, the cotton industry remains a vital source of employment worldwide. In recent years, cotton production in countries such as China and the United States has faced challenges. In China, although overall output remains stable, production outside Xinjiang has declined, while the 2024/25 crop is estimated at 6.16 million tons, a 9.7% increase from the previous year, mostly concentrated in Xinjiang [13]. In the United States, cotton production in 2023/24 fell by 12% compared to the previous year, driven by weather-related impacts and reduced planted area [14]. In contrast, Brazil has emerged as the world’s leading cotton exporter, shipping 12.3 million bales in the 2023/24 season, surpassing the U.S. with 11.8 million bales [15]. This shift underscores Brazil’s growing role in global cotton markets and highlights the need to evaluate its agroclimatic potential under future climate scenarios.
Agricultural zoning for cotton in Brazil serves as a key tool for determining the most appropriate regions for cultivation, taking into account the specific climatic and soil conditions of each area. Zoning not only enhances productivity but also reduces agricultural risks by promoting sustainable management practices, which can increase resource use efficiency and mitigate environmental impacts [10].
Temperature plays a critical role in cotton growth, with reproductive success being adversely affected at temperatures above 28–30 °C, and a critical threshold around 32 °C [16,17]. Elevated temperatures can impair reproductive development, reduce seed numbers, and increase flower abscission, leading to lower fruit retention, as observed in previous studies [18,19,20]. Additionally, cotton’s growth rate and photosynthesis decline at temperatures around 35 °C [21], and boll development ceases at temperatures below 20 °C during the fruiting and maturation stages [22].
Although cotton requires less water than other crops, such as soybeans, corn, and wheat [23], water scarcity can significantly reduce cotton productivity by negatively affecting traits like boll weight and seed cotton yield [24]. An annual precipitation of over 700 mm is deemed adequate for cotton cultivation [25]. However, much of the world’s cotton is produced in irrigated areas, a practice that is not sustainable in the long term due to the high water consumption involved [23]. Furthermore, suitable cotton cultivation areas should avoid regions with slopes greater than 12% [26].
Climatic conditions are crucial for cotton growth and development, directly influencing both productivity and fiber quality. Changes in average temperatures and precipitation patterns, driven by climate change, can adversely affect cotton cultivation. Increased temperatures have been reported to result in reduced fruit retention and increased flower abscission, significantly impacting crop yields [27]. For instance, projections suggest that temperatures exceeding 32 °C, which are expected to become more frequent under global warming scenarios, could lead to a substantial decline in cotton productivity [28].
Despite recent advances in understanding the impacts of climate change on agricultural crops, detailed projections for cotton in Brazil remain limited, particularly those based on the most recent CMIP6 scenarios. This gap hinders the development of effective adaptation strategies in the face of expected changes in temperature and precipitation. We hypothesize that climate change will exert contrasting effects on the climatic suitability of cotton across Brazil, reducing suitability in traditional production regions, such as Bahia, while potentially expanding it in areas currently limited by low temperatures, such as the southern region of the country.
Therefore, this study aims to conduct agroclimatic zoning of cotton (Gossypium hirsutum L.) across the entire Brazilian territory under both current and future climate conditions, based on different Shared Socioeconomic Pathways (SSPs) from CMIP6. In addition to identifying areas most suitable for cotton cultivation in the coming decades, the study also explores the potential for sustainable expansion of the crop, considering its implications for carbon emission mitigation and efficient resource use.

2. Materials and Methods
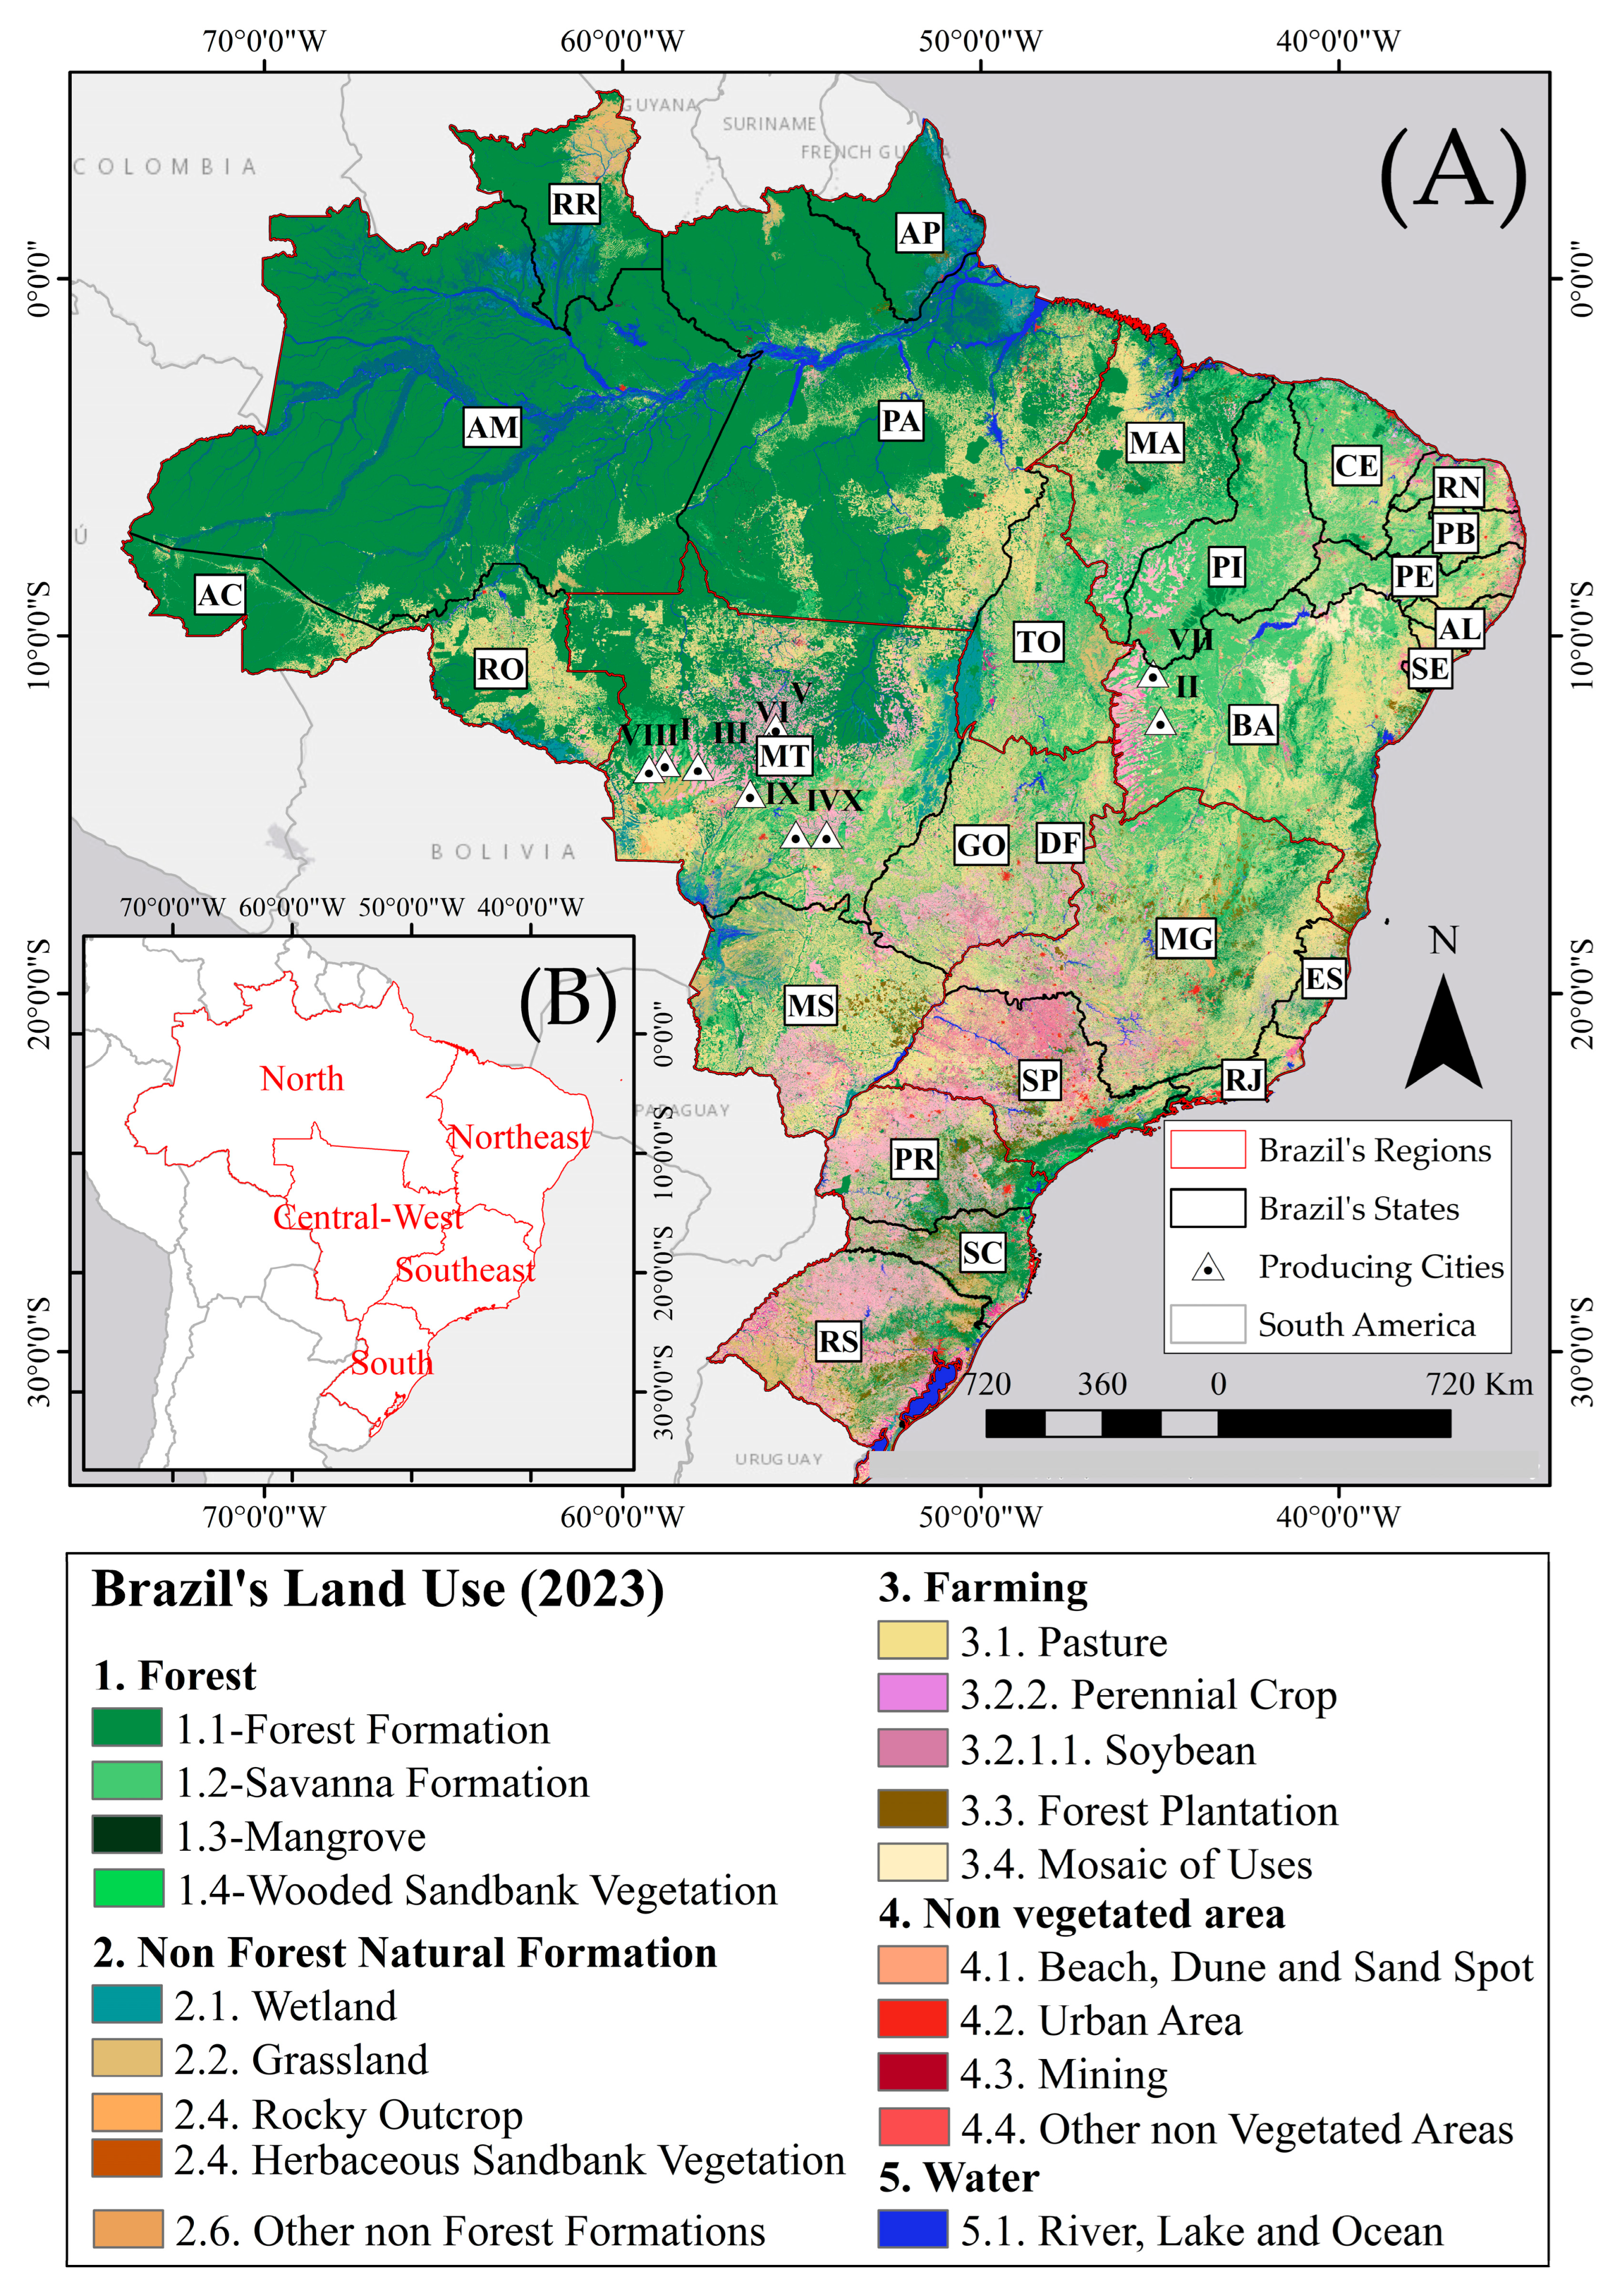
2.1. Study Area

The research was conducted across the entire Brazilian territory, encompassing an area of 8,516,000 km2. The country is divided into five distinct geographic regions: central–west, northeast, north, south, and southeast (Figure 1). According to Köppen’s classification (1948), Brazil comprises twelve climate classes, with the tropical zone “A” being predominant. This region’s climatic conditions contribute significantly to its rich biodiversity, which includes 15 to 20% of the world’s plant and animal species [29,30]. The diversity of ecosystems, such as the Amazon Rainforest, Cerrado (Brazilian Savanna), Caatinga, Pantanal, Atlantic Forest, and Pampa, along with the extensive hydrographic network highlighted by the Amazon and Paraná Basins, are crucial for maintaining the country’s biodiversity and supporting its economic activities [31].

2.2. Climate Data

Mean air temperature (Tmean) and annual cumulative precipitation (Prec) data for contemporary baseline conditions (1991–2020 climatological normal) and future climate projections were sourced from WorldClim version 2.1 [33]. These high-resolution climatologies are provided in GeoTIFF format at 30 arc-second spatial resolution (≈1 km2 at equator), offering exceptional cartographic fidelity suitable for micro-scale environmental modeling. The dataset demonstrates rigorous quality control through cross-validation against >9000 Global Historical Climatology Network stations (GHCNv2), with mean absolute errors of <1 °C for temperature and <15% monthly precipitation bias across most biomes [34]. WorldClim’s interpolation methodology, incorporating elevation-dependent regression Kriging with satellite-derived covariates, achieves superior accuracy compared to coarser-resolution alternatives [35], making it the benchmark for species distribution modeling and regional climate vulnerability assessments. The platform’s standardized geospatial metadata ensures FAIR data compliance, while its radiometric consistency has been validated through multi-model comparison studies [36], demonstrating negligible artifacts in climate trend analyses.

2.3. Future Climate Scenarios

To represent greenhouse gas trajectories across four future periods (2021–2040, 2041–2060, 2061–2080, 2081–2100), we used four Shared Socioeconomic Pathways (SSPs): SSP1-2.6 (low forcing), SSP2-4.5 (intermediate), SSP3-7.0 (high intermediate), and SSP5-8.5 (high forcing), reflecting divergent socioeconomic and land-use assumptions [37,38]. Climate projections were downscaled to 30″ (~1 km) resolution using WorldClim v2.1 [33] to align with baseline climatology.
From CMIP6, we selected IPSL-CM6A-LR due to its skill in simulating South American climate dynamics [39], particularly precipitation–temperature coupling in the La Plata Basin, despite a slight wet bias in rainy seasons and cold bias in the northeast [36,37,38,39,40]. While multi-model ensembles reduce structural uncertainties [37], computational constraints precluded high-resolution processing of multiple GCMs.
To contextualize uncertainties, we complemented our analysis with ensemble-informed statistics from published CMIP6 evaluations [36,41], including regional bias assessments for extreme precipitation [31]. This approach balances spatial detail with methodological pragmatism.

2.4. Land Use and Coverage Data

We define “Uncultivable Land” as contiguous map polygons where inherent surface characteristics preclude mechanized agriculture or soil cultivation, even under optimal climatic conditions. This exclusion is based on four mutually exclusive categories derived from MapBiomas Collection 9 land cover classes, following international remote-sensing best practices to avoid overestimation of agricultural potential and preserve critical ecosystems [32].
The categories and their rationales are as follows: (1) Anthropic Impermeable Surfaces: Artificial surfaces that physically prevent soil cultivation and root establishment due to sealing. These surfaces also severely limit water infiltration. (2) Hydrological Systems: Permanent water bodies or managed aquatic systems unsuitable for conventional soil-based agriculture. (3) Protected/Ecologically Sensitive Natural Ecosystems: Natural vegetation formations where conversion to agriculture is typically prohibited by environmental regulations or would cause severe ecological damage [38]. Naturally Fragile or Non-Soil Formations: Natural land covers inherently unsuitable for cultivation due to the absence of soil, extreme salinity, or instability.
For full reproducibility, all MapBiomas Collection 9 land cover polygons matching the codes listed in Table 1, for these four categories, were aggregated into a single “Un-cultivable Land” class. Any polygon assigned one of these codes was systematically excluded from subsequent cultivable land area calculations, generating a conservative cultivable land mask.

2.5. Climatic Suitability Assessment for Gossypium hirsutum

The study aimed to evaluate the suitability of regions within Brazil for cotton cultivation (Gossypium hirsutum) based on climatic conditions. The primary climatic variables considered were the average annual air temperature (°C) and the annual accumulated precipitation (mm).
A climatic classification key for Gossypium hirsutum was developed using established research on favorable growth conditions. The classification system incorporates parameters such as temperature thresholds, precipitation ranges, and slope constraints (Table 2). This key was adapted from previous studies [40,41,42,43], providing a comprehensive framework for assessing regional suitability for cotton cultivation under varying climatic conditions.

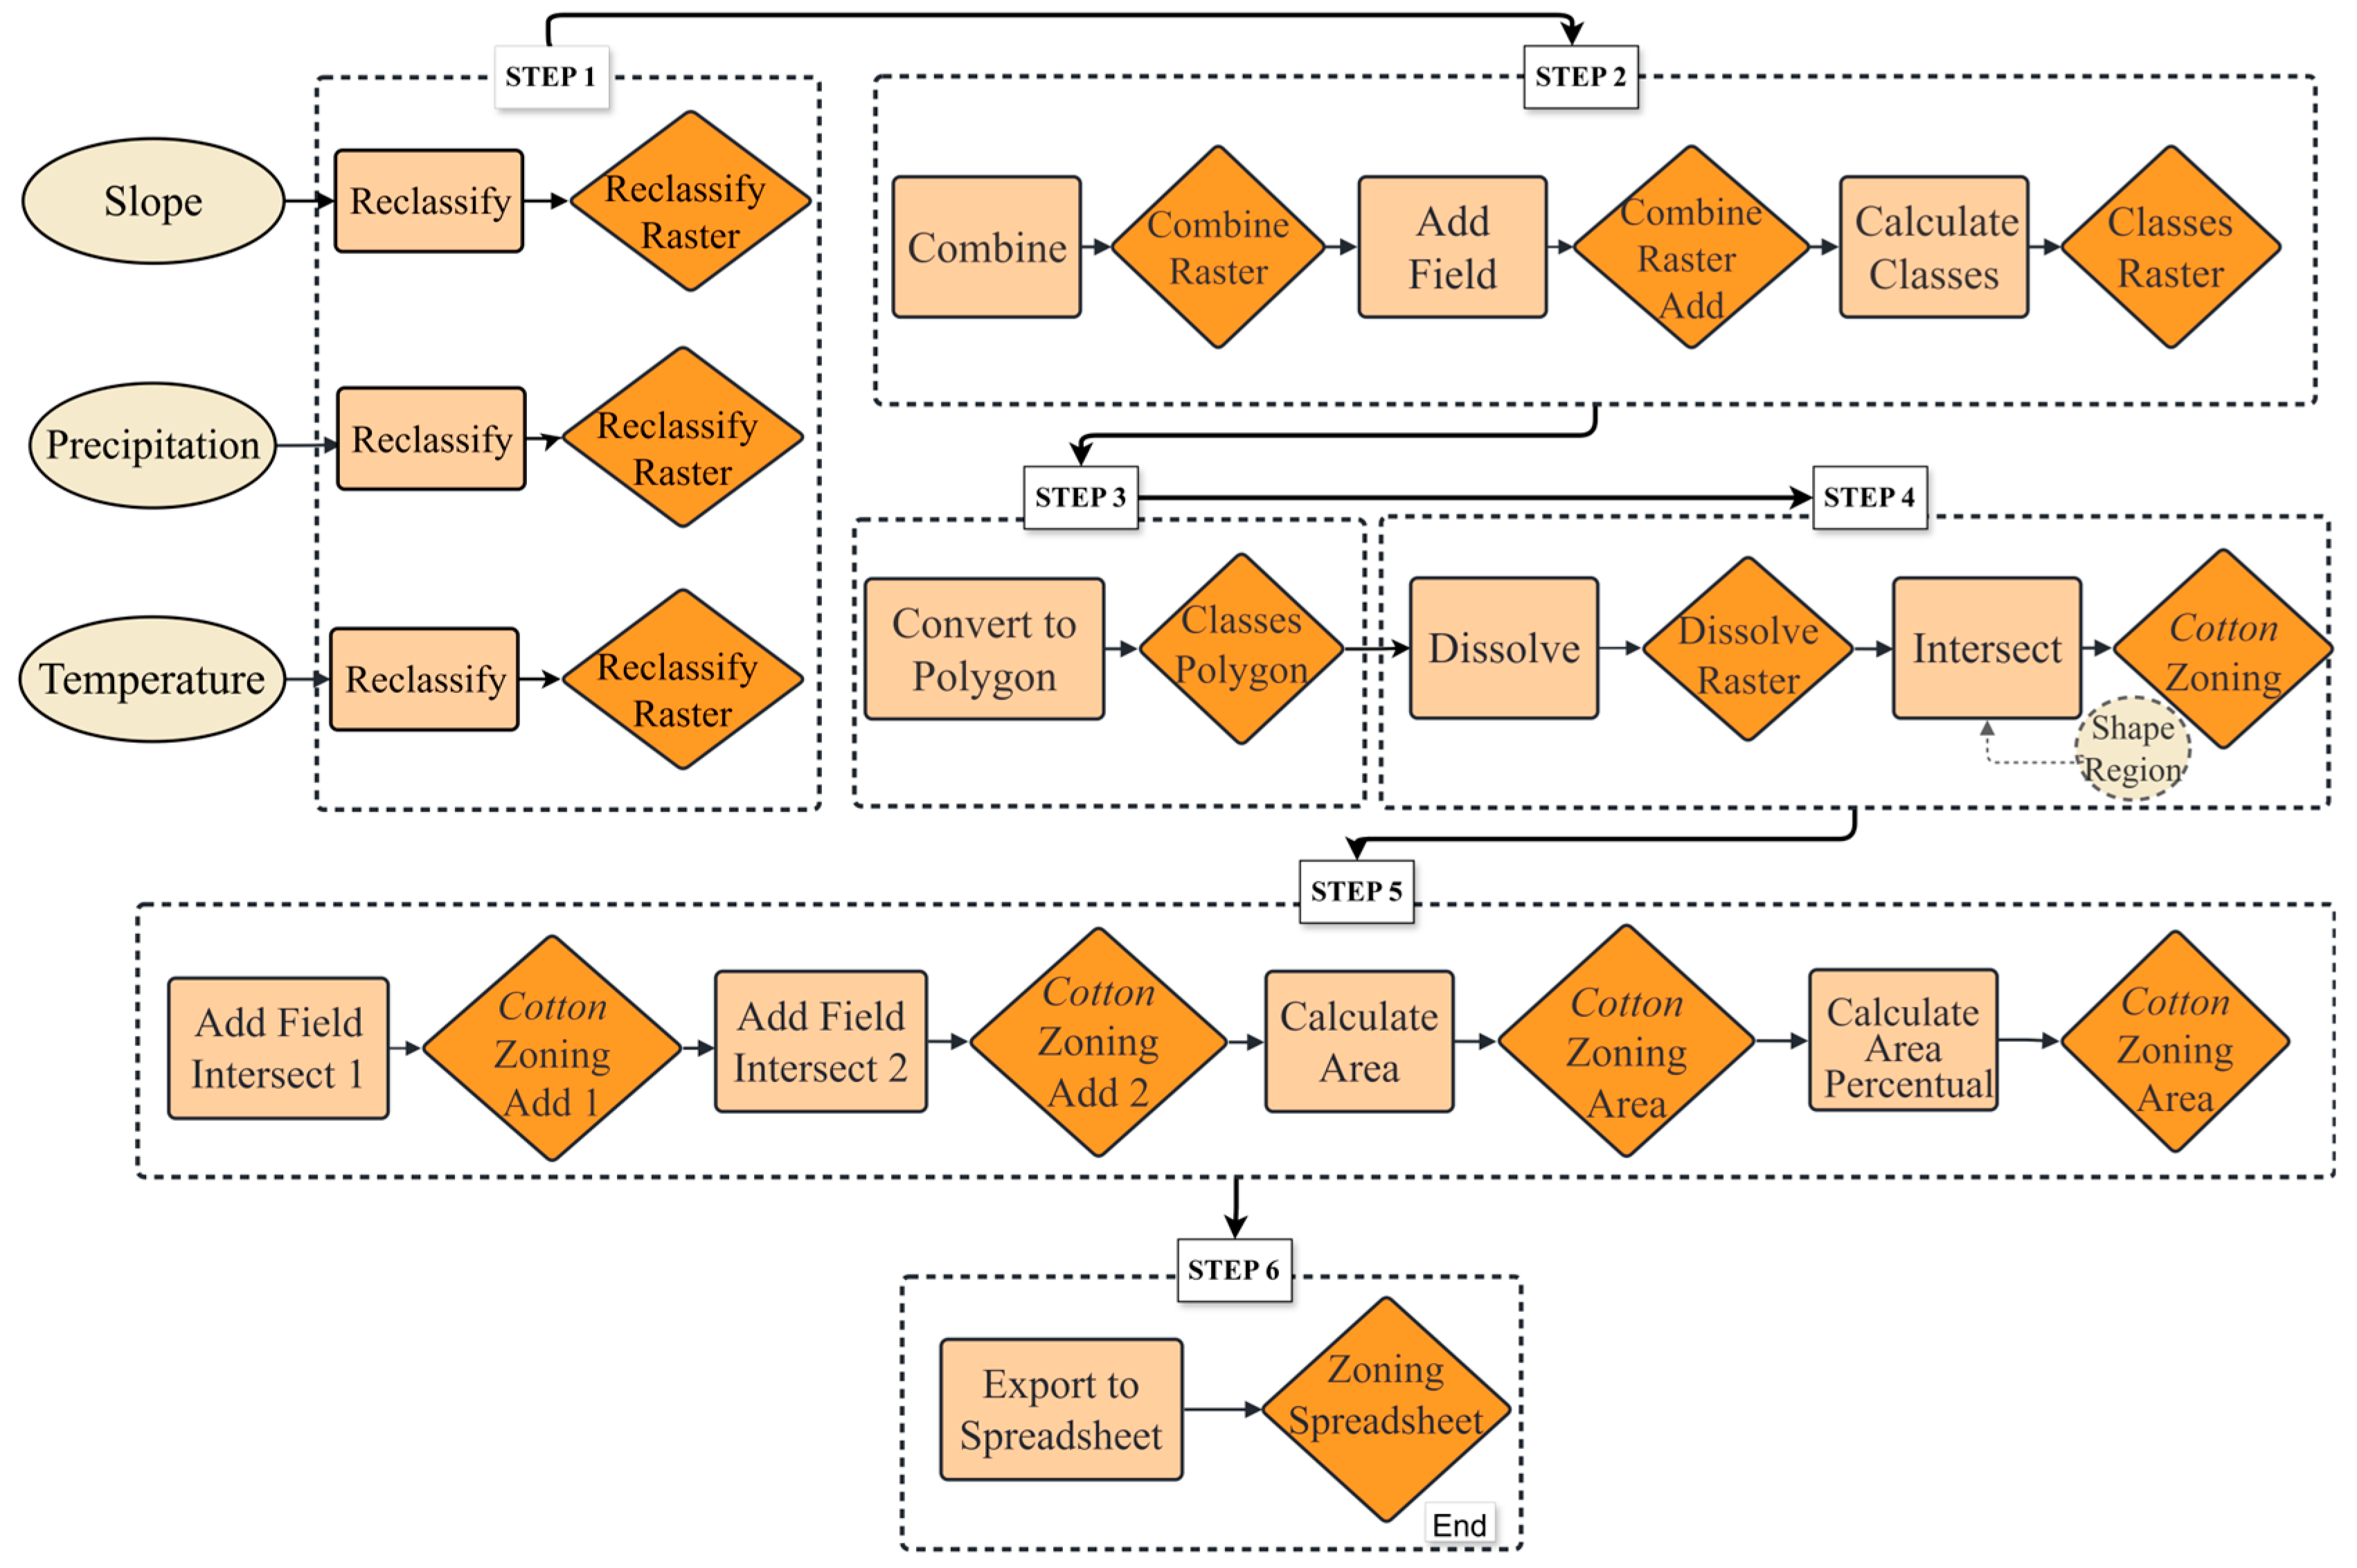
2.6. Data Processing Methodology

The data processing involved several critical steps facilitated by Geographic Information System (GIS) software QGIS (version 3.16), with automation support from Python scripts (version 3.8) (Figure 2). The methodology encompassed the following: Reclassification of Climate Data: Raster data for air temperature and daily accumulated precipitation were reclassified using the “Reclassify” tool in QGIS. This step assigned values to the rasters based on the climatic suitability criteria defined for cotton. Integration and Transformation: The reclassified rasters were merged to form a composite raster image. In this image, a new column was introduced in the attribute table to indicate the suitability classes, ranging from “Uncultivable Land” to “Suitable”. Conversion to Vector Format: The combined raster was subsequently converted into polygonal data, allowing for more detailed spatial analysis (Figure 2). This conversion facilitated the identification of continuous zones of suitability across the study area. Spatial Intersection and Area Calculation: The “Intersect” tool was employed to overlay geographic data from a Shapefile (“Shape Region”) containing geographic divisions and area data for each municipality and state. This integration enabled the calculation of the proportion of each suitability class within these administrative units.

2.7. Validation of the Agroclimatic Zoning

Cultivation records were obtained from the CROPGRIDS dataset [45], a comprehensive global geo-referenced dataset of 173 crops at 0.05° resolution. For each 30″ (~1 km) pixel, harvested area (ha) was extracted and binarized: pixels with ≥1 ha of cotton were labeled as presence (1) and those with <1 ha as absence (0), following thresholding procedures in agricultural suitability studies [46]. Positive points: the binary presence raster was converted to a point shapefile, retaining only pixels = 1 (true cotton occurrences). Negative points: all pixels = 0 were likewise converted to points, then spatially filtered to exclude any locations with known cotton presence, ensuring true absence of samples [47].
The original multi-class suitability map was reclassified into a binary raster: Apt (1): classes Suitable and Unsuitable due to Water Deficit and Not apt (0): all remaining classes. This conversion facilitated direct extraction of predicted aptness (0/1) at each validation point. For each validation point, the predicted class was compared to the observed class, yielding a confusion matrix [48].
Validation points were derived from the CROPGRIDS dataset [45], with each pixel classified as presence (1) if ≥1 ha of cotton was harvested or absence (0) if <1 ha [46]. For each of these points, the reclassified zoning provided a predicted binary value (apt = 1 or not apt = 0). Comparing these two binary datasets produces a confusion matrix consisting of true positives (TP), false negatives (FN), false positives (FP), and true negatives (TN) [47]. True positives indicate locations where cotton is known to occur and the model correctly predicts “apt”, false negatives represent cotton sites missed by the model, false positives are areas with no cotton predicted as “apt”, and true negatives are correctly predicted non-cotton locations. This framework summarizes how often the model’s binary predictions agree with or diverge from reality.
Several performance metrics were derived from the confusion matrix to summarize model behavior [48,49]. Accuracy reflects the overall proportion of points correctly classified, both apt and not apt, and indicates the general reliability of the zoning. Precision measures the proportion of predicted apt locations that truly have cotton, thereby indicating how trustworthy the model’s “apt” predictions are in practice. Omission error quantifies the fraction of actual cotton sites that the model failed to identify as apt, a key concern when underpredicting suitable areas. Conversely, commission error represents the fraction of predicted apt locations where cotton does not occur, reflecting overprediction of suitability.
Sensitivity expresses the model’s ability to detect actual cotton occurrences among all real occurrences, while specificity indicates how well the model correctly excludes areas without cotton. Finally, the True Skill Statistic (TSS) combines sensitivity and specificity to assess discrimination performance beyond random expectation; values above 0.5 are widely regarded as indicating good separation between suitable and unsuitable areas. Together, these metrics provide a balanced picture of the model’s strengths, such as its capacity to correctly identify cotton-producing areas, and its limitations, such as areas where overprediction or underprediction may occur.

3. Results

3.1. General Results and Current Scenario

For all climate change scenarios evaluated in this work, including the current scenario, areas with climatic limitations for cotton cultivation in Brazil were verified (Figure 3). Water deficit followed by high temperatures were the main climatic factors that reduced the recommended cultivation areas for cotton. The evaluation of different scenarios for future projections revealed a temporary increase in the area suitable for cotton cultivation in the south region of Brazil, and a long-term reduction in the north, northeast and center–west regions of the country.
In the current scenario, seven climate classifications were verified in Brazil (Suitable, Uncultivable Land, Unsuitable, Unsuitable due to Thermal Deficiency, Unsuitable due to Topography, Unsuitable due to Water Deficit, Unsuitable due to Water Surplus). Unsuitable due to Thermal Excess was the only class not present in the current scenario. In almost half of Brazil’s total land area (43%), no agricultural activity can be carried out. This area is made up of permanent forests, rivers, lakes, mangroves, and urban areas. In addition to the areas where no agricultural activity can be carried out, 22.5% of Brazil’s agricultural area cannot be cultivated due to the following restrictions: Unsuitable due to Thermal Deficiency, Unsuitable due to Water Deficit, Unsuitable due to Topography, Unsuitable due to Water Surplus, and Unsuitable. In the current scenario, areas suitable for cotton cultivation represent 33.9% of the entire national territory (Figure 3).

3.2. Validations Results

We evaluated the performance of our agroclimatic zonation model against cotton occurrence data from the CROPGRIDS dataset, adopting a 1 ha threshold to distinguish true presence (≥1 ha harvested) from absence (<1 ha). Table 3 presents the resulting validation metrics. Our model achieved an overall accuracy of 0.747, meaning roughly three quarters of validation points were correctly classified. Precision (0.789) indicates that nearly 79% of locations predicted as “apt” indeed coincide with known cotton cultivation, whereas a commission error of 26.1% reflects the proportion of predicted “apt” pixels where cotton is absent. Conversely, the omission error of 21.1% reveals that approximately one in five actual cotton sites were not identified as suitable, an expected consequence of applying a conservative 1 ha cutoff to minimize false positives [46].
Sensitivity (true positive rate) and specificity (true negative rate) stood at 0.789 and 0.836, respectively, demonstrating a balanced capacity to detect true cotton occurrences and to exclude non-cotton areas. Such a performance aligns with benchmarks in agroclimatic suitability studies, where TPR and TNR values above 0.70 are considered satisfactory [49]. The True Skill Statistic (TSS) of 0.625 confirms robust discrimination beyond random expectation [48].
We acknowledge that the 0.05° (~5 km) resolution of CROPGRIDS introduces spatial uncertainty, potentially masking finer-scale variability in actual cotton planting [45]. Nevertheless, by applying a 1 ha threshold, we ensured that only substantial harvested areas were counted as presence, thereby increasing the reliability of our validation samples despite the coarser resolution.

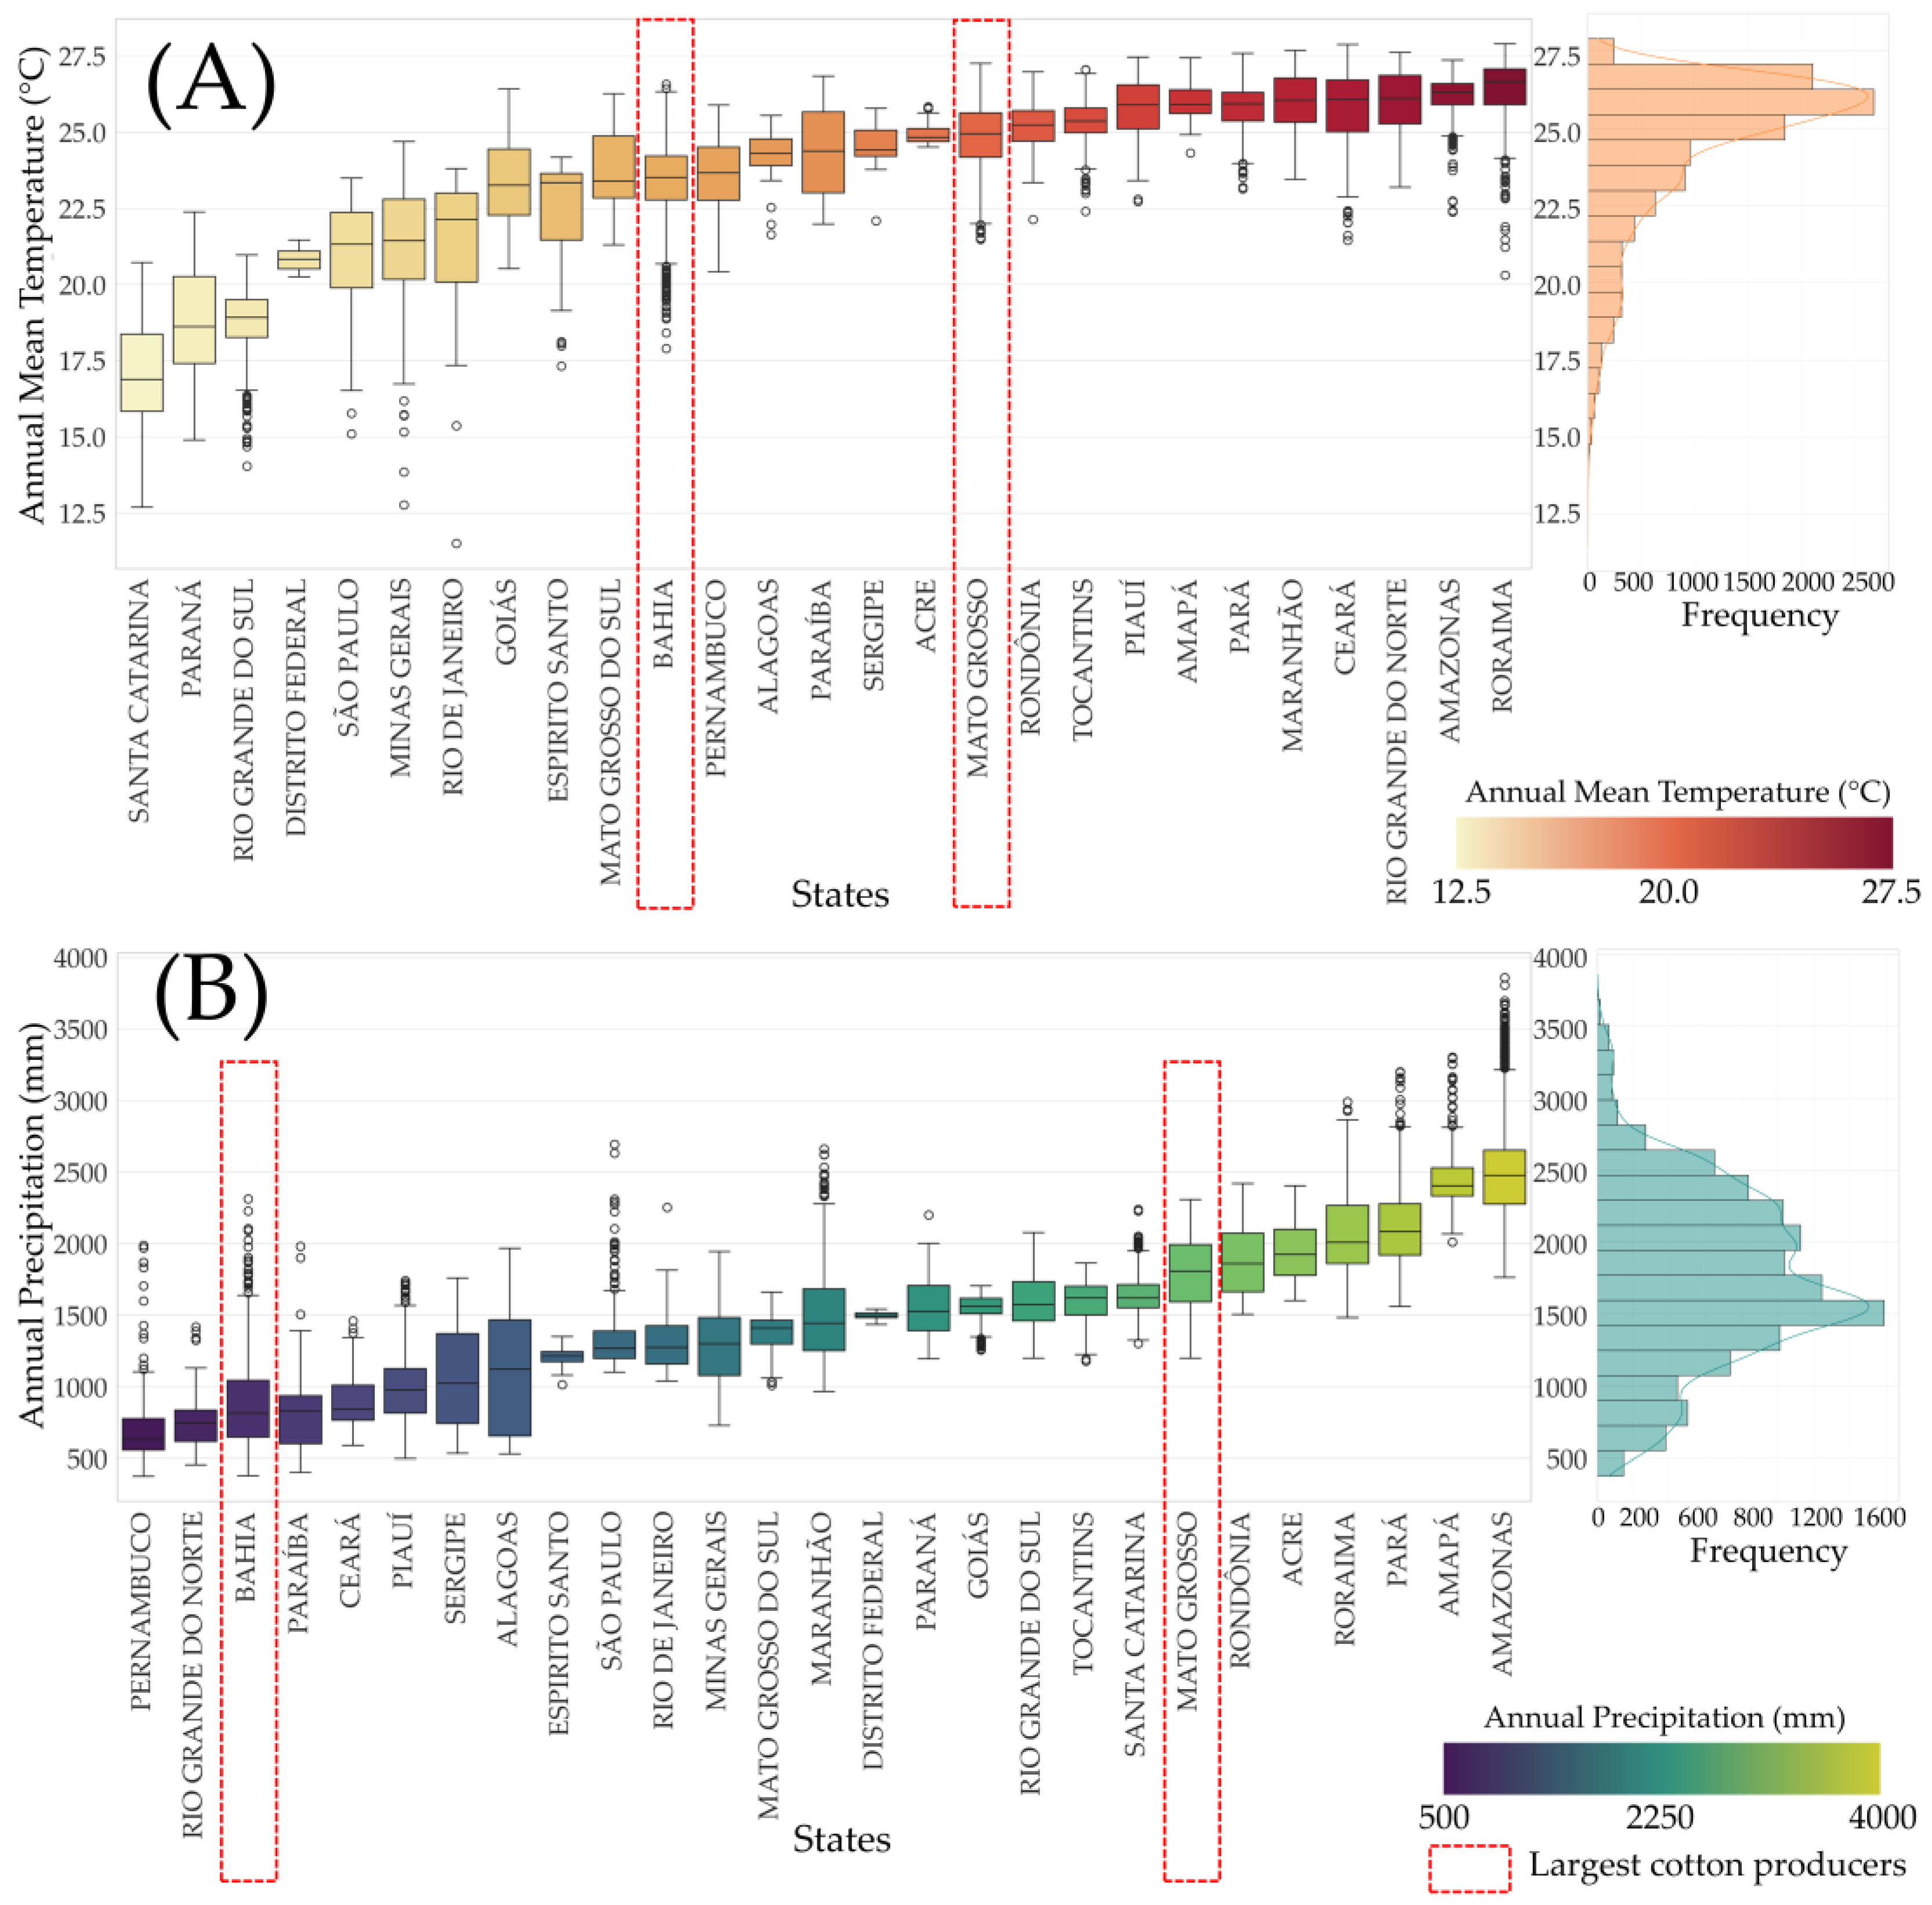
3.3. Current Climatic Conditions

Brazil presents marked climatic diversity due to its continental scale, with substantial differences in both air temperature and precipitation across its territory. The average annual air temperature ranges from approximately 17 °C and Mean Absolute Deviation (MAD) of 1.02 °C in southern states, such as Santa Catarina, to above 26 °C (MAD 0.85 °C) in northern states like Roraima and Amazonas. In key cotton-producing areas, this variation is particularly relevant. For example, Bahia, one of the top cotton-producing states, records average temperatures around 24.6 °C (MAD 0.93 °C), while Mato Grosso, the leading producer, averages approximately 25.5 °C (MAD 0.58 °C) (Figure 4A).
Precipitation patterns are even more variable. Mato Grosso, which accounts for over 90% of Brazil’s cotton production, receives an average of around 1890 mm (MAD 131 mm) of rainfall annually, with a favorable seasonal distribution that supports cotton cultivation under rainfed systems, particularly in the second crop cycle following soybean harvest. In contrast, Bahia presents a much drier climate, with annual precipitation often below 900 mm, averaging around 848 mm (MAD 124 mm), concentrated in a shorter rainy season and with higher interannual variability (Figure 4B). As a result, cotton production in Bahia relies heavily on irrigation infrastructure, particularly in the western region of the state [50].

3.4. Air Temperature Under Future Climate Scenarios

Considering the most optimistic scenario (SSP1-2.6), a progressive and moderate increase in air temperature in Brazil was observed throughout the analyzed periods. During the short term (2021–2040), the increase in average temperature was approximately 1.25 °C, and a Mean Absolute Deviation (MAD) of 0.11 °C was observed, indicating that the air temperature variation remained constant, close to the reference line of the current scenario. This increase in air temperature intensified in the medium term (2041–2060), with an average increase of 1.63 °C. In the period 2061–2080, the average increase in air temperature was 1.70 °C, indicating a continuous and controlled temperature increase trend. In the very long term (2081–2100), the average air temperature remained around 26.1 °C (increase of 1.66 °C), and the MAD remained low (Figure 5).
In the SSP2-4.5 scenario, characterized by an intermediate level of greenhouse gas emissions, an increase in the average air temperature was found to be greater than that observed in SSP1-2.6. In the short term (2021–2040), the average air temperature increased by around 1.29 °C. This warming intensified in the medium term (2041–2060), reaching an average increase of approximately 1.99 °C. The warming trend continued, with an average increase of 2.61 °C in the 2061–2080 period. For the very long term (2081–2100), an average increase of 3.05 °C was observed, and an increase in MAD to 0.28 °C.
In the SSP3-7.0 scenario, one of the most pessimistic, a substantial increase in the average air temperature was noted over the periods. Initially, for the short term (2021–2040), the increase was around 1.33 °C. In the medium term (2041–2060), an increase in the average air temperature of 2.24 °C was observed. The period 2061–2080 presented an increase of 3.31 °C in the average temperature and a MAD of 0.33 °C. In the very long term (2081–2100), the average temperature increase was 4.58 °C, with a variation of 0.52 °C (MAD) compared to the current scenario.
In SSP5-8.5, the most extreme and pessimistic among the scenarios, a significant increase in the air temperature was observed over the periods. In the short term (2021–2040), the average air temperature increased by 1.38 °C. This increase was even greater in future periods: 2.54 °C for the medium term (2041–2060), 3.99 °C for the long term (2061–2080), and 6.10 °C (MAD 0.45) in the very long term (2081–2100), with an average air temperature of 31 °C (MAD 0.74 °C).

3.5. Precipitation Under Future Climate Scenarios

In the SSP1.2-6 scenario, stability in Brazil’s average precipitation was observed during the short term (2021–2040), with the annual average recorded at 1465 mm (MAD 43.19 mm). However, a slight reduction in the annual average rainfall was observed in the period classified as long term (2081–2100), with values approximately 1440 mm (MAD 63.04 mm). In contrast, the SSP5-8.5 scenario presented an annual average precipitation close to 1465 mm in the short term. For the long term, a significant difference was observed. During this period, the annual average rainfall reduced to around 1419 mm. The MAD increased from 56.07 mm to 235.36 mm in SSP5-8.5 (Figure 5).
Although the national average of annual precipitation remains relatively stable in some scenarios, the state-level data reveal significant spatial heterogeneity that directly affects climatic suitability for cotton cultivation. States such as Amazonas and Amapá consistently receive over 2500 mm of rainfall per year even under the most critical scenarios, while others, such as Bahia, Goiás, and Piauí, operate near or below the minimum threshold of 700 mm/year required for the crop. In Bahia, for instance, the current annual average is just 848 mm, and projections indicate a decrease to 770 mm by 2081–2100 under SSP2-4.5 and as low as 688 mm under SSP5-8.5, configuring a critical scenario for rainfed cotton production. By contrast, the national average under SSP126 for 2021–2040 is around 1435 mm and remains relatively stable over the century. However, this figure masks considerable variability and seasonal imbalance at the regional scale, rendering several areas climatically unsuitable for dryland farming [51].
Beyond average reductions in vulnerable states, there is also a marked increase in interannual rainfall variability under the more pessimistic climate projections. The national Mean Absolute Deviation, a metric reflecting dispersion around the mean, rises from approximately 409 mm under SSP126 (2021–2040) to 491 mm under SSP585 (2081–2100). This represents a >20% increase, indicating that, even in regions with seemingly stable averages, the frequency of extreme years (either drier or wetter than normal) is likely to rise. Such instability poses a serious challenge for crop planning, particularly in regions where cotton is grown without irrigation, as is the case for more than 95% of Brazil’s cultivated area [52]. Drought spells during seedling emergence or flowering, or even highly concentrated rainfall events, can significantly compromise yield potential [31].

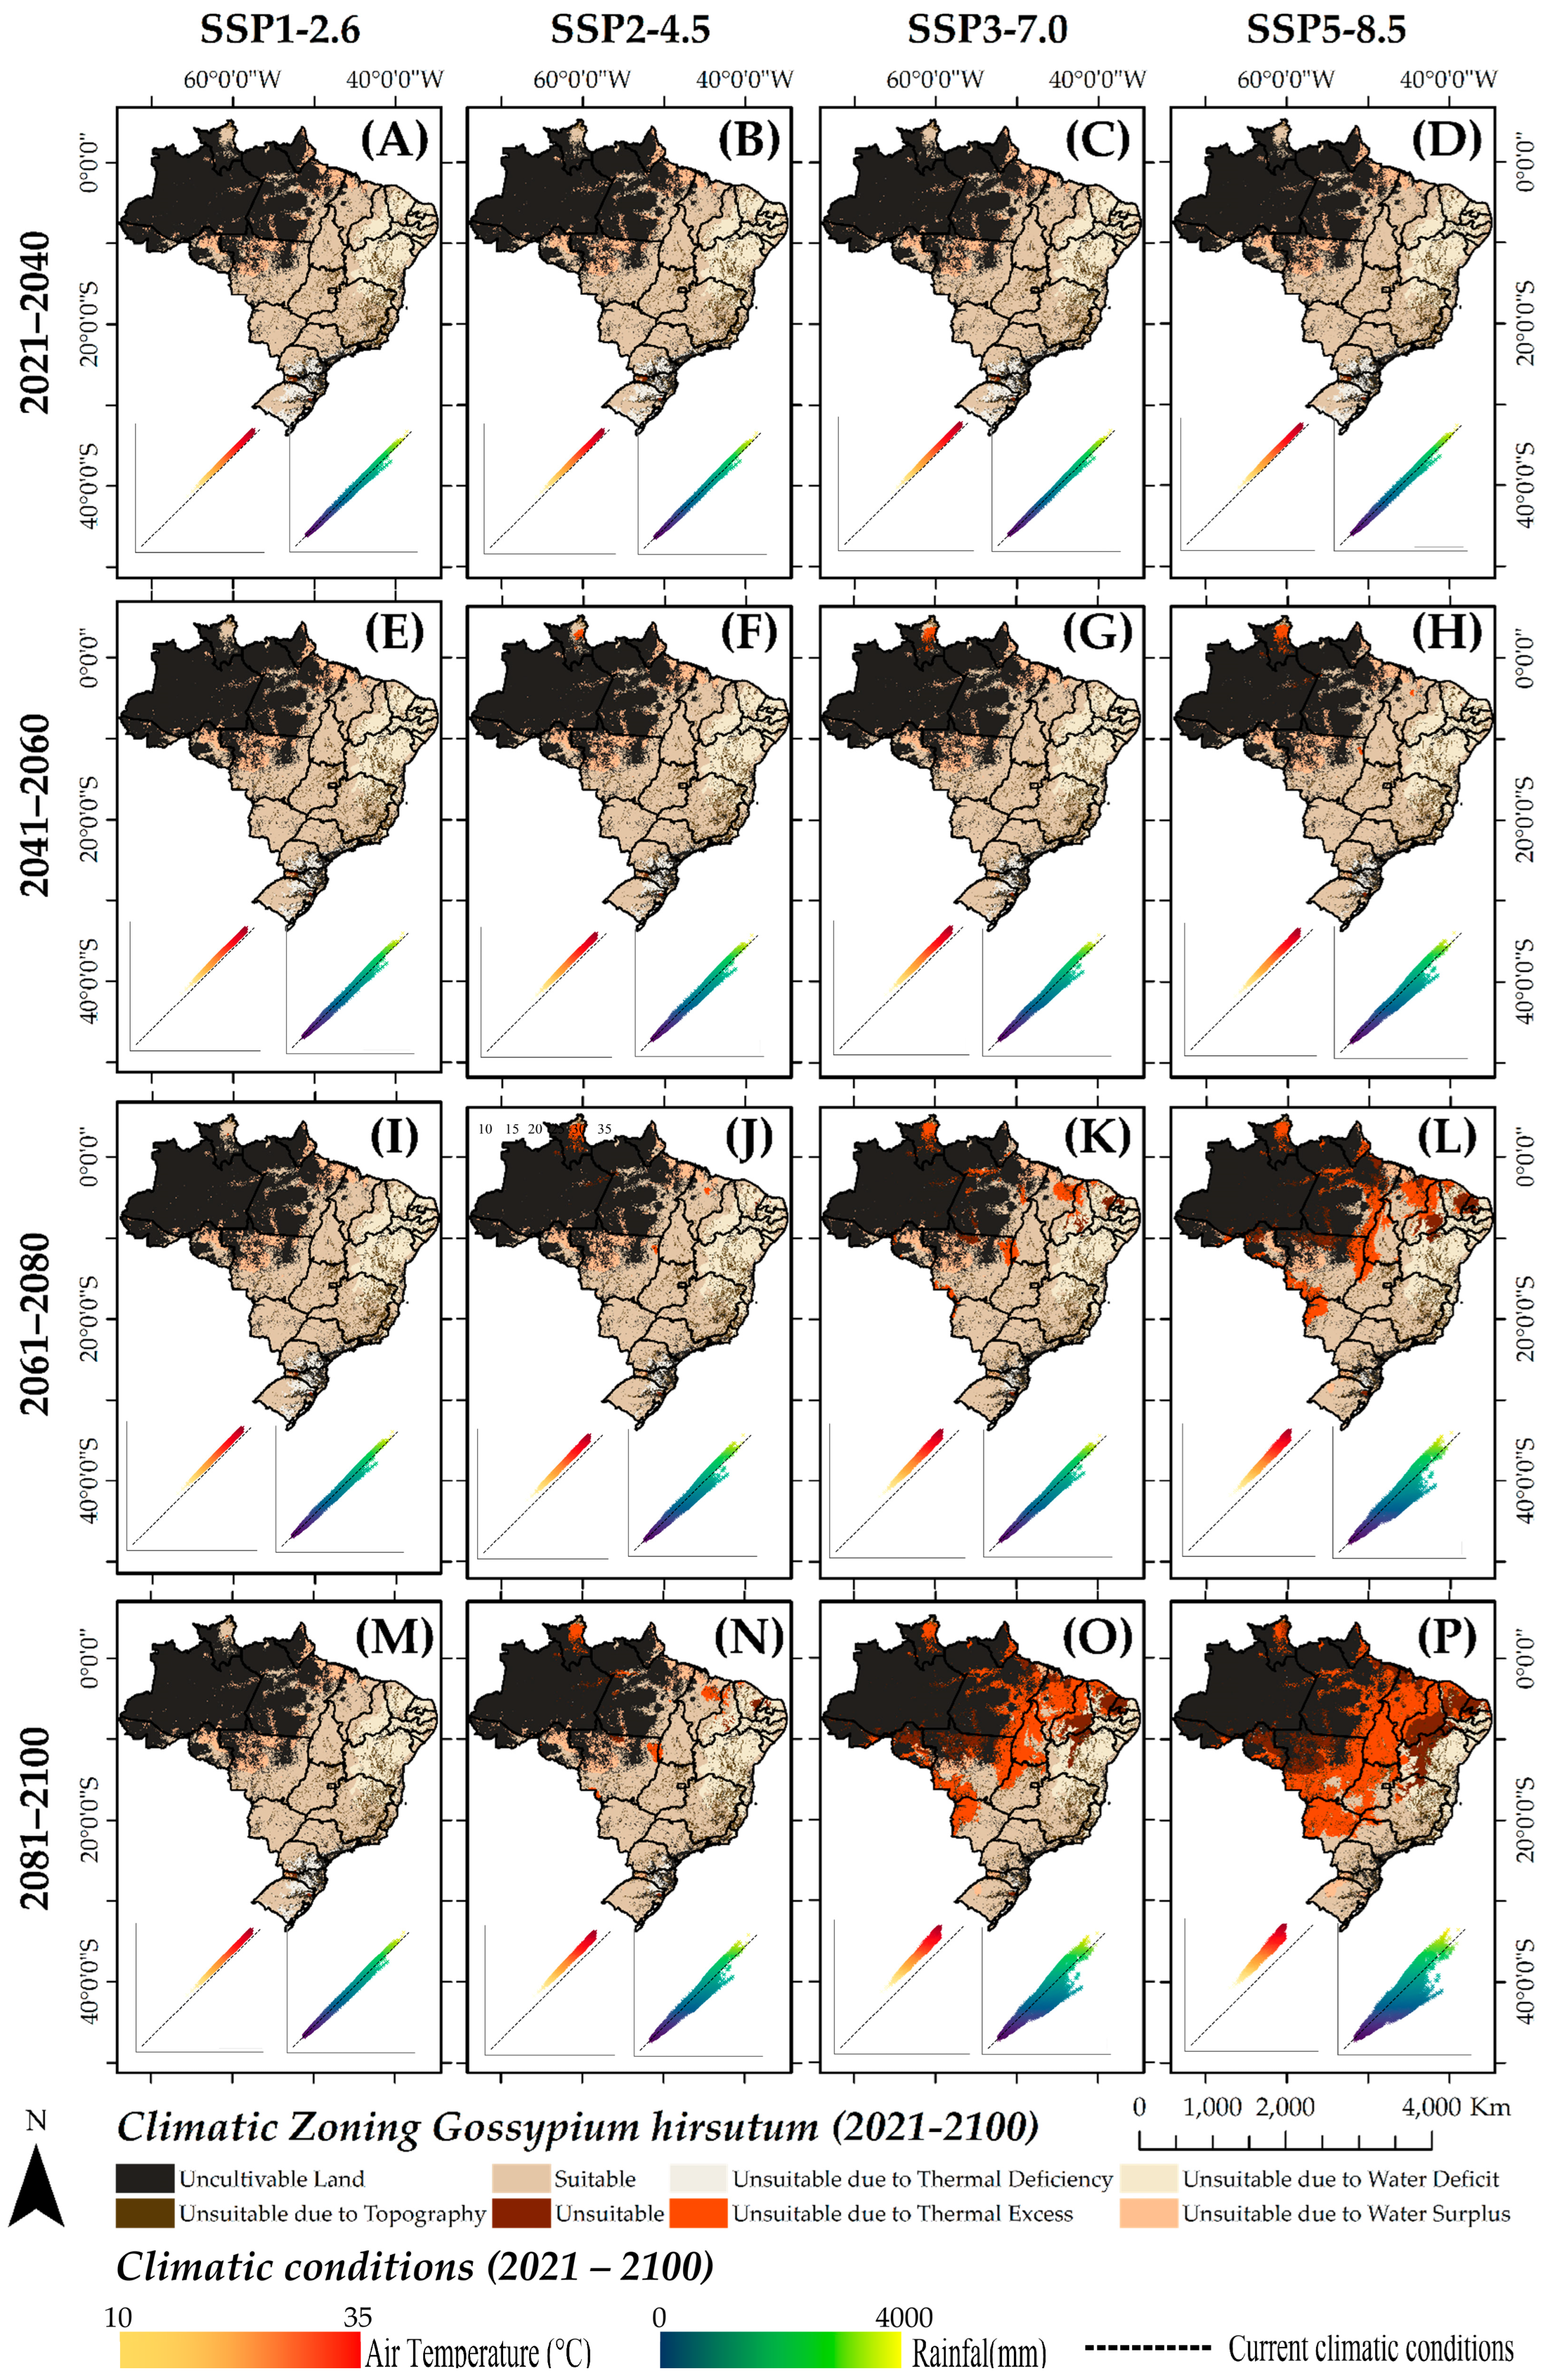
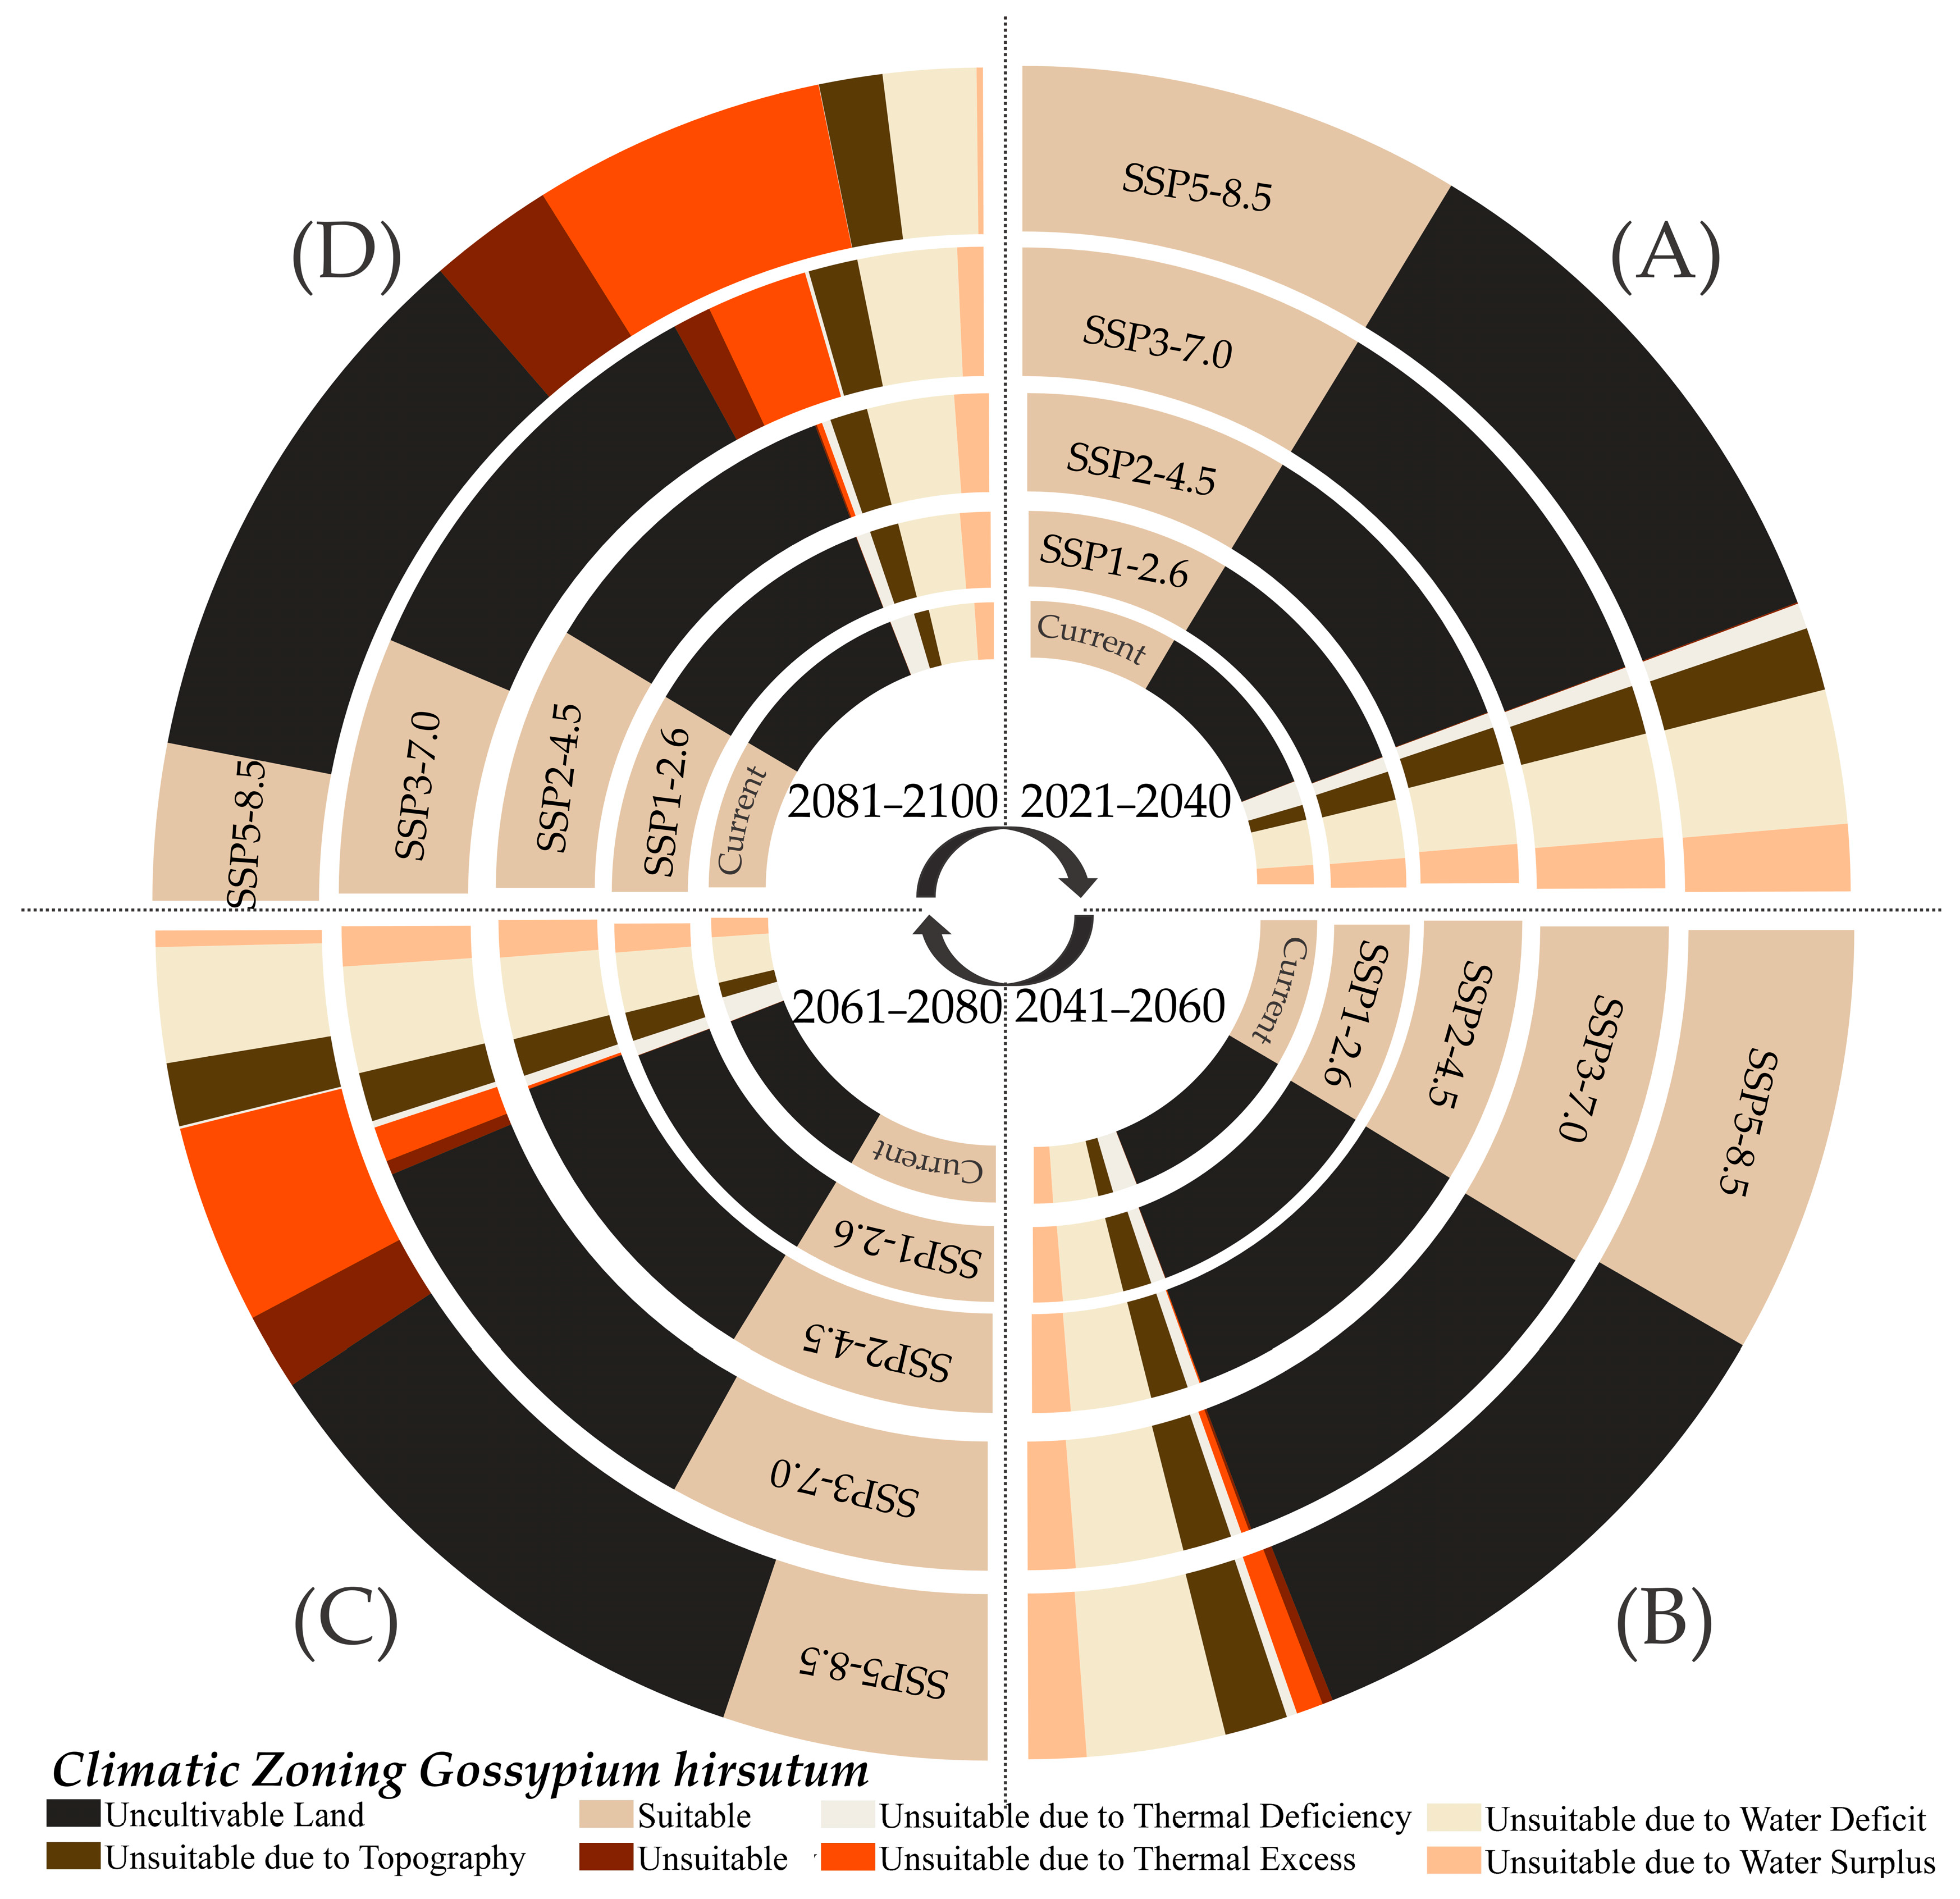
3.6. Future Climatic Zoning

Changes in areas with agricultural suitability for cotton cultivation in Brazil were verified (Figure 5) across all future scenarios (SSP1-2.6, SSP2-4.5, SSP3-7.0, and SSP5-8.5) considering eight zoning classes. The smallest variations in climatic zoning were observed under the SSP1-2.6 scenario (Figure 5A,E,I,M), showing a positive change of 0.7% over 100 years for the Suitable class compared to the current scenario. The projected increase in temperature in southern Brazil was the main factor contributing to the expansion of suitable areas for cotton cultivation. Consequently, there was a reduction of 3.6 percentage points in the area classified as Unsuitable due to Thermal Deficiency, relative to the present. Under the SSP2-4.5 scenario, the Suitable area is projected to reach 34.9% of the arable land between 2041 and 2060 (Figure 5J) but decrease to 33.4% by 2081–2100. Conversely, only 0.8% of the national territory is expected to be classified as Unsuitable due to Thermal Deficiency by 2081–2100.
In the SSP3-7.0 scenario, for the short-term period (2041–2060), the area of agricultural suitability for cotton cultivation in Brazil increased, reaching 35% of the national territory (Figure 5G). The areas classified as Inadequate due to Thermal Deficiency were converted into Adequate in the southern region of the country. However, about 15.5% of the north of the country became Unsuitable due to Thermal Excess, and 5.9% of the national territory became Unsuitable in the period 2081–2100 (Table 2). Thus, in the SSP3-7.0 scenario, for the period from 2081 to 2100, only 20.6% of the Brazilian territory had the agricultural capacity for cotton cultivation (Figure 6).
In the SSP5-8.5 scenario, the greatest reductions in areas suitable for cotton cultivation in Brazil were observed in the periods 2061–2080 and 2081–2100, representing, respectively, only 20.6 and 12.1% of the national territory. The main cause for this change was the increase in the Unsuitable class due to Thermal Excess, which reached 22.8% in 2081–2100. In the same period and scenario, around 45% of the national territory was unsuitable for cotton cultivation, double that observed in the current scenario (Figure 6).
In the SSP1.2-6 scenario, stability in Brazil’s average precipitation was observed during the short term (2021–2040), with the annual average recorded at 1465 mm (MAD 43.19 mm). However, a slight reduction in the annual average rainfall was observed in the period classified as long term (2081–2100), with values approximately 1440 mm (MAD 63.04 mm) (Table 4). In contrast, the SSP5-8.5 scenario presented an annual average precipitation close to 1465 mm in the short term. For the long term, a significant difference was observed. During this period, the annual average rainfall reduced to around 1419 mm. MAD increased from 56.07 mm to 235.36 mm in SSP5-8.5 (Figure 5).

4. Discussion

4.1. Climatic Conditions for Mato Grosso and Bahia States

Initially, it is important to highlight that among the scenarios used to evaluate climate variations, there is a consensus among researchers that two of these scenarios are unlikely to happen [37]. SSP1-2.6 simulates a condition in which measures to mitigate climate change on the planet, that is, reducing greenhouse gas emissions, would occur at a global level and actually have a positive effect, which has not occurred [41]. The SSP5-8.5 scenario, on the other hand, represents an extreme condition of climate change which, if it occurs, will be catastrophic not only for cotton cultivation [1]. Thus, the discussion of this work was based on the scenarios: current, SSP2-4.5, and SSP3-7.0.
Brazil is a world reference in exports of agricultural commodities, with emphasis on its leadership in exports of the following: coffee, soybeans, sugar, orange juice, beef, poultry, and, more recently, cotton [53]. Despite the success in the production of agricultural commodities, only 7.6% of the Brazilian territory is dedicated to agriculture [54]. Thus, due to its capacity for expansion, Brazilian soil is strategic for producing commodities and guaranteeing global food security. In the case of cotton, despite the recent global leadership in exports, the area cultivated with cotton in the country represents only 2.66% of the agricultural area cultivated. Despite the recent 25% increase in the cotton cultivation area in Brazil in the last two years, since the end of the 1970s, the country has reduced the cotton cultivation area by almost 60% [52].
In relation to the scenarios evaluated in this work (current, SSP2-4.5, and SSP3-7.0), there was a temporary increase in the area suitable for cotton cultivation in the country. These results require attention to interpret them.
In the study of agricultural zoning scenarios for cotton cultivation in Brazil, the increase in areas suitable for cotton cultivation occurred predominantly in the southern region of the country. In this region, currently, low temperatures limit the adequate development of cotton; therefore, there is no cotton production in this region [22]. Additionally, the southern region of Brazil is predominantly made up of small farms producing grains (soybean, wheat, and corn), much smaller than the farms that produce cotton in the central–west and northeast regions. Added to this, the machinery used to harvest cotton is completely different and expensive, compared to the machines that harvest soybeans and corn. Therefore, even if there are ideal climatic conditions for cotton production in the southern region of Brazil in the future, it is unlikely that this will happen.
Brazil produces cotton predominantly between the equator and the Tropic of Capricorn (Figure 3). In this region, our studies showed that even in the current scenario, there are already areas unsuitable for cotton cultivation, while in the SSP2-4.5 and SSP3-7.0 scenarios, areas unsuitable for cotton cultivation increase significantly in the medium and long term. In fact, in the State of Bahia, the second largest cotton producer in Brazil, a large part of the state’s territory is already considered unsuitable for cotton cultivation. The consequences of climate change for cotton cultivation in the State of Bahia are production losses in areas already cultivated and limitations in expanding cultivated areas. For this region, the lack of rainfall is the factor that causes the most concern in relation to climate change, since, in the current scenario, the volume of rainfall in the state of Bahia is almost half the volume of rainfall in the state of Mato Grosso. Recently, it was identified for the first time in Brazil, more specifically in the state of Bahia, a region with an arid climate [55]. Although cotton has greater tolerance to water stress than other crops such as soybeans and corn, studies have shown that an accumulated rainfall volume of 700 mm is required during the cotton-growing cycle. It is important to highlight that cotton production in Brazil is carried out predominantly without the use of irrigation (more than 95% of the cultivated area) [52], and that in the state of Bahia, the annual volume of rainfall is just over 900 mm and tends to reduce in all scenarios evaluated. Therefore, according to the scenarios evaluated, in the state of Bahia, due to the volume of rain, it will not be possible to produce cotton. The divergence between the evaluated scenarios occurs only as a function of time.

4.2. Future Projections for Cotton Cultivation in Brazil Due to Climate Change

Based on our projections, considering the most likely climate change scenarios, the areas that are actually cultivated with cotton in Brazil will be reduced in the medium and long term. However, it is still possible to expand the area of cotton cultivation. This is possible due to the small cultivated area of 16,488 km2 (1,648,800 hectares) of cotton which, in the current scenario, can be increased by 2.9 million km2. In the state of Mato Grosso alone, it is still possible to increase the cotton area from 11,922 km2 (1,192,200 ha) to 481,735 km2 (48,173,500 ha). This represents a 40-fold increase in the area cultivated with cotton in Mato Grosso, compared to the current area. It is worth noting that the areas with potential for expanding cotton cultivation are areas already cultivated with soybeans followed by corn. In this sense, there is no need to cut down forests to increase the cultivation area.
Although areas currently cultivated with soybean and corn present climatic suitability for cotton, converting these lands poses significant challenges. Cotton farming requires substantial investments in specialized machinery and processing infrastructure, which can be a major barrier for many producers [56]. Additionally, cotton export logistics in Brazil are highly centralized: approximately 95% of all exports are routed through the Port of Santos, leading to bottlenecks and increased transportation costs [57]. Therefore, despite the agroclimatic potential, realizing such expansion will depend on coordinated actions in infrastructure development, farmer training, and institutional support.
Despite the importance of agricultural zoning for crop expansion, climate-related factors must also be considered. In the specific case of this study, the question that must be answered is “What is the contribution of the increase or decrease in the cultivated area with cotton in Brazil to climate change?”
Therefore, we must consider the balance between carbon emissions and sequestration in cotton cultivation and industrialization. This process is not simple, nor is it static, especially in relation to cultivation. There is a consensus among researchers that carbon emissions from cotton cultivation vary significantly depending on the cultivation techniques adopted [58].
For cotton cultivation, the main sources of carbon emissions are as follows: production of fertilizers (especially nitrogen) and pesticides; soil use and management; irrigation; and pesticide and fertilizer application practices [59]. In this context, a series of factors favor cotton cultivation in Brazil.
Brazilian cotton cultivation often follows a no-till system, preserving soil cover year-round with plant material (living or dead). Studies have shown that cotton cultivation under no-till systems can significantly increase soil carbon sequestration compared to conventional methods. For instance, Ferreira et al. [60] observed that no-till cotton production systems in the Brazilian Cerrado region led to an increase of up to 20% in soil carbon stocks over time. Additionally, this method reduces the use of machinery and diesel consumption, thereby contributing to lower carbon emissions.
In the state of Mato Grosso, cotton is predominantly cultivated as a second crop, immediately following the soybean harvest. This sequential cropping system, executed without irrigation, is relatively rare globally. Brazil’s prominence as the world’s largest soybean producer is complemented by its efficient use of biological nitrogen fixation (BNF), facilitated through symbiosis between soybean plants and Bradyrhizobium bacteria [61]. This natural process not only eliminates the need for synthetic nitrogen fertilizers in soybean cultivation but also enriches the soil with residual nitrogen, benefiting subsequent cotton crops. Additionally, the decomposition of soybean straw contributes essential nutrients to the soil, further supporting cotton growth. Studies have demonstrated that the use of cover crops in the second season enhances nutrient cycling and improves cotton yield in succession [62].
Finally, in relation to pesticides, which also contribute to carbon emissions into the atmosphere, it is important to highlight that, for cotton cultivation in Brazil, transgenic cultivars (resistant to caterpillars and herbicides) are predominantly used, which have reduced the demand for pesticides for the crop.
Thus, cotton cultivation in Brazil, especially in the state of Mato Grosso, differs from other cotton-producing countries due to the absence of irrigation, reduced agricultural machinery use, adoption of no-till systems, reduced fertilizer inputs (especially nitrogen), and efficient nutrient recycling. These practices contribute to lower carbon emissions in Brazilian cotton production compared to traditional cotton-growing regions [52,59]. Based on the results of agricultural zoning for cotton cultivation and future climate change projections, it is desirable to expand cotton production areas in Brazil, as they offer a more sustainable alternative compared to traditional cotton-producing regions worldwide.

5. Conclusions

According to the climate change scenarios assessed in this study, in the medium and long term, cotton cultivation in Brazil will be negatively affected by climate change, especially by the following factors: rising temperatures and reduced rainfall. However, considering the current agricultural zoning, Brazil has great potential to increase the area under cotton cultivation. In the state of Mato Grosso alone (where 90% of all Brazilian cotton is produced), there is a possibility of increasing the area under cotton cultivation by 40 times.
Considering the cotton production factors that contribute most to carbon emissions into the atmosphere (land use and management, fertilizers, pesticides, and irrigation), the cultivation techniques adopted in Brazil have lower carbon emissions than cotton cultivation in other countries. In this sense, increasing the area under cotton cultivation in Brazil is more advantageous for the environmental scenario than in other countries.
Future studies should consider expanding agroclimatic zoning analyses by incorporating additional variables that influence agricultural viability, such as soil properties, topography, and socioeconomic indicators like land use pressure, infrastructure availability, and access to agricultural credit. Such multidisciplinary approaches would contribute to more comprehensive assessments and offer valuable support for public policies aimed at promoting sustainable cotton production and climate adaptation strategies at the regional and national levels.

Author Contributions

Formal analysis, J.A.L. and P.A.L.; investigation, J.A.L. and P.A.L.; visualization, J.A.L. and P.A.L.; writing—original draft preparation, J.A.L., P.A.L. and F.G.M.; writing—review and editing, J.A.L., P.A.L., G.d.S.R. and F.G.M.; supervision, L.E.d.O.A., G.B.T. and F.G.M.; validation, L.E.d.O.A., G.B.T. and F.G.M.; methodology, L.E.d.O.A. and G.B.T.; project administration, F.G.M. All authors have read and agreed to the published version of the manuscript.

Funding

This research received no external funding.

Data Availability Statement

The data presented in this study are available on request from the corresponding author.

Acknowledgments

The authors would like to thank the Federal Institute of Mato Grosso do Sul (IFMS), the Federal Institute of Southern Minas Gerais (IFSULDEMINAS), and the São Paulo State University–School of Agricultural and Veterinary Sciences (UNESP/FCAV) for their institutional support during the development of this research.

Conflicts of Interest

The authors declare no conflicts of interest.

Abbreviations

The following abbreviations are used in this manuscript:
BNFBiological Nitrogen Fixation
CEMADENNational Center for Monitoring and Early Warning of Natural Disasters
CMIP6Coupled Model Intercomparison Project Phase 6
CO2-eqCarbon Dioxide Equivalent
GEEGreenhouse Gas Emissions
GISGeographic Information System
INPENational Institute for Space Research (Instituto Nacional de Pesquisas Espaciais)
IPCCIntergovernmental Panel on Climate Change
MADMean Absolute Deviation
QGISQuantum Geographic Information System
SSPShared Socioeconomic Pathway

References

  1. Zhou, Y.; Li, F.; Xin, Q.; Li, Y.; Lin, Z. Historical Variability of Cotton Yield and Response to Climate and Agronomic Management in Xinjiang, China. Sci. Total Environ. 2024, 912, 169327. [Google Scholar] [CrossRef] [PubMed]
  2. Fischer, H.; Meissner, K.J.; Mix, A.C.; Abram, N.J.; Austermann, J.; Brovkin, V.; Capron, E.; Colombaroli, D.; Daniau, A.-L.; Dyez, K.A.; et al. Palaeoclimate Constraints on the Impact of 2 °C Anthropogenic Warming and Beyond. Nat. Geosci. 2018, 11, 474–485. [Google Scholar] [CrossRef]
  3. Gavkharoy, O.; Botirjon, F.D. History of Cotton and Characteristics of Origin. Ijtimoiy Fanlarda Innovasiya Onlayn Ilmiy Jurnali 2023, 3, 117–121. [Google Scholar]
  4. Gupta, V.; Gupta, S. Cotton Fiber and Its Sustainable Alternatives. In Novel Sustainable Raw Material Alternatives for the Textiles and Fashion Industry; Muthu, S.S., Ed.; Sustainable Textiles: Production, Processing, Manufacturing & Chemistry; Springer Nature: Cham, Switzerland, 2023; pp. 139–160. ISBN 978-3-031-37322-0. [Google Scholar]
  5. Moazzem, S.; Crossin, E.; Daver, F.; Wang, L. Baseline Scenario of Carbon Footprint of Polyester T-Shirt. J. Fiber. Bioeng. Inf. 2018, 11, 1–14. [Google Scholar] [CrossRef]
  6. Causarano, H.J.; Franzluebbers, A.J.; Reeves, D.W.; Shaw, J.N. Soil Organic Carbon Sequestration in Cotton Production Systems of the Southeastern United States: A Review. J. Environ. Qual. 2006, 35, 1374–1383. [Google Scholar] [CrossRef] [PubMed]
  7. Yuan, R.; Wang, K.; Ren, D.; Chen, Z.; Guo, B.; Zhang, H.; Li, D.; Zhao, C.; Han, S.; Li, H.; et al. An Analysis of Uncertainties in Evaluating Future Climate Change Impacts on Cotton Production and Water Use in China. Agronomy 2025, 15, 1209. [Google Scholar] [CrossRef]
  8. Srikanth, K.; Umamahesh, N.V. Assessment of Climate Change Impacts on Cotton Yield in a Semi-Arid Region: A Case Study. J. Appl. Sci. Eng. 2024, 27, 2549–2562. [Google Scholar] [CrossRef]
  9. Li, N.; Li, Y.; Yang, Q.; Biswas, A.; Dong, H. Simulating Climate Change Impacts on Cotton Using AquaCrop Model in China. Agric. Syst. 2024, 216, 103897. [Google Scholar] [CrossRef]
  10. Assad, E.D.; Martins, S.C.; Beltrão, N.E.D.M.; Pinto, H.S. Impacts of Climate Change on the Agricultural Zoning of Climate Risk for Cotton Cultivation in Brazil. Pesqui. Agropecuária Bras. 2013, 48, 1–8. [Google Scholar] [CrossRef]
  11. Thornton, P.K.; Jones, P.G.; Ericksen, P.J.; Challinor, A.J. Agriculture and Food Systems in Sub-Saharan Africa in a 4 °C+ World. Phil. Trans. R. Soc. A 2011, 369, 117–136. [Google Scholar] [CrossRef]
  12. Ovalle-Rivera, O.; Läderach, P.; Bunn, C.; Obersteiner, M.; Schroth, G. Projected Shifts in Coffea Arabica Suitability among Major Global Producing Regions Due to Climate Change. PLoS ONE 2015, 10, e0124155. [Google Scholar] [CrossRef] [PubMed]
  13. United States Department of Agriculture (USDA). Foreign Agricultural Service. China: Cotton and Products Annual—2024 Forecast Highlights Production Growth in Xinjiang; GAIN Report CH2024-0053; USDA Foreign Agricultural Service: Washington, DC, USA, 2024. Available online: https://apps.fas.usda.gov/newgainapi/api/Report/DownloadReportByFileName?fileName=Cotton%20and%20Products%20Annual_Beijing_China%20-%20People%27s%20Republic%20of_CH2024-0053.pdf (accessed on 16 June 2025).
  14. United States Department of Agriculture (USDA). Foreign Agricultural Service. Cotton: World Markets and Trade—July 2024; USDA Foreign Agricultural Service: Washington, DC, USA, 2024. Available online: https://downloads.usda.library.cornell.edu/usda-esmis/files/kp78gg36g/rv044n671/pr76gz96s/cotton.pdf (accessed on 16 June 2025).
  15. United States Department of Agriculture (USDA). Economic Research Service. Cotton and Wool Outlook: February 2025; USDA Economic Research Service: Washington, DC, USA, 2025. Available online: https://www.usda.gov/sites/default/files/documents/2025AOF-cotton-outlook.pdf (accessed on 16 June 2025).
  16. Oosterhuis, D.M.; Snider, J.L. High Temperature Stress on Floral Development and Yield of Cotton. In Stress Physiology in Cotton; The Cotton Foundation: Katy, TX, USA, 2011; Volume 7, pp. 1–24. [Google Scholar]
  17. Schlenker, W.; Roberts, M.J. Nonlinear Temperature Effects Indicate Severe Damages to U.S. Crop Yields under Climate Change. Proc. Natl. Acad. Sci. USA 2009, 106, 15594–15598. [Google Scholar] [CrossRef] [PubMed]
  18. Brown, P.W.; Zeiher, C.A. Development of an Effective Screen for Identifying Cotton Cultivars Tolerant to Elevated Night Temperatures During the Monsoon; Final Report; Project 96-342AZ; Cotton Inc.: Raleigh, NC, USA, 1998. [Google Scholar]
  19. Reddy, K.R.; Hodges, H.F.; McKinion, J.M.; Wall, G.W. Temperature Effects on Pima Cotton Growth and Development. Agron. J. 1992, 84, 237–243. [Google Scholar] [CrossRef]
  20. Saini, D.K.; Impa, S.M.; McCallister, D.; Patil, G.B.; Abidi, N.; Ritchie, G.; Jaconis, S.Y.; Jagadish, K.S.V. High Day and Night Temperatures Impact on Cotton Yield and Quality—Current Status and Future Research Direction. J. Cotton. Res. 2023, 6, 16. [Google Scholar] [CrossRef]
  21. Praxedes, S.C.; De Lacerda, C.F.; DaMatta, F.M.; Prisco, J.T.; Gomes-Filho, E. Salt Tolerance Is Associated with Differences in Ion Accumulation, Biomass Allocation and Photosynthesis in Cowpea Cultivars. J. Agron. Crop Sci. 2010, 196, 193–204. [Google Scholar] [CrossRef]
  22. Carneiro, M.A.C.; Siqueira, J.O.; Curi, N.; Moreira, F.M.S. Efeitos da Inoculação de Fungos Micorrízicos Arbusculares e da Aplicação de Fósforo No Estabelecimento de Forrageiras em Solo Degradado. Pesqui. Agropecuária Bras. 1999, 34, 1669–1677. [Google Scholar] [CrossRef]
  23. Esetlili, M.T.; Serbeş, Z.A.; Çolak Esetlili, B.; Kurucu, Y.; Delibacak, S. Determination of Water Footprint for the Cotton and Maize Production in the Küçük Menderes Basin. Water 2022, 14, 3427. [Google Scholar] [CrossRef]
  24. Shavkiev, J.; Azimov, A.; Nabiev, S.; Khamdullaev, S.; Amanov, B.; Kholikova, M.; Matniyazova, H.; Yuldashov, U. Comparative Performance and Genetic Attributes of Upland Cotton Genotypes for Yield-Related Traits under Optimal and Deficit Irrigation Conditions. SABRAO J. Breed. Genet. 2021, 53, 157–171. [Google Scholar]
  25. Barros, T.C.; De Mello Prado, R.; Roque, C.G.; Arf, M.V.; Vilela, R.G. Silicon and Salicylic Acid in the Physiology and Yield of Cotton. J. Plant Nutr. 2019, 42, 458–465. [Google Scholar] [CrossRef]
  26. Amorim Neto, M.d.S.; Beltrão, N.d.M.; Medeiros, J.d.C. Edaphic and Climatic Indicators for Zoning Perennial Cotton. Rev. Ol. Fibrosas 1997, 1, 1–6. [Google Scholar]
  27. Engonopoulos, V.; Kouneli, V.; Mavroeidis, A.; Karydogianni, S.; Beslemes, D.; Kakabouki, I.; Papastylianou, P.; Bilalis, D. Cotton versus Climate Change: The Case of Greek Cotton Production. Not. Bot. Horti Agrobot. 2021, 49, 12547. [Google Scholar] [CrossRef]
  28. Li, N.; Yao, N.; Li, Y.; Chen, J.; Liu, D.; Biswas, A.; Li, L.; Wang, T.; Chen, X. A Meta-Analysis of the Possible Impact of Climate Change on Global Cotton Yield Based on Crop Simulation Approaches. Agric. Syst. 2021, 193, 103221. [Google Scholar] [CrossRef]
  29. Romanelli, J.P.; Meli, P.; Santos, J.P.B.; Jacob, I.N.; Souza, L.R.; Rodrigues, A.V.; Trevisan, D.P.; Huang, C.; Almeida, D.R.A.; Silva, L.G.M.; et al. Biodiversity Responses to Restoration across the Brazilian Atlantic Forest. Sci. Total Environ. 2022, 821, 153403. [Google Scholar] [CrossRef] [PubMed]
  30. Tucci, C.E.M.; Hespanhol, I.; Netto, M.O.C. Water Management in Brazil; UNESCO: Brasília, Brazil, 2001. [Google Scholar]
  31. Xavier, A.C.F.; Rudke, A.P.; Fujita, T.; Blain, G.C.; De Morais, M.V.B.; De Almeida, D.S.; Rafee, S.A.A.; Martins, L.D.; De Souza, R.A.F.; De Freitas, E.D.; et al. Stationary and Non-stationary Detection of Extreme Precipitation Events and Trends of Average Precipitation from 1980 to 2010 in the Paraná River Basin, Brazil. Int. J. Climatol. 2020, 40, 1197–1212. [Google Scholar] [CrossRef]
  32. Souza, C.M.; Shimbo, J.Z.; Rosa, M.R.; Parente, L.L.; Alencar, A.A.; Rudorff, B.F.T.; Hasenack, H.; Matsumoto, M.; Ferreira, L.G.; Souza-Filho, P.W.M.; et al. Reconstructing Three Decades of Land Use and Land Cover Changes in Brazilian Biomes with Landsat Archive and Earth Engine. Remote Sens. 2020, 12, 2735. [Google Scholar] [CrossRef]
  33. Fick, S.E.; Hijmans, R.J. WorldClim 2: New 1-km Spatial Resolution Climate Surfaces for Global Land Areas. Int. J. Climatol. 2017, 37, 4302–4315. [Google Scholar] [CrossRef]
  34. Bramer, I.; Anderson, B.J.; Bennie, J.; Bladon, A.J.; De Frenne, P.; Hemming, D.; Hill, R.A.; Kearney, M.R.; Körner, C.; Korstjens, A.H.; et al. Advances in Monitoring and Modelling Climate at Ecologically Relevant Scales. In Advances in Ecological Research; Elsevier: Amsterdam, The Netherlands, 2018; Volume 58, pp. 101–161. ISBN 978-0-12-813949-3. [Google Scholar]
  35. Karger, D.N.; Conrad, O.; Böhner, J.; Kawohl, T.; Kreft, H.; Soria-Auza, R.W.; Zimmermann, N.E.; Linder, H.P.; Kessler, M. Climatologies at High Resolution for the Earth’s Land Surface Areas. Sci. Data 2017, 4, 170122. [Google Scholar] [CrossRef] [PubMed]
  36. Beck, H.E.; Zimmermann, N.E.; McVicar, T.R.; Vergopolan, N.; Berg, A.; Wood, E.F. Present and Future Köppen-Geiger Climate Classification Maps at 1-Km Resolution. Sci. Data 2018, 5, 180214. [Google Scholar] [CrossRef]
  37. Meinshausen, M.; Nicholls, Z.R.J.; Lewis, J.; Gidden, M.J.; Vogel, E.; Freund, M.; Beyerle, U.; Gessner, C.; Nauels, A.; Bauer, N.; et al. The Shared Socio-Economic Pathway (SSP) Greenhouse Gas Concentrations and Their Extensions to 2500. Geosci. Model Dev. 2020, 13, 3571–3605. [Google Scholar] [CrossRef]
  38. Soares-Filho, B.; Rajão, R.; Macedo, M.; Carneiro, A.; Costa, W.; Coe, M.; Rodrigues, H.; Alencar, A. Cracking Brazil’s Forest Code. Science 2014, 344, 363–364. [Google Scholar] [CrossRef]
  39. Lurton, T.; Balkanski, Y.; Bastrikov, V.; Bekki, S.; Bopp, L.; Braconnot, P.; Brockmann, P.; Cadule, P.; Contoux, C.; Cozic, A.; et al. Implementation of the CMIP6 Forcing Data in the IPSL-CM6A-LR Model. J. Adv. Model Earth Syst. 2020, 12, e2019MS001940. [Google Scholar] [CrossRef]
  40. Burke, J.J.; Mahan, J.R.; Hatfield, J.L. Crop-Specific Thermal Kinetic Windows in Relation to Wheat and Cotton Biomass Production. Agron. J. 1988, 80, 553–556. [Google Scholar] [CrossRef]
  41. Wilson, R.J.; Kay, S.; Ciavatta, S. Partitioning Climate Uncertainty in Ecological Projections: Pacific Oysters in a Hotter Europe. Ecol. Inform. 2024, 80, 102537. [Google Scholar] [CrossRef]
  42. Cetin, O.; Basbag, S. Effects of Climatic Factors on Cotton Production in Semi-Arid Regions—A Review. Res. Crops 2010, 11, 785–791. [Google Scholar]
  43. Conaty, W.C.; Burke, J.J.; Mahan, J.R.; Neilsen, J.E.; Sutton, B.G. Determining the Optimum Plant Temperature of Cotton Physiology and Yield to Improve Plant-Based Irrigation Scheduling. Crop Sci. 2012, 52, 1828–1836. [Google Scholar] [CrossRef]
  44. Sathiyamurthi, S.; Saravanan, S.; Sankriti, R.; Aluru, M.; Sivaranjani, S.; Srivel, R. Integrated GIS and AHP Techniques for Land Suitability Assessment of Cotton Crop in Perambalur District, South India. Int. J. Syst. Assur. Eng. Manag. 2024, 15, 267–278. [Google Scholar] [CrossRef]
  45. Tang, F.H.M.; Nguyen, T.H.; Conchedda, G.; Casse, L.; Tubiello, F.N.; Maggi, F. CROPGRIDS: A Global Geo-Referenced Dataset of 173 Crops. Sci. Data 2024, 11, 413. [Google Scholar] [CrossRef]
  46. Congalton, R.G.; Green, K. Assessing the Accuracy of Remotely Sensed Data: Principles and Practices, 3rd ed.; CRC Press: Boca Raton, FL, USA, 2019; ISBN 978-0-429-05272-9. [Google Scholar]
  47. Fielding, A.H.; Bell, J.F. A Review of Methods for the Assessment of Prediction Errors in Conservation Presence/Absence Models. Envir. Conserv. 1997, 24, 38–49. [Google Scholar] [CrossRef]
  48. Allouche, O.; Tsoar, A.; Kadmon, R. Assessing the Accuracy of Species Distribution Models: Prevalence, Kappa and the True Skill Statistic (TSS). J. Appl. Ecol. 2006, 43, 1223–1232. [Google Scholar] [CrossRef]
  49. Jiménez-Valverde, A. Insights into the Area under the Receiver Operating Characteristic Curve (AUC) as a Discrimination Measure in Species Distribution Modelling. Glob. Ecol. Biogeogr. 2012, 21, 498–507. [Google Scholar] [CrossRef]
  50. Vaddula, Y.; Singh, K. Progression of Drip Irrigation and Fertigation in Cotton across the Globe and Its Future Perspectives for Sustainable Agriculture: An Overview. Appl. Water Sci. 2023, 13, 177. [Google Scholar] [CrossRef]
  51. Jans, Y.; Von Bloh, W.; Schaphoff, S.; Müller, C. Global Cotton Production under Climate Change—Implications for Yield and Water Consumption. Hydrol. Earth Syst. Sci. 2021, 25, 2027–2044. [Google Scholar] [CrossRef]
  52. ABRAPA (Associação Brasileira dos Produtores de Algodão). Relatório Anual 2024. Brasília, DF, Brasil, 2025. Available online: https://abrapa.com.br/wp-content/uploads/2025/02/Cotton-Brazil_relatorio_anual_2024_final_0402.pdf (accessed on 16 June 2025).
  53. United States Department of Agriculture (USDA) Foreign Agricultural Service. Brazil: Cotton and Products Update; GAIN Report BR2024-0024; United States Department of Agriculture: Washington, DC, USA, 2024. Available online: https://apps.fas.usda.gov/newgainapi/api/Report/DownloadReportByFileName?fileName=Cotton+and+Products+Update_Brasilia_Brazil_BR2024-0024.pdf (accessed on 16 June 2025).
  54. Embrapa Territorial. Does the Brazilian Soybean Production Increase Pose a Threat on Land Use and Forest Conservation? Embrapa Soybean: Londrina, Brazil, 2019. [Google Scholar]
  55. Instituto Nacional de Pesquisas Espaciais (INPE); Centro Nacional de Monitoramento e Alertas de Desastres Naturais (CEMADEN). Estudo Do CEMADEN e Do INPE Identifica Pela Primeira Vez a Ocorrência de Uma Região Árida No País; INPE: São Paulo, Brazil; CEMADEN: São Paulo, Brazil, 2023.
  56. Feng, L.; Chi, B.; Dong, H. Cotton Cultivation Technology with Chinese Characteristics Has Driven the 70-Year Development of Cotton Production in China. J. Integr. Agric. 2022, 21, 597–609. [Google Scholar] [CrossRef]
  57. Pereira, L.A.S.; De Oliveira, A.K.M.; Galafassi, C. Cotton Farming in the Different Mesoregions of Mato Grosso and Land Use and Cover between 2019 and 2021. OLEL 2024, 22, e3305. [Google Scholar] [CrossRef]
  58. Torres, C.M.M.E.; Jacovine, L.A.G.; Nolasco De Olivera Neto, S.; Fraisse, C.W.; Soares, C.P.B.; De Castro Neto, F.; Ferreira, L.R.; Zanuncio, J.C.; Lemes, P.G. Greenhouse Gas Emissions and Carbon Sequestration by Agroforestry Systems in Southeastern Brazil. Sci. Rep. 2017, 7, 16738. [Google Scholar] [CrossRef]
  59. Veiga, J.P.S.; Popin, G.V.; Cerri, C.E.P.; Romanelli, T.L. Carbon Footprint of Brazilian Agriculture Based on Field Operations. Agronomy 2024, 14, 1343. [Google Scholar] [CrossRef]
  60. Ferreira, G.R.; Ferreira, W.P.M.; Barbosa, T.K.M.; Luppi, A.S.L.; Silva, M.A.V. Zoneamento Térmico Para o Cultivo Do Café de Montanha Na Região Das Matas de Minas. RBGF 2018, 11, 1176–1185. [Google Scholar] [CrossRef]
  61. Prando, A.M.; Barbosa, J.Z.; Oliveira, A.B.D.; Nogueira, M.A.; Possamai, E.J.; Hungria, M. Benefits of Soybean Co-Inoculation with Bradyrhizobium Spp. and Azospirillum Brasilense: Large-Scale Validation with Farmers in Brazil. Eur. J. Agron. 2024, 155, 127112. [Google Scholar] [CrossRef]
  62. Ferreira, A.C.D.B.; Borin, A.L.D.C.; Lamas, F.M.; Sofiatti, V. Cover Plants in Second Crop: Nutrients in Straw and Cotton Yield in Succession. Pesqui. Agropecu. Trop. 2023, 53, e75032. [Google Scholar] [CrossRef]
Figure 1. Brazil’s territory and cotton production context. (A) Map of Brazil showing land-use classes based on MapBiomas Collection 9 (2023), along with the ten largest cotton-producing municipalities in 2023 (triangles): I—Sapezal (MT); II—São Desidério (BA); III—Campo Novo de Parecis (MT); IV—Campo Verde (MT); V—Sorriso (MT); VI—Lucas do Rio Verde (MT); VII—Formosa do Rio Preto (BA); VIII—Campos de Júlio (MT); IX—Diamantino (MT); X—Primavera do Leste (MT). The figure also displays state abbreviations: AC—Acre; AL—Alagoas; AM—Amazonas; AP—Amapá; BA—Bahia; CE—Ceará; DF—Federal District; ES—Espírito Santo; GO—Goiás; MA—Maranhão; MG—Minas Gerais; MS—Mato Grosso do Sul; MT—Mato Grosso; PA—Pará; PB—Paraíba; PE—Pernambuco; PI—Piauí; PR—Paraná; RJ—Rio de Janeiro; RN—Rio Grande do Norte; RO—Rondônia; RR—Roraima; RS—Rio Grande do Sul; SC—Santa Catarina; SE—Sergipe; SP—São Paulo; TO—Tocantins. (B) Inset map indicating the five macroregions of Brazil—North, Northeast, Central-West, Southeast, and South—for spatial reference within South America. North arrow and scale bar are included. Source: data from MapBiomas [32].
Agriengineering 07 00198 g001
Figure 2. Flowchart representing the automated process developed in ArcMap’s Model Builder for generating the climatic zoning for Gossypium hirsutum. The workflow is divided into six main steps: (1) reclassification of individual climatic layers (temperature, precipitation, and slope); (2) raster combination and calculation of suitability classes; (3) conversion to vector format and assignment of class labels; (4) spatial intersection with administrative boundaries; (5) calculation of total and proportional areas per suitability class; and (6) export of results to a spreadsheet. The colors represent different types of operations within Model Builder: beige ovals are input variables: climatic layers, orange rectangles are geoprocessing tools, dark orange diamonds indicate outputs or intermediate products, and dashed boxes group steps into logical processing phases.
Agriengineering 07 00198 g002
Figure 3. (A) Climatic zoning map for Gossypium hirsutum in the current period, showing areas classified as Suitable, Unsuitable, Unsuitable due to Thermal Deficiency, Thermal Excess, Topography, Water Deficit, and Water Surplus, along with regions considered Uncultivable Land. (B) Geographical distribution of harvested cotton area in Brazil in 2022 (in hectares), highlighting the ten largest producing regions. The classification is based on harvest area intervals, and the total harvested. Data source: CROPGRIDS dataset [45].
Agriengineering 07 00198 g003
Figure 4. Current-climate distributions of (A) annual mean air temperature (°C) and (B) annual accumulated precipitation (mm) by Brazilian states. In each panel, boxplots summarize state-level variation, and the right-hand marginal histogram shows the overall frequency across all states. States are ordered along the x-axis from lowest to highest median temperature (panel (A)) or precipitation (panel (B)). Red dashed rectangles highlight those states that contain one or more of the ten largest cotton-producing municipalities.
Agriengineering 07 00198 g004
Figure 5. Scatter plots of the average annual air temperature and precipitation for all municipalities in Brazil for climate change scenarios in future periods compared to the current scenario. The figure also presents the climatic zoning map for Gossypium hirsutum for climate change scenarios in future periods. Legend: (A) SSP1-2.6 in 2021–2040, (B) SSP2-4.5 in 2021–2040, (C) SSP3-7.0 in 2021–2040, (D) SSP5-8.5 in 2021–2040, (E) SSP1-2.6 in 2041–2060, (F) SSP2-4.5 in 2041–2060, (G) SSP3-7.0 in 2041–2060, (H) SSP5-8.5 in 2041–2060, (I) SSP1-2.6 in 2061–2080, (J) SSP2-4.5 in 2061–2080, (K) SSP3-7.0 in 2061–2080, (L) SSP5-8.5 in 2061–2080, (M) SSP1-2.6 in 2081–2100, (N) SSP2-4.5 in 2081–2100, (O) SSP3-7.0 in 2081–2100, and (P) SSP5-8.5 in 2081–2100.
Agriengineering 07 00198 g005
Figure 6. Representation of all climate change scenarios in future periods compared to the current scenario. Legend: (A) 2021–2040, (B) 2041–2060, (C) 2061–2080, and (D) 2081–2100.
Agriengineering 07 00198 g006
Table 1. Criteria for identifying uncultivable land cover based on MapBiomas Collection 9. The table groups MapBiomas land-cover classes, with their class names and numeric IDs, into four categories considered unsuitable for cultivation.
Category MapBiomas Classes (Code ID)
1. Anthropic Barriers Urban Area—2
Mining—30
Beach/Dune/Sand—23
2. Hydrological Systems River/Lake/Ocean—33
Aquaculture—31
3. Protected Ecosystems Forest Formation—3
Mangrove—5
Floodable Forest—6
4. Fragile Formations Rocky Outcrop—29
Hypersaline Tidal Flat—32
Table 2. Climate classification key for Gossypium hirsutum. Tmean = mean air temperature (°C); Rainfall = annual accumulated precipitation (mm year−1); Slope = terrain slope (%). Source: Adapted from [1,17,40,41,42,43,44].
Tmean Rainfall Slope (%)ClassJustification and References
(°C)(mm yr−1)
<20<1000 or >2000UnsuitableBiomass growth and boll development fall outside the range of 20–30 °C and 1000–2000 mm [17,40].
<201000–2000Unsuitable due to Thermal DeficiencyPhotosynthesis and boll differentiation are reduced under mean temperatures below 20 °C [43].
20–301000–2000<12SuitableOptimal conditions for cotton growth and yield (21–30 °C; 1000–2000 mm; slope ≤ 12%) [1,40,44].
20–301000–2000>12Unsuitable due to TopographyMechanization and soil preparation are unfeasible on slopes > 12% [44].
20–30<1000Unsuitable due to Water DeficitWater deficit (<1000 mm yr−1) increases plant stress and reduces productivity [42].
20–30>2000Unsuitable due to Water SurplusExcess rainfall (>2000 mm yr−1) promotes waterlogging and disease incidence [42].
>301000–2000Unsuitable due to Thermal ExcessTemperatures > 30 °C impair pollination and water balance, leading to yield reductions [43].
>30>2000UnsuitableThe combination of extreme heat and high humidity compromises plant physiology [42].
Uncultivable LandImpervious surfaces and protected covers, as detailed in Section 2.4.
Table 3. Validation metrics for agroclimatic zoning.
IndexValue
Precision0.789
Omission error21.10%
Commission error26.10%
Sensitivity (TPR)0.789
Specificity (TNR)0.836
True Skill Statistic (TSS)0.625
Error rate25.30%
Table 4. Percentage of each class of climatic zoning for cotton for the current scenario and future scenarios. SUI = Suitable; UCL = Uncultivable Land; UNS = Unsuitable; UTE = Unsuitable due to Thermal Excess; UTD = Unsuitable due to Thermal Deficiency; UTO = Unsuitable due to Topography; UWD = Unsuitable due to Water Deficit; UWS = Unsuitable due to Water Surplus.
PeriodsSUIUCLUNSUTEUTDUTOUWDUWS
%
Current
scenario
Current
Period
33.942.40.105.63.410.34.4
SSP1-2.62021–204034.842.40.102.64.99.95
2041–206034.842.40.1024.910.55.1
2061–208034.942.40.101.94.910.45
2081–210034.642.40.1024.910.55.2
SSP2-4.52021–204034.542.40.102.54.910.35
2041–20603542.40.10.21.64.910.65
2061–208034.742.40.30.81.14.910.84.8
2081–210033.442.40.82.10.84.910.84.5
SSP3-7.02021–204034.742.40.102.54.910.24.9
2041–206035.142.40.10.41.44.910.74.9
2061–208032.242.41.43.50.74.910.64
2081–210020.642.45.915.50.24.98.91.3
SSP5-8.52021–204034.342.40.102.44.910.55.2
2041–206034.542.40.20.71.14.911.44.5
2061–208025.642.43.810.10.44.99.92.6
2081–210012.142.49.722.804.97.20.5
Disclaimer/Publisher’s Note: The statements, opinions and data contained in all publications are solely those of the individual author(s) and contributor(s) and not of MDPI and/or the editor(s). MDPI and/or the editor(s) disclaim responsibility for any injury to people or property resulting from any ideas, methods, instructions or products referred to in the content.

