1. Introduction
The dynamics of land use and land cover (LULC) changes are significantly shaped by anthropogenic activities that continuously transform natural landscapes, resulting in both immediate and long-term ecological effects. Extensive scholarly research has examined the consequences of urbanization and agricultural expansion on forested ecosystems, particularly focusing on how these changes disrupt established precipitation patterns and ecosystem services. The conversion of native forests into agricultural land initiates substantial biophysical alterations that affect the water and energy cycles within these environments [
1].
The socio-economic context, which includes factors such as poverty and land ownership, is deeply intertwined with climatic research and the dynamics of LULC, especially concerning the shift from forested areas to agricultural land. Secure land tenure is essential for promoting socio-economic empowerment and reducing poverty; however, issues such as land grabbing and restricted access to land can worsen poverty levels. These challenges often force marginalized communities to convert forests into cropland to sustain their livelihoods. In economically disadvantaged areas, the immediate need for financial returns frequently drives deforestation and the transformation of forested land to agricultural use, as agriculture generally offers quicker economic benefits compared to the long-term advantages of forest conservation.
Changes in land use, particularly deforestation, have significant consequences for climate change by altering carbon storage and increasing greenhouse gas emissions. Forests act as crucial carbon sinks, so converting these areas to agricultural land results in the release of sequestered carbon, thus contributing to climate change. This transformation can trigger feedback mechanisms that further amplify climate change, as reduced forest cover leads to higher temperatures and changed precipitation patterns, which subsequently impact agricultural productivity. Recent scholarly research has explored the connections between land cover, land use change, and climate, highlighting their implications for food security through data analyses from Nigeria [
2]. These studies provide a comprehensive review of the significant advancements in our understanding of the climatic implications arising from global land use change. By integrating socio-economic factors and spatial variables, the research assesses their impact on LULC changes. The findings illuminate how various elements, including the diverse characteristics of topography, variations in elevation, and the proximity to critical infrastructure, play a crucial role in shaping land use decisions. This nuanced analysis highlights the intricate interplay between environmental contexts and human activities, offering valuable insights for policymakers and researchers alike [
3].
Such transformations can lead to alterations in land surface characteristics, significantly impacting the microclimate. For instance, deforestation reduces transpiration rates, which in turn lowers local humidity levels and may affect regional rainfall patterns. The shift from vegetated landscapes to croplands changes the land’s surface albedo and has significant implications for vital ecological variables, including leaf area index, surface roughness, and moisture fluxes. While croplands and forests may exhibit similar albedo values during the peak growing season, it is important to recognize that croplands often expose bare soil for considerable parts of the year. This exposure results in a net reduction in albedo compared to native forests, which maintain continuous vegetative cover throughout the seasons and consequently achieve a higher overall albedo [
4].
Furthermore, moisture fluxes in agricultural settings are typically heightened, especially in areas that utilize irrigation techniques. Such practices can create localized microclimates that contrast significantly with surrounding natural habitats. Irrigation not only increases soil moisture but can also elevate atmospheric humidity, further distorting precipitation patterns and influencing local weather systems. These intricate interactions highlight the complexity of ecological responses to land cover changes, underscoring the necessity for thoughtful consideration in land management practices to mitigate negative environmental consequences [
5].
Human activities significantly alter LULC, thereby exerting profound influences on natural environments. A vast array of research has delved into the consequences of urban expansion in forested regions, particularly focusing on its effects on local rainfall patterns. Previous studies have illuminated the substantial impact of urbanization on woodland ecosystems, leading to detrimental outcomes such as habitat fragmentation and ecosystem loss. These transformations disrupt the delicate balance of local climates, with one notable phenomenon being the effect of the urban heat island. This effect, which results in metropolitan areas being markedly warmer than their rural counterparts, has been documented in over 60% of cities worldwide. Consequently, urban locales experience increased rainfall compared to surrounding rural areas, creating a pronounced difference in precipitation dynamics [
6].
Such alterations pose heightened risks for flooding, particularly in densely populated regions where the combination of intensified rainfall and an abundance of impervious surfaces significantly amplifies runoff. Building upon these findings, the current research aims to delve deeper into the specific mechanisms through which urbanization influences precipitation patterns in forested zones. By examining case studies alongside state-of-the-art modeling techniques, this study seeks to unravel the complexities of the urban precipitation anomaly and its far-reaching implications for sustainable urban planning.
Unlike prior investigations, this research will also explore potential strategies to mitigate the adverse effects of urbanization on forest ecosystems [
7]. In addition to these environmental changes, transformations in LULC often involve a stark transition from vibrant forested landscapes to agricultural lands. This shift is closely tied to critical issues surrounding poverty and land tenure. Secure land tenure is vital for enhancing socio-economic well-being and alleviating poverty; however, instances of land appropriation and restricted access frequently exacerbate these challenges. As a result, marginalized communities may feel compelled to convert forests into agricultural land as a means of fulfilling their subsistence needs. In regions burdened by widespread poverty, the pressing demand for immediate financial returns can drive individuals towards deforestation and the conversion of lush forests into farmland. This trend is largely because agriculture often provides quicker economic returns compared to the long-term benefits associated with preserving forest habitats. In a significant study, Shrestha et al. utilized advanced technologies, including the random forest algorithm via Google Earth Engine (GEE), to analyze urban expansion in built-up areas across Alabama from 1990 to 2020. This thorough examination not only documented historical growth patterns but also explored potential urban growth scenarios for 2050. To inform their projections, the researchers employed the Cellular Automata (CA) Markov model within the sophisticated framework of TerrSet’s Land Change Modeler (LCM), enabling robust simulations of future land use changes based on established trends [
8].
In their research, Pielke et al. explored the characteristics of croplands, which are predominantly characterized by a single plant species, each exhibiting distinct growing seasons and peak biomass intervals. The timing of peak biomass shows considerable variation between dryland and irrigated agricultural systems, affecting the surrounding ecosystem in various ways. In contrast, forested ecosystems support a mix of cool- and warm-season grasses, demonstrating extended photosynthetic activity throughout the year. This leads to peak biomass occurring in early summer, when optimal growth conditions are present [
9].
A 2022 investigation by Dutta et al. explored the implications of various LULC changes on the surface heat budget in a humid tropical region of India. Their findings highlighted the importance of LULC as a key factor influencing the relative contributions of different heat fluxes to the regional heat balance. The study predicted a decline in latent heat flux (LHF) by approximately 0.17%, alongside a projected increase in sensible heat flux (SHF) of up to 1.58%. These changes are expected to correspond with increases in land surface temperature (LST) and screen temperatures of 1.2% and 0.88%, respectively, if current LULC trends persist. The conversion of forested areas to cropland significantly alters air temperature and precipitation patterns, with the effects intricately linked to the specific methods of conversion and influenced by a variety of spatial and temporal contexts [
10].
The Weather Research and Forecasting (WRF), developed by the National Center for Atmospheric Research (NCAR) in the United States, represents the forefront of mesoscale numerical weather prediction technology. It is meticulously designed to meet both operational forecasting needs and the complexities of atmospheric research. In particular, the Advanced Research WRF (ARW) solver is a versatile and efficient tool ideally suited for deployment across various parallel computing platforms [
11].
Numerous researchers have effectively harnessed the robust capabilities of the WRF model for a wide range of analyses. For example, Karrevula et al. employed the WRF model to investigate the spatial and temporal distribution of energy fluxes, discovering remarkable consistency in their simulated results over urban areas, regardless of the planetary boundary layer (PBL) schemes implemented [
12]. In a noteworthy 2019 study, Al-Mutairi et al. examined the intricate relationship between topography and Red Sea dynamics in the cyclogenesis of a significant weather event that occurred in Saudi Arabia from 16 to 18 November 2015. Their findings underscored the crucial role of surface fluxes in driving the convergence of low-level moist air, which was vital for the initiation and eventual development of convective activity [
13].
Furthermore, Ibrahim and El Afandi utilized the WRF model to analyze heavy precipitation events throughout Egypt, highlighting its effectiveness in forecasting such extreme weather phenomena [
14]. In a similar context, El Afandi et al. investigated a flash flood triggered by intense rainfall in the Sinai Peninsula on 18 January 2010. Their study provided a rigorous comparative analysis of the predicted rainfall, framed within a four-dimensional spatial and temporal context, against empirical data from rain gauge stations, demonstrating that WRF models consistently produced accurate and reliable rainfall forecasts across all monitored locations [
15].
Additionally, Lo et al. conducted an extensive numerical simulation with the WRF model to evaluate three dynamic climate downscaling methodologies. They revealed that the incorporation of nudging techniques significantly enhanced the accuracy of precipitation forecasts. They also noted that the sensitivity of regional outcomes to the re-initialization interval highlighted the considerable impact of larger-scale reanalysis data on regional climate modeling [
16].
Recent studies utilizing the WRF model for LULC analysis highlight the importance of high-resolution and updated LULC data in improving climate model accuracy. For instance, research in Chandigarh, India, demonstrated enhanced seasonal climate forecasts with modified high-resolution LULC data, showing improved RMSE values for surface temperature, relative humidity, and wind speed. Similarly, a study in Colombo, Sri Lanka, found that high-resolution LULC data significantly improved the WRF model’s accuracy in simulating land surface temperatures during heatwaves [
17]. Additionally, research in Metro Manila, Philippines, quantified the impact of updated LULC datasets on simulating various climatic variables, emphasizing the importance of accurate LULC data for better predictions of temperature, relative humidity, heat index, wind speed, and wind direction. These studies collectively underscore the critical role of detailed LULC data in enhancing the reliability of climate models like WRF [
18].
This context highlights the crucial relationship between changes in LULC and the operational effectiveness of the WRF model. The environmental science literature has thoroughly documented the complex interplay between LULC alterations and convective rainfall patterns, emphasizing the importance of understanding these dynamics for effective environmental management and planning [
5,
19,
20,
21].
Changes in land use—such as deforestation, urban expansion, and intensified agricultural practices—significantly impact precipitation patterns and regional climatic systems [
22]. These alterations not only affect local ecosystems but also have broader implications for meteorological phenomena. To explore the intricate interactions between LULC changes and the development of cyclonic systems, along with their subsequent effects on rainfall distribution, a series of carefully designed sensitivity experiments was conducted. These experiments employed a multi-scale approach, beginning with a synoptic-scale analysis that encompassed large geographical areas over extended periods. This broad perspective facilitated the examination of overarching climatic trends. Following this, the focus shifted to localized mesoscale systems, characterized by reduced spatial dimensions and shorter event durations, allowing for a detailed analysis of specific weather events. Understanding the significance of these varying scales is essential, as it greatly enhances the accuracy of weather predictions and climatological assessments, as noted by Wernli and Gray [
23].
This study seeks to analyze the complex relationship between changes in LULC and their effects on local precipitation patterns. It will classify various types of landscape transformations, including deforestation, urban expansion, and agricultural development, while clarifying how these modifications in regional LULC influence local hydrological dynamics.
Unlike previous research that examines broader climatic trends over extended periods, this study focuses on the intricate relationship between specific weather events and the nuanced changes in LULC. The primary goal is to elucidate how rapid shifts in land use can significantly impact precipitation dynamics, particularly emphasizing daily variations.
Rooted in robust assumptions and advanced methodologies associated with the WRF model, this paper utilizes a well-established framework that is widely recognized in meteorological research. The WRF model has been extensively validated through its application by numerous researchers, as evidenced by a substantial body of literature. This positions it as an effective tool for analyzing the complex interplay between land use changes and corresponding weather phenomena [
24,
25].
This research aims to illuminate the consequences of changes in LULC on local weather patterns by closely investigating these interactions. By doing so, it seeks to contribute valuable insights to the ongoing discourse in environmental and meteorological sciences, enhancing our understanding of how anthropogenic factors influence atmospheric conditions.
To achieve this objective, the study will utilize the WRF model to simulate and analyze the impact of LULC changes on rainfall characteristics. Specifically, it will examine the effects of these alterations, alongside shifts in forestry practices, during a significant cyclone event in Alabama’s Black Belt region. This area is currently confronting substantial challenges due to the ongoing transition from forested landscapes to agricultural land, which not only disrupts the natural ecosystem but also influences local microclimates and precipitation patterns. By focusing on this critical intersection of land use and atmospheric conditions, the study aims to provide valuable insights into the broader implications of land management practices on weather patterns and climate resilience.
2. Materials and Methods
2.1. Study Area
Alabama’s Black Belt region stands out as a distinctive area within a broader national band of fertile land stretching from Texas to Virginia. It is well known for its historical significance and agricultural abundance, often characterized by the phrase “the richest soil and the poorest people” in the United States. The term “Black Belt” was originally used to describe the exceptionally fertile, dark soil that attracted early pioneers during the 1820s and 1830s, thereby facilitating the establishment of an extensive network of cotton plantations. These plantations thrived due to the soil’s richness and the labor of a large, enslaved population, as illustrated in
Figure 1.
To fully grasp the ecological and economic significance of this area, it is crucial to acknowledge the diverse forest resources that typify Alabama’s Black Belt. Despite the abundance of natural assets, African Americans, who constitute a substantial portion of the local population and own a notable share of private forest land, continue to face high rates of poverty, unemployment, and limited educational opportunities [
27].
Alabama boasts an impressive 23.0 million acres of timberland, making it home to the third-largest commercial forestland in the United States. When accounting for “reserved” timber areas, such as national wildlife refuges and protected wilderness sites, Alabama’s total forestland increases to 23.1 million acres.
In this vast landscape, approximately 93.1% of the timberland is privately owned, with just 6.9% designated as public land. The forest industry, comprising companies that operate wood-processing facilities, manages about 6.5% of this timberland. In stark contrast, the non-industrial private sector holds a significant majority at 86.6%. Historical data from the 1972 Forest Inventory and Analysis (FIA) survey indicate that forest industries previously owned a larger share, approximately 19.7%, of the total timberland acres.
Within the Black Belt region, African Americans represent 26% of Alabama’s population, yet they own only 4% of the Non-Industrial Private Forest acreage, much of which is concentrated in this very region [
28]. Over the past year, these ownership patterns have remained largely the same.
The composition of Alabama’s forests presents a diverse ecological landscape, featuring 47% softwood stands dominated by towering pines, 41% hardwood stands filled with majestic oaks and various other species, and 12% mixed hardwood/pine stands. Notably, there has been a steady increase in softwood acreage over time. Meanwhile, the Black Belt region faces significant socio-economic challenges, evidenced by a staggering poverty rate of 34.9%, nearly double the state average of 18.8% and considerably higher than the national average of 13.3%. Residents of the Alabama Black Belt often contend with shorter life expectancies, lower levels of educational attainment, and a disturbingly low average per capita income compared to other counties across Alabama [
29].
2.2. The Dataset
The dataset employed in this research is comprehensive, encompassing essential soil properties, varied land use classifications, and intricate orographic details, all obtained at a high resolution of 2 arcminutes from the United States Geological Survey (USGS). This dataset serves as the foundational static input for the model, enabling a thorough and realistic modeling framework. The initial and lateral boundary conditions were sourced from the NCEP North American Mesoscale (NAM) 12 km Analysis, which provides an array of mesoscale analysis outputs across North America, with a spatial resolution of 12 km available at six-hour intervals [
30].
Precipitation measurements, recorded during the specified severe precipitation event and characterized by a horizontal resolution of 0.25 × 0.25°, are derived from the Tropical Rainfall Measuring Mission (TRMM) Version 7 products. These measurements are utilized to evaluate and assess the rainfall predictions generated by the WRF model [
31].
The analysis is grounded in data obtained from the Weather Prediction Center of the National Oceanic and Atmospheric Administration (NOAA). This center is renowned for its robust data collection and forecasting capabilities, which are vital for analyzing meteorological patterns and trends [
32].
2.3. The Model Configuration
The Advanced Research WRF (ARW) core was chosen for this study due to several advantages over the Non-hydrostatic Mesoscale Model (NMM) core. The ARW core is known for its flexibility in handling various physical parameterizations and complex interactions between land and atmosphere, making it particularly suitable for studies involving land use changes and their impact on local climate conditions. It uses a terrain-following hydrostatic-pressure vertical coordinate system, which allows for better representation of topography and vertical atmospheric processes, crucial for accurately modeling the effects of land cover changes on rainfall. Additionally, the ARW core has a large and active user community, providing extensive support and continuous updates, ensuring the model remains up to date with the latest advancements in atmospheric research. Version 4.4 of the WRF ARW core was used in this study because it was the latest available version at the time, incorporating the most recent improvements in model physics, numerics, and data assimilation. While other versions were considered, version 4.4 provided the most consistent and reliable results for the specific conditions of the Black Belt region, effectively handling the interactions between land and atmosphere, which is critical for understanding the impact of land use changes on rainfall. The choice of the WRF ARW core and version 4.4 was driven by the need for a flexible, accurate, and well-supported model that could effectively simulate the complex interactions between land use changes and local climate conditions, ensuring that the findings of the study are robust and reliable [
33].
The WRF simulations encompass a comprehensive range of three-dimensional meteorological parameters, including atmospheric pressure, geopotential height, temperature, relative humidity, and both zonal and meridional components of wind, all meticulously assessed across 17 standard pressure levels. Furthermore, the model examines data from four soil layers related to temperature and moisture, alongside two-dimensional surface meteorological variables such as mean sea level pressure, 10 m wind components, and 2 m temperature and relative humidity. To maintain model stability throughout the simulation period, a fixed sea surface temperature (SST) from the NCEP reanalysis dataset was consistently employed [
34]. The WRF model is widely acknowledged as the leading mesoscale numerical weather prediction (NWP) system, utilized extensively by both operational forecasting organizations and the scientific community [
35]. Its development is a collaborative initiative involving prominent U.S. institutions, including the National Center for Atmospheric Research (NCAR), the National Centers for Environmental Prediction (NCEP), and the Forecast Systems Laboratory (FSL). The model features two primary dynamical cores: the Advanced Research WRF (ARW) core and the Non-hydrostatic Mesoscale Model (NMM) core. This study employs the ARW core, which is based on a comprehensive set of fully compressible, Eulerian, and non-hydrostatic equations, including an optional runtime hydrostatic mode. This design enables effective simulation of both typical and extreme weather events characterized by their brief durations. Complementing this robust modeling framework is a single domain configured using a Mercator projection, consisting of 121 × 163 horizontal grid points, each spaced at 5 km intervals. The versatility of the WRF model is further underscored by its range of physics options, with the primary physical configurations presented in
Table 1, highlighting the model’s adaptability to a wide variety of meteorological scenarios.
A comprehensive control simulation was meticulously conducted using the WRF model to assess its effectiveness in accurately depicting synoptic weather patterns and precipitation dynamics pertinent to the specific case study. This control run served as a crucial benchmark against which subsequent analyses were measured, providing significant insights into the model’s performance.
In parallel with the control run, a series of carefully designed sensitivity experiments were executed, focusing on specific variations in land use and land cover parameters within the defined geographical boundaries, particularly spanning latitudes from 31.85° to 33.28° N and longitudes from −88.5° to −85° W. These experiments involved the intentional reclassification of land use categories, specifically converting regions previously classified as forests into cropland. This strategic reclassification targeted land use categories 1 through 5, all of which were transitioned to category 14. Notably, this transformation impacted approximately 56.5% of the designated area, substantially altering the landscape characteristics.
To quantify the effects of these modifications, Python 3.11 was utilized to calculate the percentage variation in discrepancies observed between the two datasets, both before and after the reclassification was implemented. This computational script serves as an essential tool for measuring these differences, thereby enhancing the reproducibility and reliability of the current findings.
The detailed results and implications arising from these modifications are comprehensively presented in
Table 2 and visually illustrated in
Figure 2, which depicts the extent of the changes and their effects on the model outputs, offering a clearer understanding of the relationship between land use alterations and weather simulations.
Land use plays a crucial role in modeling calculations, leading to significant changes within the study area, particularly the conversion of forested lands into agricultural cropland. These transformations also affect the classification of various vegetation types, signifying shifts in the region’s ecological dynamics. An additional critical factor in this modeling process is surface albedo, which influences the amount of solar radiation that is either reflected into the atmosphere or absorbed by the Earth’s surface.
In both numerical experiments conducted, the model was initialized with consistent data at the lateral boundaries, ensuring that all scenarios shared the same starting date. This uniformity is essential for facilitating meaningful comparisons of the results across different contexts.
The dynamics of the surface energy balance are closely intertwined with the state of atmospheric variables. Even minor changes in the interactions among these variables can result in substantial shifts in the energy balance. Furthermore, LULC is vital in determining how various heat fluxes affect a region’s thermal equilibrium, particularly when analyzed alongside prevailing meteorological conditions.
To calculate the net surface heat flux (Q
Net) derived from the outputs of the WRF model, a comprehensive analysis of the various components contributing to surface heat fluxes is essential. This analysis is summarized in the following Equation (1) [
42]:
The components contributing to QNet typically include the following:
Net Shortwave Radiation (SWdown): This refers to the incoming solar radiation reaching the surface after accounting for losses due to atmospheric scattering and absorption. It plays a crucial role in supplying the energy necessary for various surface processes.
Net Longwave Radiation: This encompasses both downward longwave radiation (LWdown), emitted from the atmosphere towards the surface, and upward longwave radiation (LWup), which is generated by the surface itself. The balance between these two forms of radiation influences temperature and energy distribution across the surface.
Sensible Heat Flux (H): This represents the transfer of heat energy from the surface to the atmosphere, driven by temperature differences between the surface and the air above. It has a significant impact on convective processes and is essential in understanding weather and climate dynamics.
Latent Heat Flux (LE): This concerns the heat exchange resulting from the phase changes in water. It includes the energy involved in processes such as evaporation from water bodies or soil and condensation in the atmosphere. Grasping LE is vital for understanding how moisture interacts with energy balance and influences the local environment.
The analysis conducted through a Python script evaluates the percentage variations in discrepancies between the grids of two experimental files, taking into consideration both pre- and post-modification scenarios. This investigation, based on model simulations, yields critical insights into the effects of LULC changes on weather events [
43].
By examining these components, researchers can gain a more profound understanding of the energy dynamics at the surface and their implications for both the immediate environment and broader climatic patterns.
2.4. Model Evaluation
The evaluation process of the model involved two essential statistical measures: the Root Mean Square Error (RMSE) and the Mean Bias (MB). The RMSE acts as a reliable indicator of model performance, quantifying the average magnitude of discrepancies between observed and predicted values. In an ideal scenario, a perfect model would yield an RMSE value approaching zero, signifying that predictions closely align with actual observations.
Conversely, the Mean Bias (MB) is used to assess systematic deviations in the model’s predictions. It measures the extent to which the mean of the predicted values diverges from the mean of the observed values. Attaining lower MB values is crucial, as these indicate a greater concordance between predictions and observations. Specifically, negative MB values suggest a tendency for the model to underpredict the observed data, which may signal the need for adjustments or recalibration of the model [
44].
The correlation coefficient, commonly denoted as R
2, quantifies the effectiveness of a statistical model in predicting an outcome. It indicates the proportion of variance in the dependent variable that can be explained by the independent variable. R
2 values range from 0 to 1, where a value of 0 indicates that the model does not predict the outcome, and a value of 1 signifies a perfect prediction by the model [
45].
The Nash–Sutcliffe Efficiency (NSE) is a metric used to assess the predictive performance of hydrological models. It evaluates the residual variance of the model with the variance of the observed data. NSE values can range from negative infinity to 1, with a value of 1 representing an ideal model fit. A value of 0 suggests that the model’s predictions are no more accurate than simply using the means of the observed data. Conversely, negative NSE values imply that the mean of the observed data outperforms the model’s predictions [
46].
The mathematical formulations for assessing model performance, specifically the Root Mean Square Error (RMSE), Mean Bias (MB), coefficient of determination (R
2), and Nash–Sutcliffe Efficiency (NSE), are articulated in Equations (2)–(5) provided below. In these equations, the variable n indicates the total number of observations utilized in the analysis. The term X
p represents the predicted values generated by the model, while X
o denotes the actual observed values collected from observations. Furthermore, X
o,t refers to the observed discharge at a specific time point t, and X
p,t indicates the modeled discharge predicted by the model at that same time point. The equations also incorporate the mean of the observed values, which serves as a baseline for comparison. Together, these equations facilitate a rigorous quantitative assessment of the model’s performance, revealing insights that can inform and guide subsequent refinement and optimization efforts in the modeling process [
44,
46].
3. Synoptic Discussion of the Case Study
On 6–7 October 2021, Alabama experienced severe weather conditions marked by heavy rainfall, with totals approaching 100 mm within just 48 h. This significant weather event was largely driven by a stationary upper-level low-pressure system over the southeastern United States. Additionally, a strong blocking high-pressure ridge situated to the north, commonly referred to as a Rex Block, played a pivotal role in maintaining this atmospheric configuration. As a result, Central Alabama endured a series of unpredictable showers and thunderstorms, leading to particularly erratic weather patterns [
47].
The Surface Weather Map presented in
Figure 3a,b at 7:00 a.m. EST illustrates a complex array of station observations, supported by thorough meteorological analysis. The shaded areas indicate recorded precipitation, while the contours represent mean sea level pressure in millibars, essential for understanding the larger atmospheric processes at play. Furthermore,
Figure 3c,d displays the 500-millibar height contours, with solid lines indicating height contours, dashed lines illustrating temperature levels in degrees Celsius, and arrows showing wind direction at the 500 hPa level during that specific time. The areas and volumes of precipitation are further detailed in
Figure 3e,f, which focus on regions that experienced rainfall in the 24 h leading up to 7:00 a.m. EST on October 6 and 7, utilizing data from NOAA’s Weather Prediction Center [
48].
The analysis of surface pressure reveals a prominent subtropical high-pressure system dominating a significant portion of the northeastern United States, extending into the western Atlantic. In contrast, a localized low-pressure system has developed over the southeastern United States, characterized by dynamic fronts that sharply distinguish it from the surrounding high- and low-pressure areas, as illustrated in
Figure 3a,b. Additionally, an upper-level trough at the 500 hPa level has been observed across the western and southern regions of the U.S., originating from a moving depression in northern Canada, further depicted in
Figure 3c,d.
On October 6, the region experienced notable effects from an approaching low-pressure system from the south, which spurred the formation of a dynamic front that interacted with the incoming high-pressure system. As the 500-hPa cut-off low became more pronounced, it moved eastward, affecting the southern and southeastern U.S., as shown in
Figure 3c,d. The interactions between the surface and upper air pressure systems intensified during the early hours of October 6 and continued into 7 October 2021.
During this rain event, as illustrated in
Figure 3e,f, there was a significant interaction between the expansive surface system migrating from tropical regions and the upper-level trough characteristic of mid-latitude dynamics, as shown in
Figure 3c,d. This developing dynamic was further intensified by the collision of warm, moist tropical air masses with colder, denser polar air, which resulted in notable atmospheric instability across the southeastern region, particularly within the study area.
Following the events of 7 October 2021, the tropical surface system began its southeastward migration, while the upper-level trough transitioned northeastward. This shift led to a gradual dissipation of their interaction, fostering increased atmospheric stability and allowing for the eventual re-establishment of the high-pressure system’s dominance over the region, signifying a return to more stable weather conditions.
The meteorological conditions surrounding the Shelby County Airport (BMX) in Alabama provide compelling evidence of the pronounced atmospheric instability that contributed to the storm’s formation on 6 October 2021, as well as its subsequent dissipation on 7 October 2021.
The Skew-T diagram is created using data collected from radiosonde soundings, which include measurements of temperature, dew point, pressure, and wind speed and direction at various altitudes. Each element of the diagram corresponds to specific atmospheric parameters: isobars, indicated by horizontal lines, represent pressure levels; isotherms, shown as skewed lines, illustrate temperature; dry adiabats, depicted as curved lines, indicate the rate of temperature change for unsaturated air; moist adiabats, also represented by curved lines, pertain to saturated air; and mixing ratio lines, illustrated as dashed lines, reflect the water vapor content. Furthermore, wind barbs located on the right side of the diagram provide information about wind speed and direction at different altitudes [
49].
At 1200 UTC on 6 October 2021, a comprehensive atmospheric sounding from the Shelby County Airport revealed a significant degree of destabilization within the environment. Specifically, the Convective Available Potential Energy (CAPE) reached an impressive threshold, surpassing 595.3 J/kg, which indicates a high potential for convective development. Additionally, the observed precipitable water (PWAT) was notable, recorded at 35.43 mm, suggesting a considerable amount of moisture in the atmosphere, an often-crucial precursor to heavy rainfall and severe weather.
The analysis further elucidated key pressure levels essential for understanding the atmospheric dynamics at play. The Equilibrium Level (EL), at which rising air parcels achieve equilibrium with their environment, was identified at 186.40 hPa, providing insights into the vertical extent and capabilities of the storm system. In contrast, the Level of Free Convection (LFC), situated at 869.70 hPa, represented the altitude where buoyant air parcels could begin to rise freely, a vital factor in storm development. Moreover, the Lifting Condensation Level (LCL), approximated at 900 hPa, marked the height at which moist air parcels reach saturation and initiate the condensation process, further highlighting the critical layer of instability present during this period.
The intricate interplay of these measurements illustrates the heightened atmospheric conditions that facilitated the storm’s formation, as depicted in
Figure 4a. Conversely,
Figure 4b illustrates the gradual weakening of these interactions, leading to increased atmospheric stability and the eventual resurgence of the high-pressure system’s dominance in the region, signifying a return to more stable weather conditions.
Overall, the data highlight the complex atmospheric dynamics that characterized this event, shedding light on the factors that contributed to both the storm’s development and its subsequent dissipation [
50].
4. Results and Discussion
Figure 5 presents a detailed representation of the net surface heat flux (Q
Net) across the study area, analyzed under two distinct scenarios: a control run that reflects the environmental conditions without any alterations, and an alternative scenario that accounts for changes in LULC. This analysis is essential for comprehending the thermodynamic processes that shape local climates and weather patterns.
Moreover,
Figure 6 provides a thorough comparative assessment of net surface heat flux (Q
Net), a crucial factor driving atmospheric dynamics. This figure illustrates both the control run, which establishes a baseline of environmental conditions free of LULC modifications, and an experimental scenario that incorporates specific land use changes aimed at optimizing or evaluating ecosystem functionality.
Figure 7 presents a comprehensive comparison of the divergence in net surface heat flux (Q
Net) between two distinctly different scenarios: the control run, which reflects a stable and unchanged environmental state, and an alternative scenario that includes various modifications to LULC across Alabama’s Black Belt region. This thorough comparative analysis is crucial as it highlights the significant impacts that changes in land use can have on thermal dynamics, which can, in turn, substantially influence local climate patterns and the intricate web of ecological interactions.
The findings depicted in this figure underscore the vital importance of conducting detailed assessments of LULC changes. Such evaluations are critical for understanding how these alterations can transform the thermal characteristics of the environment, affecting factors such as heat absorption, water retention, and vegetation health. By emphasizing the interplay between human activities and natural processes, this analysis serves as a powerful reminder of the need for sustainable land management practices that consider the complex relationship between land use and climate systems.
The visual representations in these figures highlight the significant impacts of land use changes, particularly within the Black Belt region. Here, an increase in net surface heat flux is notably pronounced in the eastern part of the area, where a clear temperature differential is evident. This elevated heat flux plays a critical role in modifying localized weather phenomena, affecting the distribution patterns of precipitation and its intensity throughout the region.
Understanding these complex interactions is vital for making accurate predictions about future climate conditions. Alterations in land use can significantly disrupt established weather patterns, leading to potentially substantial and lasting effects on both local and regional climates. Given the rising pressures from urbanization and agricultural expansion, the monitoring and modeling of these changes is increasingly important for sustainable resource management and climate resilience planning.
Figure 8 presents a detailed illustration of mean sea level pressure, measured in millibars, along with shaded regions that depict surface temperatures. Furthermore, arrows are employed to indicate both the direction and intensity of surface winds, creating a comprehensive visual representation of atmospheric conditions. The data are categorized into two distinct scenarios: (a) the control run, which represents baseline atmospheric conditions free from anthropogenic influences or experimental modifications, and (b) the experimental scenario, which incorporates significant changes in LULC.
A thorough comparative analysis of the surface atmospheric charts from the LULC alteration experiments, when contrasted with those from the control runs, indicates that changes in land use have a negligible effect on the primary pressure systems and prevailing wind patterns. Nonetheless, a notable observation emerges regarding surface temperature patterns, which display significant variations influenced by factors such as the seasonality of the growing season, shifts in albedo values, fluctuations in leaf area index, and modifications to surface roughness and moisture fluxes.
Specifically, while albedo levels in cropland and forested areas remain relatively comparable during the active crop growing season, croplands experience prolonged periods of exposed bare soil throughout much of the year. This exposure leads to a marked decrease in albedo for croplands, especially when contrasted with native vegetation, which benefits from continuous plant cover that maintains a higher albedo across the seasons.
Additionally, the influence of agricultural systems is especially notable in irrigated croplands, which are marked by increased moisture fluxes. These enhanced fluxes can result in substantial alterations to local microclimates, affecting not only local weather patterns but also contributing to broader regional climatic variations. This dynamic interaction between surface conditions and atmospheric processes underscores the complex relationships between land use practices and climate, as evidenced by recent studies [
51].
The phenomenon of absolute vorticity advection has been identified as a critical factor contributing to the extreme rainfall observed in the study area, particularly in Alabama [
52]. This advection mechanism facilitates the northward trajectory of an upper atmospheric trough originating in southern latitudes. This movement is crucial as it significantly alters the meteorological conditions across the eastern portion of the study region, ultimately leading to increased precipitation.
An essential aspect of analyzing these atmospheric dynamics involves monitoring the geopotential height at the 500 hPa level, which serves as a vital indicator for understanding upper-air conditions and the positioning of upper-level troughs.
Figure 9 illustrates these dynamics, emphasizing their ramifications for weather patterns. Notably, while the geopotential height at this level did not show significant changes during the recorded rainfall events, there were considerable fluctuations in absolute vorticity. These variations are noteworthy as they closely correlate with significant LULC changes in the region.
The intricate relationship between atmospheric dynamics and terrestrial modifications highlights the growing concern regarding how human activities may influence weather patterns. Changes in land use, such as urbanization, deforestation, and agricultural practices, can profoundly alter local weather conditions, particularly in terms of precipitation intensity and distribution. This interplay between atmospheric variables and land use changes underscores the necessity for a comprehensive monitoring approach.
By systematically observing both meteorological parameters and LULC alterations, researchers and policymakers can develop a clearer understanding of their combined effects, which is essential for formulating effective strategies to address and mitigate the impacts of climate phenomena in regional contexts.
The sounding profile simulation conducted at 1200 UTC on 6 October 2021 for Shelby County Airport (BMX) revealed significant atmospheric instability, as illustrated in
Figure 10. This analysis highlights the notable discrepancies between the dynamic fluctuations present in the lower atmosphere and the more stable conditions that prevail at higher altitudes.
The Convective Available Potential Energy (CAPE) from the control run was measured at over 537 J/kg, indicating a moderate potential for convective activity during this period. CAPE is a vital metric for evaluating the atmosphere’s capacity to support thunderstorms, and such a value suggests an environment conducive to the development of convection, which can lead to severe weather events.
In contrast, the CAPE associated with LULC alterations increased to a remarkable 614 J/kg. This rise signifies a greater level of atmospheric instability linked to changes in surface properties and their interactions with atmospheric conditions. The elevated CAPE implies that these alterations could significantly enhance the potential for storm development, raising concerns about the likelihood of severe weather due to modified environmental conditions.
Consequently, the simulation results not only provide valuable insights into the current state of the atmosphere but also indicate that ongoing and future LULC changes could have profound implications for local weather patterns and storm dynamics in the region.
Figure 11 presents a comprehensive visualization of the predicted precipitation distribution (measured in millimeters) within the designated study area, as modeled by the WRF system over a specified time frame. The precipitation data are meticulously analyzed across two distinct scenarios: (a) the control scenario, which accurately replicates the current LULC conditions without any modifications, and (b) the modified scenario, which incorporates recent changes in LULC resulting from various anthropogenic and natural factors.
This comparative analysis effectively highlights the significant differences in rainfall patterns that arise from shifts in land cover, thereby emphasizing the crucial influence of LULC dynamics on precipitation forecasting. The findings reveal marked variations in precipitation between the two scenarios. The control run reflects the typical rainfall conditions experienced in the Black Belt Region of Alabama, corresponding to the area’s traditional land use patterns, while the modified scenario integrates the impacts of recent observed land use changes, providing a more contemporary representation of hydrological responses.
Furthermore,
Figure 12 provides a comprehensive comparative analysis of precipitation variations measured in millimeters (mm) across two distinct scenarios. The first scenario serves as a control run, representing unaltered environmental conditions without any external interventions. In contrast, the second scenario incorporates specific changes in LULC within Alabama’s Black Belt region, an area known for its historical significance and ecological importance.
The data presented in this figure are crucial for understanding the impacts of land use changes on hydrological patterns in the region. They reveal notable discrepancies in precipitation outcomes resulting from shifts in LULC, particularly the transition from forests to cropland. Such a change can fundamentally affect the water cycle, influencing not just the amount of precipitation but also its distribution and timing throughout the year.
Thus, this analysis emphasizes the critical need to monitor changes in precipitation and highlights the importance of thorough research focused on evaluating the environmental and ecological consequences of land use alterations. Understanding these dynamics is vital for creating effective land management strategies that can mitigate negative impacts on the region’s hydrology and biodiversity.
Such detailed insights into precipitation distribution not only enrich our understanding of local climate dynamics but also contribute to broader discussions regarding land management and environmental planning strategies in the Black Belt region and beyond.
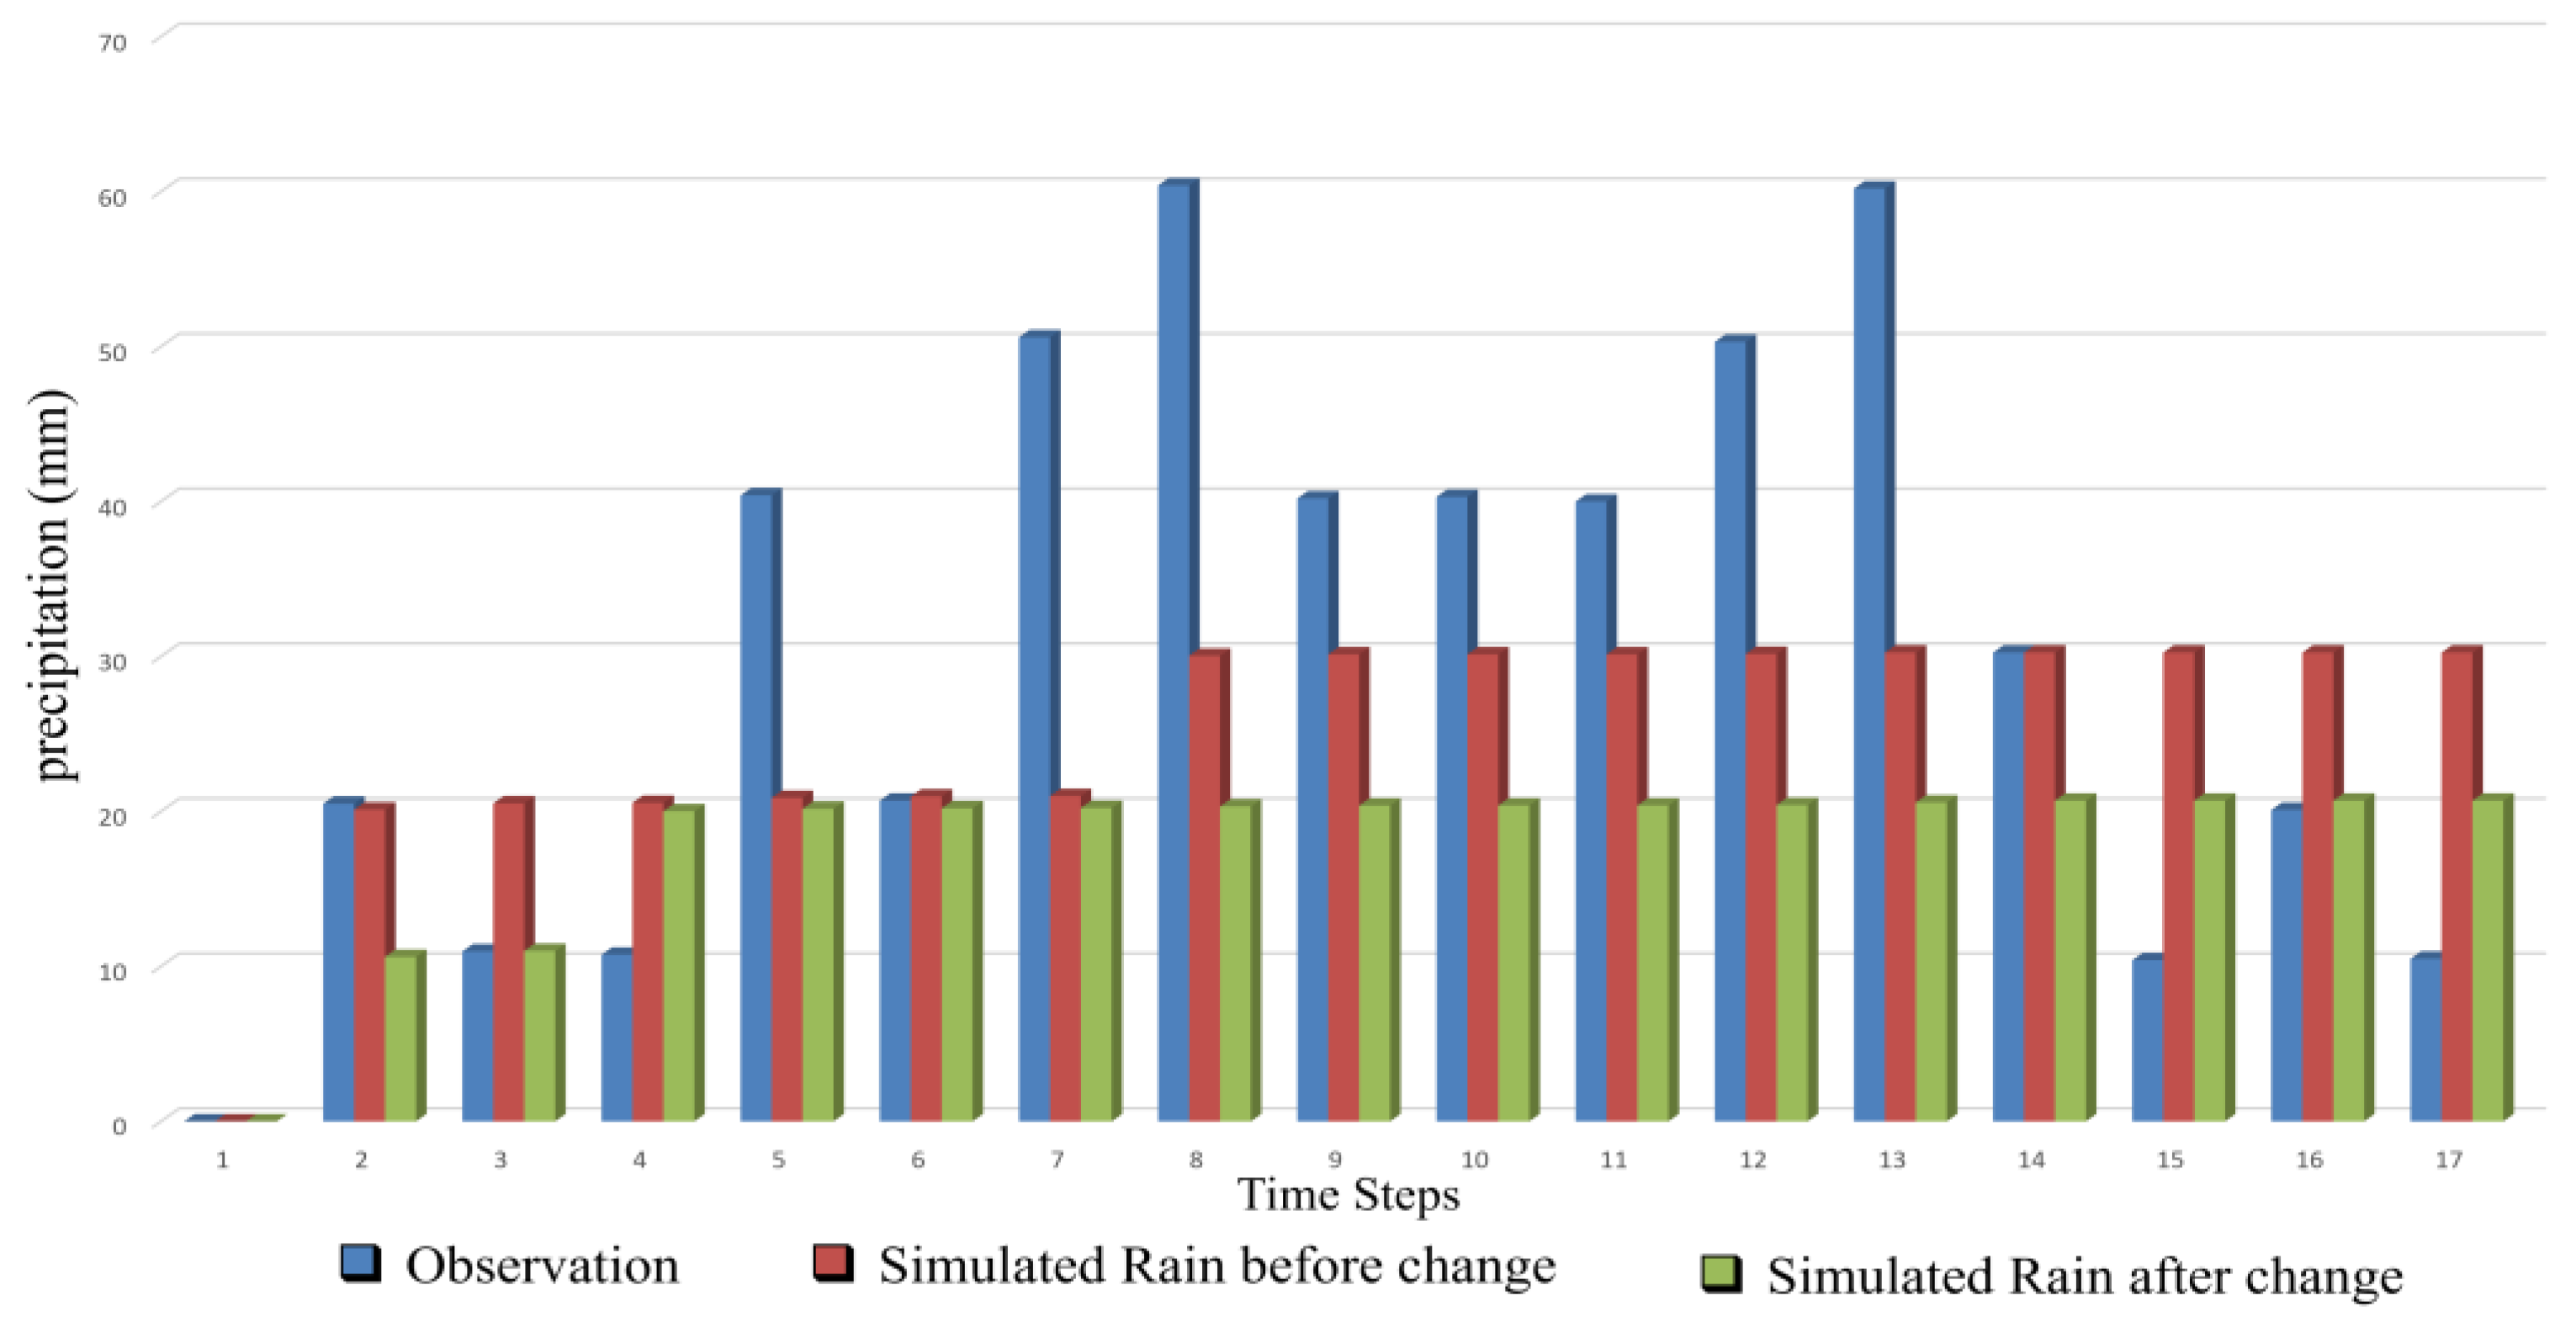
The rainfall forecasts produced by the WRF model for two separate scenarios were systematically analyzed and juxtaposed with actual rainfall data recorded in the study area on October 6–7, as illustrated in
Figure 13. This figure provides a detailed visualization of the rainfall predictions from the WRF model, evaluated under the two scenarios (Before and After Modification). The predictions were meticulously compared with empirical rainfall measurements obtained from the study area during the critical period of October 6–7, with data collected at three-hour intervals for both days.
A comprehensive analysis of the findings reveals that the WRF model exhibits a significant level of accuracy in its forecasts, as demonstrated by its close correspondence with the observed rainfall data for the region during the specified timeframe. This assessment not only underscores the model’s capability to effectively capture the complex dynamics of precipitation patterns but also validates its reliability in simulating real-world climatic conditions. This thorough analysis demonstrates that the model performed exceptionally well, closely aligning with the observed rainfall data for the region and showcasing its reliability in simulating real-world conditions.
The investigation deeply explores the variations in rainfall intensity throughout the study area, highlighting that these fluctuations can be significantly attributed to changes in land use. Notably, the findings reveal a substantial reduction in rainfall levels, underscoring the complex relationship between human activities, such as urban development, deforestation, and agricultural practices, and the corresponding responses of the climate system.
This study not only reinforces the significant impact of land cover changes on local weather patterns but also illuminates the hydrological dynamics that govern precipitation distribution. By incorporating land use factors into forecasting models, the research illustrates that accurate precipitation predictions must account for these environmental transformations.
This approach ultimately enhances the precision and reliability of rainfall forecasts, ensuring they better reflect the intricate interplay between human influences and natural climatic responses. Through this exploration, the study emphasizes the urgent need for coordinated efforts in land management and climate adaptation strategies to mitigate the adverse effects on local weather systems and water resources.
The findings of the study provided a thorough evaluation of the model’s performance, employing key statistical indicators, particularly the Root Mean Square Error (RMSE) and Mean Bias (MB). The analysis revealed RMSE values of 1.64 for the control run, which served as a baseline without LULC changes, while the scenario incorporating LULC alterations resulted in an RMSE of 2.01. These RMSE values suggest a modest decline in the predictive accuracy of the model under conditions of modified land cover.
The Mean Bias values highlighted this inconsistency, with an MB of 1.32 for the control run compared to 1.58 in the LULC change scenario. This indicates that the model underestimated certain meteorological variables when accounting for LULC changes.
The correlation coefficients highlight a notable inconsistency in model performance, with an R2 value of 0.247 for the control run compared to 0.270 in the LULC change scenario. This marginal increase indicates a slight improvement in predictive accuracy resulting from the alterations. However, both R2 values remain relatively low, suggesting that a substantial fraction of variance is still unexplained. Thus, further refinement to the model may be necessary to enhance its predictive capability.
Moreover, the Nash–Sutcliffe Efficiency (NSE) values before and after the modifications provide insight into the model’s predictive validity relative to the observed data. Before the changes, an NSE of 0.1567 indicates that the model’s predictions marginally outperformed the mean of the observed data, though it still lacked precision. In contrast, following the modifications, the NSE dropped to −0.2257, reflecting a decline in predictive performance and suggesting that the model is now less effective than employing the mean of the observed data. This negative NSE underscores a degradation in model reliability for outcome prediction. The significant shift from 0.1567 to −0.2257 highlights the need for further adjustments or a reassessment of the implemented changes to bolster the model’s predictive accuracy.
Importantly, sensitivity analyses conducted as part of the study revealed significant average shifts in critical climatic factors, with heat flux showing an average increase of 60% and precipitation exhibiting a 36% shift. These findings underscore a substantial relationship between land cover modifications and their meteorological consequences, suggesting that alterations in terrestrial landscapes can significantly impact local and regional climate patterns.
The analysis emphasizes the crucial role of land use and land cover in both the formation and intensity of storm systems. This insight highlights the importance of considering LULC dynamics in meteorological and climate modeling, reinforcing the necessity for integrated approaches that account for human impacts on land and their consequential effects on weather phenomena.
5. Summary and Conclusions
This study investigates the intricate synoptic conditions that illustrate how changes in LULC affect the formation and evolution of thunderstorms, along with their corresponding rainfall patterns. A thorough assessment of regional model downscaling techniques was carried out utilizing the WRF model, a respected tool indispensable for simulating atmospheric phenomena with high spatial and temporal accuracy. The simulations were based on initial and boundary conditions derived from the coarse-resolution North American Mesoscale (NAM) reanalysis data, establishing a robust foundation for the model’s outputs and ensuring consistency throughout our experimental framework.
To enhance the analysis, we applied a novel and meticulously modified LULC dataset across various experimental scenarios to investigate the subtle impacts of different land cover configurations on local meteorological phenomena. A comprehensive comparison between results from these realistic model simulations and those generated from intentionally altered configurations provided valuable insights into weather dynamics. This analysis underscored that LULC is not merely a contextual factor but a significant influence on moisture availability and the distribution of precipitation within the study area. Notably, we detected a pronounced shift in the hydrological cycle resulting from the conversion of densely forested regions into agricultural landscapes, revealing the broader implications of changing land use.
In addition to evaluating the impacts of LULC transformations, our study also investigates the variations among different vegetation types to assess their contributions to atmospheric interactions. Throughout this research, surface albedo emerged as a critical variable within our modeling framework, significantly influencing energy absorption and surface heat fluxes, which, in turn, affect local climatic conditions.
To ensure consistency during the numerical experiments, the model was initialized with uniform meteorological data across all test runs. The results revealed significant variations in both net surface heat flux and rainfall amounts, directly correlated with changes in LULC. Average alterations of approximately 60% in heat flux and 36% in rainfall were observed throughout the study area, underscoring the considerable impact of LULC changes on atmospheric outcomes.
The WRF model faces uncertainties arising from various sources, primarily due to limitations in boundary data and the complexities involved in physical parameterization. These limitations result from inaccuracies or insufficient resolution in the initial and boundary conditions provided to the model, which significantly impact the accuracy of the simulations. Such constraints often stem from a lack of observational data, particularly in remote or oceanic regions. In addition, physical parameterization entails modeling subgrid-scale processes such as cloud formation, radiation, and turbulence—processes that are intricate and not fully understood. This complexity leads to uncertainties regarding their precise representation within the model. Furthermore, the selection of parameterization schemes and the assumptions they incorporate can introduce variability in the model’s outputs. Collectively, these factors contribute to the overall uncertainty in the predictions produced by the WRF model, thereby affecting its reliability in weather forecasting research [
53].
Sensitivity analyses underscored the significant role of LULC in influencing the formation and intensity of localized storm events, illustrating how changes in land cover can directly affect atmospheric dynamics. A comparative assessment of rainfall predictions from the WRF control ran against various observational datasets reaffirmed that LULC is fundamental in shaping both moisture availability and precipitation patterns.
The results of this study established a comprehensive framework that clarifies the intricate interconnections between changes in land cover and climatic behaviors within the Alabama Black Belt region. These findings highlight the need for future research to prioritize a thorough examination of precipitation climatology, emphasizing the inherent variability that characterizes weather patterns in this area, particularly regarding the impacts of changes in LULC.
By adopting this integrated research approach, scholars can enhance their understanding of how alterations in LULC influence weather dynamics, ultimately contributing valuable insights essential for both meteorological studies and effective land management strategies. Specifically, investigating the interactions between land use changes, such as agricultural practices, urban development, and forest cover alterations, and local weather variables will yield critical information.
Moreover, examining the effects of LULC changes on precipitation patterns will help identify emerging trends and anomalies within the region’s weather systems. This understanding is crucial for developing effective strategies to address weather variability and its implications for sustainable land use practices. Consequently, the research could enhance resilience in both environmental stewardship and agricultural methodologies, fostering a balanced approach to the management of natural resources and farming practices in the context of evolving climatic conditions. Ultimately, the insights drawn from this comprehensive analysis will be vital in formulating adaptive strategies that ensure the long-term sustainability and productivity of the Alabama Black Belt region.
This study reaches several significant conclusions:
Alterations in LULC have a substantial impact on meteorological phenomena, particularly concerning storm dynamics and precipitation patterns. In the Black Belt region of Alabama, the conversion of 56.5% of forested land to agricultural use led to a 60% increase in heat flux and a 36% rise in precipitation, underscoring the influence of LULC on the formation and intensity of storm systems. However, the modified LULC scenario exhibited less accuracy in rainfall forecasts compared to the control scenario, as evidenced by a Root Mean Square Error (RMSE) of 2.01 versus 1.64 and a Mean Bias (MB) of 1.58, compared to 1.32. The coefficient of determination (R2) was marginally higher for the altered LULC scenario, recorded at 0.270, in comparison to 0.247 for the control scenario. Furthermore, the Nash–Sutcliffe Efficiency (NSE) value decreased from 0.1567 in the control scenario to −0.2257 in the modified scenario, indicating a decline in predictive accuracy. While the methodologies utilized in this study may be applicable in other regions, caution is warranted when generalizing these findings due to variations in land cover types, climatic conditions, and socio-economic factors. Additional research is essential to enhance the model’s applicability across diverse environments.


