1. Introduction
In agricultural production systems, seeds with good physiological quality are determinants of high productivity and, consequently, of the profitability of the producer [
1]. In this context, the germination test is of paramount importance for determining the capacity and quality of seed development. However, this test requires time and, consequently, investment, in addition to subjecting the analyzed seeds to destructive conditions. For this reason, it is necessary to develop new technologies that reduce the costs and analysis time [
2].
Given the need to integrate new technologies into the seed sector, artificial intelligence is a viable alternative because of its variety of applications, which allows greater control over the agricultural and environmental variables that impact the production system. Taking as a starting point the ability to simulate human reasoning and decision making, artificial intelligence has the ability to interpret and learn from the data it processes, thus generating a bank of information that can assist in future decision making.
Artificial intelligence applied to agricultural and livestock activities promotes the development and use of technologies that assist farmers at every stage of their production. When integrated with computerized systems, artificial intelligence performs the reading and processing of data collected by sensors or satellites, thus generating a robust database [
3]. In this way, it enhances the accuracy of the decision-making process, making it more efficient and ultimately benefiting agricultural and livestock activities.
Currently, there are multiple areas within agricultural production that can be impacted by the use of artificial intelligence, making operations more effective and sustainable [
4]. Recent studies demonstrate the integration of conventional rural production technologies with artificial intelligence tools, such as in the qualitative classification of corn kernels based on physical attributes [
5]; in the identification of distinct pathogens in bean crops, offering greater efficiency compared to conventional detection methods, as well as faster results than laboratory-based detection [
6]; in the detection of ripe apples along with their branches and trunks, aiming to improve the harvesting process performed by harvesters [
7]; and in the detection of tomato seeds with vigor, suitable for cultivation [
8].
Among the alternatives provided by artificial intelligence, digital cameras, satellites, drones, and other image-capture devices have become fundamental pieces in the construction of databases that support new technological tools. These devices enable the analysis of images, the extraction and interpretation of data and, in some cases, the autonomous application of these results.
Studies have shown that digital image processing involves capturing visual information through the recognition of objects of interest, extracting features for the formation of patterns, and subsequent classification on the basis of these patterns [
9]. In this sense, the use of digital image processing also allows the evaluation of the physiological attributes of seeds with greater reliability and effectiveness, especially compared with analyses based exclusively on human supervision [
10]. Among the available tools, YOLO (you only look once) is a real-time object detection algorithm that is capable of analyzing an image in just a single reading [
11]. Like other current technologies, YOLO has been incorporated into studies in agricultural areas, opening new research perspectives, such as more accurate identification of insects [
12] and pests at different scales in light traps [
13].
In addition, the eighth version of YOLO has shown the potential to reduce the high error rate in manual evaluations of tomato seed vigor, indicating that it is an effective and nondestructive method for determining this attribute [
8]. Thus, the present study aimed to use YOLO, an artificial intelligence tool, to identify and classify germinated and ungerminated soybean seeds and compare their accuracy with that of the conventional method to establish the degree of reliability and efficiency of this technology.
2. Materials and Methods
2.1. Preparation of Germination Tests and Image Capture
The entire stage of development of the germination tests, including preparation, quantification and calculations, was carried out according to the guidelines established by the Rules for Seed Analysis [
14]. The tests were conducted at the Seed Laboratory of the Institute of Agrarian and Technological Sciences (ICAT) of the Federal University of Rondonópolis (UFR). The images were captured in a standardized way via a camera with a resolution of 12 megapixels (12,000,000 pixels), an angular aperture of ƒ/1.5 (0.66), and optical stabilization functionality. The capture height was set at 0.30 m.
Before the tests were performed, the bench and trays were sanitized with 70% alcohol. Then, with the aid of a precision scale, the tare weight was removed from the trays, and subsequently, the germination paper (Germitest® CEL-060, Netlab, São Paulo, Brazil) were weighed. The quantification of distilled water followed the proportion of 2 to 3 times the weight of the substrate; in this study, a factor of 2.5 times the weight of the germination paper was used, ensuring that the volume of water was sufficient to cover the entire substrate area.
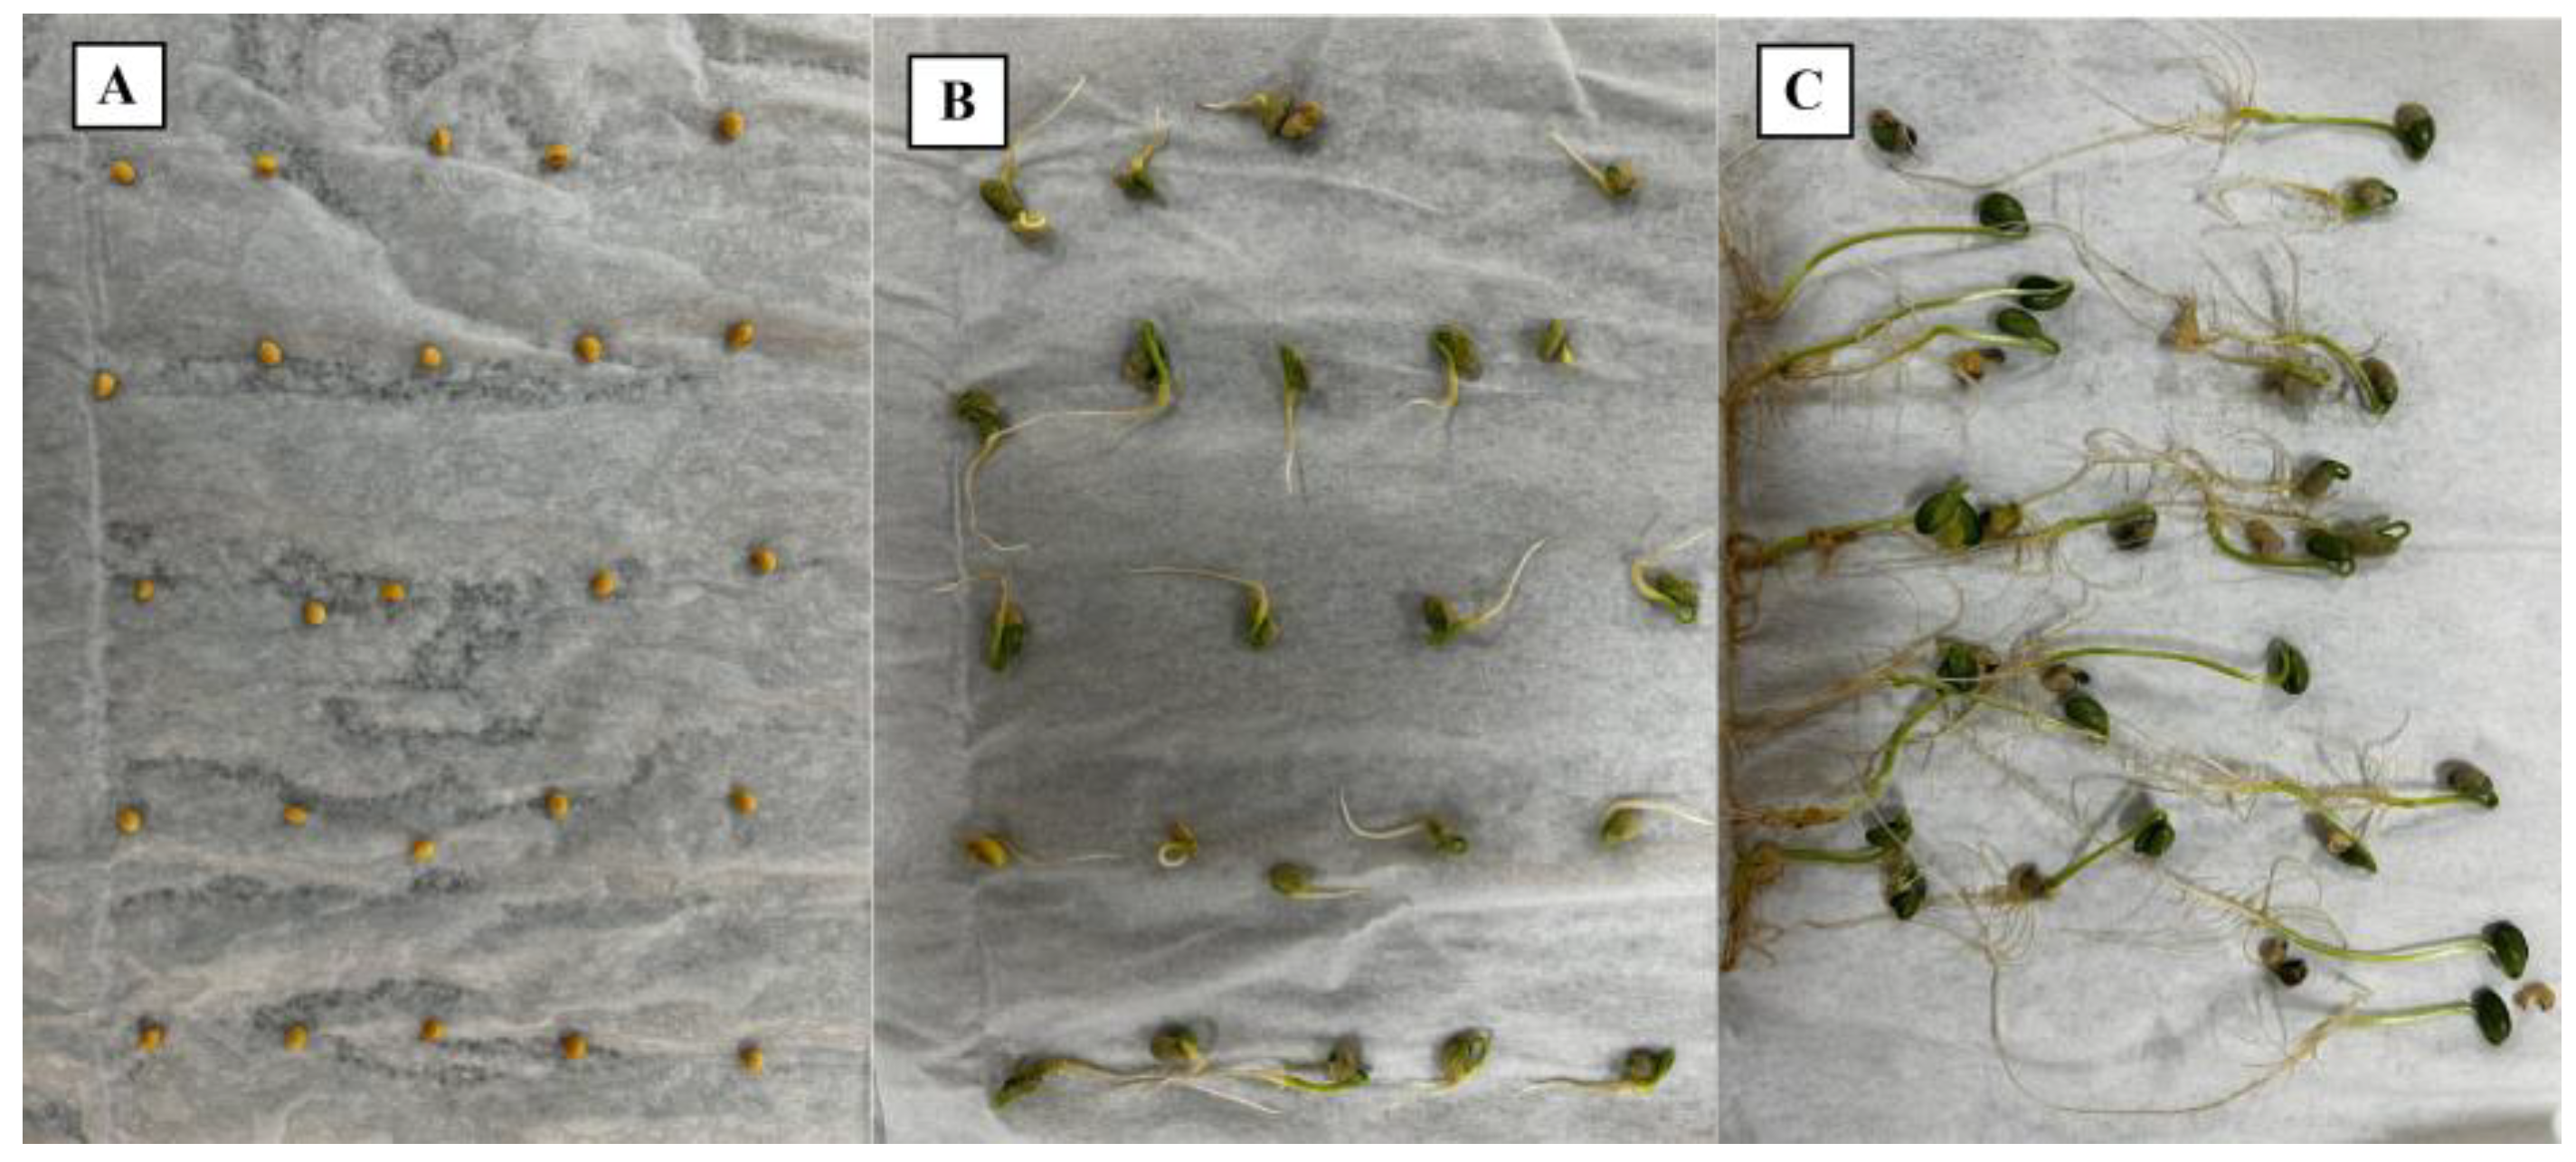
The tests were carried out in 30 sections, with 8-day intervals between each one, representing different germination stages of the Glycine max (soybean) crop. Each sample was composed of 25
Glycine max seeds distributed uniformly (
Figure 1A), totaling 75 seeds per section (3 samples per section). The second image was captured 5 days after the assembly of the tests (
Figure 1B), and the third image was recorded 8 days after the assembly, that is, 3 days after the second capture (
Figure 1C).
After performing the germination tests and capturing the images, an image bank containing 90 samples was prepared, counting 2250 seeds, including germinated and nongerminated seeds.
2.2. Conventional Classification
The classification of seeds as germinated or not germinated followed the criteria established by the Rules for Seed Analysis [
14]. This stage was conducted by two independent evaluators. On the basis of the interpretation and extraction of data from the images, a comparative table was constructed containing two columns: the first column indicated the total number of seeds in the test, which was previously standardized at 25 units, and the second column corresponded to the number of germinated seeds in each image.
2.3. Digital Processing of Images and Application of Samples to YOLO
At this stage, the images were sent to a cloud server, where the seeds were manually demarcated and categorized as germinated seeds (SGs) or nongerminated seeds (SNGs), with the help of the Label Studio 1.15 software. After each seed was delimited, the files were exported in a format compatible with the YOLO software.
Once the digital processing was completed, the extracted files were organized according to their purpose in the study: images intended for training, used to train the YOLO model, and images intended for testing, used to evaluate the performance of the model. In both directories, the images and label folders were created. For training, 70 images were used with their respective labels; for testing, 20 images were allocated, accompanied by their labels.
The implementation was carried out via PyCharm 3.12.2 software integrated with the Ultralytics 8.3.24 database, which includes the primary and updated versions of YOLO. The entire application stage of the YOLO model was performed on a notebook equipped with a GeForce RTX 2050 graphics card and 4 GB of random access memory (RAM).
Initially, the YOLOv8n (nano) version was used to evaluate the processing capacity of the equipment. The YOLOv8m (medium) version was subsequently adopted to ensure greater accuracy in the analyses. The training of the images was conducted through a code developed in the Python 3.12.2 programming language.
2.4. Categorization via YOLO and Data Analysis
To improve the image quality and optimize the training and testing process, adjustments were made using Python programming, enabling the use of higher-resolution images and configuring the number of repetitions during training
For the detection of the object of interest, the structural logic presented in
Figure 2 was followed. The image dataset was divided as follows: 70 images were allocated for the training and validation stages, and 20 images were reserved for the testing stage.
In the training phase, the YOLOv8n version was initially used, with 50 epochs and images at a resolution of 400 × 400 pixels, aiming to optimize its efficiency [
15]. The subsequent training employed the YOLOv8m version, maintaining 50 epochs but using images at a resolution of 320 × 320 pixels. During this phase, the data was continuously validated, enabling the evaluation of the model’s performance and the assessment of YOLO’s learning process—verifying whether the algorithm had truly learned the patterns of interest or merely memorized the information. The validation phase occurred cyclically, being conducted at the end of each epoch and before the beginning of the next.
After the training and validation phases, the generated data was presented through graphs and a confusion matrix. Finally, the results were tested using an image from the test set to verify the validity of the obtained outcomes.
At the end of the categorization process, the extracted data were submitted to different analysis metrics. The interpretation and extraction of the data obtained from the graphs generated during the training of the YOLO model were carried out, considering aspects such as the identification and classification of seeds, as well as the accuracy effectiveness as a function of the season. Next, an analysis of the confusion matrix was carried out with the objective of evaluating the performance of YOLO in the classification of samples, verifying the accuracy of the model in distinguishing between germinated and nongerminated seeds.
2.5. Mean Squared Error
In order to validate the efficiency of automatic classification in comparison to conventional classification, the Mean Squared Error (MSE) method—a precise comparison metric—was used, as represented by Equation (1), to compare the manually obtained results with those generated by YOLO.
where
MSE—mean squared error; n—number of samples; yi—real value (conventional classification); ŷi—value foreseen by YOLO.
4. Discussion
During the YOLO training stage for identifying the seeds as objects present in the image and classifying them as germinated seeds or nongerminated seeds, the backpropagation methodology was used. This methodology is a training algorithm for neural networks that defines the real error as the difference between the expected error in the input of the information into its network and the actual value of errors in the output [
16], so if the real error is close to zero, it is indicated that YOLO has predicted the error in the image input phase.
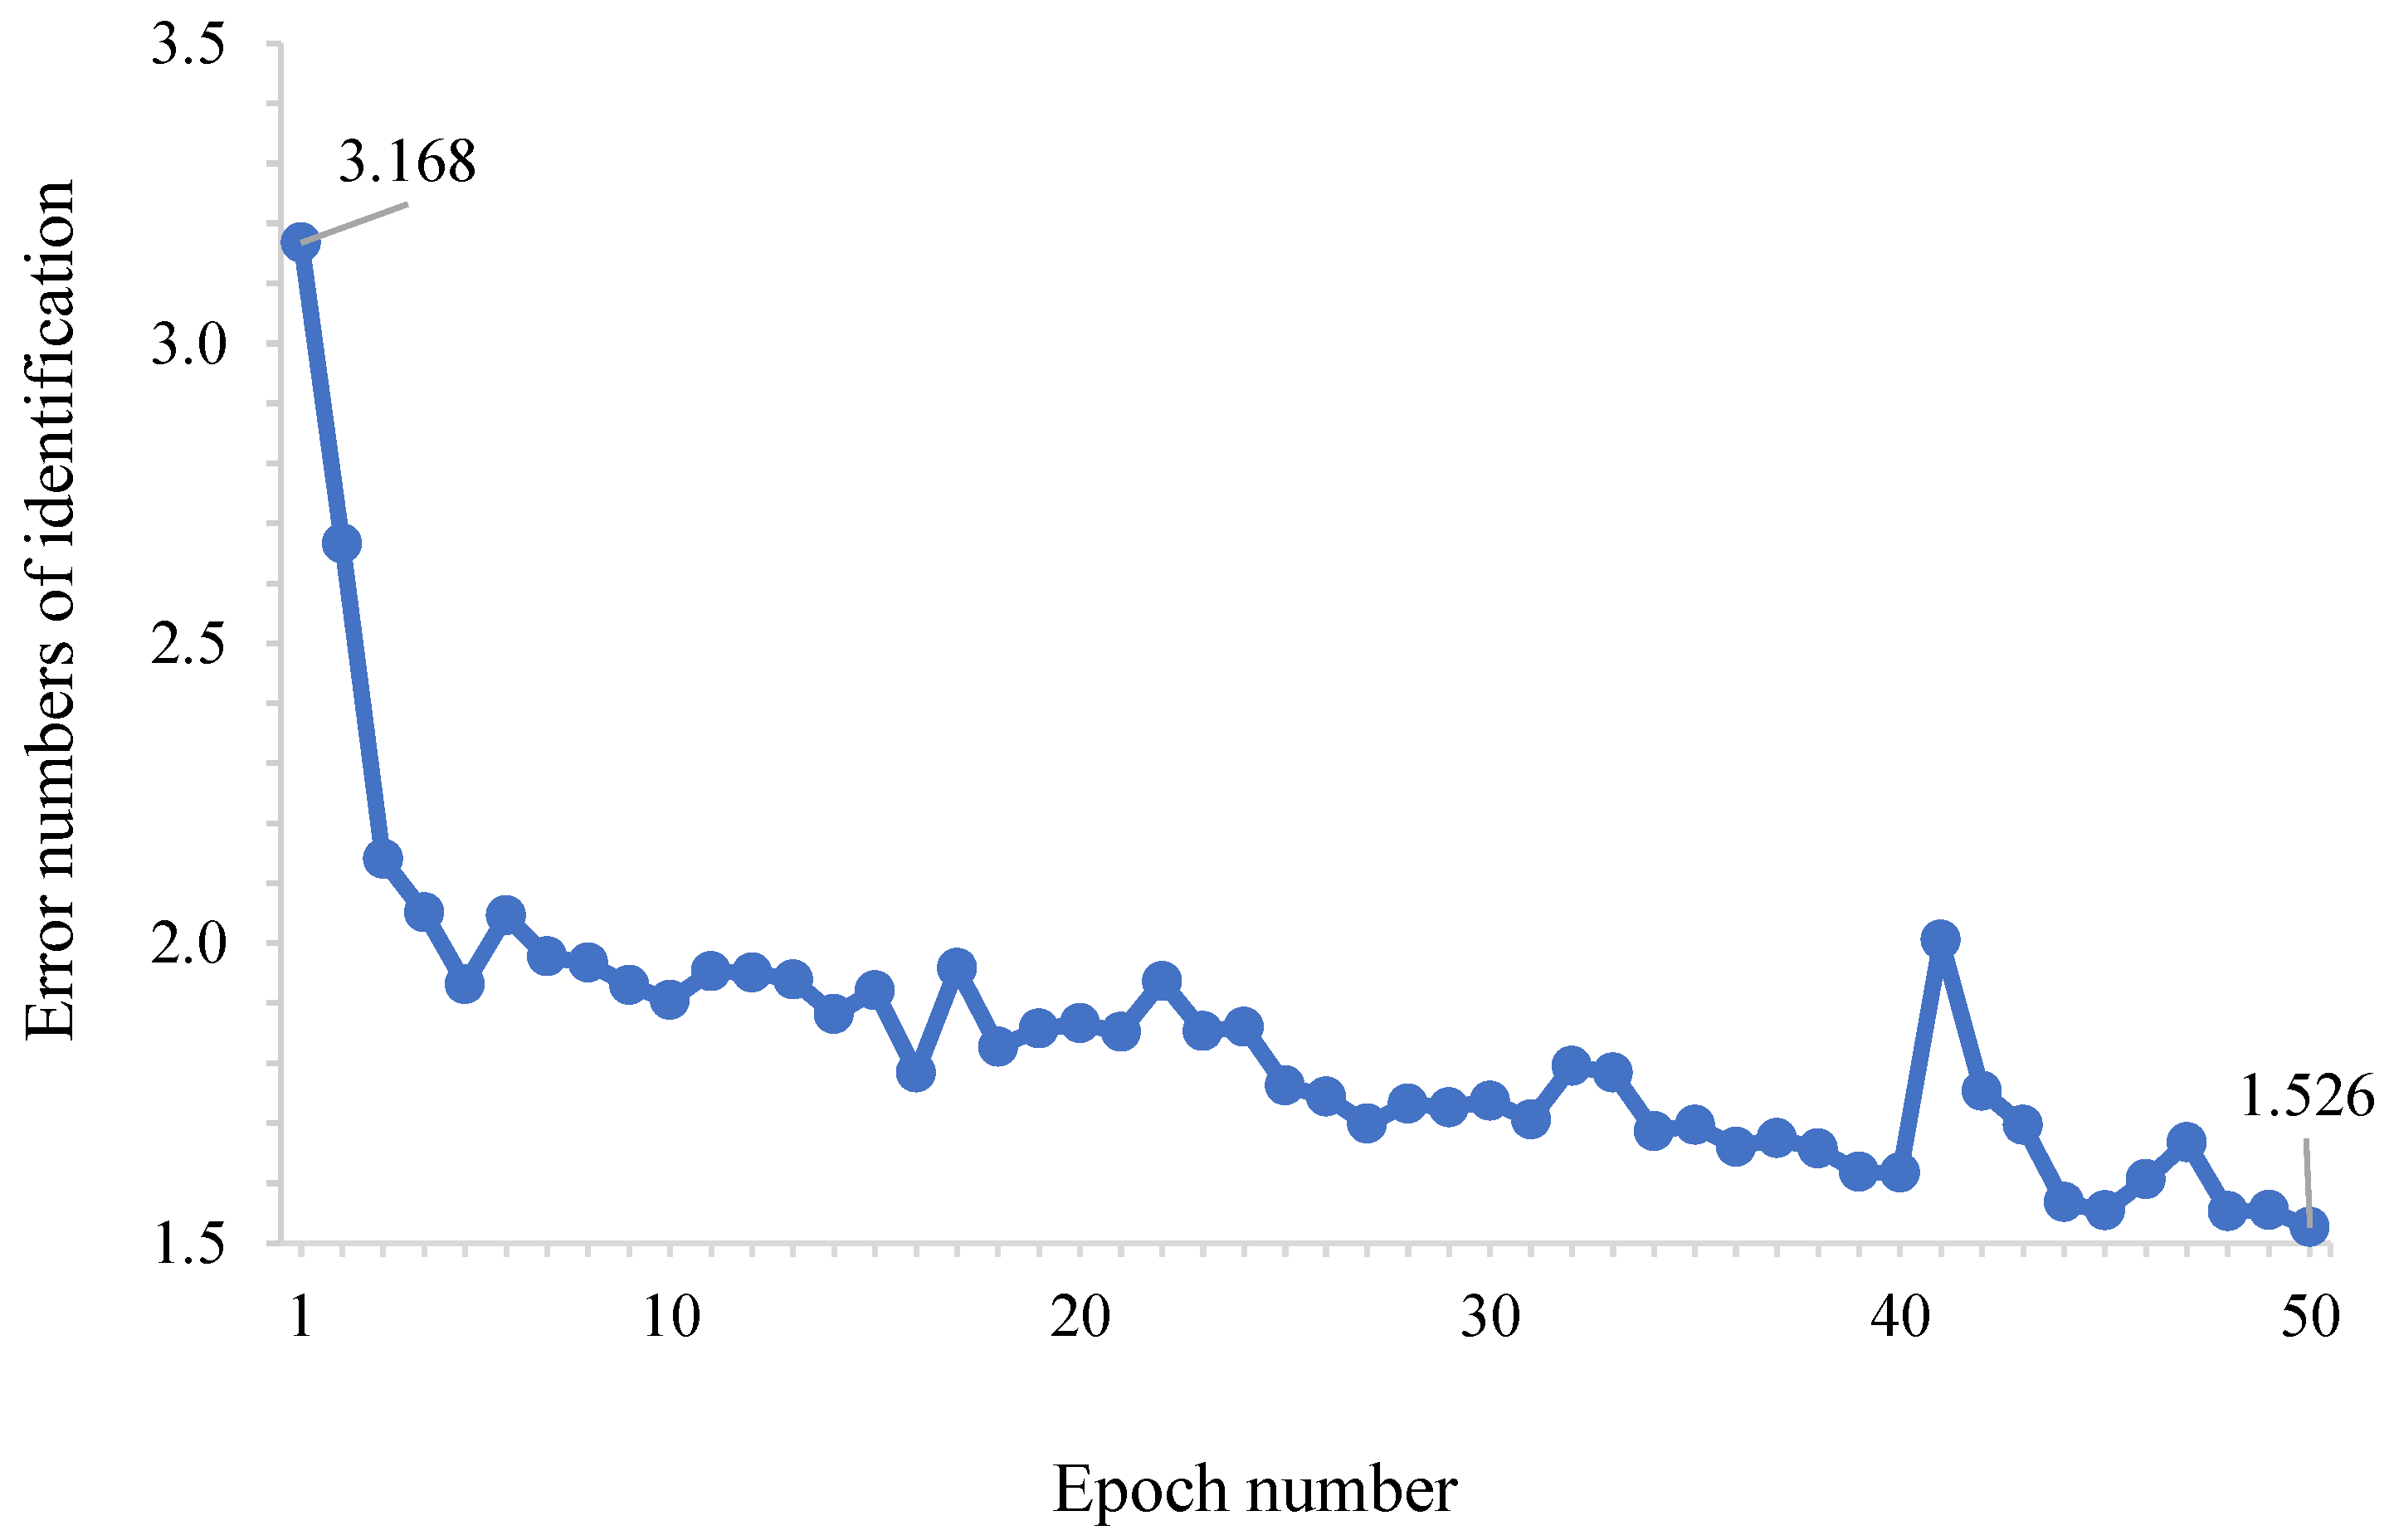
The results obtained in the stage of identifying the seeds as objects under study in the images (
Figure 3) were accurate but ineffective. Despite the accuracy of YOLO in identifying the seeds as objects of study in the images, there is no good accuracy, as there is a constant alternation between 1.5 and 2 real errors. These results corroborate those of [
17], who developed studies applying YOLO to detect objects on railway tracks and reported a decrease in errors over time, verifying YOLO’s ability to learn and estimate the real locations of objects in images.
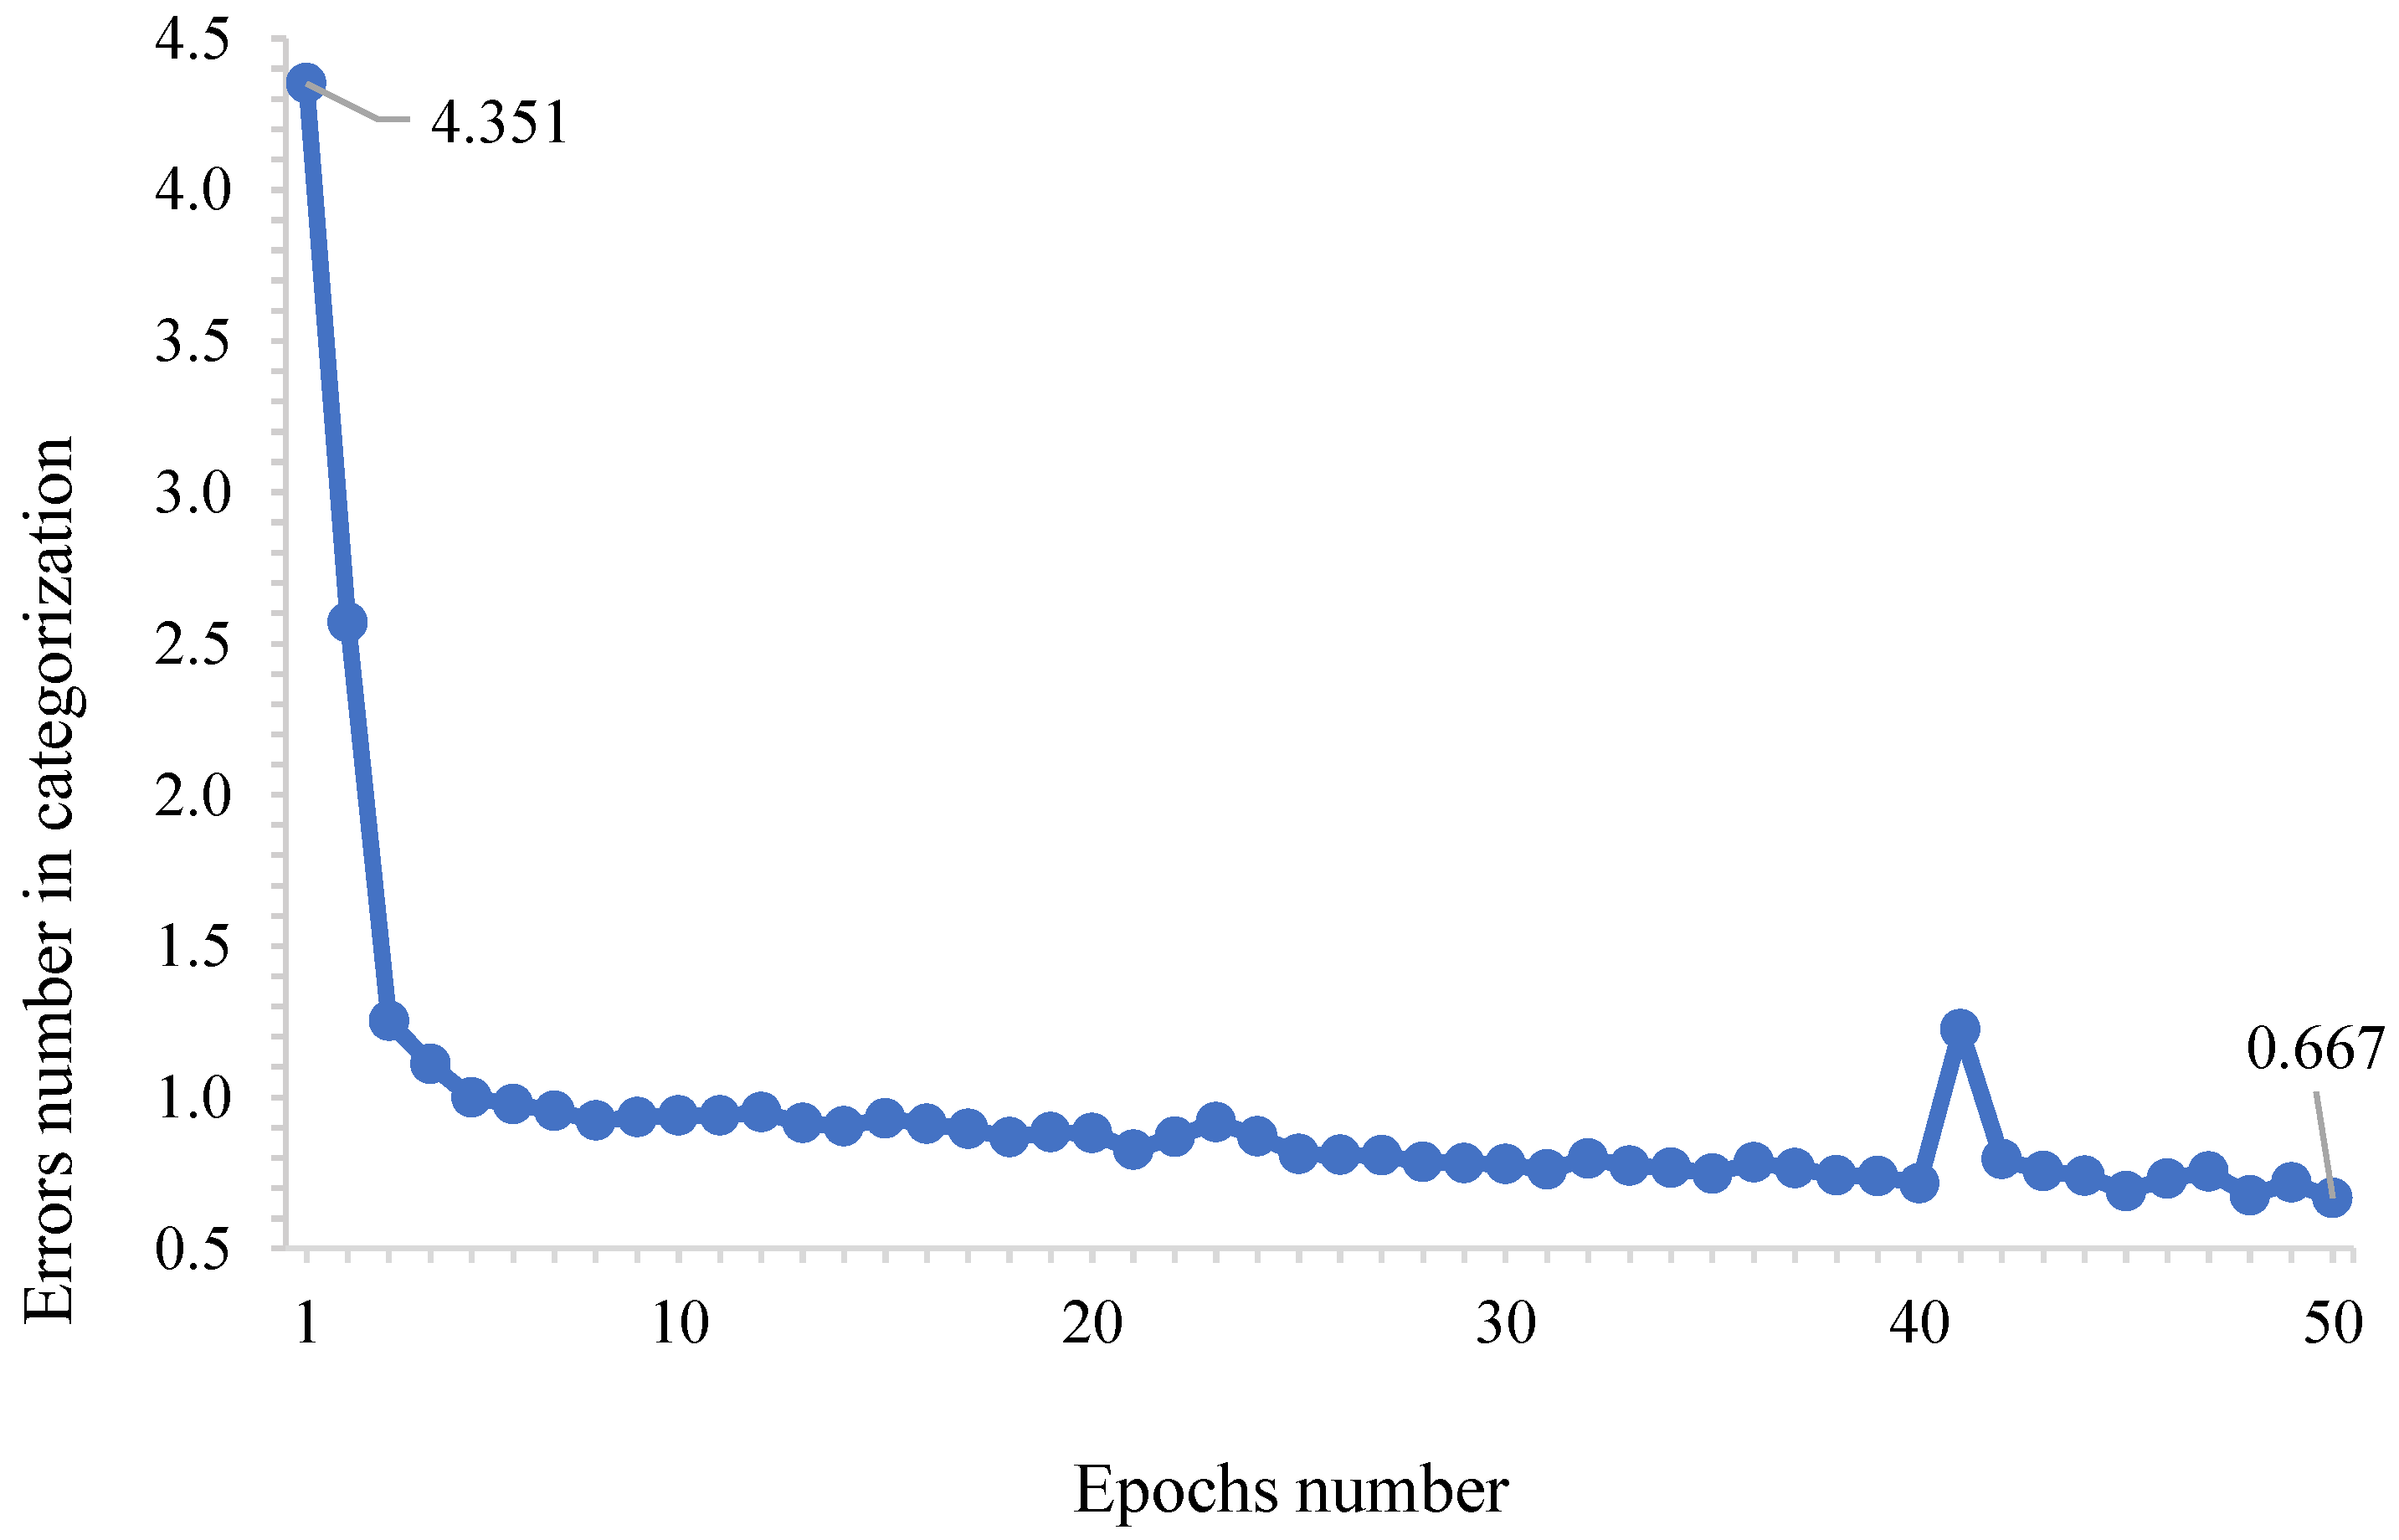
The values presented in
Figure 4, particularly their decrease, highlight the relationship between the class balancing performed by YOLO and the number of training epochs. These results are consistent with the findings of [
18], who, in their study using an enhanced version of YOLOv8n to accurately determine ripeness in pepper crops, observed a linear decrease over the epochs, ultimately recording a value of 0.2 at the end of the training phase.
With respect to the seed classification stage, YOLO, in addition to the precision already demonstrated in the seed identification stage, was also accurate. The average number of real errors in the classification of seeds was 0.879, and the lowest value of real errors recorded was 0.667 in the fiftieth season. In view of the linear trend (
Figure 5), the feasibility of the YOLO training process for object classification of seeds, in the case of the study, is evident. These values contribute to the study by [
19], who determined the accuracy of the YOLO classification for different fruit species, with an error ranging between 0.001 and 0.005 in one hundred analyses.
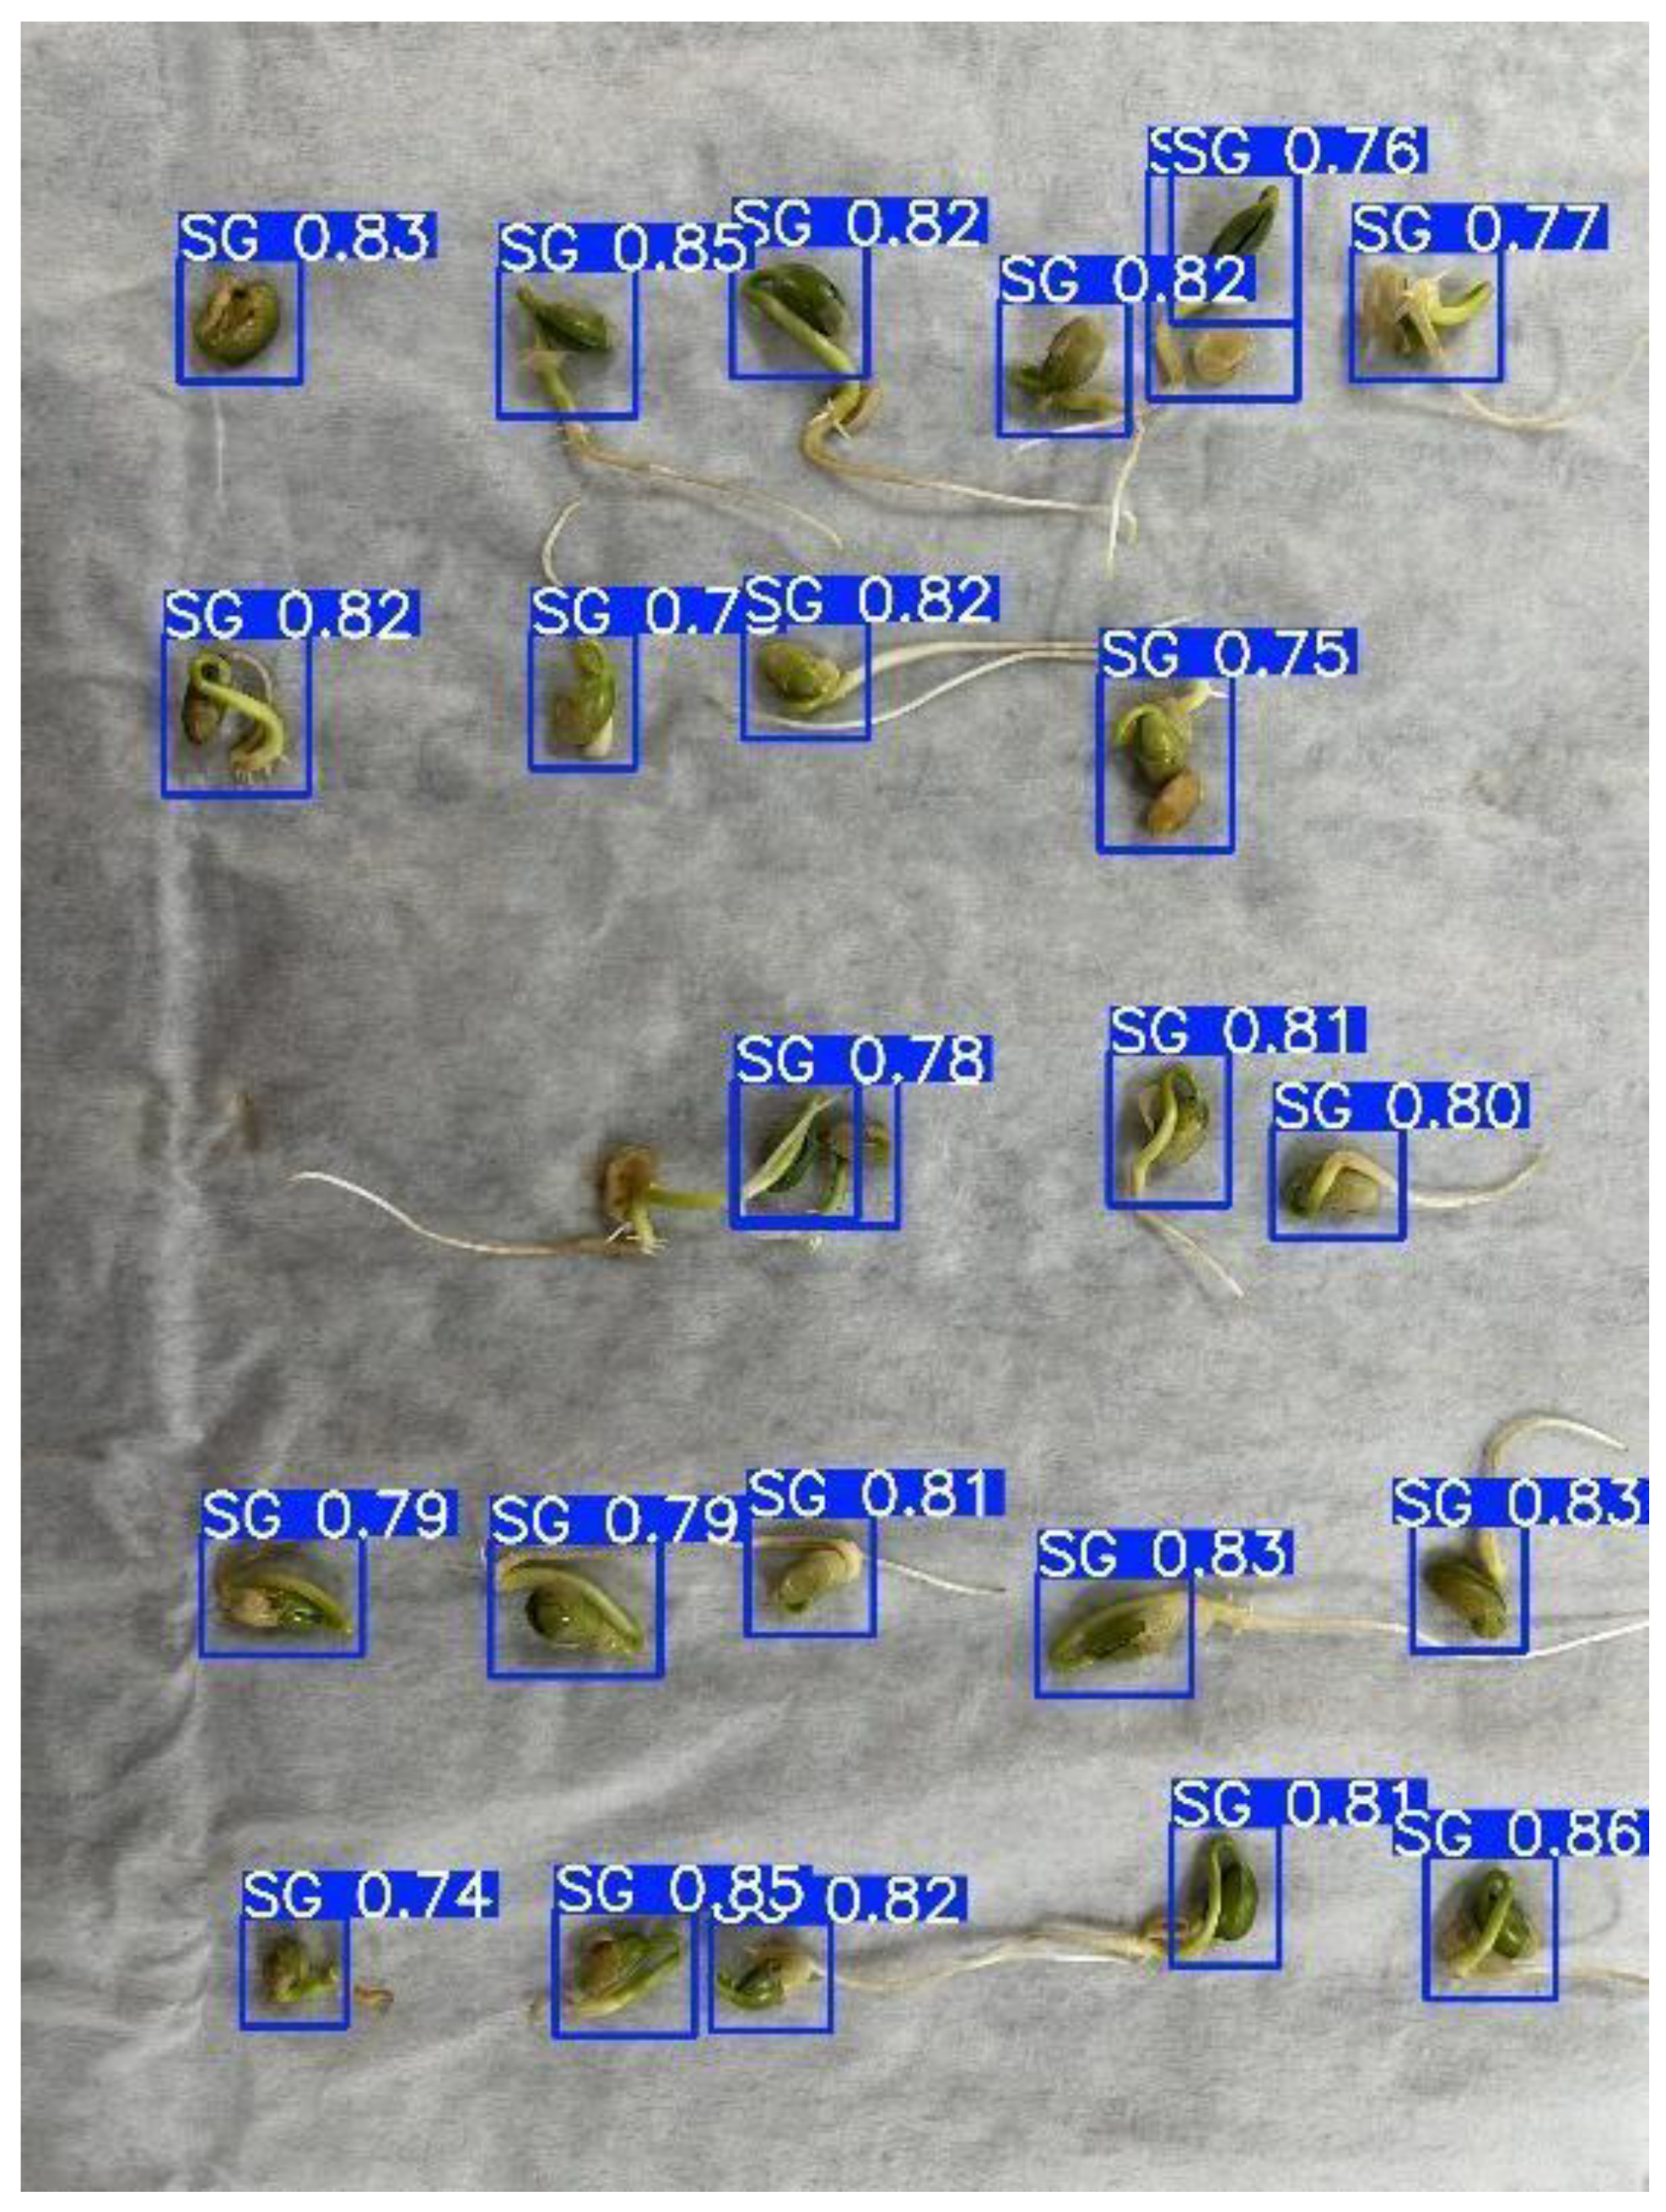
YOLO delimited all the germinated seeds and presented a high rate of reliability in its choices, alternating between 74% and 86% confidence in its classification (
Figure 6), thus validating the previous training stages. The results obtained in this study were similar to those of the study by [
20], which demonstrated the efficiency and reliability of YOLO, which presented between 49% and 88% confidence in the identification and classification of peppers in images.
The efficient performance of YOLO resulted from its training phases, whose effectiveness was proven (
Figure 7), when the accuracy of YOLO reached 94.58% of correct answers in the classification of seeds as germinated or nongerminated. These values corroborated the studies by [
21], which reported more than 90% accuracy in identifying signs of ripeness in fruit species. This result supports the findings of [
7] in their studies aimed at optimizing the harvest of fruit species—specifically apple trees—by providing visual guidance to pickers and assisting in distinguishing between fruits, branches, and trunks. Their approach integrated YOLOv8s with an additional algorithm and compared the outcomes with other YOLO versions, including YOLOv8n, which achieved an accuracy of 97.3%.
However, its results attest to the need for a minimum value of periods applied to training, owing to the regularity presented after the twentieth period (
Figure 7). This minimum standard of applied seasons aims at greater precision and efficiency in seed classification, similar to [
22], who defined the minimum number of learning times as a critical factor for YOLO.
The results represented in the confusion matrix (
Figure 8) demonstrate the accuracy of YOLO in categorizing soybean seeds in relation to the initially predicted balance and the actual output values. There was greater efficacy for classifying germinated seeds (95%); however, for nongerminated seeds, this value remained very close (93%), which indicates the efficiency of YOLO in classifying seeds. In addition, there were 1% errors in the classification of germinated seeds as nongerminated and 4% errors in the classification of nongerminated seeds as germinated. These results are consistent with those of [
23], who used YOLO as a tool for classifying rice, pea, soybean, and wheat seeds.
These results are similar to the values presented in current studies obtained by [
24], who applied YOLOv8n to identify corn crop seeds and categorize them into germinated, abnormal, or nongerminated seeds and were successful, presenting 95% correct answers in the classification of germinated corn seeds and 95% nongerminated corn seeds, in addition to 73% abnormal seeds. These data corroborate the results of the present study, validating them when compared with recent studies.
However, the main error rate presented by YOLO was when 5% of germinated seeds and 3% of nongerminated seeds were related to the background of the image, similar to the study by [
25], where, when YOLO was implemented for the detection of citrus fruits in orchards, the software defined 24% of the fruits as the background of the image. However, this definition of 5% of germinated seeds and 3% of nongerminated seeds as background may have been due to the reading carried out by YOLO in another phase of its processing, considering that the predetermined labels also include the background of the image, causing YOLO to count pixels referring to the background (germination paper) in labels of germinated and nongerminated seeds. This fact is also explained by [
26], who, when applying YOLO for the detection of license plates, paid attention to the possibility of the software confusing the plates with other objects present in the image because the labels are reduced.
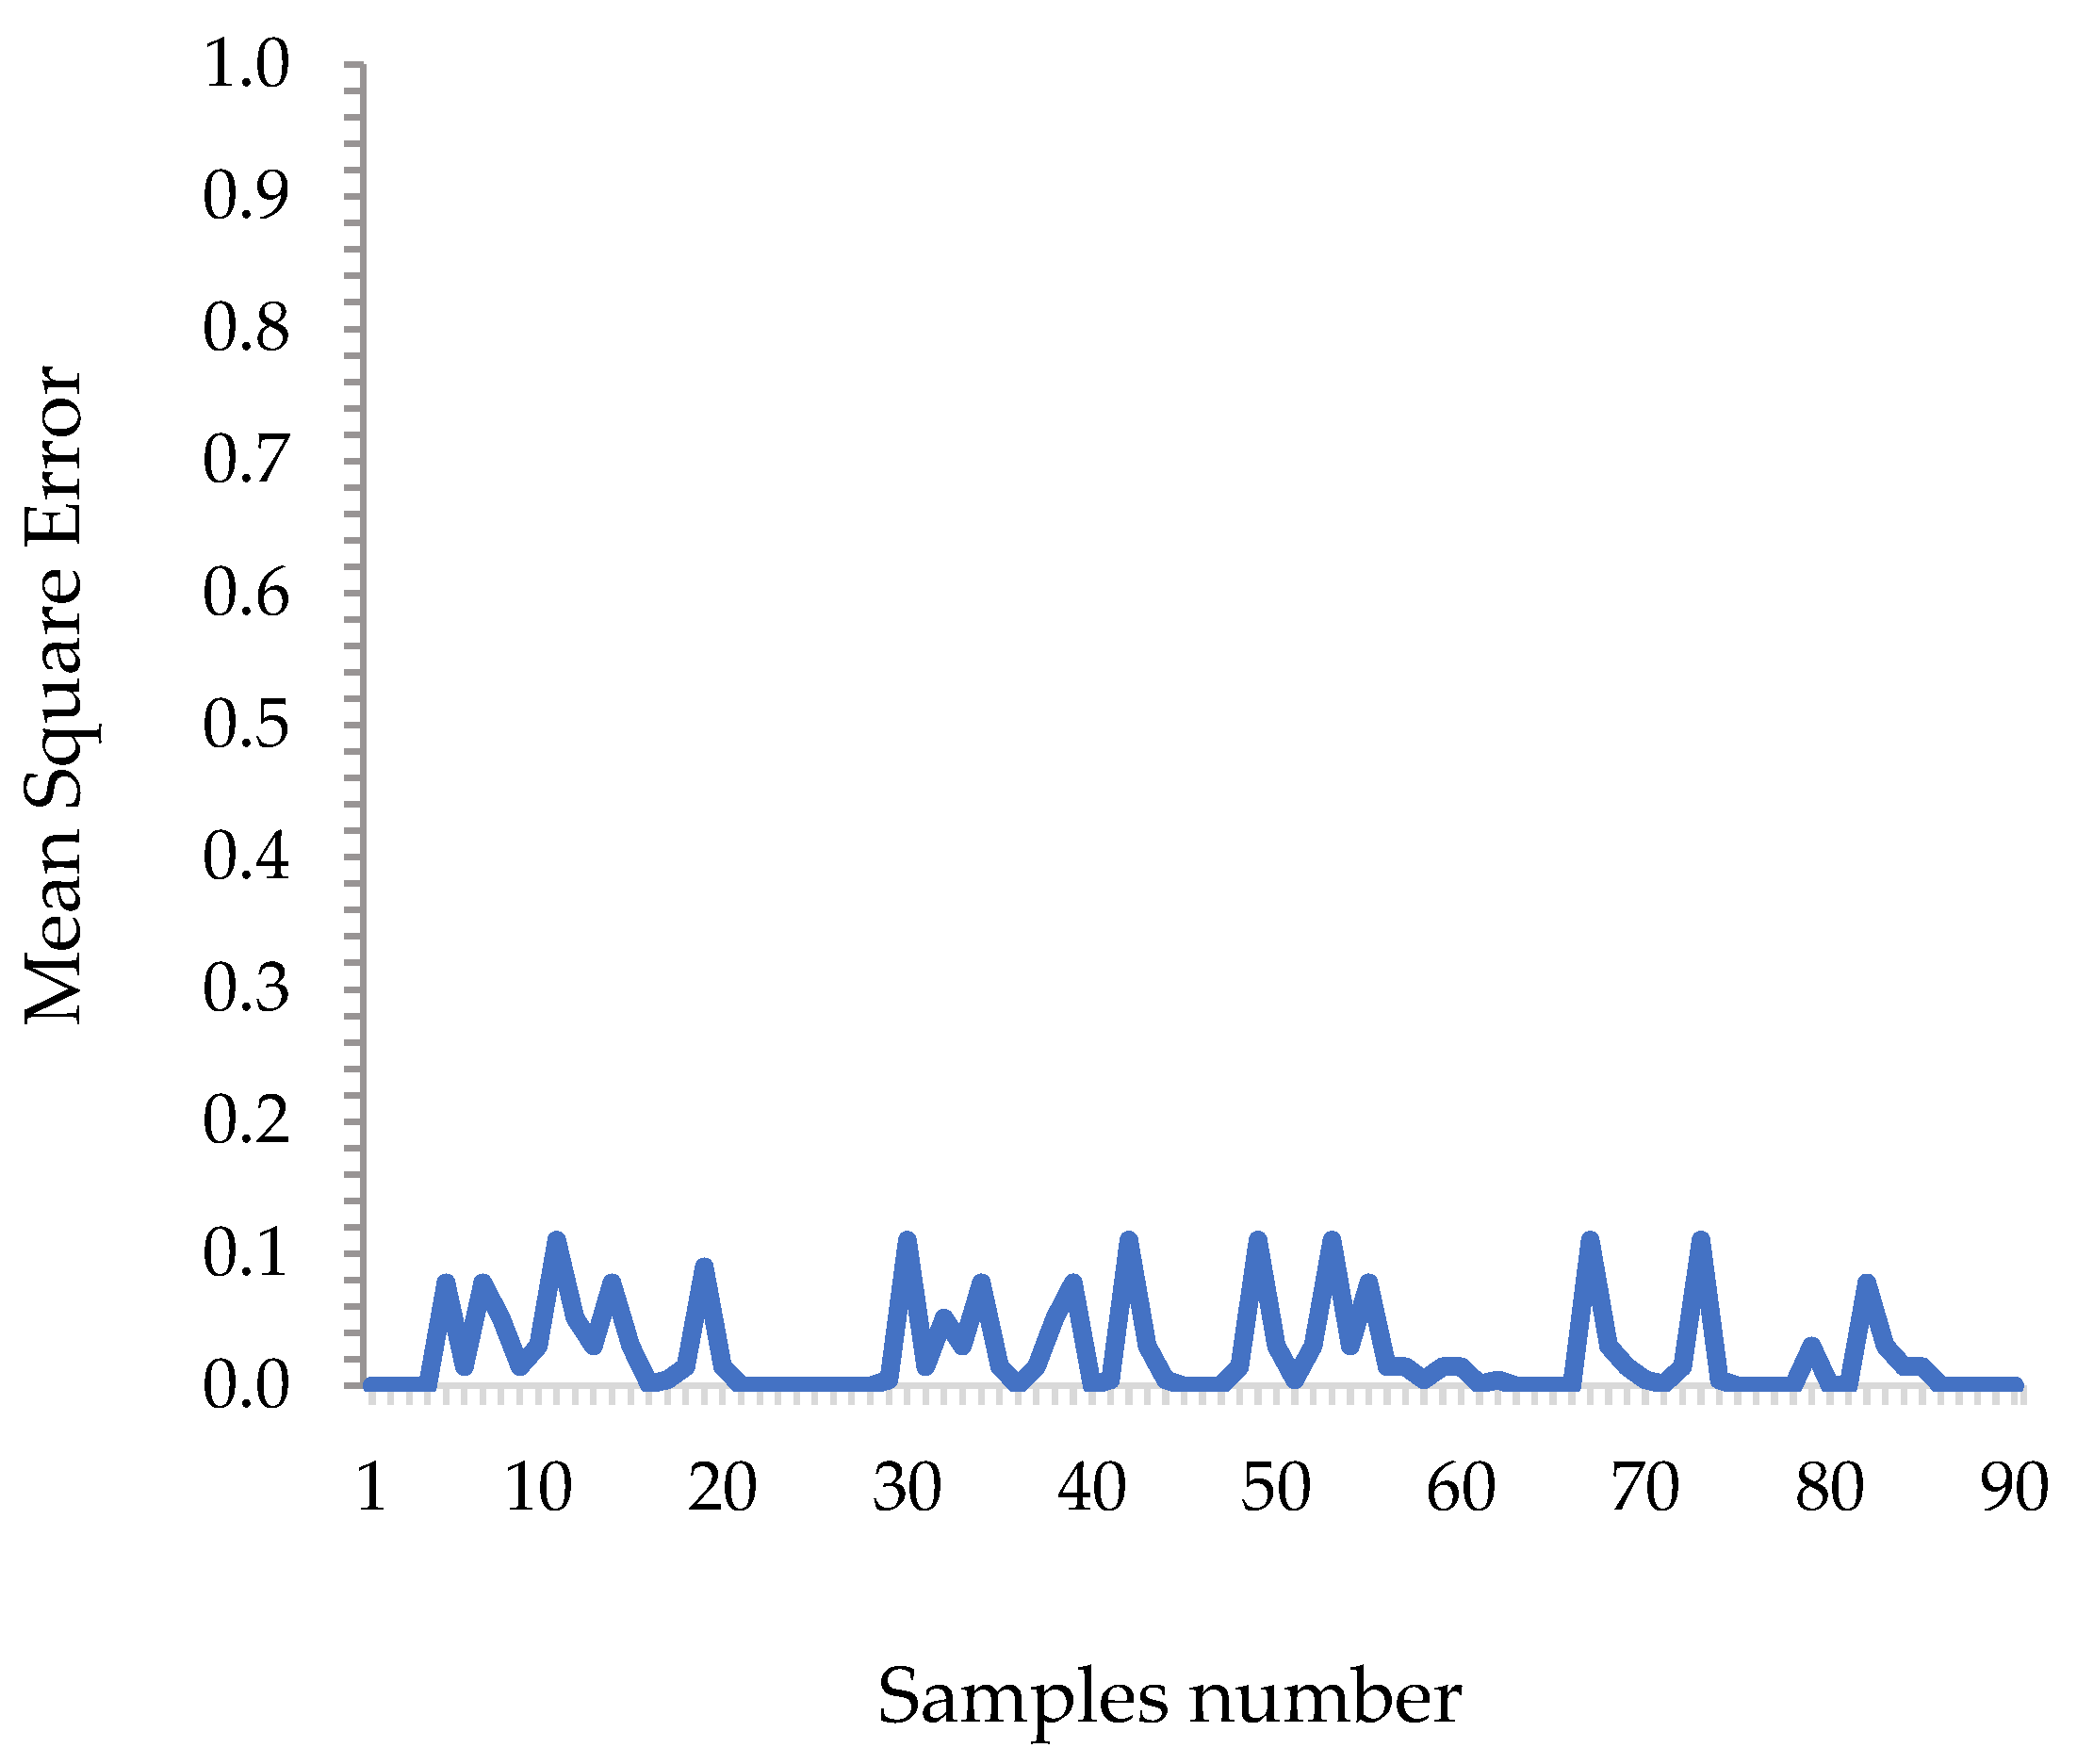
The proximity of the mean squared error values to zero (
Figure 9) supports the assertion that the YOLO algorithm has precision, considering that the YOLO algorithm presented a mean MSE value of 0.015 errors, in addition to 35.5% of the samples presenting a value equal to zero. According to [
27], values close to zero imply that YOLO works with precision, whereas values far from zero imply the opposite. Like [
28], who applied the root of the mean square error to compare the performance of different versions of YOLO in detecting impurities in cotton samples, they affirm the tool’s accuracy, as they find values close to zero.
Other studies have integrated the mean squared error metric to make it possible to compare a custom YOLO model with the basic version in terms of flower and flower bud counts [
29]. Thus, the accuracy and precision of YOLO make it an auxiliary tool in the conventional classification process, which in turn can be subjective and time-consuming.
Thus, the practical application of YOLO in laboratory environments, genetic improvement programs, and seed processing units shows promise, especially for its automation capacity, speed in analysis, and reduction in human subjectivity. The implementation of this technology can represent a significant advance in the standardization and efficiency of germination tests, contributing to more accurate decision making in the agricultural sector.
For future studies, expanding the database to include different soybean cultivars and germination conditions and evaluating the robustness of the model in uncontrolled environments and with visual noise are recommended. In addition, investigations that integrate YOLO with other computer vision and deep-learning approaches can further increase the accuracy and adaptability of the system in diverse operational contexts.
5. Conclusions
The YOLO application as a method for identifying germinated and nongerminated seeds was effective, with a peak of 94.58% accuracy in seed categorization. In addition, a stable learning line from 20 periods of study is presented.
The comparison, via the mean square error methodology, of the YOLO results to the results obtained by the conventional method of seed classification, performed by humans, presents a low margin of prediction error. Thus, the validity of YOLO as a tool applied to seed classification is evident. However, there are possibilities for improvement, especially in the capture of images and in the process of identifying the object of study.
Thus, the use of YOLO for the classification of soybean seeds for germination is highly effective, with consistent performance and comparable to, or even superior to, traditional methods, which makes it a promising tool for automating analyses in the agricultural sector.


