1. Introduction
The use of anti-insect nets in the openings of greenhouses and nurseries is widespread and allows, among other constructive solutions, the reduction in the use of pesticides. For this reason, Directive 2009/128/EC—which aims to achieve a sustainable use of pesticides promoting the use of Integrated Pest Management (IPM) and of alternative approaches or techniques, such as non-chemical alternatives to pesticides—recommends the use of anti-insect nets.
The air permeability properties of the covering material influence both the ventilation performance, alongside buoyancy and convective phenomena [
1], and the aerodynamic effects resulting from the structure’s geometry [
2,
3].
Insect-proof nets are characterized by having a very small pore size (less than 1 mm × 1 mm) and, consequently, very low porosity values (ε < 25%) that determine a variation in the microclimate below the protection in terms of an increase in the relative humidity, a reduction in air ventilation, and a temperature rise that can become harmful to cultivation. Furthermore, the low porosity of the net negatively affects the impact of wind action on the structure, increasing the stresses on it. Porosity (ε) is a parameter used to describe the ratio between the surface area of the voids and the total surface area of the net. It can be determined through mathematical relationships—if the structure of the net is very simple, consisting of one warp thread and one weft thread—or through image analysis [
4,
5]. The simplicity of determining this parameter often leads to its frequent use, although sometimes improperly, as a descriptive element of the general characteristics of the fabric.
The evaluation of porosity through its orthogonal projection corresponds to considering the surface of the net as planar, without accounting for the complexity of its three-dimensional structure. Recent studies have addressed the effect of the three-dimensionality of the weave of agro-textiles, introducing the concept of 3D porosity and other parameters such as constricted factor and tortuosity [
6,
7,
8,
9]. In these studies, 3D porosity is associated with simplified models that involve types of nets made of one warp thread and one weft thread (flat or Italian woven) that are quite common in agriculture but are not yet capable of describing the behaviour of more complex but widely used weaves in agriculture, such as woven fabrics (English or leno) where two warp yarns are woven around the weft yarns, knitted fabrics (Raschel), or all cases where the threads are replaced by polyethylene strips.
The air permeability of agro-textiles depends on numerous factors such as the diameter of the wires, the thickness of the screen, the pore surface, the porosity, and the air velocity [
10].
The relation between the porosity and loss coefficient, related to pressure loss, is considered as a standard approach and has been widely studied in the literature [
11,
12,
13,
14,
15,
16,
17,
18].
Despite the numerous studies, the proposed models still seem to differ significantly. These differences can be attributed to the determination of the geometric characteristics of the nets, the different types of setup employed to study the pressure drop through the screens, and the different ranges of air velocity tested.
The fluid dynamic behavior of the porous media is studied not only through laboratory tests, such as those using wind tunnels, but also through fluid dynamic simulations [
19,
20,
21,
22,
23,
24].
As previously mentioned, despite the numerous publications, a “universal” correlation between the geometric characteristics of the net and its air permeability has yet to be determined. In this context, the more extensive the laboratory experiments, the more data will be available for researchers to calibrate more complex computational models.
Regarding this aim, as part of the Project “PON POFACS—5.10 Baby leaf grown under insect nets with different air permeability and radiometric properties”, funded by the Italian Ministry for University and Research (MUR), the air permeability coefficients of 10 anti-insect nets were evaluated by means of a micro wind tunnel facility. The air velocity of the different samples was correlated with the pressure drop measured inside the wind tunnel, with the permeability coefficient characteristics of the sample obtained for each net. Finally, the reduction factor RF(ε) was calculated. This parameter can be considered as an estimation of the reduction in wind pressure acting perpendicularly on the surface of a textile due to the porosity of the net. For insect-proof nets, it is strategic to understand the correlation between the air flow passing through the net and its geometric characteristics to optimize the size of the holes, ensuring the anti-insect function is maintained as the air velocity increases, and to properly design the structure both from a structural and energy efficiency perspective.
2. Materials and Methods
2.1. Laboratory Devices
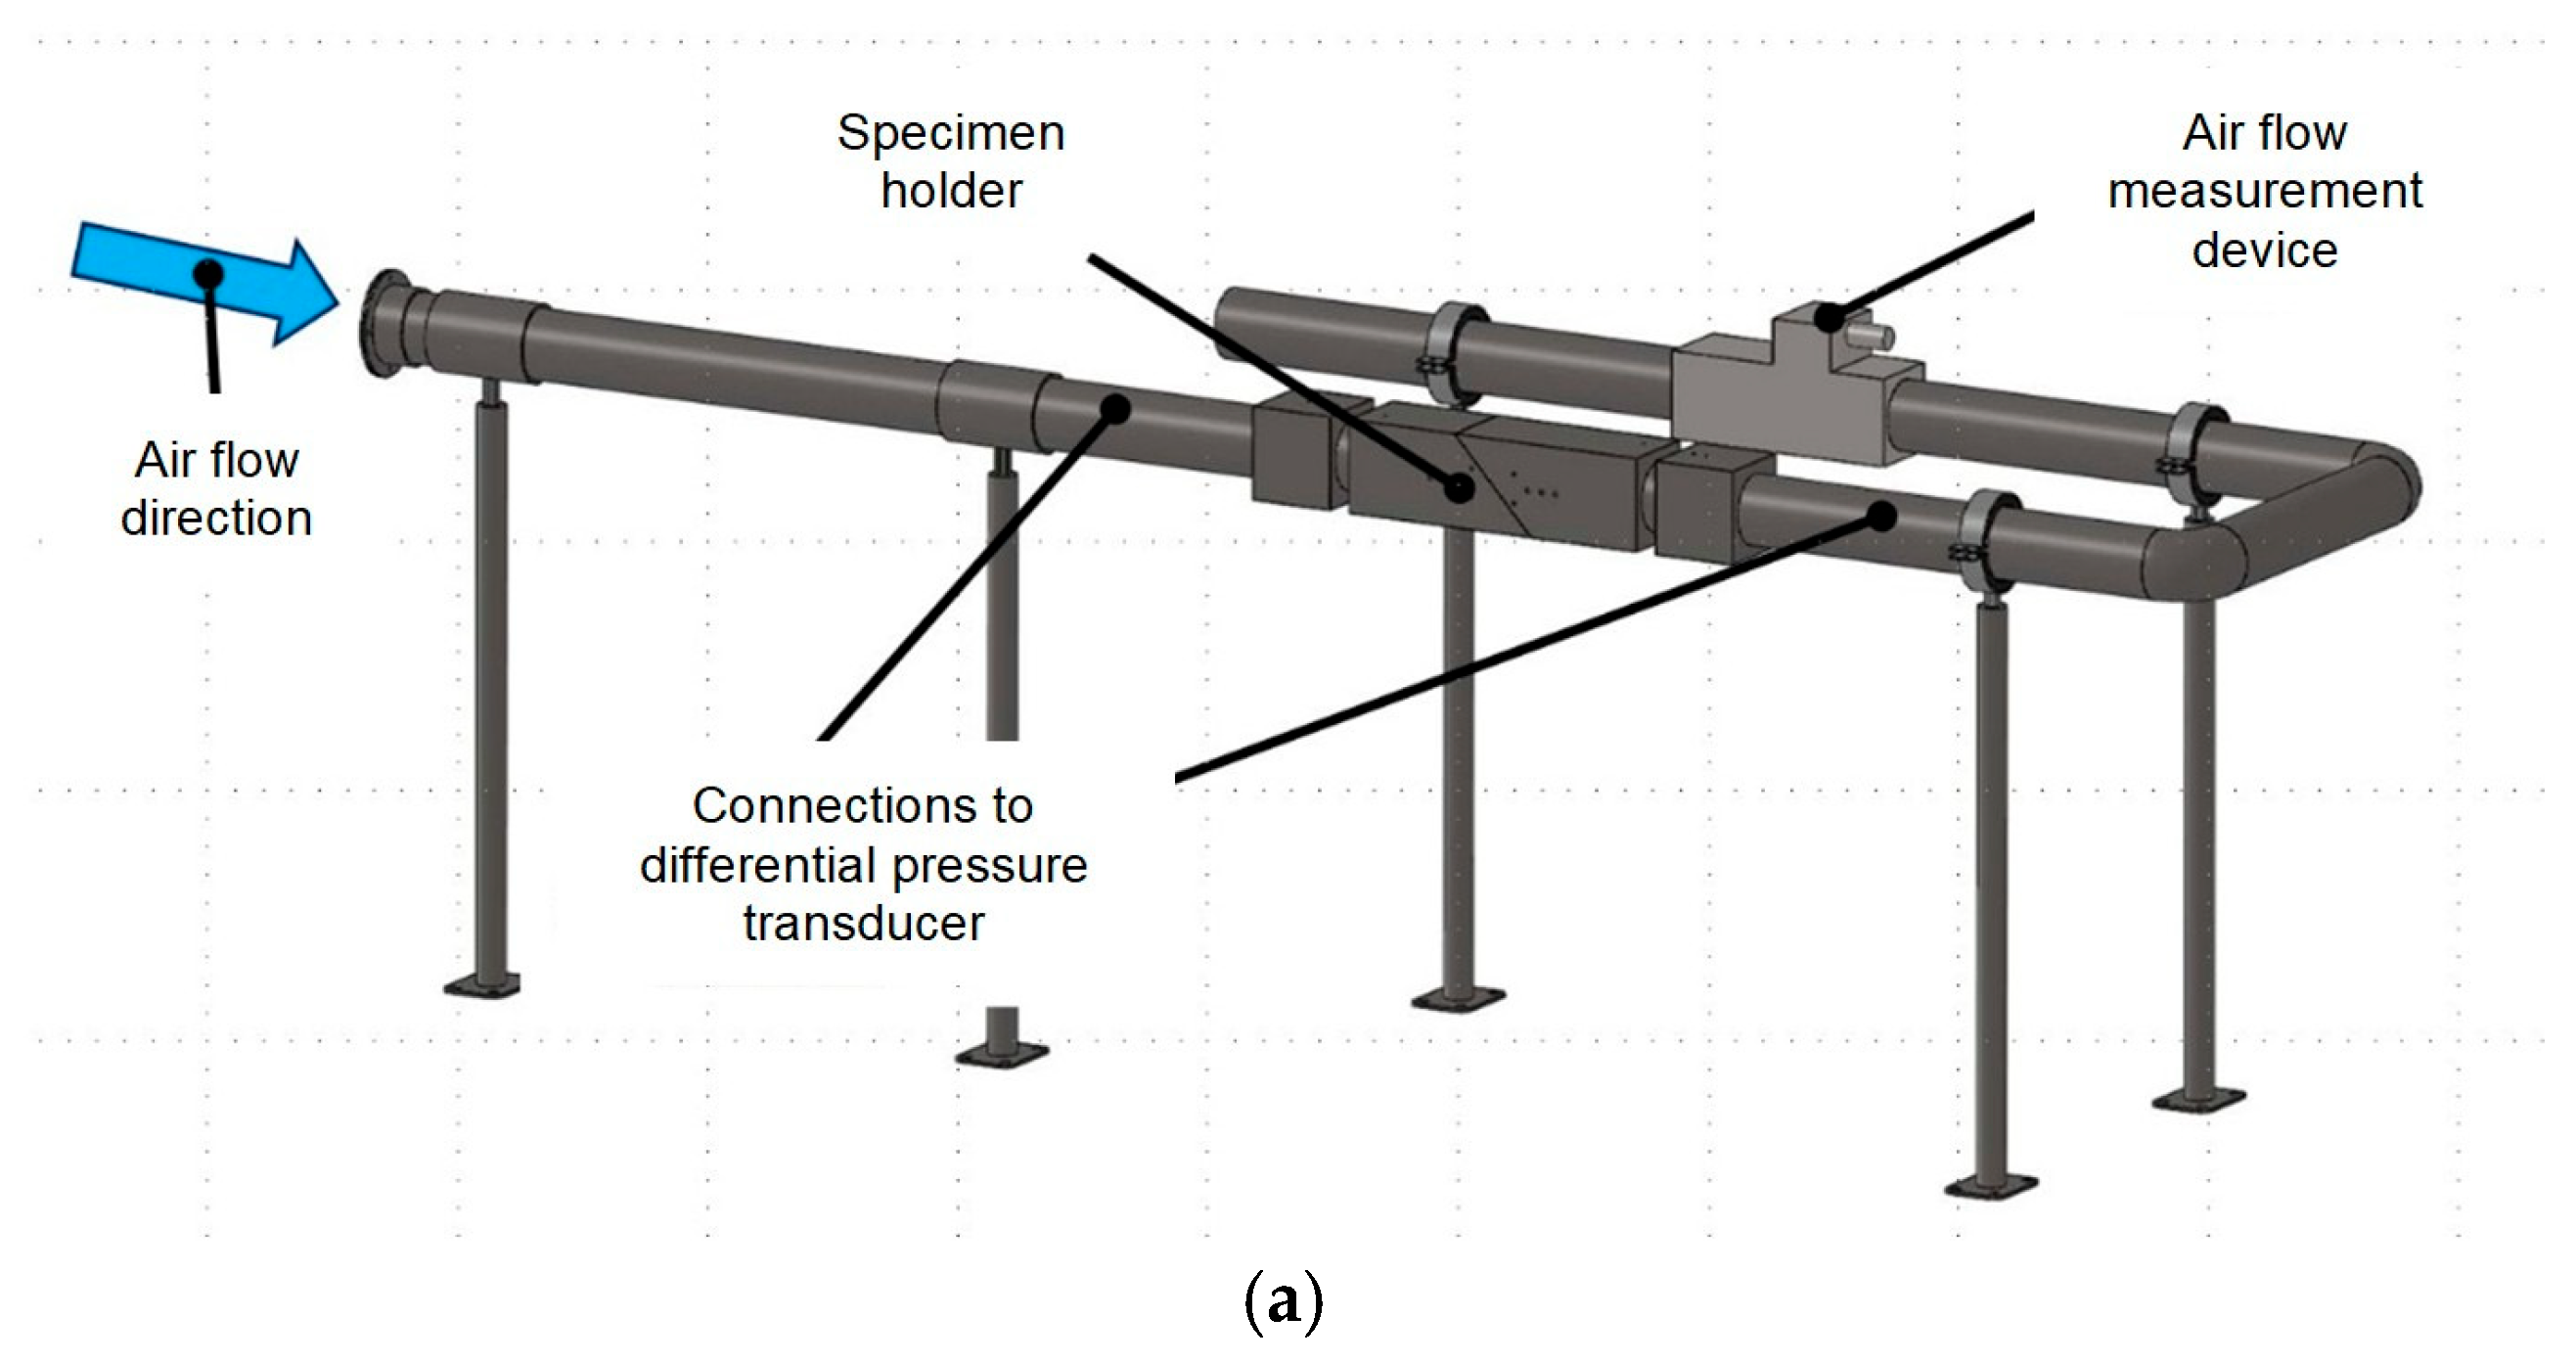
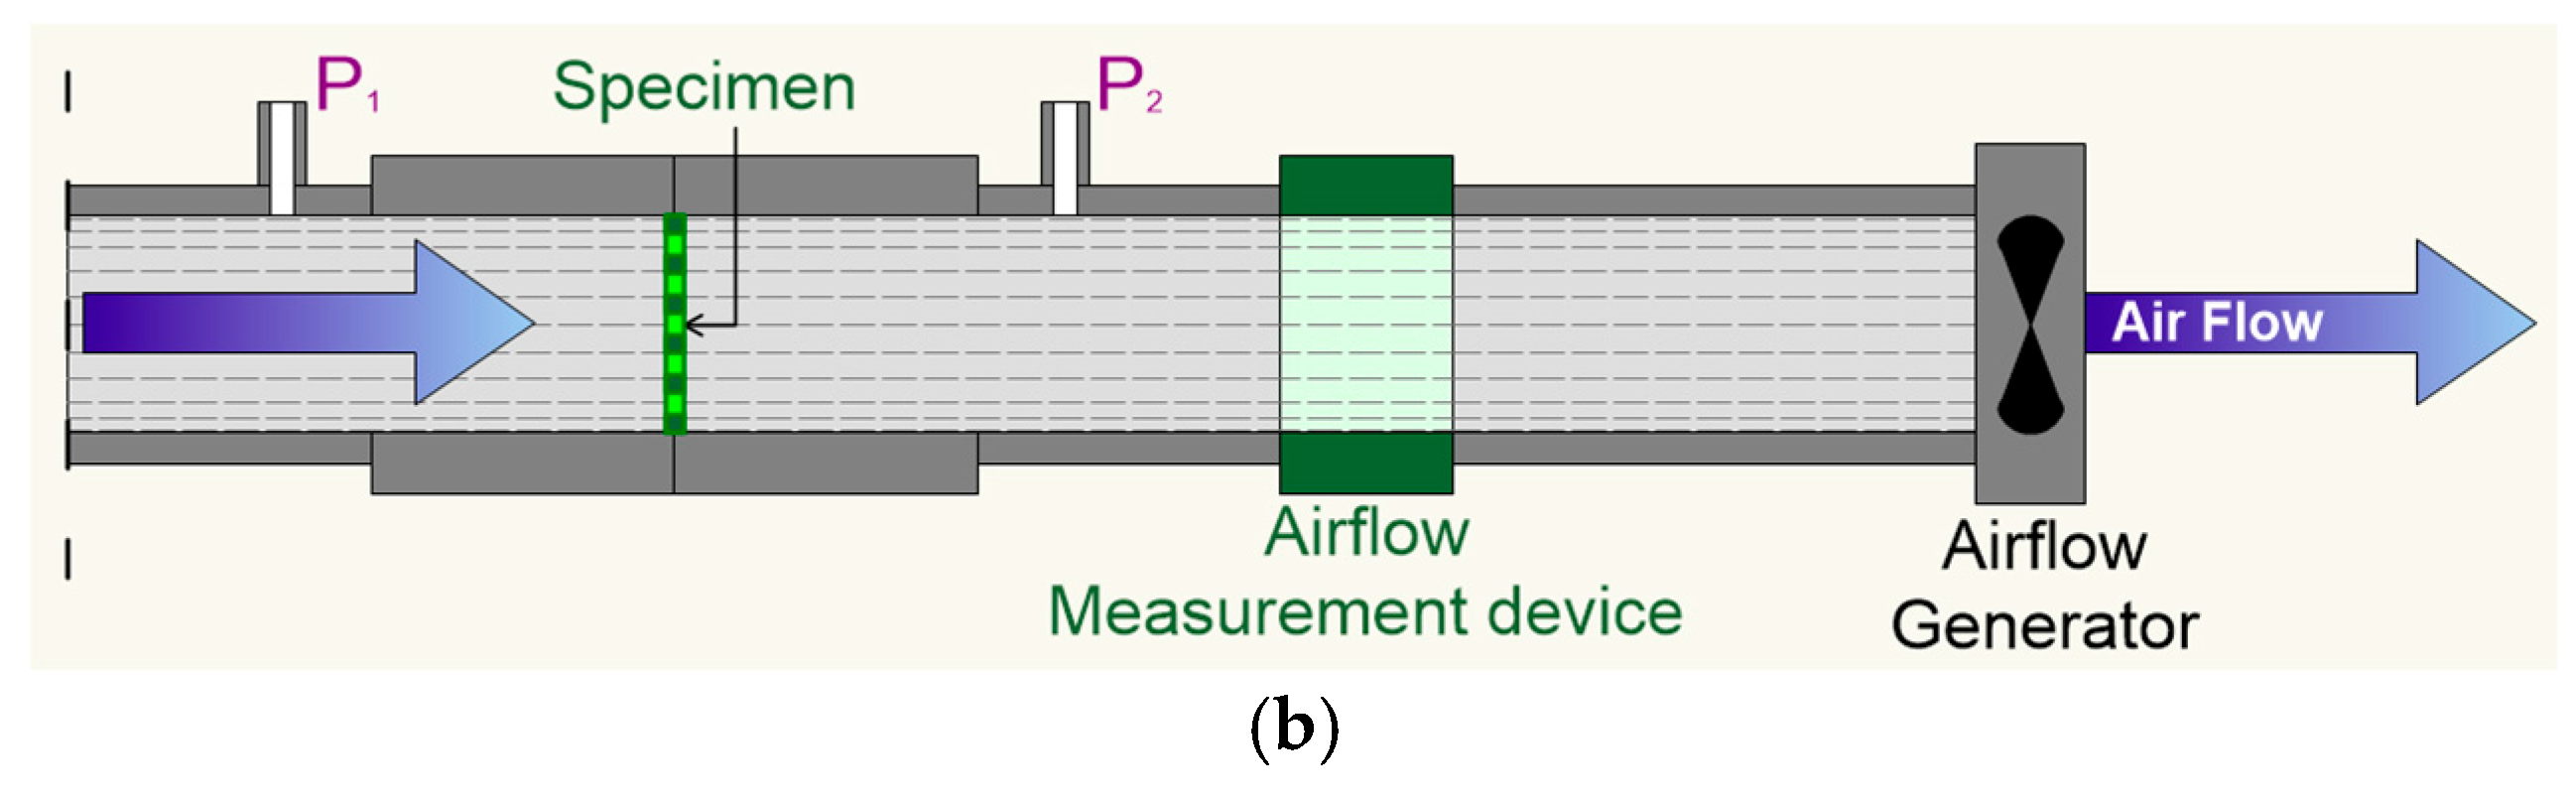
Air permeability tests were conducted at the “Testing and Engineering Laboratory” of Arrigoni SpA, an Italian manufacturer specializing in HDPE technical textiles. The experiments utilized a stainless-steel micro wind tunnel with a circular cross-section (D = 0.051 m) (
Figure 1 and
Figure 2). The pressure drop across the fabric specimen, measured between the upstream and downstream sections, was recorded using an Aerofiltri MOD. MM200600 manometer capable of detecting pressure differences within the range of 0–200 ± 5 Pa. The air flow rate passing through the wind tunnel was measured with a digital air flow sensor (SMC mod. PF2A 721H, accuracy ±5 F.S.), placed in series with the net under analysis (
Figure 2). The velocity required for fluid dynamics calculations was subsequently determined based on the cross-sectional area of the tunnel. The air flow was generated by an industrial blower, model CIMME-Mediojet (2.2 kW, 300 rpm, pressure range −195/+185 mbar). The air flow velocity ranged from 5 to 15 m/s. Measurements of air speeds in the 0–5 m/s range proved to be unstable and statistically not significant. This low-speed range may be useful for studying “air passage through nets between the open and protected environments; higher values, on the other hand, are more meaningful for investigating structural aspects, which is the aim of this research.
To account for the roughness of the pipe’s inner surface, the distributed pressure drop was calculated using three measurements taken without the net sample at different air velocities. For each tested net, this distributed pressure drop was subtracted from the experimental data collected. The ambient temperature during the tests was maintained at 20 ± 1 °C, aligning with the sensor specifications.
Each net sample was tested three times, and the average value was considered for analysis. These averages were used to establish the effective relationship between the distributed pressure drop and the air velocity.
2.2. Tested Nets
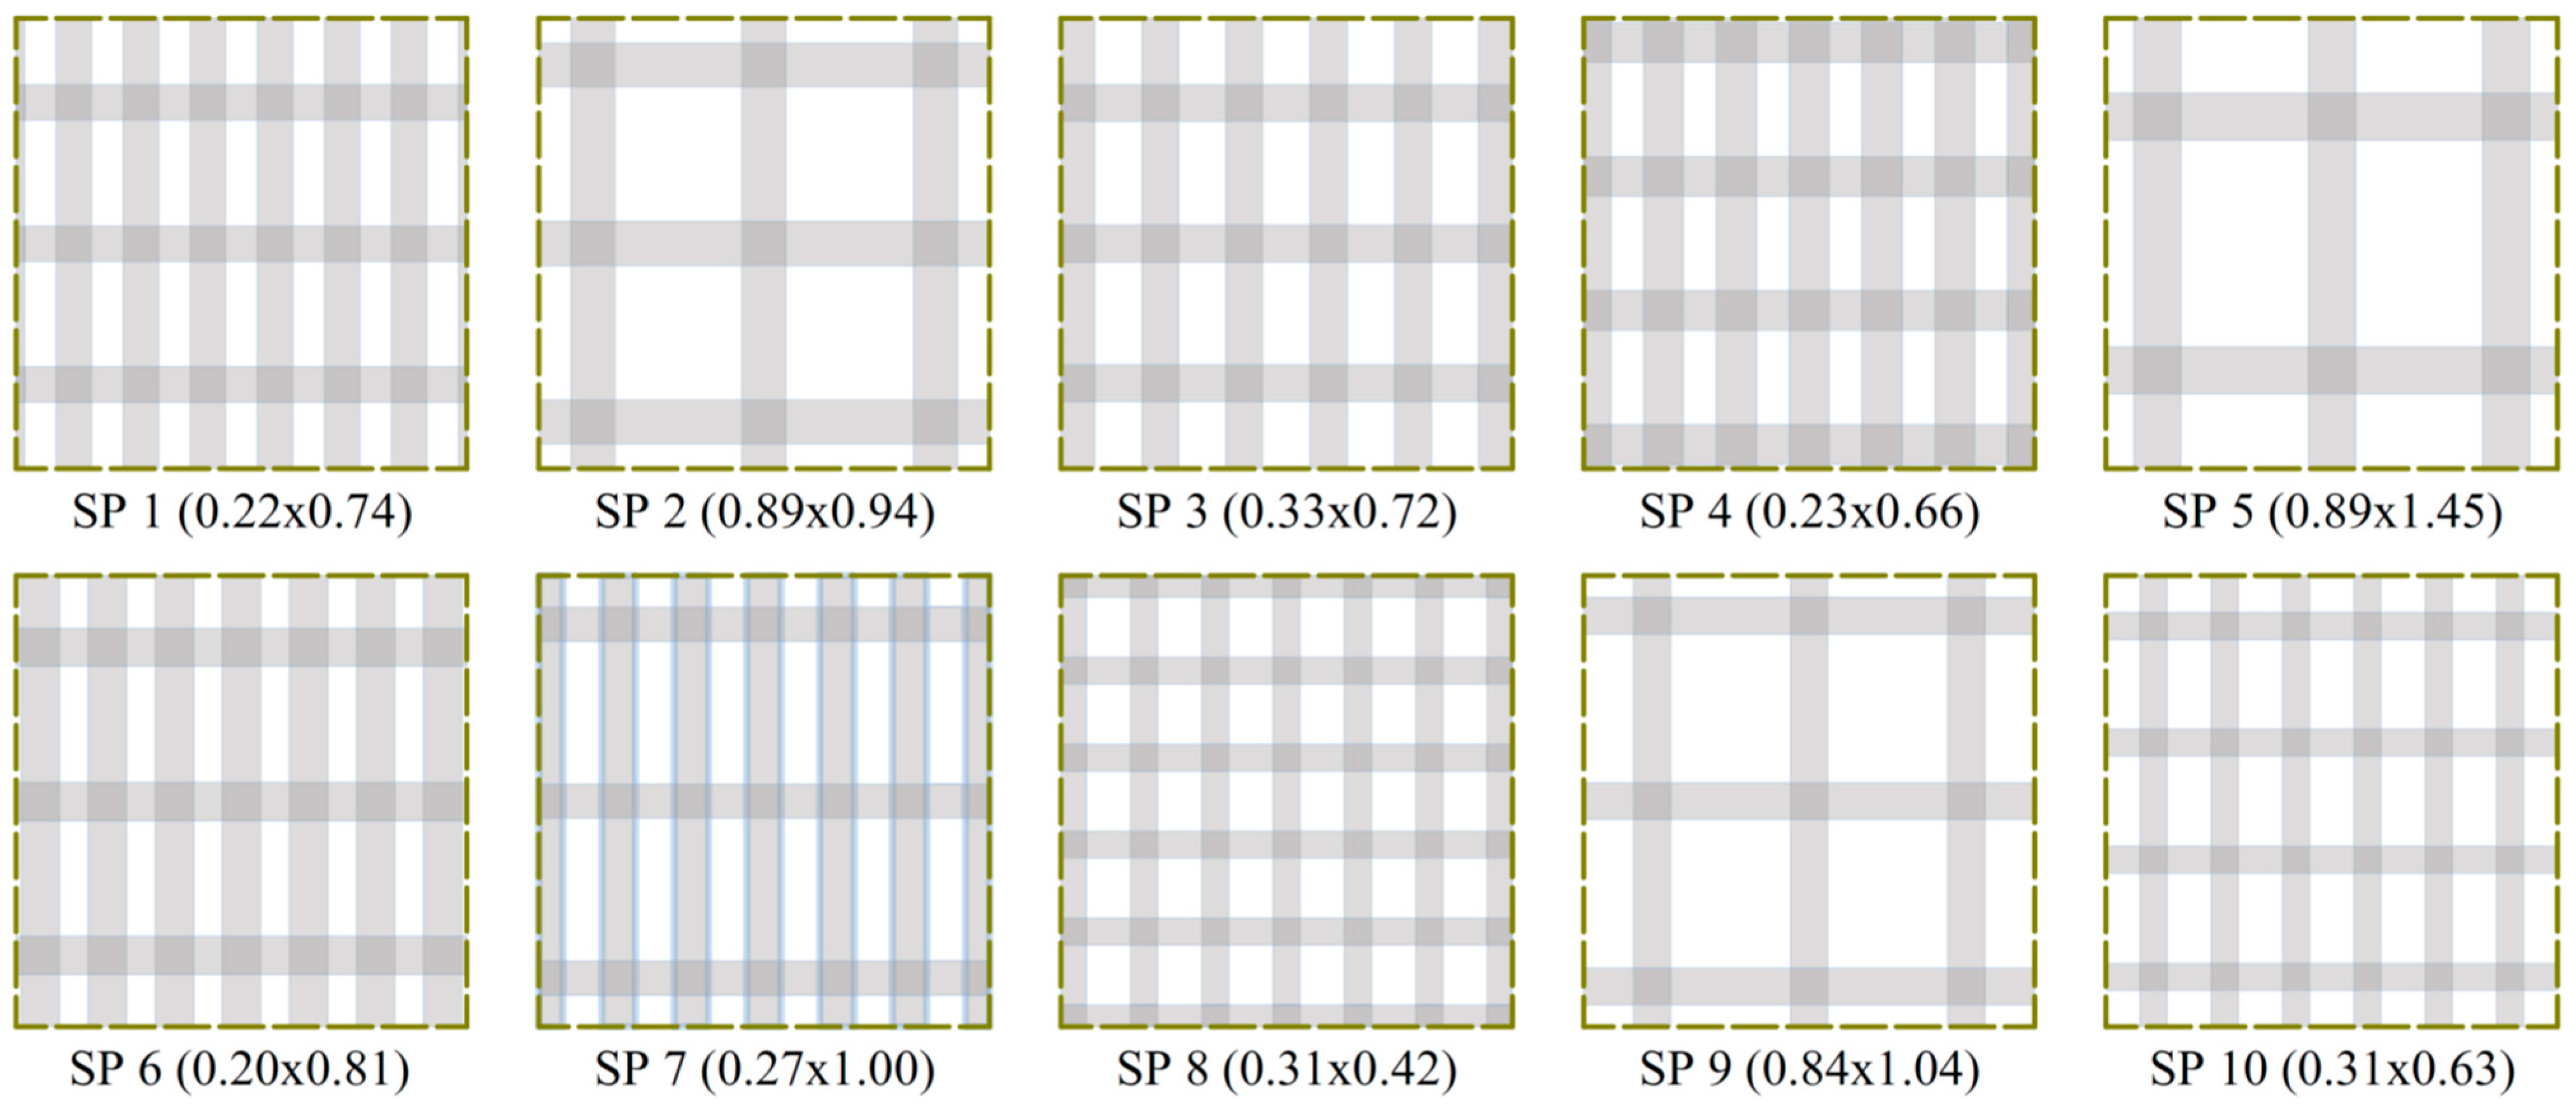
Ten samples of insect nets were collected from greenhouses where baby leaves were grown in the Apulia Region in southern Italy. All the samples collected have a flat weave with weft and warp monofilament HDPE threads (
Figure 3). All the nets have the same wire diameter for the warp and the weft.
The geometric characteristics of each net were measured: diameter of the warp and weft threads (
), hole size (
), elongation factor (
), porosity (
) (
Table 1).
The thickness of the threads was measured using a micro-meter with an accuracy of 0.01 mm. The void size was measured using images of the sample captured with a microscope (Dino-Lite AM3013T), utilizing the measurement tools of the Dino-Capture 2 software (accuracy at 200×: ±0.04 mm). The porosity,
, of the tested nets was estimated by image analysis [
5]. All tested net samples were scanned at a resolution of 2400 dpi by a commercially available image analysis tool (Adobe Photoshop, 2021). Images were converted into black (net) and white (empty). A representative area was selected from each image and the percentage of white pixels of the whole picture was evaluated by means of the same software. All measurements were repeated at least three times for each sample, using areas of different size, and an average value was obtained.
2.3. Models for Fluid Flow
In the literature, air flow characteristics have been assessed either using “permeability”, derived from the motion equation of a fluid passing through a permeable material as described by the Forchheimer equation [
24], or using the “coefficient of discharge”, based on Bernoulli’s flow theory [
6,
10]. In many cases, the pressure drop calculated by these two methods shows only minor differences. The variation between results obtained using the Forchheimer or Bernoulli equations is generally smaller than the uncertainty arising from the lack of precise knowledge of the air pressure distribution around the greenhouse, which is a critical parameter for determining the ventilation rate through an opening [
23].
Most authors correlated the pressure losses as a summation of two terms depending on the air velocity. The first, linear, describes the viscous (laminar) effects and the second (quadratic), the inertial (turbulent) effects. With the increase in air velocity and, consequently, with the increase in Re, the quadratic term becomes more prevalent than the first [
15]. In this study, a discharge coefficient approach [
1] was adopted, applying the relation of the air flow resistance of an insect screen proposed by Bailey et al. [
15]:
where the pressure drop (
) is a function of the density of air (
kgm
−3), of the superficial fluid velocity (
), and of the loss coefficient (
), which is directly correlated to the discharge coefficient (
), with the following:
Some authors [
5,
12,
13] assumed the loss coefficient as a function of the Reynolds number and the porosity of the net (3).
The Reynolds number describes the motion regime and can be interpreted as the ratio between inertial and viscous forces:
where
is the density of the fluid,
is the velocity of the fluid,
is a characteristic dimension of the porous media making up the structure, and
is the dynamic viscosity of the fluid. The Formula (4) is derived from the general motion equation of one-dimensional mass transfer through a permeable medium and transposed to agro-textiles with many uncertainties in the definition of the parameters
(superficial or interstitial velocity of the fluid) and
(diameter of the wire, thickness of the net, wet perimeter, hydraulic diameter, etc.).
With the increase in the air flow velocity—Miguel et al. [
23] assumed empirically
as the threshold value—the inertia effects become predominant (non-Darcy flow); as a consequence,
in (3) can be considered constant. According to Miguel et al. [
23], for insect-proof nets, the threshold value of Re = 150 is reached at air velocities above 8 m/s; therefore, the range of air velocities considered in this study can be regarded as within a non-Darcy flow regime.
The fluid velocity measured in the micro wind tunnel induces high values of the Reynolds number and, consequently, only the dependence of the loss coefficient on the geometric characteristics of the textiles will be evaluated in this study.
3. Results and Discussion
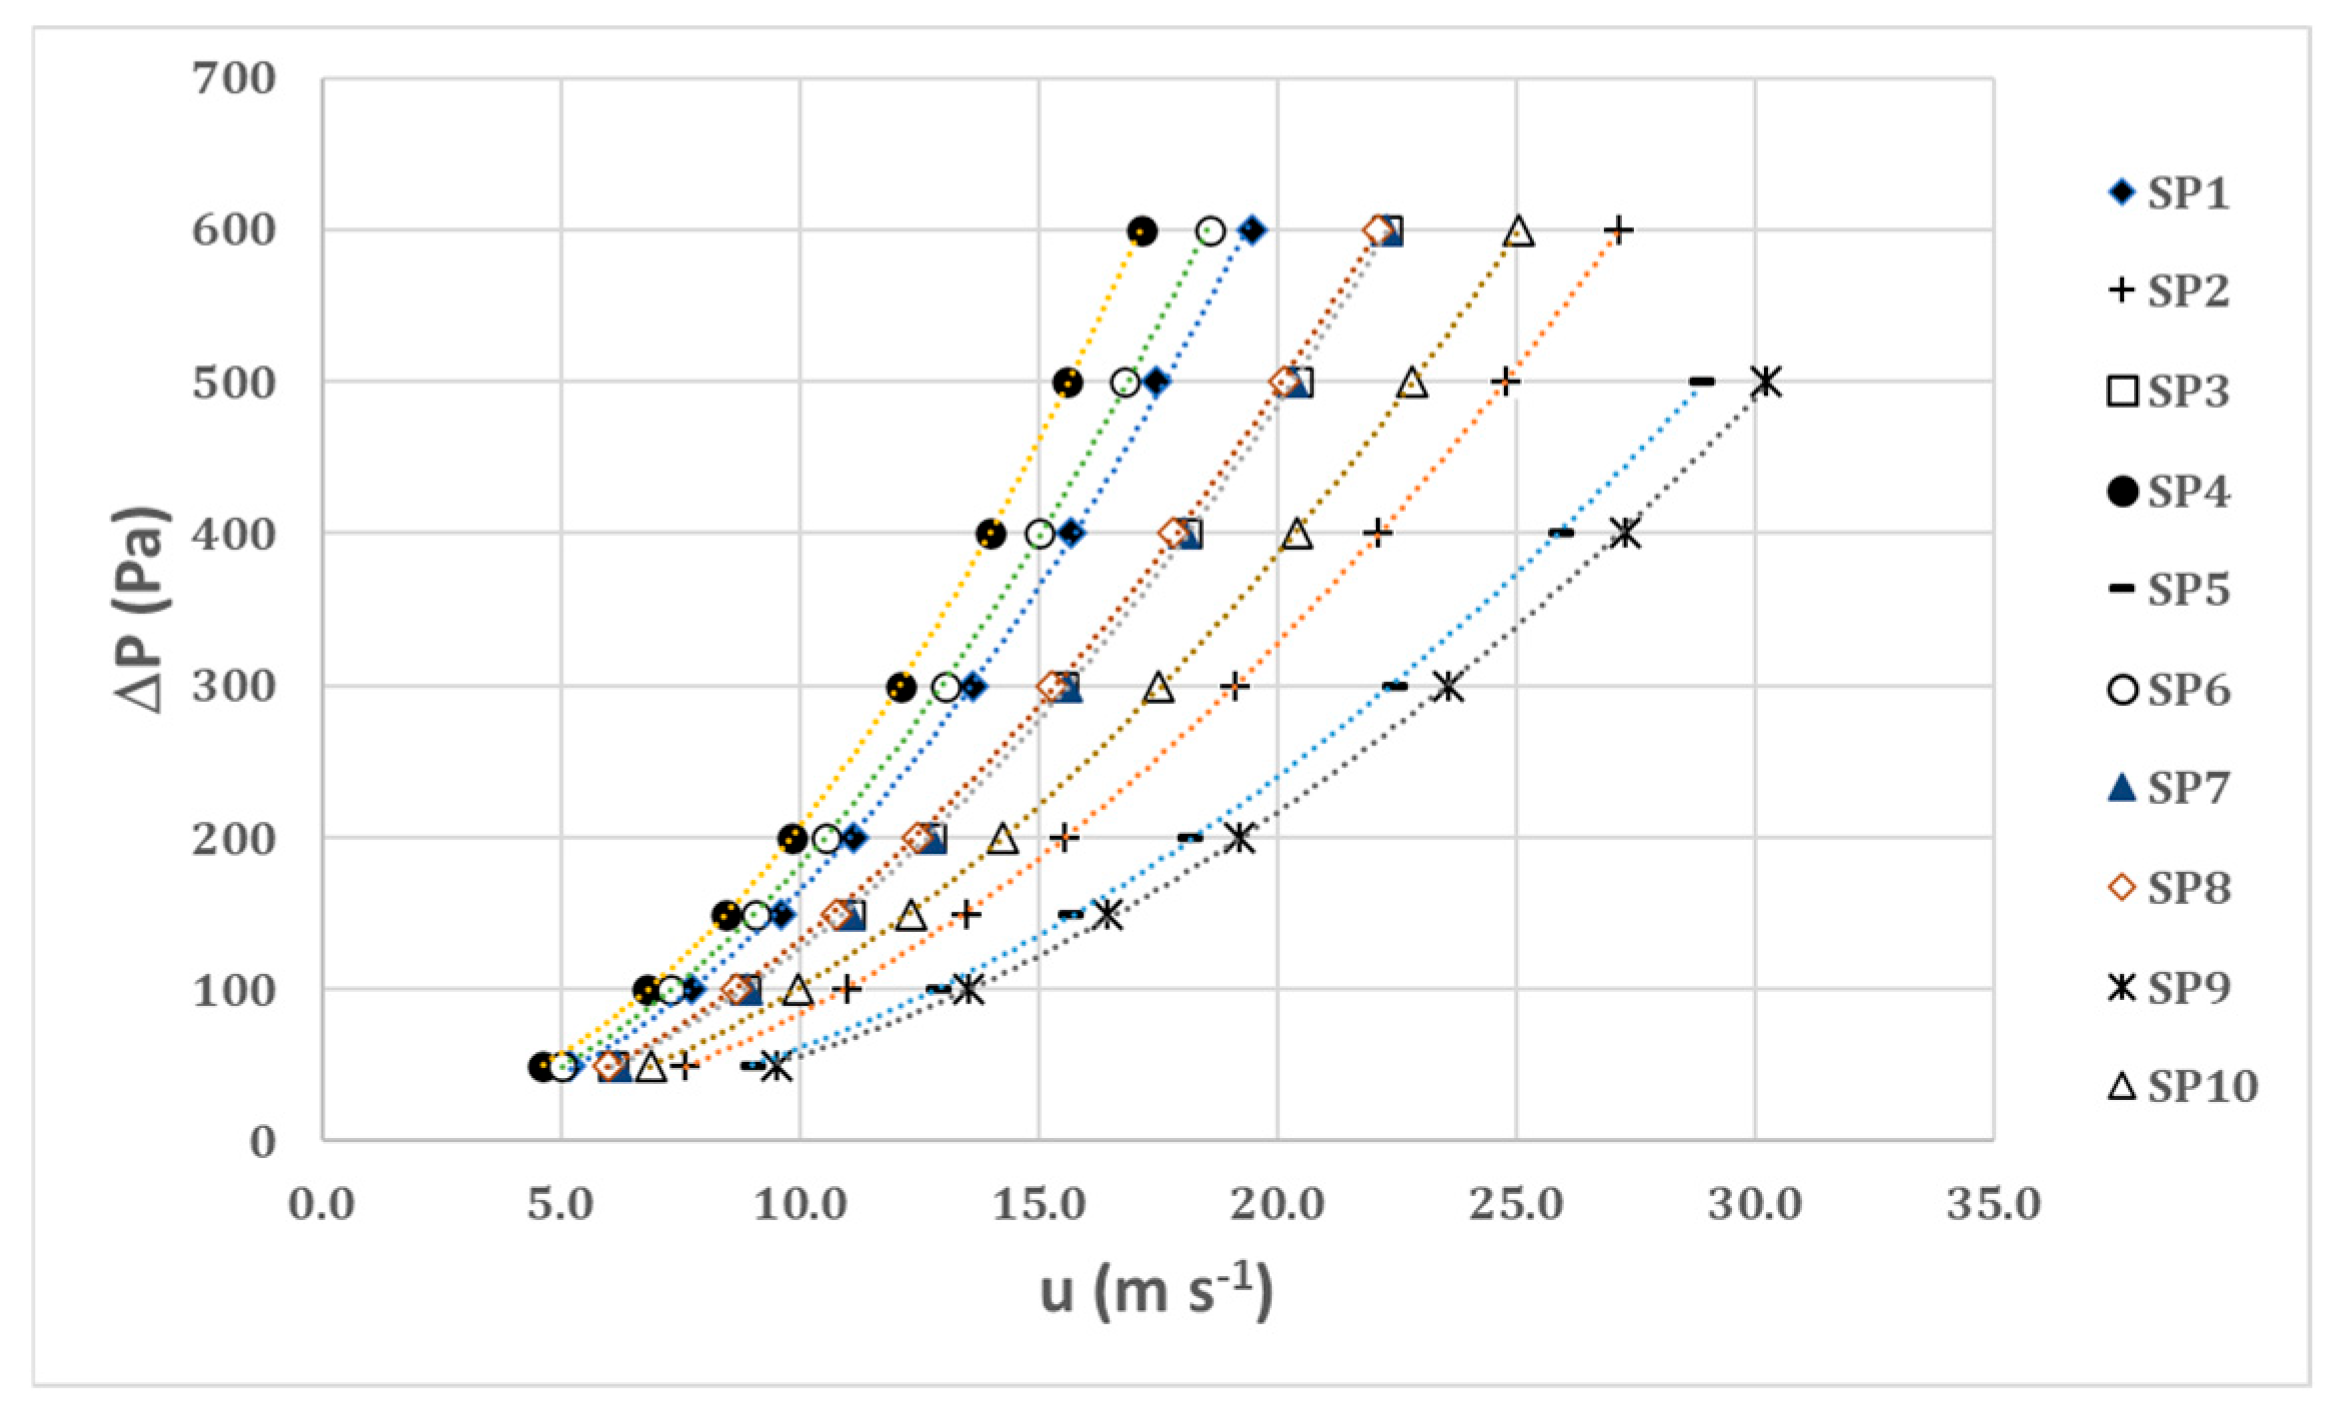
For all the nets analyzed, a second-order correlation was identified between the air velocity u [m/s] in the wind tunnel and the pressure drop Δp [Pa] (1). The parabolic relationships (
Figure 4) were determined using the ordinary least squares method, yielding a very high coefficient of determination (R
2 > 0.98) for all the tested nets.
Equation (1) represents a parabola with the vertex coincident with the origin of axes; the shape of the curve depends on the value of the coefficient . The lower is, the lower the slope of the parabola is throughout the whole velocity range and, consequently, the air flow resistance of the textile.
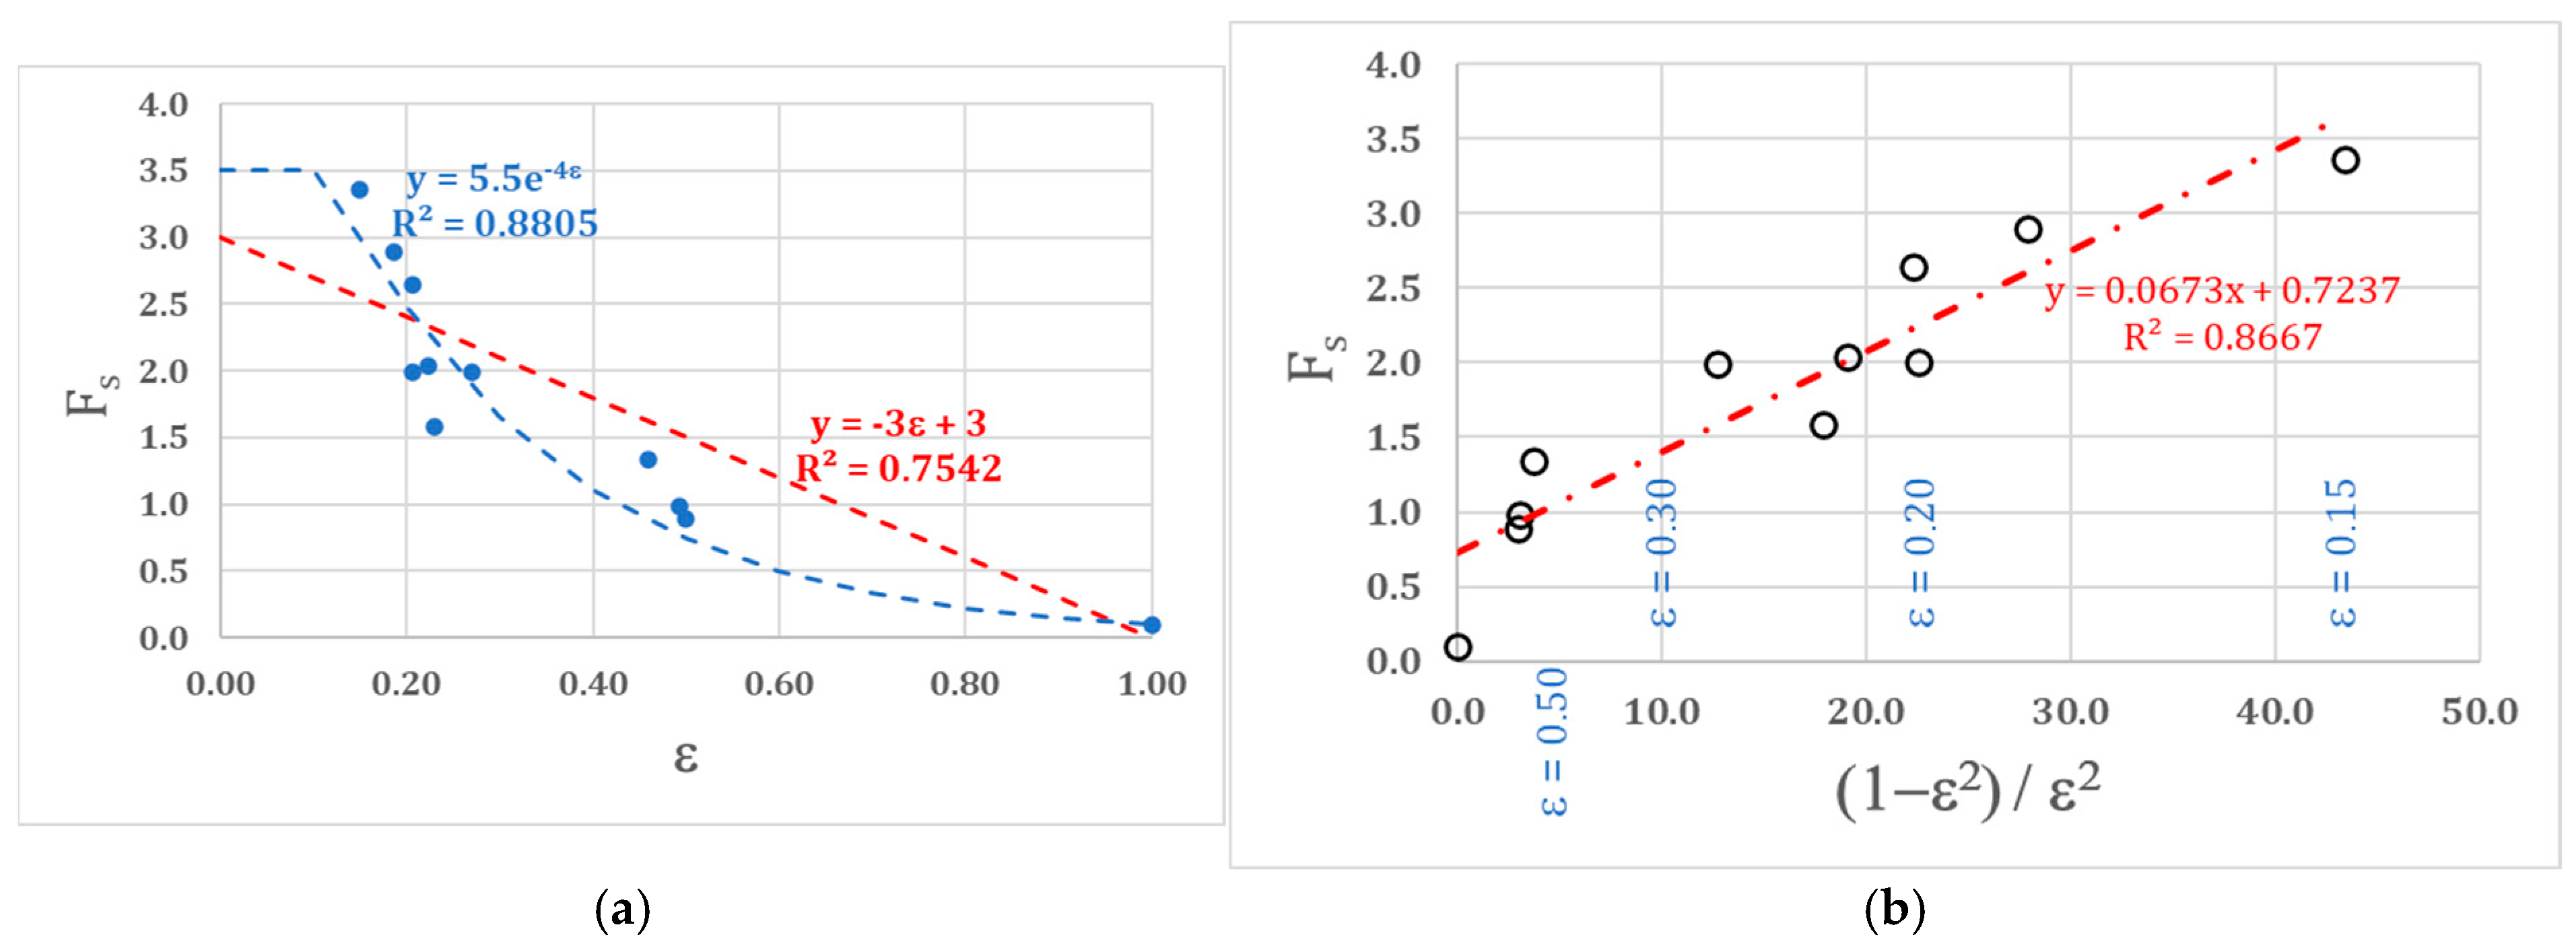
Figure 5 shows that the
coefficient is correlated to the porosity of the net. Based on how porosity and air permeability are defined, an increase in the void surface area of an agro-textile, and therefore its porosity, leads to a reduction in the aerodynamic resistance and, consequently, in the loss coefficient. The correlation with
is quite low (
) considering a linear regression, while considering an exponential correlation, the coefficient of determination increases to
(
Figure 5a). With regard to the exponential correlation, a constant value of the loss coefficient (
for low values of the porosity (
) was considered (
Figure 5a).
Figure 5b shows, in accordance with Brundrett [
5], that the parameter best correlating with the loss coefficient is the following function of the porosity:
Function
, due to its hyperbolic behaviour (7), is not able to describe values of porosity close to the extremes of the range of variability in the porosity (
) taking into account that when
,
; when
,
(
Figure 5a). As shown in
Figure 5b, in the interval of porosity
, the linear regression correlation is quite high (
).
Considering the two regression curves describing the dependence of the coefficient loss to the porosity (
Figure 5a):
it is possible, assuming
, to calculate the loss coefficient associated with an impermeable surface (
and to evaluate the reduction factor
due to the porosity of the net:
where
is the loss coefficient associated with the porosity
of the textile according to (8) or (9).
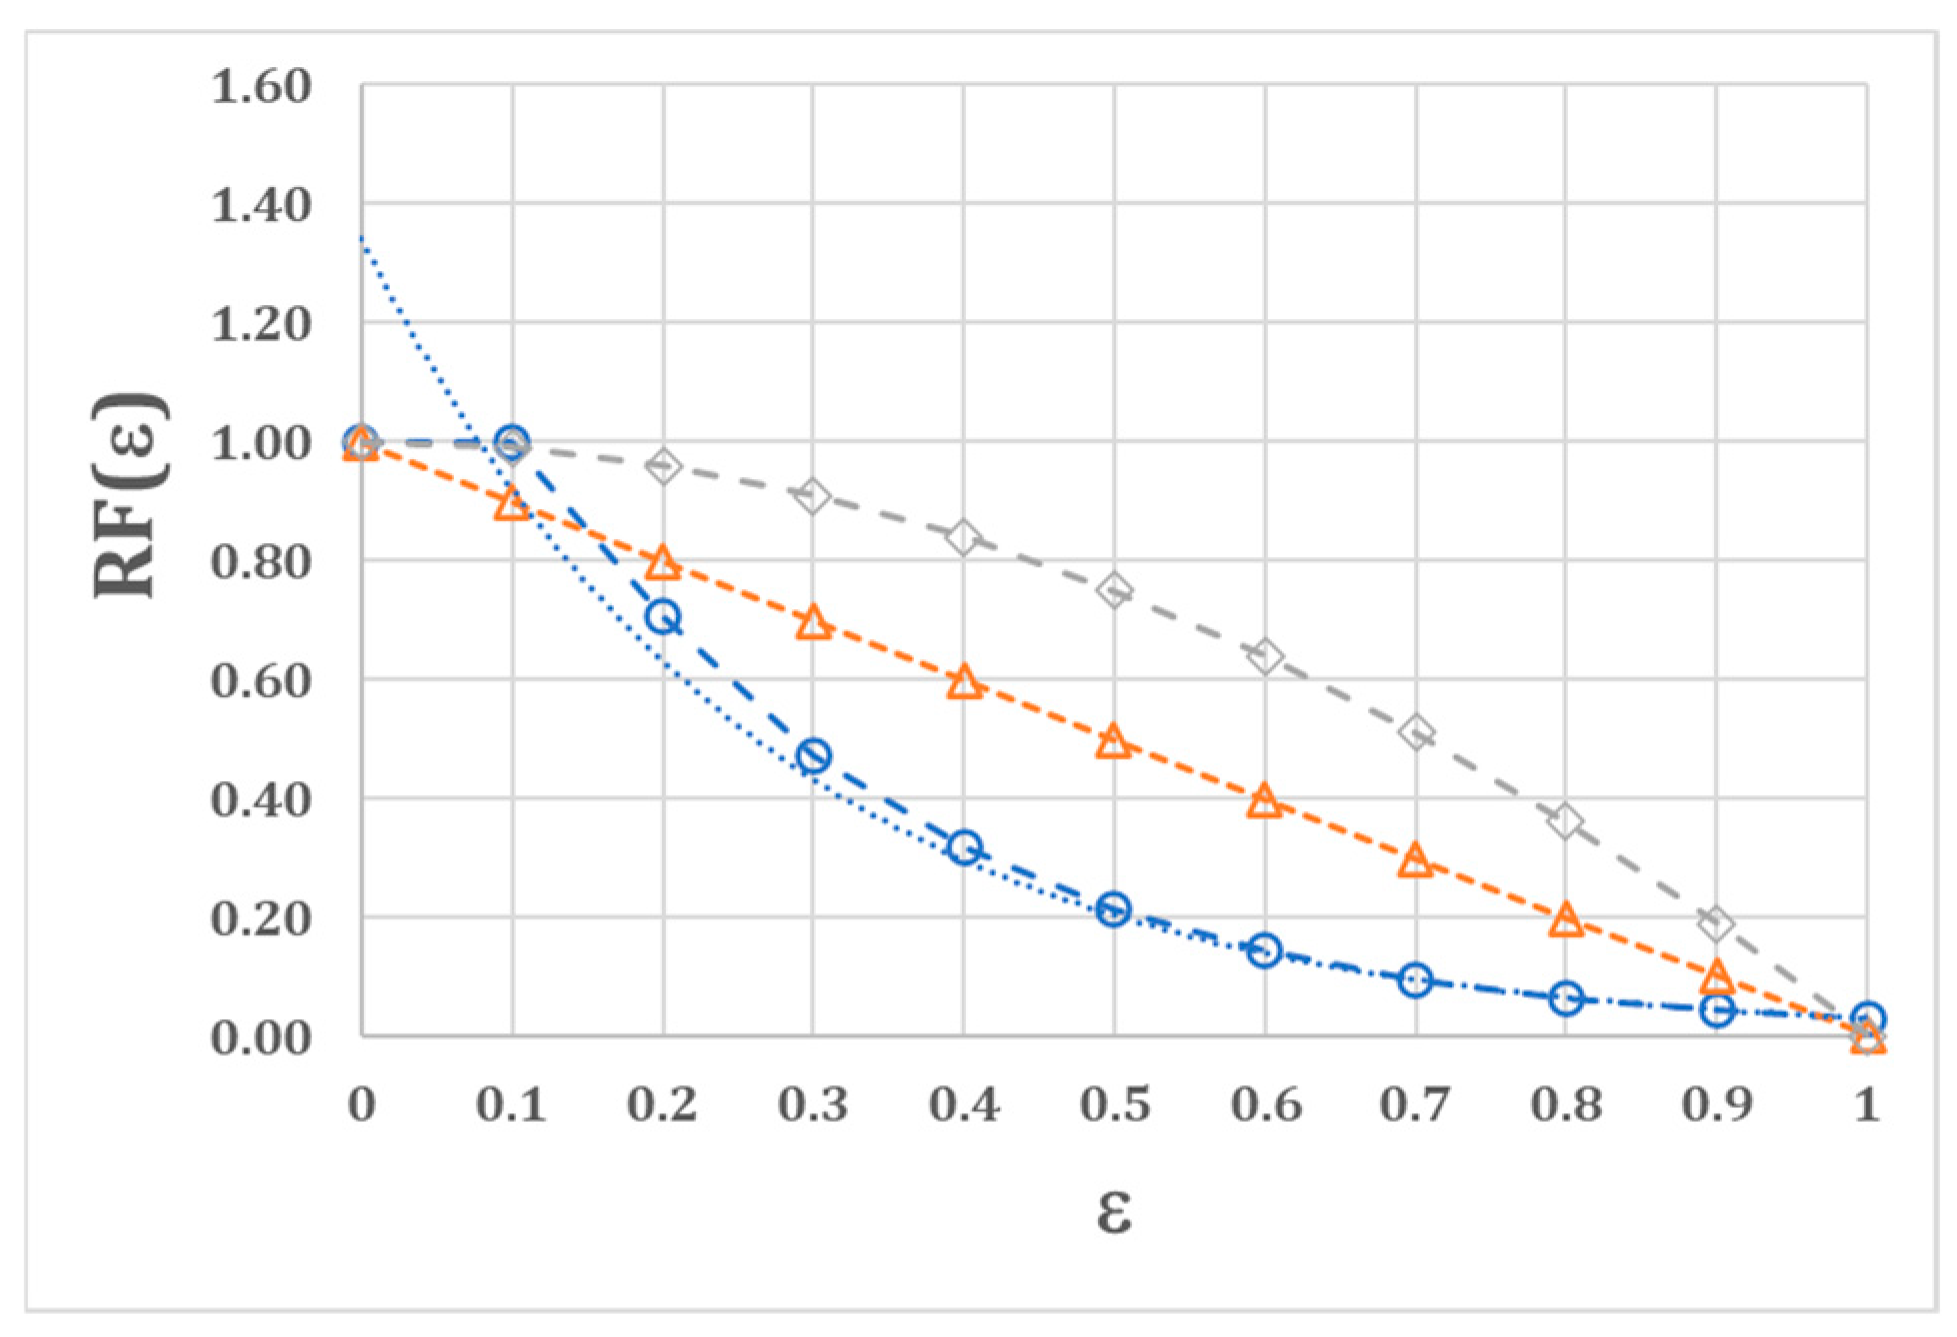
In Bernoulli’s theory, apart from aerodynamic effects, the reduction factor can be considered as an estimation of the reduction in wind pressure acting perpendicularly on the surface of a textile due to the porosity of the net (11).
Applying Equation (10), assuming the exponential regression curve (8), a reduction factor as a function of the porosity can be obtained, as reported in (12). Likewise, assuming the linear regression curve described by Equation (9), the reduction factor as a function is described in (13).
It is notable that Equation (13) is the same as proposed by Richards and Robertson [
25]. In
Figure 4, curves associated with Equations (12) and (13) are reported, together with the one suggested by the Australian standard
AS/NZS 1170.2:2021—Structural Design Actions—Wind Actions [
26]—the only international standard that considers a relationship between surface porosity and wind action—for freestanding walls, when the wind is normal to the wall:
As reported in
Figure 6, the experimental results interpolated by the exponential regression function (8) seem to overestimate the effect of the porosity with a strong reduction in the wind action due to the geometric porosity. A more conservative relation with a lower reduction in the wind action is proposed in Equation (13). An intermediate behaviour with a linear reduction in the wind load with the porosity is pointed out in Equation (13).
With this approach, for instance, to a textile with a porosity of 20% (
), the reduction factors associated with Equations (12) and (13) are, respectively, the following:
,
, and
(
Figure 5). Consequently, the corresponding basic velocity pressures [
26] acting perpendicularly on the external surface of the textile are the following:
;
; and
.
4. Conclusions
The air flow through the nets was experimentally evaluated using a micro wind tunnel. In the present paper, results concerning the air flow perpendicular to the net sample are reported.
A second-order correlation was observed for all the analyzed nets between the air velocity [ms−1] in the wind tunnel and the pressure drop [Pa]. The parabolic relationships were determined using the ordinary least squares method, resulting in a very high coefficient of determination () for all tested nets.
Based on how porosity and air permeability are defined, an increase in the void surface area of an agro-textile, and therefore its porosity, leads to a reduction in the aerodynamic resistance and, consequently, in the loss coefficient. The relationship between porosity and the loss coefficient is not linear and also depends on other parameters such as the diameter of the threads, the thickness of the net, and the air velocity. However, an empirical relationship for agro-textiles capable of correlating the two parameters would be extremely useful for practical applications such as, for example, the determination of wind action on shade-houses. Despite the numerous studies, the proposed models still seem to differ significantly.
Experimental results showed that the correlation with is quite low () considering a linear regression, while considering an exponential correlation, the coefficient of determination increases to . The parameter best correlating with the loss coefficient is the function of the porosity . Function , due to its hyperbolic behaviour (7), is not able to describe values of porosity close to the extremes of the range of variability in the porosity (). As a consequence, the function is not able to describe nets with low () or high () porosity. In the interval of porosity , the linear regression correlation is quite high ().
According to the permeability coefficients found, the reduction factor
could be calculated, which can be considered as an estimation of the reduction in wind pressure acting perpendicularly on the surface of a textile due to the porosity of the net. Three formulations of the reduction factor depending on the porosity were investigated. Two of these were based on the experimental results—
(
) and
(
); the third was based on the formula proposed in the Australian standard [
25]:
. It is notable that equation
is the same as proposed by Richards and Robertson.
Experimental results interpolated by the exponential regression function (), characterized by the higher R2, showed a higher reduction in the wind action due to the geometric porosity. A more conservative relation with a lower reduction in wind action is proposed by the Australian standard . An intermediate behaviour with a linear reduction in the wind load with the porosity is pointed out in equation .
Further research will be necessary to validate the results through field tests, whose feasibility would be actually very hard, given the extremely high instability of wind conditions in real contexts, both in terms of intensity and direction.
Author Contributions
Conceptualization, S.C. and G.S.; methodology, S.C. and G.S.; validation, S.C. and G.S.; formal analysis, S.C.; investigation, S.C. and G.S.; resources, S.C. and G.S.; data curation, S.C. and G.S.; writing—original draft preparation, S.C.; writing—review and editing, S.C. and G.S.; visualization, S.C. and G.S.; supervision, G.S.; project administration, S.C.; funding acquisition, S.C. All authors have read and agreed to the published version of the manuscript.
Funding
This research was funded by the Italian Ministry of University and Research (MUR), project “Conservabilità, qualità e sicurezza dei prodotti ortofrutticoli ad alto contenuto di servizio”—ARS01_00640—POFACS, D.D. 1211/2020 and 1104/2021.
Data Availability Statement
The original contributions presented in this study are included in the article. Further inquiries can be directed to the corresponding author(s).
Acknowledgments
The authors want to thank Danilo Giannoccaro for his contribution to the elaboration of data and Marco Lippolis of Arrigoni spa for his valuable role during the experimental campaign.
Conflicts of Interest
The authors declare no conflicts of interest.
References
- Teitel, M. The effect of screened openings on greenhouse microclimate. Agric. For. Meteorol. 2007, 143, 159–175. [Google Scholar] [CrossRef]
- Robertson, A.P.; Roux, P.; Gratraud, J.; Scarascia Mugnozza, G.; Castellano, S.; Dufresne de Virel, M.; Palier, P. Wind pressures on permeably and impermeably-clad structures. J. Wind Eng. Ind. Aerodyn. 2002, 90, 461–474. [Google Scholar] [CrossRef]
- Mistriotis, A.; Castellano, S. Airflow through net covered tunnel structures at high wind speeds. Biosyst. Eng. 2012, 113, 308–317. [Google Scholar] [CrossRef]
- Hu, S.; Wang, D.; Periyasamy, A.P.; Kremenakova, D.; Militky, J.; Tunak, M. Ultrathin Multilayer Textile Structure with Enhanced EMI Shielding and Air-Permeable Properties. Polymers 2021, 13, 4176. [Google Scholar] [CrossRef]
- Lopez-Martinez, A.; Valera-Martinez, D.L.; Molina-Aiz, F.; Peña-Fernandez, A.; Marin-Membrive, P. Microclimate evaluation of a new design of insect-proof screens in a Mediterranean greenhouse. Span. J. Agric. Res. 2014, 12, 338–352. [Google Scholar] [CrossRef]
- Wang, Q.; Maze, B.; Vahedi Tafreshi, H.; Pourdeyhimi, B. On the pressure drop modelling of monofilament woven fabrics. Chem. Eng. Sci. 2007, 62, 4817–4821. [Google Scholar] [CrossRef]
- Granados-Ortiz, F.J.; Arrabal-Campos, F.M.; Lopez-Martinez, A.; Molina-Aiz, F.D.; Peña-Fernández, A.; Valera, D.L. On the estimation of three-dimensional porosity of insect-proof screens. Comput. Electron. Agric. 2022, 193, 106639. [Google Scholar] [CrossRef]
- Granados-Ortiz, F.J.; Ortega-Casanova, J.; Lopez-Martinez, A.; Mahabaleshwar, U.S. Estimation of the aerodynamic tortuosity of woven/wire screens. J. Wind Eng. Ind. Aerodyn. 2023, 243, 105608. [Google Scholar] [CrossRef]
- Granados-Ortiz, F.-J.; Lopez-Martinez, A.; Ortega-Casanova, J.; Lai, C.-H. Semi-analytical calculation of pore-related parameters of wire/woven screens. Int. J. Mech. Sci. 2023, 242, 107972. [Google Scholar] [CrossRef]
- Brundrett, E. Prediction of pressure drop for incompressible flow through screens. J. Fluid Eng. Trans. Am. Soc. Mech. Eng. 1993, 115, 239–242. [Google Scholar] [CrossRef]
- López, A.; Molina-Aiz, F.D.; Valera, D.L.; Peña, A. Wind Tunnel Analysis of the Airflow through Insect-Proof Screens and Comparison of Their Effect When Installed in a Mediterranean Greenhouse. Sensors 2016, 16, 690. [Google Scholar] [CrossRef]
- Ishizuka, M.; Hayama, S.; Peng, G. Measurements of flow resistance coefficients for wire nets in natural air convection flow. In Proceedings of the 6th Triennial International Symposium on Fluid Control, Measurement and Visualisation, Sherbrooke, QC, Canada, 13–17 August 2020. [Google Scholar]
- Molina-Aiz, F.D.; Valera, D.L.; Peña, A.A.; Gil, J.A.; López, A. A study of natural ventilation in an Almería-type greenhouse with insect screens by means of tri-sonic anemometry. Biosyst. Eng. 2019, 104, 224–242. [Google Scholar] [CrossRef]
- Castellano, S.; Starace, G.; De Pascalis, L.; Lippolis, M.; Mugnozza, G.S. Test results and empirical correlations to account for air permeability of agricultural nets. Biosyst. Eng. 2016, 150, 131–141. [Google Scholar] [CrossRef]
- Bailey, B.J.; Montero, J.I.; Pérez Parra, J.; Robertson, A.P.; Baeza, E.; Kamaruddin, R. Airflow Resistance of Greenhouse Ventilators with and without Insect Screens. Biosyst. Eng. 2003, 86, 217–229. [Google Scholar] [CrossRef]
- Azizi, F. On the pressure drop of fluids through woven screen meshes. Chem. Eng. Sci. 2019, 207, 464–478. [Google Scholar] [CrossRef]
- López-Martínez, A.; Molina-Aiz, F.D.; Valera, D.L.; Espinoza-Ramos, K.E. Models for characterising the aerodynamics of insect-proof screens from their geometric parameters. Biosyst. Eng. 2020, 192, 42–55. [Google Scholar] [CrossRef]
- Marykovskiy, Y.; Pomaranzi, G.; Schito, P.; Zasso, A. A Method to Evaluate Forchheimer Resistance Coefficients for Permeable Screens and Air Louvers Modelled as a Porous Medium. Fluids 2024, 9, 147. [Google Scholar] [CrossRef]
- Abou-Hweij, W.; Azizi, F. CFD simulation of wall-bounded laminar flow through screens. Part I Hydrodyn. Charact. Eur. J. Mech. B/Fluids 2020, 84, 207–232. [Google Scholar] [CrossRef]
- Green, S.I.; Wang, Z.; Waung, T.; Vakil, A. Simulation of the flow through woven fabrics. Comput. Fluids 2008, 37, 1148–1156. [Google Scholar] [CrossRef]
- Middelstädt, F.; Gerstmann, J. Numerical investigations on fluid flow through metal screens. In Proceedings of the 5th European Conference for Aeronautics and Space Sciences (EUCASS), Munich, Germany, 1–5 July 2013. [Google Scholar]
- Costa, S.C.; Barrutia, H.; Esnaola, J.A.; Tutar, M. Numerical study of the heat transfer in wound woven wire matrix of a Stirling regenerator. Energy Convers. Manag. 2014, 79, 255–264. [Google Scholar] [CrossRef]
- Miguel, A.F.; Van de Braak, N.J.; Bot, G.P.A. Analysis of airflow characteristics of green-houses screening materials. J. Agric. Eng. Res. 1997, 67, 105–112. [Google Scholar] [CrossRef]
- Munoz, P.; Montero, J.I.; Anton, A.; Giufrida, F. Effect of Insect-proof Screens and Roof Openings on Greenhouse Ventilation. J. Agric. Eng. Res. 1999, 73, 171–178. [Google Scholar] [CrossRef]
- Richards, P.J.; Robinson, M. Wind loads on porous structures. J. Wind Eng. Ind. Aerodyn. 1999, 83, 455–465. [Google Scholar] [CrossRef]
- AS/NZS 1170.2:2021; Australian Standard Structural Design Actions—Wind Actions. Standards Australia: Sydney, Australia, 2021; ISBN 978 1 76113 448 7.
| Disclaimer/Publisher’s Note: The statements, opinions and data contained in all publications are solely those of the individual author(s) and contributor(s) and not of MDPI and/or the editor(s). MDPI and/or the editor(s) disclaim responsibility for any injury to people or property resulting from any ideas, methods, instructions or products referred to in the content. |
© 2025 by the authors. Licensee MDPI, Basel, Switzerland. This article is an open access article distributed under the terms and conditions of the Creative Commons Attribution (CC BY) license (https://creativecommons.org/licenses/by/4.0/).


