Article

Predicting Pineapple Quality from Hyperspectral Data of Plant Parts Applied to Machine Learning

by
Vitória Carolina Dantas Alves
1,
Sebastião Ferreira de Lima
1,
Dthenifer Cordeiro Santana
1,
Rafael Ferreira Barreto
1,
Roger Augusto da Cunha
1,
Ana Carina da Silva Cândido Seron
1,
Larissa Pereira Ribeiro Teodoro
1,
Paulo Eduardo Teodoro
1,
Rita de Cássia Félix Alvarez
1,
Cid Naudi Silva Campos
1,
Carlos Antonio da Silva Junior
2 and
Fábio Luíz Checchio Mingotte
3,*
1
Universidade Federal de Mato Grosso do Sul (UFMS), Campus de Chapadão do Sul (CPCS), Chapadão do Sul 79560-000, MS, Brazil
2
Departamento de Geografia, Universidade Estadual de Mato Grosso (UNEMAT), Sinop 78555-000, MT, Brazil
3
Departamento de Produção Vegetal, Universidade Estadual Paulista (UNESP), Jaboticabal 14884-900, SP, Brazil
*
Author to whom correspondence should be addressed.
AgriEngineering 2025, 7(6), 170; https://doi.org/10.3390/agriengineering7060170
Submission received: 3 February 2025 / Revised: 30 April 2025 / Accepted: 14 May 2025 / Published: 3 June 2025

Abstract

:
Food quality detection by machine learning (ML) is more practical and sustainable as it does not require sample preparation and reagents. However, the prediction of pineapple quality by hyperspectral data applied to ML is not known. The aim of this study was to verify accurate ML models for predicting pineapple fruit quality and the best inputs for algorithms: Artificial Neural Networks (ANNs), M5P (model tree), REPTree decision trees, Random Forest (RF), Support Vector Machine (SMV) and Zero R. Three inputs were used for each model: leaf reflectance, peel reflectance, and fruit reflectance. The machine learning model SVM, stood out for its best results, demonstrating good generalization capacity and effectiveness in predicting these attributes, reaching accuracy values above 0.7 for Brix and ratio, using fruit reflectance. In terms of the overall efficiency of the input variables, peel and fruit were the most informative, with peel standing out for the estimation of secondary metabolism compounds, while the fruit showed excellent performance in predicting flavor-related attributes, such as acidity, °Brix and ratio, as mentioned previously, above 0.7. These results highlight the potential of using spectral data and machine learning in the non-destructive assessment of pineapple quality, enabling advances in monitoring and selecting fruits with better sensors.

Graphical Abstract

1. Introduction

One of the most consumed subtropical and tropical fruits in the world is the pineapple (Ananas comosus (L.) Merril.), the fruit is nutritionally important; it is a source of fiber, carotenoids and flavonoids, and supports digestion, the immune system, and promotes skin improvements [1,2,3]. The pineapple is a fruit that does not ripen after harvesting. Therefore, the fruit must have a pleasant taste for the consumer when it is harvested.
Usually, the harvest season is defined by measurements inside the fruit, such as total soluble solids, where sugar predominates, measured in °Brix, and total acidity [4]. However, the ratio between °Brix and the total acidity may be more accurate in determining quality, as the fruit may contain sufficient sugar but the high citric acid content may mask some of the perception of sweetness, i.e., fruit with sufficient sugar content but high acidity may be perceived as sour [5].
In addition to the parameters that are usually evaluated to determine the time of harvest and the resulting flavor of the fruit, the evaluation of bioactive molecules with antioxidant and anti-inflammatory properties that can prevent cancer and cardiovascular diseases is of great value to human health. Flavonoids are among these beneficial compounds. They are found in various parts of the pineapple plant, particularly in the peel of the fruit, and are retained even after drying or freeze-drying the peel, a process used to produce flour that can be used in feed [6].
Conventional methods for evaluating the quality of pineapples are destructive, require equipment, laboratory procedures, and trained personnel, and are quite laborious. Furthermore, not all fruit can be assessed using the destructive method. Instead, one sample is used to assess all fruits and this can lead to errors. Therefore, a more practical and non-destructive assessment of pineapple quality parameters such as °Brix, acidity and flavonoids would be more sustainable as it would eliminate the use of reagents and better meet the growing consumer demand for high-quality fruit [4]. Therefore, it is important to develop new technologies and effective equipment to check the quality of pineapple fruit [7,8].
The use of hyperspectral sensors has many advantages, such as the fact that the fruit is not damaged and that the quality characteristics of the fruit can be predicted very well [9]. In addition to this method, machine learning (ML) makes it possible to find a model with the accuracy of the evaluated factors that make up the quality of the fruit, ensuring a database of qualitative and quantitative characteristics for future evaluations of other fruits [10]. Furthermore, studies have shown that selecting specific spectral features can improve maturity classification in crops such as strawberries and tomatoes using hyperspectral imaging [11]. Non-destructive fruit quality assessment using hyperspectral data have benefited significantly from the use of machine learning techniques, such as Artificial Neural Networks (ANNs) and Support Vector Machines (SVMs). These approaches allow detailed analysis of internal and external fruit characteristics, providing accurate and efficient results.
Computational intelligence algorithms can predict the quality of fruit using training data without the need to manually extract the features, reducing the influence of human factors on the prediction results [12]. Studies using ML algorithms with spectral data to evaluate fruit quality have been very promising in various fruits, e.g., peaches [13], apples [14], pears [15], oranges [16]. Specifically for pineapples noticed that NIR-HSI techniques could be successfully used as a commercial method to predict the maturity index of individual pineapple fruits [17]. It was also concluded that the infrared thermal imaging technique, when used on image parameters, can auspiciously predict the physicochemical properties of different pineapple varieties during storage, especially fruit stored at 10 °C [18]. In another study, they predicted the chemical composition in each pixel of the multispectral images using the calibration models that yielded spatially distributed quantification of the fruit slice [19]. However, research and in-depth analysis are required to develop more accurate and robust models.
With this in mind, the objective of this study is to validate accurate ML models for predicting pineapple fruit quality using different parts of the plant: leaf, peel, and fruit. The specific objectives of the present study are as follows: (i) to build a predictive model for pineapple fruit quality features by comparing machine learning algorithms with different inputs and (ii) to optimize the detection of spectral features for pineapple fruit representative of different parts of the fruit, peel, and leaf, thereby improving the predictive results of the machine learning model.

2. Materials and Methods

2.1. Study Site and Growing Conditions

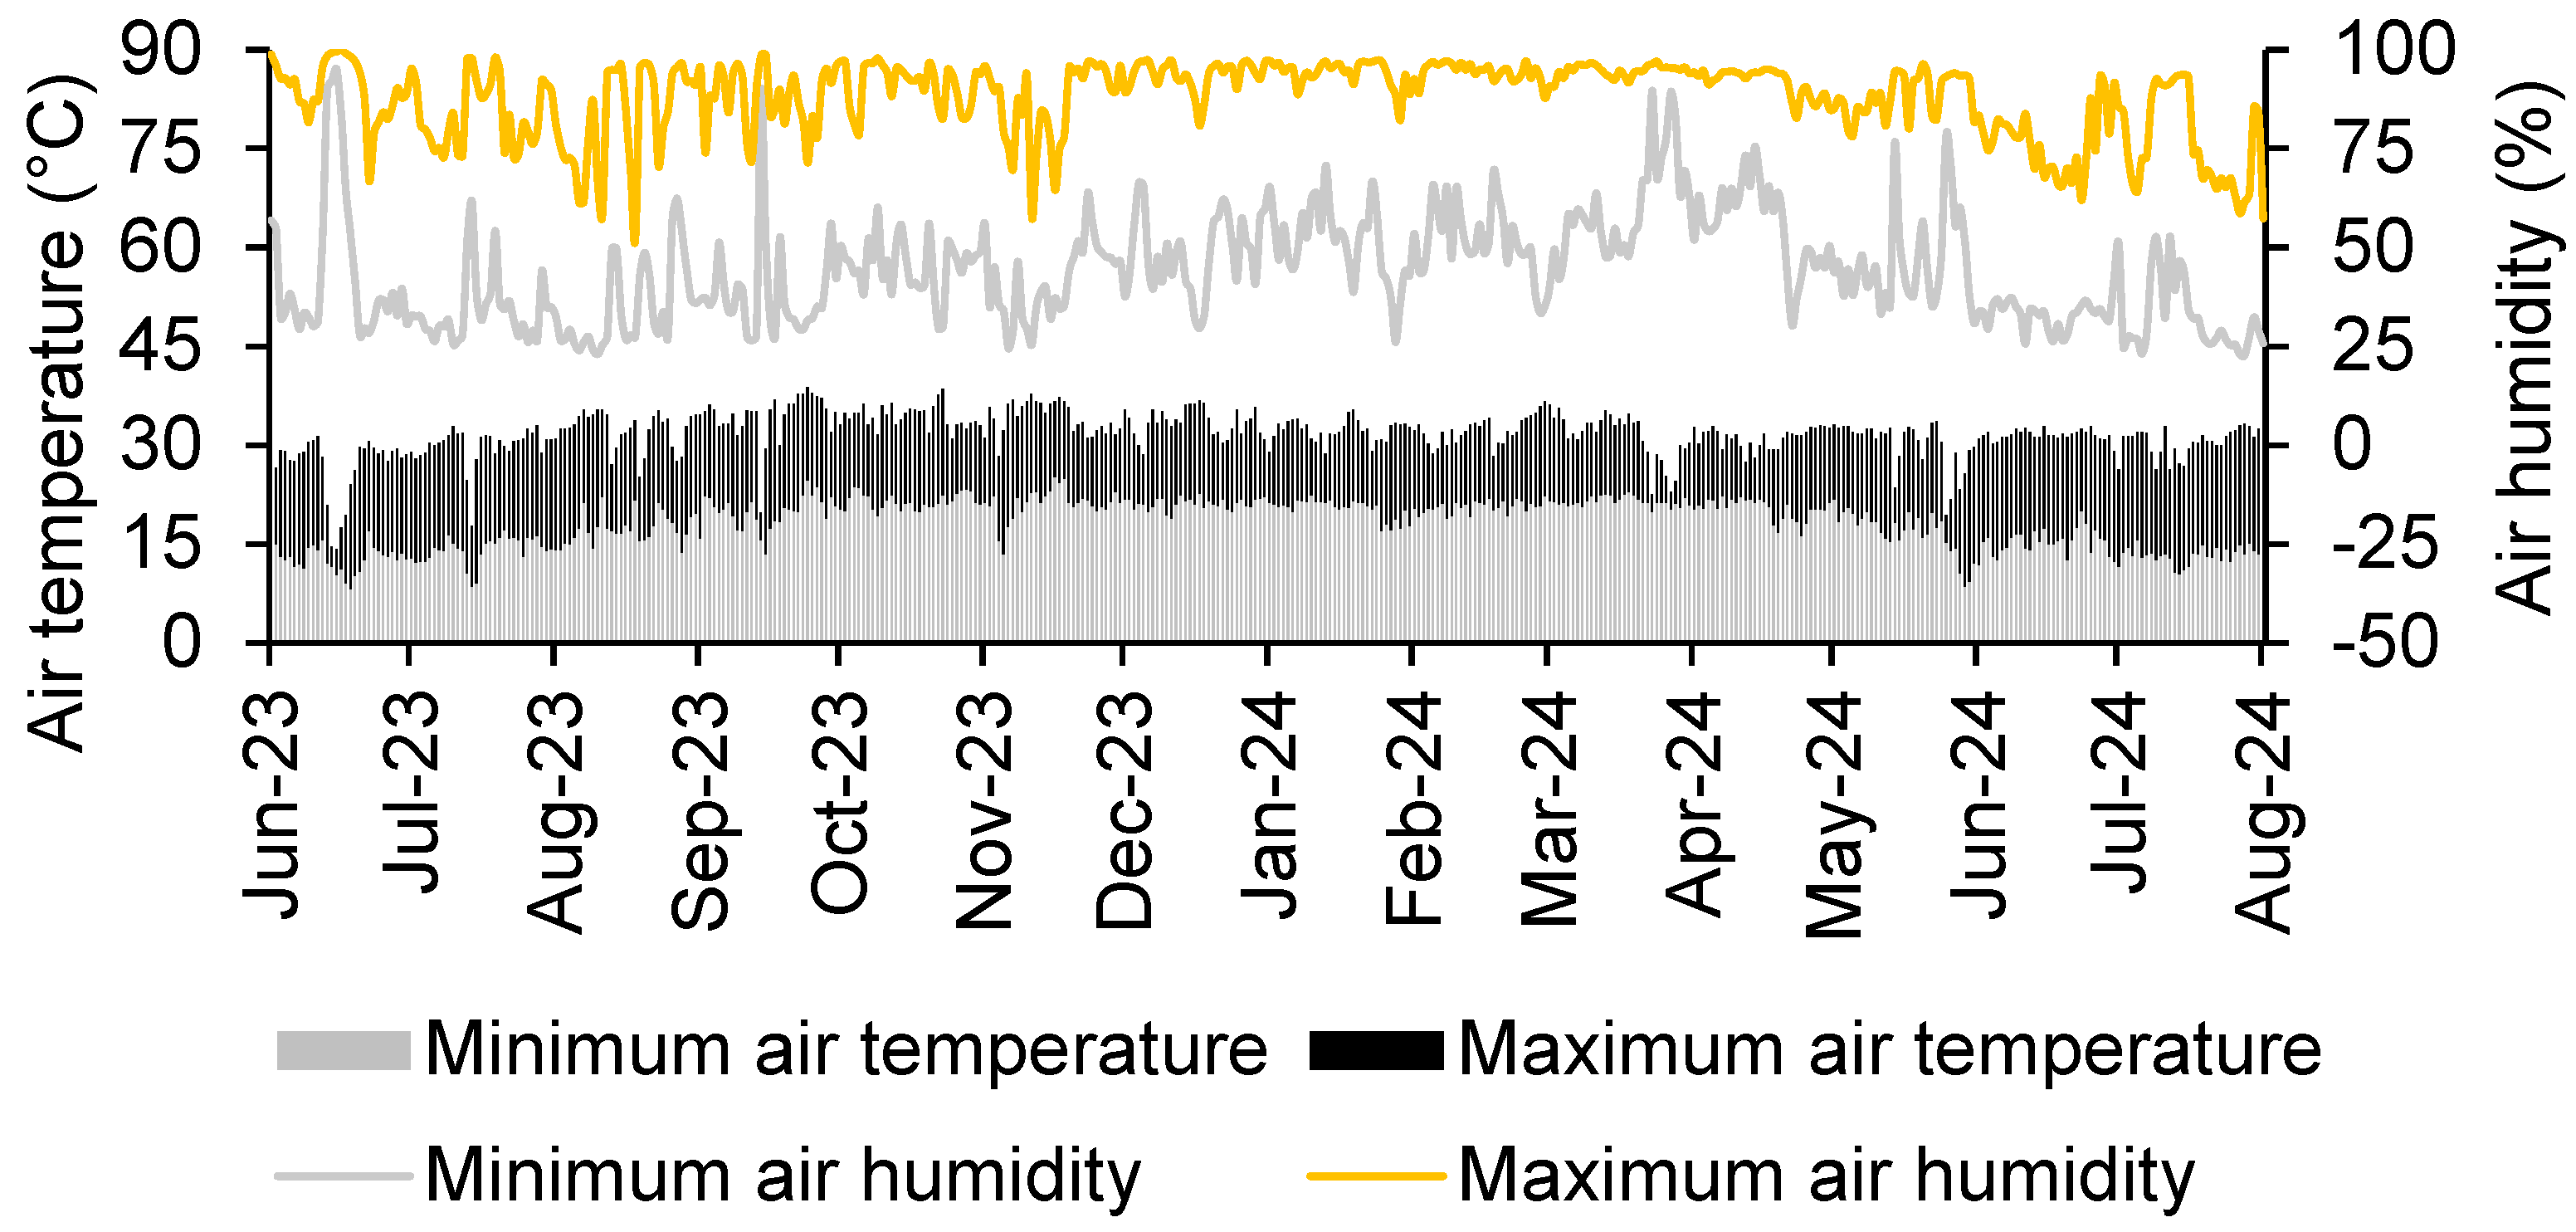
The field experiment was carried out in the experimental area at the Federal University of Mato Grosso do Sul, located in the municipality Chapadão do Sul, Brazil, at 18°46′44″ S, 52°36′59″ W and an altitude of 820 m. The region’s climate is classified as tropical humid (Aw type) according to the Köppen classification, with a rainy season in summer and a dry season in winter [20]. The average rainfall is 1850 mm and the average annual temperature is between 13 °C and 29 °C [21]. Throughout the experiment, air temperature and relative humidity measurements were made (Figure 1).
The soil is classified as Oxisol [22], with a clayey texture. Before planting, the soil was chemically analyzed (Table 1). Soil correction and fertilization followed the recommendations for the Cerrado biome [23]. Soil samples were collected in the 0 to 20 cm depth layer, using a Dutch auger manufactured by Sondaterra.
The pineapple variety ‘Pérola’ was used. To obtain the seedlings, after harvesting the pineapple fruits that had already been planted in the UFMS area, the seedlings from the base of the fruits remained on the plant until they reached 25–30 cm, then they were harvested and placed in a shaded area until planting.
The pineapples were planted in a single row. The distance between the rows was 1 m and between the plants 0.5 m. Eight rows of 20 m each were planted. The experiment used a drip irrigation system installed under a plastic film (mulching) to suppress the development of weeds. Topdressing fertilization was applied using a Venturi injector.

2.2. Brix and Total Titratable Acidity

The soluble solids content was determined using a manual refractometer with a scale of 0–32% and the results were expressed in °Brix [24]. The ATC portable refractometer manufactured by Shenzhen Yieryi Technology (Shenzhen, China) was used, with a reading of 0–32% °Brix and automatic temperature compensation. Total titratable acidity was determined by titrimetry with 0.1 M NaOH solution and phenolphthalein indicator until a permanent light pink color was obtained [25].

2.3. Liquid Chromatography Analysis for Quantification of Flavonoids

Flavonoids in pineapple fruit, peel, and leaf were extracted and measured during harvest. After drying, the samples were ground, and 50 mg of the samples were placed into a 2 mL Eppendorf, which also included 1.5 mL of 70% methanol with 0.1% acetic acid, in order to extract the isoflavones. Subsequently, the samples were centrifuged at 5000 rpm for 20 min and the supernatant was filtered using a 0.2 µm filter syringe and transferred to 1.5 mL vials before injection into an ultra-performance liquid chromatography system. Each sample was analyzed three times [26]. The isoflavones were separated and quantified using a Waters Acquity 1100 series ultra-performance liquid chromatography (UPLC, Waters Corporation, Milford, CT, USA) automatic sample injector.

2.4. Hyperspectral Data

Ten months after planting, a spectral assessment was performed on the largest leaf of the plant, as it is the youngest among the adult leaves and the most physiologically active among all leaves [27]. A total of 14 months after planting, at the time of harvest, a spectral evaluation of the fruit peel and pulp was performed. Hyperspectral evaluations of each part (leaf, rind and fruit) were performed on 100 plants.
The ASD FieldSpec® instrument, manufactured by Analytical Spectral Device (Boulder, CO, USA), which provides spectral readout capability in the broad reflectance spectrum (350–2500 nm), was used to acquire the spectral data. The equipment was coupled to a computer, allowing the recording of spectral data from each part of the plant. Each reading had 2200 spectral information items used in full for data processing with machine learning.

2.5. Machine Learning

Six machine learning algorithms were used to model fruit quality variables based on hyperspectral data: Artificial Neural Networks (ANN), M5P (model tree), REPTree decision trees, Random Forest (RF), Support Vector Machine (SMV), and Zero R. Hyperspectral data were used as input variables and the variables to be predicted were used as output variables: acidity, °Brix, ratio, daidzein, daidzin, and genistin. Hyperspectral data from leaves, bark and fruit were used as different inputs for each model.
Three different inputs were used for each model: leaf reflectance (leaf), peel reflectance (peel), and fruit reflectance (fruit) to predict the variables acidity, °Brix, ratio between °Brix and acidity (ratio) and secondary metabolites. Prediction was performed using stratified cross-validation with k-fold = 10 and 10 replicates (100 runs for each model). All model parameters were set according to the default configuration of Weka 3.8.5. software, except for the ANN, which was restricted to 10 neurons in the first and 10 neurons in the second layer, as previously performed in other studies [28,29,30].
The ANN was implemented as a Multilayer Perceptron using the backpropagation algorithm, with a learning rate of 0.3, momentum of 0.2 and 500 epochs. J48 is a classifier that applies an additional pruning based on an error reduction strategy, adopting a minimum of 4 instances per leaf node. REPTree uses information gain for tree selection and pruning by error reduction, with no depth restriction and a minimum weight of the instances in the leaf of 2.0. RF generates 100 trees and uses voting for prediction, with other hyperparameters in the Weka standards. SVM builds hyperplanes for classification, being executed via LibSVM with RBF kernel (degree 3), tolerance of 1 × 10 4 and cost of 1.0.
The performance of the evaluated prediction models was using the following: Mean absolute error (MAE) and Pearson’s correlation coefficient (r). To check the significance of the inputs, the tested algorithms and the interaction between them, an analysis of variance was performed. If significance was present, tables were created with the mean values of r and MAE grouped by the Scott–Knott test at a 5% probability level. The comparison of averages was carried out with the help of the ExpDes.pt packages of the R software version 4.2.3 [31].

3. Results

Spectral information from pineapple leaves, peels, and fruit were tested in the machine learning models to predict each variable indicative of fruit quality. An analysis of variance with mean squares to investigate the interaction between ML models and inputs was constructed, finding significant interaction between all variables (Table 2).
When predicting acidity, the use of fruit reflectance provided higher accuracy for all models (Table 3). When evaluating the performance of the models with each input, fruit reflectance provided better results for SVM with a mean prediction of 0.43 correlation coefficient. With leaf reflectance as input, ANN, RF, and SVM showed higher accuracy mean values of 0.11, 0.11, and 0.18, respectively, which are unreliable prediction values. Peel reflectance showed better performance for the M5P model with an average accuracy of 0.30. As for the error of the models (Table 3), fruit reflectance generally provided smaller errors for the models, while leaf reflectance produced larger errors. SVM and RF had smaller errors when using each input compared to the other models. These results suggest that while fruit reflectance is the most promising for predicting pineapple acidity, other parts of the plant can be examined to optimize accuracy depending on the variable of interest.
The use of peel reflectance led to a higher accuracy of the models for °Brix. In addition to using this input for ANN and SVM, fruit reflectance also provided good accuracy (Table 4). When evaluating the models for each input tested, it can be seen that fruit reflectance provided excellent accuracy for the SVM in predicting °Brix, with an accuracy of 0.75. When using leaf reflectance, the SVM model also showed superiority over the others, but with a low correlation coefficient of about 0.17. The SVM also showed better accuracy than the others when using peel reflectance, with an r of about 0.66. As for the MAE (Table 4), the models with the lowest errors were generally those using SVM, especially when using fruit reflectance. The prediction of °Brix content, peel reflectance and fruit reflectance are the most accurate inputs, with SVM consistently proving to be the most accurate model.
In terms of the relationship between °Brix and acidity (ratio), there were excellent prediction results, with the use of peel and fruit reflectance allowing the best performance for the models, in particular, SVM showed an accuracy of 0.73 when using fruit reflectance (Table 5). When evaluating the performance of the models within each input data using fruit reflectance, SVM stood out from the others with an accuracy of 0.73. The same model performed better than the others when using leaf reflectance, but with a very low predictive metric of about 0.17. Peel reflectance provided better results for M5P and SVM with an accuracy of 0.57 and 0.56, respectively. Peel and fruit reflectance provided smaller errors, especially for SVM (Table 5). The results confirm that peel and fruit reflectance are more efficient inputs for predicting the ratio, with SVM performing particularly well against the other models.
When evaluating the secondary metabolite daidzein, it was found that the use of peel reflectance provided better accuracy in all models (Table 6). When evaluating the performance of the models within each input data, it is noticeable that fruit reflectance provided better accuracy for SVM with an r of 0.61. The same model showed better accuracy than the other models using leaf reflectance of about 0.37. Using the peel reflectance guaranteed higher r values for SVM and M5P, namely 0.63 and 0.60, respectively. In terms of error (Table 6), the peel also generally provided lower errors and the SVM algorithm was the one with the lowest error rate compared to the others. The reflectance of the shell is the most promising input for the prediction of daidzein, with the SVM algorithm consistently proving to be the most accurate model.
The prediction of daidzin showed a different behavior than the prediction of the other variables, where leaf reflectance contributed the most to better model accuracy (Table 7). When fruit reflectance was used, the SVM model showed better results, 0.41. When leaf SVM was used as input, it also showed good accuracy, 0.48. Peel reflectance provided better accuracy for M5P and SVM, 0.33 and 0.31, respectively. Leaf reflectance also provided smaller errors for the models, and the SVM algorithm had the lowest error rate. These results indicate that leaf reflectance proved to be the most effective input in predicting daidzin, with SVM remaining the most accurate model with the lowest error.
When predicting genistin, peel reflectance was more accurate than the other inputs (Table 8). When using the fruit spectral data as input, the SVM achieved higher accuracy than the other models with a correlation coefficient of 0.64. For leaf reflectance, the same model was superior to the others with an accuracy of 0.44 and remained so when peel reflectance was used as input, with 0.63 r. In terms of error, it was mostly similar between models between inputs (Table 8). The SVM was the model with the lowest accuracy, regardless of the input used.
Finally, the best model was the SVM, which had the best accuracy results, the lowest errors and proved to be the most robust model for most of the pineapple fruit quality variables analyzed. Regarding the best input, the reflectance of the peel and the fruit were generally the most effective inputs, with the peel being particularly efficient for secondary metabolites and the fruit standing out in the prediction of acidity, °Brix and ratio. Leaf reflectance showed good results for daidzin but unsatisfactory performance for the other variables.

4. Discussion

The applicability of hyperspectral data for fruit quality assessment is a technique that identifies and examine spectral data of different wavelengths and bands without destroying the fruit and with high precision [32,33]. Predicting fruit quality by analyzing leaves, peel and fruit and other attributes of fruit evaluation is a complex approach that can improve agricultural practices [34,35]. When the data are combined with machine learning algorithms to evaluate fruit quality, such as fruit damage, good performance is achieved [36], as in carrots [37] and real-time identification of defective apples [38]. The use of hyperspectral data in the 400–1000 nm range has different capabilities in measuring some internal quality characteristics of Red and Golden Delicious apples in a non-destructive manner for variables such as pH, soluble solids, titratable acid and phenol [39]. Another application of spectral data are the effectiveness of evaluating the internal and external quality attributes of peaches, demonstrating their versatility in relation to different species [40].
When analyzing the deconvolution of the models, it was found that the use of fruit reflectance resulted in higher accuracy for all models. In terms of the performance of the individual inputs and the models, fruit reflection gave better results for SVM. The same algorithm showed promising accuracy in identifying moldy apple seeds [41]. The same model also had good accuracy in predicting titratable acidity [42], as shown in this study.
Peel and fruit reflectance were the most accurate inputs for °Brix prediction, with the SVM proving to be even more accurate. According to research on blueberry anthocyanin prediction [43], it was reported that the SVM model was more appropriate for the determination of small samples and had the lowest errors. For the ratio, the results confirm that the reflectance of the peel and fruit are more efficient inputs for predicting the ratio, with the SVM performing particularly well compared to the other models. Furthermore, the application of ML techniques in conjunction with these data produces fast and reliable results for industrial applications [44].
Pineapple fruits have a high content of various flavonoids, that are directly linked to the color of the fruit and are involved in the white-yellow pigmentation of the fruit [45,46,47]. It has an antioxidant function and cellular signaling pathways and plays an essential role in plant growth and biotic and abiotic stress reduction [48]. For the flavonoid variable, in general, peel and fruit reflectance were the most effective inputs, with peel being particularly efficient for secondary metabolites. The highest concentrations of flavonoids are found in the pineapple peel, which can be attributed to the protection of the fruit against environmental stress. They also act as biological protectors, against oxidative stress caused by UV radiation and in antimicrobial activity to protect the fruit [49,50].
Among the criteria of accuracy that were examined, the SVM’s algorithm was the one with the best performance, regardless of the input used. This algorithm shows good performance in prediction in conjunction with the machine learning algorithm [51,52]. It also has minimization of overfitting [53], it reduces the errors presented, making it an excellent algorithm for prediction and accuracy.
The results indicate that although the use of leaves was initially considered the most promising approach for prediction, the results obtained were not satisfactory as their use would provide early answers while the fruit is still in the field. This suggests that the limited number of leaf samples may negatively affect the accuracy of the models. For future work, increasing the number of leaf samples could provide a more robust and representative database for the analyses. In addition, the application of deep learning techniques could be an effective alternative to improve the predictions, which could lead to more accurate and consistent results in the assessment of the variables of interest. However, the use of hyperspectral data for predictions based on pineapple peel and fruit features can optimize assessments, curb fruit destruction, and be very relevant for post-harvest economics as it provides fast and accurate information, especially when using fruit peels. It is a more accurate, effective, and easy-to-use method. This technology could be made available to farmers and companies to provide information to predict the quality of pineapple fruit. In this way, losses and waste of pineapple fruit can be reduced.

5. Conclusions

The machine learning model, Support Vector Machine (SVM), provided the best results, demonstrating good generalization capacity and effectiveness in predicting these attributes, reaching accuracy values above 0.7 for Brix and ratio, for example, using fruit reflectance. In terms of the overall efficiency of the input variables, peel and fruit were the most informative, with peel standing out especially for the estimation of secondary metabolism compounds, while the fruit showed excellent performance in predicting flavor-related attributes, such as acidity, °Brix and ratio, as mentioned previously, above 0.7. These results highlight the potential of using spectral data and machine learning techniques in the non-destructive assessment of pineapple quality, enabling advances in monitoring and selecting fruits with better sensory and nutritional characteristics.

Author Contributions

Conceptualization, R.F.B., S.F.d.L., D.C.S. and P.E.T.; methodology, V.C.D.A., S.F.d.L., R.F.B., D.C.S., R.A.d.C. and A.C.d.S.C.S.; formal analysis, R.F.B., V.C.D.A., S.F.d.L. and D.C.S.; investigation, R.F.B., V.C.D.A., S.F.d.L., D.C.S. and R.A.d.C.; data curation, V.C.D.A., S.F.d.L., D.C.S., P.E.T. and L.P.R.T.; writing—original draft preparation, V.C.D.A., R.F.B. and D.C.S.; writing—review and editing, S.F.d.L., C.N.S.C., A.C.d.S.C.S., R.d.C.F.A., C.A.d.S.J. and F.L.C.M.; project administration, S.F.d.L., F.L.C.M., R.d.C.F.A. and C.N.S.C. All authors have read and agreed to the published version of the manuscript.

Funding

This study was financed in part by the Coordenação de Aperfeiçoamento de Pessoal de Nível Superior—Brazil (CAPES)—Financial Code 001.

Data Availability Statement

The original contributions presented in this study are included in the article. Further inquiries can be directed to the corresponding author.

Conflicts of Interest

The authors declare no conflicts of interest.

References

  1. Abraham, R.A.; Joshi, J.; Abdullah, S. A Comprehensive Review of Pineapple Processing and Its By-Product Valorization in India. Food Chem. Adv. 2023, 3, 100416. [Google Scholar] [CrossRef]
  2. Adedokun, T.O.; Matemu, A.; Höglinger, O.; Mlyuka, E.; Adedeji, A. Evaluation of Functional Attributes and Storage Stability of Novel Juice Blends from Baobab, Pineapple, and Black-Plum Fruits. Heliyon 2022, 8, e09340. [Google Scholar] [CrossRef]
  3. Guillén, L.; Monribot-Villanueva, J.L.; Guerrero-Analco, J.A.; Ortega, R.; Altúzar-Molina, A.; Mena, V.; Ruiz-May, E.; Aluja, M. Influence of Sunlight Incidence and Fruit Chemical Features on Oviposition Site Selection in Mango by Anastrepha Obliqua: Implications for Management. Insects 2022, 13, 141. [Google Scholar] [CrossRef]
  4. Amuah, C.L.Y.; Teye, E.; Lamptey, F.P.; Nyandey, K.; Opoku-Ansah, J.; Adueming, P.O.-W. Feasibility Study of the Use of Handheld NIR Spectrometer for Simultaneous Authentication and Quantification of Quality Parameters in Intact Pineapple Fruits. J. Spectrosc. 2019, 2019, 5975461. [Google Scholar] [CrossRef]
  5. Saradhuldhat, P.; Paull, R.E. Pineapple Organic Acid Metabolism and Accumulation during Fruit Development. Sci. Hortic. 2007, 112, 297–303. [Google Scholar] [CrossRef]
  6. Morais, D.R.; Rotta, E.M.; Sargi, S.C.; Schmidt, E.M.; Bonafe, E.G.; Eberlin, M.N.; Sawaya, A.C.H.F.; Visentainer, J.V. Antioxidant Activity, Phenolics and UPLC–ESI (–)–MS of Extracts from Different Tropical Fruits Parts and Processed Peels. Food Res. Int. 2015, 77, 392–399. [Google Scholar] [CrossRef]
  7. Adiani, V.; Gupta, S.; Variyar, P.S. Microbial Quality Assessment of Minimally Processed Pineapple Using GCMS and FTIR in Tandem with Chemometrics. Sci. Rep. 2020, 10, 6203. [Google Scholar] [CrossRef]
  8. Palumbo, M.; Cefola, M.; Pace, B.; Attolico, G.; Colelli, G. Computer Vision System Based on Conventional Imaging for Non-Destructively Evaluating Quality Attributes in Fresh and Packaged Fruit and Vegetables. Postharvest Biol. Technol. 2023, 200, 112332. [Google Scholar] [CrossRef]
  9. Wieme, J.; Mollazade, K.; Malounas, I.; Zude-Sasse, M.; Zhao, M.; Gowen, A.; Argyropoulos, D.; Fountas, S.; Van Beek, J. Application of Hyperspectral Imaging Systems and Artificial Intelligence for Quality Assessment of Fruit, Vegetables and Mushrooms: A Review. Biosyst. Eng. 2022, 222, 156–176. [Google Scholar] [CrossRef]
  10. Fan, X.; Sun, Z.; Tian, E.; Yin, Z.; Cao, G. Medical Image Contrast Enhancement Based on Improved Sparrow Search Algorithm. Int. J. Imaging Syst. Technol. 2023, 33, 389–402. [Google Scholar] [CrossRef]
  11. Zahidi, U.A.; Łukasik, K.; Cielniak, G. Dual-Band Feature Selection for Maturity Classification of Specialty Crops by Hyperspectral Imaging. arXiv 2024, arXiv:2405.09955. [Google Scholar]
  12. Doğan, D.E.; Rashid, H.H.R.; Lizalo, A.; Soysal, D.; Demirsoy, H. Growth, Fruit Bearing Behaviour, Yield and Quality of Some Apple Cultivars. Sci. Hortic. 2024, 327, 112762. [Google Scholar] [CrossRef]
  13. Yang, B.; Gao, Y.; Yan, Q.; Qi, L.; Zhu, Y.; Wang, B. Estimation Method of Soluble Solid Content in Peach Based on Deep Features of Hyperspectral Imagery. Sensors 2020, 20, 5021. [Google Scholar] [CrossRef]
  14. Tian, G.; Li, X.; Zhang, B.; Zhou, J.; Gu, B. Comparative Study of Two Different Strategies for Determination of Soluble Solids Content of Apples from Multiple Geographical Regions by Using FT-NIR Spectroscopy. IEEE Access 2019, 7, 179734–179745. [Google Scholar] [CrossRef]
  15. Davur, Y.J.; Kämper, W.; Khoshelham, K.; Trueman, S.J.; Bai, S.H. Estimating the Ripeness of Hass Avocado Fruit Using Deep Learning with Hyperspectral Imaging. Horticulturae 2023, 9, 599. [Google Scholar] [CrossRef]
  16. Zeb, A.; Qureshi, W.S.; Ghafoor, A.; Malik, A.; Imran, M.; Mirza, A.; Tiwana, M.I.; Alanazi, E. Towards Sweetness Classification of Orange Cultivars Using Short-Wave NIR Spectroscopy. Sci. Rep. 2023, 13, 325. [Google Scholar] [CrossRef]
  17. Tantinantrakun, A.; Sukwanit, S.; Thompson, A.K.; Teerachaichayut, S. Nondestructive evaluation of SW-NIRS and NIR-HSI for predicting the maturity index of intact pineapples. Postharvest Biol. Technol. 2023, 195, 112141. [Google Scholar] [CrossRef]
  18. Ali, M.M.; Hashim, N.; Abd Aziz, S.; Lasekan, O. Quality prediction of different pineapple (Ananas comosus) varieties during storage using infrared thermal imaging technique. Food Control 2022, 138, 108988. [Google Scholar]
  19. Mollazade, K.; Hashim, N.; Zude-Sasse, M. Towards a multispectral imaging system for spatial mapping of chemical composition in fresh-cut pineapple (Ananas comosus). Foods 2023, 12, 3243. [Google Scholar] [CrossRef]
  20. Dubreuil, V.; Fante, K.P.; Planchon, O.; Neto, J.L.S. Os Tipos de Climas Anuais No Brasil: Uma Aplicação Da Classificação de Köppen de 1961 a 2015. Confins. Rev. Fr.-Brésilienne Géographie/Rev. Fr.-Bras. Geogr. 2018. [Google Scholar] [CrossRef]
  21. da Cunha, F.F.; Magalhães, F.F.; de Castro, M.A. Métodos Para Estimativa Da Evapotranspiração de Referência Para Chapadão Do Sul-MS. Rev. Eng. Na Agric.-Reveng 2013, 21, 159–172. [Google Scholar]
  22. IUSS Working Group. International Soil Classification System for Naming Soils and Creating Legends for Soil Maps; IUSS Working Group: Vienna, Austria, 2014. [Google Scholar]
  23. Sousa, D.M.G.; Lobato, E. Cerrado: Correção Do Solo e Adubação; Embrapa Informação Tecnológica: Brasília, Brazil; Embrapa: Planaltina, Brazil, 2004; ISBN 8573832304. [Google Scholar]
  24. CEAGESP. A Medida Da Doçura Das Frutas; CEAGESP: São Paulo, Brazil, 2016. [Google Scholar]
  25. Zenebon, O.; Pascuet, N.S. Métodos Físico-Químicos Para Análise de Alimentos. In Métodos Físico-Químicos para Análise de Alimentos; Instituto Adolfo Lutz: São Paulo, Brazil, 2005; p. 1018. [Google Scholar]
  26. Carrão-Panizzi, M.C.; Favoni, S.P.d.G.; Kikuchi, A. Extraction Time for Soybean Isoflavone Determination. Braz. Arch. Biol. Technol. 2002, 45, 515–518. [Google Scholar] [CrossRef]
  27. Coelho, R.I.; Caetano, L.C.S.; Alexandre, R.S.; Zucoloto, M. Abacaxi: Do Plantio a Colheita; UFV: Viçosa, Brazil, 2019. [Google Scholar]
  28. de Gregori, G.S.; de Souza Loureiro, E.; Amorim Pessoa, L.G.; de Azevedo, G.B.; Azevedo, G.T.d.O.S.; Santana, D.C.; de Oliveira, I.C.; de Oliveira, J.L.G.; Teodoro, L.P.R.; Baio, F.H.R. Machine Learning in the Hyperspectral Classification of Glycaspis Brimblecombei (Hemiptera Psyllidae) Attack Severity in Eucalyptus. Remote Sens. 2023, 15, 5657. [Google Scholar] [CrossRef]
  29. Pereira Ribeiro Teodoro, L.; Estevão, R.; Santana, D.C.; de Oliveira, I.C.; Lopes, M.T.G.; de Azevedo, G.B.; Rojo Baio, F.H.; da Silva Junior, C.A.; Teodoro, P.E. Eucalyptus Species Discrimination Using Hyperspectral Sensor Data and Machine Learning. Forests 2023, 15, 39. [Google Scholar] [CrossRef]
  30. Santana, D.C.; de Oliveira, I.C.; de Oliveira, J.L.G.; Baio, F.H.R.; Teodoro, L.P.R.; da Silva Junior, C.A.; Seron, A.C.C.; Ítavo, L.C.V.; Coradi, P.C.; Teodoro, P.E. High-Throughput Phenotyping Using VIS/NIR Spectroscopy in the Classification of Soybean Genotypes for Grain Yield and Industrial Traits. Spectrochim. Acta A Mol. Biomol. Spectrosc. 2024, 310, 123963. [Google Scholar] [CrossRef]
  31. R Core Team. R: A Language and Environment for Statistical Computing; R Core Team: Vienna, Austria, 2013. [Google Scholar]
  32. Zikiou, N.; Lahdir, M.; Helbert, D. Support Vector Regression-Based 3D-Wavelet Texture Learning for Hyperspectral Image Compression. Vis. Comput. 2020, 36, 1473–1490. [Google Scholar] [CrossRef]
  33. Zhang, K.; Yan, F.; Liu, P. The Application of Hyperspectral Imaging for Wheat Biotic and Abiotic Stress Analysis: A Review. Comput. Electron. Agric. 2024, 221, 109008. [Google Scholar] [CrossRef]
  34. Caporaso, N.; Whitworth, M.B.; Grebby, S.; Fisk, I.D. Non-Destructive Analysis of Sucrose, Caffeine and Trigonelline on Single Green Coffee Beans by Hyperspectral Imaging. Food Res. Int. 2018, 106, 193–203. [Google Scholar] [CrossRef]
  35. Khan, A.; Vibhute, A.D.; Mali, S.; Patil, C.H. A Systematic Review on Hyperspectral Imaging Technology with a Machine and Deep Learning Methodology for Agricultural Applications. Ecol. Inf. 2022, 69, 101678. [Google Scholar] [CrossRef]
  36. Zhang, P.; Ji, H.; Wang, H.; Liu, Y.; Zhang, X.; Ren, C. Quantitative Evaluation of Impact Damage to Apples Using NIR Hyperspectral Imaging. Int. J. Food Prop. 2021, 24, 457–470. [Google Scholar] [CrossRef]
  37. Xie, W.; Wei, S.; Zheng, Z.; Jiang, Y.; Yang, D. Recognition of Defective Carrots Based on Deep Learning and Transfer Learning. Food Bioprocess Technol. 2021, 14, 1361–1374. [Google Scholar] [CrossRef]
  38. Fan, S.; Li, J.; Zhang, Y.; Tian, X.; Wang, Q.; He, X.; Zhang, C.; Huang, W. On Line Detection of Defective Apples Using Computer Vision System Combined with Deep Learning Methods. J. Food Eng. 2020, 286, 110102. [Google Scholar] [CrossRef]
  39. Hasanzadeh, B.; Abbaspour-Gilandeh, Y.; Soltani-Nazarloo, A.; Hernández-Hernández, M.; Gallardo-Bernal, I.; Hernández-Hernández, J.L. Non-Destructive Detection of Fruit Quality Parameters Using Hyperspectral Imaging, Multiple Regression Analysis and Artificial Intelligence. Horticulturae 2022, 8, 598. [Google Scholar] [CrossRef]
  40. Xuan, G.; Gao, C.; Shao, Y. Spectral and Image Analysis of Hyperspectral Data for Internal and External Quality Assessment of Peach Fruit. Spectrochim. Acta A Mol. Biomol. Spectrosc. 2022, 272, 121016. [Google Scholar] [CrossRef]
  41. Tian, X.; Wang, Q.; Huang, W.; Fan, S.; Li, J. Online Detection of Apples with Moldy Core Using the Vis/NIR Full-Transmittance Spectra. Postharvest Biol. Technol. 2020, 168, 111269. [Google Scholar] [CrossRef]
  42. Fan, L.; Yu, J.; Zhang, P.; Xie, M. Prediction of Strawberry Quality during Maturity Based on Hyperspectral Technology. Agronomy 2024, 14, 1450. [Google Scholar] [CrossRef]
  43. Liu, M.; Liu, M.; Bai, L.; Shang, W.; Ren, R.; Zhao, Z.; Sun, Y. Establishing a Berry Sensory Evaluation Model Based on Machine Learning. Foods 2023, 12, 3502. [Google Scholar] [CrossRef]
  44. Çetin, N.; Karaman, K.; Kavuncuoğlu, E.; Yıldırım, B.; Jahanbakhshi, A. Using Hyperspectral Imaging Technology and Machine Learning Algorithms for Assessing Internal Quality Parameters of Apple Fruits. Chemom. Intell. Lab. Syst. 2022, 230, 104650. [Google Scholar] [CrossRef]
  45. Caires, E.F.; Sharr, D.A.; Joris, H.A.W.; Haliski, A.; Bini, A.R. Phosphate Fertilization Strategies for Soybean Production after Conversion of a Degraded Pastureland to a No-till Cropping System. Geoderma 2017, 308, 120–129. [Google Scholar] [CrossRef]
  46. Liu, J.; Wang, X. Plant Diseases and Pests Detection Based on Deep Learning: A Review. Plant Methods 2021, 17, 22. [Google Scholar] [CrossRef]
  47. Zhang, J.; Han, M.; Wang, L.; Chen, M.; Chen, C.; Shen, S.; Liu, J.; Zhang, C.; Shang, J.; Yan, X. Study of Genetic Variation in Bermuda Grass along Longitudinal and Latitudinal Gradients Using Spectral Reflectance. Remote Sens. 2023, 15, 896. [Google Scholar] [CrossRef]
  48. de Oliveira, I.C.; Santana, D.C.; de Oliveira, J.L.G.; Silva, E.V.M.; da Silva Candido Seron, A.C.; Blanco, M.; Teodoro, L.P.R.; da Silva Júnior, C.A.; Baio, F.H.R.; Alves, C.Z. Flavonoids and Their Relationship with the Physiological Quality of Seeds from Different Soybean Genotypes. Sci. Rep. 2024, 14, 17008. [Google Scholar] [CrossRef]
  49. Sharma, S.; Majumdar, R.K.; Mehta, N.K.; Nirmal, N.P. Effects of Pineapple Peel Ethanolic Extract on the Physicochemical and Textural Properties of Surimi Prepared from Silver Carp (Hypophthalmichthys Molitrix). Foods 2022, 11, 3223. [Google Scholar] [CrossRef]
  50. Lourenço, S.C.; Campos, D.A.; Gómez-García, R.; Pintado, M.; Oliveira, M.C.; Santos, D.I.; Corrêa-Filho, L.C.; Moldão-Martins, M.; Alves, V.D. Optimization of Natural Antioxidants Extraction from Pineapple Peel and Their Stabilization by Spray Drying. Foods 2021, 10, 1255. [Google Scholar] [CrossRef]
  51. Bhargava, A.; Bansal, A. Automatic Detection and Grading of Multiple Fruits by Machine Learning. Food Anal. Methods 2020, 13, 751–761. [Google Scholar] [CrossRef]
  52. Senapaty, M.K.; Ray, A.; Padhy, N.A. Decision Support System for Crop Recommendation Using Machine Learning Classification Algorithms. Agriculture 2024, 14, 1256. [Google Scholar] [CrossRef]
  53. Wang, J.; Tian, G.; Tao, Y.; Lu, C. Prediction of Chongqing’s Grain Output Based on Support Vector Machine. Front. Sustain. Food Syst. 2023, 7, 1015016. [Google Scholar] [CrossRef]
Figure 1. Air temperature and humidity during the period of the study.
Agriengineering 07 00170 g001
Table 1. Results of soil chemical analysis.
pH M.O.CaMgAlH + AlKP (res)SBCuFe Mn ZnCECVm
CaCl2g dm−3cmolc dm−3 mg dm−3cmolc dm−3 %
5.130.83.51.30.064.68151.620.220.17513.74.39.6152.101.20
CEC: cation exchange capacity; V: base saturation; m: aluminum saturation.
Table 2. Summary of mean squares analysis of variance for variables acidity, brix, ratio, daidzein, daidzin, and genistin.
AcidityBrixRatio
SVDFrMAErMAErMAE
input20.38 *0.00 *0.950.27 *1.67 *4.03 *
ML50.24 *0.00 *0.950.42 *0.76 *2.68 *
input*ML100.05 *0.00 *0.150.09 *0.13 *0.67 *
Residuals1620.010.000.010.010.010.06
C.V. (%) 54.129.5535.617.9928.58.18
DaidzeinDaidzinGenistin
SVDFrMAErMAErMAE
input21.24 *12,777.50 *0.14 *447,058.5 *0.24 *87,562.50 *
ML50.50 *79,054.20 *0.72 *1,086,434.8 *1.36 *1,386,911.20 *
input*ML100.11 *8379.00 *0.03 *48,049.1 *0.06 *56,612.60 *
Residuals1620.01500.72017,094.070.0123,844.35
C.V. (%) 39.168.7842.378.0334.4413.8
SV: source of variations; DF: degrees of freedom; C.V. coefficient of variation; * significant at 5% probability by F test; Pearson’s correlation coefficient (r), and Mean absolute error (MAE).
Table 3. Accuracy of machine learning models, Pearson’s correlation coefficient (r), and Mean absolute error (MAE), in predicting acidity of pineapple fruits using leaf, peel, and fruit spectral data.
rMAE
LeafPeelFruit LeafPeelFruit
ANN0.108 aB0.111 bB0.282 bAANN0.065 aB0.075 aA0.062 aB
M5P0.074 bB0.301 aA0.261 bAM5P0.063 aA0.056 cB0.051 cC
Reptree0.028 bB0.136 bA0.178 cAReptree0.056 bA0.056 cA0.054 bA
RF0.111 aB0.176 bB0.295 bARF0.056 bA0.056 cA 0.050 cB
SVM0.176 aB0.156 bB0.434 aASVM0.059 bA0.062 bA0.049 cB
ZeroR0.000 bA0.00 cA0.000 dAZeroR0.055 bA0.055 cA0.055 bA
Means with the same lowercase letter are statistically similar between models and means followed by the same uppercase letter are statistically similar between inputs.
Table 4. Accuracy of machine learning models, Pearson’s correlation coefficient (r), and Mean absolute error (MAE), in predicting pineapple fruit °Brix using leaf, peel, and fruit spectral data.
rMAE
LeafPeelFruit LeafPeelFruit
ANN0.066 cB0.234 dA0.203 bAANN1.254 aA1.272 aA1.205 aA
M5P0.102 bC0.485 bA0.212 bBM5P1.163 bA0.928 cC1.084 bB
Reptree0.042 cB0.253 dA0.075 cBReptree1.093 cA1.039 bA1.080 bA
RF0.076 cC0.319 cA0.158 bBRF1.150 bA0.997 bB1.086 bA
SVM0.172 aC0.66 aB0.75 aASVM1.124 bA0.811 dB0.680 cC
ZeroR0.00 cA0.00 eA0.00 dAZeroR1.063 cA1.063 bA1.063 bA
Means with the same lowercase letter are statistically similar between models and means followed by the same uppercase letter are statistically similar between inputs.
Table 5. Accuracy of machine learning models, Pearson’s correlation coefficient (r), and Mean absolute error (MAE), in predicting pineapple fruit ratio using leaf, peel, and fruit spectral data.
rMAE
LeafPeelFruit LeafPeelFruit
ANN0.093 bB0.346 bA0.362 bAANN3.720 aA3.568 aA3.173 aB
M5P0.095 bC0.570 aA0.333 bBM5P3.310 bA2.469 dC2.895 bB
Reptree0.008 cC0.393 bA0.273 cBReptree3.033 cA2.687 cB2.883 bA
RF0.074 bB0.412 bA0.360 bARF3.185 bA2.687 cB2.714 bB
SVM0.174 aC0.562 aB0.725 aASVM3.232 bA2.489 dB2.019 cC
ZeroR0.00 cA0.00 cA0.00 dAZeroR3.008 cA3.008 bA3.008 aA
Means with the same lowercase letter are statistically similar between models and means followed by the same uppercase letter are statistically similar between inputs.
Table 6. Accuracy of machine learning models, Pearson’s correlation coefficient (r), and Mean absolute error (MAE), in predicting daidzein in pineapple fruits using leaf, peel, and fruit spectral data.
rMAE
LeafPeelFruit Leaf PeelFruit
ANN0.075 cA0.161 cA0.102 cAANN310.187 aC359.749 aA338.478 aB
M5P0.162 bC0.599 aA0.512 bBM5P276.060 bA179.492 cC212.195 cB
Reptree0.067 cB0.347 bA0.080 cBReptree270.085 bA196.515 cB262.159 bA
RF0.164 bA0.187 cA0.079 cBRF266.114 bA267.069 bA274.923 bA
SVM0.357 aB0.625 aA0.607 aASVM215.905 cA161.243 dB178.229 dB
ZeroR0.00 cA0.00 dA0.00 dAZeroR272.519 bA272.519 bA272.519 bA
Means with the same lowercase letter are statistically similar between models and means followed by the same uppercase letter are statistically similar between inputs.
Table 7. Accuracy of machine learning models, Pearson’s correlation coefficient (r), and Mean absolute error (MAE), in predicting daidzin in pineapple fruits using leaf, peel, and fruit spectral data.
rMAE
LeafPeelFruit Leaf PeelFruit
ANN0.093 cA0.119 bA0.111 cAANN1840.349 aB2111.034 aA1896.946 aB
M5P0.392 bA0.332 aB0.276 bBM5P1429.367 cA1526.262 d1495.031 cA
Reptree0.154 cA 0.042 cB0.052 dBReptree1572.907 bA1672.038 cA1657.996 bA
RF0.324 bA0.107 bB0.112 cBRF1468.658 cB1780.415 bA1705.189 bA
SVM0.483 aA0.319 aC0.406 aBSVM1249.305 dB1499.100 dA1427.778 cA
ZeroR0.00 dA0.00 cA0.00 dAZeroR1653.085 bA1653.085 cA1653.085 bA
Means with the same lowercase letter are statistically similar across models, and means followed by the same uppercase letter are statistically similar across inputs.
Table 8. Accuracy of machine learning models, Pearson’s correlation coefficient (r), and Mean absolute error (MAE), in predicting genistin in pineapple fruits using leaf, peel and fruit spectral data.
rMAE
LeafPeelFruit Leaf PeelFruit
ANN0.124 cA0.164 dA0.084 cAANN1435.971 aA1583.069 aA1451.005 aA
M5P0.247 bB0.531 bA0.462 bAM5P1162.020 bA889.098 cB 1003.002 bB
Reptree0.081 cB 0.254 cA 0.032 dBReptree1129.890 bA1008.516 bA1120.375 bA
RF0.199 bA0.251 cA0.114 cBRF1170.945 bA1114.287 bA1155.882 bA
SVM0.439 aB 0.629 aA0.644 aASVM924.911 cA776.740 cA801.380 cA
ZeroR0.000 dA0.000 eA0.000 dAZeroR1139.489 bA1139.489 bA1139.489 bA
Means with the same lowercase letter are statistically similar between models and means followed by the same uppercase letter are statistically similar between inputs.
Disclaimer/Publisher’s Note: The statements, opinions and data contained in all publications are solely those of the individual author(s) and contributor(s) and not of MDPI and/or the editor(s). MDPI and/or the editor(s) disclaim responsibility for any injury to people or property resulting from any ideas, methods, instructions or products referred to in the content.

