Article

Canopy Transpiration Mapping in an Apple Orchard Using High-Resolution Airborne Spectral and Thermal Imagery with Weather Data

1
Department of Biological Systems Engineering, Tidewater AREC, Virginia Tech, Suffolk, VA 23437, USA
2
Department of Biological Systems Engineering, Washington State University, Pullman, WA 99164, USA
3
Innov8.ag, Walla Walla, WA 99362, USA
*
Authors to whom correspondence should be addressed.
AgriEngineering 2025, 7(5), 154; https://doi.org/10.3390/agriengineering7050154
Submission received: 28 February 2025 / Revised: 26 April 2025 / Accepted: 7 May 2025 / Published: 14 May 2025

Abstract

:
Precision irrigation requires reliable estimates of crop evapotranspiration (ET) using site-specific crop and weather data inputs. Such estimates are needed at high resolutions which have been minimally explored for heterogeneous crops such as orchards. In addition, weather information for estimating ET is very often selected from sources that do not represent conditions like heterogeneous site-specific conditions. Therefore, a study was conducted to map geospatial ET and transpiration (T) of a high-density modern apple orchard using high-resolution aerial imagery, as well as to quantify the impact of site-specific weather conditions on the estimates. Five campaigns were conducted in the 2020 growing season to acquire small unmanned aerial system (UAS)-based thermal and multispectral imagery data. The imagery and open-field weather data (solar radiation, air temperature, wind speed, relative humidity, and precipitation) inputs were used in a modified energy balance (UASM-1 approach) extracted from the Mapping ET at High Resolution with Internalized Calibration (METRIC) model. Tree trunk water potential measurements were used as reference to evaluate T estimates mapped using the UASM-1 approach. UASM-1-derived T estimates had very strong correlations (Pearson correlation [r]: 0.85) with the ground-reference measurements. Ground reference measurements also had strong agreement with the reference ET calculated using the Penman–Monteith method and in situ weather data (r: 0.89). UASM-1-based ET and T estimates were also similar to conventional Landsat-METRIC (LM) and the standard crop coefficient approaches, respectively, showing correlation in the range of 0.82–0.95 and normalized root mean square differences [RMSD] of 13–16%. UASM-1 was then modified (termed as UASM-2) to ingest a locally calibrated leaf area index function. This modification deviated the components of the energy balance by ~13.5% but not the final T estimates (r: 1, RMSD: 5%). Next, impacts of representative and non-representative weather information were also evaluated on crop water uses estimates. For this, UASM-2 was used to evaluate the effects of weather data inputs acquired from sources near and within the orchard block on T estimates. Minimal variations in T estimates were observed for weather data inputs from open-field stations at 1 and 3 km where correlation coefficients (r) ranged within 0.85–0.97 and RMSD within 3–13% relative to the station at the orchard-center (5 m above ground level). Overall, the results suggest that weather data from within 5 km radius of orchard site, with similar topography and microclimate attributes, when used in conjunction with high-resolution aerial imagery could be useful for reliable apple canopy transpiration estimation for pertinent site-specific irrigation management.

Graphical Abstract

1. Introduction

A significant amount of irrigation water is lost to the atmosphere in the form of crop transpiration (T, essentially crop water uptake) and soil water evaporation (E), collectively referred to as evapotranspiration (ET). Estimation of ET is used for irrigation management. Conventionally, ET is estimated using small or point scale approaches such as soil water balance, sap flow sensors, eddy covariance, and canopy gas exchange. Such estimates are reliable but often lack sufficient spatial coverage for the implementation of site-specific/block level irrigation management [1,2,3,4]. Eddy covariance fluxes and generalized season-average standard crop coefficients [5] can also be used for ET estimation but provide single-point estimates on a spatial scale and do not assess spatial variation of the crop water demand [2,6].
Satellite-based remote sensing has emerged in the past two decades to map geospatial ET at large scale [7,8,9]. Remote sensing data from satellites is ingested into the energy balance models (for example, single-source models and dual source models) that compute the latent heat flux (LE) exchanged with the atmosphere. This LE is converted to the actual rate of water that plants transpire and soil evaporates. One such energy balance model is Mapping ET at High Resolution with Internalized Calibration (METRIC), which has been widely adopted for its estimation errors of 5–15% [10,11,12,13,14]. The major advantages of the METRIC model include limited dependency on actual crop information, internal calibration of the energy balance between extreme conditions, lower data requirements, and bias compensation due to atmosphere and data uncertainties. However, the model was developed for satellite-based imagery inputs from high orbital satellites (Landsat and MODIS [Moderate Resolution Imaging Spectroradiometer]), which leads to low resolution ET outputs (~30 m/pixel for Landsat and 1 km for MODIS) [1,2,15]. This is because the energy balance models are dependent on thermal infrared imaging wavebands which are available only with high orbital (low spatial resolution) satellites. As a result, the available resolution is not sufficient to segment irrigated crop rows and non-irrigated inter-row regions in heterogeneous cropping systems such as orchards and vineyards [4]. Low recurrence frequency (~16 days for Landsat) and cloud covers are additional challenges that often lead to no or poor ET estimation from satellite imagery. Such limitations could be avoided with small unmanned aerial systems (UASs) which can be leveraged to collect crop imagery on-demand and at flexible high spatial resolution (up to mm/pixel) [3,4]. Small UASs with METRIC model have been reliably used to map ET of field crops and heterogeneous vineyards [1,2,3,4,15]. However, such approaches have been limitedly explored for other high-density heterogeneous crops such as apple orchards [6], which will be addressed in this study.
Weather information is another most critical input for computing crop water use, either with energy balance models or other empirical models. Weather data are used to compute reference ET, which is the rate of water lost from a well-watered uniform reference crop surface (shortgrass [ETo] or alfalfa [ETr]). When shortgrass is used as a reference crop, ETo is used to denote reference ET, whereas when alfalfa is used as a reference crop, the reference ET is denoted by ETr. This reference ET is multiplied by a specific-crop factor referred to as crop coefficient to compute actual ET of the given crop. Crop factor encompasses biological composition, type, and growth stage, while the reference ET is represented by environmental conditions that includes localized weather and soil conditions [16,17,18]. At sufficient soil moisture status, the ambient temperature (AT), relative humidity (RH), solar radiation (SR), and wind speed (WS) are the critical drivers of crop ET [18]. Such parameters are typically acquired from open-field weather stations near the target site and installed over healthy and fully transpiring standard vegetation, mostly short grass [19]. However, AT and RH from open-field weather stations may deviate considerably relative to the site of interest. This can be due to surface energy balances affected by topography, crop physiology, and local microclimate differences [20,21,22,23,24]. Such deviations may be higher in case of tree crops where the local climate varies with canopy height and architectures, soil wetness, and other factors to suppress or enhance the ET rates [22,23,24,25,26]. For example, in modern apple orchards with inter-row grass cover, the sensible heat (H) and LE from the canopy may be different than a vineyard with bare soil in the inter-row region. The differences are also attributable to the overhead sprinkler systems in the apple orchards that are used to manage the fruit sunburn risks.
Studies have reported deviation in weather, affecting ETr and energy balance calculations, when using inputs from sources at an increasing distance from the target site [21,23,24,27,28]. So far, the effects of weather data from sources around or within the target site on estimating T has not been studied, and they are therefore the focus of this study. Apple is a very important fruit crop of the US with Washington State producing 73% of the total US apples. The regions producing apples are mostly arid and semi-arid and are completely dependent on freshwater irrigation. Additionally, site-specific management operations such as evaporative cooling can significantly impact the microclimate, and therefore the actual water requirement. Therefore, irrigation management for apples is highly critical, and hence apples were selected as the model crop for this study. This study hypothesizes that aerial imagery coupled with site-specific weather information produces the most precise and representative estimates of actual crop water use for heterogeneous apple orchard. Specific objectives to evaluate this hypothesis are (1) mapping evapotranspiration and transpiration of a high-density apple orchard using small UAS-based thermal and multispectral imagery, as well as the METRIC energy balance model, and (2) assessing the deviation effects of site-specific crop, and local open-field and in-canopy weather data inputs on transpiration estimates.

2. Materials and Methods

2.1. Study Site

An 8.1 ha commercial apple orchard block shown in Figure 1 (46°28′31″ N, 119°13′11″ W) was selected for this study. The trees were of Buckeye Gala variety (Rootstock: Bu-dagovsky-9, age: 11 year). The trees were trained in a modern V-trellis architecture with tree and row spacing of 60 and 300 cm, respectively. The average tree height was about 330 cm in 2020 field season. The trees were irrigated using under-tree drip systems at an interval of 2–3 days and at rates determined by the grower based on season-average non-stressed crop coefficient (0.9, Food and Agricultural Organization (FAO) of the United Nations) coupled to ETo. Irrigation rate was based on historic yields and to meet production goals. The inter-rows were maintained with periodically irrigated shortgrass vegetation to have a cool microclimate for fruits during the critical growth stages. The trees were also cooled with overhead sprinklers to manage heat stress in maturing fruits. In 2020, growth season was from April 5 (bud break) to August 25 (harvest). Per the nearest open-field weather station (3 km), for the last 10 years (2010–2020), the site annually received a total precipitation of 172 mm and had average ambient temperature of 11.1 °C (Minimum: 4.7 °C, Maximum: 17.6 °C).

2.2. Aerial Imaging

Aerial imagery data were collected in the 2020 growing season to map geospatial ET (and T) of the apple orchard. A small UAS (Figure 2) was deployed with a five-band multispectral imaging sensor (RedEdge 3, Micasense, Seattle, WA, USA) and a radiometric thermal longwave infrared imaging sensor (Duo Pro R, Teledyne FLIR, Wilsonville, OR, USA) to capture images at 7 and 13 cm/pixel, respectively, at 100 m above ground level (AGL). The flight missions were configured to capture images at 75% front and 65% side overlaps using the ground control software (Mission Planner 1.3.70, Ardupilot, Open-Source Project). The UAS also had a downwelling light sensor (DLS, Micasense, Seattle, WA, USA) facing skyward to measure incoming solar irradiance in the multispectral spectrum during each image snapshot acquisition. This information along with the images of calibrated reflectance panel (CRP, Micasense, Seattle, WA, USA) were used for radiometric correction of multispectral images. Thermal imaging sensor was calibrated using the known set temperatures of a blackbody calibrator in outdoor conditions. All the imaging configurations are detailed in Chandel et al. [2,4]. A real-time kinematics global positioning system (GPS) receiver was used to record the locations of 13 ground control points around the orchard which were used during image stitching operations for orthomosaic georectification. A total of five imaging campaigns were conducted on 92, 76, 41, and 21 days before harvest (DBH) and 5 days after harvest (DAH). The campaign on 41 DBH was aligned on the day and time (~12 PM) with the Landsat 7 satellite overpass.

2.3. Weather Data

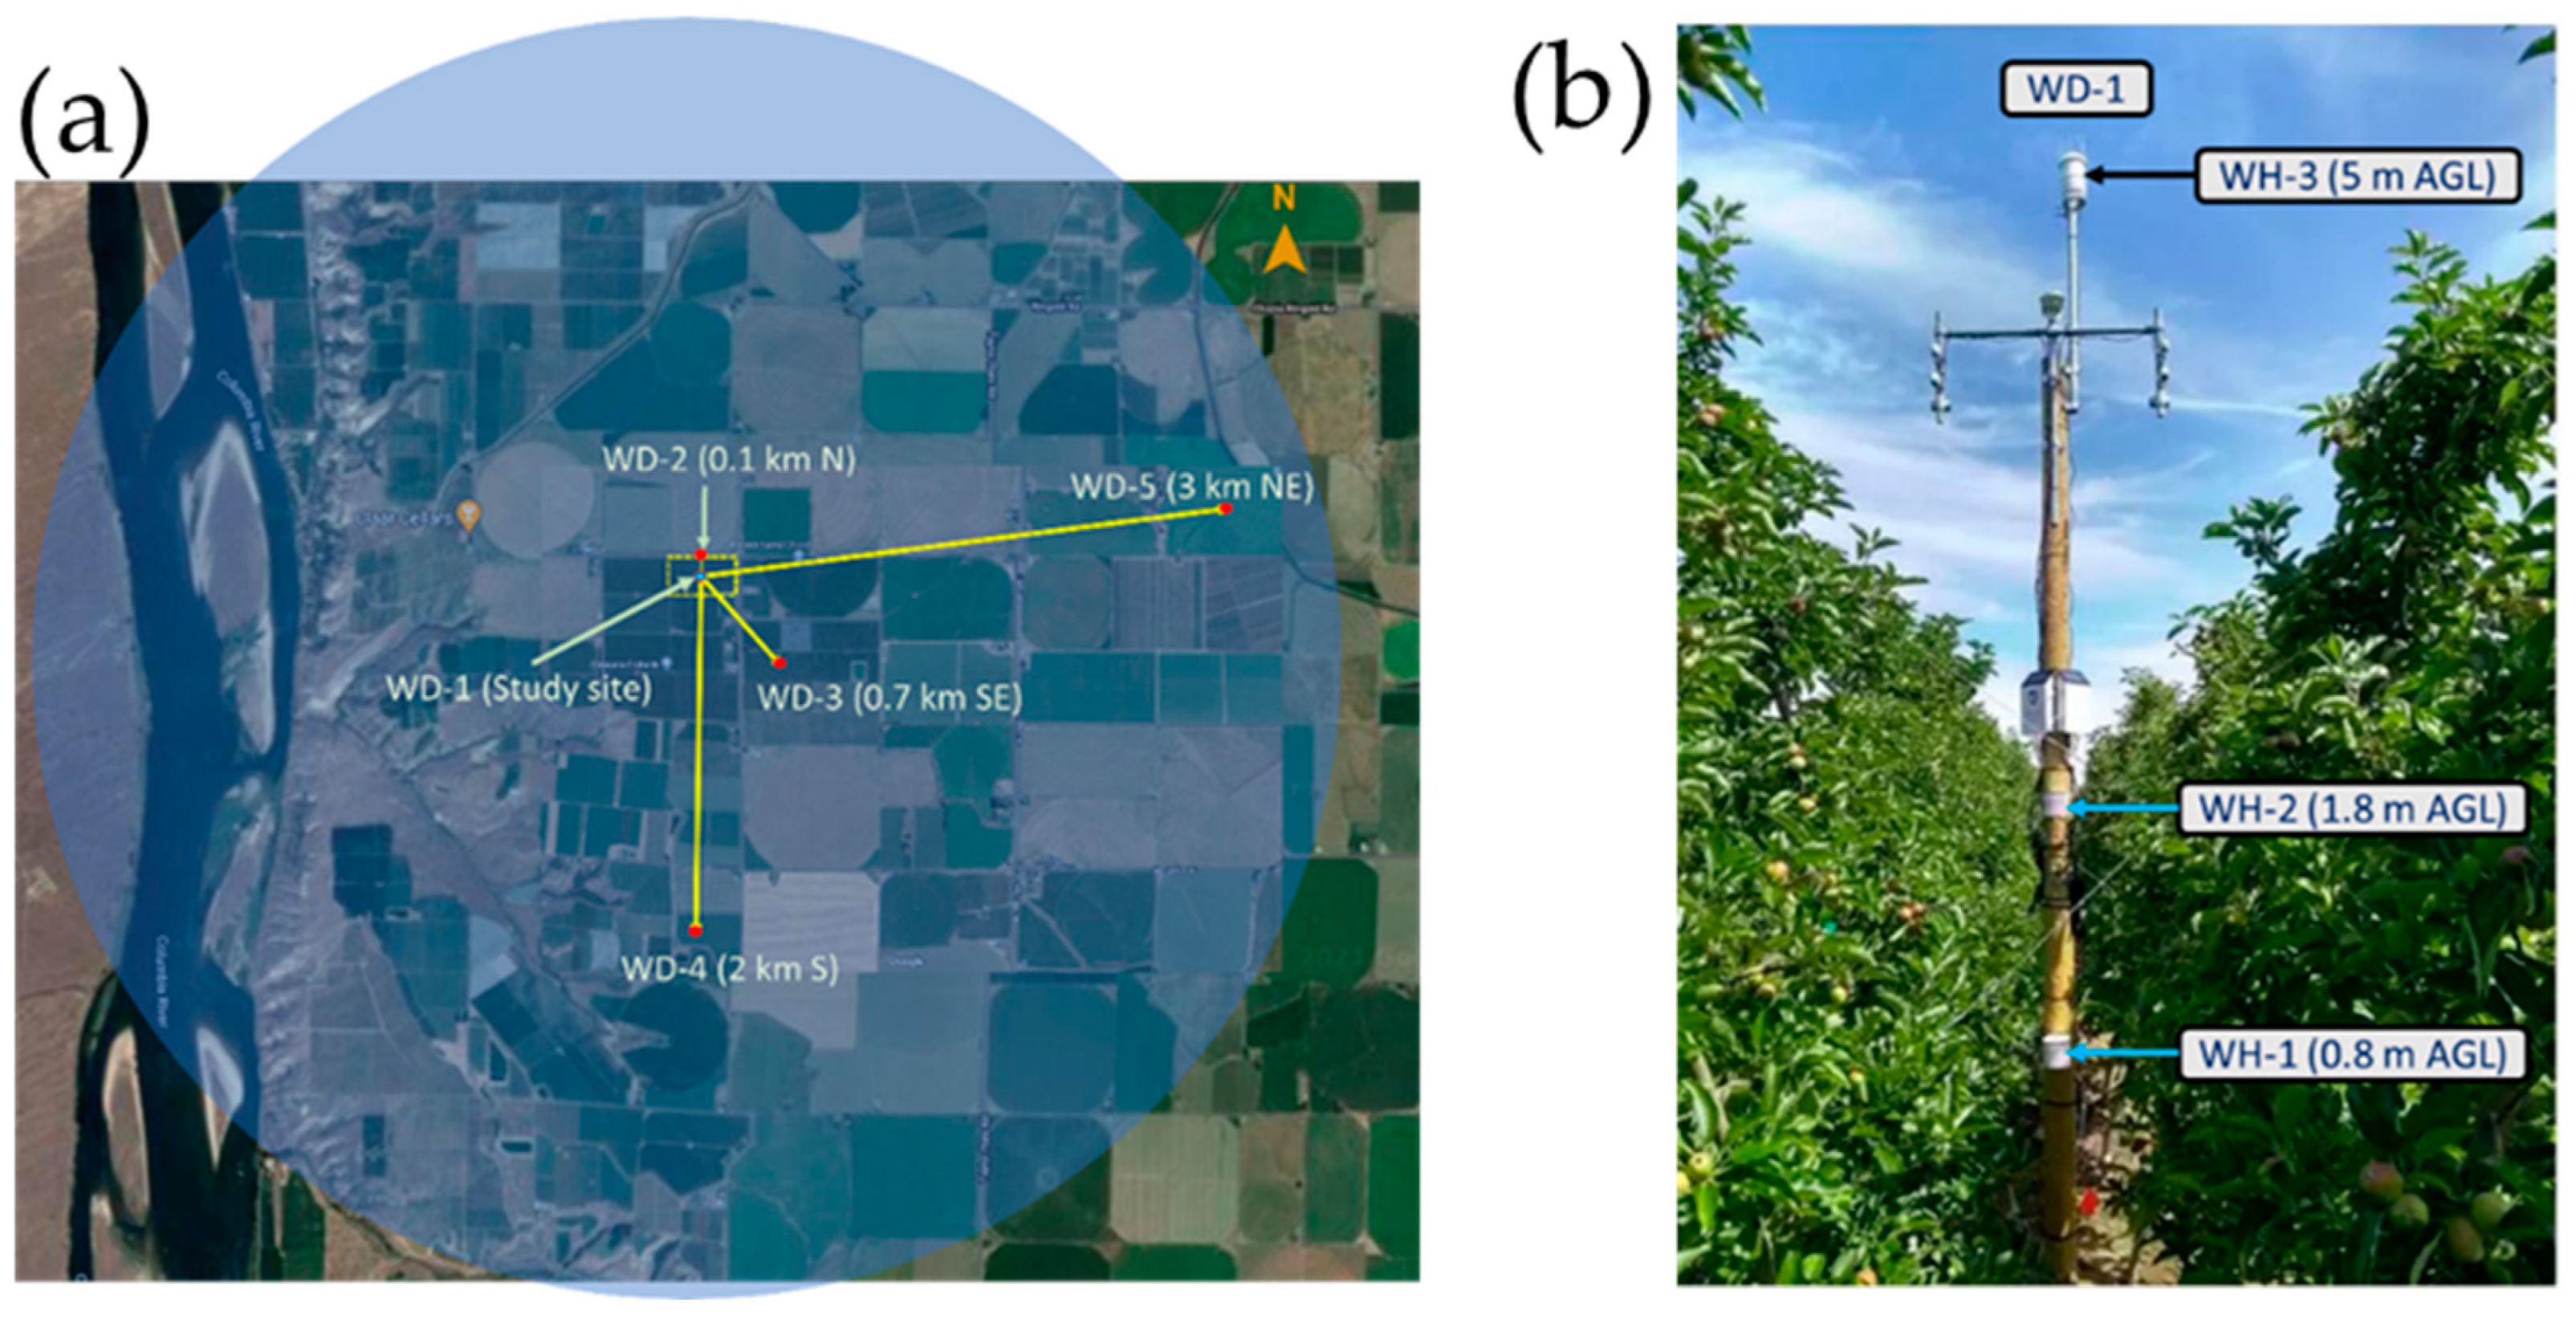
Five weather stations within a 5 km radius of the site were selected in the study (Figure 3, Table 1). These included a station (WD-1) installed at the center of the orchard block. The second station (WD-2) was at 0.1 km N, the third station (WD-3) at 0.7 km SE, the fourth (WD-4) at 2 km S, and the fifth (WD-5) at 3 km NE of the site-center. WD-3 and -4 were installed by WSU-AgWeatherNet (Washington State University, Pullman, WA, USA) in association with the cooperator grower, while WD-5 was installed exclusively by WSU-AgWeatherNet. Stations WD-2 through WD-5 were open-field with sensors installed at 2 m AGL over irrigated short grass. Stations WD-1 and -2 were active since 1 May 2020, while WD-3 and WD-4 since 6 June 2020, and WD-5 since 18 September 2007. WD-1 to WD-4 have factory-calibrated all-in-one weather sensors (ATMOS 41, Meter Group Inc., Pullman, WA, USA) while WD-5 integrates climate sensors (soil temperature and moisture, wind, leaf wetness, precipitation, solar radiation, air pressure) (Campbell Scientific, Logan, UT, USA). Weather parameters are logged at 15 min interval on respective data loggers (WD-1 to WD-4 on ZL6, Meter Group Inc., and WD-5 on CR1000, Campbell Scientific) and later uploaded to respective servers (WD-1 to WD-4 on Zentra cloud, Meter Group Inc., and WD-5 on WSU-AgWeatherNet). Station WD-3 was surrounded by high density apple orchards, WD-4 by surface-drip-irrigated vineyards, apple orchard, and irrigated short field crops. WD-5 was surrounded by irrigated short field crops and modern apple orchards.
On WD-1, all-in-one weather sensors were installed at 0.8 m (WH-1), 1.8 m (WH-2), and 5 m (WH-3) height AGL (Figure 3b). Using these three sensors, height-gradient-based weighted mean (WMean) and median (Median) of measurements were obtained to account for entire vertical microclimate of the target site for improved T estimation [29]. Since the evaluated orchard was trained in a V-shaped architecture, the interaction of canopy with weather would change with the canopy height. This is the reason for using height-based gradients to compute WMean weather parameters. Inputs from WD-5 were used for objective-1 and part-I of objective-2. Data from WD-1 to WD-5, WH-1 to WH-3, and Median and WMean were used for part-II of objective-2 (explained below).

2.4. Evapotranspiration Mapping

The UAS imagery was stitched using sequential image stitching operations in a photogrammetry and mapping software (Pix4D Mapper 4.8.2, Pix4D, Inc., Lausanne, Switzerland) to obtain orthomosaics of the study site. A high-resolution digital elevation model because of multispectral image stitching was also obtained. The thermal orthomosaic was then resampled to the multispectral imagery resolution (~7 cm/pixel). All the other imagery preprocessing methods are detailed in Chandel et al. [2,4]. A modified METRIC model as described in Chandel et al. [2,4] was used to process the above obtained orthomosaics to derive high-resolution ET maps (objective-1, UASM-1 approach). The METRIC model computes the LE as the residue of net radiation (Rn) on to the land surface, soil heat flux (G) going down to the soil, and iteratively computed sensible heat flux (H) that is exchanged with the atmosphere due to temperature differences without changing the state. This LE is converted to actual water lost to the atmosphere i.e., instantaneous ET (mm h−1) using the latent heat of vaporization and density of water. Next, reference ET fraction is computed as the ratio of instantaneous ET and reference ET for that hour. Reference ET in METRIC is calculated for alfalfa as the standard crop of 0.5 m height which is well irrigated. The reference ET fraction is nothing but the crop-coefficient, which is multiplied with 24 h reference ET to compute daily ET. More details of the model can be found in [8,9]. The METRIC model was selected for its low input data requirements compared to other energy balance models, its minimum crop related information dependency, and, most importantly, its internal calibration feature. The METRIC model during its computation of sensible heat flux calibrates the entire energy balance between non-transpiring (bare soil) and fully-transpiring (well irrigated vegetation) conditions represented in the image pixels. This calibration compensates for any biases arising from atmospheric uncertainties, thermal infrared imaging, and any other internal computations. Conventional Landsat satellite imagery-based METRIC approach (LM) maps regional-scale ET for 185 × 185 km scene size and at coarse resolution of 30 m/pixel. Therefore, all assumptions of LM approach might not necessarily apply at the field-scale [1], specifically for heterogeneous vegetation conditions like tree and orchard crops with bare land or a different vegetation between the tree or tree rows. Low spatial resolution inhibits delineation of different vegetations to compute canopy transpiration of individual trees with higher number of pixels. For this reason, high-resolution aerial imagery was chosen as the best technique for mapping tree-level canopy transpiration and their variations at field-scale. While the high-resolution of aerial imagery (7–13 cm/pixel) offers the capability to distinctively delineate different vegetation or surfaces on ground, the overlaps (75% front and 65% side) between aerial imagery snapshots enhance stitching or mapping precision for quality data retrieval of the trees.
To address constraints pertaining to LM approach, UASM-1 adopted modifications of input parameters specific to sensors and flight parameters that include (i) imagery metadata from flights, (ii) surface albedo computation pertaining to on-board multispectral imager, and (iii) high-resolution DEM obtained from stitched aerial imagery. All other model parameters were identical as the conventional LM approach. As a standard reference for comparisons of the UAS imagery-based estimates, ET was also mapped using conventional METRIC [9] with Landsat imagery inputs for overpass as discussed above (LM approach). Also, T was calculated using standard basal crop coefficient approach (FAO-Kcb, [5]), as a reference to T estimates from UASM-1. Tabulated short-grass-based Kcb values (Kcb apples,grass) for three growth stages of apples in arid and semi-arid climates for active ground cover and no frosts were selected from FAO irrigation and drainage paper [5,6]. These values were adjusted as per local conditions and converted to alfalfa-based Kcb values (Kcb apples,alfalfa, [5], Equations (1)–(4)). These Kcb values were then used to construct seasonal Kcb curves through linear interpolation for the 2020 season, and T on imaging days was calculated using such curves and pertaining 24 h reference ET (ETr24). ETr24 was calculated using weather data from WD-5 and the Penman–Monteith equation parameterized for an alfalfa reference crop [5].
Kcb apples (ini/mid/end),grass = Kcb apples (Tab: ini/mid/end),grass + [0.04 × (u2 − 2) − 0.004 × (RHmin−45)] × (h/3)0.3
Kratio = 1.2 + [0.04 × (u2 − 2) − 0.004 × (RHmin − 45)] × (0.5/3)0.3
Kcb apples,alfalfa = Kcb apples,grass/Kratio
T = Kcb apples,alfalfa × ETr24
where u2 is the mean daily wind speed (m s−1), RHmin is the mean daily minimum relative humidity (%) at the pertinent growth stage, Kratio is the factor for converting the grass-based crop coefficient (Kcb apples,grass) to the alfalfa-based crop coefficient (Kcb apples,alfalfa), and h is the mean tree height (3.3 m).
For part-I of objective-2, the UASM-1 was further modified (hereafter termed as UASM-2 approach) to use more localized crop and weather data inputs to compute the components of METRIC model. Herein, a locally calibrated function was first used to calculate the leaf area index (LAI). For this, 20 sample apple trees selected randomly within the orchard were marked with tags and white boards (55 × 90 cm) next to them in the inter-tree row region to be visible in the aerial imagery. These trees were manually measured for photosynthetically active radiation (PAR) below (PARbc) and above canopy (PARac) using a line quantum sensor (LI-191R) of 1 m length and a point quantum sensor (LI-290R), respectively (LI-COR, Inc., Lincoln, NE, USA). The line sensor was placed below the canopy (at bottom-trellis, 45 cm AGL) facing upwards, and the quantum sensor faced skywards above canopy to record uninterrupted SR. Three replicate measurements were collected per tree near the local solar noon (±2 h) on each imaging day and recorded in the data logger (LI-1500G, LI-COR, Inc.) with time and georeferencing stamps. The LAI was calculated using Equations (5) and (6) [30,31].
FPARI = (PARac − PARbc)/(PARac)
LAI = −ln(1 − FPARI)/k
where FPARI is the fraction of PAR interception by the canopy and k is the solar extinction coefficient of 0.68 for apple canopy measurements near solar noon [30,32]. Relationships were obtained between measured LAI and aerial imagery mapped soil adjusted vegetation index (SAVI), normalized difference vegetation index (NDVI), and green NDVI (GNDVI) of the sample trees. The best fit relationship was incorporated in the UASM-2 for LAI calculations. The next modification was of the momentum roughness length for heterogeneous crops as suggested by Perrier [33] (Equation (7)). The inputs used were mean tree height (h, 3.3 m in this study), LAI, and fraction of LAI (f, ~0.6 in this study) above half of the tree height. Next, the conventional method of calculating incoming shortwave radiation (ISWR) in the METRIC model (using solar constant, SR incidence angle, and relative earth to sun distance inputs) [8] was replaced by directly using the SR measured by the local weather station (WD-5). Lastly, the incoming longwave radiation (ILWR) component was calculated using Stefan–Boltzman law by replacing surface temperature with local AT [2]. Post-ET computation from UASM-1 and -2, T maps of the trees (~ET of canopy pixels) were segmented out from the background using SAVI feature histogram. For this, a vegetation mask was created out of the SAVI map using the histogram thresholds and multiplied with the ET map using the ‘raster calculator’ tool in QGIS (Ver 2.18.16, Open-Source project). For part-II of objective-2, UASM-2 was used independently with weather inputs from the sources listed in Section 2.3 to assess variations of T estimates. All implementations were done in R (R Core Team, Vienna, Austria, and RStudio, Inc., Boston, MA, USA) with “water” package as reference [34].
Zom = [(1 − exp(−a × LAI/2) × exp(−a × LAI/2)] × h
a = 2 × f   for f ≥ 0.5   and   (2 × (1 − f)) − 1   for f < 0.5

2.5. Ground Reference Data

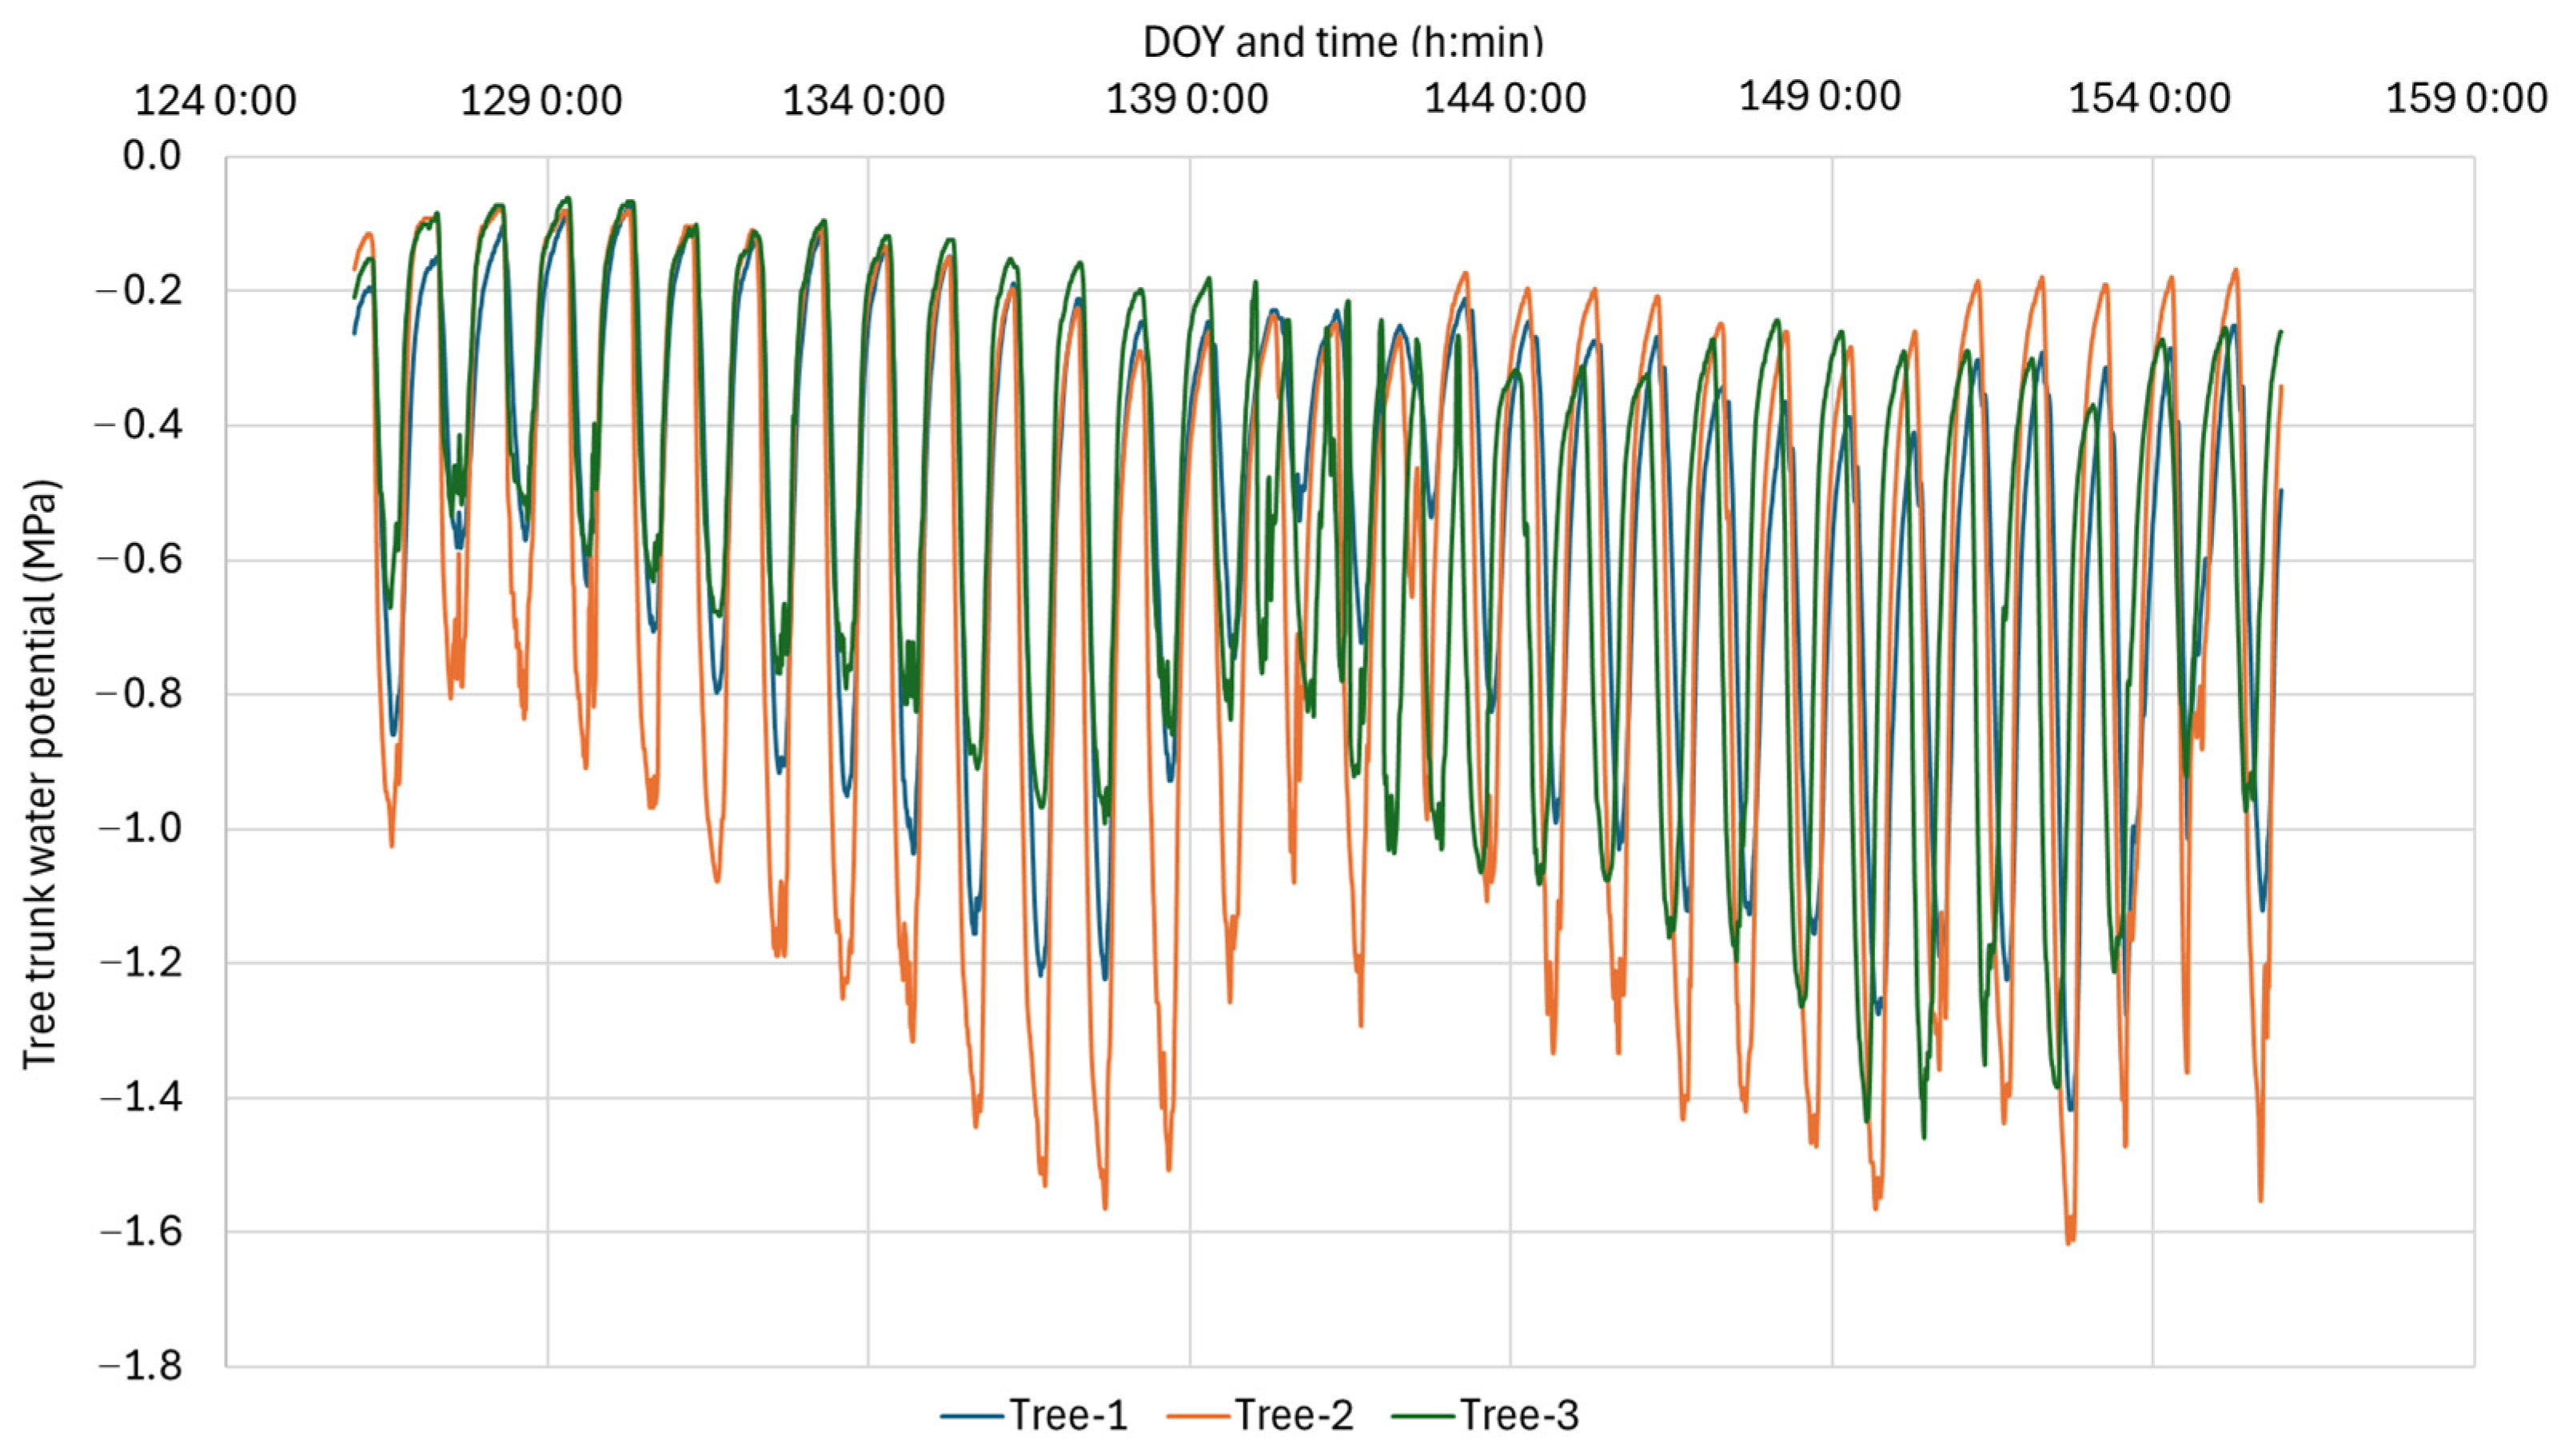
Micro-tensiometer sensors (FloraPulse, Davis, CA, USA) were installed on three trees selected in different parts of a conventional test orchard. The sensors were embedded into the tree bark tissue, i.e., the xylem, to directly measure tree trunk water potential (TTWP) in terms of barometric pressure. This pressure is inversely proportional to the actual transpiration of the trees and represents water stress. Generally, the higher the TTWP, the higher the water stress and the lower the transpiration. The sensor measurements were logged into a data logger (CR1000, Campbell Scientific, Logan, UT, USA) at 15 min interval. Hourly and daily averages of TTWP measurements were calculated and used as reference to compare with aerial imagery derived instantaneous T estimates (UASM-1, mm h−1) and Penman–Monteith method-derived daily ETr for peak growth stage. Figure 4 shows distinct variations noted in the TTWP from measurements acquired in different sections of the orchard. These variations highlight the influence of agroclimatic conditions (soil, land elevation, microclimate, and tree physiology, among others) in the water stress measurements. Evaluation of ET and T estimated from aerial imagery with these ground reference data would also indicate the robustness of the high-resolution remote sensing method.

2.6. Data Analysis

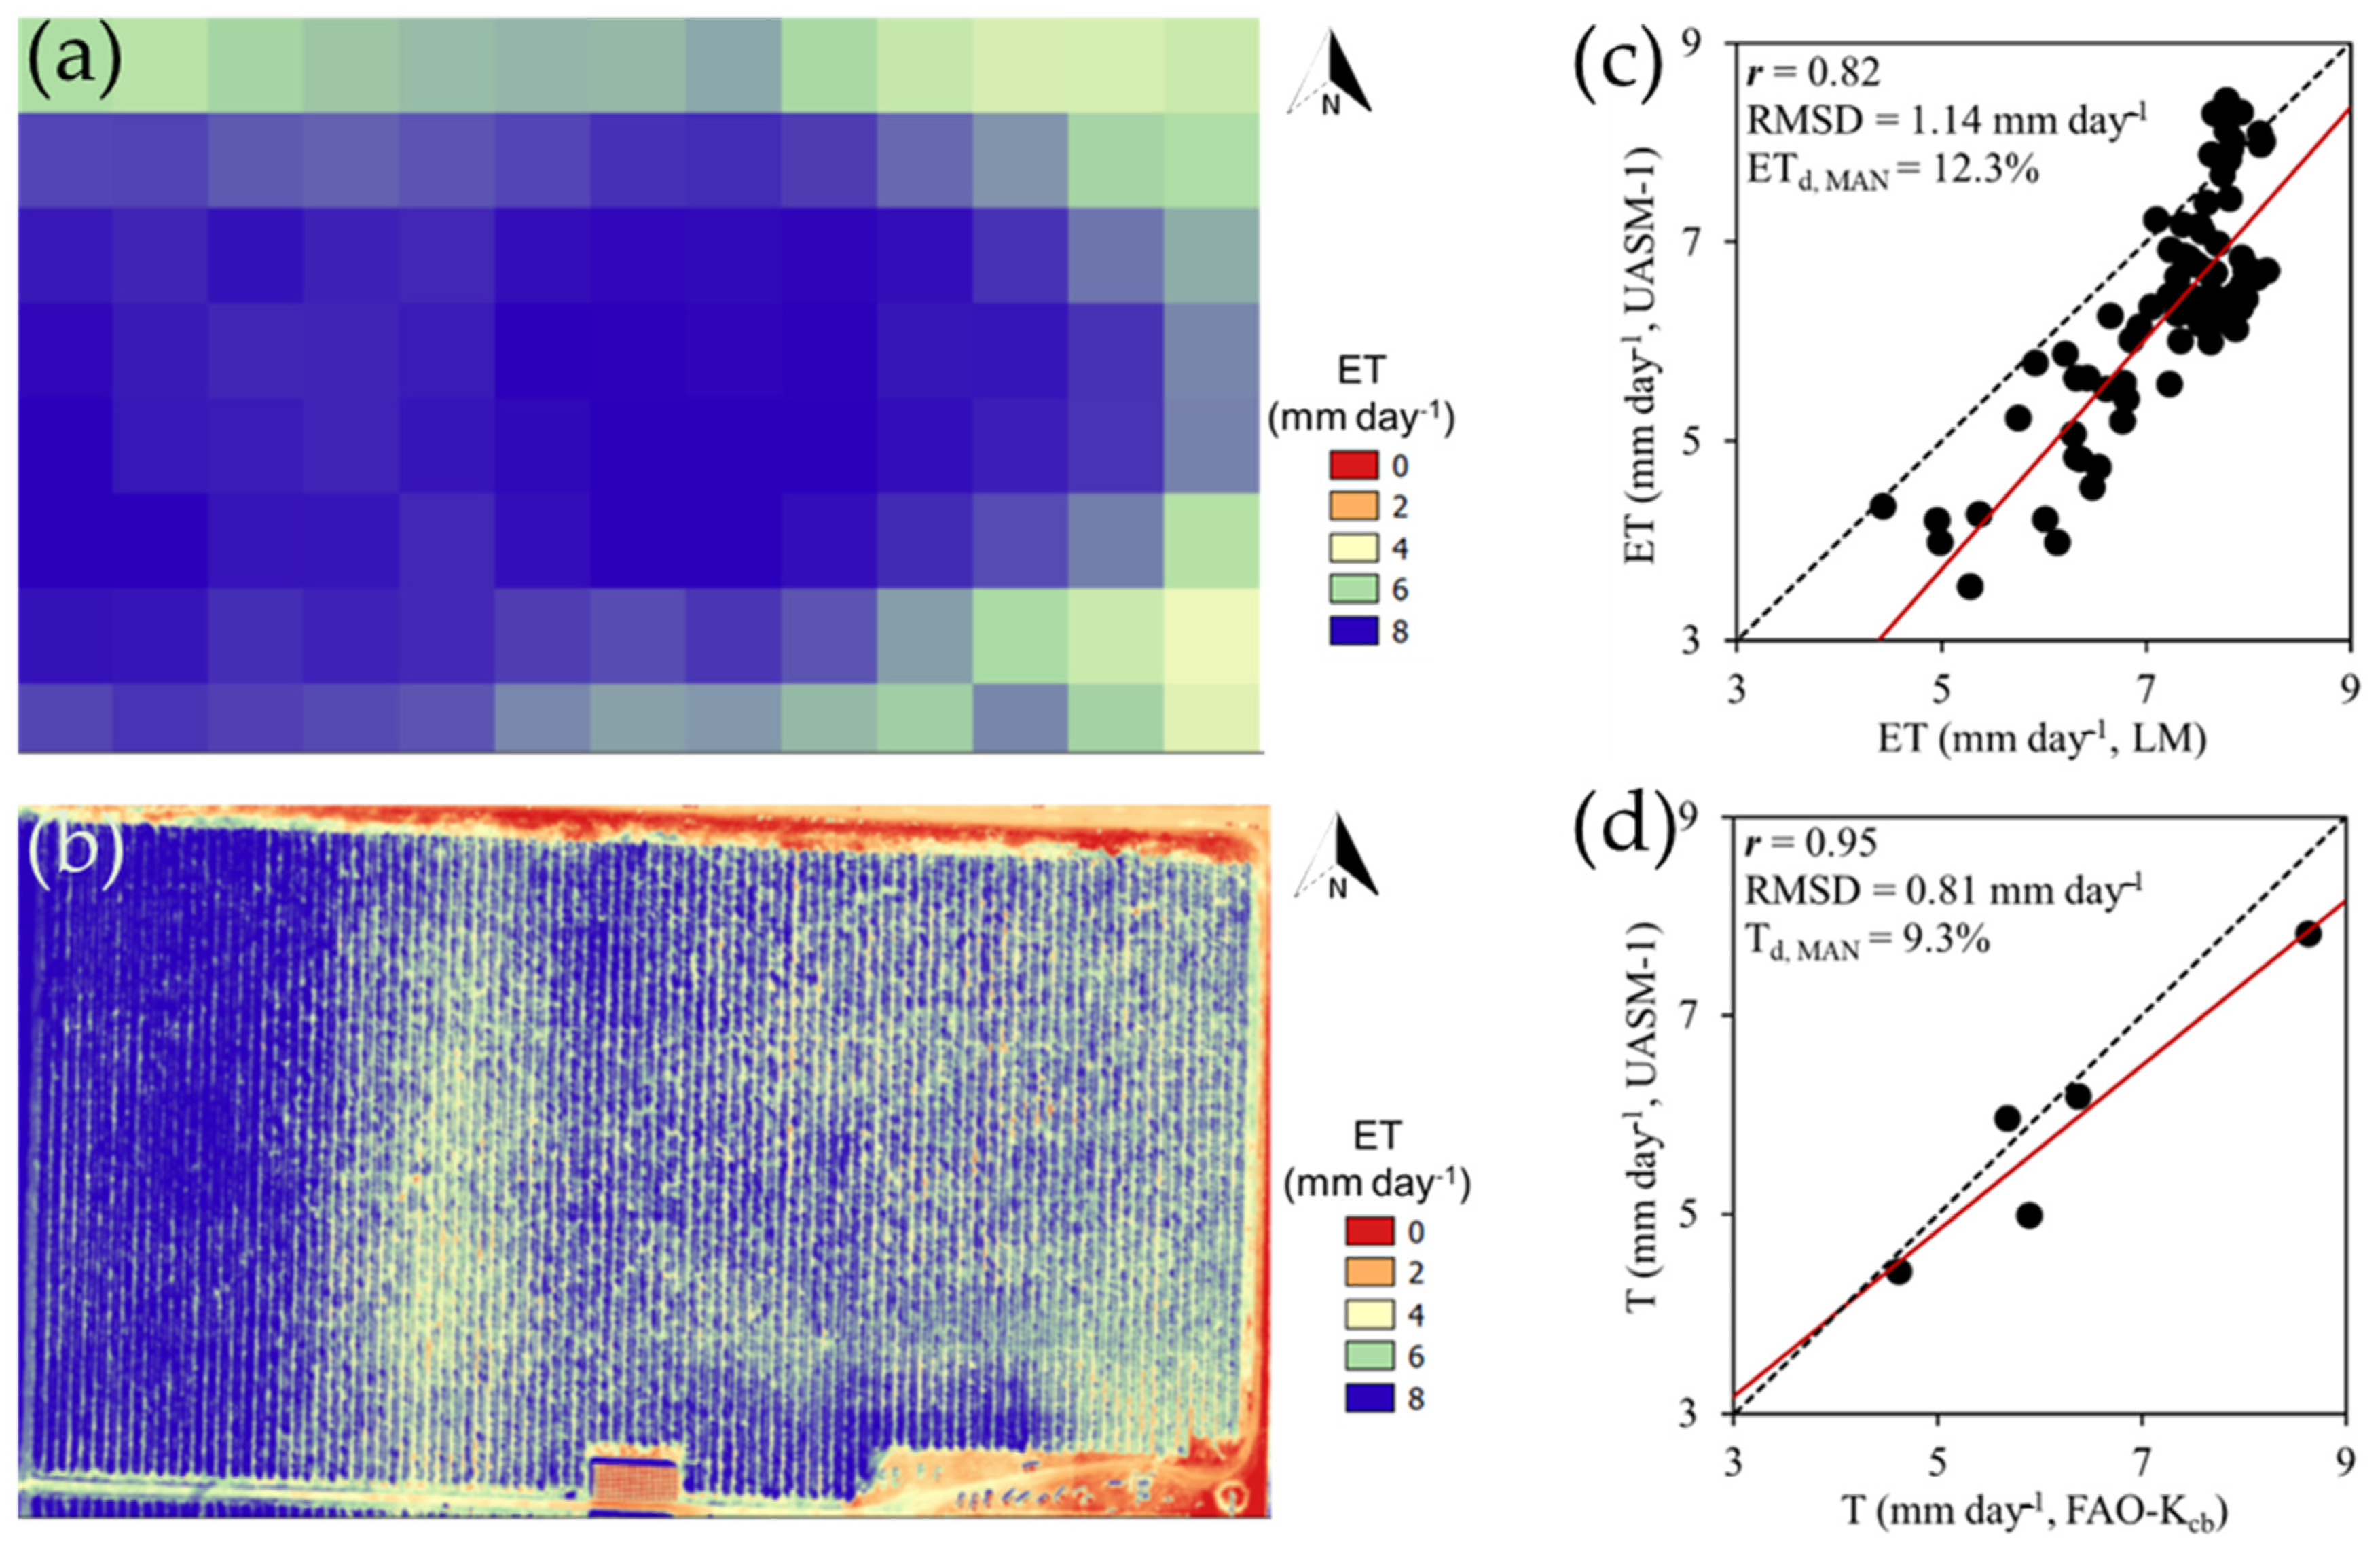
For objective-1, the UASM-1 24 h ET map was downgraded in spatial resolution (~30 m/pixel) as the LM ET map and corresponding values for each of the 30 m × 30 m cell areas were compared using the correlation coefficient (Pearson: r), absolute and normalized root mean square difference (RMSD, Equations (8) and (9)), and mean–absolute–normalized departures (ETd,MAN, %, Equation (10)) for 41 DBH. Similarly, the means of the 24 h T estimates extracted from UASM-1 ET maps for the entire site were compared with 24 h T from the FAO-Kcb approach for the imaging days. For part-I of objective-2, LAI calculated with UASM-1 was first compared with the LAI measured for the sample trees using r, RMSD. Secondly, the instantaneous T estimates (mm h−1) from UASM-1 were compared with hourly reference TTWP measurements recorded from the selected three trees (Section 2.5) using correlation analysis. In addition, daily averaged TTWP measurements were also used as comparison reference for daily ETr calculated using Penman–Monteith method from the in situ weather data inputs for peak growth stage period of 45 days (Mid-End). Next, energy components and T estimates from UASM-1 and UASM-2 were compared using r, RMSD. Such tests and analysis of variance (ANOVA) were also assessed for deviations in raw weather parameters (SR, WS, RH, and AT), ETr, and T estimates pertinent to listed weather data sources (Section 2.3), relative to those derived from the source at the orchard center and above canopy level (WD-1/WH-3). All analyses were conducted in R platform and results were inferred at 5% significance.
RMSD   ( mm   day 1 ) = ( i N E T U A S M , i E T L M , i 2 N )
RMSDN (%) = (RMSD × 100)/Mean ETLM
ETd, MAN (%) = (|ETUASM − ETLM| × 100)/ETLM
where RMSD is the absolute root mean square difference between the small UAS-based estimates (ETUASM or TUASM) and estimates based from reference methods (ETLM or TFAO-Kcb), RMSDN is the normalized RMSD relative to the mean estimate from reference methods, ETd, MAN is the absolute departure (%) relative to reference estimates, N is the total number of estimates, and ‘i’ is the sample estimate.

3. Results

3.1. High-Resolution Evapotranspiration and Transpiration Mapping

UASM-1 was able to map in-field variability of ET and T at high spatial resolution compared to LM approach (Figure 5a,b) [1,3,4]. UASM-1 estimated mean ET of 6.3 mm day−1 (Standard Deviation [SD]: 2 mm day−1, coefficient of variation [CV]: 31%) compared to mean ET of 7.2 mm day−1 (SD: 0.9 mm day−1, CV: 12%) from LM approach. UASM-1 estimates had a strong correlation with LM estimates (Figure 5c). Unlike LM, UASM-1 mapped T of the apple trees successfully. Tree transpiration ranged from 4.4 to 7.8 mm day-1 (CV: 6–15%) for the imaging days and had a strong correlation (r) relative to the estimates from FAO-Kcb approach (4.6–8.6 mm day−1, Figure 5d). The standard (FAO) adjusted basal crop coefficient (Kcb) values ranged from 0.67 to 0.92 between the first and the last aerial imaging. While values determined from aerial imagery ranged from 0.77 to 0.89 and accounted for spatial heterogeneity. The spatial heterogeneity is reflective of the canopy vigor variations within the field that are affected due to localized soil conditions, crop growth conditions, microclimate, and management operations. The UASM-1-derived instantaneous (mm h−1) T estimates had a very strong inverse correlation with the reference measurements of TTWP (Figure 6a, r: 0.85). Similarly, the Penman–Monteith method-derived 24 h ETr also had a very strong correlation with the TTWP measurements (Figure 6b, r: 0.89). These strong correlations are reflective of the accuracy and reliability of actual T and ETr computations using aerial thermal-multispectral imagery and in situ weather data.

3.2. UASM-1 vs. UASM-2 for ET Mapping

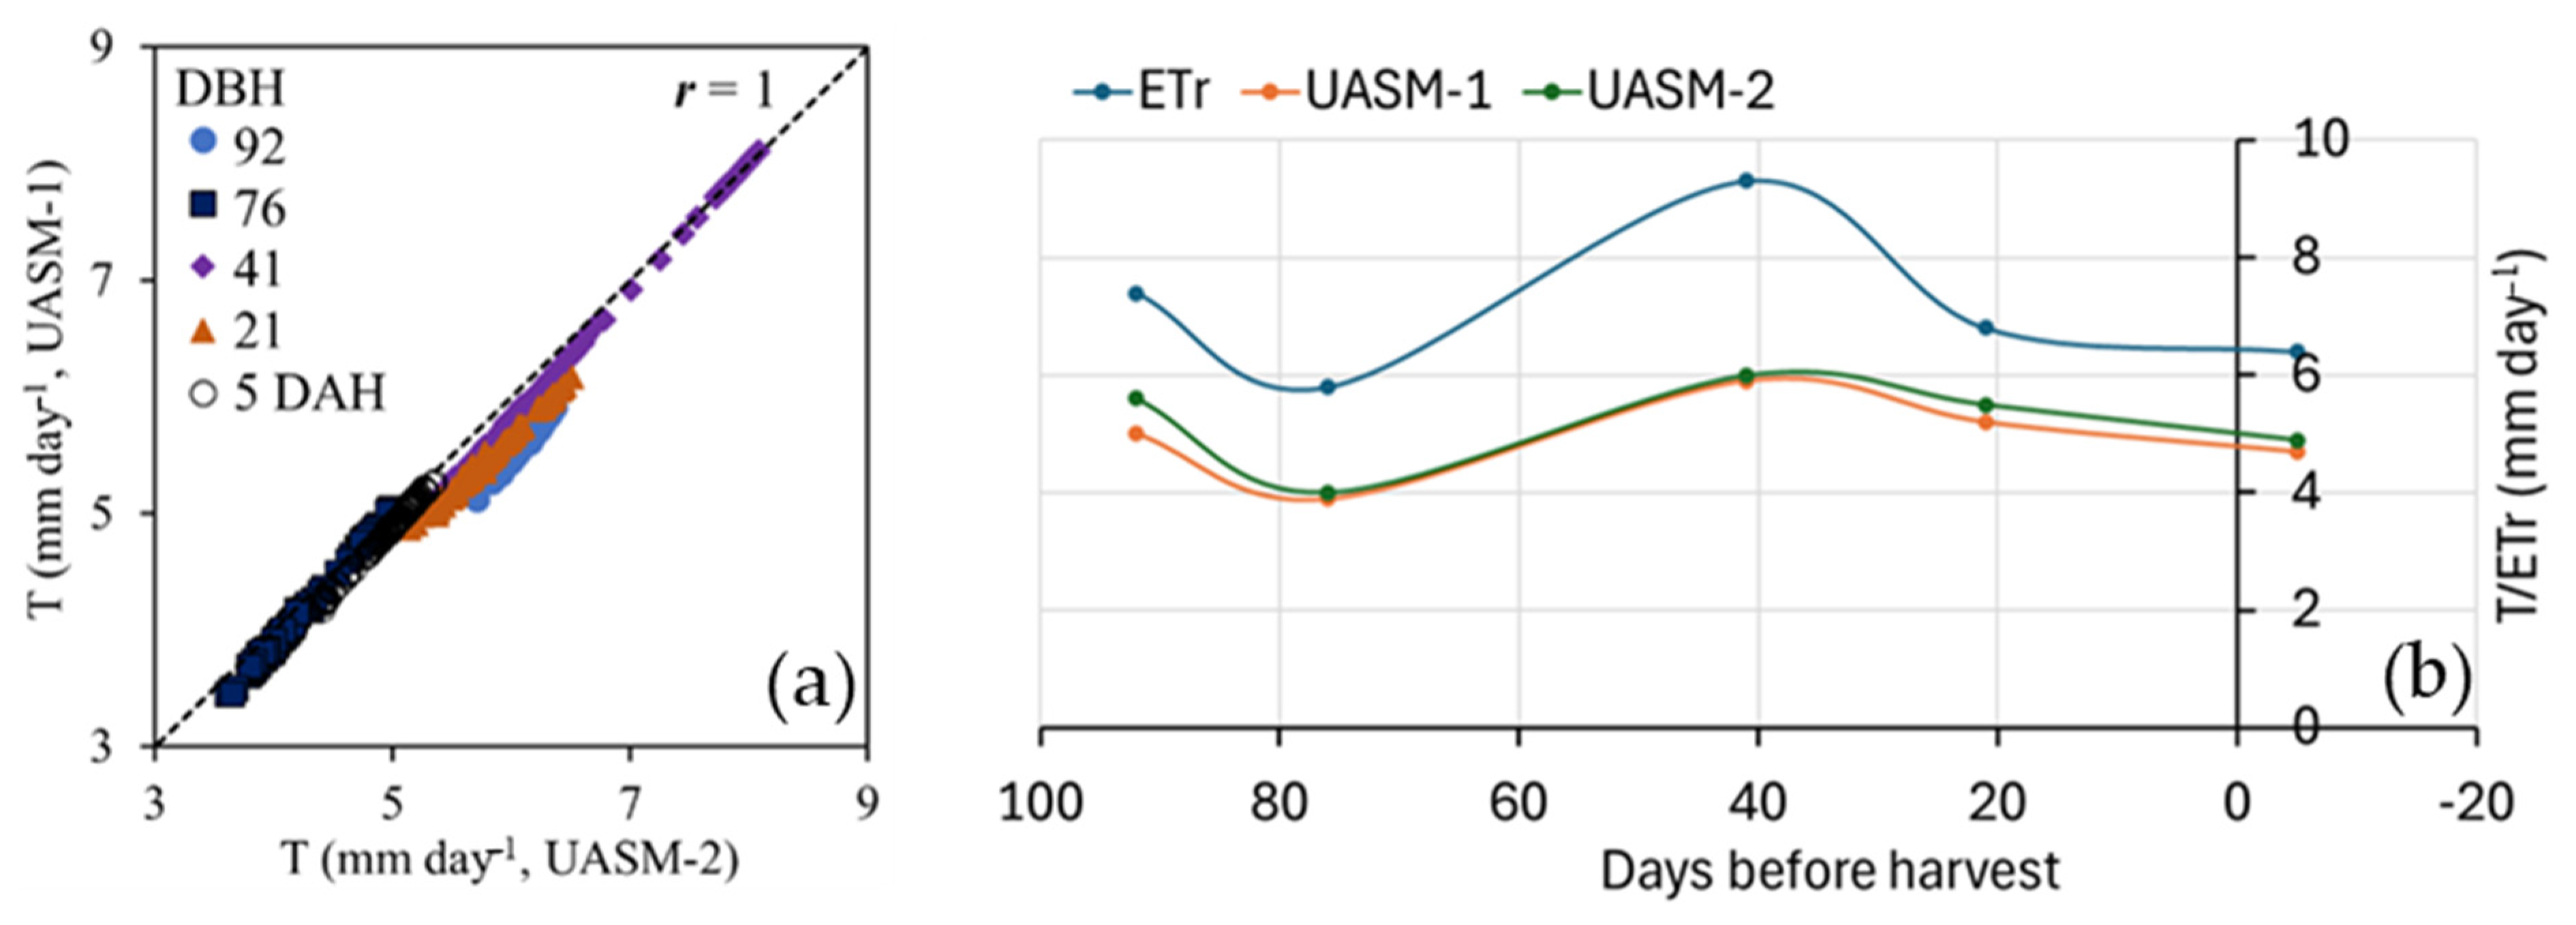
The LAI estimated using UAS imagery, from the function in UASM-1 (2.6 ± 0.8 [Mean ± SD] m2 m−2), was not significantly different (p = 0.46) than that estimated on ground (2.7 ± 1.1 m2 m−2). However, no correlation was observed (Figure 7a) between the two. Moderate to strong correlation ranges were observed between the ground measured LAI, and GNDVI, NDVI, and SAVI mapped with UAS imagery (Figure 7b–d). SAVI had the strongest correlation compared to NDVI and GNDVI [35]. Therefore, the pertinent relationship (Figure 7b) was used to calculate LAI in the UASM-2 approach. The ISWR and ILWR from UASM-1 were higher and outgoing longwave radiation (OLWR) was lower than from UASM-2 approach (Table 2), resulting in higher net radiation (Rn) and soil heat (G) fluxes (Mean difference: 77 and 9 Wm−2, respectively). ISWR with conventional method was overestimated by 73 Wm−2 and the use of local weather data could be more appropriate for this purpose [8]. The H from UASM-1 was also higher (78 Wm−2) than UASM-2. However, as a result of energy balance, LE from the two approaches was similar, showing compensation of the differences between Rn, G and H components (Overall RMSDN: 13.5%). As a result, T estimates from UASM-1 and UASM-2 approaches had the strongest agreement (Figure 8a). When compared temporally over the season, the mean orchard T estimates between 92 DBH to 5 DAH from UASM-1 approach varied between 3.9 to 5.9 mm day-1 compared to between 4 to 6 mm day-1 from the UASM-2 approach (8b).

3.3. Weather Specificity and Apple Tree Transpiration Estimation

3.3.1. Weather Variation Around the Orchard

In reference to WD-1, i.e., a station at orchard block center, the SR and WS from WD-2, WD-3 and WD-5, RH from WD-2 and WD-5, AT from WD-5, and ETr pertinent to WD-2 and WD-5 had strongest agreements (r: 0.9–1), while SR and WS from WD-4, RH and ETr from WD-3 and WD-4, AT from WD-3, WD-4, and WD-5 had relatively weaker to moderate correlations (r: 0.60–0.87, Figure 9a,b). Mean CVs of 15%, 55%, 9%, 26%, and 26% were observed between the SR, WS, RH, AT, and ETr attributes, respectively, from all the above sources. Moreover, those parameters from all the sources were significantly different (one-way ANOVA, p < 0.01) except for measurements by WD-1, WD-, and WD-5 in most cases (Figure 9).

3.3.2. Weather Variation Along Canopy Heights

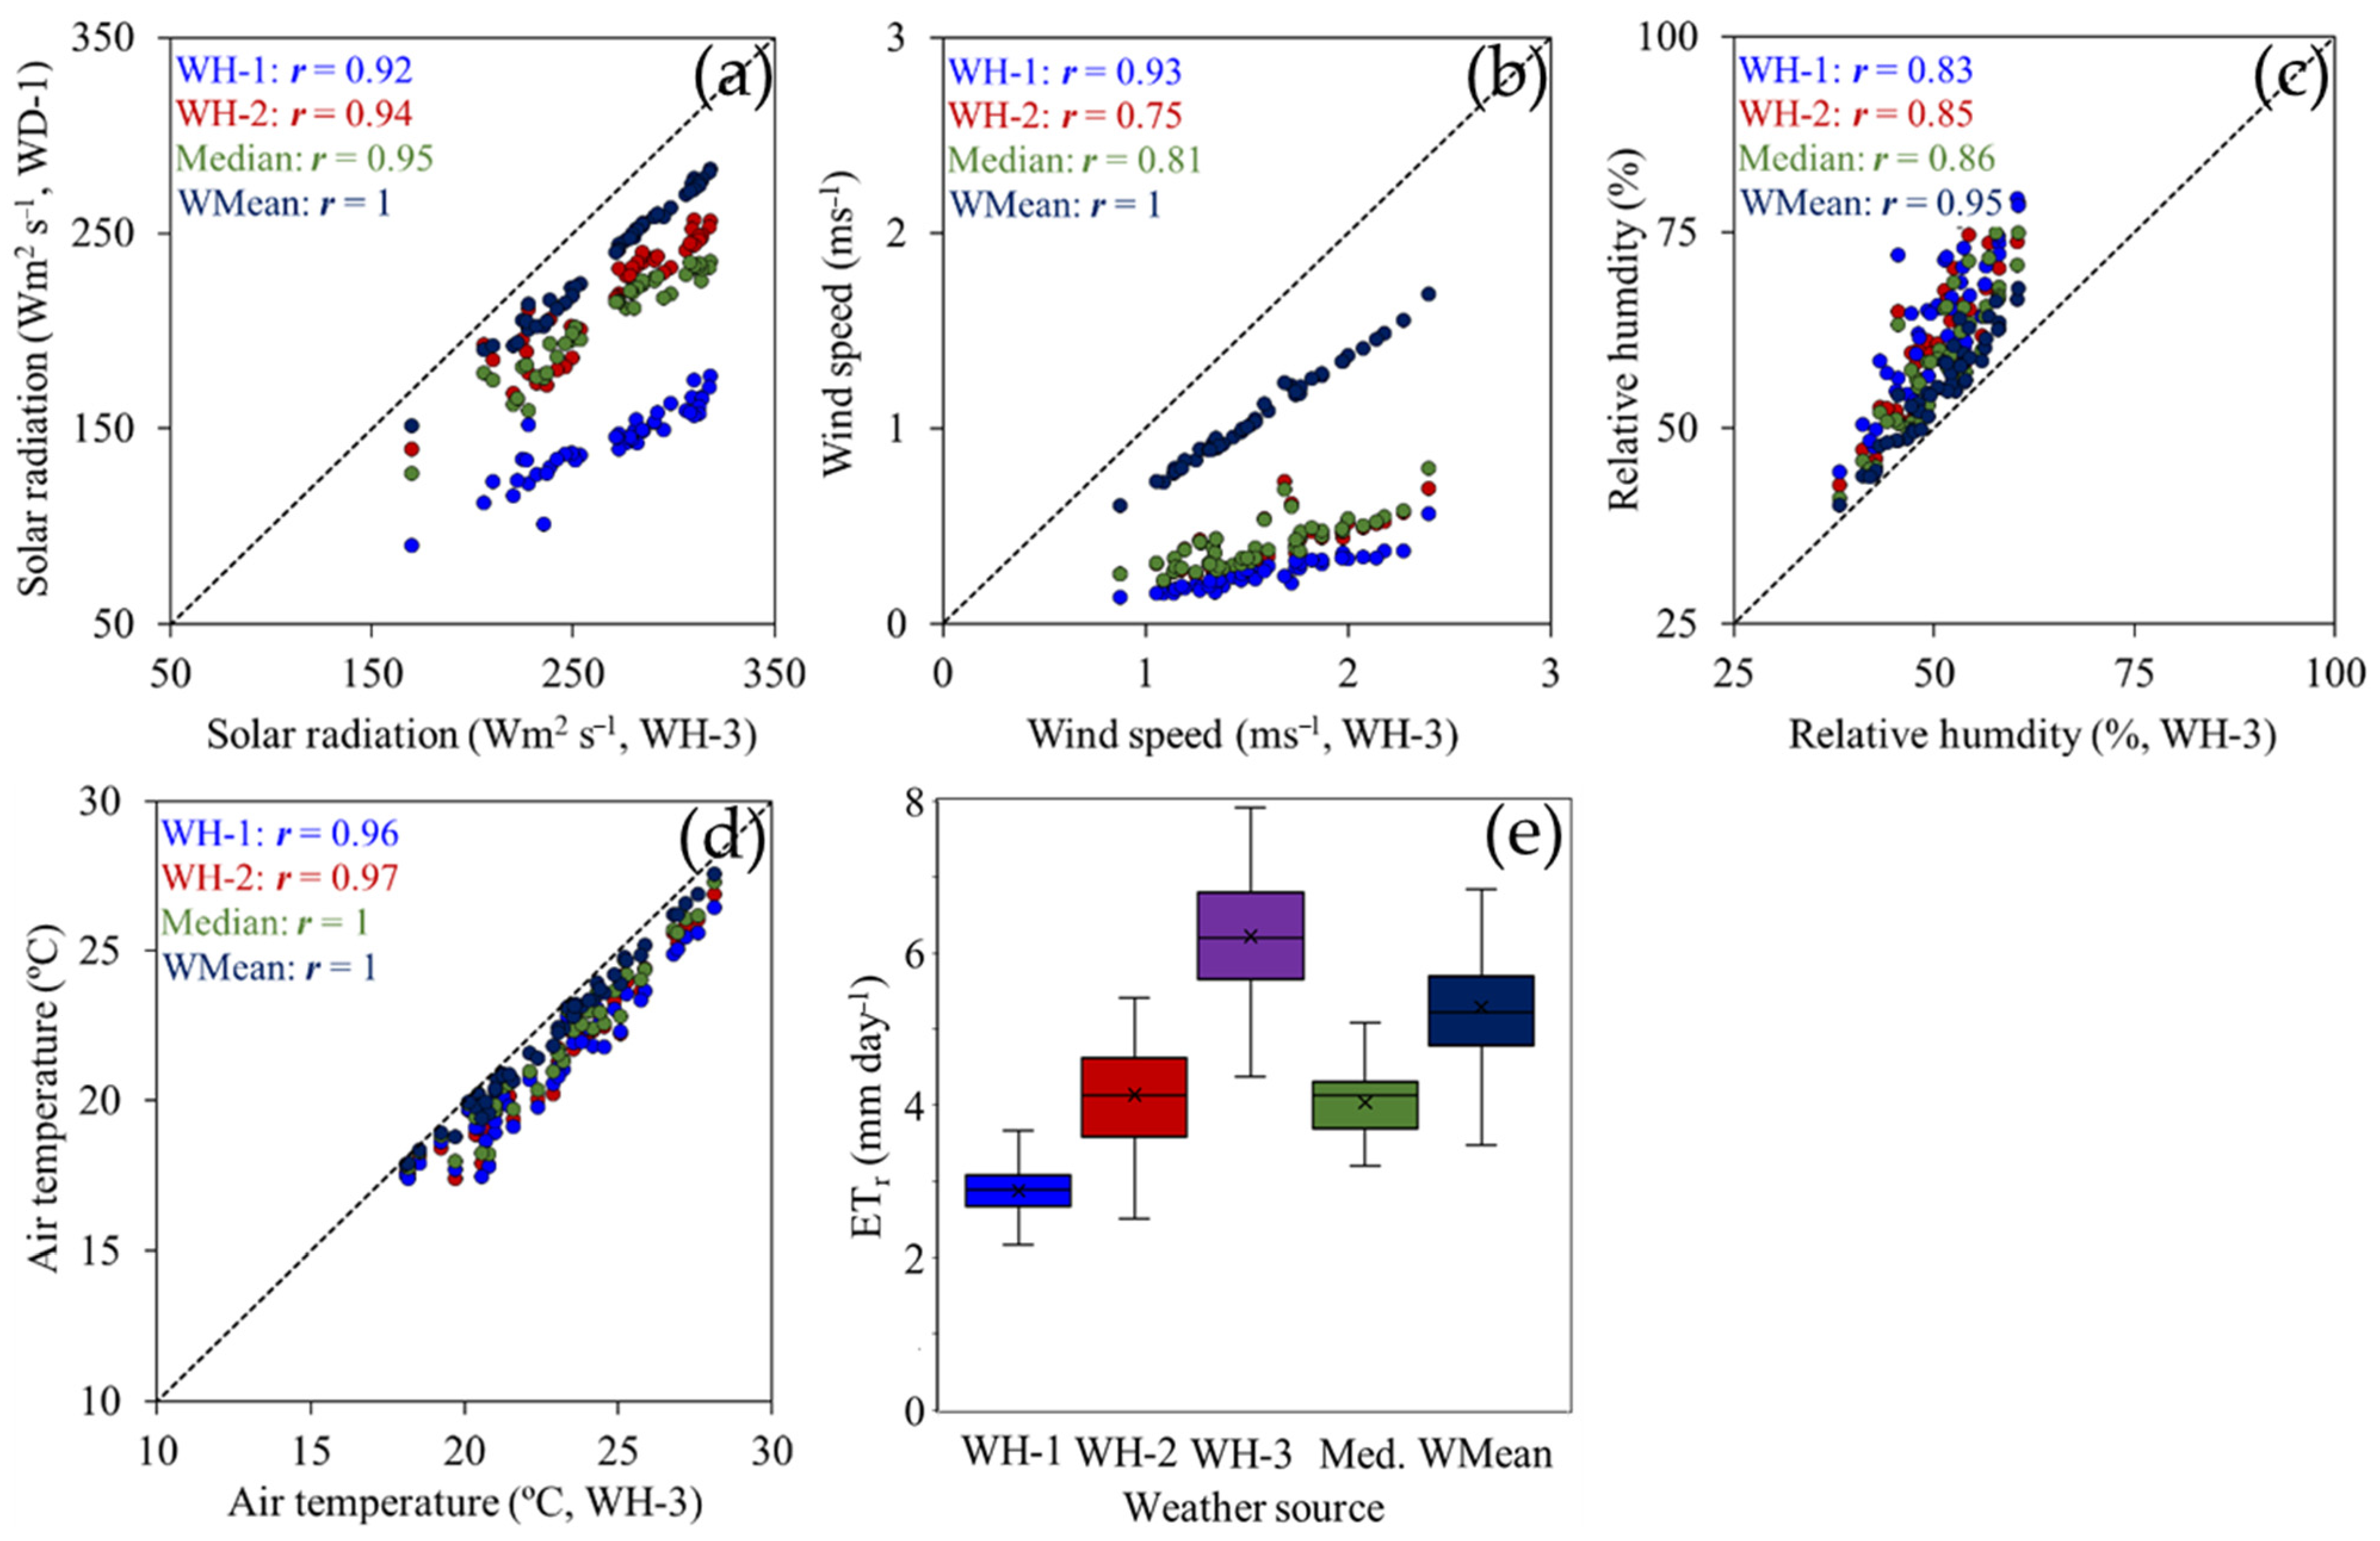
Relative to WH-3, SR and WS from WH-1 and WMean, RH from WMean, AT from all sources, and ETr from WH-2, Median, and WMean had strong correlations (r: 0.9–1), while SR and WS from WH-2 and Median, RH from WH-1, WH-2, and Median, and ETr from WH-1 had relatively moderate correlations (r: 0.75–0.86, Figure 10). Mean CVs of 22, 76, 9, 3, and 29% were observed between SR, WS, RH, AT, and ETr attributes, respectively. Those parameters were also different for all the mentioned sources (one-way ANOVA, p < 0.01) except for WH-3 and WMean, and for WH-2 and Median in most cases (Figure 10).

3.3.3. Effect on Tree Transpiration Estimation

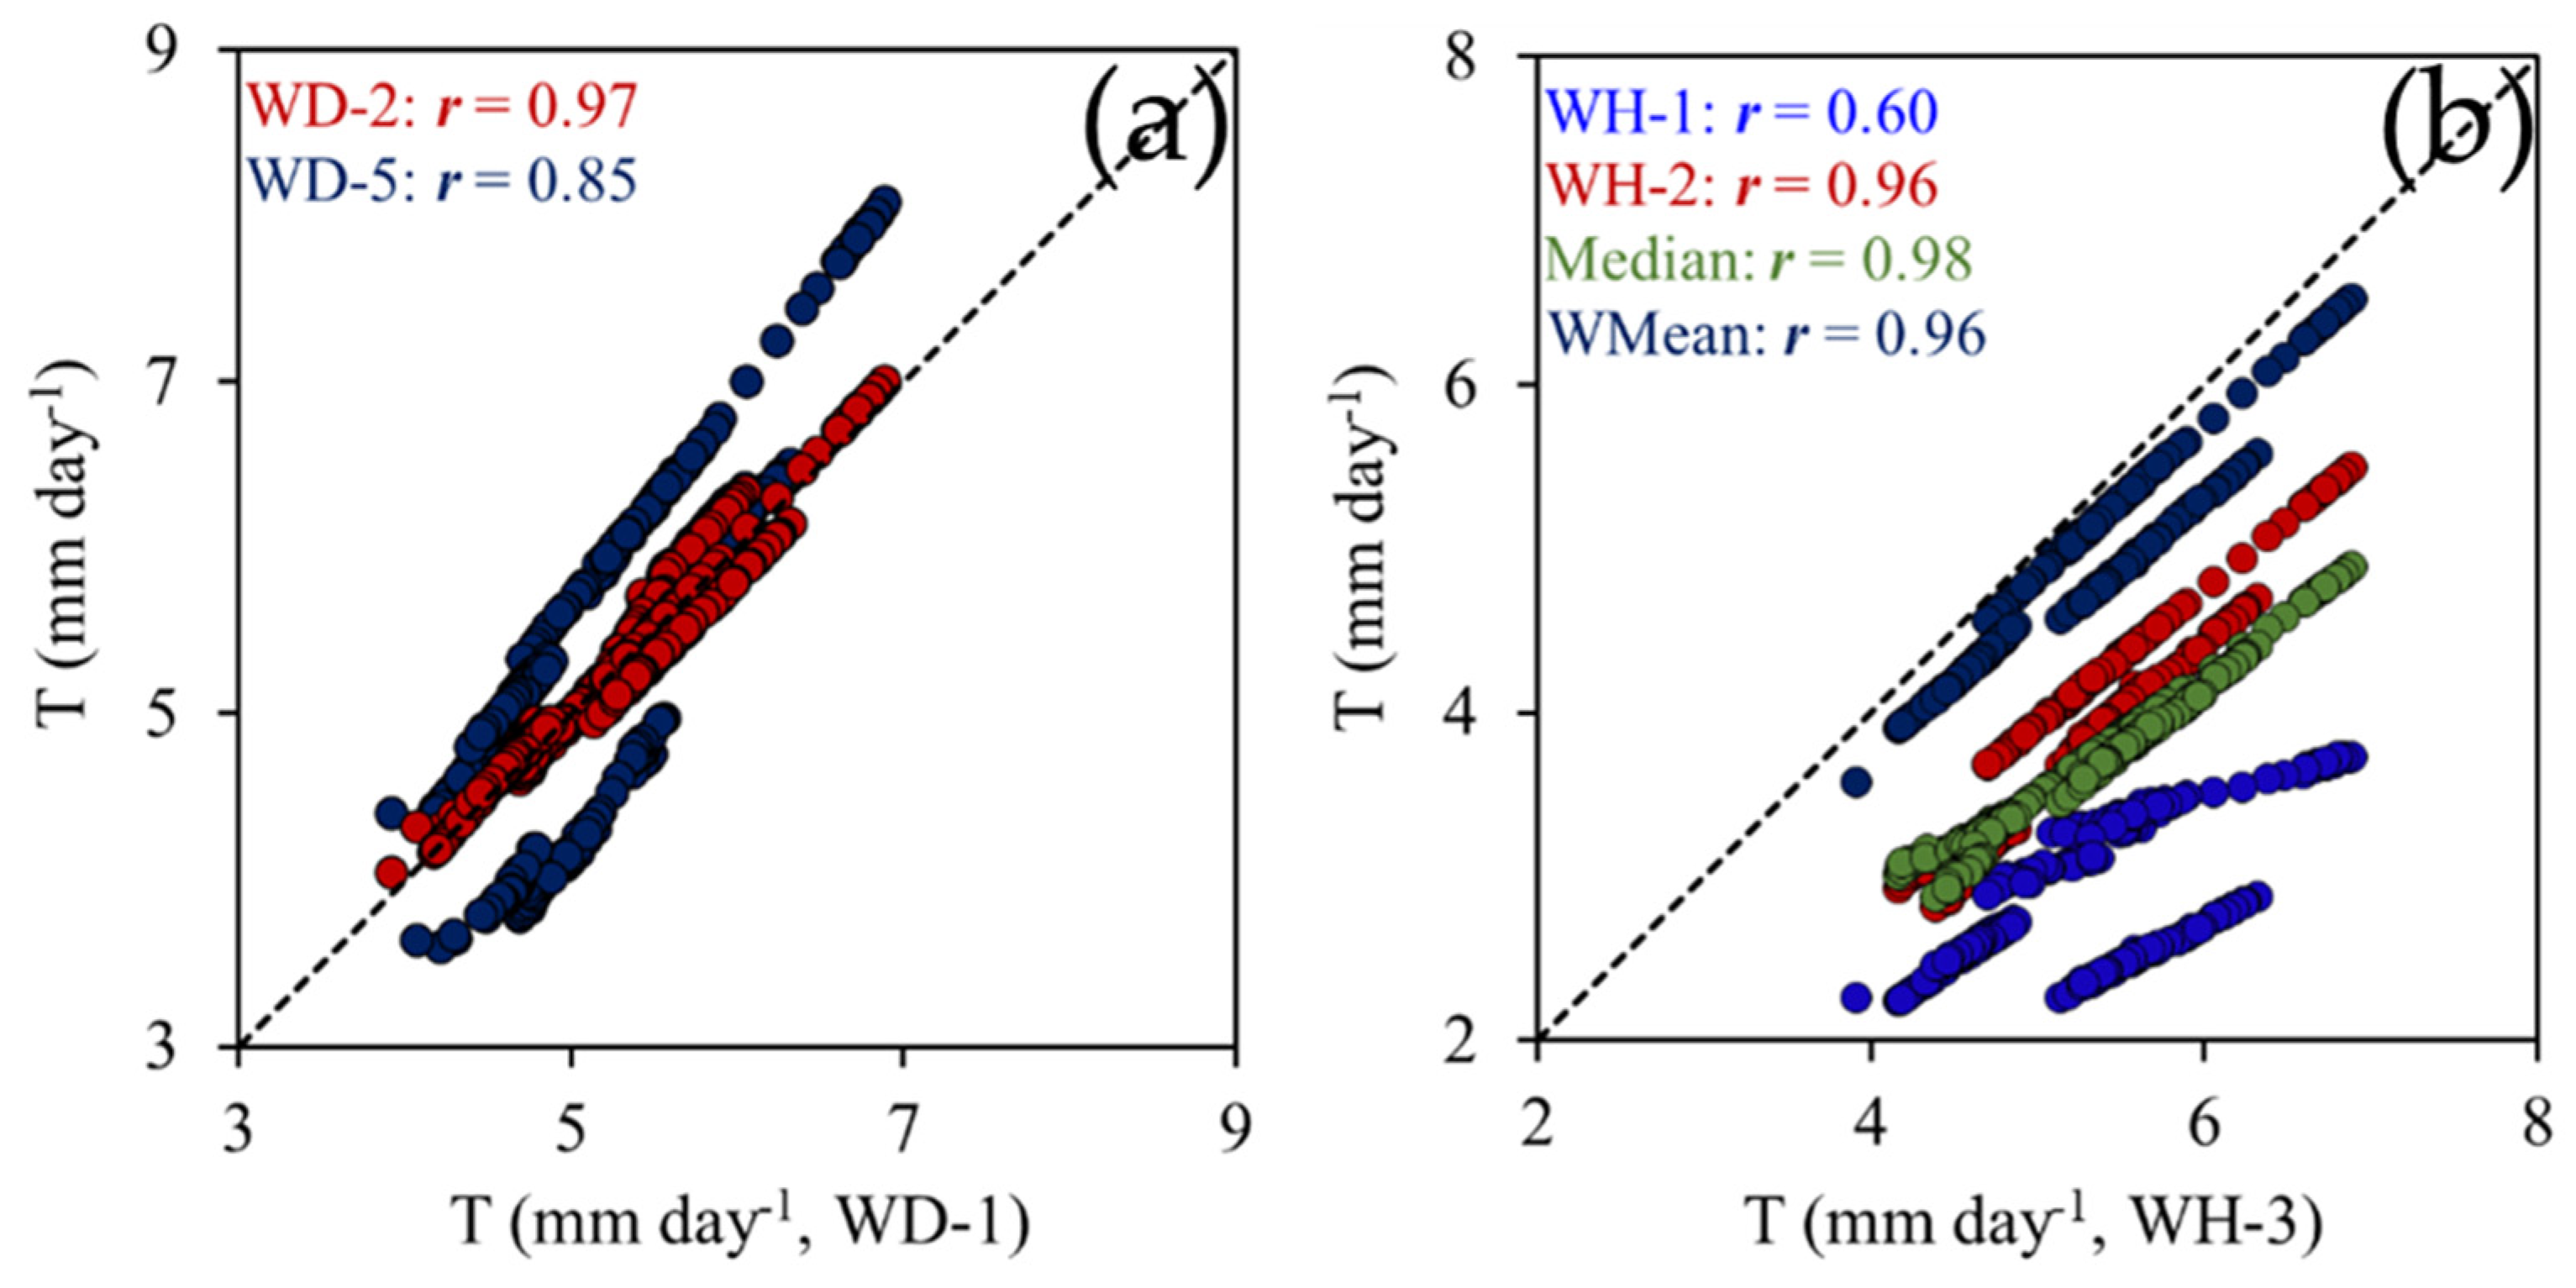
For the open-field weather data sources, the apple tree canopy transpiration (T) was mapped using inputs from sensors at WD-1, WD-2, and WD-5, and not pertinent to WD-3 and WD-4 due to the observed variations (reported in the Section 3.3.2), which may not be necessarily accounted for. The T estimates from UASM-2 using weather inputs from WD-1 was in the ranges of 3.9 to 6.9 mm day−1 (Mean ± SD = 5.3 ± 0.6 mm day−1) for the imaging days. Relatively, estimates pertinent to WD-2 and WD-5 had strong correlations and were in the ranges of 4.1–7.0 mm day−1 (r: 0.97, RMSD: 0.2 mm day−1 [3%]) and 3.6–8.1 mm day−1 (r: 0.85, RMSD: 0.7 mm day−1 [12.7%]), respectively. Estimates pertinent to WD-5 were lower for some imaging days and higher for some imaging days relative to WD-1 (Figure 11a). Also, the transpiration estimates were similar for WD-1 and WD-2 but were significantly different pertinent to WD-5 (one-way ANOVA, Tukey’s test, p < 0.01).
The T estimates with weather input sources inside the orchard; WH-1, WH-2, WH-3, Median, and WMean were in the ranges of 2.2–3.7 mm day−1 (Mean ± SD = 2.8 ± 0.4 mm day−1), 2.0–5.5 mm day−1 (Mean ± SD = 3.9 ± 0.7 mm day−1), 3.9–6.9 mm day−1 (Mean ± SD = 5.3 ± 0.7 mm day−1), 2.0–4.9 mm day−1 (Mean ± SD = 3.7 ± 0.5 mm day−1), and 3.6–6.5 mm day−1 (Mean ± SD = 4.9 ± 0.6 mm day−1), respectively, and were significantly different (p < 0.01, CV: 25 ± 3%). Relative to WH-3, T estimates pertinent to Median weather had the strongest correlation (r: 0.98, Figure 11b) but high RMSD (1.6 mm day−1, 31%), while estimates pertinent to WMean had the highest agreement (r: 0.96) and lowest RMSD (0.4 mm day−1, 8%) followed by WH-2 (r: 0.96, RMSD: 1.4 mm day−1 [27%]). Estimates pertinent to WH-1 had the highest RMSD (2.6 mm day−1, 48%) and weakest but significant correlation (r: 0.60).

4. Discussion

The UASM-1-mapped ET had a strong correlation with the LM-mapped ET. However, some differences between the two (RMSD: 16% and ETd, MAN: 12.3%) could be due to internal calibrations where Landsat imagery resolution restricts uniform bare soil (hot) or well-irrigated vegetation (cold) pixel selection near the target site and would lead to their identification under non-representative climatic or weather conditions. This could have deviated the H, and therefore the LE and ET [2], relative to UASM-1. Such uncertainty could be low with UASM approaches for pixel selection near the orchard. Overestimation of ET from the LM approach compared to the UASM-1 approach as in this study has also been reported earlier for alfalfa, corn, rye grass, peas, and wheat crops [36]. The major reason for this is the lower resolution of Landsat satellites (30 m/pixel) where an aggregated impact of different vegetations and surfaces impact the overall temperature and surface reflectance in each pixel. This can be highly contrasting to the aerial imagery that offers distinctive capability to capture temperature and reflectance at very high precision due to ultra-high spatial resolution (~7–13 cm/pixel). Similar observations were also reported for a study over almond orchards [37] where aerial imagery resolution could distinctively capture the reflectance and temperature characteristics of almond trees compared to Landsat satellite images that captured mixed surfaces (soil, grass, trees, and others).
Similarly, UASM-1-derived T estimates had a very strong correlation with the FAO-Kcb approach (r: 0.95, Td, MAN: 9.5%). However, the latter is a generalized approach that considers standard phenological crop stages which may often be off from the actual conditions [4], while aerial imagery is a better representative of the actual crop as it captures detailed spatial heterogeneity in the crop vigor. This was well observed as the basal crop coefficients from FAO-Kcb ranged from 0.67 to 0.92 and those from aerial imagery ranged from 0.77 to 0.89. The significant and high accuracy of UASM-1-derived T estimates when compared with reference ground measured TTWP (r: 0.85) is indicative of the robustness of aerial thermal and multispectral imagery when analyzed using METRIC energy balance model. Such observation was also reported by a study conducted on citrus trees where the correlation between stem water potential and relative transpiration was 0.84 [38]. This accuracy with reference measurements was further supported by stronger correlations observed between the TTWP and ETr (r: 0.89). Observations also abide by the fact that when water stress was higher (higher negative magnitude of TTWP), the transpiration rates reduced and vice versa. Similarly, as the reference ET or evaporative demand of the atmosphere increased, the water stress also increased proportionally. A similar (relatively lower) correlation (r: 0.5) between stem water potential and reference ET was also reported in a study conducted for early maturing peach trees [39]. Distinct variations noted in the TTWP from measurements acquired in different sections of the orchard pertain to variations in soil, land elevation, microclimate, and tree physiology, among others. Evaluation with respect to such measurements of ET and T estimated from aerial imagery adds robustness for efficiently capturing in-orchard variations.
To map the LAI with aerial imagery, SAVI had the strongest correlation with LAI compared to other vegetation indices possibly for its higher sensitivity to leaf biomass unlike NDVI and GNDVI [35]. OLWR is dependent on LAI but only up to 1% [8], and therefore was similar for UASM-1 and UASM-2. LAI is also used for calculating momentum roughness length and hot and cold pixel selection. However, its computation method did not deviate LE or T estimation, as evident from the strongest possible correlation from UASM-1 and -2 approaches (r: 1, RMSD: 0.3 mm day−1 [5%], Figure 8a). This is well supported by prior studies [4,11] which reported maximum deviation of 2–3% in ET due to LAI or momentum roughness length. Such observation abides with METRIC, i.e., independence on the surface characteristics. Therefore, the existing LAI calculation method [8] may be applicable, but its timely localized calibration may enhance the confidence towards mapping site-specific crop transpiration. The SR may often be affected by the cloud cover and other atmospheric dynamics [4,40,41,42]. Similarly, surface temperature input overestimated ILWR relative to local AT inputs, and therefore Rn and G fluxes were overestimated in UASM-1 compared to UASM-2. The H, Rn, and G were different for the UASM-1 and UASM-2 approaches. However, such differences were compensated later during computation of LE due to the nature of METRIC model [7,8,43]. Compared to the LM and UASM-1 approaches, UASM-2 offers higher precision and parametrization by incorporating local conditions of vegetation and weather that form the foundation for more representative estimation of ET and T. The orchard transpiration increased since 92 DBH and peaked at 41 DBH when the ETr peaked due to the summer season at its peak. After this, although the ETr decreased, the transpiration estimates did not decrease at a similar gradient due to canopy development progression at the later stage. The aerial imagery and site-specific weather-derived T estimates indicate the influence of weather and canopy development over time on the actual crop water usage.
When assessed for weather variations around the orchard, the SR and WS measurements at WD-4 were possibly interfered by the local conditions (surface topography, vineyards, or building structures), and therefore were not in good agreement with WD-1, WD-2, and WD-5. WD-3 was surrounded by apple orchards and their local surface heterogeneity would have impacted the WS measurements. Therefore, despite the high correlation, WS from WD-3 was not in good agreement with WS from WD-1, WD-2, or WD-5. Local crop and irrigation and energy exchange variations possibly deviated the RH and AT parameters at other stations relative to those at the orchard center or in proximity (WD-2). Moreover, there could be numerous uncertainties which may not be accurately conditioned for site-specific information [24,44]. Nonetheless, the results suggest that open-field weather data sources within or in proximity of the target site can better represent microclimates in the orchard with some offset due to crop and input management practices. For such reasons, daily ETr was underestimated by WD-3 and WD-4 relative to WD-1, WD-2, or WD-5.
Deviations in T estimates using weather inputs from WD-5, relative to WD-1 or WD-2, were possibly because the weather at WD-5 may not completely represent the microclimatic conditions near the orchard but rather represent the microclimate over well-irrigated shortgrass [29,45]. This could be because the surfaces below the weather station, and resultant RH and WS, influence the identification of zero-plane displacement heights, where end points for H are defined, and subsequently the calculation of aerodynamic resistance for energy balance [8,46]. However, the deviations were within 13%, and therefore open-field weather stations may be considered for ET or T modelling studies. Prior studies have also reported deviation in transpiration calculations due to deviations in microclimate features at the target site relative to the location of the weather station. This difference can become further prominent when using inputs from weather sources at increasing distance from the target site [21,27,28], especially when the target vegetation is heterogeneous like the tree crops or orchards, as well as when specific farm management operations are implemented, for example, the overhead sprinkler systems in apple orchards used to manage the fruit sunburn risks [23,24]. Nonetheless, since WD-1 and WD-2 were closer to the orchard, they can be better sources of weather data for precision management activities specific to the target site [21,22,23]. The deviations of T estimates pertinent to weather inputs from WD-2 and WD-1 were very low (~3%), indicating that an open-field weather station installed with standard procedures right in the proximity of the target site would be reliable and ideal.
When assessed for the in-field weather variations, the magnitudes of SR and WS decreased with canopy height due to larger interception and interferences at the top canopy zone followed by the middle zone, but still persistent at the bottom zone. Such persistence at bottom zones can also lead to water exchanges from canopies trained in V-architecture [18]. This was also evident with significant correlations between the T estimates from WH-1 and WH-2 relative to WH-3. The ground surface was well irrigated and therefore would have lowered AT and increased RH closer to the ground, resulting in lowered energy exchange or ET demands [25,47,48,49,50,51]. The T estimates pertinent to WMean would be better representative for accounting weather and energy exchanges at different canopy zones. Estimates relative to WH-3 were slightly lower due to suppressed evaporative demand from cooling effects in the bottom zones, while the proportion of T will be higher from the topmost canopy due to its complete exposure to uninterrupted SR and WS [51,52]. Therefore, there may be a possibility of T overestimation when considering weather inputs solely from WH-3 or underestimating it when using weather inputs solely from WH-1. Moreover, the presence of edges, porosities, and small unique structures within the canopy disturbs the constant flux layer assumptions based on weather measurement at only one height [49,50]. Overall, it was observed that there is a potential of significant variation in transpiration from the bottom zone, mid zone, and top zone of the canopy, thereby needing a comprehensive approach for estimating the actual water requirements for precision irrigation. Further studies may be conducted to account for exact proportions of energy exchanged from different canopy zones in modern tree architectures. Approaches discussed in this study may also be applicable to field crops with non-uniform vegetation growth, exposed soil patches, or large fields where spatial microclimate variations could be prominent. Under such conditions, multiple weather stations may be installed to regularly generate spatially interpolated weather information, which can be further coupled with small UAS or low-orbital satellite-based spectral and thermal imagery through energy balance for ET estimations. Evaluation over multiple cropping systems, growing seasons and scales, management practices, agroclimatic conditions, and fusion with satellite-imagery can further establish robustness of the aerial imagery and site-specific weather data-based ET estimations.
It will also be imperative to integrate precision ET/T maps such as the ones generated in this study to the automated irrigation networks to eventually realize site-specific irrigation and water use efficiencies. This can be done by converting ET/T maps into temporal shapefiles and then fed into the irritation controller computers for water management by fixed or mobile systems. Although small UASs are emerging technologies in agriculture, there could be some barriers to adoption at farmer level such as skillsets and costs. However, numerous crop consultants and service providers are making technology adoption easier for the growers towards sustainable production.

5. Conclusions

The aerial thermal and multispectral imagery and in situ weather-derived transpiration estimates (UASM-1 method) had very strong correlations with the tree-trunk water potential measurements on ground (r: 0.85). In addition, the in situ weather data derived reference ET also had very strong correlation with the tree-trunk water potential (r: 0.89). Such observations suggest accuracy and reliability of aerial thermal and multispectral imagery to estimate actual crop water use when used as inputs with modified METRIC energy balance model. The UAS imagery-based model also had comparable ET and T estimates to the standard LM and FAO-Kcb approaches, respectively, showing strong agreement (r: 0.82–0.95) and RMSD from 13 to 16%. This observation was very strongly agreed by the reference ground-based tree-trunk water potential measurements that had strong correlations with T and ETr estimations (r: 0.85–0.89). The site-specific crop and weather data inputs deviated the computation of various energy components in UASM-1 relative to UASM-2 approach (RMSD: 13.5%); however, the ET or T estimates were not affected by those deviations (r: 1, RMSD: 5%) due to the bias compensation features of the METRIC energy balance. The reference ET and apple canopy transpiration estimates were impacted by the source of the weather data, i.e., location of station with respect to crop block and the height within the orchard block. The open-field weather stations (WD-5: ~3 km and WD-2: ~0.1 km) showed lower deviations in T estimates (r: 0.85 and 0.97, and RMSD: 13 and 3%, respectively) relative to the station at the orchard-center with sensors mounted above the canopy (WD-1: 5 m AGL). Nonetheless, having integrated weather data (WMean) along different canopy heights and open-field better represented the local microclimate compared to a single unit of the open-field sensor. This is critical for heterogeneous cropping systems and their irrigation requirement management.

Author Contributions

A.K.C.: Conceptualization, methodology, investigation, software, visualization, data curation, writing—original draft, writing—review and editing. L.R.K.: Supervision, investigation, methodology, resources, funding acquisition, visualization, writing—review and editing. C.O.S.: Supervision, investigation, resources, software, writing—review and editing. L.K.: Resources, writing—review and editing. S.M.: Resources, funding acquisition, writing—review and editing. A.P.R.: Visualization, data curation, writing—review and editing. T.R.P.: Resources, funding acquisition, writing—review and editing. All authors have read and agreed to the published version of the manuscript.

Funding

This research was funded in part by USDA NIFA projects (WNP0745 and WNP0893) and the Washington Tree Fruit Research Commission.

Data Availability Statement

The raw data supporting the conclusions of this article will be made available by the authors on request.

Acknowledgments

The authors would like to thank the cooperator growers from Columbia Reach, Chiawana orchards, and Grandview orchards for providing access to their apple orchards for this study. The authors would also like to thank Ines Hanrahan from the Washington Tree Fruit Research Commission and David Brown, Bernadita Sallato, Jake Schrader, and Gajanan Kothawade from Washington State University for their valuable suggestions and assistance in data collection.

Conflicts of Interest

Co-author Steve Mantle was employed by the company Innov8.ag who received funding from the Washington Tree Fruit Research Commission to collect data for this project. All other authors declare that they have no known competing financial interests or personal relationships that could have appeared to influence the work reported in this paper.

References

  1. Elarab, M. The Application of Unmanned Aerial Vehicle to Precision Agriculture: Chlorophyll, Nitrogen, and Evapotranspiration Estimation. Ph.D. Thesis, Utah State University, Logan, UT, USA, 2016. [Google Scholar]
  2. Chandel, A.K.; Molaei, B.; Khot, L.R.; Peters, R.T.; Stöckle, C.O. Small UAS-based multispectral and thermal infrared imagery driven energy balance model for high-resolution evapotranspiration estimation of irrigated field crops. Drones 2020, 4, 52. [Google Scholar] [CrossRef]
  3. Chávez, J.L.; Torres-Rua, A.; Boldt, W.E.; Zhang, H.; Robertson, C.; Marek, G.; Wang, D.; Heeren, D.; Taghvaeian, S.; Neale, C.M. A Decade of Unmanned Aerial Systems in Irrigated Agriculture in the Western US. Appl. Eng. Agric. 2020, 36, 423–436. [Google Scholar] [CrossRef]
  4. Chandel, A.K.; Khot, L.R.; Molaei, B.; Peters, R.T.; Stöckle, C.O.; Jacoby, P.W. High-Resolution Spatiotemporal Water Use Mapping of Surface and Direct-Root-Zone Drip-Irrigated Grapevines Using Uas-Based Thermal and Multispectral Remote Sensing. Remote Sens. 2021, 13, 954. [Google Scholar] [CrossRef]
  5. Allen, R.G.; Pereira, L.S.; Raes, D.; Smith, M. FAO Irrigation and Drainage Paper No. 56; Food and Agriculture Organization of the United Nations: Rome, Italy, 1998; Volume 56, p. e156. [Google Scholar]
  6. Chandel, A.K.; Khot, L.R.; Stöckle, C.O.; Peters, R.T.; Mantle, S. Spatiotemporal water use mapping of a commercial apple orchard using UAS based spectral imagery. In Proceedings of the 2020 IEEE International Workshop on Metrology for Agriculture and Forestry (MetroAgriFor), Virtual Conference, 4–6 November 2020; pp. 268–272. [Google Scholar]
  7. McShane, R.R.; Driscoll, K.P.; Sando, R. A Review of Surface Energy Balance Models for Estimating Actual Evapotranspiration with Remote Sensing at High Spatiotemporal Resolution over Large Extents. In Scientific Investigations Report 2017; U.S. Department of the Interior, U.S. Geological Survey: Reston, VA, USA, 2017. [Google Scholar]
  8. Allen, R.G.; Tasumi, M.; Trezza, R. Satellite-based energy balance for mapping evapotranspiration with internalized calibration (METRIC)-Model. J. Irrig. Drain. Eng. 2007, 133, 380–394. [Google Scholar] [CrossRef]
  9. Allen, R.G.; Tasumi, M.; Morse, A.; Trezza, R.; Wright, J.L.; Bastiaanssen, W.; Kramber, W.; Lorite, I.J.; Robison, C.W. Satellite-based energy balance for mapping evapotranspiration with internalized calibration (METRIC)—Applications. J. Irrig. Drain. Eng. 2007, 133, 395–406. [Google Scholar] [CrossRef]
  10. Carrasco-Benavides, M.; Ortega-Farías, S.; Lagos, L.O.; Kleissl, J.; Morales, L.; Poblete-Echeverría, C.; Allen, R.G. Crop coefficients and actual evapotranspiration of a drip-irrigated Merlot vineyard using multispectral satellite images. Irrig. Sci. 2012, 30, 485–497. [Google Scholar] [CrossRef]
  11. Carrasco-Benavides, M.; Ortega-Farías, S.; Lagos, L.; Kleissl, J.; Morales-Salinas, L.; Kilic, A. Parameterization of the satellite-based model (METRIC) for the estimation of instantaneous surface energy balance components over a drip-irrigated vineyard. Remote Sens. 2014, 6, 11342–11371. [Google Scholar] [CrossRef]
  12. Paço, T.A.; Pôças, I.; Cunha, M.; Silvestre, J.C.; Santos, F.L.; Paredes, P.; Pereira, L.S. Evapotranspiration and crop coefficients for a super intensive olive orchard. An application of SIMDualKc and METRIC models using ground and satellite observations. J. Hydrol. 2014, 519, 2067–2080. [Google Scholar] [CrossRef]
  13. la Fuente-Sáiz, D.; Ortega-Farías, S.; Fonseca, D.; Ortega-Salazar, S.; Kilic, A.; Allen, R. Calibration of metric model to estimate energy balance over a drip-irrigated apple orchard. Remote Sens. 2017, 9, 670. [Google Scholar] [CrossRef]
  14. Ortega, S. Evaluation of the METRIC Model for Mapping Energy Balance Components and Actual Evapotranspiration for a Super-Intensive Drip-Irrigated Olive Orchard. Ph.D. Thesis, University of Nebraska-Lincoln, Lincoln, NE, USA, 2019. [Google Scholar]
  15. Chávez, J.L.; Gowda, P.H.; Howell, T.A.; Garcia, L.A.; Copeland, K.S.; Neale, C.M.U. ET mapping with high-resolution airborne remote sensing data in an advective semiarid environment. J. Irrig. Drain. Eng. 2012, 138, 416–423. [Google Scholar] [CrossRef]
  16. Liu, B.J.; Sha, D.G.; Shen, X.P. The Analysis of Reference Crop Evapotranspiration Methods. J. Irrig. Drain. Eng. 2006, 25, 9–12. [Google Scholar]
  17. Han, W.F.; Wu, J.C.; He, F. Summarization on researches on the crop water requirement. J. North China Inst. Water Conserv. Hydroelectr. Power 2008, 29, 32–35. [Google Scholar]
  18. Yu, Q.; Shah, K.; Wang, D.; Ma, Y.; Wang, Z. Model Based Study of Crop Evapotranspiration under Canopy Shading. Agronomy 2019, 9, 334. [Google Scholar] [CrossRef]
  19. Allen, R.G.; Walter, I.A.; Elliott, R.L.; Howell, T.A.; Itenfisu, D.; Jensen, M.E.; Snyder, R.L. The ASCE standardised reference evapotranspiration equation. In Task Committee on Standardization of Reference Evapotranspiration of the EWRI of the ASCE; ASCE: Reston, VI, USA, 2005. [Google Scholar]
  20. Kalma, J.D.; Stanhill, G. Transpiration, evaporation and deep drainage losses from an orange plantation. Israel J. Agric. Res. 1969, 19, 11–24. [Google Scholar]
  21. Jia, X.; Dukes, M.D.; Jacobs, J.M.; Haley, M. Impact of weather station fetch distance on reference evapotranspiration calculation. In Proceedings of the Restoring Our Natural Habitat. In Proceedings of the 2007 World Environmental and Water Resources Congress, Tampa, FL, USA, 15–19 May 2007. [Google Scholar]
  22. Středa, T.; Středová, H.; Rožnovský, J. Orchards microclimatic specifics. In Bioclimate: Source and Limit of Social Development, Topolčianky, Slovakia; Slovak University of Agriculture: Nitra, Slovakia, 2011; pp. 132–133. [Google Scholar]
  23. Kelvin, J.; Acreman, M.C.; Harding, R.J.; Hess, T.M. Micro-climate influence on reference evapotranspiration estimates in wetlands. Hydrol. Sci. J. 2017, 62, 378–388. [Google Scholar] [CrossRef]
  24. Quiñones, A.J.P.; Hoogenboom, G.; Gutiérrez, M.R.S.; Stöckle, C.O.; Keller, M. Comparison of air temperature measured in a vineyard canopy and at a standard weather station. PLoS ONE 2020, 15, e0234436. [Google Scholar] [CrossRef]
  25. Hardwick, S.R. Interactions Between Vegetation and Microclimate in a Heterogeneous Tropical Landscape. Ph.D. Thesis, Department of Physics, Imperial College London, London, UK, 2015. [Google Scholar]
  26. Neukam, D.; Ahrends, H.; Luig, A.; Manderscheid, R.; Kage, H. Integrating wheat canopy temperatures in crop system models. Agronomy 2016, 6, 7. [Google Scholar] [CrossRef]
  27. Gasca-Tucker, D.L.; Acreman, M.C.; Agnew, C.T.; Thompson, J.R. Estimating evaporation from a wet grassland. Hydrol. Earth Syst. Sci. 2007, 11, 270–282. [Google Scholar] [CrossRef]
  28. Huryna, H.; Brom, J.; Pokorny, J. The importance of wetlands in the energy balance of an agricultural landscape. Wetl. Ecol. Manag. 2014, 22, 363–381. [Google Scholar] [CrossRef]
  29. Kalma, J.D.; Stanhill, G. The climate of an orange orchard: Physical characteristics and microclimate relationships. J. Agric. Meteorol. 1972, 10, 185–201. [Google Scholar] [CrossRef]
  30. Flénet, F.; Kiniry, J.R.; Board, J.E.; Westgate, M.E.; Reicosky, D.C. Row spacing effects on light extinction coefficients of corn, sorghum, soybean, and sunflower. J. Agron. 1996, 88, 185–190. [Google Scholar] [CrossRef]
  31. Awal, M.A.; Ismail, W.I.W.; Harun, M.; Endan, J. Methodology and measurement of radiation interception by quantum sensor of the oil palm plantation. Songklanakarin J. Sci. Technol. 2005, 27, 1083–1093. [Google Scholar]
  32. Poblete-Echeverría, C.; Fuentes, S.; Ortega-Farias, S.; Gonzalez-Talice, J.; Yuri, J.A. Digital cover photography for estimating leaf area index (LAI) in apple trees using a variable light extinction coefficient. Sensors 2015, 15, 2860–2872. [Google Scholar] [CrossRef] [PubMed]
  33. Perrier, A. Land surface processes: Vegetation. In Land Surface Processes in Atmospheric General Circulation Models; Eagleson, P.S., Ed.; Cambridge University Press: Cambridge, UK, 1982; pp. 395–448. [Google Scholar]
  34. Olmedo, G.F.; Ortega-Farías, S.; de la Fuente-Sáiz, D.; Fonseca-Luego, D.; Fuentes-Peñailillo, F. Water: Tools and Functions to Estimate Actual Evapotranspiration Using Land Surface Energy Balance Models in R. R J. 2016, 8, 352–369. [Google Scholar] [CrossRef]
  35. Chandel, A.K.; Khot, L.R.; Yu, L.-X. Alfalfa (Medicago Sativa L.) Crop Vigor and Yield Characterization Using High-Resolution Aerial Multispectral and Thermal Infrared Imaging Technique. Comput. Electron. Agric. 2021, 182, 105999. [Google Scholar] [CrossRef]
  36. Khanal, R.; Barber, M.E. Integration of unmanned aerial vehicle imagery with Landsat imagery for better watershed scale ET prediction. Hydrology 2023, 10, 120. [Google Scholar] [CrossRef]
  37. Mokhtari, A.; Ahmadi, A.; Daccache, A.; Drechsler, K. Actual Evapotranspiration from UAV Images: A Multi-Sensor Data Fusion Approach. Remote Sens. 2021, 13, 2315. [Google Scholar] [CrossRef]
  38. Ballester, C.; Castel, J.; Jiménez-Bello, M.A.; Intrigliolo, D.S.; Castel, J.R. Are sap flow and canopy temperature measurements useful alternatives to stem water potential for detecting plant water stress in citrus trees. Acta Horticult. 2014, 1038, 51–57. [Google Scholar] [CrossRef]
  39. Conejero, W.; Mellisho, C.D.; Ortuño, M.F.; Galindo, A.; Pérez-Sarmiento, F.; Torrecillas, A. Establishing maximum daily trunk shrinkage and midday stem water potential reference equations for irrigation scheduling of early maturing peach trees. Irrig. Sci. 2011, 29, 299–309. [Google Scholar] [CrossRef]
  40. Prata, A.J. A new long-wave formula for estimating downward clear-sky radiation at the surface. Q. J. R. Meteorol. Soc. 1996, 122, 1127–1151. [Google Scholar]
  41. Sun, Z.; Gebremichael, M.; Wang, Q.; Wang, J.; Sammis, T.; Nickless, A. Evaluation of clear-sky incoming radiation estimating equations typically used in remote sensing evapotranspiration algorithms. Remote Sens. 2013, 5, 4735–4752. [Google Scholar] [CrossRef]
  42. Stettz, S.; Zaitchik, B.F.; Ademe, D.; Musie, S.; Simane, B. Estimating variability in downwelling surface shortwave radiation in a tropical highland environment. PLoS ONE 2019, 14, e0211220. [Google Scholar] [CrossRef] [PubMed]
  43. Allen, R.; Irmak, A.; Trezza, R.; Hendrickx, J.M.; Bastiaanssen, W.; Kjaersgaard, J. Satellite-based ET estimation in agriculture using SEBAL and METRIC. Hydrol. Process. 2011, 25, 4011–4027. [Google Scholar] [CrossRef]
  44. Allen, R.G.; Dhungel, R.; Dhungana, B.; Huntington, J.; Kilic, A.; Morton, C. Conditioning point and gridded weather data under aridity conditions for calculation of reference evapotranspiration. Agric. Water Manag. 2021, 245, 106531. [Google Scholar] [CrossRef]
  45. Mihailovic, D.T.; Eitzinger, J. Modelling temperatures of crop environment. Ecol. Model. 2007, 202, 465–475. [Google Scholar] [CrossRef]
  46. Allen, R.G.; Wright, J.L. Translating wind measurements from weather stations to agricultural crops. J. Hydrol. Eng. 1997, 2, 26–35. [Google Scholar] [CrossRef]
  47. Katul, G.G.; Mahrt, L.; Poggi, D.; Sanz, C. One-and two-equation models for canopy turbulence. Bound. Layer Meteorol. 2004, 113, 81–109. [Google Scholar] [CrossRef]
  48. Bonan, G.B. Forests and climate change: Forcings, feedbacks, and the climate benefits of forests. Science 2008, 320, 1444–1449. [Google Scholar] [CrossRef]
  49. Cassiani, M.; Katul, G.; Albertson, J. The effects of canopy leaf area index on airflow across forest edges: Large-eddy simulation and analytical results. Bound. Layer Meteorol. 2008, 126, 433–460. [Google Scholar] [CrossRef]
  50. Banerjee, T.; Katul, G.; Fontan, S.; Poggi, D.; Kumar, M. Mean flow near edges and within cavities situated inside dense canopies. Bound. Layer Meteorol. 2013, 149, 19–41. [Google Scholar] [CrossRef]
  51. Banerjee, T.; Linn, R. Effect of vertical canopy architecture on transpiration, thermoregulation and carbon assimilation. Forests 2018, 9, 198. [Google Scholar] [CrossRef]
  52. Bailey, B.; Overby, M.; Willemsen, P.; Pardyjak, E.; Mahaffee, W.; Stoll, R. A scalable plant-resolving radiative transfer model based on optimized GPU ray tracing. Agric. For. Meteorol. 2014, 198, 192–208. [Google Scholar] [CrossRef]
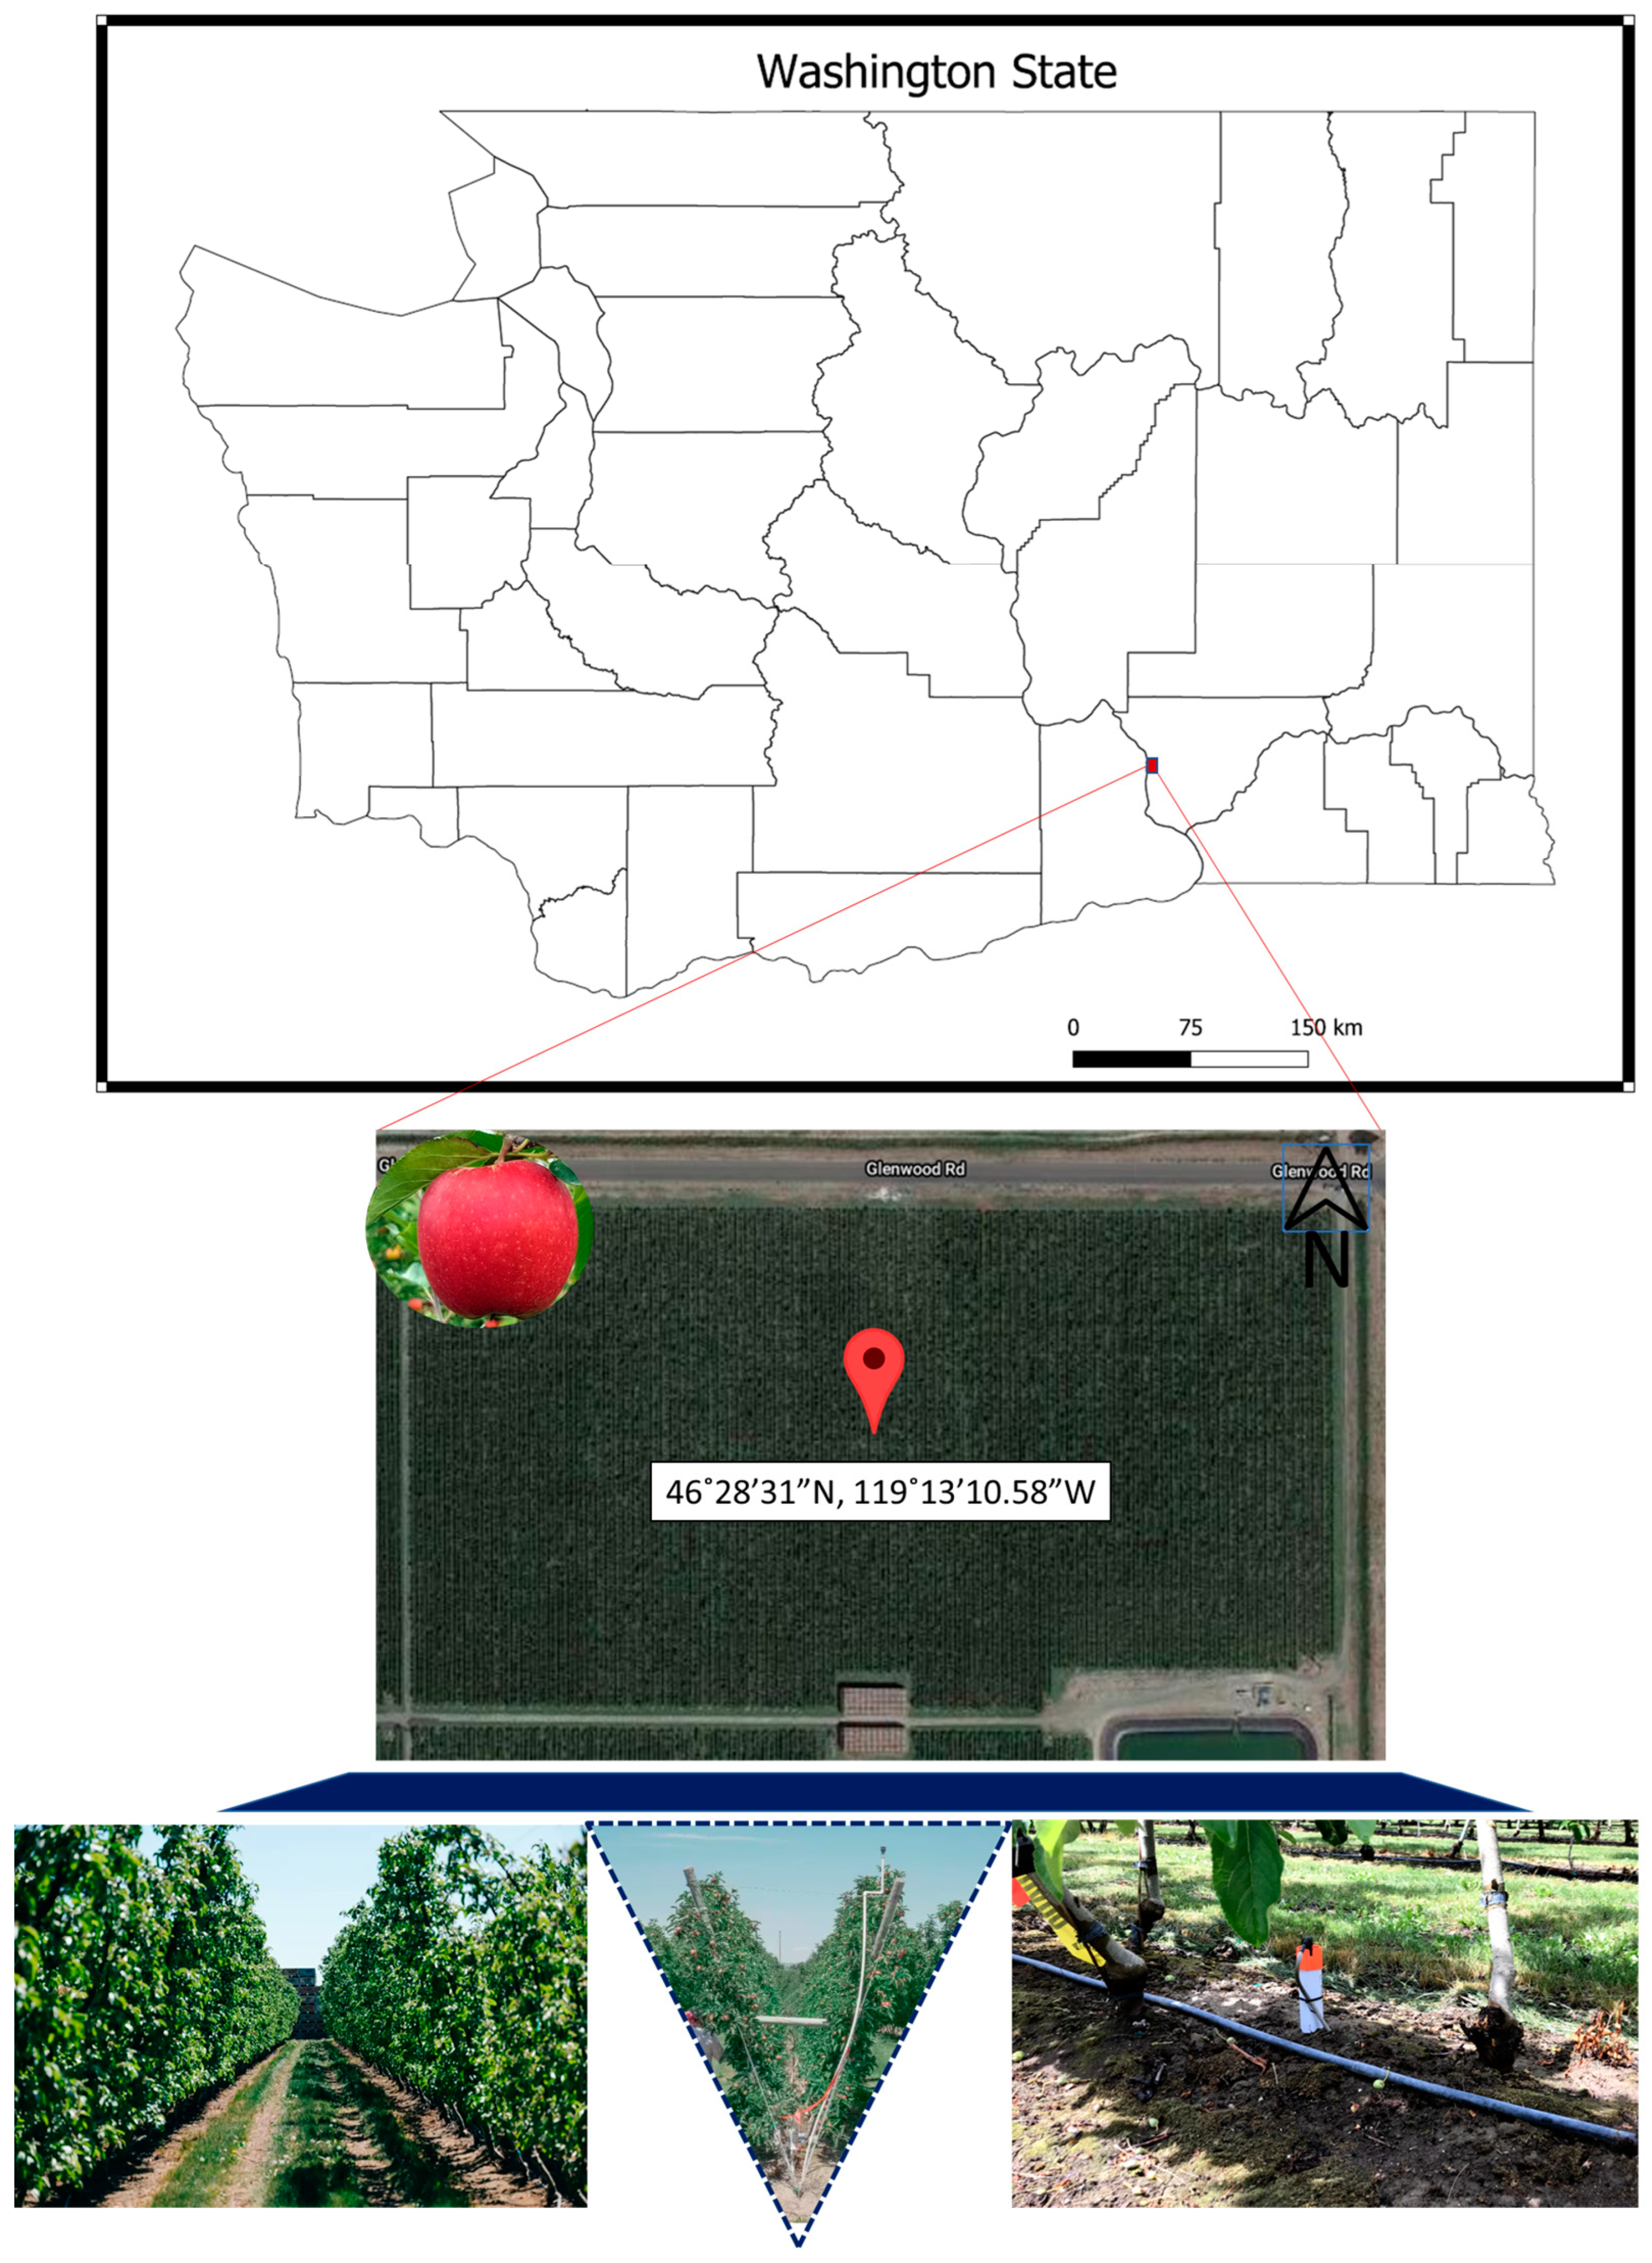
Figure 1. Study site of a high-density apple orchard trained in a modern V-trellis architecture and irrigated using under-tree surface drip system.
Agriengineering 07 00154 g001
Figure 2. Aerial imaging and georeferencing hardware used for high-density apple orchard mapping (RTK: real-time kinematics).
Agriengineering 07 00154 g002
Figure 3. (a) Weather stations within 5 km radius of site, outlined in Google Maps, and (b) all-in-one weather sensors at different heights above ground level on station WD-1. WD refers to weather station at a given distance from site while WH refers to all-in-one weather sensor at a given height above ground level.
Agriengineering 07 00154 g003
Figure 4. Tree trunk water potential variations observed for a month of growing season from trees in different sections of the apple orchard.
Agriengineering 07 00154 g004
Figure 5. 24 h Evapotranspiration (ET) maps for high-density apple orchard derived from (a) standard Landsat-METRIC (LM) approach, (b) high-resolution UAS-METRIC-1 (UASM-1) approach on 16 July 2020, (c) their comparison for 30 m × 30 m pixel areas on 41st day before harvest (16 July 2020), and (d) comparison of mean transpiration (T) estimates from UASM-1 and FAO-Kcb (single crop coefficient) approaches for imaging days. Here, r is Pearson correlation coefficient, RMSD is root mean square error in mm day−1, and ETd,MAN and Td,MAN are mean of normalized absolute departures in ET and T between the UASM-1 and respective standard approaches, respectively.
Agriengineering 07 00154 g005
Figure 6. Comparison of (a) aerial thermal and multispectral imagery, and in situ weather-derived instantaneous transpiration estimates (UASM-1), with hourly reference tree trunk water potential (TTWP) and (b) in situ weather-based 24 h reference evapotranspiration derived using Penman-Monteith method, with daily reference TTWP measurements.
Agriengineering 07 00154 g006
Figure 7. Correlation plots between on-ground measured leaf area index (LAI) and UAS imagery mapped (a) LAI using conventional method, (b) soil adjusted vegetation index (SAVI), (c) normalized difference vegetation index (NDVI), and (d) green-NDVI (GNDVI).
Agriengineering 07 00154 g007
Figure 8. Comparison of transpiration (T) estimates from high-resolution UASM-1 and UASM-2 approaches with (a) correlation and (b) orchard-mean at temporal scale.
Agriengineering 07 00154 g008
Figure 9. Variation of (a) solar radiation, (b) wind speed, (c) relative humidity, (d) air temperature, and (e) reference ET pertinent to measurements by open-field sources around and at the orchard center.
Agriengineering 07 00154 g009
Figure 10. Variation of weather parameters: (a) solar radiation, (b) wind speed, (c) relative humidity, (d) air temperature, and (e) reference ET relative to measurement by sources within the orchard.
Agriengineering 07 00154 g010
Figure 11. Comparative plots of spatiotemporal T estimates using weather inputs from sources (a) at different distances around the orchard, relative to WD-1, and (b) within the orchard at different canopy heights relative to WH-3.
Agriengineering 07 00154 g011
Table 1. Topographical details of weather stations considered for mapping transpiration of apple trees.
SourceLatitude (°N)Longitude (°W)Ground Elevation (m, a AMSL)Sensor Height (m, b AGL)
WD-146.475119.2192775.0
WD-246.476119.2202771.8
WD-346.471119.2112832.0
WD-446.440119.2202702.0
WD-546.483119.1842672.0
WH-146.475119.2192770.8
WH-246.475119.2192771.8
WH-346.475119.2192775.0
Median46.475119.2192771.8
WMean46.475119.2192772.5
a AMSL: Above mean sea level, b AGL: Above ground level.
Table 2. Mean (and k SD) values of energy components from the UASM-1 and UASM-2 approaches.
Approacha LAI b ISWR c OLWR d ILWR e Rn f G g Zomh H i ET
DBH: 92
(j ETr = 7.4)
UASM-11.7 (1.5)850445 (56)350 (46)658 (46)52 (36)0.6 (0.3)238 (82)5.0 (2.0)
UASM-22.3 (1.2)831448 (55)341630 (81)47 (27)0.6 (0.3)170 (35)5.6 (1.6)
DBH: 76
(ETr = 5.8)
UASM-11.6 (1.4)706461 (48)366 (40)535 (33)42 (27)0.7 (0.3)244 (38)3.9 (1.2)
UASM-22.2 (1.1)563464 (48)358497 (61)29 (13)0.6 (0.3)110 (13)4.0 (1.0)
DBH: 41
(ETr = 9.3)
UASM-11.8 (1.0)892499 (47)391 (39)678 (38)69 (35)0.7 (0.3)225 (74)5.9 (2.0)
UASM-22.4 (0.9)829503 (48)365594 (69)58 (23)0.6 (0.2)193 (39)6.0 (1.8)
DBH: 21
(ETr = 6.8)
UASM-12.6 (1.4)870486 (48)379 (40)652 (38)54 (35)0.6 (0.3)199 (42)5.2 (1.3)
UASM-22.9 (1.1)795488 (47)368575 (69)46 (22)0.5 (0.2)104 (18)5.5 (1.3)
DAH: 5
(ETr = 6.4)
UASM-11.7 (1.1)791426 (38)335 (32)608 (28)40 (24)0.7 (0.3)233 (42)4.7 (1.1)
UASM-22.4 (1.0)725429 (38)340553 (52)35 (18)0.6 (0.3)174 (22)4.9 (1.0)
a LAI: leaf area index (m2 m−2), b ISWR: incoming shortwave radiation (Wm−2), c OLWR: outgoing longwave radiation (Wm−2), d ILWR: incoming longwave radiation (Wm−2), e Rn: net radiation (Wm−2), f G: soil heat flux (Wm−2), g Zom: momentum roughness length (m), h H: sensible heat flux (Wm−2), i ET: evapotranspiration (mm day−1), j ETr: reference ET (mm day−1), k SD: standard deviation.
Disclaimer/Publisher’s Note: The statements, opinions and data contained in all publications are solely those of the individual author(s) and contributor(s) and not of MDPI and/or the editor(s). MDPI and/or the editor(s) disclaim responsibility for any injury to people or property resulting from any ideas, methods, instructions or products referred to in the content.