Article

Visible and Near-Infrared Spectroscopy for Investigation of Water and Nitrogen Stress in Tomato Plants

1
Department of Agricultural Engineering, Faculty of Agriculture, Trakia University, Students Campus, 6000 Stara Zagora, Bulgaria
2
Department of Plant Sciences, Faculty of Agriculture, Trakia University, Students Campus, 6000 Stara Zagora, Bulgaria
*
Author to whom correspondence should be addressed.
AgriEngineering 2025, 7(5), 155; https://doi.org/10.3390/agriengineering7050155
Submission received: 26 March 2025 / Revised: 5 May 2025 / Accepted: 9 May 2025 / Published: 14 May 2025
(This article belongs to the Section Remote Sensing in Agriculture)

Abstract

:
The main objective of this study was to evaluate the possibilities of visible-near-infrared spectroscopy for investigating water and nitrogen stress in tomato plants. Two varieties of tomato plants (Red Bounty and Manusa) were grown in a greenhouse. Plants were divided into three groups: control, reduced nitrogen fertilization, and reduced watering. Spectral measurements of tomato leaves were made on-site. A USB4000 spectrometer for 450–1100 nm and a handheld AlbaNIR for the 900–1650 nm region were used for the spectra acquisition. Twenty-four vegetative indices were calculated using the reflectance characteristics of plants. Soft Independent Modeling of Class Analogy (SIMCA) models were developed for classification. Additionally, aquagrams were calculated. Results show differences between the spectra of leaves from control and stressed plants for both tomato varieties. Aquagrams clearly show the differences in water structures in the three groups of plants. The performance of developed SIMCA models for discriminating plants according to growing conditions was very high. The total accuracy was between 86.89% and 97.09%. Several vegetation indices successfully differentiate control and stressed plants for both tomato varieties. The results show successful differentiation of the control and stressed tomato plants based on spectral characteristics of the plants’ leaves in the visible and near-infrared region.

1. Introduction

The productivity of plants is considerably affected by various abiotic stresses. Plant stress detection is critical to increasing crop yield. Quickly detecting drought and nutrient deficiencies promotes the immediate and precise delivery of nutrients. In recent years, modern technological solutions have been applied in agriculture to reduce losses resulting from abiotic stress. Knowledge transfer from laboratory tests to crops in fields and under greenhouse conditions is one of the most important issues. Traditional methods of estimating plant nitrogen and water status involve the removal and analysis of the plant leaves. Some methods are based on physiological, biochemical, and molecular techniques. Plants under drought conditions show reduced stomatal conductance and increased leaf temperature [1]. Stress conditions lead to a decrease in chlorophyll content [2]. The level of carotenoids can be indicative of stress. All these methods provide very accurate data, but they are slow, and their sampling is destructive. These features prevent conducting dynamic studies.
Recently, spectroscopy in the visible and near-infrared (VNIR) regions was used to investigate the effects of abiotic stress on plants [3,4,5,6]. The visible region provides information on plant pigments such as chlorophylls, carotenoids, and anthocyanins because the pigments have absorption maxima in the red and blue areas. Absorption in the near-infrared region provides information about the chemical composition of plants, the content of moisture, protein, cellulose, lignin, etc., and the structure of cells. Therefore, changes in the chemical composition and structure of cells as a result of various stress factors will be reflected in a specific way in the spectra of plants. VNIR spectroscopy has advantages over conventional chemical methods of plant analysis. It requires little or no sample preparation and can be used for in-field measurements. It does not use special consumables and chemicals after instrument calibration. Data on the concentration of several components can be obtained with only one spectral measurement. Continuous real-time measurements allow physiological investigations.
VNIR spectroscopy can detect various types of abiotic stress, including water stress, heat stress, and nutrient deficiencies. One approach is to use chemometric methods to extract information from plants’ near-infrared spectra and create equations to determine quantitative parameters and models for classification [7,8]. A novel scientific method is aquaphotomics, based on the near-infrared spectra of water in different materials, mainly biological samples, and analysis of changes in water spectra caused by the influence of various factors [9,10,11]. This new approach will provide additional information about the plants’ condition and health. A combination of NIRS with aquaphotomics has already been used for nondestructive investigation of plants’ abiotic stress and diseases [12,13,14]. Several groups of scientists have investigated the application of spectral analysis in the visible and near-infrared regions to analyze the condition of tomato plants. Portable spectrometers or multispectral and hyperspectral cameras were used for non-destructive analysis of tomato leaves grown in greenhouses or in the field and under different levels of nitrogen or water stress. Suhandy et al. [15] investigated the possibilities of spectral analysis in the near-infrared region for determining the water potential of tomato leaves. They found that the best determination accuracy was obtained using the 700–990 nm spectral range. Kuo et al. [16] investigated drought stress in tomato plants at an early stage without visible morphological changes. Based on spectral information in the range 348–1052 nm and a neural network as a qualification method, 90% determination accuracy was obtained. Weng et al. [17] used a hyperspectral camera operating in the range of 400 to 1000 nm to detect drought in tomato plants. Images of leaves of plants with different degrees of water stress were obtained, from which reflectance spectra were analyzed. Models for determining water stress were created based on the spectral characteristics. The accuracy of determination was 95.90% in calibration and 95.78% in independent verification. Visible and NIR spectroscopy were used for non-destructive determination of nitrogen, phosphorus, and potassium content in greenhouse tomato plants based on multispectral images in the range of 400–1000 nm, and a very good accuracy in determination was obtained [18]. Ulissi et al. [19], using a portable VIS-NIR spectrometer, reported a very high correlation coefficient (r = 0.94) between spectral data and nitrogen content in tomato leaves.
Another approach is the development of vegetation indices, typically used in remote sensing. A comprehensive review of the reflectance indices used for monitoring crop water stress and scheduling irrigation has been detailed by Katsoulas et al. [3] and Ihuoma and Madramootoo [6]. Several different vegetative indices were studied to detect water stress in tomato plants grown in greenhouses. It was found that the photochemical reflectance index PRI550, water index WI, optimized soil vegetative index OSAVI, and normalized water index WI/NDVI were the most sensitive to water stress [6]. The same team also studied tomatoes grown under field conditions to investigate the combined effects of water and nitrogen stress [20]. The results showed that the photochemical reflectance indices PRI550, PRInorm, and water index WI were the most sensitive for distinguishing water-stressed plants. At the same time, RDVI, PRInorm, and Transformed Chlorophyll Absorption in Reflectance Index TCARI correlated best with nitrogen stress indicators. PRInorm was the most sensitive index for detecting the combined effect of water and nitrogen stress.
The main purpose of this study was to evaluate the possibilities of visible and near-infrared spectroscopy and aquaphotomics for the investigation of water and nitrogen stress in tomato plants. Specifically, the objectives were as follows:
  • Investigate changes in the water structure of control and stressed plants using an aquaphotomic approach;
  • Test different vegetative indices for detecting water and nitrogen stress in tomato plants;
  • Create models for the classification of control and stressed tomato plants based on their near-infrared spectra.

2. Materials and Methods

2.1. Tomato Experiment

The Red Bounty and Manusa varieties of tomato plants were grown in a polyethylene greenhouse in training experimental fields at Trakia University, Stara Zagora, Bulgaria. The greenhouse was unheated and had only the option of ventilation. The plants were grown in soil and planted in rows in an 80 × 30 cm scheme, with previously grown seedlings of the indicated varieties.
Plants were divided into three groups. The plants from the first group were grown under optimal agro-technical conditions and were used as control plants. The plants were fertilized with ammonium nitrate (8 kg/ha) every 10 days before and during the fruiting of the tomato plants [21]. Two or three waterings per week were made depending on the temperature and the plants’ conditions. The second group had plants that received 67% of nitrogen fertilizers compared to the control and regular watering. The third group had normal fertilization and had one-third reduced watering. A total of twenty plants were grown from each group.
Spectral measurements of leaves from each group were made on-site at the flowering stage of tomato plants, seven days after nitrogen fertilization and four days after watering. Spectral measurements were made twice.

2.2. Spectral Measurement

Spectral measurements of leaves from control and stressed plants were made using a nondestructive method. The diffuse reflectance from tomato leaves was measured using the USB4000 and AlbaNIR spectral devices. The USB4000 is a portable scanning spectrometer (OceanOptics, Inc., Orlando, FL, USA) operating from 450 to 1100 nm. The reflectance fiber optic probe was used for the spectra acquisition. The reflection holder was used to position the probe perpendicular to the measured surface at a constant distance to ensure uniform measurement conditions and eliminate external light’s influence. The spectra were recorded as reflectance.
The second instrument, AlbaNIR, from GrainNit, S.r.L., Padua, Italy, operates in the range from 900 to 1650 nm. The AlbaNIR spectrometer has two built-in radiation sources and a detector, and allows direct measurement from the leaf surface. The spectra were recorded as absorbance.
The measurements of the tomato leaves were made in the greenhouse simultaneously with both spectrometers immediately after detachment of the leaves from the plants. The leaves were detached because there was no electricity in the greenhouse where the plants were grown. The spectrometers were battery-powered, which prevented measurements from being taken on each plant. The spectrometers used are capable of taking measurements on plants in vivo. Thirty different leaves from each group of tomato plants and varieties were measured. For each measured leaf, spectral data were obtained from several different points on the upper surface of the leaf. In the range of 450–1100 nm, for all the varieties, the number of recorded spectra was as follows: 66 spectra from the control group, 69 from the group with reduced fertilization, and 66 from the group with reduced watering. In the range of 900–1650 nm, the recorded spectra were as follows: control plants (n = 102 for Red Bounty and n = 86 for Manusa); plants with reduced nitrogen fertilization (n = 86 for Red Bounty and n = 89 for Manusa); plants with reduced watering (n = 87 for Red Bounty and n = 92 for Manusa).

2.3. Vegetative Indices

Further, 24 vegetation indices (shown in Table 1) were calculated from every spectrum, and their values were analyzed. The selected vegetative indices are mainly related to the content of pigments in plants, such as several indices connected with chlorophyll and carotenoid absorption. Another is the water band index. Several indices, connected with disease estimation, were also tested.

2.4. Data Analysis, Classification Models, and Aquagrams

A Pirouette 4.5 (Infometrix, Inc. Bothell, WA, USA) was used for performing spectral data processing. Soft Independent Modeling of Class Analogy (SIMCA) was used to develop the classification models. The class variable was assigned to each analyzed sample: class “control plants”, class “plants grown with reduced nitrogen fertilization”, and class “plants grown with reduced watering”, respectively. The spectral data were transformed as first derivatives before the application of SIMCA modeling. The probability threshold was set to 0.95. The probability threshold is a value used to determine whether a sample belongs to a certain class or not.
The F1 score and total accuracy were used as the classification model performance indicators. The F1 score is a harmonic mean of precision and sensitivity (recall) calculated for each class. In a multi-class classification model, the F1 score for a class is a digital representation of whether the prediction on a specific class is valid. Total accuracy measures the number of correctly determined samples divided by the total number of predictions made. The terms are defined as follows:
P r e c i s i o n = T P T P + F P
S e n s i t i v i t y = T P T P + F N
F 1 = 2 × S e n s × P r e c S e n s + P r e c
T o t a l   a c c u r a c y = T P + T N T P + T N + F P + F N
where TN is the number of true negatives, FP is the number of false positives, FN is the number of false negatives, and TP is the number of true positives. These parameters were multiplied by 100 to turn them into a percentage.
Additionally, so-called aquagrams were calculated. An aquagram is a radar chart with coordinates, related to wavelengths, connected with absorption of free water, and specific water configurations such as dimers, trimers, solvation shells, etc., and named water matrix coordinates [9]. Further in the text, the water matrix coordinates are typed as C1, C2, C3, etc. The values for aquagram A q λ are calculated using the following equation:
A q λ = A λ μ λ σ λ ,
where A λ is the absorbance at a wavelength λ after multiplicative scatter correction (MSC) transformation of spectral data, μ λ is the mean value of all spectra, and σ λ is the standard deviation of all spectra at a wavelength λ , respectively. Aquagrams were calculated using the new 19 water matrix coordinates proposed by Vitalis et al. [39].
Multivariate ANOVA was applied to calculate the significant differences between the control and treated groups of plants, as well as between groups with reduced nitrogen fertilization and with reduced watering. Depending on Levene’s test of equality of error variances, the Post Hoc multiple comparisons were used with LSD or Dunnett T3 test at p-value < 0.05. Data processing was performed with IBM® SPSS® Statistics 26.0 software package.

3. Results and Discussion

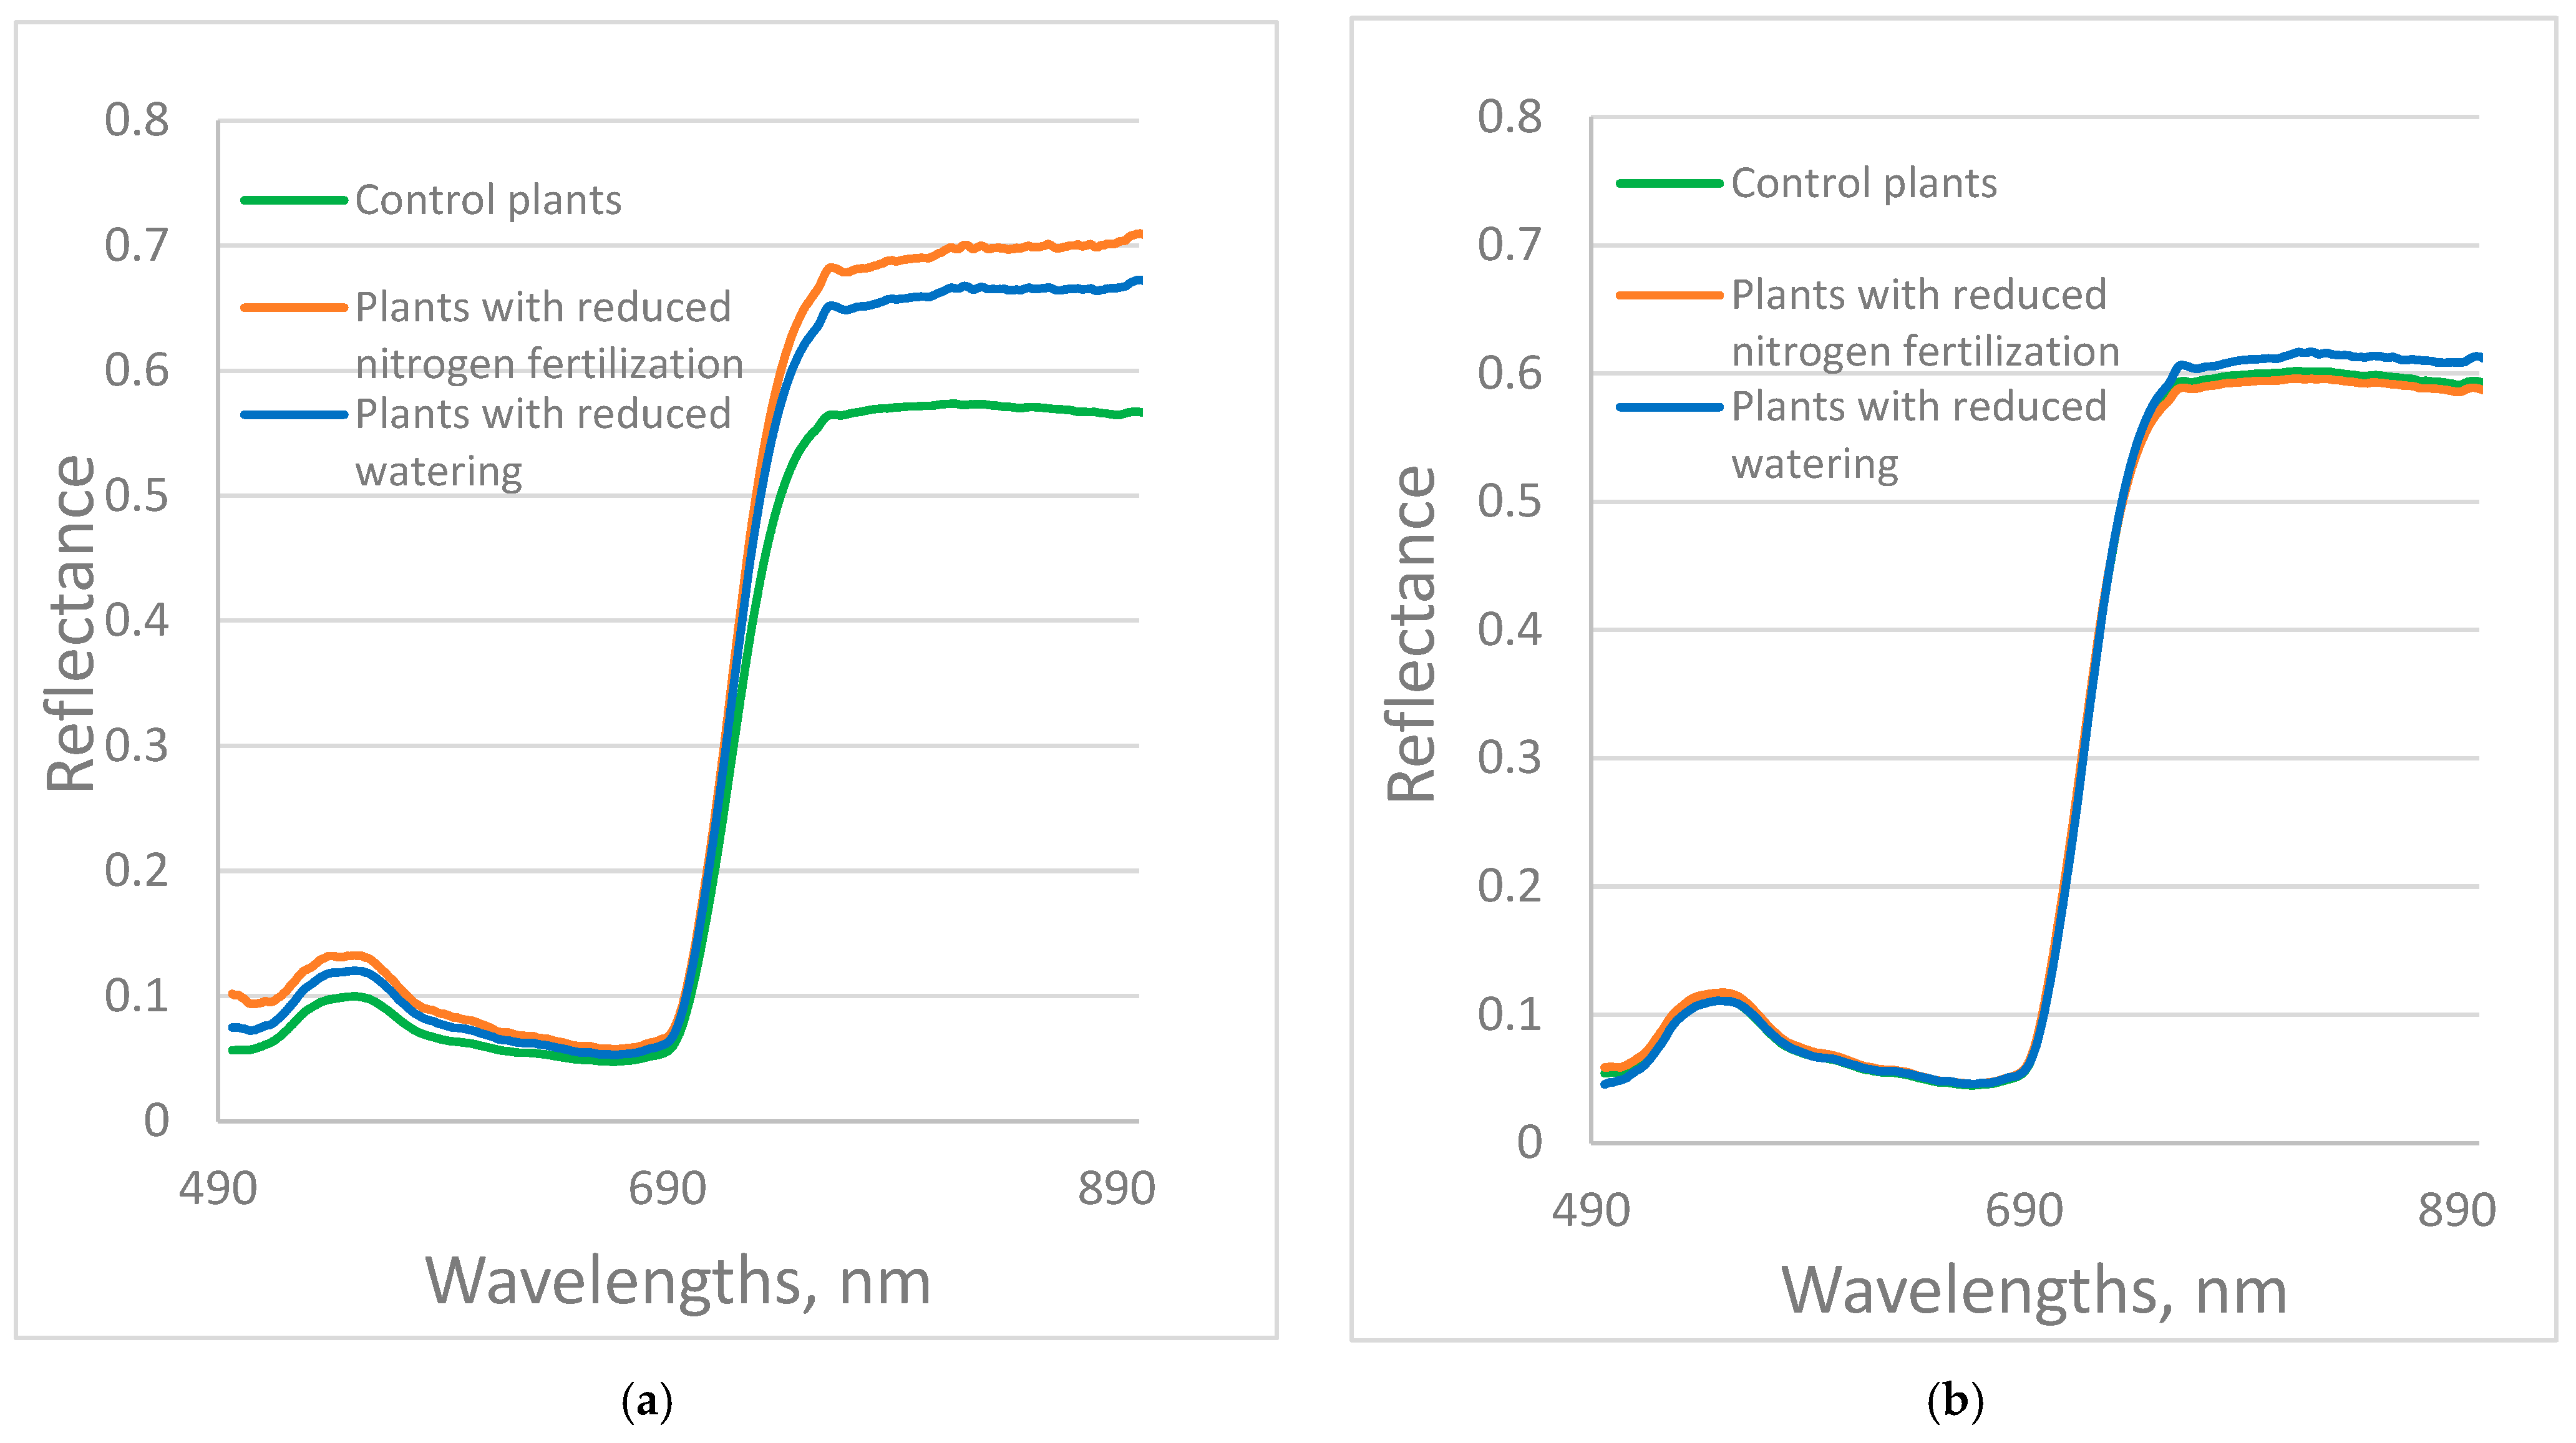
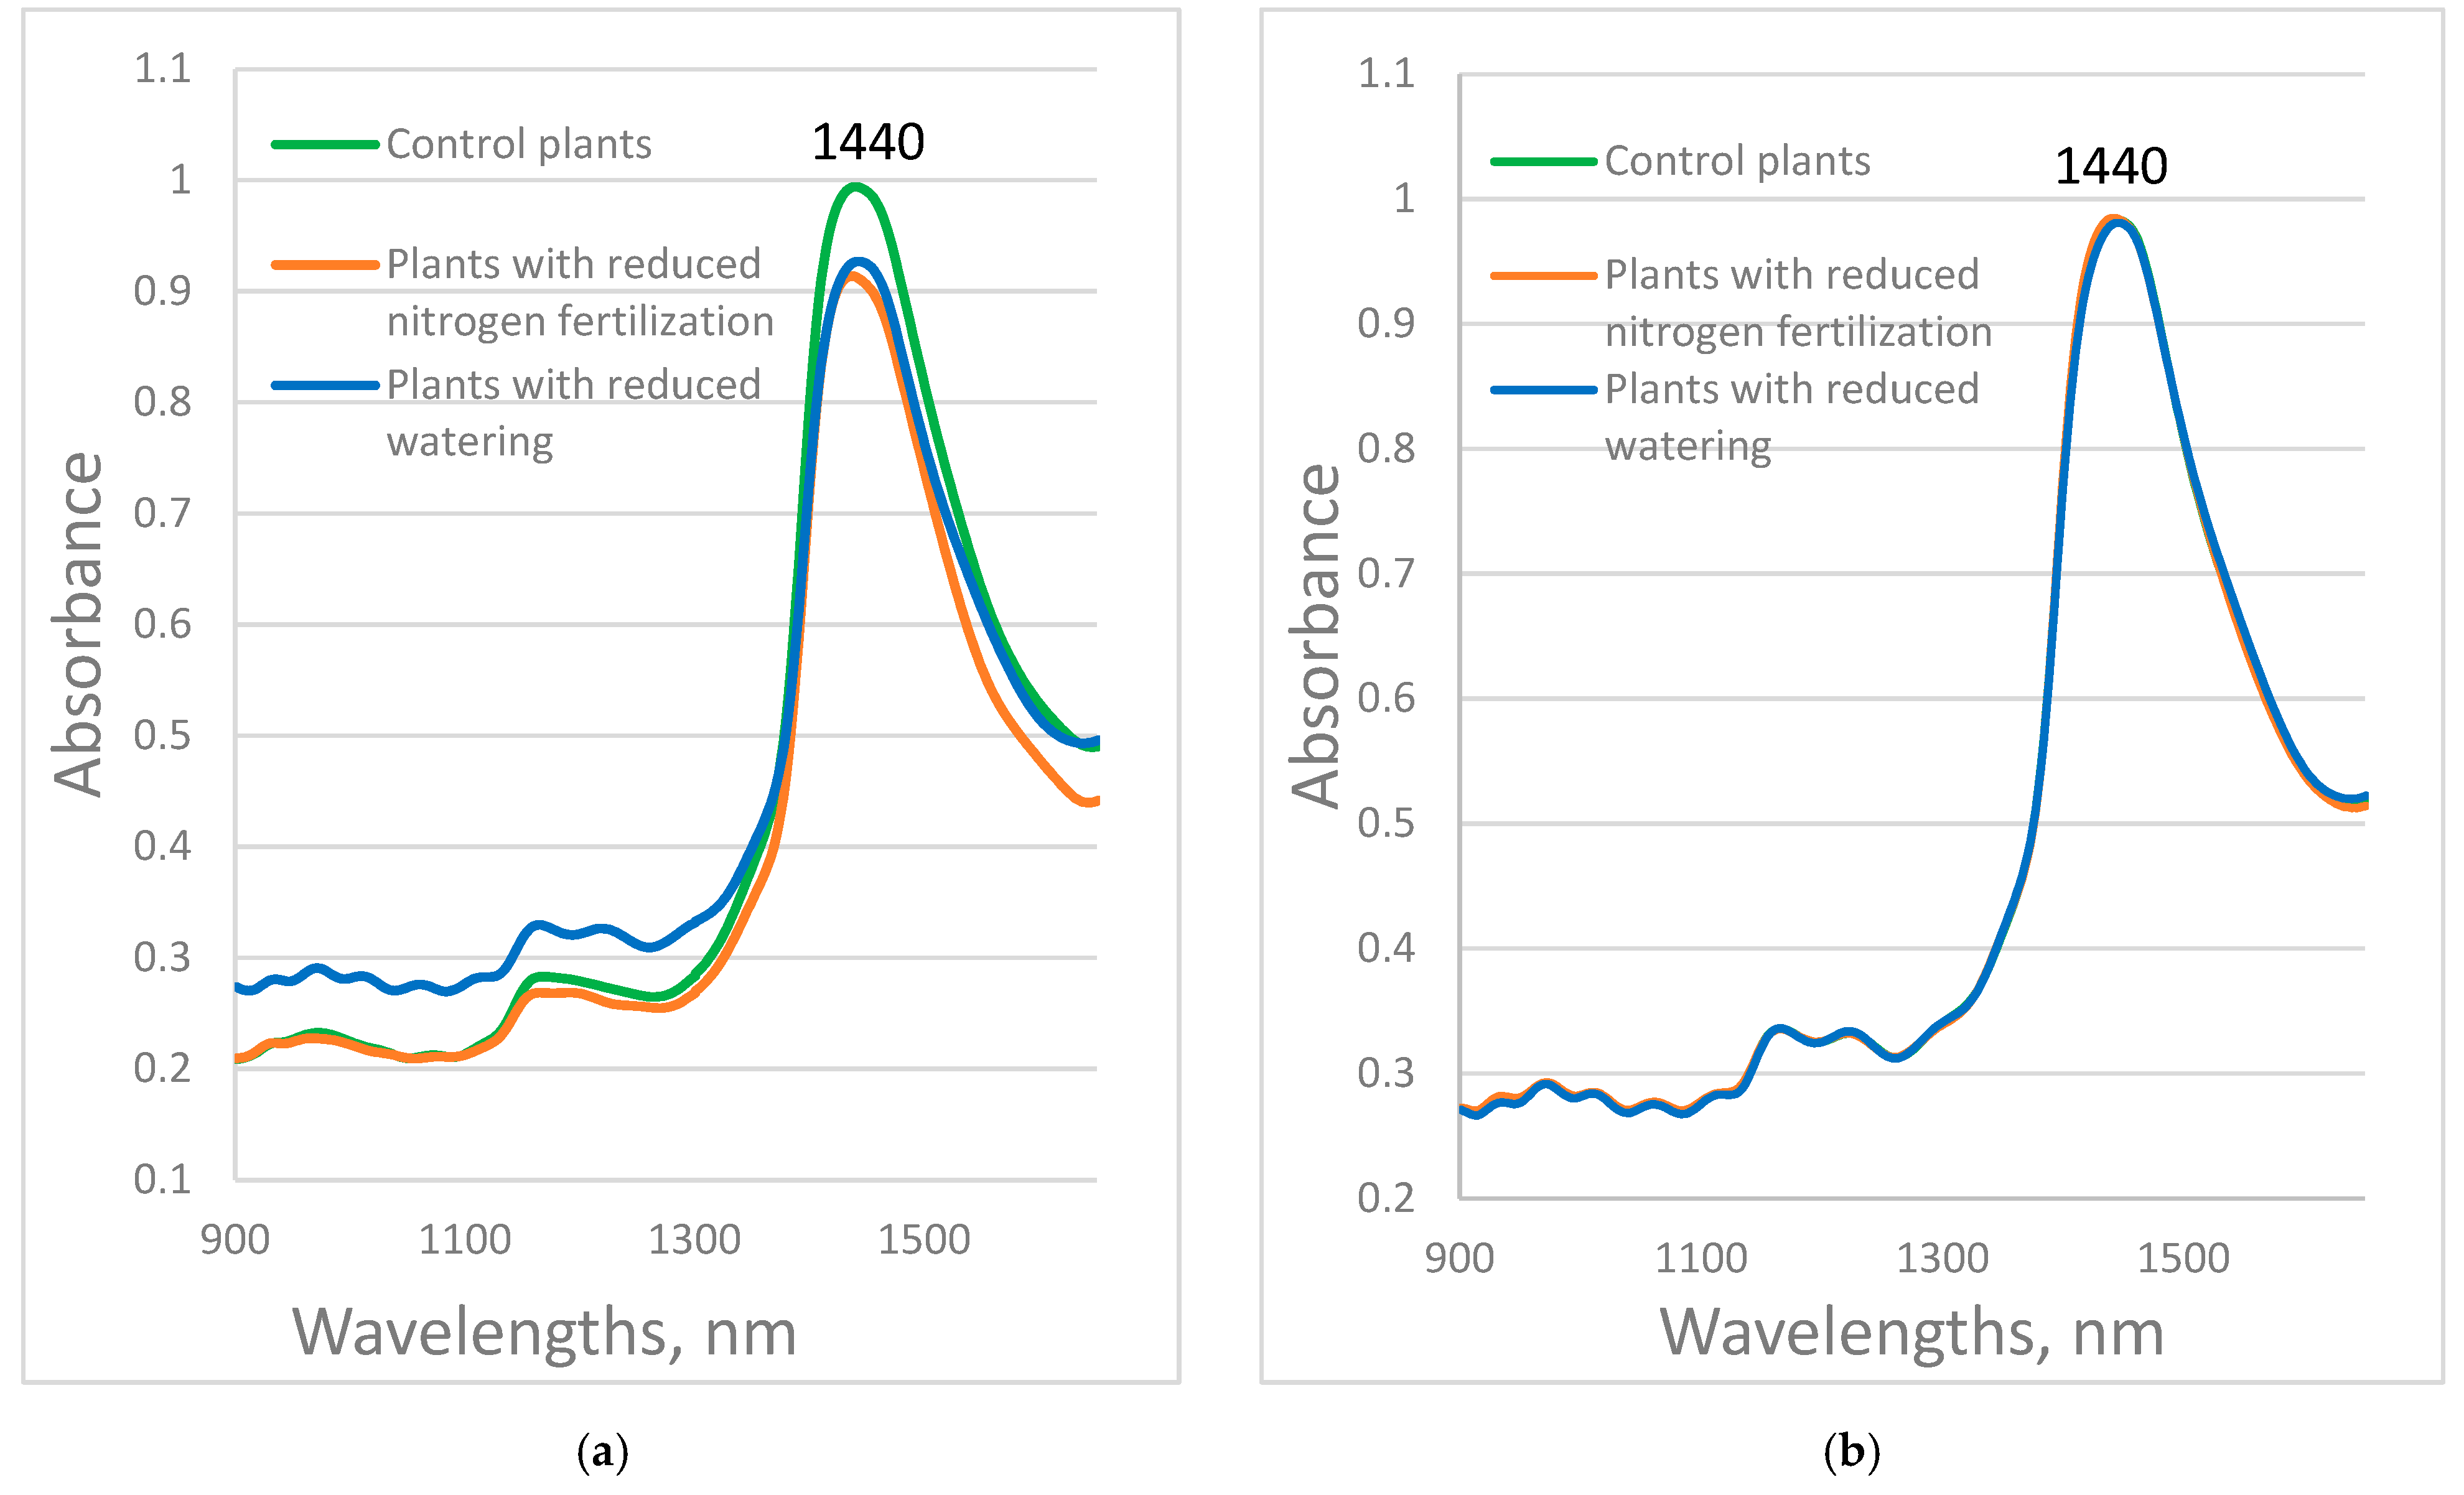
3.1. Tomato Plants Spectra

The average reflectance spectra in the visible-near-infrared range of the studied control plants, plants with reduced nitrogen fertilization or reduced watering during growing, are presented in Figure 1a for the Red Bounty variety and Figure 1b for the Manusa variety. The differences between the spectra of the leaves of control and stressed plants of the Manusa variety are much smaller in comparison with those of the Red Bounty variety. The leaf reflectance curves showed similar shapes and varied among stress factors. There are peaks around 550 nm and a minimum near 680 nm. The plants with reduced nitrogen fertilization from both varieties show higher reflectance values compared to the control group within the visible range, which means that the plants absorb less visible light for photosynthesis. A similar finding was reported for the spectral signature of leaves in the investigation of water and nitrogen stress in field grown tomato crops [20]. The differences between the spectra of the leaves of the control group of tomatoes and the stressed plants, and the differences between the spectra of the differently stressed plants are bigger in the 750–900 nm region, compared to the visible one. This indicates the existence of differences in the chemical composition and structure of plant cells between control and stressed plants. The reflectance of the stressed plants from the Red Bounty variety was much higher in the near-infrared region. This could be due to radiation scattering by air bubbles arising in sponge cavities because of less water content and amendment of leaf chemical composition [40,41]. The reflectance of Manusa plants with reduced watering was also higher than that of control plants.
Differences in spectral characteristics in this range were also observed in an experiment to study the effects of varying exposure times of microelement fertilization on pepper plants grown in an aquaponic system [42].
The average absorbance spectra of the studied plants in the range of 900–1650 nm are presented in Figure 2a for the Red Bounty variety and Figure 2b for the Manusa variety. Significant differences in the spectra between the control and stressed plants of the Red Bounty variety are observed around 1440 nm. The absorption in this range is mainly due to the O-H bonds of water. A difference was observed between the absorbance of control plants and plants with reduced nitrogen fertilization and those with reduced watering in the 900–1300 nm range. This is probably due not only to changes in the chemical composition, but mostly to changes in the structure of the leaves due to drought. Differences in absorption spectra in the first overtone water region from 1300 to 1600 nm between control and water-stressed maize plants, as well as between different days of water stress, were reported [43].
Again, the differences among the spectra of the control and stressed plants of the Red Bounty variety are much greater than those of the Manusa variety. This could be explained by the higher resistance to stress factors of the plants of the Manusa variety compared to those of the Red Bounty variety.
A chart referred to as an “aquagram” was used to visualize the changes in the water absorbance pattern. The aquagrams, calculated using spectral data from the control plants, plants with reduced nitrogen fertilization, and plants with reduced watering, are presented in Figure 3. There are differences in aquagrams between control plants and stressed plants, as well as between plants with reduced nitrogen fertilization and plants with reduced watering for both tomato varieties.
The aquagram coefficients for control Manusa plants showed that the different water structures are approximately evenly distributed, with a small predominance of free water compared to the more strongly bound water. Aquagram values decreased in the range 1391–1473 nm and increased in 1503–1559 nm for plants with reduced watering. A characteristic is the decrease at 1411 nm (C5 water matrix coordinate), a wavelength associated with free water. This indicates a decrease in the free water due to the reduced watering. The region of 1503–1559 nm corresponded to strongly bound water and structural water, which is a result of water-cellulose or water-protein interaction [14]. Different changes in the aquagram of plants with reduced nitrogen fertilization were observed. The aquagram values increased in 1411–1441 nm (C5, C6, and C7 water matrix coordinates). This indicated more free-water content compared to control plants.
From Figure 3, it is clearly seen that the aquagrams for leaves from the Red Bounty tomato variety were different from those for Manusa, especially for control plants and plants with reduced watering. Aquagram for Red Bounty control plants had the highest values in the 1348–1391 nm (C1–C5 water matrix coordinates) and 1503–1559 nm areas. This indicated that a portion of the water in this tomato plant variety was in the quasi-free or free state. Another part of the water was in strongly bound water and structural water. The aquagram of plants with reduced watering showed a strong reduction of free water and an increase in the water solvation shell (aquagram values at 1447 nm), and water molecules with two or three hydrogen bonds (aquagram values at 1454, 1465, and 1473 nm). Some of the water in plants with reduced watering was in a strongly bound state or structural water (1522–1559 nm). The aquagram of plants with reduced nitrogen fertility of the Red Bounty variety showed characteristics similar to those obtained for plants of the Manusa variety. The aquagram values increased in the 1411–1441 nm region. This indicated more free-water content compared to control plants.
The aquagrams clearly showed changes in the ratio of free and bound water and the number of hydrogen bonds between water molecules in control and stressed plants, as well as the influence of different types of stress factors on tomato plants. There were significant differences between aquagrams for water-stressed tomato plants from the two investigated varieties. This indicated different water structures in the studied varieties. Therefore, aquagrams could be used as an additional method for the estimation of the resistance of different tomato varieties to stress factors.
Similar observations were reported in the investigations related to the monitoring of changes during the storage of rocket leaves [44] and monitoring of lettuce freshness during cold storage [39]. Aquagrams could be used to detect changes in the water structure of leafy vegetables during storage. Differences in aquagrams of control and water-stressed plants from two maize lines, as well as between different days of water stress, were reported [43].

3.2. Vegetative Indices Analysis

The measured values of leaf reflectance were used for the calculation of spectral vegetation indices, as defined in Table 1. The mean values and standard deviations of vegetative indices are presented in Table 2 for the Manusa variety and in Table 3 for the Red Bounty variety.
Results for Manusa variety plants showed that vegetative indices mNDVI, Cl red edge, REI1, and REI3 (in blue) could be used to distinguish the control group from the stressed tomato plants (Manusa variety), as well as the group with reduced nitrogen fertilization from the group with reduced watering (Table 2). Indices SR, CARI, Cl green, PRI, and REI2 (in green) successfully differentiate tomato plants with reduced fertilization from the control and group with reduced watering. Indices PMI and WBI (in grey) can distinguish the control group, tomato plants treated with reduced watering, and also plants with reduced nitrogen fertilization from those treated with reduced watering. However, indices MCARI and PI (in orange) are only useful for distinguishing between tomato plants with reduced nitrogen fertilization and those with reduced watering.
For some of the indices, there is no statistically significant difference in the values for the plants from the control group and the stressed plants.
The vegetative indices CLSI and TVI (in light blue) could be used to distinguish the control group from the stressed groups of tomato plants for the Red Bounty variety and the group with reduced fertilization from the group with reduced watering (Table 3). Indices HI and PSRI (in green) successfully differentiate tomato plants with reduced nitrogen fertilization from the control and group with reduced watering. The largest number of vegetative indices, CARI, MCARI, PI, PMI, REI2, REI3, WBI, and G (in orange), are useful for distinguishing the control group from stressed tomato plants. The Cl green index (in blue) can only distinguish the control group from tomato plants grown with reduced fertilization.
Since there was a difference in the spectral information between the two tomato plant varieties, there was also a difference in the vegetative indices, with statistically significant differences between the studied plant groups. A summary of this information is presented in Table 4. Reliable differences between the plant groups were obtained only for one of the tomato varieties for some of the vegetative indices. Such were, for example, Cl red edge, MCARI, mNDVI, PRI, and SR indices for the Manusa variety, while for the Red Bounty variety, these are CLSI, G, HI, PSRI, and TVI indices. For CARI, Cl green, PI, PMI, REI 1, REI2, REI3, and WBI indices, statistically significant differences among the investigated plant groups were found for both studied tomato varieties.
The spectral information associated with these vegetative indices was found in several ranges. The indices distinguishing control plants from those with reduced nitrogen fertilization included wavelengths in the green range of the visible spectrum, such as 500, 520, 534, and 550 nm. This is probably related to some change in the plants’ color as a result of the action of the stress factor. Other wavelengths are in the red range, 670–680 nm, where there is chlorophyll absorption. Most of them are related to the so-called red edge of plant reflection, 698–750 nm, where the reflection increases sharply, as is shown in Figure 1. Sun et al. [18] reported characteristic wavelengths of 451.6, 544.1, 585.7, 696.3, and 739.0 nm for the nondestructive determination of nitrogen content in greenhouse tomato plants based on multispectral imaging. Ihuoma and Madramootoo [20] also found that the Renormalized Difference Vegetation Index RDVI, Photochemical Reflectance Index PRI, and Transformed Chlorophyll Absorption in Reflectance Index indices, which are based on 550, 670, and 700 nm, respectively, are the best correlated with nitrogen stress indicators in the field-grown tomato plants.
The vegetative indices, in which statistically significant differences were found between control plants and those grown with reduced irrigation, are based on similar spectral information. They used wavelengths in the green range, which are associated with a change in the plants’ color, and from the red edge range, connected with chlorophyll absorption. The differences obtained for the WBI, based on water absorption, were also statistically significant for both tomato varieties. Similar results for monitoring water stress in tomato plants grown in a greenhouse or the field are also reported by Ihuoma and Madramootoo [6] and Ihuoma and Madramootoo [20].
Most of the vegetative indices that allow statistically reliable distinction between control and stressed plants are related to physiological changes in plants. Significant differences were also obtained for some of the indices related to the assessment of plant diseases, such as HI, PMI, and CLSI. Therefore, some of the changes in plants as a result of stress factors are similar to those as a result of diseases.

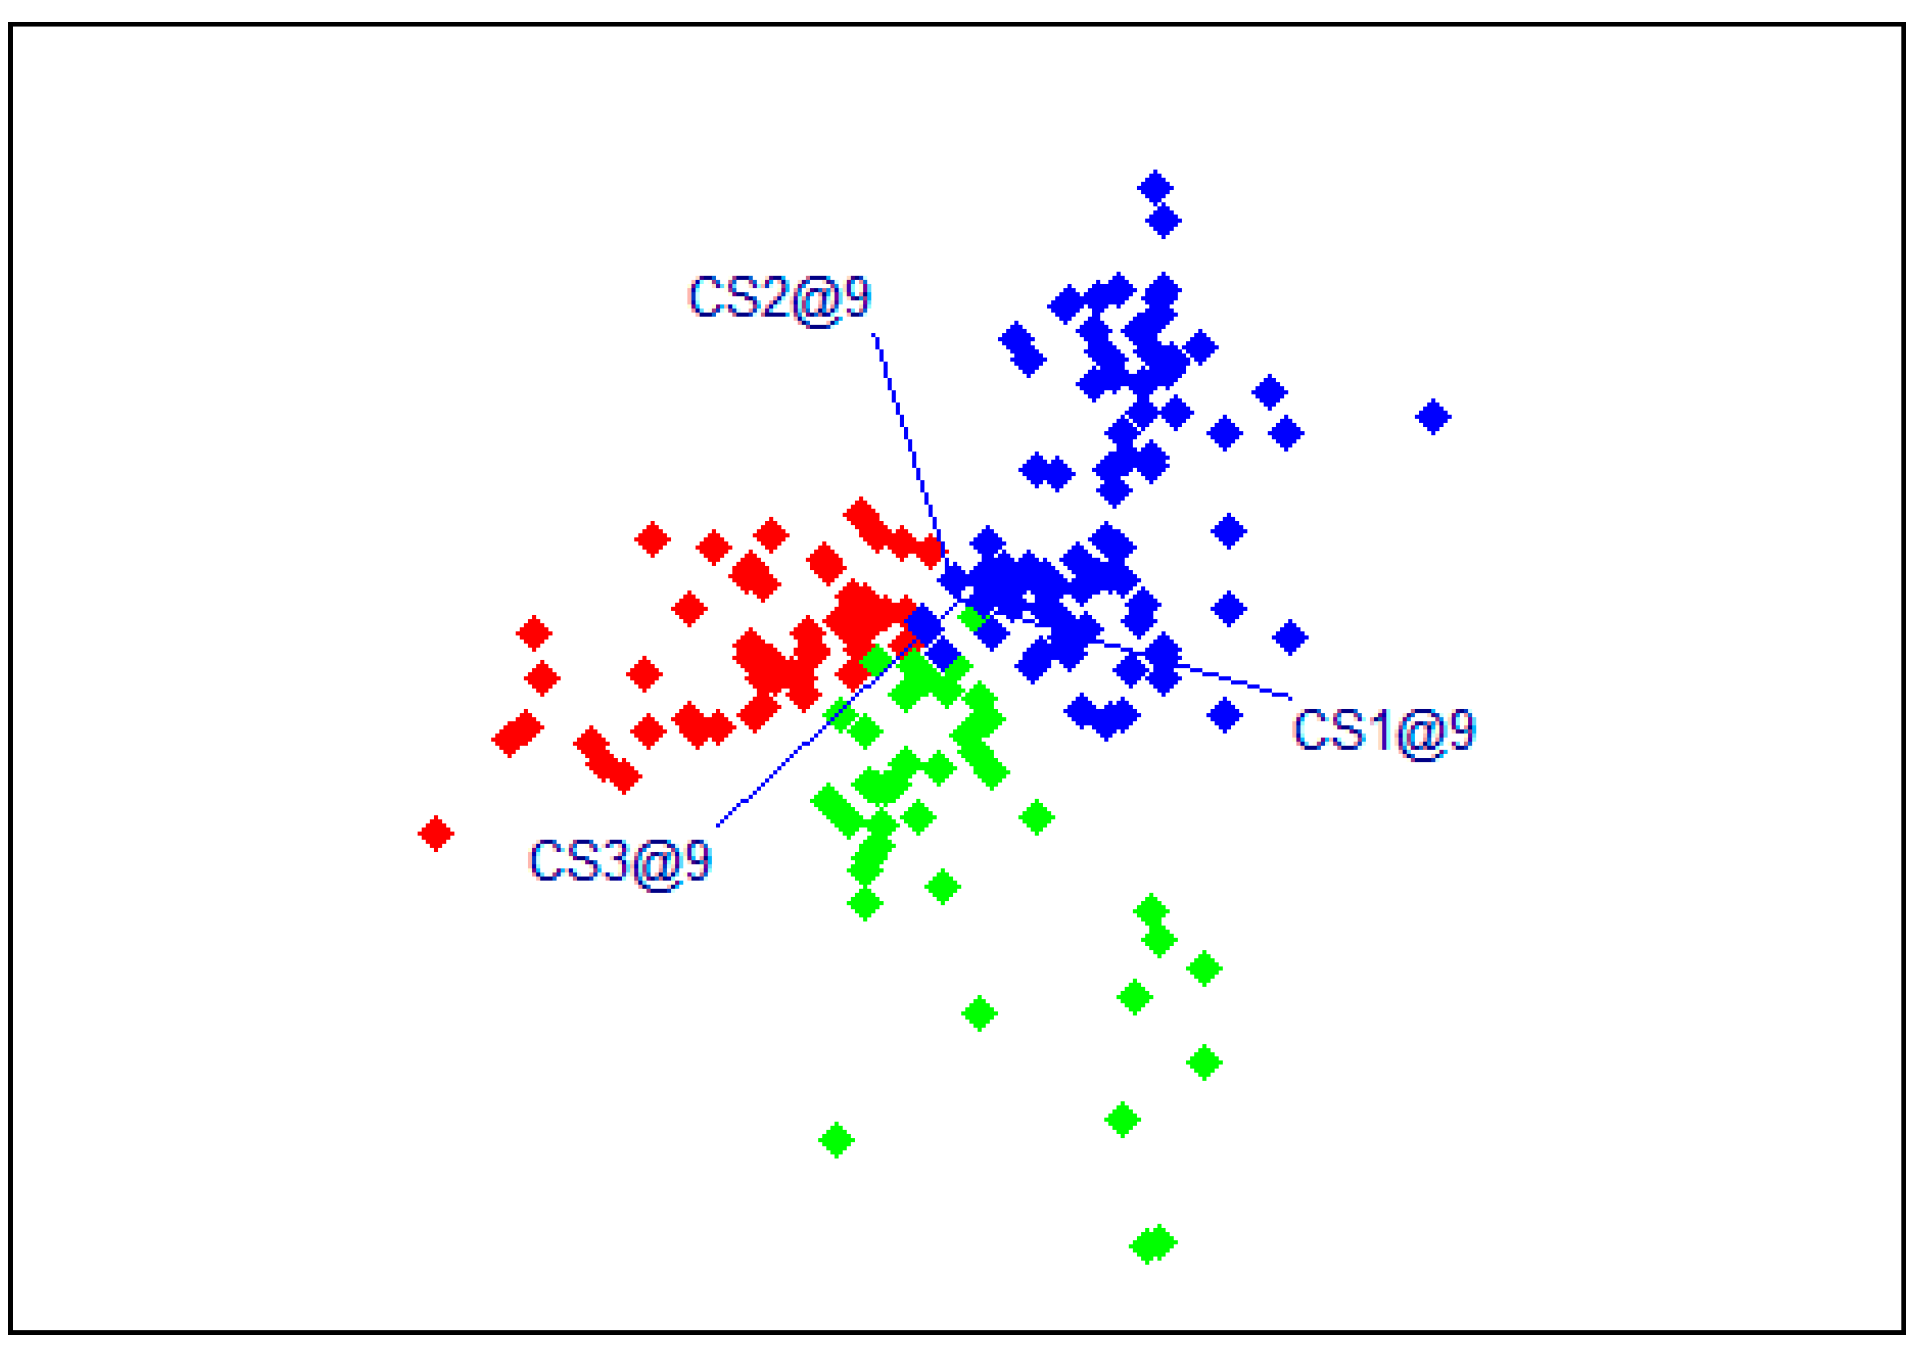
3.3. Models for Classification of Plants According to Stress Factors

The SIMCA (Soft Independent Modeling of Class Analogy) method was used to develop plant classification models based on their spectra. The measured spectra were divided into three groups: a group of spectra of control plants, a group of spectra of plants with reduced nitrogen fertilization, and a group of spectra of plants with reduced watering. Then, a model for each class by principal component analysis was made. The results of the SIMCA classification are presented in Table 5 for plants of the Red Bounty variety and Table 6 for plants of the Manusa variety. The total error and the F1 parameter were used to assess the accuracy of the models.
The results of the SIMCA models for the Red Bounty variety showed very good plant classification accuracy. The sensitivity and precision of the models were higher than 94%. The total error is 96.73%, and the F1 parameter varies from 95.95% to 98.85%. A high F1 score indicates that the model has a good balance between precision and sensitivity, meaning it can effectively identify positive cases while minimizing false positives and false negatives. An F1 score bigger than 0.9 is considered excellent, and a score between 0.8 and 0.9 is considered good. The model for plants with reduced nitrogen fertilization had the highest sensitivity, precision, and F1 score compared to the model for plants with reduced watering. A graphical illustration of the results is presented in Figure 4. A clear distinction among the three groups of plants of the Red Bounty variety was observed.
The results of the SIMCA models for the Manusa variety show a slightly lower accuracy of plant classification (Table 6). The sensitivity and precision of the models were higher than 84%. The total error is 86.89%, and the F1 parameter varies from 85.23% to 87.91%. The model for plants with reduced watering had the highest sensitivity, precision, and F1 score compared to the model for plants with reduced fertilization. The lower accuracy of the determination can be explained by the smaller spectral differences obtained for the Manusa plants. A graphical illustration of the results is presented in Figure 5.
The results of the classification of control and stressed tomato plants agree with the results presented by Xia et al. [45]. In that work, experiments with two tomato varieties and three water treatments were conducted. Multilayer perceptron classifier and one-vs.-rest classifier was applied to the spectral data in the 400–1000 nm range. The accuracy of classification varied from 76.43 to 85.91% when the full spectral range was used, and from 71.83 to 83.47% when using six selected wavebands. Yuan et al. [46] investigated possibilities for diagnosing mild nutrient stress in facility-grown tomatoes based on spectral characteristics of leaves in the 900–1700 nm region. The authors reported similar discriminating accuracy for nutrient stress. Deep learning models (Convolutional Neural Networks (CNN) and CNN + Long Short-Term Memory) successfully discriminate for K-deficient, Ca-deficient, N-excess, K-excess, and Ca-excess with the accuracy of 93.33%, 63.33%, 99.2%, 83.33%, and 98.52%, respectively.

4. Conclusions

This study was conducted to investigate the changes during nitrogen and water stress of two varieties of tomato plants using visible-near-infrared characteristics of their reflectance spectra and an aquaphotomic approach. Differences between the spectra of leaves from control and stressed plants for the two tomato varieties were obtained. The differences among the spectra of the control and stressed plants of the Red Bounty variety are much greater than those of the Manusa variety. Aquagrams visualize the differences in water structures of the control and stressed plants and between plants of the two investigated varieties.
Vegetation indices that successfully differentiated control and stressed tomato plants were established. For CARI, Cl green, PI, PMI, REI 1, REI2, REI3, and WBI indices, statistically significant differences among the investigated plant groups were found for both studied tomato varieties.
The performance of developed SIMCA models for discriminating plants according to growing conditions was very high. The total accuracy was between 86.89% and 97.09%. The results show successful differentiation of the control and stressed tomato plants based on spectral characteristics of the plants’ leaves in the visible and near-infrared region. The results also demonstrated the potential of the aquaphotomics approach for better understanding the processes occurring during nitrogen and water stress in tomato plants. This could be used in the future as an additional approach in breeding programs for the selection of stress-tolerant tomato varieties.

Author Contributions

Conceptualization, S.A. and R.M.; methodology, S.A., A.P. and R.M.; software, S.A., A.P. and P.V.; validation, S.A., D.Y. and P.V.; formal analysis, S.A.; investigation, A.P., D.Y. and S.A.; resources, R.M.; data curation, S.A.; writing—original draft preparation, S.A., D.Y. and P.V.; writing—review and editing, S.A. and A.P.; visualization, S.A. and A.P.; supervision, S.A.; project administration, S.A.; funding acquisition, S.A. All authors have read and agreed to the published version of the manuscript.

Funding

This research was funded by the National Science Fund of Bulgaria (Contract No. KP-06-N 51/3). The topic of the scientific research national project is: “Aquaphotomics approach for investigation of stress-induced changes of water molecular structure in green species”.

Data Availability Statement

All data are available from the corresponding author upon request.

Conflicts of Interest

The authors declare no conflicts of interest.

References

  1. Gupta, A.; Rico-Medina, A.; Caño-Delgado, A.I. The physiology of plant responses to drought. Science 2020, 368, 266–269. [Google Scholar] [CrossRef] [PubMed]
  2. Farhan, M.; Sathish, M.; Kiran, R.; Mushtaq, A.; Baazeem, A.; Hasnain, A.; Hakim, F.; Naqvi, S.A.H.; Mubeen, M.; Iftikhar, I.; et al. Plant nitrogen metabolism: Balancing resilience to nutritional stress and abiotic challenges. Phyton Int. J. Exp. Bot. 2024, 93, 581–609. [Google Scholar] [CrossRef]
  3. Katsoulas, N.; Elvanidi, A.; Ferentinos, K.P.; Bartzanas, T.; Kittas, C. Crop reflectance monitoring as a tool for water stress detection in greenhouses: A review. Biosyst. Eng. 2016, 151, 374–398. [Google Scholar] [CrossRef]
  4. Zahir, S.; Omar, A.F.; Jamlos, M.F.; Azmi, M.A.M.; Muncan, J. A review of visible and near-infrared (Vis-NIR) spectroscopy application in plant stress detection. Sens. Actuators A Phys. 2022, 338, 113468. [Google Scholar] [CrossRef]
  5. Zahir, S.A.D.M.; Jamlos, M.F.; Omar, A.F.; Jamlos, M.A.; Mamat, R.; Muncan, J.; Tsenkova, R. Review—Plant nutritional status analysis employing the visible and near-infrared spectroscopy spectral sensor. Spectrochim. Acta Part A Mol. Biomol. Spectrosc. 2024, 304, 123273. [Google Scholar] [CrossRef]
  6. Ihuoma, S.O.; Madramootoo, C.A. Sensitivity of spectral vegetation indices for monitoring water stress in tomato plants. Comput. Electron. Agric. 2019, 163, 104860. [Google Scholar] [CrossRef]
  7. Teixeira dos Santos, C.A.; Lopo, M.; Pascoa, R.; Lopes, J.A. A review on the applications of portable near-infrared spectrometers in the agro-food industry. Appl. Spectrosc. 2013, 67, 1215–1233. [Google Scholar] [CrossRef]
  8. Pandiselvam, R.; Prithviraj, V.; Manikantan, M.R.; Kothakota, A.; Rusu, A.V.; Trif, M.; Mousavi Khaneghah, A. Recent advancements in NIR spectroscopy for assessing the quality and safety of horticultural products: A comprehensive review. Front. Nutr. 2022, 9, 973457. [Google Scholar] [CrossRef] [PubMed]
  9. Tsenkova, R. Aquaphotomics: Dynamic Spectroscopy of Aqueous and Biological Systems Describes Peculiarities of Water. J. Near Inf. Spec. 2009, 17, 303–314. [Google Scholar] [CrossRef]
  10. Tsenkova, R.; Muncan, J.; Pollner, B.; Kovacs, Z. Essentials of Aquaphotomics and Its Chemometrics Approaches. Front. Chem. 2018, 6, 363. [Google Scholar] [CrossRef]
  11. Muncan, J.; Tsenkova, R. Aquaphotomics-From Innovative Knowledge to Integrative Platform in Science and Technology. Molecules 2019, 24, 2742. [Google Scholar] [CrossRef] [PubMed]
  12. Jinendra, B.; Tamaki, K.; Kuroki, S.; Vassileva, M.; Yoshida, S.; Tsenkova, R. Near infrared spectroscopy and aquaphotomics: Novel approach for rapid in vivo diagnosis of virus infected soybean. Biochem. Biophys. Res. Commun. 2010, 397, 685–690. [Google Scholar] [CrossRef]
  13. Kuroki, S.; Tsenkova, R.; Moyankova, D.; Muncan, J.; Morita, H.; Atanassova, S.; Djilianov, D. Water molecular structure underpins extreme desiccation tolerance of the resurrection plant Haberlea rhodopensis. Sci Rep. 2019, 9, 3049. [Google Scholar] [CrossRef] [PubMed]
  14. Muncan, J.; Jinendra, B.M.S.; Kuroki, S.; Tsenkova, R. Aquaphotomics Research of Cold Stress in Soybean Cultivars with Different Stress Tolerance Ability: Early Detection of Cold Stress Response. Molecules 2022, 27, 744. [Google Scholar] [CrossRef] [PubMed]
  15. Suhandy, D.; Khuriyati, N.; Matsuoka, T. Determination of Leaf Water Potential in Tomato Plants Using NIR Spectroscopy for Water Stress Management. Environ. Control Biol. 2006, 44, 279–284. [Google Scholar] [CrossRef]
  16. Kuo, C.-E.; Tu, Y.-K.; Fang, S.-L.; Huang, Y.-R.; Chen, H.-W.; Yao, M.-H.; Kuo, B.-J. Early detection of drought stress in tomato from spectroscopic data: A novel convolutional neural network with feature selection. Chemom. Intell. Lab. Syst. 2023, 239, 104869. [Google Scholar] [CrossRef]
  17. Weng, S.; Ma, J.; Tao, W.; Tan, Y.; Pan, M.; Zhang, Z.; Huang, L.; Zheng, L.; Zhao, J. Drought stress identification of tomato plant using multi-features of hyperspectral imaging and subsample fusion. Front. Plant Sci. 2023, 14, 1073530. [Google Scholar] [CrossRef]
  18. Sun, G.; Ding, Y.; Wang, X.; Lu, W.; Sun, Y.; Yu, H. Nondestructive Determination of Nitrogen, Phosphorus and Potassium Contents in Greenhouse Tomato Plants Based on Multispectral Three-Dimensional Imaging. Sensors 2019, 19, 5295. [Google Scholar] [CrossRef]
  19. Ulissi, V.; Antonucci, F.; Benincasa, P.; Farneselli, M.; Tosti, G.; Guiducci, M.; Tei, F.; Costa, C.; Pallottino, F.; Pari, L.; et al. Nitrogen Concentration Estimation in Tomato Leaves by VIS-NIR Non-Destructive Spectroscopy. Sensors 2011, 11, 6411–6424. [Google Scholar] [CrossRef]
  20. Ihuoma, S.O.; Madramootoo, C.A. Narrow-band reflectance indices for mapping the combined effects of water and nitrogen stress in field-grown tomato crops. Biosyst. Eng. 2020, 192, 133e143. [Google Scholar] [CrossRef]
  21. Valchev, N.; Toskov, K. Vegetable Growing; Kolor Print BG: Plovdiv, Bulgaria, 2015; pp. 57–62. [Google Scholar]
  22. Haboudane, D.; Miller, J.R.; Pattey, E.; Zarco-Tejada, P.J.; Strachan, I.B. Hyperspectral vegetation indices and novel algorithms for predicting green LAI of crop canopies: Modeling and validation in the context of precision agriculture. Remote Sens. Environ. 2004, 90, 337–352. [Google Scholar] [CrossRef]
  23. Gitelson, A.A.; Viña, A.; Ciganda, V.; Rundquist, D.C.; Arkebauer, T.J. Remote estimation of canopy chlorophyll content in crops. Geophys. Res. Lett. 2005, 32, L08403. [Google Scholar] [CrossRef]
  24. Mahlein, A.-K.; Rumpf, T.; Welke, P.; Dehne, H.-W.; Plümer, L.; Steiner, U.; Oerke, E.-C. Development of spectral indices for detecting and identifying plant diseases. Remote Sens. Environ. 2013, 128, 21–30. [Google Scholar] [CrossRef]
  25. Gitelson, A.A.; Merzlyak, M.N.; Zur, Y.; Stark, R.; Gritz, U. Non-destructive and remote sensing techniques for estimation of vegetation status. Third Eur. Conf. Precis. Agric. 2001, 1, 301–306. [Google Scholar]
  26. Moshou, D.; Bravo, C.; Oberti, R.; West, J.; Bodria, L.; McCartney, A.; Ramon, H. Plant disease detection based on data fusion of hyper-spectral and multi-spectral fluorescence imaging using Kohonen maps. Real Time Imaging 2005, 11, 75–83. [Google Scholar] [CrossRef]
  27. Smith, R.C.G.; Adams, J.; Stephens, D.J.; Hick, P.T. Forecasting wheat yield in a Mediterranean-type environment from the NOAA satellite. Aust. J. Agric. Res. 1995, 46, 113–125. [Google Scholar] [CrossRef]
  28. Daughtry, C.S.T.; Walthall, C.L.; Kim, M.S.; De Colstoun, E.B.; McMurtrey III, J.E. Estimating corn leaf chlorophyll concentration from leaf and canopy reflectance. Remote Sens. Environ. 2000, 74, 229–239. [Google Scholar] [CrossRef]
  29. Tucker, C.J.; Holben, B.N.; Elgin, J.; James, H.; McMurtrey, I.; James, E. Remote sensing of total dry-matter accumulation in winter wheat. Remote Sens. Environ. 1981, 11, 171–189. [Google Scholar] [CrossRef]
  30. Main, R.; Cho, M.A.; Mathieu, R.; O’Kennedy, M.M.; Ramoelo, A.; Koch, S. An investigation into robust spectral indices for leaf chlorophyll estimation. ISPRS J. Photogramm. Remote Sens. 2011, 66, 751–761. [Google Scholar] [CrossRef]
  31. Brantley, S.T.; Zinnert, J.C.; Young, D.R. Application of hyperspectral vegetation indices to detect variations in high leaf area index temperate shrub thicket canopies. Remote Sens. Envron. 2011, 115, 514–523. [Google Scholar] [CrossRef]
  32. Datt, B. Remote sensing of chlorophyll a, chlorophyll b, chlorophyll a + b and total carotenoid content in eucalyptus leaves. Remote Sens. Environ. 1998, 66, 111–121. [Google Scholar] [CrossRef]
  33. Sims, D.A.; Gamon, J.A. Relationships between leaf pigment content and spectral reflectance across a wide range of species, leaf structures and developmental stages. Remote Sens. Environ. 2002, 81, 2–3, 337–354. [Google Scholar] [CrossRef]
  34. Merzlyak, M.N.; Gitelson, A.A.; Chivkunova, O.B.; Rakitin, V.Y. Non-destructive optical detection of pigment changes during leaf senescence and fruit ripening. Physiol. Plant. 1999, 106, 135–141. [Google Scholar] [CrossRef]
  35. Vogelmann, J.E.; Rock, B.N.; Moss, D.M. Red edge spectral measurements from sugar maple leaves. Int. J. Remote Sens. 1993, 14, 1563–1575. [Google Scholar] [CrossRef]
  36. Gitelson, A.A.; Merzlyak, M.N. Remote estimation of chlorophyll content in higher plant leaves. Int. J. Remote Sens. 1997, 18, 2691–2697. [Google Scholar] [CrossRef]
  37. Broge, N.H.; Leblanc, E. Comparing prediction power and stability of broadband and hyperspectral vegetation indices for estimation of green leaf area index and canopy chlorophyll density. Remote Sens. Environ. 2001, 76, 156–172. [Google Scholar] [CrossRef]
  38. Wang, L.; Qu, J.J. NMDI: Anormalizedmulti-band drought index for monitoring soil and vegetation moisture with satellite remote sensing. Geophys. Res. Lett. 2007, 34, L20405. [Google Scholar] [CrossRef]
  39. Vitalis, F.; Muncan, J.; Anantawittayanon, S.; Kovacs, Z.; Tsenkova, R. Aquaphotomics Monitoring of Lettuce Freshness during Cold Storage. Foods 2023, 12, 258. [Google Scholar] [CrossRef]
  40. Sclemmer, M.R.; Francis, D.D.; Shanahan, J.F.; Scepers, J.S. Remotely measuring chlorophyll content in corn leaves with differing nitrogen levels and relative water content. Agron. J. 2005, 97, 106–112. [Google Scholar] [CrossRef]
  41. Vigneau, N.; Ecarnotb, M.; Rabatela, G.; Roumet, P. Potential of field hyperspectral imaging as a non destructive method to assess leaf nitrogen content in wheat. Field Crops Res. 2011, 122, 25–31. [Google Scholar] [CrossRef]
  42. Sirakov, I.; Stoyanova, S.; Velichkova, K.; Slavcheva-Sirakova, D.; Valkova, E.; Yorgov, D.; Veleva, P.; Atanassova, S. Exploring Microelement Fertilization and Visible–Near-Infrared Spectroscopy for Enhanced Productivity in Capsicum annuum and Cyprinus carpio Aquaponic Systems. Plants 2024, 13, 3566. [Google Scholar] [CrossRef] [PubMed]
  43. Moyankova, D.; Stoykova, P.; Veleva, P.; Christov, N.K.; Petrova, A.; Atanassova, S. An Aquaphotomics Approach for Investigation of Water-Stress-Induced Changes in Maize Plants. Sensors 2023, 23, 9678. [Google Scholar] [CrossRef] [PubMed]
  44. Marinoni, L.; Buccheri, M.; Bianchi, G.; Cattaneo, T. Aquaphotomic, E-nose and electrolyte leakage to monitor quality changes during the storage of ready-to-eat rocket. Molecules 2022, 27, 2252. [Google Scholar] [CrossRef] [PubMed]
  45. Xia, J.; Zhang, W.; Zhang, W.X.; Yang, Y.W.; Hu, G.Y.; Ge, D.K.; Liu, H.; Cao, H.X. A cloud computing-based approach using the visible near-infrared spectrum to classify greenhouse tomato plants under water stress. Comput. Electron. Agric. 2021, 181, 105966. [Google Scholar] [CrossRef]
  46. Yuan, Y.; Sun, G.; Chen, G.; Zhang, Q.; Liang, L. A Model for Diagnosing Mild Nutrient Stress in Facility-Grown Tomatoes Throughout the Entire Growth Cycle. Agriculture 2025, 15, 307. [Google Scholar] [CrossRef]
Figure 1. (a) Red Bounty plants; (b) Manusa plants. The average reflectance spectra of the studied control plants (n = 66), plants with reduced nitrogen fertilization (n = 69), or reduced watering (n = 66) in the visible-near-infrared range.
Agriengineering 07 00155 g001
Figure 2. (a) Red Bounty plants; (b) Manusa plants. The average absorbance spectra of the studied control plants (n = 102 for Red Bounty and n = 86 for Manusa), plants with reduced nitrogen fertilization (n = 86 for Red Bounty and n = 89 for Manusa), or reduced watering (n = 87 for Red Bounty and n = 92 for Manusa), in the near-infrared range.
Agriengineering 07 00155 g002
Figure 3. (a) Red Bounty plants; (b) Manusa plants. Aquagram of tomato plants. In polar coordinates, the aquagram values A q λ are shown.
Agriengineering 07 00155 g003
Figure 4. Graph of the results of the SIMCA models for the Red Bounty variety (in red—control plants, blue—plants with reduced watering, and green—plants with reduced fertilization).
Agriengineering 07 00155 g004
Figure 5. Graph of the results of the SIMCA models for the Manusa variety (in red—control plants, blue—plants with reduced watering, and green—plants with reduced fertilization).
Agriengineering 07 00155 g005
Table 1. Definitions of calculated vegetative indices.
IndexDefinitionReference
CARI
Chlorophyll Absorption in Reflectance Index
C A R I = R 700 R 670 0.2 R 700 R 550 [22]
Cl green
Green chlorophyll index
C l g r e e n = R 760 R 550 1 [23]
Cl red edge
Chlorophyll Index at red edge
C l r e d   e d g e = R 760 R 714 1 [23]
CLSI
Cercospora leaf spot index
C L S I = R 698 R 570 R 698 + R 570 R 734 [24]
CRI
Carotenoids Reflectance index
C R I = 1 R 510 1 R 550 [25]
fD
Index of disease
f D = R 500 R 500 + R 570 [26]
G
Greenness index
G = R 554 R 677 [27]
HI
Healthy index
H I = R 534 R 698 R 534 + R 698 0.5 R 704 [24]
MCARI
Modified chlorophyll absorption in reflectance index
M C A R I = R 700 R 670 0.2 R 700 R 550 R 700 R 670 [28]
mNDVI
Modified Normalized Difference Vegetation Index
m N D V I = R 750 R 705 R 750 + R 705 [29]
NDVI (1)
Normalized Difference Vegetation Index
N D V I = R 845 R 665 R 845 + R 665 [29]
NDVI (2)
Normalized Difference Vegetation Index
N D V I = R 800 R 680 R 800 + R 680 [30]
NDVI (3)
Normalized Difference Vegetation Index
N D V I = R 800 R 670 R 800 + R 670 [31]
PI
Pigment index
P I = R 677 R 554 [32]
PMI
Powdery mildew index
P M I = R 520 R 584 R 520 + R 584 R 724 [24]
PRI
Photochemical reflectance index
P R I = R 531 R 570 R 531 + R 570 [33]
PSRI
Plant Senescence Reflectance Index
P S R I = R 680 R 500 R 750 [34]
REI 1
Red Edge Index
R E I 1 = R 740 R 720 [35]
REI 2
Red Edge Index
R E I 2 = R 734 R 747 R 715 R 720 [35]
REI 3
Red Edge Index
R E I 3 = R 734 R 747 R 715 R 726 [35]
SBRI
Sugar beet rust index
S B R I = R 520 R 513 R 570 + R 513 0.5 R 704 [24]
SR
Simple ratio
S R = R 760 R 695 [36]
TVI
Triangular vegetation index
T V I = 0.5 120 R 750 R 550 200 R 670 R 550 [37]
WBI
Water band index
W B I = R 900 R 970 [38]
Table 2. Multivariate ANOVA of vegetative indices for tomato plants (Manusa variety) based on the different variants of treatment.
Vegetation IndicesControl
(n = 66)
With Reduced Fertilization
(n = 69)
x ¯   ±   S D
With Reduced Watering
(n = 66)
Sig.
CARI0.065 ± 0.009 a0.070 ± 0.010 ab0.062 ± 0.013 b0.001
Cl green4.363 ± 0.497 a4.027 ± 0.623 ab4.489 ± 0.522 b0.001
Cl red edge1.252 ± 0.108 a1.1787 ± 0.129 ab1.350 ± 0.217 ab0.001
CLSI−0.471 ± 0.040−0.478 ± 0.059−0.489 ± 0.0510.138
CRI11.705 ± 8.8911.679 ± 9.7712.386 ± 8.340.877
fD0.332 ± 0.1480.333 ± 0.1700.305 ± 0.1400.477
G2.399 ± 0.2852.460 ± 0.2512.335 ± 0.2860.033
HI−0.023 ± 0.041−0.019 ± 0.057−0.018 ± 0.0620.841
MCARI0.166 ± 0.0470.180 ± 0.052 b0.153 ± 0.0636 b0.014
mNDVI0.567 ± 0.021 a0.550 ± 0.029 ab0.578 ± 0.040 ab0.001
NDVI (1)0.860 ± 0.0230.856 ± 0.0230.860 ± 0.0200.336
NDVI (2)0.851 ± 0.0220.845 ± 0.0220.851 ± 0.0190.176
NDVI (3)0.859 ± 0.0220.854 ± 0.0220.858 ± 0.0200.364
PI0.423 ± 0.0500.410 ± 0.039 b0.435 ± 0.052 b0.014
PMI0.373 ± 0.060 a−0.373 ± 0.069 b−0.401 ± 0.058 ab0.013
PRI0.047 ± 0.025 a0.051 ± 0.031 ab0.036 ± 0.020 b0.002
PSRI−0.009 ± 0.049−0.017 ± 0.0630.005 ± 0.0470.051
REI11.558 ± 0.043 a1.531 ± 0.049 ab1.588 ± 0.076 ab0.001
REI21.115 ± 0.073 a1.079 ± 0.076 ab1.144 ± 0.104 b0.001
REI30.525 ± 0.028 a0.510 ± 0.030 ab0.537 ± 0.042 ab0.001
SBRI0.022 ± 0.0580.019 ± 0.0650.029 ± 0.0550.634
SR8.114 ± 0.687 a7.694 ± 0.837 ab8.352 ± 0.937 b0.001
TVI34.046 ± 1.37834.156 ± 2.04134.377 ± 1.4320.503
WBI1.224 ± 0.065 a1.223 ± 0.088 b1.180 ± 0.131 ab0.012
The same superscripts within the same row represent significant differences at p < 0.05 as follows: a—between the control plants and all other groups; b—between the group with reduced nitrogen fertilization and with reduced watering; Test: LSD or Dunnett T3, depending on Levene’s Test of Equality of Error Variances; SD—Standard deviation. In blue—vegetative indices that differentiate the control from the stressed plants; in green—vegetative indices that differentiate plants with reduced fertilization from the control and group with reduced watering; in grey—vegetative indices that differentiate the control group and plants with reduced watering, and also plants with reduced nitrogen fertilization from those with reduced watering; in orange—vegetative indices useful for distinguishing between plants with reduced nitrogen fertilization and those with reduced watering.
Table 3. Multivariate ANOVA of vegetative indices for tomato plants (Red Bounty variety) based on the different variants of treatment.
Vegetation IndicesControl
(n = 66)
With Reduced Fertilization
(n = 69)
x ¯   ±   S D
With Reduced Watering
(n = 66)
Sig.
CARI0.050 ± 0.009 a0.064 ± 0.011 a0.061 ± 0.010 a0.001
Clgreen4.704 ± 0.665 a4.328 ± 0.871 a4.482 ± 0.6170.010
Clred edge1.410 ± 0.1681.384 ± 0.1821.376 ± 0.1750.507
CLSI−0.445 ± 0.033 a−0.562 ± 0.131 ab−0.523 ± 0.106 ab0.001
CRI11.705 ± 8.8911.679 ± 9.7712.386 ± 8.340.877
fD0.380 ± 0.1180.385 ± 0.1840.365 ± 0.1560.754
G2.030 ± 0.233 a2.276 ± 0.278 a2.239 ± 0.296 a0.001
HI−0.011 ± 0.035 a0.011 ± 0.056 ab−0.008 ± 0.048 b0.015
MCARI0.107 ± 0.033 a0.141 ± 0.040 a0.140 ± 0.045 a0.001
mNDVI0.593 ± 0.0300.586 ± 0.0310.585 ± 0.020.245
NDVI (1)0.847 ± 0.0240.852 ± 0.0280.855 ± 0.0250.162
NDVI (2)0.837 ± 0.0230.841 ± 0.0280.844 ± 0.0240.276
NDVI (3)0.845 ± 0.0240.849 ± 0.0290.852 ± 0.0250.290
PI0.499 ± 0.054 a0.446 ± 0.054 a0.454 ± 0.057 a0.001
PMI−0.335 ± 0.056 a−0.387 ± 0.038 a−0.388 ± 0.037 a0.001
PRI0.046 ± 0.0160.055 ± 0.0300.048 ± 0.0220.064
PSRI−0.010 ± 0.041 a−0.044 ± 0.083 ab−0.020 ± 0.060 b0.006
REI11.621 ± 0.0661.601 ± 0.0681.599 ± 0.0650.103
REI21.212 ± 0.114 a1.161 ± 0.104 a1.164 ± 0.111 a0.010
REI30.561 ± 0.043 a0.542 ± 0.040 a0.543 ± 0.042 a0.009
SBRI0.009 ± 0.051−0.009 ± 0.0890.005 ± 0.0710.326
SR8.287 ± 0.9378.319 ± 0.9708.328 ± 0.7630.962
TVI31.556 ± 1.326 a38.187 ± 5.839 ab36.520 ± 4.834 ab0.001
WBI1.218 ± 0.040 a1.085 ± 0.188 a1.116 ± 0.156 a0.001
The same superscripts within the same row represent significant differences at p < 0.05 as follows: a—between the control plants and all other groups; b—between the group with reduced nitrogen fertilization and with reduced watering; Test: LSD or Dunnett T3, depending on Levene’s Test of Equality of Error Variances; SD—Standard deviation. In orange—indices that distinguish the control from stressed plants; in light blue—vegetative indices that distinguish the control from the stressed groups and the group with reduced fertilization from the group with reduced watering; in green—indices that differentiate plants with reduced fertilization from the control and the group with reduced watering; in blue - index that distinguish the control from plants with reduced fertilization.
Table 4. A summary of statistically significant differences in the vegetative indices for the studied tomato plants, the Manusa variety, and the Red Bounty variety.
Manusa Variety—Statistically
Significant Differences
Red Bounty Variety—Statistically
Significant Differences
Vegetative IndicesUsed WavelengthsControl-Reduced N FertilizationControl-Reduced WateringReduced N Fertilization—Reduced WateringControl-Reduced N FertilizationControl-Reduced WateringReduced N Fertilization—Reduced Watering
CARI550, 670, 700v voo
Clgreen550, 760v vo
Clred edge714, 760vvv
CLSI570, 698, 734 ooo
G554, 677 oo
HI534, 698, 704 o o
MCARI550, 670, 700 voo
mNDVI705, 750vvv
PI554, 677 voo
PMI520, 584, 724 vvoo
PRI531, 570v v
PSRI500, 680, 750 o o
REI 1720, 740vvv
REI 2715, 720, 734, 747v voo
REI 3715, 726, 734, 747vvvoo
SR695, 760v v
TVI550, 670, 750 ooo
WBI900, 970 vvoo
v—indicates statistically significant differences for the groups of plants of the Manusa variety; o—indicates statistically significant differences for the groups of plants of the Red Bounty variety. Statistically significant differences between control plants and plants from the group with reduced N fertilization are marked with light green; Statistically significant differences between control plants and plants from group with reduced watering are marked with light blue; Statistically significant differences between the group with reduced N fertilization and group with reduced watering are marked light orange.
Table 5. Results of the SIMCA classification of tomato leaves of the Red Bounty variety.
Determined as Control PlantsDetermined as Plants with Reduced Nitrogen FertilizationDetermined as Plants with Reduced WateringNo MatchSensitivity, %F1 Score, %
Control plants9624094.1296.48
Plants grown with reduced nitrogen fertilization08600100.0098.85
Plants grown with reduced watering1084296.5595.95
Precision, %98.9797.7295.45
Table 6. Results of the SIMCA classification of tomato leaves of the Manusa variety.
Determined as Control PlantsDetermined as Plants with Reduced Nitrogen FertilizationDetermined as Plants with Reduced WateringNo MatchSensitivity, %F1 Score, %
Control plants7754089.5387.50
Plants grown with reduced nitrogen fertilization8756084.2785.23
Plants grown with reduced watering5780086.9587.91
Precision, %85.5588.2388.88
Disclaimer/Publisher’s Note: The statements, opinions and data contained in all publications are solely those of the individual author(s) and contributor(s) and not of MDPI and/or the editor(s). MDPI and/or the editor(s) disclaim responsibility for any injury to people or property resulting from any ideas, methods, instructions or products referred to in the content.

