Abstract
Effective water and soil management is crucial for crop productivity, particularly in rice cultivation, where poor soil quality and water scarcity pose challenges. The response of deeper-rooted rice grown in soils amended with different soil amendments (SAs) to Internet of Things (IoT)-managed alternate wetting and drying (AWD) irrigations remains undetermined. This study explores the effects of various SAs on DRO-1 IR64 rice plants under IoT-based soil moisture monitoring of AWD irrigation. A greenhouse experiment executed at the Tokyo University of Agriculture assessed two water management regimes—continuous flooding (CF) and AWD—alongside six types of SAs: vermicompost and peat moss (S + VC + PM), spirulina powder (S + SPP), gypsum (S + GS), rice husk biochar (S + RHB), zeolite (S + ZL), and soil without amendment (S + WA). Soil water content was continuously monitored at 10 cm depth using TEROS 10 probes, with data logged via a ZL6 device and managed through the ZENTRA Cloud application (METER GROUP Company). Under AWD conditions, VC + PM showed the greatest decline in volumetric water content due to enhanced root development and water uptake. In contrast, SPP and ZL maintained consistent water levels. Organic amendments like VC + PM improved soil properties and grain yield, while AWD with ZL and GS optimized water use. Strong associations exist between root traits, biomass, and grain yield. These findings highlight the benefits of integrating SAs for improved productivity in drought-prone rice systems.
1. Introduction
The world’s population is predicted to increase by two billion people over the next 30 years, or around 0.84% per year. To ensure food security and efficiently meet the demands of this growing population, worldwide agricultural production must rise by 50% by 2050 [1]. Over half of the world’s population relies on rice as a supplementary staple [2]. This essential crop is prevalent in over 30 developing countries, primarily in Asia, which accounts for 92% of world production [3]. Rice is the most water-intensive crop globally [4], with approximately 50% of its production encountering challenges due to water scarcity [5]. Projections indicate that by 2025, around 15 to 20 million hectares of irrigated rice cultivation could experience varying degrees of water stress [4]. Water is a critical resource for agricultural production, particularly for paddy rice, which exhibits significantly higher water requirements compared to other staple crops such as wheat and maize [6]. The water footprint of rice, quantified as green water (1146 m3/ton), blue water (341 m3/ton), and gray water (187 m3/ton), underscores its substantial water demand. In contrast, wheat demonstrates a water footprint of green water (1277 m3/ton), blue water (342 m3/ton), and gray water (207 m3/ton), while maize exhibits a lower water footprint, with green water (947 m3/ton), blue water (81 m3/ton), and gray water (194 m3/ton) [7]. With climate change and rising water demands from economic development and urbanization [8], it has become essential for the agricultural sector to prioritize increasing food production and water productivity amidst limited resources [6].
Afghanistan is among the most vulnerable countries to climate change, having experienced significant drought in recent decades. The worst food crisis occurred in 2000, marking the lowest rainfall since 1950 [9]. This water shortage is primarily due to climate change, limiting the effective use of suitable land for irrigation. Afghanistan’s soil is mainly formed under arid and semi-arid conditions, primarily clay and sandy loam. They have high calcium carbonate content, elevated pH levels, and low organic matter, ranging from 0.2% to 2.5% [10]. The soil has low water-holding capacity but high permeability and infiltration rates [11]. Paddy soils struggle to retain sufficient water, forming large cracks during dry spells, a significant concern for rice producers.
The ecosystem services that agricultural soils give are becoming increasingly important in response to the changing climate, resulting in droughts, floods, severe rainstorms, and extremely high temperatures [12]. To address this issue, researchers have proposed the use of organic amendments and soil conditioners, including vermicompost, peat moss, spirulina powder, gypsum, rice husk biochar, and zeolite, which play a crucial role in improving soil properties and mitigating the adverse effects of water deficits [13,14,15,16,17,18]. Vermicompost, produced by earthworms and microbes, is a nutrient-rich organic fertilizer that enhances soil aeration, porosity, and water retention. It helps manage organic waste, promotes plant growth, and increases the availability of essential minerals, including potassium, phosphorus, and nitrogen [13]. In a similar direction, peat moss successfully holds water due to its many micropores, holding roughly ten times its dry weight compared to conventional materials [14]. Spirulina, a blue-green unicellular microalga classified as cyanobacteria, acts as a nutrient-rich organic amendment that enhances plant growth and improves water retention in sandy soils of arid and semi-arid regions [15]. Gypsum is an effective soil amendment that conserves moisture, reduces soil crusting, and balances electrolytes. It also lowers soil pH and improves nutrient availability, enhancing soil properties that can increase crop yields by up to 41% [16,19]. Biochar, a carbon-rich material created by heating organic residues in limited oxygen, is recognized for enhancing long-term soil fertility [20]. It contributes vital nutrients, enhances soil structure, moisture retention, and biological activity, and supports sustainable nutrient cycling and carbon sequestration [21]. Clinoptilolite zeolite, a microporous mineral, is utilized for efficient water and fertilizer management in agriculture. It absorbs significant amounts of water, helping to alleviate plant water stress during dry spells [18]. Furthermore, it enhances nutrient efficiency by gradually releasing potassium (K), making it a valuable fertilizer for increasing soil K levels in rice production [22]. Globally, vermicompost, peat moss, and rice husk biochar are widely available and low to moderate in cost, with potential for local production in Afghanistan. Gypsum and zeolite are globally available but costly, and in Afghanistan, especially they are also highly available and low cost. Spirulina powder is globally expensive and limited in Afghanistan, but small-scale cultivation could be explored.
To address irrigation water scarcity, various water-saving techniques for rice production have been developed, including saturated soil culture [23], aerobic rice [24], the System of Rice Intensification [25], non-flooded mulching cultivation [26], and safe AWD irrigation [27]. Safe AWD involves irrigating the field several days after ponded water disappears, allowing the soil to dry when the water potential reaches −10 kPa to −30 kPa before re-irrigation [28]. A safe AWD method allows the water level in rice fields to drop up to 15 cm below the soil surface before irrigation is needed again [29]. A perforated pipe is used to monitor this water level. AWD can reduce irrigation water usage by 15% to 30% compared to conventional flooded systems [30]. However, its efficiency varies with soil type and hydrological conditions, which can lead to economic yield losses [29]. Plants experience moisture stress during dry cycles, which causes them to absorb less nutrients and decrease water productivity [17,30]. Possible yield losses can overshadow the water-saving advantages of AWD.
In order to improve moisture retention, organic and inorganic soil amendments can be added. Additionally, deeper-rooting cultivars like DRO1-IR64 can help reach deeper water reserves during dry periods, improving drought tolerance [31]. Currently, rice farmers in Afghanistan use manually flooded irrigation, resulting in significant water loss [9]. Effective irrigation management strategies, including innovative technologies like the IoT, are essential to promote sustainable water use. Numerous studies have examined the use of IoT technology in agriculture to develop innovative solutions [32,33,34]. Advances in this field suggest that IoT can help farmers tackle water scarcity, manage costs, and boost productivity [35]. Since unplanned water use often leads to waste, systems need to minimize water loss without burdening farmers. IoT solutions in agriculture rely on sensors connected to the Internet to gather environmental data. Recently developed Internet-based irrigation systems monitor crop water needs, allowing for better water management and increased efficiency [32].
Numerous agronomic studies have investigated the effects of soil amendments in conjunction with AWD strategies in low-fertility soils characterized by poor physical conditions. While the water-saving benefits of AWD are well established, significant gaps still exist in our understanding. In particular, the response of deeper-rooted rice cultivars to AWD management through Internet of Things (IoT) technology and a comprehensive analysis of the DRO-1 IR64 cultivar’s yield performance and the impact of various soil amendments have yet to be explored. This study has the potential to revolutionize rice farming by exploring how the DRO-1 IR64 cultivar responds to IoT-managed AWD systems, combined with the application of soil amendments. By integrating advanced IoT technologies for precise water management and leveraging soil amendments to enhance resilience and nutrient availability, this research could significantly improve water-use efficiency, reduce resource inputs, and boost crop yields. IoT technology integration with AWD helps drought-prone areas adapt to climate change by improving precision irrigation and increasing water efficiency. The results of this research could help direct breeding initiatives, sustainable soil management, and the creation of policies. They could also encourage fair technology transfer and support environmental sustainability and global food security. This study aims to examine how soil amendments affect rice plants that experience periodic water stress and evaluate if they can lessen adverse effects on yield, growth, physiological characteristics, and water-use efficiency. It also looks at how different soil amendments affect the physical characteristics and fertility of the soil. We hypothesize that rice production can be enhanced under limited water conditions by combining AWD and IoT-based irrigation systems with soil amendments and drought-tolerant cultivars (featuring deeper rooting), improving water use efficiency and increasing yields.
2. Materials and Methods
2.1. Description of Study Area
Baghlan is one of the leading provinces in the north, considered the grain basket of Afghanistan, holding strategic importance for food security at the national level [36]. The Pozeshan Agricultural Research Farm, located in Baghlan province in northeastern Afghanistan at 36°0′0″ N, 70°0′0″ E, spans 30 hectares and sits at an elevation of 532.25 m above sea level (Figure 1). It lies within a cold semi-arid climate, with an average annual temperature of 15.8 °C and moderate humidity levels averaging 62% [37]. The farm experiences distinct seasonal variations, with July being the hottest month, recording an average temperature of 28.3 °C, while winters bring more extraordinary conditions—annual precipitation averages 284 mm, mainly during the cooler months, which sustains its semi-arid environment. The soil type is clay loam, with a pH range of 8.2 to 8.5, and belongs to the soil taxonomy of Calcaric Cambisol, Calcaric Fluvic Cambisol, and Calcaric Leptic Cambisol. The soil contains a carbonate level of 15% to 16%, enhancing its fertility and suitability for various crops [38].
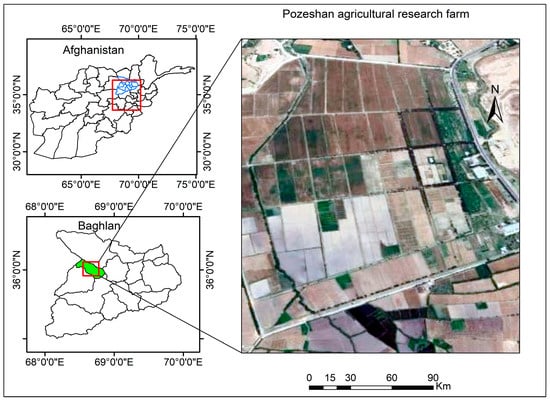
Figure 1.
The map of the study area (Pozeshan agricultural research farm, Pul-e-Khumri city, Baghlan province, Afghanistan) was prepared using ArcGIS 10.8 software. The blue color represents Baghlan province, while the green color highlights Pul-e-Khumri, the specific location of the study area within the province.
2.2. Dataset and Analysis of Hydrological Variables
The hydrological and meteorological variables were sourced from the Central Asian Famine Early Warning Systems Network (FEWS NET) Land Data Assimilation System version 2 (FLDAS2) (Table 1). This method offers high-resolution simulations of land surface parameters for food security assessments in areas with limited data [39]. The dataset comprises the time frame from 1 October 2000 to the present, with a daily temporal resolution and a spatial resolution of 0.01°. Precipitation (PR), evapotranspiration (ET), root zone soil moisture (SM), and air temperature (AT) data were analyzed together to provide yearly values between 2001 and 2023. The linear least squares method investigated PR, ET, SM, and AT temporal and spatial trends. Student’s t-test was used to assess statistical significance at the 95% confidence level (p < 0.05).

Table 1.
Summary of the dataset used in this study.
2.3. Experimental Design and Treatments Details
A glasshouse experiment was conducted at the Tokyo University of Agriculture, Tokyo, Japan, from May to October 2024. The experiment was laid out in a factorial, completely randomized design (CRD) with five replications, resulting in 60 pots. The first factor was two water management (WM) regimes —(i) alternate wetting and drying (AWD), (ii) continuous flooding (CF)—and the second factor was soil amendments (SA)—(i) soil without amendment (S + WA), (ii) soil with vermicompost and peat moss (S + VC + PM), (iii) soil with spirulina powder (S + SP), (iv) soil with gypsum (S + GS), (V) soil with rice husk biochar (S + RHB), (VI) soil with zeolite (S + ZL). The rice variety used in this study was DRO-1 IR64 (deeper rooting), developed by Uga et al. [31] from the International Rice Research Institute (IRRI). The soil used in the experiment was red Akadama soil, which was poor in fertility and organic matter. Each experimental pot (25 cm in diameter and 25 cm in height) was filled with 8.5 kg of amended soil, incorporating the respective treatment-specific amendments. To guarantee even distribution, the amendments were combined with the soil seven days before transplanting. The amount of amendment applied in each pot was calculated based on the 8.5 kg air-dried soil. The treatment details adopted are presented in Table 2. Additionally, for the AWD irrigation regime (30 pots), a perforated PVC pipe measuring 4 cm in diameter and 25 cm in length was put into the soil up to 20 cm deep, with the remaining 5 cm above the surface. The other pots remained unchanged. There was no perforation at the end of the experimental pot to avoid the percolation loss of water. Rice seeds were soaked in 0.1% Benlate for 24 h and then under running water for two days for pre-germination. In each pot, two 25-day-old seedlings were transplanted by maintaining a 15 cm plant-plant distance, and water levels were maintained at 2 cm for 20 days to support seedling establishment. Moreover, water levels in the pots under AWD irrigation were monitored by perforated PVC pipe and allowed to dry until the water levels reached 15 cm from the soil surface and then flooded to 2 cm above the surface (Figure 2 and Figure 3). These intermittent drying cycles continued for the whole growth period except for the flowering stage. However, water levels in the pot under CF conditions were maintained at 2 cm from the soil surface. Weeding and spraying pesticides were carried out when necessary. After full maturation, rice was harvested 135 days after transplanting.
Table 2.
Experimental treatments, which are a combination of water management and soil amendments.
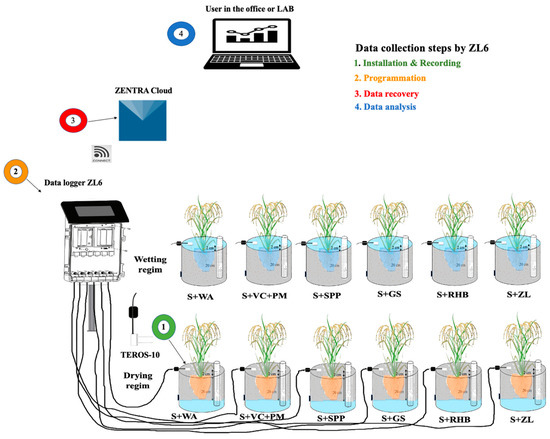
Figure 2.
Schematic representation of data collection process by ZL6 under AWD irrigation system.
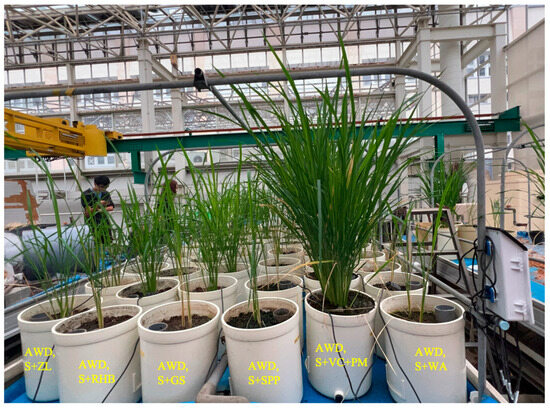
Figure 3.
Experimental pots showing the application of soil amendments, AWD irrigation, and real-time soil moisture data collection using the ZL6 data logger and connected sensors.
2.4. Monitoring Soil Moisture Using an IoT System
The proposed IoT system for this study is a ZL6 device from METER GROUPE. The soil’s volumetric water content (VWC) under the AWD irrigation system was monitored using a ZL6 IoT system integrated with six TEROS 10 sensor nodes and the ZENTRA Cloud platform. The TEROS 10 sensors were installed at a depth of 10 cm in each experimental pot to capture soil moisture dynamics in the root zone of rice plants. Utilizing a capacitance-based method to measure dielectric permittivity, these sensors provided accurate VWC readings essential for managing AWD irrigation. The six sensors were distributed across the experimental setup to represent six soil amendment treatments under AWD irrigation. Data from the sensors were collected by the ZL6 data logger at 15 min intervals and transmitted wirelessly to the ZENTRA Cloud via the Wi-Fi network of the Tokyo University of Agriculture, ensuring continuous and real-time monitoring without manual intervention. The steps involved in data collection and transmission are illustrated in Figure 2 and Figure 3. The ZENTRA Cloud platform was a central hub for storing, visualizing, and analyzing the collected data. Temporal VWC trends were monitored to determine the point at which soil moisture reached the lower limit of the safe AWD threshold, triggering re-irrigation events and integrating six sensors and high-frequency data recording provided comprehensive insights into how each soil amendment influenced water retention and availability under AWD conditions.
2.5. Calibration and Validation of Sensors in the Laboratory
The calibration and validation of the TEROS 10 sensors were conducted in the Laboratory of Land and Water Use Engineering to ensure accurate measurement of VWC across varying soil moisture conditions. Initially, the soil was air-dried to a uniform moisture level, and six moisture levels were used for calibration: saturated soil, air-dried soil mixed with 200 mL, 150 mL, 100 mL, and 50 mL of water, and air-dried soil with no added water. A sample of each soil mixture was taken after the water was mixed into it, and the samples were oven-dried in the laboratory to determine the gravimetric water content. The gravimetric water content was then converted to VWC using the following formula:
where GWC is the gravimetric water content (expressed as a percentage), and BD is the dry bulk density of the soil (g/cm3). The VWC readings from the sensors were compared to the calculated values, and regression analysis was performed to establish a calibration curve. After calibration, the sensors were validated by comparing their VWC measurements to gravimetric values from a new set of soil samples with different moisture levels.
2.6. Growth Parameters Measurement
To determine how treatments affected plant performance, growth data were examined at critical points. Plant height (PH), with values averaged for each experimental unit, was recorded from the soil surface to the tip of the tallest leaf or panicle. Total tillers (TNT) were manually counted, while productive tillers (PT) bearing panicles were recorded separately at the flowering stage. The flag leaf area (FLA) was measured during the flowering stage using an LI-3000C portable leaf area meter (LI-COR, Lincoln, NE, USA), which provided accurate readings of the flag leaf’s surface area. Additional growth parameters included root length (RL) and plant biomass. RL was assessed at harvest by extracting and washing roots and measuring the longest root. Root fresh weight (RFW), root dry weight (RDW), shoot fresh weight (SFW), and shoot dry weight (SDW) were used to determine plant biomass. To obtain the dry biomass, shoots, and roots were separated, weighed fresh, oven-dried at 70 °C to a consistent weight, and then weighed once more.
2.7. Physiological Parameters Measurement
After applying the second period of the drying regime, leaf chlorophyll content and photosynthetic parameters were measured using the SPAD value meter (SPAD-502, Minolta, Tokyo, Japan) and LCi-SD Portable Photosynthesis System (ADC Bioscientific, Hoddesdon, UK), respectively. Readings were taken from each plant’s upper, middle, and lower leaves, and the values were averaged to assess chlorophyll distribution across the canopy. Each plant’s photosynthetic rate (Pn: μmol CO2 m−2 s−1), transpiration rate (E: μmol H2O m−2 s−1), and stomatal conductance (gs: mol H2O m−2 s−1) were measured. Photosynthetically active radiation (PAR) was determined using the mini–Plant Photosynthesis Meter (miniPPM-300, Delft, Netherlands). Measurements were taken from three leaves of ten plants for each treatment, including a flag leaf and two lower leaves, with the central part of the leaf sheet used for consistent measurement. All photosynthetic data were gathered between 10:00 AM and 1:00 PM to reduce variability brought on by environmental changes during the day. Consequently, Instantaneous water use efficiency (WUE) was calculated as the ratio of the Pn to the E, expressed as
2.8. Determination of Soil Physical and Chemical Parameters
Soil physical parameters were measured using standard methods at the end of harvest. Bulk density (BD) was determined by core sampling from a 0–20 cm soil depth [17] and calculated by the following Equation (3):
Soil organic matter (SOM) and soil organic carbon (SOC) were measured using the ignition method, where a 1 g soil sample was combusted at 550 °C for 4 h. SOM was calculated as the weight loss during combustion, and SOC was estimated using the following Equation (4):
The JXCT 7-in-1 soil sensor (Weihai JXCT Electronic Technology, Weifang, China) was used to measure soil nitrogen (N), phosphorus (P), potassium (K), pH, temperature, and electrical conductivity (EC), following the methodology described by G et al. [40]. The measurement was taken one day before transplanting to evaluate plant nutrient uptake under each treatment. The sensor probe was inserted into the topsoil (0–25 cm depth), with each pot treated as a replication. Readings were collected from five pots per treatment, and real-time data were recorded using the Soil Sensors Display Terminal, ensuring seamless integration with the JXCT 7-in-1 soil sensor and high measurement precision across treatments.
2.9. Determination of Yield and Yield Components
Grain yield (GY) and yield components, including the number of panicles per plant, filled grains per panicle, unfilled grains per panicle, total grains per panicle, and 1000-grain weight, were assessed after harvest following the methodology described by Amin et al. [41]. The grain harvest index was calculated based on the ratio of GY to total biomass produced (Equation (5)):
2.10. Water Productivity and Water Saving Assessment
Water productivity was calculated as grain yield divided by the total amount of water supplied to the pot and was expressed in kg m−3 according to Equation (6):
Water saving was determined concerning irrigation water and calculated as the difference in irrigation under the two irrigation regimes divided by the irrigation water applied under the CF regime, as shown in Equation (7). The number of irrigations was determined by calculating the mean number of all irrigations for each pot:
2.11. Statistical Analysis
To fully understand the findings, Tukey’s test, a measure of effect size eta-squared (η2), Pearson’s correlation analysis, regression analysis, and analysis of variance (two-way ANOVA) at a 5% significance level were performed. The data were visualized using Python 3.7.4 Jupyter Notebook “https://api.anaconda.org (accessed on 12 October 2024)” and analyzed using the statistical software R 3.6.2.
3. Results
3.1. Temporal and Spatial Variations in Hydrological Parameters
Analysis of Baghlan Province’s hydrological parameters spans for 22 years, focusing on annual variation between 2001 and 2023, reveals significant patterns relevant to sustainable farming practices, particularly AWD irrigation. PR exhibited a positive trend (1.48), ET showed a slight negative trend (−0.86), and SM of the root zone at a depth of 40 cm displayed a minor positive trend (0.17). These patterns, however, did not reach statistical significance (p > 0.05). In contrast, AT demonstrated a statistically significant positive trend (0.06, p < 0.05), highlighting a consistent warming pattern over the study period (Figure 4). Further information on the spatial variability of these variables can be obtained by visualizing them spatially throughout the province. Hatched lines indicate places with significant trends (p < 0.05), highlighting localized climate changes, especially for AT, which showed notable increases in specific locations (Figure 5). These temporal and spatial patterns suggest the need for regionally specific water management solutions. Despite the warming trend, the SM of the root zone shows slight stability, especially at a depth of 40 cm. This is especially important because AWD irrigation depends on soil moisture at deeper depths to support crop growth during periodic dry spells. In order to sustain productivity in regions impacted by rising temperatures, AWD can maximize water consumption, preserve surface water, and promote more profound root growth. The notable warming patterns found temporally and spatially suggest that future ET demand may rise. Although the historical trend in ET is slightly negative, this could change as temperatures rise. AWD irrigation offers a proactive solution by reducing water use while maintaining adequate soil moisture, particularly in regions most affected by warming.
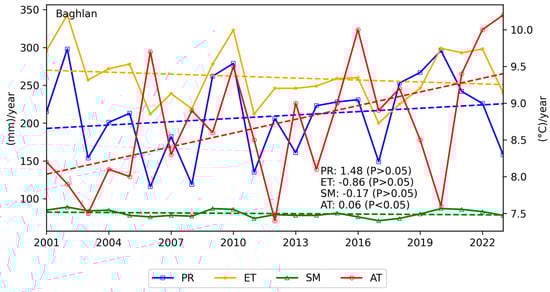
Figure 4.
Annual variations in precipitation (PR), evapotranspiration (ET), soil moisture of root zone (SM), and air temperature (AT) during 2001–2023 in Baghlan. Dashed lines are linear regression trends with a significant trend (p-value < 0.05).
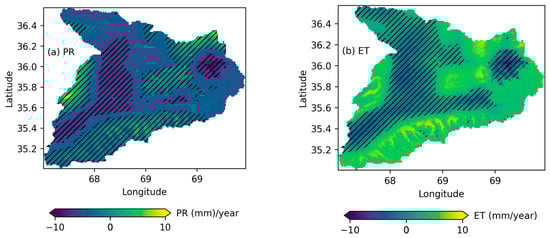
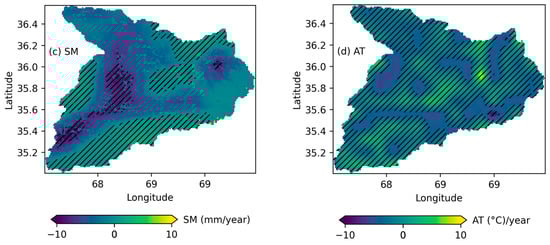
Figure 5.
Spatial trends in (a) precipitation, (b) evapotranspiration (ET), (c) soil moisture (SM), and (d) air temperature (AT) over the study area during 2001–2023. Hatched lines mark regions with a significant trend (p-value < 0.05).
3.2. Accuracy and Precision of Probes Calibration
Strong linear relationships between sensor readings and measured VWC values were shown by regression analysis for sensors calibration curves, with R2 ranging from 0.88 *** to 0.94 ***, highlighting the calibration method’s reliability (Figure 6). Through validation using separate soil samples, the validity of the calibration was confirmed by the close match between the sensor-measured VWC and the laboratory output of VWC. After calibration, the TEROS 10 sensor achieved a measurement error of ±1–2% VWC for soil moisture, which is highly accurate for most agricultural, environmental, and research applications. The calibrated TEROS 10 sensors were validated as suitable for monitoring soil moisture under AWD irrigation systems in field conditions.
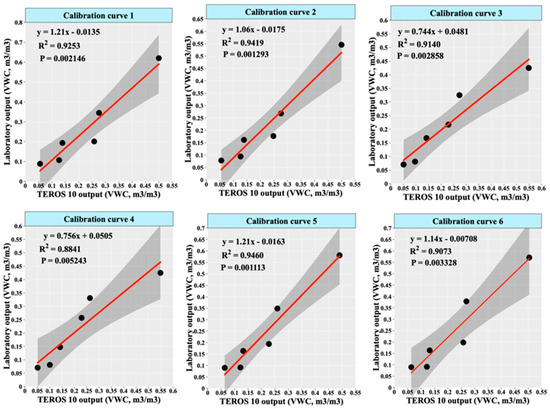
Figure 6.
Calibration curve together with confidence interval resulted from regression analysis. Black dots indicate calibration points while red lines show calibration curves.
3.3. Variation in Soil Water Content During AWD Irrigation
The result of the water content assessment by the TEROS 10 probes from 23 July to 10 November 2024, showed ten primary wetting and drying periods during the 5 months of the survey (Figure 7). The sensors were installed during the first drying period, starting on 23 July, prior to the continuous flooding of the pots. The results revealed cyclical patterns in VWC corresponding to the AWD irrigation schedule, with soil moisture increasing sharply after each irrigation event and gradually decreasing during the drying periods. In the first drying period from 23 July to 5 August, S + WA showed lower VWC after S + VC + PM due to a similar plant growth stage. Physiological activities such as Pn and E were comparable, leading to similar water uptake rates. At this stage, root systems were not fully developed to impact water consumption significantly. The VWC differences became more noticeable later as amended treatments, particularly S + VC + PM, supported better plant growth and higher water demand. Throughout the drying periods, S + VC + PM exhibited the steepest decline in VWC. This could be attributed to enhanced physiological activities such as Pn and E, driven by the higher soil nutrients and improved physical structure provided by the organic amendment. The rice plants in these pots had longer roots, which absorbed more water, leading to consistently lower VWC than other treatments. The second-lowest VWC was observed in the S + RHB, which may have improved the soil’s water-holding capacity to some extent but still allowed for efficient water uptake by the plants. S + GS treatment had the third lowest VWC due to improved soil structure and calcium availability, which enhanced root growth and water uptake efficiency. This led to increased water consumption during the drying periods. Soil with spirulina powder and zeolite exhibited the most consistent VWC levels, highlighting its high water-holding capacity and gradual moisture release. Unlike the treatments with more pronounced declines in VWC (like S + VC + PM), S + SPP treatment likely provided a steady nutrient supply to the rice plants, supporting their growth without causing excessive water uptake. This moderate and consistent growth could result in a more stable rate of Pn and root water absorption, leading to relatively stable soil moisture levels over time. These treatments did not induce as significant improvements in plant growth and physiological activity as S + VC + PM, which may explain the less pronounced decline in VWC compared to these treatments. Generally, the decline in VWC was closely linked to the plants’ growth performance and physiological activity. In treatments with SAs, where plant growth and physiological activity were enhanced, the VWC was lower. However, the water content remained higher in the treatment without any soil amendment except during the first drying period. This may be because the rice plants in these pots exhibited slower growth and physiological activity, reducing water uptake compared to the amended treatments.
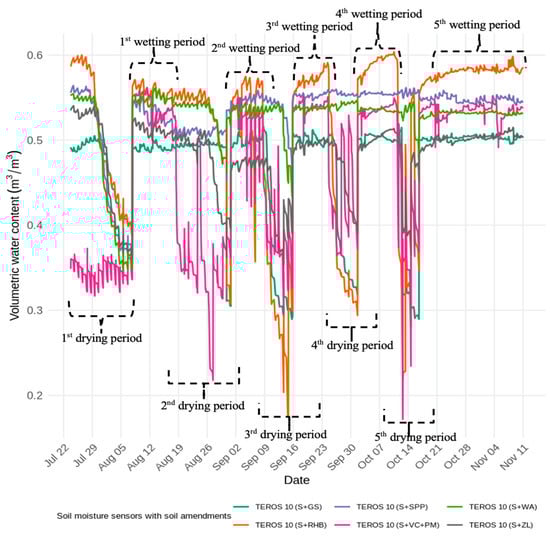
Figure 7.
Variation in soil volumetric water content (VWC) amended with different organic and inorganic materials under AWD irrigation from 23 July to 10 November 2024.
3.4. Variation in Growth Parameters
The effects of SA and WM on the growth parameters of deeper-rooted rice are presented in Table 3. Significant variations were observed across treatments for all growth attributes. The CF + (S + VC + PM) treatment exhibited superior performance with the highest PH, TNT, PT, FLA, and RL, closely followed by AWD + (S + VC + PM). In contrast, the lowest values for these parameters were recorded under CF + (S + SW) and AWD + (S + SW), indicating the limited efficacy of these amendments. Statistical analysis revealed that SA had a highly significant effect (p < 0.001) on all parameters, while WM significantly influenced PT and FLA (p < 0.05). The interaction between WM and SA was significant for PH (p < 0.05), demonstrating the dependency of SA effectiveness on irrigation regimes. These findings emphasize the potential of VC and PM to enhance growth performance, particularly under CF conditions. Regarding fresh and dry weight, there were significant differences in shoot and root biomass across treatments (Table 4). The CF + (S + VC + PM) treatment achieved the highest SFW, SDW, RFW, and RDW, highlighting the efficacy of combining VC and PM under CF. Similarly, AWD + (S + VC + PM) also resulted in high shoot and root biomass, though slightly lower than its CF counterpart, indicating the adaptability of this amendment under AWD irrigation. Conversely, the CF + (S + SW) and AWD + (S + SW) treatments resulted in the lowest biomass production, with significantly reduced SFW and negligible RDW. Statistical analysis revealed that SA had a highly significant effect (p < 0.001) on all biomass parameters. WM significantly influenced root biomass (p < 0.001) and shoot biomass (p < 0.01 for fresh weight; p < 0.001 for dry weight). The interaction between WM and SA was significant for RFW (p < 0.01) but non-significant for other parameters, suggesting that root biomass is more sensitive to the combined effects of irrigation and amendments.
Table 3.
Effects of SAs with AWD irrigation on growth parameters of deeper-rooted rice cultivar.
Table 4.
Effects of SAs with AWD irrigation on plant biomass of deeper-rooted rice cultivar.
3.5. Variation in Physiological Parameters
The results demonstrate that combining CF with VC and PM achieved the highest physiological performance (Table 5), including chlorophyll content, Pn, PAR, E, and gs, highlighting its efficacy in supporting rice growth. Conversely, AWD combined with zeolite resulted in the lowest values for Pn, E, and gs, indicating limited physiological activity under water-saving practices with mineral amendments. However, SAs played a crucial role in enhancing physiological traits under AWD. For instance, AWD combined with biochar improved WUE by enhancing soil aeration and water-holding capacity. AWD with gypsum supported moderate Pn rate and gs, reflecting its ability to improve soil structure and nutrient availability. Under AWD, organic amendments like VC and PM also demonstrated the ability to sustain physiological activity by increasing the soil’s microbial activity and nutritional content. Combining both strategies is crucial for better crop performance, as seen by the strong interaction effect between WM and SA for most metrics. CF with organic amendments consistently outperformed other combinations, demonstrating the synergy between constant water availability and nutrient-rich soil. Under AWD, SAs such as biochar and gypsum mitigated the limitations of intermittent drying by maintaining root-zone moisture and nutrient availability, thereby supporting physiological activity.
Table 5.
Effect of SAs with AWD irrigation on physiological characteristics of deeper-rooted rice cultivar.
3.6. Analysis of Soil Physical and Chemical Properties
The results highlight the significant influence of SA and WM on soil properties and nutrient availability (Table 6). Treatments with VC and PM under both CF and AWD demonstrated the highest levels of N, P, and K, along with superior SOM and SOC, indicating enhanced nutrient enrichment and organic content Table 5. The lowest BD in this treatment suggests improved soil structure and porosity. Conversely, treatments with spirulina, gypsum, and zeolite showed moderate improvements in nutrient levels and organic content compared to untreated soils. Biochar treatments exhibited the highest K levels, likely due to its inherent nutrient composition, alongside moderate SOM and SOC. EC was significantly higher in VC + PM treatments, indicating greater nutrient solubility. Soil pH remained stable across treatments, while ST varied slightly, with biochar and zeolite treatments achieving the highest values. The interaction of WM and SA significantly influenced most soil parameters, emphasizing the importance of tailored strategies to optimize soil health and fertility in drought-prone environments.
Table 6.
Effects of SAs on soil physical and chemical properties under CF and AWD conditions.
3.7. Analysis of Yield and Yield Components
The effects of SA and WM on the reproductive growth parameters of deeper-rooted rice are detailed in Table 7. The number of panicles, GY, and harvest index varied significantly among treatments. Concerning the maximum number of panicles, filled grains per panicle, total number of grains per panicle, GY, and harvest index, the CF + (S + VC + PM) treatment performed exceptionally well. Similarly, the AWD + (S + VC + PM) treatment also demonstrated high performance, emphasizing the effectiveness of VC and PM in improving reproductive parameters under AWD irrigation. Conversely, the CF + (S + SW) and AWD + (S + SW) treatments recorded the lowest values across most parameters, with AWD + (S + SW) producing the least GY and harvest index. Statistical analysis revealed significant effects of SA (p < 0.001) on all parameters, with WM also significantly influencing most traits (p < 0.001). Interaction effects between WM and SA were significant for filled, unfilled, total grains, and GY (p < 0.05 to p < 0.001), highlighting the interplay between soil amendments and irrigation practices.
Table 7.
Effects of SAs with AWD irrigations on yield and yield components of deeper-rooted rice.
3.8. Analysis of Water Productivity and Water Saving Across Treatments
The results in Table 8 demonstrate significant variations in water use, irrigation number, water productivity, and water savings among the treatments under CF and AWD. The highest water use was observed in CF + (S + VC + PM), while the lowest was in AWD + (S + SW), with AWD treatments consistently saving water by 10.29% to 23.02% compared to CF treatments. The number of irrigations was also significantly lower under AWD, with AWD + (S + SW) requiring the least, compared to CF + (S + VC + PM), which needed the most. Water productivity was highest in AWD + (S + ZL) and lowest in AWD + (S + SPP), indicating that zeolite was particularly effective in improving water efficiency. The efficiency of zeolite can be attributed to its high cation exchange capacity and porous structure, which enhance water retention, reduce evaporation, and improve nutrient availability for plant uptake. Among the treatments, gypsum also contributed significantly to water saving, with a reduction of 23.02% under AWD compared to CF. This efficiency can be attributed to gypsum’s role in improving soil structure and water infiltration, which minimizes surface runoff and enhances water retention in the root zone. Overall, AWD with zeolite demonstrated the best water savings and productivity balance. At the same time, gypsum was particularly effective in reducing water loss, highlighting its potential for enhancing WUE in drought-prone rice production systems.
Table 8.
Water use, percentage of water saved, number of irrigation and water productivity.
3.9. Regression Analysis
GY is a crucial measure of food security and agricultural productivity, especially in rice cultivation. Correlation between GY and other parameters is vital to comprehending the underlying causes of productivity loss and finding ways to improve it. Regression analysis found significant correlations between GY and other parameters, which provides insight into the variables affecting production. Because panicles are the primary source of grain production, the number of RT showed the most prominent positive connection with GY (R2 = 0.96 ***) among these. Their significant positive relationships further highlighted the significance of SFW (R2 = 0.71 ***) and P content (R2 = 0.68 ***) in plant vigor, biomass accumulation, and energy transfer mechanisms necessary for grain development. P is particularly critical for energy transfer, root development, and reproductive processes such as flowering and grain filling. Moderate positive correlations were found between GY and N content (R2 = 0.58 ***) and RL (R2 = 0.56 ***). Nitrogen’s role in chlorophyll production, photosynthesis, and root length’s contribution to water and nutrient uptake supports their impact on yield variability. Conversely, GY showed an important negative correlation with soil BD (R2 = 0.63 ***), suggesting that compacted soils restrict resource availability, aeration, and root growth, eventually lowering productivity (Figure 8).
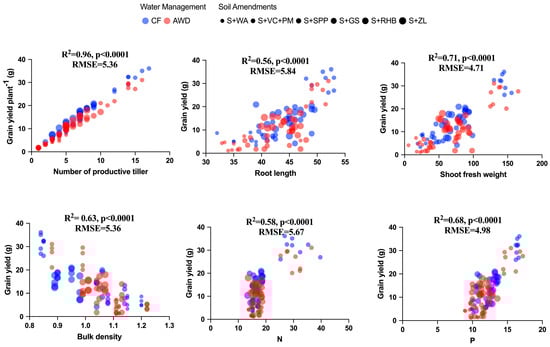
Figure 8.
Regression analysis of number of productive tillers, root length, shoot fresh weight, bulk density, N, and P with grain yield.
3.10. Correlation Analysis
Correlation analysis found a significant relationship between the morphological, biomass, and physiological characteristics of rice plants. In terms of biomass accumulation and overall plant performance, RT was found to have the strongest connections with TNT (r = 0.95 ***), SFW (r = 0.84 ***), SDW (r = 0.84 ***), and RDW (r = 0.82 ***). The near-perfect correlation between SFW and SDW (r = 0.99 ***) highlighted their significance as growth indicators and their interrelatedness. Strong relationships between RL and SFW (r = 0.85 ***) and SDW (r = 0.84 ***) further demonstrated RL’s role in biomass development. Among physiological characteristics, the Pn rate was critical to the plant’s photosynthetic efficiency, as evidenced by its high associations with PAR (r = 0.89 ***), E (r = 0.84 ***), and gs (r = 0.85 ***). Furthermore, SPAD substantially contributed to physiological performance. However, it showed moderate associations with SDW (r = 0.62 ***) and RDW (r = 0.63 ***) (Figure 9).
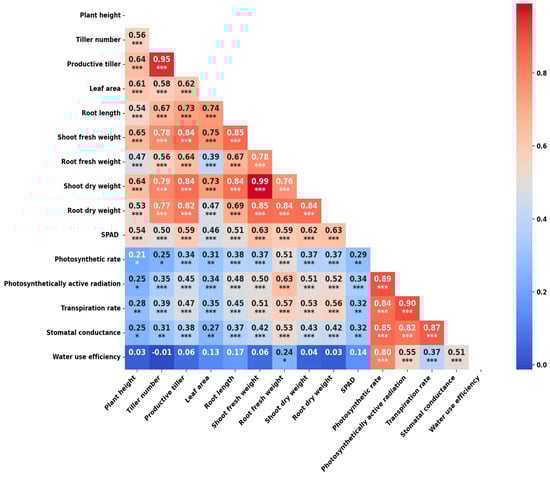
Figure 9.
Correlation of growth parameters with physiological parameters. *** p < 0.001, ** p < 0.01, * p < 0.05.
4. Discussion
4.1. Interpretation of Probes Validation Results
It has been reported that the calibration of sensors is still a significant challenge to have applied in actual conditions [32]. However, in this study, the calibration of TEROS 10 probes, used to assess Akadama soil humidity, has been processed to demonstrate the reliability of the ZL6 device inside the laboratory. Equations x and y were used to calibrate the measured values of soil water content. The value of R2 ranging from 0.94 to 0.88 shows the reliability of the calibration method used in this study. Previously, soil moisture sensors were also tested under laboratory conditions [32]. The data analysis of these tests showed a strong relationship between the water content values measured by ZL6 and those determined by the gravimetric method with linear regression. Previously, researchers had developed methods of monitoring processes and equipment applied to monitoring the calibration of sensors [42]. In addition to Zl6 probes, several soil moisture sensors, such as the ECH2O-5TE probe and copper-based probe, have also recently been calibrated and validated with RMSE = 0.009 according to globally accepted and proven oven-dry methods by using linear, polynomial and logarithmic regression equations [43]. The developed calibration graphs provide a reliable tool for precise soil moisture management, contributing to improved water-use efficiency in agricultural practices. This process made it possible to create reliable calibration graphs to ensure the accuracy of the TEROS 10 sensors for tracking soil moisture under the AWD irrigation system in field circumstances.
4.2. Insitghts into Soil Water ContentVariation During AWD Irrigation
The water content (TEROS 10) sensor readings indicate how much water is in the soil. For example, 0.30 m3/m3 means 30% of a soil block is water at the measured location [44]. The assessment of VWC using TEROS 10 probes revealed distinct wetting and drying cycles aligned with the AWD irrigation schedule Figure 6. Treatments with amendments showed notable differences in VWC dynamics. S + VC + PM exhibited the steepest declines during drying periods, reflecting enhanced water uptake driven by improved physiological activity and shoot and root development. Similarly, S + RHB and S + GS supported efficient water use through improved soil structure and nutrient availability. In contrast, S + SPP and S + Z treatments maintained more stable VWC, attributed to their high water-holding capacities and gradual moisture release. The non-amended soil had the highest VWC due to slower plant growth and lower water uptake, highlighting the role of amendments in optimizing water use. This study uniquely demonstrated using ZL6-connected TEROS 10 sensors with AWD irrigation and soil amendments, a combination not explored in previous research. However, research conducted in Vietnam concluded that plots with sensors used less irrigation water than plots with manual AWD, resulting in moderately higher yields [45]. The sensors effectively provided real-time, high-resolution data on soil moisture dynamics, proving invaluable for optimizing irrigation practices. Consistent with prior studies [34,46,47], the sensor data demonstrated strong correlations with soil water content across treatments, supporting their utility in optimizing irrigation systems [32].
4.3. Interpretation of Growth Parameters Trend
When soil amendments containing organic matter and essential nutrients increase in proper amount or decrease by previous crop uptake, the plant growth rate and biomass production are likewise altered. In this study, PH, TNT, PT, FLA, RL, and overall plant biomass of rice cultivar increased significantly (p < 0.0001) in response to SA compared to the control treatment that received no SA (Table 3 and Table 4). Growth and plant biomass can be increased by incorporating certain organic and inorganic amendments under CF and AWD conditions. Many scholars have reported an increase in growth and plant biomass due to decent nutrient availability, enhanced soil structure, and better microbial activity [17,27,48]. This experiment revealed that combining VC and PM with CF and AWD irrigation achieved the highest and second-highest growth attributes, respectively. This increase can be attributed to the unique properties of these amendments. VC enhances soil structure, increases nutrient availability, and stimulates microbial activity, improving root and shoot development [48]. A similar result was found by Oyege and Balaji Bhaskar [49], who reported that when VC was added under 100% supplement irrigation, it achieved the highest grain yield and enhanced plant growth. Peat moss contributes high organic matter content and excellent water-retention capacity, ensuring sustained nutrient release and soil aeration, which support robust plant growth [14]. These amendments are particularly beneficial under AWD irrigation because they improve the soil’s ability to retain moisture during drying periods while maintaining nutrient availability [14,48]. However, the TEROS 10 sensor indicated the steepest decline in VWC in this study. This decline could be attributed to enhanced growth rate and physiological activities driven by the higher soil nutrients and physical structure provided by VC and PM. VC enhances cation exchange capacity and provides a steady supply of essential nutrients like nitrogen and phosphorus, critical for maintaining plant growth under fluctuating water conditions. Similarly, peat moss tries to buffer against water stress by gradually releasing moisture, mitigating the adverse effects of drying cycles and allowing roots to access water even during periods of limited irrigation. Biomass analysis further supported these trends, with CF + (S + VC + PM) achieving the highest shoot and root biomass, followed closely by AWD + (S + VC + PM). This finding demonstrates the efficacy of S + VC + PM in enhancing biomass accumulation even under intermittent water supply.
4.4. Interpretation of Variation in Physiological Parameters
Our results revealed that under both CF and AWD irrigations, the photosynthesis activities of rice were also improved with the addition of soil conditioners Table 6. Under CF conditions, each soil conditioner enhances these activities more than in AWD conditions. However, when it comes to water-saving conditions, VC + PM showed better performance compared to other soil conditioners. That is why VC and PM sustained photosynthesis-related traits such as SPAD, E, Pn, PAR, and gs by enriching the soil with nutrients and enhancing microbial activity, as reported by Lim et al. [48]. This finding was also consistent with the conclusion of previous studies, that is, vermicompost was richer in nutrients, which could remarkably enhance soil fertility [50,51]. AWD, combined with biochar, mitigated the limitations of drying periods and improved WUE by enhancing soil aeration and water-holding capacity, as supported by previous findings [52]. This reported that biochar’s porous structure supports root growth and nutrient retention, which can help plants maintain physiological functions during drying cycles. Similarly, AWD with gypsum supported moderate Pn and gs values, reflecting its ability to improve soil structure, calcium availability, and overall nutrient uptake. These results are indirectly supported by Abbas et al. [16], who highlighted the role of gypsum in increasing the soil porosity, loosening the soil, decreasing the bulk density, decreasing the soil electrolytes concentration, and replacing the Na+ with Ca+2, which might enhance root growth and allows better air and water movement in the soil. These positive changes indirectly help healthier plants with more efficient photosynthesis. Surprisingly, AWD combined with zeolite resulted in the lowest physiological performance compared to the other amendments, likely due to limited nutrient availability, contrasting with findings by Li et al. [18], which emphasize the context-dependent efficacy of zeolite.
4.5. Elucidation of Soil Physical and Chemical Properties
VC and PM demonstrated the highest improvement in N, P, K, SOM, and SOC, consistent with the findings by Rehman et al. [13], who emphasized the ability of organic amendments to supply essential nutrients, improve soil structure, and enhance microbial activity. The observed reduction in BD in these treatments corroborates findings by Alegre et al. [53], who reported that organic matter incorporation that contains VC and PM reduces soil compaction, improving aeration and root penetration. RHB treatments showed the highest K levels, likely due to the high K content of biochar, which has been well-documented in previous studies [54]. Furthermore, the higher EC in VC + PM treatments reflects more excellent nutrient solubility, as organic materials release ions upon decomposition [48]. Similarly, zeolite treatments resulted in moderate nutrient improvement and enhanced ST, consistent with Ramesh and Reddy [55], who highlighted zeolite’s cation exchange capacity and thermal properties. The near-neutral pH across treatments, support [54], highlights how organic amendments like biochar and vermicompost buffer soil pH optimize nutrient availability and microbial activity.
4.6. Inference on Yield and Yield Components
The findings of this study align with the existing literature highlighting the importance of irrigation management and soil amendments in rice productivity. CF consistently outperformed alternate AWD across all measured parameters, consistent with [56], who reported that CF enhances nutrient uptake and reduces weed competition. Among the treatments, CF + (S + VC + PM) achieved the highest grain yield and the highest number of panicles per plant, supporting Haque et al. [17], who noted the significant role of organic amendments in improving soil fertility, water retention, and nutrient availability. Under AWD conditions, grain yield followed the ranking: (S + VC + PM) > (S + ZL) > (S + RHB) > (S + GS) > (S + SPP) > (S + SW). AWD + (S + VC + PM) showed superior performance in the number of panicles per plant, filled grains per panicle, and 1000-grain weight, demonstrating its ability to mitigate water stress through improved nutrient availability. Zeolite and rice husk biochar also performed well, consistent with [17,18], who highlighted their ability to enhance water and nutrient retention under water-limited conditions. Soil without amendment had the lowest yield and the poorest performance across most parameters, confirming Belder et al. [30], who noted that AWD is less effective in the absence of appropriate soil amendments. In terms of total grains per panicle, AWD + (S + ZL) and AWD + (S + RHB) performed well, but unfilled grain numbers were higher, especially in AWD + (S + ZL), suggesting potential sink limitations. Treatments with VC and PM consistently supported better grain filling under both CF and AWD conditions, highlighting their overall efficacy. These findings demonstrate that while CF consistently supports higher productivity, AWD can be optimized with effective amendments such as vermicompost, zeolite, or biochar. Tailoring amendment and irrigation strategies are critical for enhancing rice productivity, especially in drought-prone regions.
4.7. Explanation of Water Productivity and Water Saving
This study supports the growing evidence that AWD can significantly reduce water use in rice cultivation. AWD treatments, particularly S + SW, used less water and required fewer irrigations than CF treatments. For example, CF + (S + VC + PM) used the most water and required the highest number of irrigations, while AWD treatments, especially S + GS and S + ZL), reduced water use by over 20% while maintaining high water productivity. These findings align with previous studies [57], which showed that AWD can cut water use by 8.5% without negatively affecting yield. Hussain et al. [58] also reported the superiority of AWD in improving water productivity over CF. Soil amendments like zeolite (S + ZL) and gypsum (S + GS) improve soil structure and moisture retention, enhancing water efficiency. In this study, both AWD + (S + ZL) and AWD + (S + GS) exhibited better water productivity and saved significant amounts of water, reflecting findings from [18]. Conversely, CF treatments showed higher water use and more irrigation events, consistent with [57,58], which found that CF leads to higher water loss through evaporation and seepage. Overall, AWD, particularly when paired with soil amendments, reduces water use and the number of irrigations required, leading to substantial water savings and improved water productivity, making it a viable, sustainable irrigation strategy for rice farming.
5. Conclusions
The IoT has made it more accessible to monitor soil properties regularly, but improving measurement accuracy is still a significant challenge. In order to effectively monitor the water content in AWD irrigation systems, this study suggests using TEROS 10 probes. With a calibration reliability ranging from R2 = 0.88 to R2 = 0.94, our results show that the ZL6 system efficiently monitors soil VWC during AWD irrigation when combined with TEROS 10 sensors. The sensors’ excellent recording of cyclical VWC patterns demonstrated how soil amendments affect water intake and retention. Due to improved soil nutrients and structure, the S + VC + PM treatment consistently enhanced plant growth, biomass, and physiological activity. While this treatment performed best under CF, it also showed adaptability under AWD, supporting higher WUE. Spirulina powder and zeolite maintained stable soil moisture due to their water-holding capacity, while zeolite achieved the highest water productivity under AWD. Additionally, VC and PM contributed to increased organic matter, improved soil structure, and improved nutrient availability, all boosted by organic amendments. Though excellent performance was also noted under AWD, which led to significant water savings, the CF + (S + VC + PM) treatment produced the highest yield components and GY). Regression analysis revealed that phosphorus levels, shoot biomass, and root characteristics influenced GY. To sum up, combining organic amendments with AWD irrigation can significantly improve the yield of deep-rooted rice, fortify the soil, and boost water efficiency—elements that together support a sustainable method for areas vulnerable to drought. Future research should focus on assessing the suitability of these strategies across diverse field conditions to ensure their widespread effectiveness.
Author Contributions
Conceptualization, M.W.A., K.I. and M.M.; methodology, M.W.A., A.H.A., M.S.A. and S.S.; validation, M.W.A., M.M., K.I., S.S. and A.B.M.; formal analysis, M.W.A., N.S. and A.H.A.; investigation, M.W.A., N.S., A.H.A., K.J. and M.M.; resources, M.W.A., N.S., S.S., A.H.A., K.I. and M.M.; data curation, M.W.A., A.H.A., M.S.A. and A.B.M.; writing—original draft preparation, M.W.A., S.A. and M.S.A.; writing—review and editing, M.W.A., N.S. and M.M.; visualization, M.W.A., S.A. and N.S.; supervision, M.M. and K.J. All authors have read and agreed to the published version of the manuscript.
Funding
This research was supported by the Gakupro Doctoral Program Research Grant 2024 (Funding Number: 46407445G), which provided 400,000 yen in funding for one year (1 April 2024–31 March 2025). The grant, aimed at promoting research by doctoral students aspiring to become researchers, enabled pot experiments at the Tokyo University of Agriculture. This experiment was critical for studying strategies to enhance rice production in drought-prone regions of Afghanistan. The funding required submitting a research plan, expenditure plan, and a final research report, with budget execution data monitored through the accounting system. The authors express their sincere gratitude for this financial assistance, which was instrumental in completing the project.
Institutional Review Board Statement
Not applicable.
Data Availability Statement
When requested, the authors will make available all data used in this study.
Acknowledgments
The authors would like to thank the Ministry of Education, Culture, Sports, Science, and Technology (MEXT) of Japan for providing a scholarship that made this study possible at the Tokyo University of Agriculture. We have obtained explicit consent from all acknowledged individuals and entities to include their names in this section.
Conflicts of Interest
The authors declare no conflicts of interest.
References
- Van Dijk, M.; Morley, T.; Rau, M.L.; Saghai, Y. A meta-analysis of projected global food demand and population at risk of hunger for the period 2010–2050. Nat. Food 2021, 7, 494–501. [Google Scholar] [CrossRef] [PubMed]
- Zeng, D.; Tian, Z.; Rao, Y.; Dong, G.; Yang, Y.; Huang, L.; Leng, Y.; Xu, J.; Sun, C.; Zhang, G.; et al. Rational design of high-yield and superior-quality rice. Nat. Plants 2017, 3, 17031. [Google Scholar] [CrossRef]
- Kondamudi, R.; Swamy, K.N.; Chakravarthy, D.V.N.; Vishnuprasanth, V.; Rao, Y.V.; Rao, P.R.; Sarla, N.; Subrahmanyam, D.; Voleti, S.R. Heat Stress in Rice—Physiological Mechanisms and Adaptation Strategies. In Crop Stress and its Management: Perspectives and Strategies; Venkateswarlu, A.K., Shanker, C., Shanker, M., Maheswari, M., Eds.; Springer: Berlin/Heidelberg, Germany, 2012; pp. 193–224. [Google Scholar] [CrossRef]
- Bouman, B.A.M.; Tuong, T.P. Field water management to save water and increase its productivity in irrigated lowland rice. Agric. Water Manag. 2001, 49, 11–30. [Google Scholar] [CrossRef]
- Lal, R.; Delgado, J.A.; Gulliford, J.; Nielsen, D.; Rice, C.W.; Van Pelt, R.S. Adapting agriculture to drought and extreme events. J. Soil Water Conserv. 2012, 67, 162A–166A. [Google Scholar] [CrossRef]
- Yamaguchi, T.; Tuan, L.M.; Minamikawa, K.; Yokoyama, S. Assessment of the relationship between adoption of a knowledge-intensive water-saving technique and irrigation conditions in the Mekong Delta of Vietnam. Agric. Water Manag. 2019, 212, 162–171. [Google Scholar] [CrossRef]
- Mekonnen, M.M.; Hoekstra, A.Y. The Green, Blue and Grey Water Footprint of Crops and Derived Crop Products; Value of Water Research Report Series No. 47; UNESCO-IHE: Delft, The Netherlands, 2010. [Google Scholar]
- Yan, T.; Wang, J.; Huang, J. Urbanization, agricultural water use, and regional and national crop production in China. Ecol. Model. 2015, 318, 226–235. [Google Scholar] [CrossRef]
- FAO. 15 Years in Afghanistan: A Special Report: 2003–2018; Food and Agriculture Organization of the United Nations: Quebec, QC, Canada, 2018. [Google Scholar]
- Sediqui, N.; Amin, M.W.; Dawlatzai, N.; Gulab, G.; Poyesh, D.S.; Terada, N.; Sanada, A.; Kamata, A.; Koshio, K. Elucidation of Shoot and Root Growth, Physiological Responses, and Quality Traits of Tomato (Solanum lycopersicon L.) Exposed to Elevated Calcium Carbonate Concentrations. Horticulturae 2024, 10, 573. [Google Scholar] [CrossRef]
- Hashimi, R.; Matsuura, E.; Komatsuzaki, M. Effects of Cultivating Rice and Wheat with and without Organic Fertilizer Application on Greenhouse Gas Emissions and Soil Quality in Khost, Afghanistan. Sustainability 2020, 12, 6508. [Google Scholar] [CrossRef]
- Feng, Z.; Leung, L.R.; Hagos, S.; Houze, R.A.; Burleyson, C.D.; Balaguru, K. More frequent intense and long-lived storms dominate the springtime trend in central US rainfall. Nat. Commun. 2016, 7, 13429. [Google Scholar] [CrossRef]
- Rehman, S.U.; De Castro, F.; Aprile, A.; Benedetti, M.; Fanizzi, F.P. Vermicompost: Enhancing Plant Growth and Combating Abiotic and Biotic Stress. Agronomy 2023, 13, 1134. [Google Scholar] [CrossRef]
- Lee, S.-Y.; Kim, E.-G.; Park, J.-R.; Ryu, Y.-H.; Moon, W.; Park, G.-H.; Ubaidillah, M.; Ryu, S.-N.; Kim, K.-M. Effect on Chemical and Physical Properties of Soil Each Peat Moss, Elemental Sulfur, and Sulfur-Oxidizing Bacteria. Plants 2021, 10, 1901. [Google Scholar] [CrossRef]
- Suzuki, S.; Watanabe, S.; Omar, A.I.; Watanabe, F.; Shimada, S. Preliminary study on improvement of soil water retention characteristics by Spirulina. Jpn. Assoc. Arid Land Stud. 2022, 32, 49–52. [Google Scholar] [CrossRef]
- Abbas, F.; Siddique, T.; Fan, R.; Azeem, M. Role of Gypsum in Conserving Soil Moisture Macronutrients Uptake and Improving Wheat Yield in the Rainfed Area. Water 2023, 15, 1011. [Google Scholar] [CrossRef]
- Haque, A.N.A.; Uddin, M.K.; Sulaiman, M.F.; Amin, A.M.; Hossain, M.; Aziz, A.A.; Mosharrof, M. Impact of Organic Amendment with Alternate Wetting and Drying Irrigation on Rice Yield, Water Use Efficiency and Physicochemical Properties of Soil. Agronomy 2021, 11, 1529. [Google Scholar] [CrossRef]
- Li, Y.; Zheng, J.; Wu, Q.; Gong, X.; Zhang, Z.; Chen, Y.; Chen, T.; Siddique, K.H.M.; Chi, D. Zeolite increases paddy soil potassium fixation, partial factor productivity, and potassium balance under alternate wetting and drying irrigation. Agric. Water Manag. 2022, 260, 107294. [Google Scholar] [CrossRef]
- Dawar, K.; Khalil, Z.; Mian, I.A.; Khan, B.; Ali, S.; Rahi, A.A.; Tahir, M.S.; Ahmed, N.; Fahad, S.; Danish, S.; et al. Effects of Farmyard Manure and Different Phosphorus Inorganic Fertilizer Application Rates on Wheat Cultivation in Phosphorus-Deficient Soil. Sustainability 2022, 14, 9030. [Google Scholar] [CrossRef]
- Mosharrof, M.; Uddin, M.K.; Jusop, S.; Sulaiman, M.F.; Shamsuzzaman, S.M.; Haque, A.N.A. Integrated use of biochar and lime as a tool to improve maize yield and mitigate CO2 emission: A review. Chil. J. Agric. Res. 2021, 81, 109–118. [Google Scholar] [CrossRef]
- Głąb, T.; Palmowska, J.; Zaleski, T.; Gondek, K. Effect of biochar application on soil hydrological properties and physical quality of sandy soil. Geoderma 2016, 281, 11–20. [Google Scholar] [CrossRef]
- Najafi-Ghiri, M. Effects of zeolite and vermicompost applications on potassium release from calcareous soils. Soil Water Res. 2014, 9, 31–37. [Google Scholar] [CrossRef]
- Kima, A.; Chung, W.; Wang, Y.-M. Improving Irrigated Lowland Rice Water Use Efficiency under Saturated Soil Culture for Adoption in Tropical Climate Conditions. Water 2014, 6, 2830–2846. [Google Scholar] [CrossRef]
- Nie, L.; Peng, S.; Chen, M.; Shah, F.; Huang, J.; Cui, K.; Xiang, J. Aerobic rice for water-saving agriculture. A review. Agron. Sustain. Dev. 2012, 32, 411–418. [Google Scholar] [CrossRef]
- Berkhout, E.; Glover, D.; Kuyvenhoven, A. On-farm impact of the System of Rice Intensification (SRI): Evidence and knowledge gaps. Agric. Syst. 2015, 132, 157–166. [Google Scholar] [CrossRef]
- Qin, J.; Wang, X.; Hu, F.; Li, H. Growth and physiological performance responses to drought stress under non-flooded rice cultivation with straw mulching. Plant Soil Environ. 2010, 56, 51–59. [Google Scholar] [CrossRef]
- Nalley, L.; Linquist, B.; Kovacs, K.; Anders, M. The Economic Viability of Alternative Wetting and Drying Irrigation in Arkansas Rice Production. Agron. J. 2015, 107, 579–587. [Google Scholar] [CrossRef]
- Lampayan, R.M.; Rejesus, R.M.; Singleton, G.R.; Bouman, B.A.M. Adoption and economics of alternate wetting and drying water management for irrigated lowland rice. Field Crops Res. 2015, 170, 95–108. [Google Scholar] [CrossRef]
- Carrijo, D.R.; Lundy, M.E.; Linquist, B.A. Rice yields and water use under alternate wetting and drying irrigation: A meta-analysis. Field Crops Res. 2017, 203, 173–180. [Google Scholar] [CrossRef]
- Belder, P.; Spiertz, J.H.J.; Bouman, B.A.M.; Lu, G.; Tuong, T.P. Nitrogen economy and water productivity of lowland rice under water-saving irrigation. Field Crops Res. 2005, 93, 169–185. [Google Scholar] [CrossRef]
- Uga, Y.; Sugimoto, K.; Ogawa, S.; Rane, J.; Ishitani, M.; Hara, N.; Kitomi, Y.; Inukai, Y.; Ono, K.; Kanno, N.; et al. Control of root system architecture by DEEPER ROOTING 1 increases rice yield under drought conditions. Nat. Genet. 2013, 45, 1097–1102. [Google Scholar] [CrossRef]
- Zarai, B.; Khaskhoussy, K.; Zouari, M.; Souguir, D.; Khammeri, Y.; Moussa, M.; Hachicha, M. Smart control of soil water and salt content for improving irrigation management of tomato crop field: Kairouan area. Environ. Monit. Assess. 2023, 195, 1408. [Google Scholar] [CrossRef]
- Rehman, A.; Saba, T.; Kashif, M.; Fati, S.M.; Bahaj, S.A.; Chaudhry, H. A Revisit of Internet of Things Technologies for Monitoring and Control Strategies in Smart Agriculture. Agronomy 2022, 12, 127. [Google Scholar] [CrossRef]
- Said Mohamed, E.; Belal, A.; Kotb Abd-Elmabod, S.; El-Shirbeny, M.A.; Gad, A.; Zahran, M.B. Smart farming for improving agricultural management. Egypt. J. Remote Sens. Space Sci. 2021, 24, 971–981. [Google Scholar] [CrossRef]
- Farooq, M.S.; Riaz, S.; Abid, A.; Abid, K.; Naeem, M.A. A Survey on the Role of IoT in Agriculture for the Implementation of Smart Farming. IEEE Access 2019, 7, 156237–156271. [Google Scholar] [CrossRef]
- Thomas, V.; Ramzi, A.M. SRI contributions to rice production dealing with water management constraints in northeastern Afghanistan. Paddy Water Environ. 2011, 9, 101–109. [Google Scholar] [CrossRef]
- World Weather Online. Statistics of Rainfall and Temperature of Baghlan Province. Available online: https://www.worldweatheronline.com/Baghlan-weather-averages/Baghlan/af.aspx (accessed on 23 December 2024).
- FAO. Islamic Republic of Afghanistan Soil Atlas; FAO: Quebec, QC, Canada, 2020. [Google Scholar] [CrossRef]
- Kimberly, S.; Daniel, S. (NASA/GSFC/HSL) FLDAS2 Noah-MP GDAS Land Surface Model L4 Central Asia Daily 0.01 × 0.01 Degree, Greenbelt, MD, USA. Goddard Earth Sciences Data and Information Services Center (GES DISC). 2023. Available online: https://disc.gsfc.nasa.gov/datasets (accessed on 20 June 2024).
- Manju, G.; Syam Kishor, K.S.; Binson, V.A. An IoT-Enabled Real-Time Crop Prediction System Using Soil Fertility Analysis. Eng 2024, 5, 2496–2510. [Google Scholar] [CrossRef]
- Amin, M.W.; Aryan, S.; Habibi, N.; Kakar, K.; Zahid, T. Elucidation of photosynthesis and yield performance of rice (Oryza sativa L.) under drought stress conditions. Plant Physiol. Rep. 2022, 27, 143–151. [Google Scholar] [CrossRef]
- Hines, J.W.; Garvey, D. Process and equipment monitoring methodologies applied to sensor calibration monitoring. Qual. Reliab. Eng. Int. 2007, 23, 123–135. [Google Scholar] [CrossRef]
- Louki, I.I.; Al-Omran, A.M. Calibration of Soil Moisture Sensors (ECH2O-5TE) in Hot and Saline Soils with New Empirical Equation. Agronomy 2022, 13, 51. [Google Scholar] [CrossRef]
- Long, H.; Daniel, W. Monitoring Soil Moisture Level for Precision Irrigation in Apple Orchards. 2024. Available online: https://extension.psu.edu/monitoring-soil-moisture-level-for-precision-irrigation-in-apple-orchards (accessed on 12 September 2024).
- Pham, V.B.; Diep, T.T.; Fock, K.; Nguyen, T.S. Using the Internet of Things to promote alternate wetting and drying irrigation for rice in Vietnam’s Mekong Delta. Agron. Sustain. Dev. 2021, 41, 43. [Google Scholar] [CrossRef]
- Li, W.; Awais, M.; Ru, W.; Shi, W.; Ajmal, M.; Uddin, S.; Liu, C. Review of Sensor Network-Based Irrigation Systems Using IoT and Remote Sensing. Adv. Meteorol. 2020, 10, 8396164. [Google Scholar] [CrossRef]
- Narendrakumar, C.; Pradeep, M.; Rajeswaran, N.; Lawrence, T.S. Sensor Based Smart Monitoring and Controlling System for Cultivation using Labview. Int. J. Innov. Technol. Explor. Eng. 2019, 8, 3687–3689. [Google Scholar] [CrossRef]
- Lim, S.L.; Wu, T.Y.; Lim, P.N.; Shak, K.P.Y. The use of vermicompost in organic farming: Overview, effects on soil and economics: The use of vermicompost in organic farming. J. Sci. Food Agric. 2015, 95, 1143–1156. [Google Scholar] [CrossRef] [PubMed]
- Oyege, I.; Balaji Bhaskar, M.S. Effects of Vermicompost on Soil and Plant Health and Promoting Sustainable Agriculture. Soil Syst. 2023, 7, 101. [Google Scholar] [CrossRef]
- Liu, X.; Zhang, J.; Wang, Q.; Chang, T.; Shaghaleh, H.; Hamoud, Y.A. Improvement of Photosynthesis by Biochar and Vermicompost to Enhance Tomato (Solanum lycopersicum L.) Yield under Greenhouse Conditions. Plants 2022, 11, 3214. [Google Scholar] [CrossRef] [PubMed]
- Blouin, M.; Barrere, J.; Meyer, N.; Lartigue, S.; Barot, S.; Mathieu, J. Vermicompost significantly affects plant growth. A meta-analysis. Agron. Sustain. Dev. 2019, 39, 34. [Google Scholar] [CrossRef]
- Wijitkosum, S. Biochar derived from agricultural wastes and wood residues for sustainable agricultural and environmental applications. Int. Soil Water Conserv. Res. 2022, 10, 335–341. [Google Scholar] [CrossRef]
- Alegre, J.C.; Pashanasi, B.; Lavelle, P. Dynamics of Soil Physical Properties in Amazonian Agroecosystems Inoculated with Earthworms. Soil Sci. Soc. Am. J. 1996, 60, 1522–1529. [Google Scholar] [CrossRef]
- Lehmann, J.; Joseph, S. Biochar for Environmental Management Science and Technology, 3rd ed.; Earthscan: London, UK, 2009; pp. 211–215. [Google Scholar]
- Ramesh, K.; Reddy, D.D. Zeolites and Their Potential Uses in Agriculture. Adv. Agron. 2011, 113, 219–241. [Google Scholar] [CrossRef]
- Tuong, P.; Bouman, B.A.M.; Mortimer, M. More Rice, Less Water—Integrated Approaches for Increasing Water Productivity in Irrigated Rice-Based Systems in Asia. Plant Prod. Sci. 2005, 8, 231–241. [Google Scholar] [CrossRef]
- Mboyerwa, P.; Kibret, K.; Mtakwa, P.; Aschalew, A. Evaluation of Growth, Yield, and Water Productivity of Paddy Rice with Water-Saving Irrigation and Optimization of Nitrogen Fertilization. Agronomy 2021, 11, 1629. [Google Scholar] [CrossRef]
- Hussain, S.; Hussain, S.; Aslam, Z.; Rafiq, M.; Abbas, A.; Saqib, M.; Rauf, A.; Hano, C.; El-Esawi, M.A. Impact of Different Water Management Regimes on the Growth, Productivity, and Resource Use Efficiency of Dry Direct Seeded Rice in Central Punjab-Pakistan. Agronomy 2021, 11, 1151. [Google Scholar] [CrossRef]
Disclaimer/Publisher’s Note: The statements, opinions and data contained in all publications are solely those of the individual author(s) and contributor(s) and not of MDPI and/or the editor(s). MDPI and/or the editor(s) disclaim responsibility for any injury to people or property resulting from any ideas, methods, instructions or products referred to in the content. |
© 2025 by the authors. Licensee MDPI, Basel, Switzerland. This article is an open access article distributed under the terms and conditions of the Creative Commons Attribution (CC BY) license (https://creativecommons.org/licenses/by/4.0/).