Abstract
This study evaluated the impact of biochar on the growth of strawberry plants, combining visual and proximal sensing monitoring. The plants were rooted in soil enriched with biochar, derived from pyrolysis of soft wood at 550 °C and applied in two doses (2 and 15 g/L), and after physical activation with CO2 at 900 °C; there was also a treatment with no biochar (unaltered). Visual monitoring was based on data logging twice per week of plants’ height and number of flowers and ripe fruits. Proximal sensing monitoring involved a system including a low-cost multispectral camera and a Raspberry Pi 4. The camera acquired nadiral images hourly in three spectral bands (550, 660, and 850 nm), allowing calculation of the normalized difference vegetation index (NDVI). After three months, control plants reached a height of 12.3 ± 0.4 cm, while those treated with biochar and activated biochar grew to 18.03 ± 1.0 cm and 17.93 ± 1.2 cm, respectively. NDVI values were 0.15 ± 0.11 for control plants, increasing to 0.26 ± 0.03 (+78%) with biochar and to 0.28 ± 0.03 (+90%) with activated biochar. In conclusion, biochar application was beneficial for strawberry plants’ growth according to both visual and proximal-sensed measures. Further research is needed to optimize the integration of visual and proximal sensing monitoring, also enhancing the measured parameters.
1. Introduction
Sustainable agriculture aims to produce enough food to fulfill current demands without endangering the needs of future generations. This paradigm is founded on preserving biodiversity, using natural resources responsibly, and minimizing the negative effects of agricultural activities on the environment [1,2,3]. Practices like crop rotation, use of organic fertilizers, effective water management, and the use of natural pest control methods are all encouraged. Sustainable agriculture helps rural communities and strengthens agricultural systems’ resistance to climate change, also balancing environmental preservation, social equality, and crop production. By 2050, the integration of the circular economy into agricultural systems will support Europe in becoming the first carbon-neutral continent [1,4,5].
Biofertilizers and soil conditioners provide a sustainable alternative to mineral fertilizers, helping to improve soil fertility without the negative effects associated with excessive use of chemicals [6,7,8]. Intensive application of chemical fertilizers has led to increased soil degradation, including loss of organic matter [9]. Biofertilizers enhance soil microbial health, improving its capacity to retain water and nutrients. They also help to decrease greenhouse gas emissions and prevent groundwater pollution, promoting sustainable and efficient agricultural systems. Biochar is a carbon-rich material obtained through the pyrolysis of biomass [10], and its characteristics depend on pyrolysis conditions and feedstock [11]. In recent years, biochar application as soil conditioner has gained increasing interest due to numerous benefits for soil health and agricultural productivity. Biochar improves soil structure, enhancing water retention and the availability of essential nutrients for plants [12,13,14,15]. Additionally, it promotes the growth of beneficial microorganisms, reducing the need for chemical fertilizers and contributing to climate change mitigation through long-term carbon sequestration. Biochar has also been shown effective in the reduction of weeds, managing to preserve and improve the environment for the growth of native plants [11,13]. Regional differences in soil type and climate can cause variability when examining the benefits of biochar as soil amendment [16].
A literature survey on biochar application as soil amendment, identifying feedstock, pyrolysis conditions, dose, and crop, was carried out (Table 1) [17,18,19,20,21,22,23,24]. The search strategy employed the keywords “biochar” AND “dose” AND “cultivation” in the Scopus database, with results filtered to include only recent studies (published from 2022) that reported biochar application rates in units of tons per hectare (t/ha) and including control groups. These were key selection criteria to identify literature data for consistent comparison. The reported biochars derived from different feedstocks, such as eucalyptus [17], coffee pulp [18,19], sewage sludge [20], olive mill waste [20], grass [21], wood [21,22], coconut [23], and tomato [24], were obtained at different pyrolysis temperatures (mostly between 400 °C and 500 °C) [18,19,20,21], and different doses were supplemented to soil (in the range from 1–2 t/ha up to 30–40 t/ha, with 12 t/ha as the median value) to grow crops such as rice [17], coffee [18], peppers [19,22], tomato [20,23], and lettuce [22,24]. Biochar improved soil quality [17,18,19,20,21,23], and greater plant production yield was observed with higher biochar doses [17,18,19,20,21], except in one study with a lower dose [22], or no positive effects on the fresh mass of the plants were observed [17,24]. The performed literature survey allowed identifying two knowledge gaps. Firstly, the effect of the same biochar applied at different doses (expressed in t/ha) to the same plant and soil was not explored. Secondly, the effect of biochar activation on its application in agriculture has not yet been evaluated. A study [25] compared the effect of biochars derived from peanut, cocoa, and rice husk dosed at different % by volume of soil (with no overall effect on plant growth) on the cultivation of onion, therefore this study was not included in Table 1.

Table 1.
Overview of previous studies on the application of biochar in agriculture (N.A.: not available in t/ha but expressed as % by volume).
Remote and proximal sensing are widely employed in precision agriculture for vegetation monitoring and plant phenotyping and assessment of soil moisture level, plant stress conditions, and growth dynamics [25,26,27,28]. Remote sensing typically involves the use of multispectral sensors mounted on aerial or satellite platforms for large-scale data acquisition [27]. It has been successfully applied for the investigation of soil salinity and its effects on crop development, such as in barley cultivation [28]. On smaller scales, such as individual agricultural plots or cooperatives, remote sensing has been effectively applied to support farmers, with field data collected manually to validate the remotely acquired information, for example, in sugarcane fields [29]. In contrast, proximal sensing refers to sensor systems positioned at close range to the target, either statically (e.g., in greenhouse environments) or dynamically (e.g., mounted on ground vehicles). Proximal sensing is particularly advantageous in controlled environments such as greenhouses, where it enables continuous and automated monitoring of crop status [30]. This approach reduces the reliance on manual inspection while enhancing measurement objectivity and consistency across time. In many cases, it facilitates real-time decision making and improves the efficiency of crop management protocols.
Multispectral sensors are commonly employed in both remote and proximal sensing configurations, as they can capture reflectance data across key spectral bands of the electromagnetic spectrum relevant to plant physiological processes. Photosynthetic pigments (as chlorophyll) exhibit strong absorption in the red spectral region and low absorption in the near-infrared (NIR) region. This spectral behavior is critical for monitoring photosynthetic activity [31]. Although the entire photosynthetically active radiation range (400–700 nm) contributes to photosynthetic function, specific spectral signatures are leveraged to compute vegetation indices [31,32,33,34]. These indices mathematically quantify the physiological status of vegetation and are widely applied in both remote and proximal sensing applications. Among them, the normalized difference vegetation index (NDVI), which correlates indirectly with the photosynthetic capacity of the plants, is one of the most widely adopted indicators for assessing photosynthetic performance and vegetative vigor [35].
As far as the authors are aware, the direct application of proximal sensing techniques for the monitoring of biochar impacts on crops and soil properties remains underexplored in the existing literature, as the influence of biochar has been only studied using high-resolution red–green–blue multispectral images and thermal sensors mounted on unmanned aerial vehicles in chicory cultivation [36], enabling the generation of high-frequency, detailed remote sensing data.
This manuscript has as its main goal and novelty the investigation of the effect of biochar as soil conditioner on the growth of strawberry plants through the integration of visual and proximal sensing monitoring. This combined approach provides a comprehensive evaluation of vegetative development conditions, offering a unique perspective on plant health and development driven by biochar application. A proximal sensing monitoring system with overhead data collection offered continuous, non-invasive observation of strawberry plants’ growth, enabling precise tracking of development patterns, early detection of stress, and improved data accuracy across the growth cycle. Manual monitoring was also essential to validate and calibrate the remotely collected data, ensuring reliability and robustness of the overall monitoring approach. The study assessed strawberry plant growth under different doses of softwood biochar, combining traditional visual observations with multispectral proximal sensing. Another novelty of this study is the investigation of the net effect of physical activation of biochar on its influence on strawberry plants’ growth. Specifically, physical activation in CO2 at 900 °C improves biochar morphology and physical properties, e.g., specific surface area, pore volume, and dimension, and eliminates volatile components. Biochar activation is commonly applied when biochar is employed as an adsorbent [37] or additive for anaerobic digestion processes [38], and to the best of our knowledge, this is the first study addressing the effect of biochar activation within its application as soil amendment.
2. Materials and Methods
2.1. Materials and Experimental Setup
The biochar involved in this study is a standard biochar identified as SWP550 (Figure 1) and produced at the UK Biochar Research Centre of the University of Edinburgh (https://www.biochar.ac.uk, (accessed on 15 July 2025)) from the pyrolysis of soft wood pellets in a pilot-scale rotary kiln unit (550 °C, heating rate 78 °C/min, residence time 12 min). The biochar yield of the process is 21.89 wt%. Physical activation with CO2 at 900 °C for 2 h happened at the Institute for Chemicals and Fuels from Alternative Resources (ICFAR) of Western University, Canada (https://icfra.com/, (accessed on 15 July 2025)).
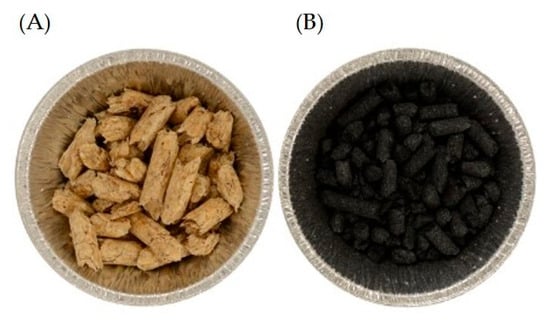
Figure 1.
(A) Soft wood pellets and (B) resulting biochar produced at the UK Biochar Research Centre of the University of Edinburgh, UK.
The effectiveness of biochar as a biostimulant depends on key physicochemical properties such as its porosity, surface area, nutrient content, and pH (Table 2). High porosity and large surface area enhance water retention and microbial colonization, while the presence of essential nutrients (e.g., potassium, phosphorus, calcium) directly contributes to plant nutrition. Additionally, biochar can help in neutralizing acidic soils, thus improving overall soil health [21]. Comparing the characteristics of the biochar involved in this study with the ones considered in the studies listed in Table 1, the here-applied biochar exhibited lower ash and K contents [20] and pH within the reported range [20,24].
Table 2.
Characteristics and soil enhancement properties of soft wood pellet biochar SWP550 (source: UK Biochar Research Centre and [39]).
The biochar was supplemented at two different doses based on the mean and median value of the literature results (Table 1) identifying: 2 g of biochar per 1 L pot (corresponding to 2 t/ha) and 15 g of biochar per 1 L pot (corresponding to 12 t/ha) to commercial garden soil (pH 5, electrical conductivity 0.3 dS/m, porosity 92% v, dry bulk density 150 kg/m3). The doses mentioned in Table 1 refer to biochar application in the field, while in this study the same doses were adapted to 1 L pots assuming a 1875 kg/m3 density for the soil. Biochar was supplemented considering unaltered and physically activated biochar for each dose. The samples were identified accordingly as SW2, SW2a, SW15, SW15a, and C (control, i.e., no biochar). Three replicates were involved for each treatment, resulting in 12 pots in total.
Perennial strawberry plants (Fragaria × ananassa) (Figure 2A) were grown in 1 L pots filled with the mentioned biochar–garden soil mixtures and placed in a laboratory-scale greenhouse located in the open air at DIATI, Politecnico di Torino, Italy (Figure 2B). The volume of garden soil necessary to fill each pot was mixed in a container with biochar and then used to transplant the strawberry plants at the beginning of the test. To provide protection from sunlight and rain, a PVC sheet was placed on the top of the greenhouse. Each pot was connected to an automatic drip irrigation system (WD-01BDE Dual path, 30 PSI, 0.8 L/min for 1 min 2 times per day) to ensure consistent watering throughout the monitoring period.
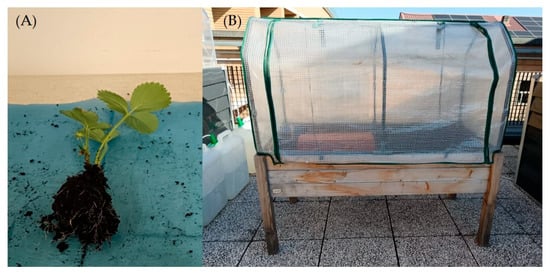
Figure 2.
(A) Perennial strawberry Fragaria ananassa plants and (B) lab-scale greenhouse.
2.2. Visual and Proximal Sensing Monitoring
The plants’ growth was observed for three months, from May to July. Visual monitoring involved measurements of the height of the plants (i.e., distance from the soil to the top of the longest leaf) [40], number of flowers, and number of ripe fruits. The measurements happened twice per week, for a total of 23 measurements multiplied by 3 parameters.
Proximal sensing monitoring was based on an automated low-cost system specifically designed for this study and installed inside the greenhouse. The system (Figure 3) consisted of a MAPIR Survey 3W multispectral camera (MAPIR, Beaumont, TX, USA) and a Raspberry Pi 4 computer board (Raspberry Pi Ltd., Cambridge, UK) for automatic and continuous Wi-Fi-based data logging. The camera was installed on the top of the greenhouse to capture all the 12 pots in a single nadiral image. The camera has a 12 MP sensor acquiring data every hour in three spectral bands with an 87° field of view. The images contain spectral response values in the red, green, and near-infrared portions of the electromagnetic spectrum (550, 660, and 850 nm). These, compared to reference images, allowed the calculation of the normalized difference vegetation index (NDVI) [35] to estimate the plants’ photosynthetic capacity and therefore their health.
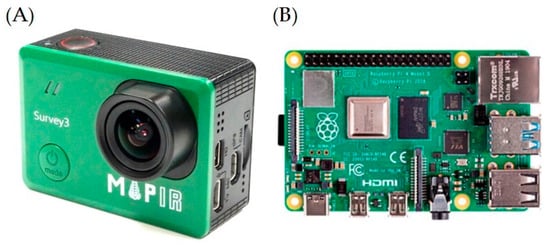
Figure 3.
Details of the low-cost proximal sensor system installed for remote monitoring: (A) spectral camera and (B) and Raspberry Pi 4 computer board. Picture not scaled.
Specifically, the acquired images were initially filtered by time of day. The image closest to 12:00 p.m. was selected to ensure maximum solar irradiance for every day of the week. The camera captures both JPEG and RAW image formats. The selected images were then radiometrically calibrated. The raw images were used for calibration through a code based on the one developed and distributed by MAPIR (version MCC 20250324) (https://www.mapir.camera/) but modified to allow manual selection of reference areas for DN 0 (black) and DN 1 (white). This modification enables avoiding selecting leaves accidentally placed on the calibration panel or other elements in the scene that are present when the panel is absent. The calibrated images were then used to compute the NDVI, calculated as the normalized difference between the NIR and red bands. Subsequently, one image per week was selected, and strawberry leaves were manually segmented within each image. Leaf edges were avoided, and each segmented area was assigned to its corresponding biochar treatment. The segments, saved in shapefile format and in local coordinate systems, were then used in R to calculate aggregated statistics (i.e., average NDVI values in time per treatment group). This process was carried out partly using the statistical analysis software R (version 4.3.2) and partly using QGIS (Version 3.34) for the manual segmentation.
2.3. Sensitivity Analysis
To statistically evaluate the differences among treatments, statistical tests were applied to the experimental data. Firstly, a one-way analysis of variance (ANOVA) was applied to compare all treatment groups, including the control. Subsequently, a two-way ANOVA with replication was implemented to assess the individual and interactive effects of the two experimental factors: biochar type (activated vs. non-activated) and biochar dose (2 g/L vs. 15 g/L); for this reason, the two-way ANOVA was applied only to treatments with biochar. The statistical analyses were performed using Microsoft Excel, and significance was evaluated at a 95% confidence level (p < 0.05). Also, Pearson’s correlation test was performed to assess potential relationships among couples of independent and dependent variables.
3. Results and Discussion
3.1. Visual Monitoring
Visual monitoring involved the measurement twice per week of the height of each plant and of the number of flowers and ripe strawberries. For each measurement, the pots were taken out of the greenhouse and then placed back in the same position. Figure 4 shows pictures of the plants during the monitoring period. It can be noticed that, since the test was performed between May and July, corresponding to a hot climate in Italy, the position of the control pots (C) allowed better air circulation compared to the pots supplemented with biochar and located behind.
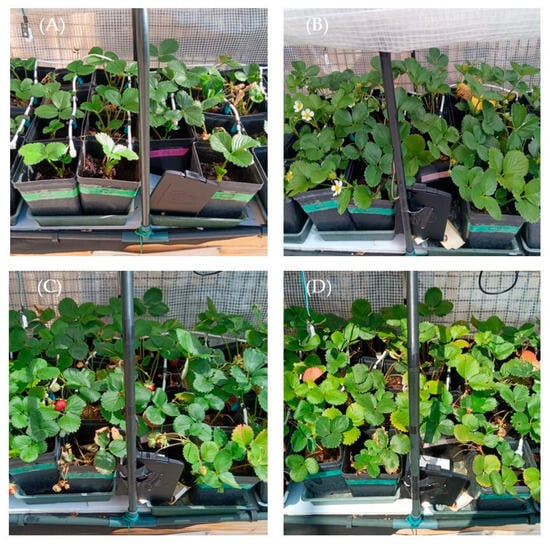
Figure 4.
Details of plants’ growth throughout the experiment at (A) the beginning of the test, (B) after 2 weeks, (C) after 3 weeks, and (D) after 9 weeks.
Some comments may arise analyzing the experimental data at different levels of detail, e.g., comparing the control plants with aggregated data measured in plants growing with biochar independently of activation and dose, or considering the detailed data measured for plants growing in pots supplemented with activated or unaltered biochar at different doses. Considering the plants’ height, compared to control plants, the net increments in plants’ height with respect to the beginning of the tests in pots supplemented with biochar (aggregated data independent of activation or dose) (Figure 5A), it was evident that biochar led to taller plants (+8.3 ± 1.1 cm after 3 months) (+5.3 ± 0.4 cm). During the monitoring period, the plants growing in pots supplemented with biochar exhibited a net growth equal to +17% after one month, +9% after two months, and +11% after three months compared to the control group. These results, showing a slight positive effect of biochar addition on plants’ height, are aligned with previous studies exploring the effect of biochar on strawberries’ cultivation, which were mostly focused on morphological and physiological features of fruits [10,41].
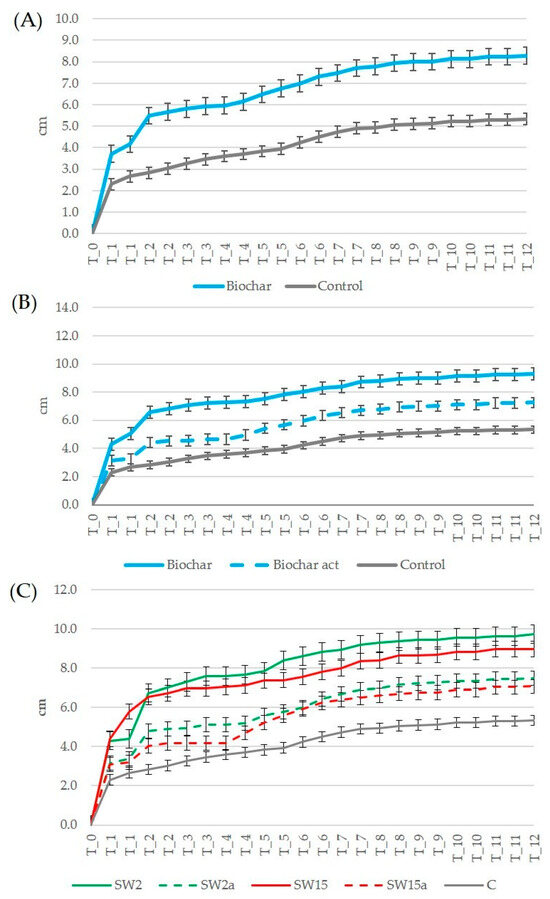
Figure 5.
Trends of net increment (cm) in plants’ height: (A) comparison of plants supplemented with biochar (unaltered and activated) and control plants; (B) comparison of plants supplemented with biochar, activated biochar and control plants; (C) comparison of plants supplemented with different doses of biochar and control plants (SW2: unaltered biochar 2 g/pot, SW2a: activated biochar 2 g/pot, SW15: unaltered biochar 15 g/pot, SW15a: activated biochar 15 g/pot, C: control plants, T_0 to T_12: monitoring period from time 0 to 12 weeks).
Considering the height of plants growing with unaltered biochar, activated biochar, and the control group (Figure 5B), it was clear after one month that the net height increase compared to control plants was +35% for plants growing with unaltered biochar and +30% for plants supplemented with activated biochar. After three months, the net increase compared to control plants was +30% and +8% in the presence of unaltered and activated biochar, respectively. About the influence of biochar activation and dose on the net increment of plants’ height (Figure 5C), in all cases biochar led to a net increase in plants’ height compared to control plants. The largest net increase compared to control plants was observed with the higher dose of biochar (+54% for SW15 and +48% for SW15a on average over the three months), and the lower dose of biochar led to a slightly minor net increase (+41% for SW2 and +46% for SW2a on average over the three months). However, compared to control plants, after the first month the positive effect of unaltered biochar on the net increment of plants’ height was larger for the lower dose SW2 (+88%) compared to SW15 (+64%), while those of SW2a and SW15a were +48% and +34%, respectively. In summary, biochar exhibited a positive effect on plants’ height, more evident without activation and particularly in the first month of the monitoring period at a lower dose and after three months at a higher dose.
Regarding the count of flowers, the weekly measurements were based on the situation at the time of the measurement, e.g., the number of flowers in each week may include flowers from the previous week if those had not yet produced fruits. In addition, the analysis of the replicates for each treatment showed that often only one plant of the three replicates displayed flowers. Consequently, the data related to number of flowers exhibited a relatively high standard deviation. Analyzing the number of flowers at the end of the first month, an earlier onset of flowering was clearly observed in plants treated with biochar compared to the control group (Figure 6A), consistent with previous findings [42]. In this study, compared to control group, the flower counts after one month increased by 100% and 67% in treatments with unaltered and activated biochar, respectively. After 10 weeks, the increase in flower number was 83% in plants treated with unaltered biochar and 67% with activated biochar (Figure 6B). After three months, no flowers were present on any plant. Considering the effect of different biochar doses on flowers’ development (Figure 6C), on average the greatest increase in flowering was observed with the high-dose treatments, with +69% for SW15 and +25% for SW15a. The supplement of low-dose unaltered biochar (SW2) resulted in a modest +6% increase, whereas a slight decrease (−6%) was recorded for the low-dose activated treatment (SW2a). From week 9 onward, only the biochar-treated plants produced a second round of flowers.
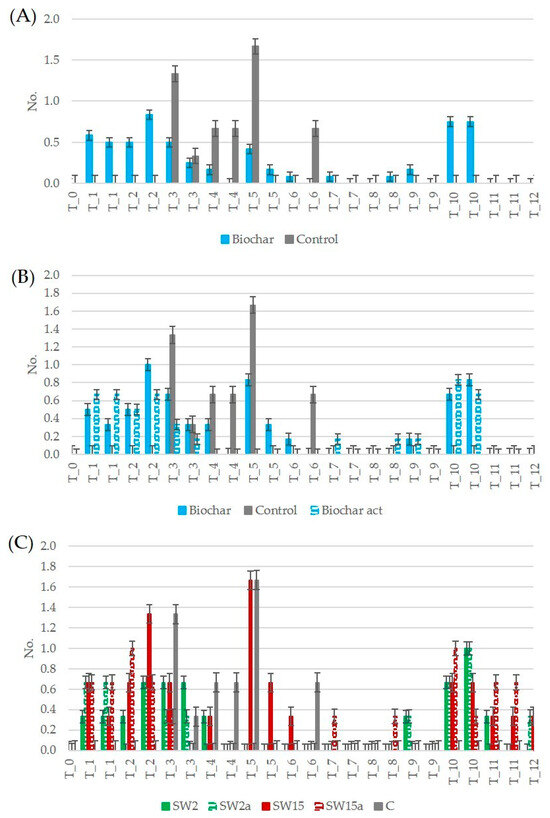
Figure 6.
Trends of number of flowers: (A) comparison of plants supplemented with biochar (unaltered and activated) and control plants; (B) comparison of plants supplemented with biochar, activated biochar and control plants; (C) comparison of plants supplemented with different doses of biochar and control plants (SW2: unaltered biochar 2 g/pot, SW2a: activated biochar 2 g/pot, SW15: unaltered biochar 15 g/pot, SW15a: activated biochar 15 g/pot, C: control plants, T_0 to T_12: monitoring period from time 0 to 12 weeks).
The analysis of the number of fruits was made by observing all the fruits but counting only the ripe ones [40]. The data shown in Figure 7 therefore refer to the fruits that became red and were harvested between weeks 3 and 8. In plants treated with biochar, fruits ripened approximately one week earlier than in the control (Figure 7A), with an average of 0.22 ± 0.21 fruits harvested per plant over the period. When comparing treatments considering biochar activation (Figure 7B), plants amended with unaltered biochar showed fruit production similar to the control group, whereas those treated with activated biochar exhibited a 30% increase in ripe fruit yield after the first month. Fruit ripening began one week earlier (at week 3) in plants supplemented with activated biochar compared to the control group. Looking at dosage effects (Figure 7C), the plants growing in unaltered biochar at a high dose (SW15) showed a 31% increase in ripe fruit production compared to the control over the entire period. The supplementation of low-dose unaltered biochar (SW2) yielded the lowest results, on average −31% for the activated biochar and −13% for the unaltered biochar vs. control plants. Activated biochar treatments showed lower yields with a −13% drop for the low dose (SW2a).
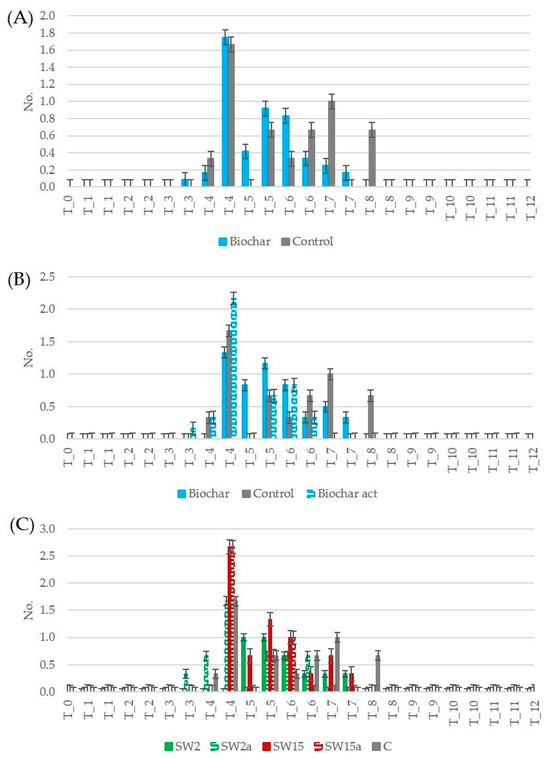
Figure 7.
Trends of number of ripe fruits: (A) comparison of plants supplemented with biochar (unaltered and activated) and control plants; (B) comparison of plants supplemented with biochar, activated biochar and control plants; (C) comparison of plants supplemented with different doses of biochar and control plants (SW2: unaltered biochar 2 g/pot, SW2a: activated biochar 2 g/pot, SW15: unaltered biochar 15 g/pot, SW15a: activated biochar 15 g/pot, C: control plants, T_0 to T_12: monitoring period from time 0 to 12 weeks).
3.2. Proximal Sensing Monitoring
The average data for weather conditions during the experiments refer to the Meteorological Observatory of the University of Turin (Lat: 45°03 07,15 N, Long: 007°40 53,30 E, Alt: 254 m at an orthometric height) [43]. The average air temperature in May was 17 °C, the relative humidity was 72%, and the average wind speed was 3.5 m/s. The observed average apparent temperature was 28.6 °C, and the global solar radiation was equivalent to 1276 W/m2. The average air temperature in June was 21.8 °C, the relative humidity was 68%, and the average wind speed was 3.9 m/s. The average apparent temperature was 40.4 °C, and the total solar radiation was equivalent to 1271 W/m2. The average air temperature in July was 26.1 °C, the relative humidity was 63%, and the average wind speed was 4.0 m/s. With a perceived average apparent temperature of 42.1 °C, the global sun radiation was 1227 W/m2. The weather conditions throughout the experiment also underline the fact that environmental stressors, such as high temperatures, probably played a key role in influencing plants’ development, particularly in terms of photosynthetic activity and overall vegetative health. These conditions may have amplified the observable differences among the tested treatments, especially highlighting the potential benefits of biochar in supporting plant resilience. Heat stress has been shown to significantly reduce the photosynthetic rate in strawberry plants [44], potentially impairing their growth, yield, and overall physiological performance due to disruptions in stomatal conductance and chlorophyll efficiency.
Table 3 shows the values of the NDVI across the different treatment classes. Overall, the values calculated for all treatments were higher than for control plants. Increases ranging from 19% (SW2) to 24% (SW15) and up to the highest value obtained for classes treated with activated biochar were observed: +29% for SW2a and SW15a. The increase in NDVI values observed in plants treated with biochar suggests a potential mitigating effect on heat-induced stress, by enhancing water retention and nutrient availability in the soil [45,46]. In general, NDVI was higher for plants supplemented with biochar. In particular, during the whole period of the experiment, NDVI was 0.21 ± 0.03 for control plants, 0.27 ± 0.01 for plants supplemented with activated biochar (+27% compared to control), and 0.25 ± 0.01 for plants supplemented with unaltered biochar (+21% with respect to the control). Regarding biochar dosage, the high and low doses showed similar trends; over the whole period a 26% increase in NDVI (respect to control) with a value of 0.26 ± 0.02 and 0.26 ± 0.01, respectively, for low and high doses.
Table 3.
Mean and Standard Deviation (SD) value of the NDVI throughout the experiment period for control (C), the treatment classes with unaltered biochar at low dose (SW2) and high dose (SW15), and activated biochar at low dose (SW2a) and high dose (SW15a).
Overall, control plants exhibited lower NDVI than plants treated with biochar, regardless of biochar activation (Figure 8A) or dose (Figure 8B). This suggests that photosynthetic activity was reduced in the control group compared to plants treated with biochar. Between the two groups treated with biochar, the plants supplemented with activated biochar exhibited slightly higher NDVI for 8 out of 12 weeks.
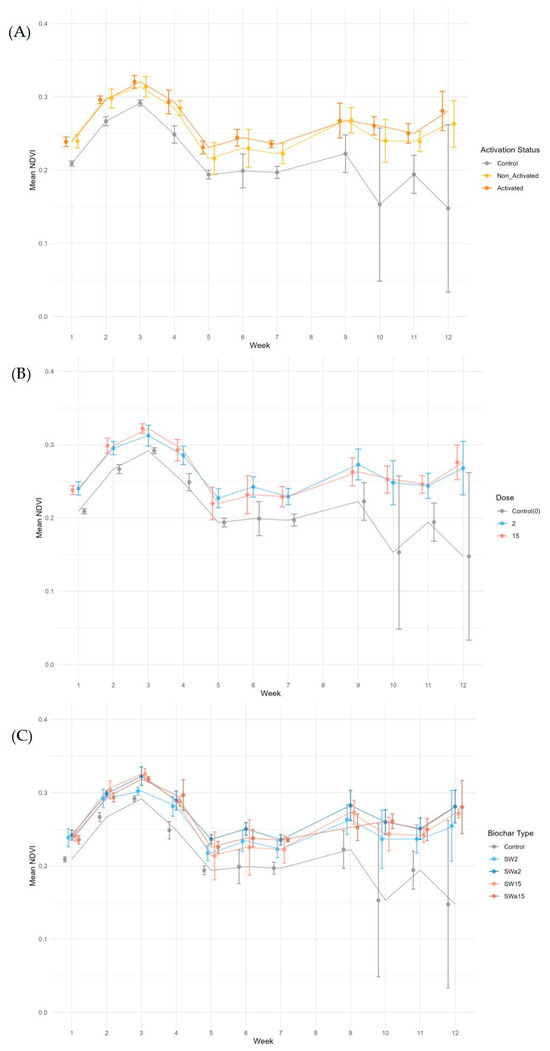
Figure 8.
Trends of NDVI values: (A) comparison of plants supplemented with biochar (unaltered and activated) and control plants; (B) comparison of plants supplemented with biochar and control plants at two different doses (2 g/pot and 15 g/pot); (C) comparison of plants supplemented with different doses of biochar and control plants (SW2: unaltered biochar 2 g/pot, SW2a: activated biochar 2 g/pot, SW15: unaltered biochar 15 g/pot, SW15a: activated biochar 15 g/pot, C: control plants).
Between the two groups treated with biochar, little difference can be noticed between plants treated with the two doses, suggesting that in the considered experimental conditions increasing biochar supplementation did not imply advantages about the photosynthetic activity. The control group exhibited lower NDVI than the plants treated with biochar, regardless of dose or activation (Figure 8C). There is a marked decline in the average NDVI of control plants and an increase in standard deviation in weeks 10 and 12. In both weeks, C1 had a much lower NDVI than C2 and C3, bringing down the average NDVI and increasing the standard deviation of the treatment group. This suggests that photosynthetic activity was significantly reduced in the control group compared to the plants treated with biochar, highlighting the potential of biochar to positively influence photosynthetic performance. This enhancement may be attributed to improved soil aeration, water retention, and nutrient availability, all factors known to support chlorophyll synthesis [47]. Among the groups treated with biochar, differences in NDVI values were minimal during the first month. Starting from week 4, plants treated with activated biochar consistently exhibited slightly higher NDVI values compared to those receiving the same dose of non-activated biochar. This trend suggests a marginal improvement in plant health and photosynthetic efficiency.
3.3. Sensitivity Analysis
The results of the one-way ANOVA showed clear differences in response depending on the variable considered. For plants’ height, the analysis disclosed a high F-value of 41.34, which is substantially greater than the critical F-value 2.45. The associated p-value was 1.93 × 10⁻²¹, indicating a significant effect of the treatments on plants’ height. A significant difference was also observed for NDVI values; the F-value was 4.91, again exceeding the critical value of 2.56, and the p-value was 0.00202, confirming that biochar had a measurable and statistically significant impact on plants’ health as captured through multispectral imaging. In contrast, the variables number of flowers and number of fruits did not show statistically significant differences among treatments. For the number of flowers, the F-value was 0.76 with p-value 0.55244, and for the number of fruits, the F-value was 0.29 with a p-value of 0.88561, both well below their respective critical F-value of 2.45. These results suggest that, while biochar may have influenced plants’ height and photosynthetic performance, it did not significantly affect the reproductive output, at least under the conditions and time frame of this experiment. Overall, the one-way ANOVA results highlight that biochar was effective in promoting strawberry plants’ vegetative growth and physiological performance but not in altering flower or fruit production during the monitoring period. Table 4 presents the statistical data obtained from the one-way ANOVA test, including the p-value, the sum of squares (SQ), degrees of freedom (df), mean squares (MQ), F-value (F), and the critical F-value (F crit). These metrics offer a more comprehensive understanding of the variability within and between treatment groups, and they are necessary for interpreting the significance and strength of the observed differences. In other studies, ANOVA was commonly employed to statistically assess differences between group means and the variability within and between those groups [48,49].
Table 4.
Statistical values derived from the one-way ANOVA test results: p-value, the Sum of squares (SQ), Degrees of Freedom (df), Mean Squares (MQ), F-value (F), and the critical F-value (F crit).
The results of the two-way ANOVA (Table 5) revealed a statistically significant effect of biochar treatments on plants’ height (F = 9.07, p < 0.001), indicating that both activation and dose of biochar influenced the plants’ growth. Additionally, the sampling time had a significant impact (F = 102.93, p < 0.001), suggesting that temporal variation strongly affected plants’ development. No significant interaction was found between treatment and sampling time (F = 0.29, p = 0.94), implying that the response to biochar supplementation was consistent across different sampling times. These results highlight the independent and stable effect of biochar application on enhancing plants’ height under the tested conditions. Sampling time showed a statistically significant effect on flowers’ number (F = 7.07, p = 0.001), and no significant differences were found among treatments (F = 1.04, p = 0.376), indicating that variations in biochar activation and dose did not affect flower production under the tested conditions. The lack of significant interaction (F = 0.53, p = 0.785) confirms that the response in flowers’ number remained consistent across different sampling times regardless of the treatment applied. About the number of ripe fruits, the analysis revealed a significant effect of sampling time on fruits’ number (F = 36.99, p < 0.001), with no statistically significant differences observed among treatments (F = 0.94, p = 0.422), suggesting that neither biochar type nor dose had measurable impact on fruits’ production. The interaction between treatment and sampling time was not significant (F = 1.39, p = 0.220), implying that biochar’s influence was stable across different sampling times. These findings point to a limited role of biochar in modulating fruit yield under the tested conditions, while underscoring the relevance of temporal factors in reproductive outcomes.
Table 5.
Statistical values derived from the two-way ANOVA test results: p-value, the Sum of squares (SQ), Degrees of Freedom (df), Mean Squares (MQ), F-value (F), and the critical F-value (F crit).
The Pearson’s test demonstrated strong positive correlations between plants’ height and biochar supplementation, e.g., r = 0.98 between SW2 and SW2a, SW15 and SW2a, and SW15a and SW2a. High correlation values (r = 0.95) were also found between SW15 and SW15a and between the control sample (C) and SW15 and SW2, suggesting that plants’ height was consistently affected across similar treatments and control conditions. Regarding the number of flowers, the highest correlation (r = 0.79) was observed between SW2a and SW2, indicating a moderately strong relationship. Other correlations were below 0.44, suggesting more variability in flowering among treatments. For the number of fruits, the highest correlation was found between SW15a and SW15 (r = 0.93), followed by SW15a and SW2a (r = 0.87) and SW15 and both SW2a and the control (r = 0.83), highlighting a consistent fruiting pattern at higher biochar dose and with activation. Finally, NDVI values showed strong positive correlations, with r > 0.96 for SW2 vs. SW2a, SW15 vs. SW2, and SW15 vs. SW2a, and r = 0.93 for SW15a vs. SW2, SW2a, and SW15, reflecting similar photosynthetic performance among these treatments. Other NDVI correlations were generally lower (<0.77), indicating that spectral response varied more between less similar treatments. These results overall suggest that activation and dose of biochar influenced plants’ growth and physiological responses in a coherent and dose-dependent manner.
4. Conclusions
This study analyzed the impact of biochar on the growth of strawberry plants, combining visual and proximal sensing monitoring for three months. Biochar was supplemented to commercial garden soil in two doses (2 and 15 g/L), as unaltered material and after physical activation. In general, biochar application exhibited better yields than control plants for all parameters analyzed. At the end of the experiment, the height of the plants was 45% higher with biochar (unaltered or activated) compared to the control group. Biochar led to earlier flowering, and this was also mirrored in the ripening of fruits. The number of harvested fruits was superior (+31%) with a higher dose of biochar compared to the control group. The normalized difference vegetation index (NDVI), related to the plants’ health, was greater for all plants supplemented with biochar compared to the control group. An ANOVA demonstrated significant influence of biochar on plants’ height, whereas flower and fruit development were predominantly affected by time, with no evident effect related to biochar type or dose.
Based on the achieved results, the use of biochar as a soil supplement in agricultural practices is promising. Future research is necessary to validate these results by exploring different plants and types and doses of biochar and integrating sensors to measure environmental parameters (e.g., temperature, air and soil moisture, sunlight intensity, etc.) into the proximal monitoring system. The use of standard biochar is recommended to enable replicability.
Author Contributions
Conceptualization, S.F. and M.P.; methodology, S.F., M.P. and I.O.; validation, I.O. and K.N.S.; formal analysis, I.O. and K.N.S.; investigation, I.O. and K.N.S.; data curation, I.O., E.B. and K.N.S.; writing—original draft preparation, I.O.; writing—review and editing, I.O., K.N.S., E.B., R.F., M.P. and S.F.; visualization, I.O.; supervision, S.F. and M.P.; project administration, S.F., M.P. and R.F.; funding acquisition, S.F., M.P. and R.F. All authors have read and agreed to the published version of the manuscript.
Funding
This study was carried out within the Agritech National Research Center and received funding from the European Union Next-GenerationEU (PIANO NAZIONALE DI RIPRESA E RESILIENZA (PNRR)–MISSIONE 4 COMPONENTE 2, INVESTIMENTO 1.4–D.D. 1032, 17 June 2022, CN00000022). This manuscript reflects only the authors’ views and opinions, neither the European Union nor the European Commission can be considered responsible for them.
Data Availability Statement
Data will be made available on request.
Acknowledgments
The contribution of Nicola Dilillo in assisting with the processing and analysis of data acquired through remote monitoring was invaluable to the success of this study.
Conflicts of Interest
The authors declare no conflicts of interest.
Abbreviations
The following abbreviations are used in this manuscript:
| PVC | Polyvinyl chloride |
| NDVI | Normalized difference vegetation index |
| C | Strawberry plant control |
| SW2 | Strawberry plant treated with unaltered biochar with dose of 2 g/pot |
| SW15 | Strawberry plant treated with unaltered biochar with dose of 15 g/pot |
| SW2a | Strawberry plant treated with activated biochar with dose of 2 g/pot |
| SW15a | Strawberry plant treated with activated biochar with dose of 15 g/pot |
| ANOVA | Analysis of variance test |
References
- European Commission. Available online: https://commission.europa.eu/strategy-and-policy/priorities-2019-2024/european-green-deal (accessed on 15 July 2025).
- Marques Filho, A.C.; Santana, L.S.; Martins, M.B.; Guimarães Júnnyor, W.d.S.; Medeiros, S.D.S.d.; Lanças, K.P. Straw Cover and Tire Model Effect on Soil Stress. AgriEngineering 2025, 7, 263. [Google Scholar] [CrossRef]
- Wang, Z.; Xiao, S.; Wang, J.; Parab, A.; Patel, S. Reinforcement Learning-Based Agricultural Fertilization and Irrigation Considering N2O Emissions and Uncertain Climate Variability. AgriEngineering 2025, 7, 252. [Google Scholar] [CrossRef]
- Yan, F. Agricultural biomass wastes and their resource utilization technologies: A review. Biomass Bioenergy 2025, 203, 108291. [Google Scholar] [CrossRef]
- Le, L.; Reddy, V.R.; Jin, J.; Rahut, D.B. Circular economy and sustainable agriculture ecosystems a case of hybrid paper mulberry in the Yellow River Basin, China. Discov. Sustain. 2025, 6, 448. [Google Scholar] [CrossRef]
- Álvarez-González, A.; Castro, I.M.; Ortiz, A.; Díez-Montero, R.; Passos, F.; Garfí, M.; Uggetti, E. Environmental and economic benefits of using microalgae grown in wastewater as biofertilizer for lettuce cultivation. Bioresour. Technol. 2025, 424, 132230. [Google Scholar] [CrossRef]
- Bouhzam, I.; Azarkamand, S.; Puig, R.; Bala, A.; Fullana-I.-Palmer, P.; Sazdovski, I.; Mazurenko, B.; Mir, S.; Sani, N.H.; Lopes, I.G.; et al. Assessing environmental impacts of various biofertilizers in Europe: A step toward circular economy transition. Sustain. Prod. Consum. 2025, 56, 460–476. [Google Scholar] [CrossRef]
- Martín-Sanz-Garrido, C.; Revuelta-Aramburu, M.; Santos-Montes, A.M.; Morales-Polo, C. A Review on Anaerobic Digestate as a Biofertilizer: Characteristics, Production, and Environmental Impacts from a Life Cycle Assessment Perspective. Appl. Sci. 2025, 15, 8635. [Google Scholar] [CrossRef]
- Liu, J.; Nauta, J.; van Eekert, M.H.; Chen, W.-S.; Buisman, C.J. Integrated life cycle assessment of biotreatment and agricultural use of domestic organic residues: Environmental benefits, trade-offs, and impacts on soil application. Sci. Total. Environ. 2023, 897, 165372. [Google Scholar] [CrossRef]
- Aali, N.; Ansari, N.A.; Zahedi, S.M. Development of sustainable strawberry production in closed cultivation systems: Effects of bagasse biochar on morphological and physiological attributes, yield and autotoxic changes. J. Environ. Manag. 2024, 371, 123100. [Google Scholar] [CrossRef]
- Das, S.K.; Ghosh, G.K.; Avasthe, R. Application of biochar in agriculture and environment, and its safety issues. Biomass Conv. Bioref. 2023, 13, 1359–1369. [Google Scholar] [CrossRef]
- De Tender, C.A.; Debode, J.; Vandecasteele, B.; D’hOse, T.; Cremelie, P.; Haegeman, A.; Ruttink, T.; Dawyndt, P.; Maes, M. Biological, physicochemical and plant health responses in lettuce and strawberry in soil or peat amended with biochar. Appl. Soil Ecol. 2016, 107, 1–12. [Google Scholar] [CrossRef]
- Babu, S.; Singh, R.; Kumar, S.; Rathore, S.S.; Yadav, D.; Yadav, S.K.; Yadav, V.; Alam Ansari, M.; Das, A.; Rajanna, G.A.; et al. Biochar implications in cleaner agricultural production and environmental sustainability. Environ. Sci. Adv. 2023, 2, 1042–1059. [Google Scholar] [CrossRef]
- Graziano, S.; Caldara, M.; Gullì, M.; Cornali, S.; Vassura, I.; Coralli, I.; Pagano, L.; Marmiroli, M.; Donati, M.; Bevivino, A.; et al. Improving the Sustainability of Tomato Production With Biochar and Biofertilizers in Emilia-Romagna, Italy. Soil Use Manag. 2025, 41, e70091. [Google Scholar] [CrossRef]
- Tadayon, M.S.; Mousavi, S.M.; Hosseini, S.M. Salicylic acid and biochar-biofertilizer improve soil fertility, drought tolerance, and fig yield in a semi-arid region. J. Soil Sci. Plant Nutr. 2025, 25, 7496–7510. [Google Scholar] [CrossRef]
- Filiberto, D.M.; Gaunt, J.L. Practicality of Biochar Additions to Enhance Soil and Crop Productivity. Agriculture 2013, 3, 715–725. [Google Scholar] [CrossRef]
- Torchia, D.F.D.O.; van Tol de Castro, T.A.; Tavares, O.C.H.; Souza, C.C.B.; da Silva, H.F.O.; de Moura, O.V.T.; da Silva, K.C.M.; de Souza Rocha, F.; Zonta, E.; García, A.C. Effects of Artisanal Biochar Applied to Rice Cultivation in Fragile Sandy Planosol at Rio de Janeiro (Brazil). J. Soil Sci. Plant Nutr. 2023, 24, 172–189. [Google Scholar] [CrossRef]
- Sánchez-Reinoso, A.D.; Ávila-Pedraza, E.Á.; Lombardini, L.; Restrepo-Díaz, H. The Application of Coffee Pulp Biochar Improves the Physical, Chemical, and Biological Characteristics of Soil for Coffee Cultivation. J. Soil Sci. Plant Nutr. 2023, 23, 2512–2524. [Google Scholar] [CrossRef]
- Kebede, T.; Berhe, D.T.; Zergaw, Y.; Cocozza, C. Effects of Biochar and Compost Application on Soil Properties and on the Growth and Yield of Hot Pepper (Capsicum annuum L.). Appl. Environ. Soil Sci. 2023, 2023, 8546135. [Google Scholar] [CrossRef]
- Lilli, M.A.; Paranychianakis, N.V.; Lionoudakis, K.; Kritikaki, A.; Voutsadaki, S.; Saru, M.L.; Komnitsas, K.; Nikolaidis, N.P. The Impact of Sewage-Sludge- and Olive-Mill-Waste-Derived Biochar Amendments to Tomato Cultivation. Sustainability 2023, 15, 3879. [Google Scholar] [CrossRef]
- Zonayet, M.; Paul, A.K.; Faisal-E.-Alam, M.; Syfullah, K.; Castanho, R.A.; Meyer, D. Impact of Biochar as a Soil Conditioner to Improve the Soil Properties of Saline Soil and Productivity of Tomato. Sustainability 2023, 15, 4832. [Google Scholar] [CrossRef]
- González-Pernas, F.M.; Grajera-Antolín, C.; García-Cámara, O.; González-Lucas, M.; Martín, M.T.; González-Egido, S.; Aguirre, J.L. Effects of Biochar on Biointensive Horticultural Crops and Its Economic Viability in the Mediterranean Climate. Energies 2022, 15, 3407. [Google Scholar] [CrossRef]
- Warzukni, W.; Zaitun, Z.; Jauharlina, J. Changes in soil chemical properties due to the application of young coconut waste biochar and goat manure fertilizer on tomato (Solanum lycopersicum L.) cultivation land. In IOP Conference Series: Earth and Environmental Science; Institute of Physics: London, UK, 2022. [Google Scholar] [CrossRef]
- Asri, F.Ö. Effects of biochar and fertilizer application on soil properties and nutrient status of lettuce. Chil. J. Agric. Res. 2022, 82, 469–483. [Google Scholar] [CrossRef]
- Cedeño, Á.; Saldarriaga, V.; Cedeño, G.; López, G.; Mendoza, J. Effects of Biochar Type on the Growth and Harvest Index of Onion (Allium cepa L.). AgriEngineering 2024, 6, 1568–1580. [Google Scholar] [CrossRef]
- Pérez-Pérez, C.A.; Viejo, C.G.; Fuentes, S.; Valiente-Banuet, J.I. Vineyard proximal sensing using multispectral imaging to evaluate grape ripening and quality traits using artificial neural networks modeling. J. Agric. Food Res. 2025, 23, 102252. [Google Scholar] [CrossRef]
- Jennewein, J.S.; Davis, B.W.; Seehaver-Eagen, S.; Nicolette, J.; Pittman, J.; Hively, W.D.; Goldsmith, A.; Hidalgo, C.; Reberg-Horton, C.; Mirsky, S.B. Multi-sensor proximal remote sensing for cover crop biomass estimation at high and moderate spatial resolutions. Smart Agric. Technol. 2025, 12, 101201. [Google Scholar] [CrossRef]
- Ndlovu, H.S.; Odindi, J.; Sibanda, M.; Mutanga, O. Multi-temporal analysis of taro crop water stress using high-resolution thermal and multispectral proximal sensing for improved resilience of smallholder farming systems. Smart Agric. Technol. 2025, 12, 101337. [Google Scholar] [CrossRef]
- Tao, H.; Xu, S.; Tian, Y.; Li, Z.; Ge, Y.; Zhang, J.; Wang, Y.; Zhou, G.; Deng, X.; Zhang, Z.; et al. Proximal and remote sensing in plant phenomics: 20 years of progress, challenges, and perspectives. Plant Commun. 2022, 14, 100344. [Google Scholar] [CrossRef] [PubMed]
- Schuster, J.; Hagn, L.; Mittermayer, M.; Maidl, F.-X.; Hülsbergen, K.-J. Using Remote and Proximal Sensing in Organic Agriculture to Assess Yield and Environmental Performance. Agronomy 2023, 13, 1868. [Google Scholar] [CrossRef]
- Luo, Z.; Deng, M.; Tang, M.; Liu, R.; Feng, S.; Zhang, C.; Zheng, Z. Estimating soil profile salinity under vegetation cover based on UAV multi-source remote sensing. Sci. Rep. 2025, 15, 2713. [Google Scholar] [CrossRef]
- Alemán-Montes, B.; Serra, P.; Zabala, A.; Masó, J.; Pons, X. A near real-time spatial decision support system for improving sugarcane monitoring through a satellite mapping web browser. Smart Agric. Technol. 2025, 12, 101084. [Google Scholar] [CrossRef]
- Bånkestad, D.; Wik, T. Growth tracking of basil by proximal remote sensing of chlorophyll fluorescence in growth chamber and greenhouse environments. Comput. Electron. Agric. 2016, 128, 77–86. [Google Scholar] [CrossRef]
- Dilillo, N.; Sanna, A.; Belcore, E.; Smith, K.; Piras, M.; Montrucchio, B.; Ferrero, R. Enhancing lettuce classification: Optimizing spectral wavelength selection via CCARS and PLS-DA. Smart Agric. Technol. 2025, 11, 100962. [Google Scholar] [CrossRef]
- Wei, Z.; Fang, W. UV-NDVI for real-time crop health monitoring in vertical farms. Smart Agric. Technol. 2024, 8, 100462. [Google Scholar] [CrossRef]
- Dehkordi, R.H.; Denis, A.; Fouche, J.; Burgeon, V.; Cornelis, J.T.; Tychon, B.; Gomez, E.P.; Meersmans, J. Remotely-sensed assessment of the impact of century-old biochar on chicory crop growth using high-resolution UAV-based imagery. Int. J. Appl. Earth Obs. Geoinf. 2020, 91, 102147. [Google Scholar] [CrossRef]
- Lee, H.; Fiore, S.; Berruti, F. Adsorption of methyl orange and methylene blue on activated biocarbon derived from birchwood pellets. Biomass Bioenergy 2024, 191, 107446. [Google Scholar] [CrossRef]
- Chiappero, M.; Fiore, S.; Berruti, F. Impact of biochar on anaerobic digestion: Meta-analysis and economic evaluation. J. Environ. Chem. Eng. 2022, 10, 108870. [Google Scholar] [CrossRef]
- Chiappero, M.; Cillerai, F.; Berruti, F.; Mašek, O.; Fiore, S. Addition of different biochars as catalysts during the mesophilic anaerobic digestion of mixed wastewater sludge. Catalysts 2021, 11, 1094. [Google Scholar] [CrossRef]
- Graber, E.R.; Harel, Y.M.; Kolton, M.; Cytryn, E.; Silber, A.; David, D.R.; Tsechansky, L.; Borenshtein, M.; Elad, Y. Biochar impact on development and productivity of pepper and tomato grown in fertigated soilless media. Plant Soil 2010, 337, 481–496. [Google Scholar] [CrossRef]
- Song, Z.; Yan, D.; Fang, W.; Zhang, D.; Jin, X.; Li, Y.; Wang, Q.; Wang, G.; Li, Q.; Cao, A. Response of Strawberry Fruit Yield, Soil Chemical and Microbial Properties to Anaerobic Soil Disinfestation with Biochar and Rice Bran. Agriculture 2023, 13, 1466. [Google Scholar] [CrossRef]
- Yuan, J.; Liang, X.; Yang, X. Impact of Biochar on the Flowering and Growth of Strawberry Varied with Different Pyrolysis Temperatures. J. Plant Growth Regul. 2025, 44, 4155–4164. [Google Scholar] [CrossRef]
- University of Turin. Meteorological Observatory. Available online: https://www.meteo.dfg.unito.it/m/previsioni/mese-5-2024 (accessed on 15 July 2025).
- Kadir, S.; Sidhu, G.; Al-Khatib, K. Strawberry (Fragaria ×ananassa Duch.) growth and productivity as affected by temperature. HortScience 2006, 41, 1423–1430. [Google Scholar] [CrossRef]
- Pan, Y.; Wang, D.; Tan, T.; An, J.; Jin, X.; Zou, H.; Zhang, Y.; Yu, N.; Siddique, K.H. Effect of organic amendments on soil organic carbon fractions, water retention, and mechanical properties in a Chinese Alfisol. Soil Tillage Res. 2025, 254, 106723. [Google Scholar] [CrossRef]
- Yang, P.; Xu, H.; Yu, M.; Yamsomphong, K.; Setyawan, M.I.B.; Takahashi, F. Enhancing water retention performance of biochar modified by alkali-treated coal fly ash: Pyrolysis behavior, field simulation, and metal leaching assessment. Environ. Technol. Innov. 2025, 39, 104306. [Google Scholar] [CrossRef]
- Zheng, C.; Abd-Elrahman, A.; Whitaker, V. Remote Sensing and Machine Learning in Crop Phenotyping and Management, with an Emphasis on Applications in Strawberry Farming. Remote. Sens. 2021, 13, 531. [Google Scholar] [CrossRef]
- Treder, W. Morphological and Physiological Responses of Strawberry Plants to Water Stress. Agric. Conspec. Sci. 2006, 71, 159–165. Available online: https://hrcak.srce.hr/7902 (accessed on 15 July 2025).
- Sujeeun, L.; Thomas, S.C. Biochar Rescues Native Trees in the Biodiversity Hotspot of Mauritius. Forests 2022, 13, 277. [Google Scholar] [CrossRef]
Disclaimer/Publisher’s Note: The statements, opinions and data contained in all publications are solely those of the individual author(s) and contributor(s) and not of MDPI and/or the editor(s). MDPI and/or the editor(s) disclaim responsibility for any injury to people or property resulting from any ideas, methods, instructions or products referred to in the content. |
© 2025 by the authors. Licensee MDPI, Basel, Switzerland. This article is an open access article distributed under the terms and conditions of the Creative Commons Attribution (CC BY) license (https://creativecommons.org/licenses/by/4.0/).