Article

Effects of Moisture Content and Lime Concentrate on Physiochemical, Mechanical, and Sensory Properties of Quinoa Snacks: An Ancient Andean Crop in Puno, Peru

1
Doctorado en Ciencia de Alimentos, Universidad Nacional Agraria La Molina, Av. La Molina s/n, Lima 12-056, Peru
2
Escuela Profesional de Ingeniería Agroindustrial, National University of Altiplano, Puno 04013, Peru
3
Departamento de Ingeniería de Alimentos y Productos Agropecuarios, Universidad Nacional Agraria La Molina s/n, Lima 12-056, Peru
4
Escuela Profesional de Ingeniería Estadística e Informática, National University of Altiplano, Puno 04013, Peru
5
Escuela Profesional de Ingeniería Agronómica, National University of Altiplano, Puno 04013, Peru
6
Escuela Profesional de Ingeniería agroindustrial, National University of Huancavelica, Huancavelica 09001, Peru
7
Escuela Profesional de Ingeniería Agronómica y Agrícola, Catholic University of Santa María Arequipa, Urbanización San José s/n Umacollo, Arequipa 04013, Peru
8
National Autonomous University of Huanta, Huanta 05121, Peru
*
Author to whom correspondence should be addressed.
AgriEngineering 2024, 6(4), 3931-3951; https://doi.org/10.3390/agriengineering6040223
Submission received: 28 August 2024 / Revised: 10 October 2024 / Accepted: 18 October 2024 / Published: 24 October 2024
(This article belongs to the Section Pre and Post-Harvest Engineering in Agriculture)

Abstract

:
The growing global demand for healthy, gluten-free snacks has driven the food industry to explore innovative products that fit consumer preferences. This study focused on developing a gluten-free, energy-dense, and crunchy snack called Quispiño, made from quinoa (Chenopodium quinoa Willd.), an ancient crop native to the Andes and particularly significant in Puno, Peru. Natural and desaponified quinoa samples were compared, revealing decreased carbohydrate content (69.75 g to 64.02 g per 100 g) and protein content (13.27 g to 12.90 g per 100 g) after desaponification. Moisture remained around 11.5%, while fiber content significantly decreased in the desaponified quinoa (from 4.39 g to 2.76 g per 100 g). The extrusion process influenced the color of the extrudates, reducing the L* value (from 75.28 to a range of 63.70–69.12), indicating darkening due to the Maillard reaction. Moisture in the extrudates ranged from 3.08% to 6.12%, while firmness varied between 7.25 N and 25.86 N, significantly influencing extrusion temperature. The water solubility index (WSI) ranged from 0.17% to 71.61%, with high values attributed to starch dextrinization during extrusion. The water absorption index (WAI) showed a significant increase, highlighting the physical changes induced by extrusion. The sectional expansion index (SEI) also varied considerably, ranging from 7.33 to 13.08, reflecting the impact of the extrusion process on the final product structure. The optimal sample was identified and subjected to an acceptability test with an untrained panel of 45 evaluators who assessed flavor, color, odor, appearance, and texture. The best-performing treatment was further analyzed for proximate composition, calcium, and iron content to compare with the raw material. The results demonstrate the potential of quinoa as a key ingredient in developing new, expanded, gluten-free snacks that meet the growing demand for nutritious and appealing food products in the global market.

1. Introduction

Native to the Andes highlands of South America, quinoa is an ancient crop with great potential as an additive in various culinary products due to its exceptionally high nutritional content [1,2,3]. Quinoa (Chenopodium quinoa Willd.) is a plant belonging to the Chenopodiaceae family that originated in the Andes and is cultivated in a variety of soil types and climates [4,5]. It was valued by pre-Columbian Andean civilizations and was considered by the Incas to be a divine gift [6] due to its multiple health benefits and high nutritional value. It contains between 15 and 23 percent protein, mainly albumins and globulins [7], and a broader essential amino acid profile than cereals and legumes, with amino acids such as lysine, isoleucine, methionine, phenylalanine, threonine, valine, leucine, histidine, arginine, alanine, and glycine [8]. Consequently, it is an excellent source of protein and essential nutrients. Quinoa grains contain unsaturated fatty acids and important vitamins and minerals, such as calcium, iron, zinc, and phosphorus, necessary for various physiological and biochemical functions [9,10,11]. Quinoa is especially rich in calcium, which makes it beneficial for the healing of broken bones [12]. Its content varies according to the variety and the region in which it is grown; according to the US National Institute of Health, one cup (185 g) of cooked quinoa contains about 31 mg of calcium, which represents about three percent of the recommended daily value for an average adult. The fiber and B vitamins in quinoa are of high quality compared to other cereals such as barley, oats, rice, corn, or wheat [13,14]. On the other hand, quinoa produces a low glycemic response, which makes it ideal for people who require a special diet, such as those with diabetes, celiac disease, and autism. In addition, it is a versatile food consumed daily in the Andes in the form of quispiño, pesque, grained quinoa, soup, and other dishes [15].
Quispiño is a traditional Andean food from the Puno region, made from quinoa flour. Although it is not well known outside the area, its preparation is an artisanal process that requires time and skill [16,17]. To prepare quispiño, the toasted quinoa is ground in a stone fuller and kneaded with lime and salt to taste. Once kneaded, oil is added and it is shaped with the hands before being placed in a clay pot for cooking. Quispiño is traditionally served with chuño or boiled potato, corn, and other ingredients, and cheese, meat, or salads can be added for flavor [18]. Lime is mainly calcium hydroxide, which produces heat when reacted with water to an exothermic reaction [19]. This white, odorless, microcrystalline powder is added to quispiño to give it its characteristic color acidity regulator. Lime can neutralize some of the saponin, a natural substance that contributes to the bitter taste of quinoa. An ethnographic study in the southern Salar de Uyuni states that a considerable amount of quinoa is also kept in the region for self-consumption [20].
The extrusion technique is versatile, prolific, energy efficient, and environmentally friendly, with no effluents [21]. It has been widely used worldwide to produce expanded foods, breakfast cereals, and pet foods [21,22,23]. This process has many advantages compared to other food technologies due to its short processing time and continuous nature [24]. Physical and chemical changes brought about by the extrusion process include the denaturation of proteins and the gelatinization of starch, as well as improvements in sensory qualities, nutritional bioavailability, and the inactivation of heat-sensitive toxins and enzymes [25]. Some variables can alter important system response parameters such as mechanical and thermal energy input [26]. Still, the extrusion of quinoa enhances the phenolic compounds’ extractability [27]. The optimal temperature for freeing bound phenols is 160 °C. [28]. Two crucial variables affecting these chemicals’ alteration are the grain and the degree of heat treatment; this research demonstrated that quinoa can be successfully used for extruded feed production. Despite the popularity of extrusion processes in food and feed production, data on raw materials and extrusion conditions for some products are still lacking [29].
The main objective of this study is to revalue the consumption of traditional quispiño by creating an energetic and crunchy snack using extrusion technology, to seek and provide new opportunities for quinoa producers to improve their economic income and, consequently, their quality of life. It will accomplish this by (1) developing an extruded quispiño from quinoa; (2) determining the moisture content of the quinoa grain before extrusion and the amount of lime used; (3) analyzing the physical characteristics of the quispiño-type snack, such as its color, moisture, hardness, gelatinization degree, sectional expansion index, solubility index, water retention, and bulk density; and (4) evaluating the acceptance of the quispiño-type snack by selected consumers, as well as its nutritional content and other relevant sensory properties.

2. Materials and Methods

The analyses of the quinoa grains and lime were carried out in food analysis laboratories. The conditioning, mixing, extrusion, cooling, and packaging stages were carried out at the Agroindustrial Moquegua plant, Ilo, Moquegua, Peru. Final product analysis was carried out at the research and packaging laboratories of the Faculty of Food Industries of the Universidad Nacional Agraria La Molina, Lima, Peru. On the other hand, the acceptability test was carried out at the Universidad Nacional del Altiplano Puno, Peru, using panelists from the Professional School of Agroindustrial Engineering.

2.1. Row Materials

Between 2019 and 2020, quinoa of the Salcedo variety was grown in the seed fields of the Instituto Nacional de Innovación Agraria (INIA) at the Agrarian Experimental Station (ILLPA) Puno located in (15°52′56.6″ S, 70°00′08.9″ W). After harvesting, the grains were cleaned of impurities such as leaves, perigonium, stem fragments, and foreign seeds. The quinoa, of certified category and lot code ILL1-015-19, had a varietal purity of 99.7% and a germination percentage of 93%, stored in 25 kg bags. The kernels were scarified (dry de-stoned) and manually washed with potable water to remove the contained saponin [30]. Then, they were dried naturally at an ambient temperature of 20 °C for several days until a humidity of 11% was reached. Finally, they were stored in airtight bags (zip-lock) at a temperature of 20 ± 2 °C for further processing and analysis.

2.2. Methods and Procedures of Analysis

2.2.1. Proximal Chemical

A proximate chemical analysis of two quinoa samples (grain and pearl) was carried out according to test reports No. 1-08081/22 and No. 0675/21-L conducted at laboratory CERPER SA. Analyses were performed following standardized methods: humidity was determined using NTP 205.002:2021; total protein by the Kjeldahl method according to NTP 205.005:2018; total fat according to NTP 205.006:2017/Technical Corrigendum 1 2018; crude fiber with NTP 205.003:2016/Technical Corrigendum 1 2018; and ash according to NTP 205.004:2017 conducted at the laboratory World Survey Services Perú S.A.C. Total carbohydrates were calculated by difference, applying the formula: CHO = 100 − (water + protein + fat + crude fiber + ash). In addition, these same methodologies were used to perform a proximate analysis of the final extruded quispiño product, ensuring consistency and comparability of results between quinoa samples and the final product.

2.2.2. Minerals

The calcium (Ca) and iron (Fe) content was determined in two quinoa samples, in grain and pearl, using the AOAC 985.35 Online 2005 method. This analysis was performed by the Intertek laboratory in 2021, and the results were documented in the certificate of analysis No. 01945/21, expressed in mg/100 g of sample. For the determination of calcium in powdered lime samples used in the research, the AACC 40-70.01 11th 2009 method was used, according to Test Report No. 1-06882/22, performed by Laboratorios CERPER SA in 2022. The results of this analysis were expressed in g/100 g of sample. Additionally, the same CERPER SA laboratory analyzed the calcium and iron content in samples of extruded quispiño, again using the AOAC 985.35 Online 2005 method. The results obtained were also expressed in mg/100 g of sample, thus ensuring the consistency and comparability of the analyses between the different samples and products investigated.

2.2.3. Amino Acid Profile in Salcedo Quinoa, Scarified, Washed, and Dried

The amino acid profile in the raw material was developed by a laboratory accredited by INACAL in the SAC SLAB chemical analysis and services system, using the Agilent 1260 Infinity II HPLC system manufactured by Agilent Technologies in Santa Clara, California, USA. The HPLC UV-VIS assay method is used to determine the amino acid content, quantify it, and identify the limiting factors. In addition, the results were compared with FAO/WHO/UNU (1985) estimates for adults in mg/kg/day [31].

2.2.4. Starch, Amylopectin, and Particle Size Determination

The starch and amylopectin content of scarified, washed, and dried quinoa grains was determined by two different laboratories. The CERPER SA laboratory determined the starch content, according to Test Report No. 1-06883/22, applying the agricultural chemical analysis method, and the results were expressed in g/100 g of sample. On the other hand, the amylopectin content was determined by the laboratory World Survey Services Peru S.A.C., according to Test Report N° 0904/22-L, using the UV-visible spectrophotometry test method, and the results were expressed as a percentage. In addition, the particle size of the Salcedo quinoa grains was determined, where the particle size was defined following the methodology described in the Ecuadorian Technical Standard [32], expressing the data in percentage retention versus sieve number.

2.2.5. Instrumental Texture or Hardness (N)

The texture of the quispiño-type extrudates was measured as indicated by [33] with the Instron 5965 texturometer manufactured by Instron Corporation in Norwood, MA, USA. A Warner-Bratzler cutting blade with a V-shaped probe was used, and the test speed was four mm/s. The sample was placed at the base of the Warner-Bratzler fixture, which has a slot through which the cutting blade passes. The cut was made perpendicular to the central axis of the extrudates until it was completely broken. Time, distance, and force were recorded using Bluehill 3 Software. The hardness or cutting force was determined as the maximum force required to cut the extrudate completely, and the shear strength was calculated by dividing the hardness by the average cross-sectional area of the extrudate material expressed in Newton [34,35].

2.2.6. Net Color Variation (∆E)

Net color variation (∆E) was carried out using a spectrophotometer-colorimeter. The CIELAB system was used for the determination of the laboratory parameters (L*, a*, b*), where L will represent lightness with 0 for dark and 100 for bright, a will describe the extent of green color in the range 100 to 0 and red in the range 0 to 100, b will quantify blue color in the range 100 to 0 and yellow in the range 0 to 100, chromaticity (0–100 percent) and hue angle (0–360°). Hue angle (°H) is the angular representation of color, often described as “red”, “blue”, etc., while chromaticity (C*) describes the purity (saturation) of the color. Reference values for °H are 0/360°, 90°, 180°, and 270° for magenta red, yellow, blue-green, and blue colors, respectively [36]. The color of quinoa, salt, anise, raw and cooked quispiño dough, and extruded samples was measured in triplicate using a Minolta chroma meter to determine the color change due to the effect of lime and the extrusion process and to find the color numerically. The data were expressed with the following Equation (1):
Δ E   = Δ L 2 + Δ a 2 + Δ b 2
where:
∆E = net color variation.
∆L = L − Lo, ∆a= a − ao, and ∆b = b − bo.
Lo, ao, and bo represent the product’s color used before extrusion at the corresponding moisture levels.

2.2.7. Sectional Expansion Index (SEI)

The sectional expansion index (SEI) was expressed as the ratio of the diameter of the extrudate to the die diameter D0. Ten extruded samples were randomly selected, and one reading was taken per part [37]. The diameter of the extrudates D was measured with a vernier electronic digital caliper Stainless Hardened 0–150 mm. The D0 was 5 mm, which the equipment supplier gave. One bag was sampled using Equation (2).
SEI = ( D D 0 ) 2

2.2.8. Bulk Density (BD)

Bulk density (BD) (g/cm3) was determined from 10 measurements for each treatment using Equation (3) [38].
BD = 4   W π D 2 T
where BD = bulk density (g/cm3), T = thickness (cm), D = diameter (cm), and W = mass of each extruded sample (g). Ten replicates of extrudates were randomly selected, and the arithmetic mean X ¯ was calculated [37].

2.2.9. Degree of Starch Gelatinization (DSG)

The determination of the starch gelatinization (DSG) degree was based on forming a blue iodine complex with amylose released during gelatinization. Grinding and sieving were performed at No. 80 ASTM mesh (particle size of 180 μm) to the starch obtained from cooked quinoa. A total of 50 mg of samples were added to 50 mL of 0.05 M KOH solution [39]. The suspension was then centrifuged for 10 min at 4000 rpm, and 1 mL aliquots of the supernatant was added to 1 mL of 0.05 M HCL and made up to 10 mL with deionized water. Then, 0.1 mL of iodine reagent (1 g iodine and 4 g KI per 100 mL deionized water) was added. After mixing, the absorbance was measured at 600 nm (Jenway UV/Vis 6850 spectrophotometer, and it is located in Stone, Staffordshire, United Kingdom) against an unsampled reagent blank. In the control group, KOH (0.05 M) and HCl (0.05 M) were replaced by 0.5 M KOH and 0.5 M HCl. The reference blank was prepared with 10 mL of distilled water and 0.1 mL of the iodine reagent. The calculation of the degree of gelatinization was performed using the following Equation (4):
DSG   % = 100 ( A 1 A 2 )
where:
A1: The absorbance of the test group is 600 nm.
A2: Absorbance of the control group.
The degree of starch gelatinization was determined to evaluate the functional characteristics of the quispiño type extrudate.

2.2.10. Water Absorption Index (WAI) and Water Solubility Index (WSI)

The water absorption index (WAI) and water solubility index (WSI) were determined according to the methods described by [40], with some modifications. The extrudate was ground to less than 300 µm, and one gram of flour was mixed with 15 mL of distilled water and agitated in a vortex for 30 min at room temperature, then centrifuged at 3000× g for 15 min. The supernatant was carefully poured into a Petri dish and dried at 105 °C to a constant weight. The sedimented gel remaining from the centrifugation was weighed. The WSI was the weight of dry solids in the supernatant divided by the number of samples in the gel. Calculations were performed using Equations (5) and (6).
WAI   % = Weight   of   dried   supernatant Initial   sample   weight × 100
WSI   g / g = Weight   of   sedimented   gel Initial   sample   weight   x   1 WAI × 100

2.2.11. Wetting

Water was sprinkled on the quinoa grains, making a good mixture so that all the particles would absorb the water homogeneously. This conditioning must be carried out for a prudent period to ensure all the water is absorbed. Moisture content adjustment was performed based on a matter balance [41], bringing the product to a final humidity of 12.5% and 13.5%. The balance was performed according to the following expression:
M   water = m 1   h 2 h 1 100 h 2
where:
M water = mass of water to be added; m1 = initial mass of product; h1 = initial product moisture; and h2 = final product moisture content.

2.2.12. Sensory Evaluation of the Extruded

The product obtained was evaluated by applying a general acceptability test to both men and women, where they were asked to eat the extruded quispiño and give their opinion about the taste, color, smell, appearance, and texture. A linear scale of 10 cm was used, having as extremes “I dislike it very much”, “I like it very much”, and the central point, “I neither dislike it nor like it” [42]. The survey model was applied to a total of 45 untrained panelists, and the marks were expressed as scores on a scale from 0 to 10. A radar and multivariate design were applied to interpret the results with the help of RStudio software (https://posit.co/download/rstudio-desktop/).

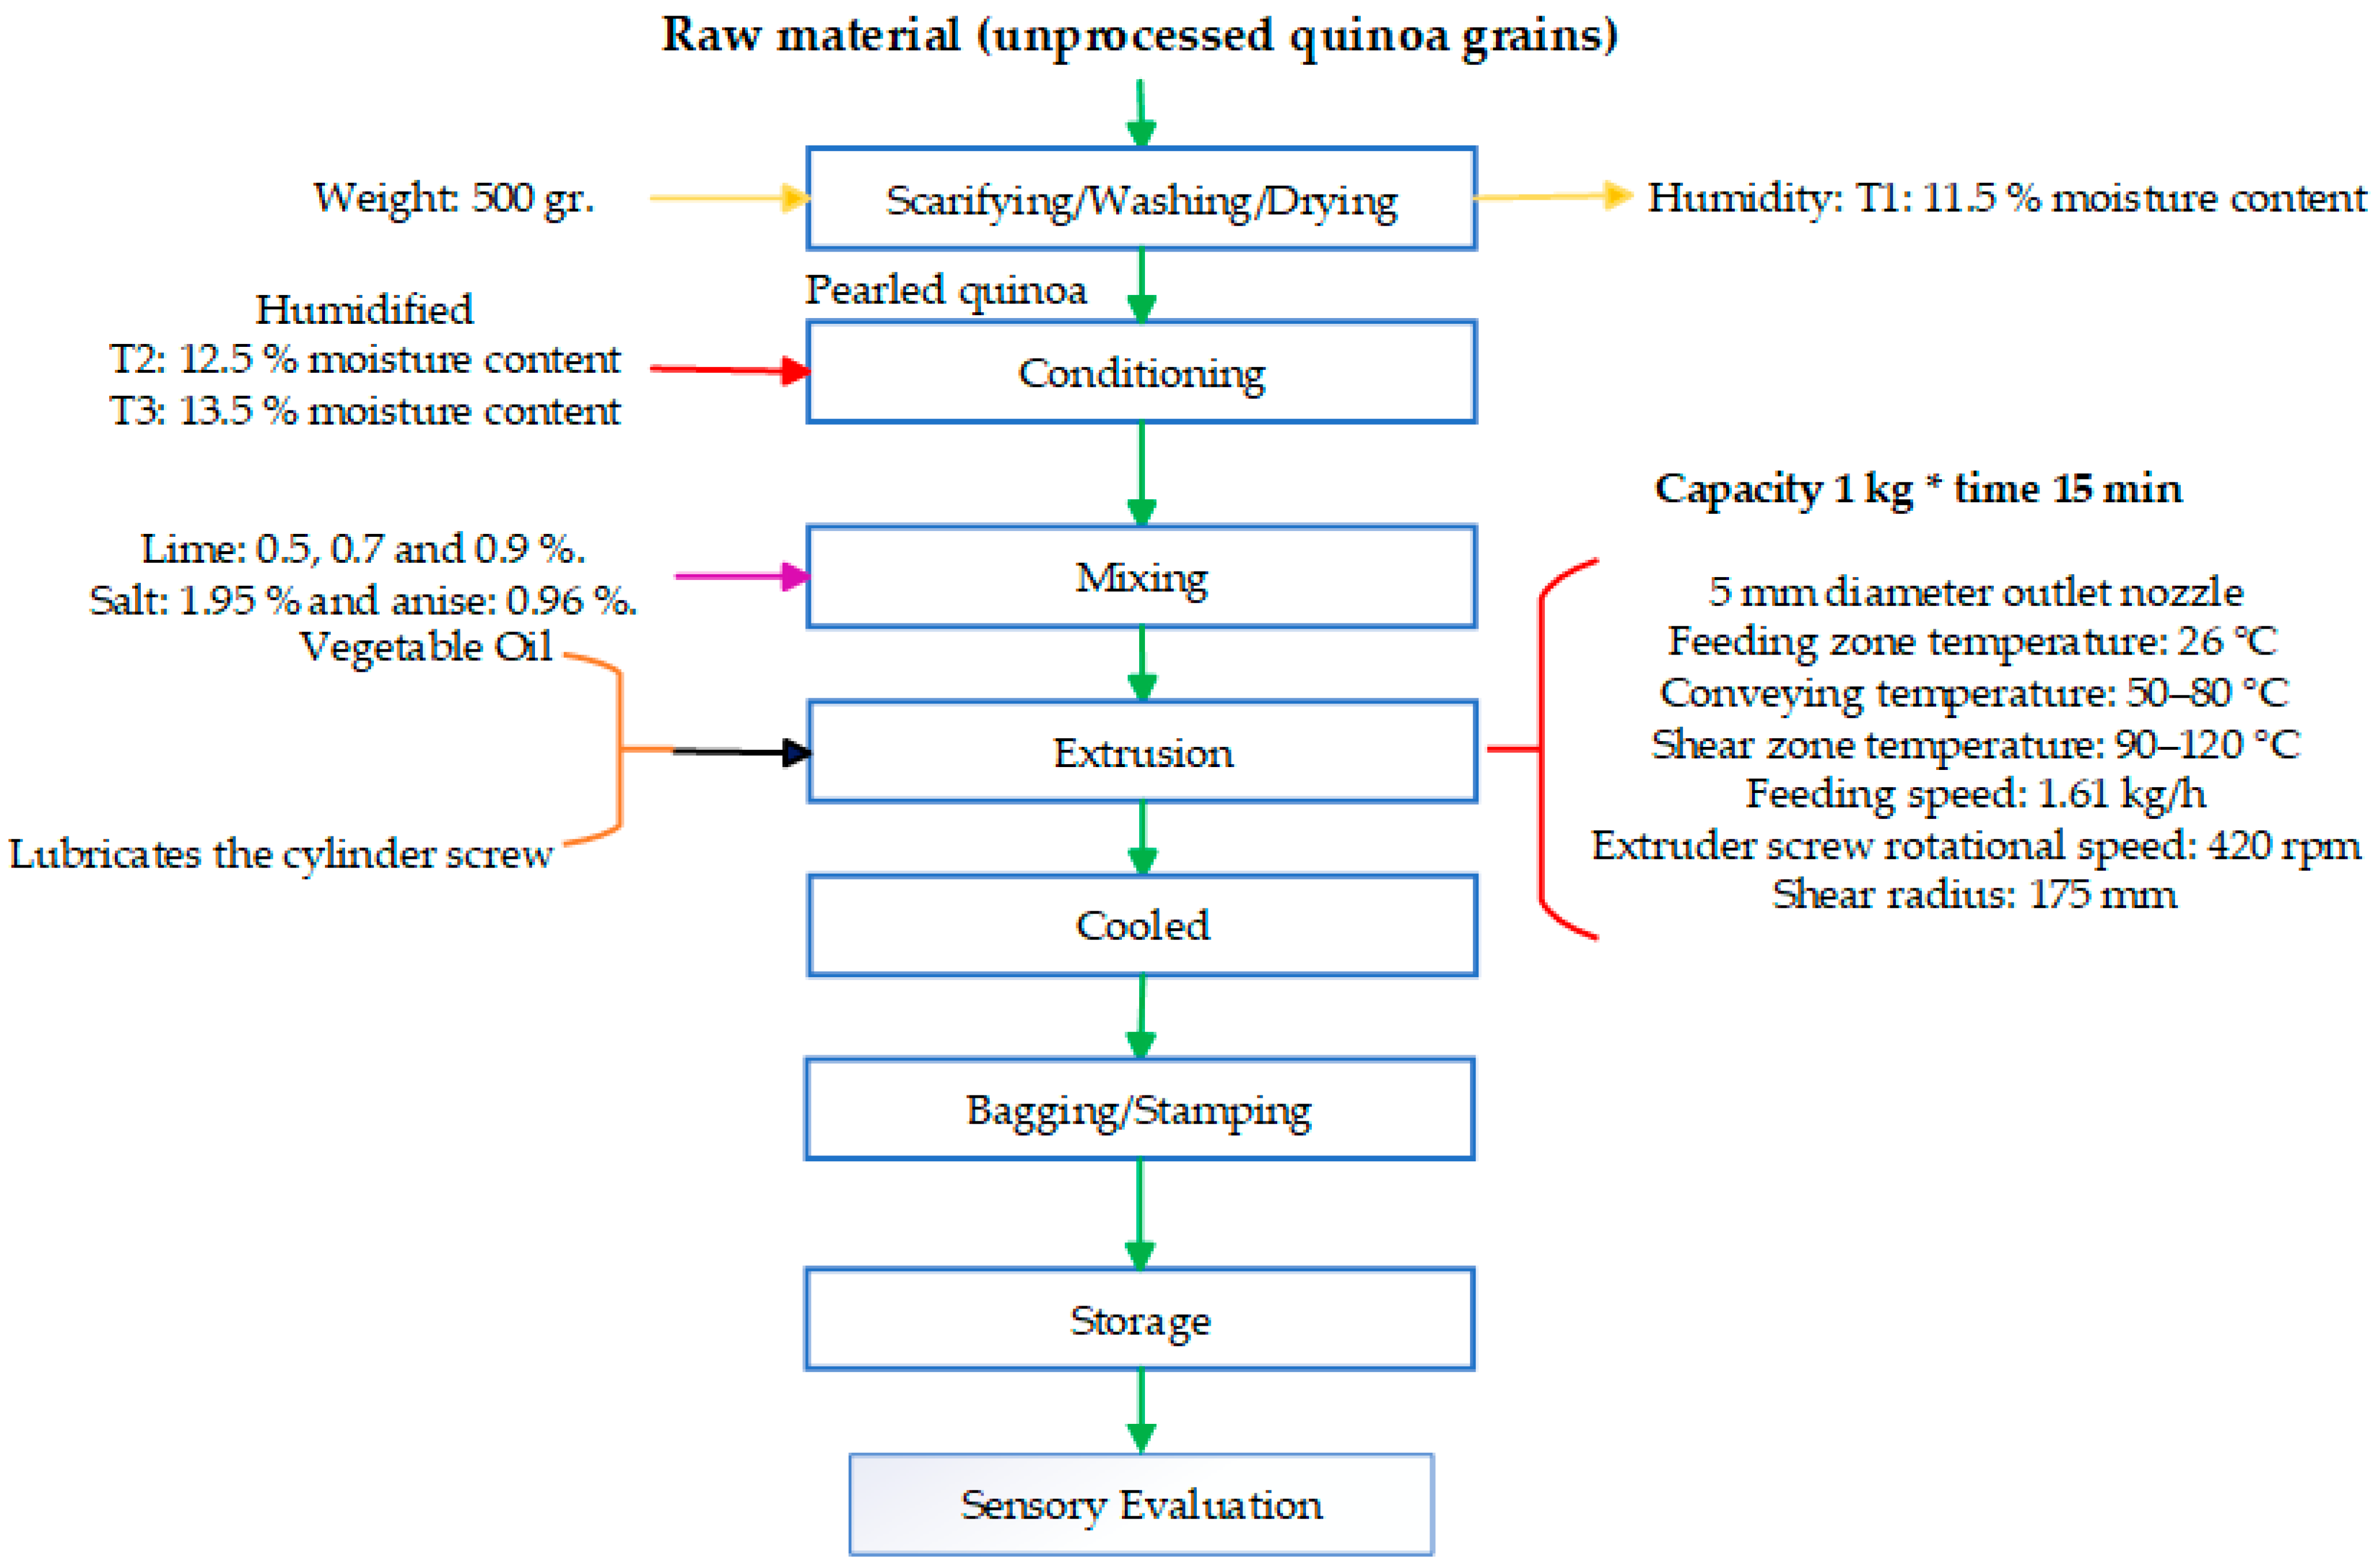
2.3. Experimental Methodology

2.3.1. Pearled Quinoa

A total of 500 g of pearled quinoa was used to make extruded quispiño. Proximal chemical analyses of the Salcedo quinoa grains were carried out to evaluate moisture, protein, fat, crude fiber, ash, carbohydrates, total energy, calcium, iron, diameter, color, and amino acid profile to compare them with other varieties. In addition, the lime used was characterized by determining its calcium content, color, and particle size according to the ASTM mesh. The particle size and color of the lime, salt, and anise used in the formulation were also analyzed.

2.3.2. Moisture Adjustment of Quinoa Grains

Initially, the moisture content of the grains was measured, and the amount of water to be added was calculated using a material balance. Water addition was carried out using a manual spray, ensuring uniform distribution over the grains, which were carefully mixed to ensure homogeneous absorption. After adding water, the samples were stored for 4 h, thus allowing the moisture to become uniform throughout the grains. During this conditioning stage, the necessary measurements and adjustments were made to achieve the optimum moisture required for the extrusion tests. Simultaneously, the other ingredients, such as salt, lime, and anise, which would be added to the extruded material later, were weighed, ensuring accuracy in the preparation of the mixture before extrusion [41].

2.3.3. Mixing of Ingredients

The treatments under study (Table 1) were placed in a stainless-steel mixer model VH-8 powder mixer J514P-M, with a capacity of 1 kg, for 15 min at a constant speed to homogenize the mixture conveniently, using a 500 g capacity ladle and a stainless-steel boil.

2.3.4. Extrusion Process

We worked with pearled grains free of saponins. The quinoa snacks were made in a Yhoma Ingenieros SAC DGP series multifunction snack extruder with a single screw of 37.73 mm diameter. The total length of the extruder cylinder was 380.43 mm, giving a length-to-diameter (L/D) ratio of 10.08. A 5 mm diameter outlet nozzle was used for all extrusion tests. The moisture content of the quinoa was 11.5%. The batch was 500 g. The extruder capacity was 50 kg/h. The feed rate of the quinoa grains, lime, salt, and anise was set at 1.61 kg/h. The quinoa seeds were moistened to two moisture levels of 12.5 and 13.5% by spraying the amount of water and mixing in a stainless steel boil continuously with a capacity of 3 kg. The samples were packed in polyethylene bags and stored for four hours at room temperature to equilibrate the moisture. The extruder consisted of three temperature zones; the average temperature profile corresponded to 26.7 °C (ambient temperature) for the feed zone. The conveying temperature (or friction temperature) ranged from 50–80 °C, and the shear or discharge zone temperature was 90–120 °C; the latter was considered the extrudates’ firing temperature. The extruder screw rotational speed was 420 rpm and the feed rate was 26.8 g/min (1.61 kg/h). The shear radius was maintained at 1.75. Only one temperature sensor, one electrical resistor, one cutter speed controller, one feeder speed controller, and one temperature controller were available. Similar conditions were applied by [43].

2.3.5. Cooling of Extrudates, Packaging and Storage

The extrudates were cooled to room temperature inside a stainless steel container with square wheels. Once cooled, the snacks were packed at room temperature using a stainless steel spoon with a 500 g capacity. The snacks were placed inside kraft paper bags with a capacity of 150 g and an airtight seal. The bags, previously tared with their empty weight, were weighed on an electric balance, filled individually, and placed on a stainless steel table. Finally, the extrudates were stored on pallets under stable conditions at room temperature in a clean, dry, ventilated area. The bags were hermetically sealed and conveniently labeled, following procedures similar to those applied by [16] for storing fresh quispiños, ensuring that the samples were ready for further analysis and study.

2.3.6. Evaluation and Optimization of the Extrusion of Quinoa, Lime, Salt, Anise, and Vegetable Oil

To produce quispiño-type extrudates, a process flow detailed in (Figure 1) was used. Extrusion and optimization were conducted using Response Surface Methodology (RSM) with a Central Composite Design (CCD) 3 × 3, involving nine treatments with three repetitions. Quinoa moisture levels of 11.5%, 12.5%, and 13.5% were used as independent variables, while lime levels in the mixture were set at 0.5%, 0.7%, and 0.9% based on preliminary tests. Salt and anise were measured at 0.4% and 0.2%, respectively, for all treatments, and lime powder was weighed in three amounts. Vegetable oil was used to grease the metal cylindrical screw in the extruder. The textures of the quispiño-type extrudates were compared to those of a commercially available extrudate of Angel cereals with a similar presentation using an Instron texture analyzer.

2.4. Application of Inferential Statistical Test

To test the research hypothesis and determine the existence of a significant or no significant difference, a screening design with central points in the analysis of variance ANOVA was used, with a 95% confidence level, after verifying the assumptions of normality, homogeneity, independence, and significant interaction. Assumptions of normality, homogeneity, independence, and significant interaction were verified. In the Central Composite Design (CCD), thirteen experimental runs were performed, which included four factorial runs, four axial runs, and five center points.
For the statistical model, the following Equation (8) was applied:
y = β 0   + i = 1 k β i x i + i = 1 k β i i x i 2 + i = 1 k J = i + 1 k β i j x i x j + ε
where:
y = response variable; β0 = constant term or the intercept of the model; βi = linear coefficients associated with the factors xi; βii = quadratic coefficients related to the factors xi, explaining the curvature of the factor   x i 2 ; βij = interaction coefficients between the factors xi and xj; xi = levels of the factors; and ε = error term.
The central composite design (CCD) for mixture experiments is used to explore the relationship between the factors and the response in an experimental design where the levels of the factors are varied within a central range. It allows the evaluation of both linear and quadratic effects and the interaction effects of the factors on the response “y”. The coefficients “β” are estimated from the experimental data to analyze the influence of the factors and their interactions on the response variable.

3. Results and Discussion

3.1. Physicochemical Composition of Quinoa and Extrudates

Salcedo quinoa exhibits significant variations in its physicochemical composition, depending on whether it is in its natural or de-saponified state. Regarding carbohydrate content, unprocessed quinoa contains 69.75 g per 100 g, while de-saponified quinoa contains 64.02 g per 100 g. This reduction of 5.73 g can be attributed to (Table 1) to the processes of de-saponification and soaking, which reduce mineral and nutritional content [44]. The starch content in de-saponified quinoa is 60.07 g per 100 g, suggesting a high extrusion capacity essential in producing extruded foods such as cereals and snacks. This value is consistent with previous studies highlighting the importance of starch and amylopectin in the extrusion process, with de-saponified quinoa containing 20.65 g of amylopectin per 100 g [45,46].
Regarding protein content, natural quinoa has 13.27 g per 100 g, while de-saponified quinoa contains 12.90 g per 100 g, representing a decrease of 0.37 g (Table 1). This slight reduction may be related to the selection of quinoa plants to evaluate the heritability of saponin content [47]. Moisture content levels vary slightly, with natural quinoa exhibiting 11.2 g per 100 g and de-saponified quinoa containing 11.81 g per 100 g. The average used in the experiment was 11.5 g, meeting the maximum moisture requirement of 12.5% according to NTP 205.062 [2]. Salcedo quinoa grain’s water activity (Aw) was 0.5, classifying it as a food with intermediate moisture content. The fiber content in natural quinoa is 4.39 g per 100 g, compared to 2.76 g in de-saponified quinoa, indicating a significant reduction. In terms of total fat content, an increase from 5.53 g to 6.18 g per 100 g is observed in scarified quinoa. This variation can affect derived products’ nutritional properties and organoleptic characteristics [48].
The ash content decreases from 2.66 g to 2.34 g per 100 g in de-saponified quinoa (Table 1). Ash reflects the amount of minerals and inorganic elements present in foods, and this variation may be due to differences in mineral composition or extraction processes [49,50]. In terms of energy, natural quinoa provides 1485.31 kJ/100 g, while de-saponified quinoa provides 1520.55 kJ/100 g. These differences may be related to plant genetics, growth conditions, and processing methods [48]. Finally, de-saponified quinoa contains 9.49 g of calcium and 2.26 g of iron per 100 g. These minerals are crucial for bone health and red blood cell formation, making quinoa a vital source of these essential nutrients [51].
According to the results presented in Table 2, it has been observed that the Salcedo quinoa variety, after the saponification process, contains 18 of the 20 known amino acids. Notably, Salcedo quinoa includes all nine essential amino acids required by the human diet which are nutritionally essential (valine, isoleucine, leucine, lysine, methionine, phenylalanine, threonine, tryptophan, and histidine). When comparing these findings with the estimates by [31] regarding amino acid requirements at different life stages, it can be concluded that Salcedo quinoa not only meets but also exceeds the daily amino acid needs in milligrams per kilogram per day (mg/kg/day) for an adult.
The saponin content in scarified, washed, and naturally dried quinoa was 0.02 ± 0.01%. This minimal content meets the requirements established by [52], which stipulates that high-quality quinoa grains should have no detectable saponin content. It indicates that the processes applied during preparation were optimal and effective in reducing or eliminating saponin in quinoa, ensuring its suitability for human consumption. According to [53], 10 mg/100 g or 0.01% saponin content in polished quinoa is considered very low and neither antinutritional nor toxic. Experiments by [54] tested five different pearling times (0, 2, 4, 6, 7, and 8 min) using a locally made pearling machine. The results revealed that a pearling duration of just two minutes significantly reduced the total saponin content. For the Puno variety, the reduction was from 0.49% to 0.09%; for the Titicaca variety, it decreased from 0.37% to 0.07%; and for the ICBA-Q5 variety, it reduced from 0.57% to 0.1%.
During the conditioning phase, the initial moisture content of quinoa grains was measured at 11.5%. Each batch consisted of 2000 g, with the final moisture adjusted to 12.5% and 13.5%. It was observed that as the product mass increases, the required amount of water also rises. The precise water quantity was determined using a mass balance and then uniformly distributed over the quinoa grains utilizing a sprayer. The grains were carefully mixed to ensure even water absorption, with the conditioning process extending for the necessary time to provide adequate water uptake (Table 3).

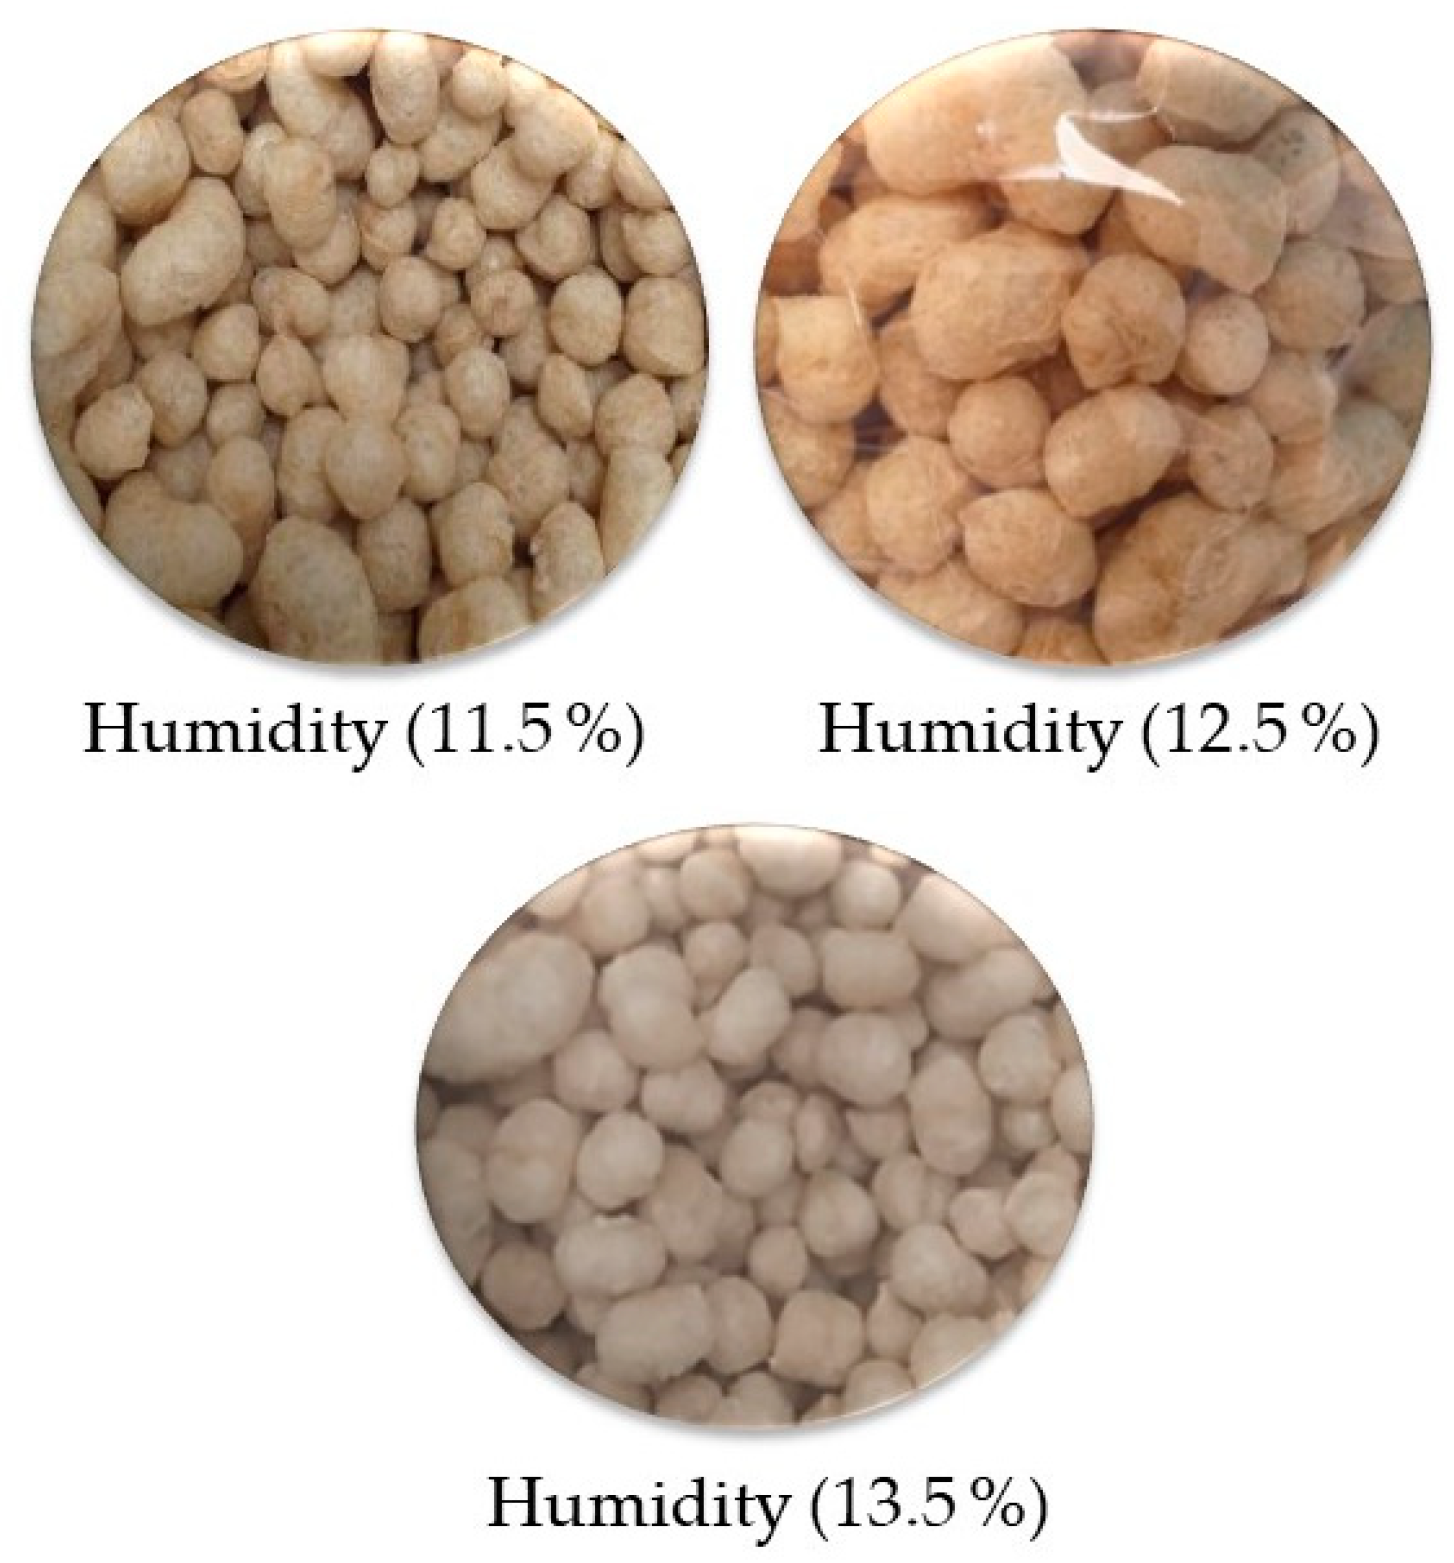
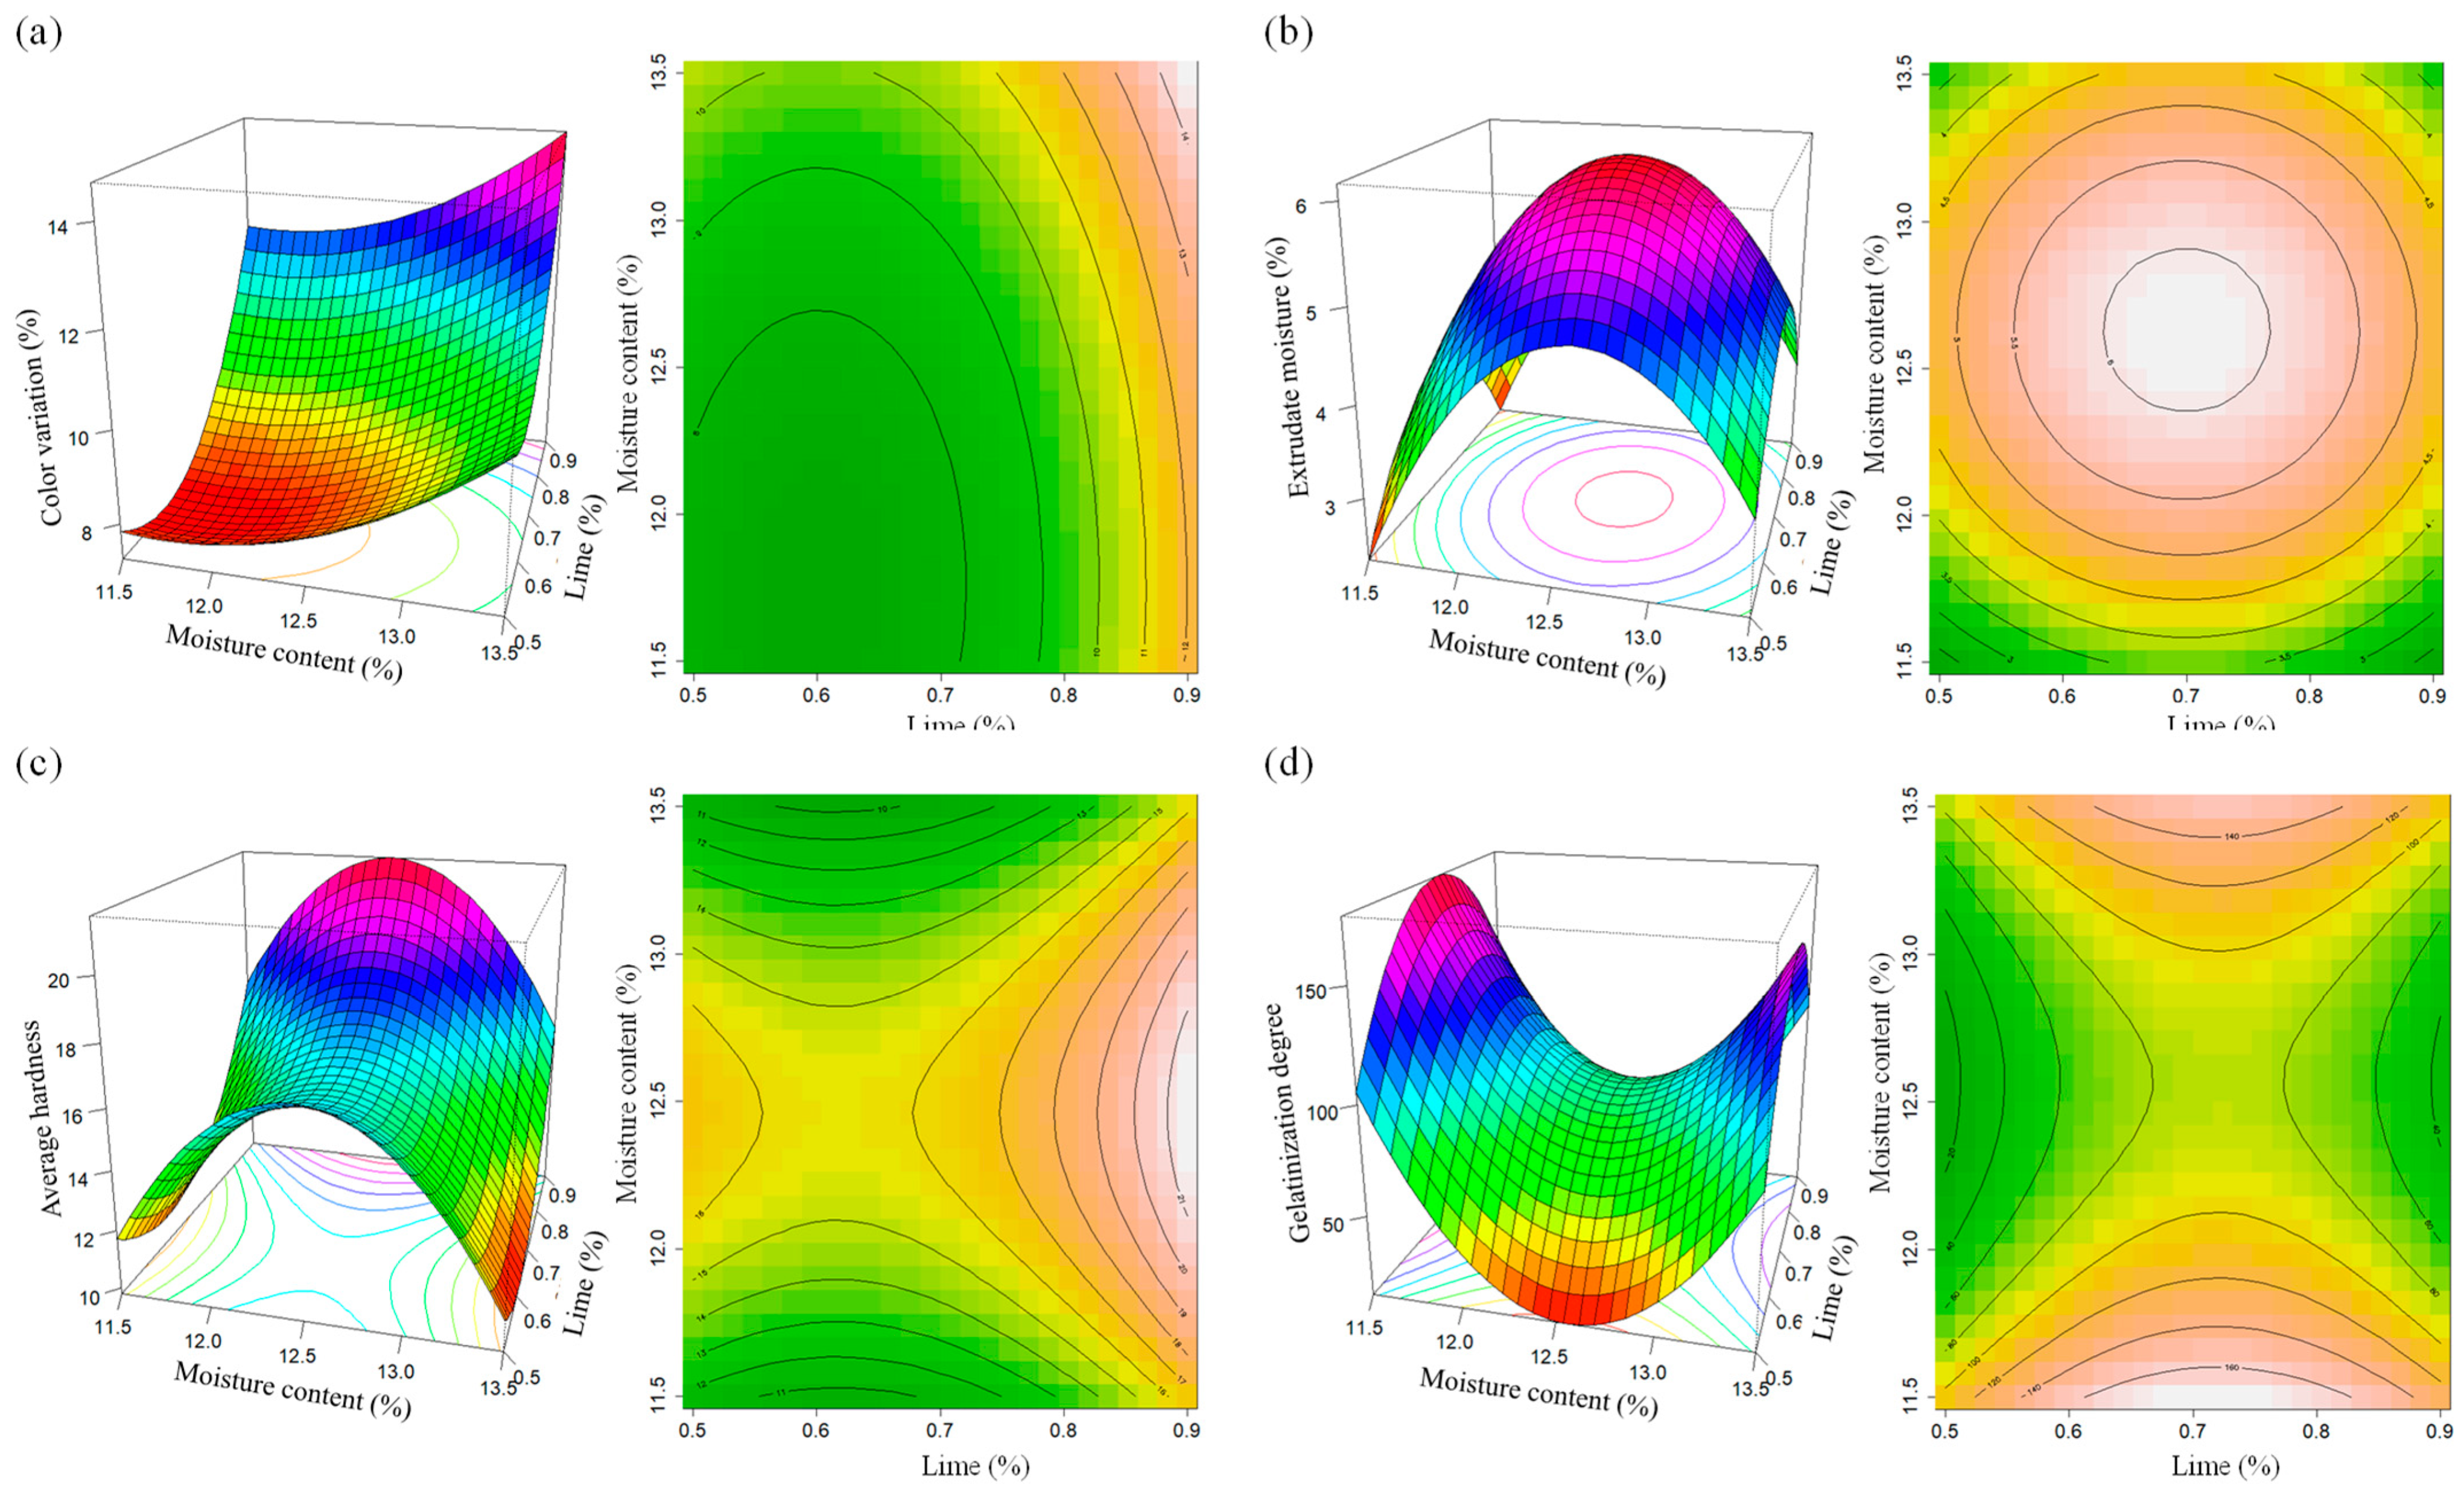
3.2. Evaluating the Physical Characteristics of Net Variation of the Extruded Quispiño

The effect of varying percentages of lime and initial humidity of quinoa grains can be observed in the extruded quispiño (Figure 2).

3.2.1. The Color of the Extruded Quispiño

Represented by the parameters L*, a*, and b*, significantly differs from that of the quinoa grain. The L* value significantly decreased, dropping from 75.28 to 63.70–69.12 (Table 4). This reduction in L* indicates darkening attributable to the lime content and the extrusion process. Similar results were observed in extruded kañihua, where the L* value decreased from 80.4 to a range of 44.5–52.1 [55]. This pattern was also reported for A. cruentus, where the L* value decreased from 79.9 to 58.7 [56], as well as in rice and amaranth blends. The influence of the extrusion process on product darkening can be attributed to caramelization or the Maillard reaction. Lysine and other amino acids likely react with reducing sugars during this process. The darkening increased with higher lime and moisture content, while temperature had the opposite effect (Table 5). The reduction in darkening associated with higher temperatures is explained by the degradation of pigments and a higher Sectional Expansion Index (SEI), resulting in a more open cellular structure and, therefore, a lighter color [57]. In the case of extruded kiwicha, it was observed that L* values (44.5–52.1) were lower than those measured after grinding the extruded samples (71.1–75.0), suggesting that color change primarily occurs on the surface of the extrudate. The color variation of extrudates (∆E) of kiwicha ranged between 28.5 and 36.3; a higher ∆E value (24) calculated from L*, a*, and b* for A. cruentus extrudate was reported by [56]. Additionally, it was observed that the initial lime and moisture content of quinoa positively affected the ∆E* value, which increased from 6.54 to 12.20. Higher values were recorded for extruded kiwicha, ranging from 28.5 to 36.3.

3.2.2. The Moisture of the Extrudates

A critical factor in the quality of the final product was meticulously analyzed and recorded in a range from a minimum of 3.08% to a maximum of 6.12% (Table 5). This wide range of values reflects variability in processing conditions and formulation used in producing extrudates, which can significantly impact the final product’s characteristics, including texture, flavor, and stability. Accuracy in moisture measurement is essential to ensure uniformity and consistency in production and meet quality and food safety standards.

3.2.3. Hardness

The firmness of the extruded products varied notably, ranging from 7.25 to 25.86 N (Table 5). In the case of extruded kiwicha, firmness values ranged from 20.0 to 37.72 N, showing an apparent influence of extrusion temperature (p < 0.05). Specifically, an increase in firmness was observed with increasing extrusion temperature from 160 to 175 °C, while a decrease occurred when the temperature increased from 175 to 190 °C. This same trend has been observed in the case of extruded defatted amaranth [58]. In contrast, firmness was not influenced by the initial moisture level, which contrasts with what was reported for a maize and amaranth blend extrudate [59]. The cutting resistance (CR), obtained by dividing the firmness by the sectional area of the extrudate, varied widely from 4.7 × 10⁵ to 16.5 × 10⁵ N/m2. This range is higher than the CR of 1.3–5.9 × 10⁵ N/m2 reported for rice and amaranth blend extrudates. It is noteworthy that initial moisture did not significantly affect the cutting resistance. However, it was observed that cutting resistance decreased with increasing initial moisture at an extrusion temperature of 160 °C but increased with initial moisture at 175 and 190 °C. This behavior is attributed to the influence of initial humidity content on the Specific Expansion Index (SEI), which affects cutting resistance.

3.2.4. Degree of Gelatinization

The gelatinization degree (DG) was determined using spectrophotometry in quinoa flour and extruded quispiño. It was observed that the DG for extruded quispiño varied significantly, ranging from 4% to a remarkable 22.47% of the original quinoa flour. Following the previous kiwicha, DG values ranged from 51.0% to 99.5% for the extruded study. Additionally, a progressive increase in DG was noted with increasing extrusion temperature, and this phenomenon was influenced by the initial moisture content, consistent with the research [60]. It is worth noting that the DG reported for extruded quispiño was higher than the DSG for extruded kiwicha. However, an inverse pattern was observed for non-extruded kiwicha. Despite these differences, a strong correlation was established between the DG values obtained by spectrophotometry and those determined by Differential Scanning Calorimetry (DSC), with a correlation coefficient of r = 0.97, indicating a high consistency between both techniques (p < 0.01). Similar results have been reported in comparisons between DG measured by DSC and enzymatic methods, supporting the validity and accuracy of the obtained results [61].

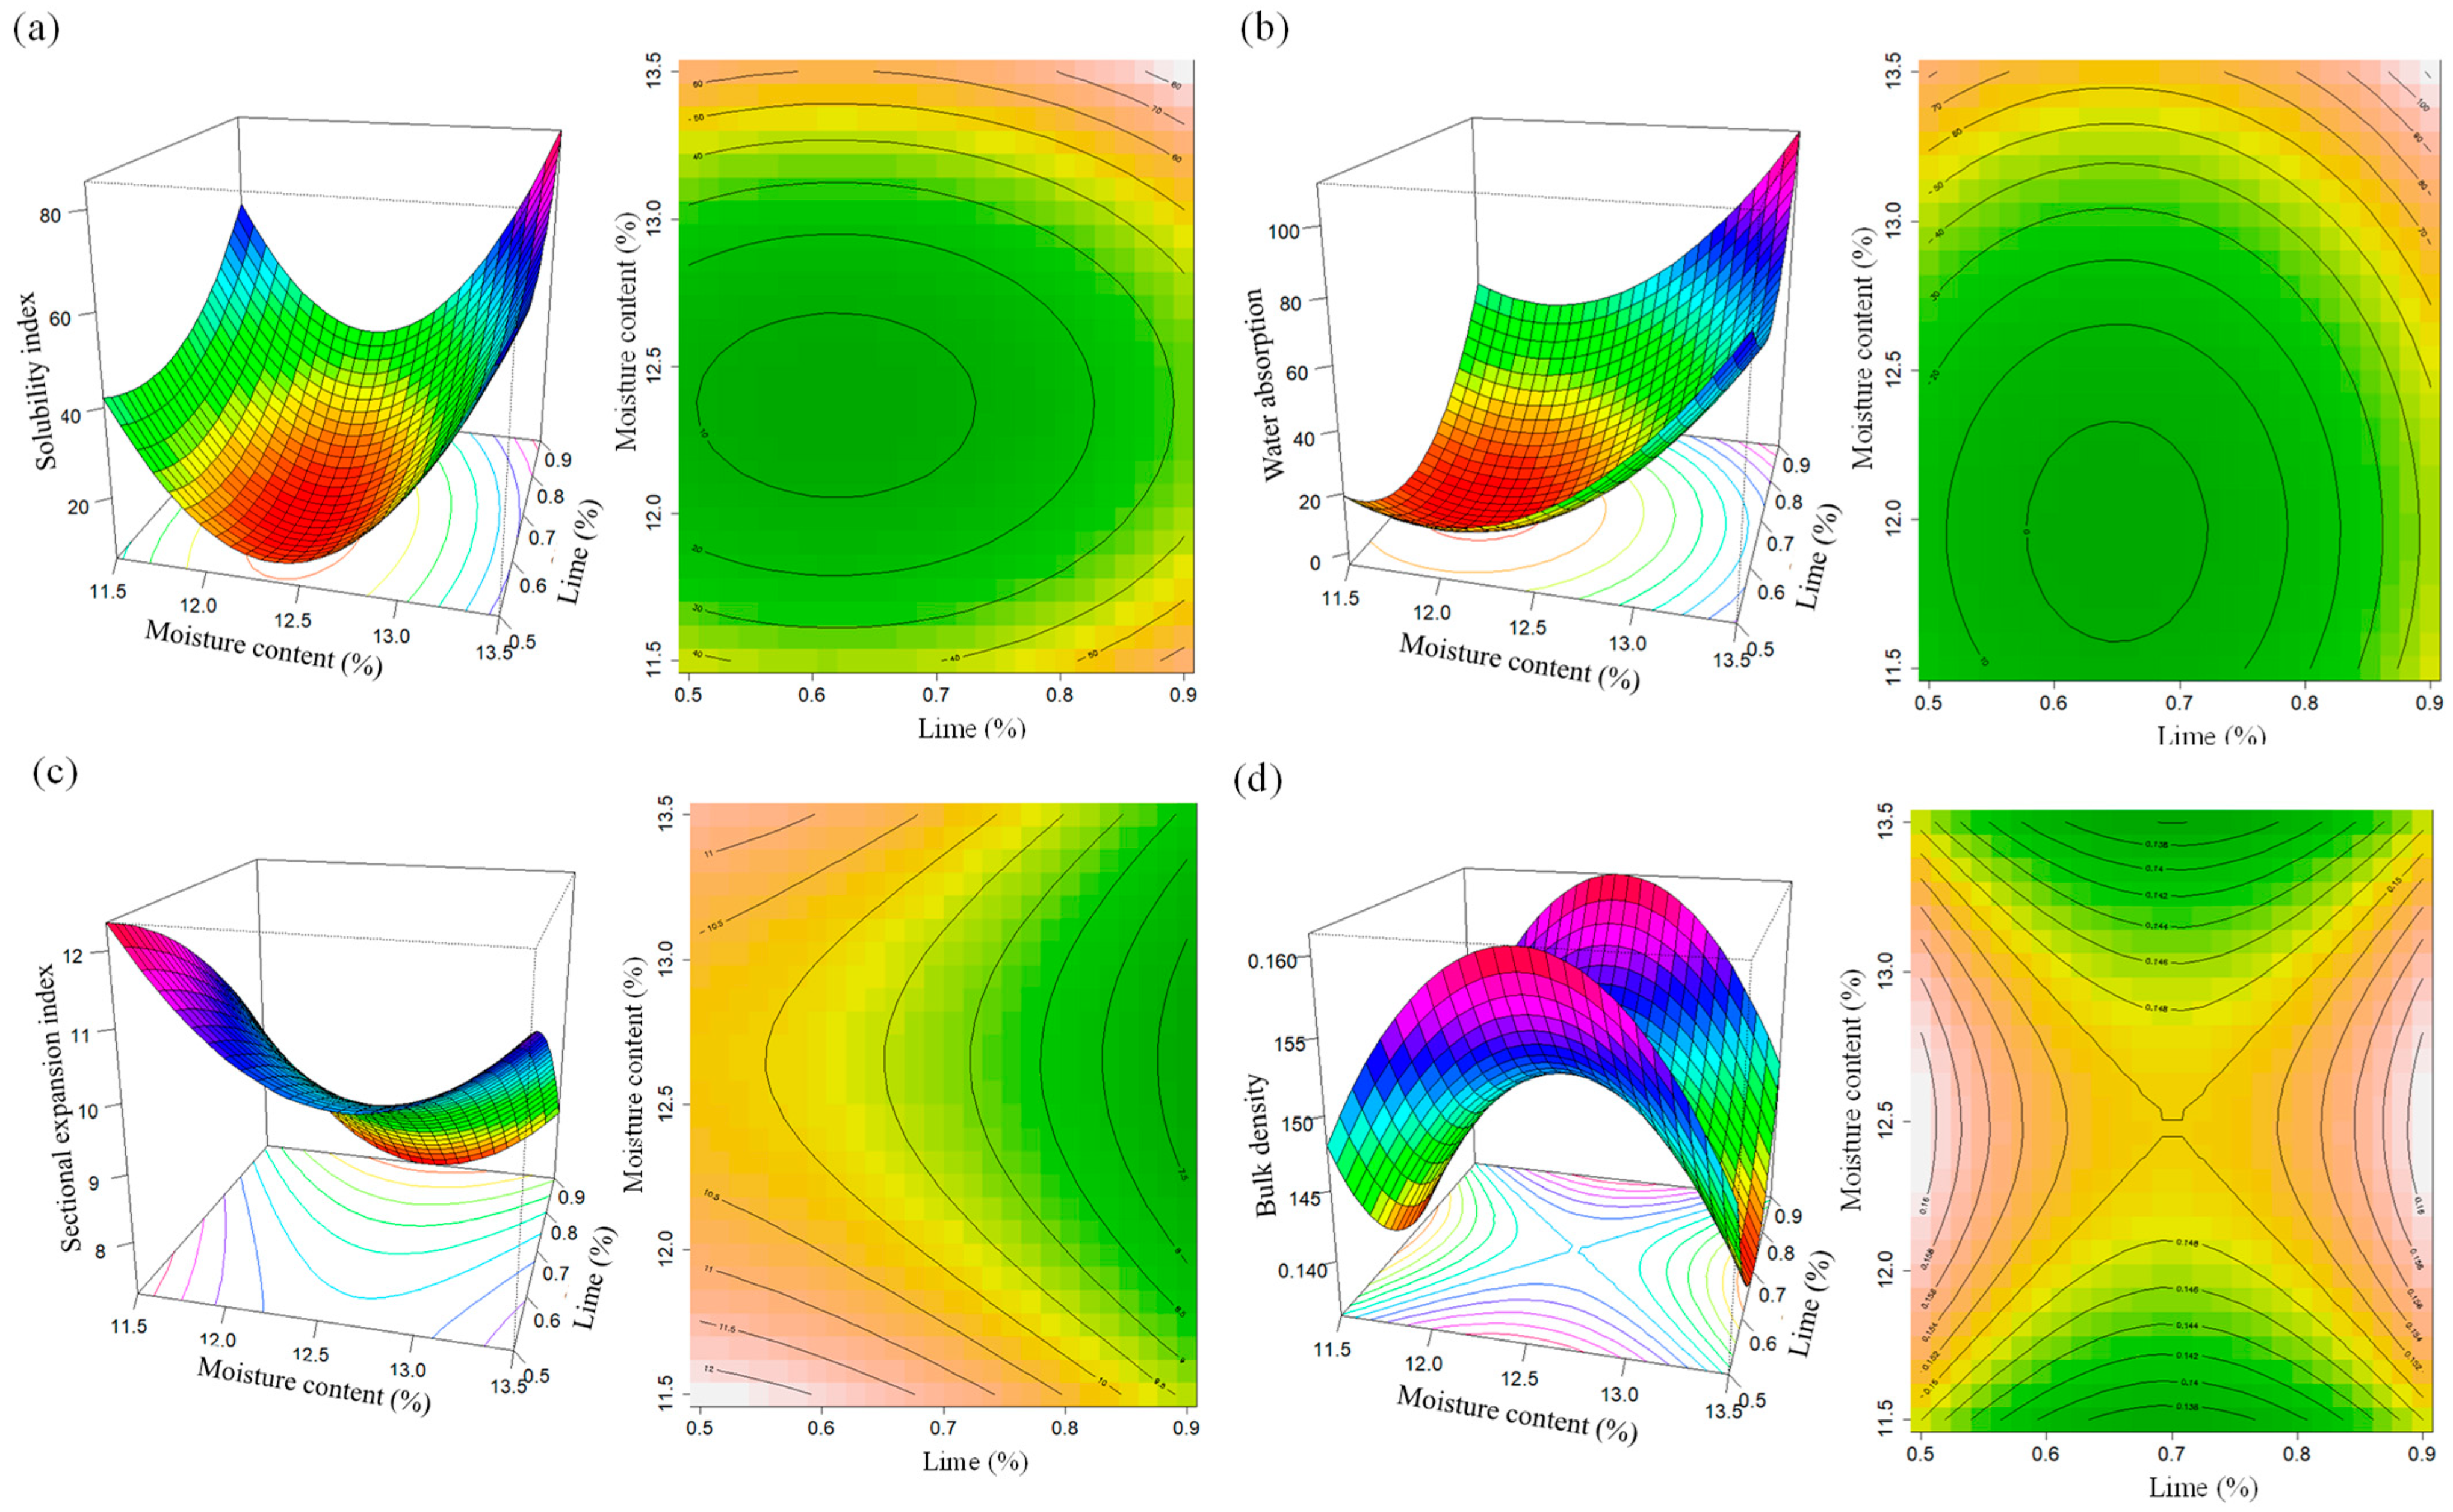
3.2.5. Water Solubility Index

The water solubility index (WSI) ranged from 0.17% to 71.61% (Table 5). Similar increases in WSI have been recorded during the extrusion of amaranth, from 14.8% to 54.1% and 11% to 61%, according to Robin et al. [62]. Elevated WSI values have also been documented for maize extrudates with 20% amaranth, ranging from 35.2% to 32.1%, according to Ramos-Diaz et al. [63]. The high WSI observed in extruded quispiño (Table 5) is likely due to a lower resistance in its endosperm, leading to greater dextrinization of starch during the extrusion process, as noted by Gonzales et al. [64]. Temperature has been shown to positively and significantly impact WSI (p < 0.01). Multiple R-squared: 0.8898, adjusted R-squared: 0.8111, F-statistic: 11.3 on 5 and 7 DF, p-value: 0.003016
Furthermore, the effect of initial moisture on WSI is influenced by extrusion temperature. In mild extrusion conditions characterized by low temperatures and high humidity, the increase in WSI is primarily attributed to the dispersion of amylose and amylopectin induced by gelatinization, which is enhanced by higher initial moisture. In contrast, under more severe conditions with high temperatures and low humidity, the increase in WSI is associated with the presence of lower molecular weight compounds. It is essential to highlight that water acts as a lubricant, reducing mechanical shear, so initial moisture levels harm WSI.

3.2.6. Water Absorption Index

The water absorption index (WAI) changed from 3.76 to 66.89 in the case of extruded quispiño (Table 5). Compared to other food materials, this variation can be considered to be high.

3.2.7. Sectional Expansion Index

The sectional expansion index (SEI) of extruded quispiño changed, ranging from 7.33 to 13.08 (Table 5). Similar studies of extruded kiwicha report SEI values ranging from 1.79 to 7.31. It is relevant to highlight that the WSI of extruded quispiño varied from 8.70% to 71.61%. This latter value significantly exceeds the WSI of non-extruded quinoa flour, which is 0.17. Similar findings have been observed for extruded kiwicha, with WSI ranging from 24.4% to 60.6%. These differences can be explained by the fact that gelatinized starch becomes more susceptible to dissolution, and vigorous mechanical shear during extrusion leads to the dextrinization of starch, reducing its molecular weight and increasing its solubility [59].
In contrast, higher values (6.2–22.8) have been recorded for extruded rice and amaranth flour blends, while for extruded whole wheat, SEI values have been observed to range from 1.06 to 6.20. The results indicate that SEI is influenced by both extrusion temperature and initial moisture (p < 0.05). It is important to note that the extrusion temperature conditions the effect of initial moisture content on SEI. In the evaluated extrusion process, the transport temperature varied between 50–80 °C and the shear zone temperature was 90–120 °C. This behavior aligns with what has been reported for the extrusion of maize, amaranth blends, and whole grain wheat [65]. Increasing water content in the molten mass results in greater flexibility in the amylopectin network, reducing elasticity and, consequently, SEI. Therefore, the maximum IES for the extrusion of quispiño was achieved with a low initial moisture content and a high extrusion temperature. It is worth mentioning that the IES found for extruded quispiño (Table 4) differs from that of extruded cereals such as maize and rice, which is related to the high protein (12.90%) and fat (6.18%) content of quinoa quispiño affecting the properties of the molten mass during extrusion, thus decreasing SEI. Protein hardens the mass, while fat acts as a lubricant, reducing viscosity, mechanical energy, and the amount of gelatinized starch and SEI.

3.2.8. Apparent Density

The apparent density (AD), indicating expansion in all directions, ranged from 0.09 to 0.17 g/cm3 in extruded quispiño (Table 6). These values are similar to those reported for extruded blends of amaranth and rice (0.099–0.226 g/cm3) [35]. It is essential to highlight that extrusion temperature significantly negatively impacted AD (p < 0.01).

3.3. Optimization of Extruded Quispiño

The optimization was carried out using Response Surface Methodology (RSM) with a Central Composite Design (CCD). The percentage of lime and the initial moisture of quinoa were optimized to maximize the following response variables: color variation, initial moisture, hardness, gelatinization, solubility index, expansion index, water absorption index, and bulk density. The quadratic model was significant in estimating the response variables.
Color variation is shown in (Figure 3a), which presents a response surface diagram based on the Central Composite Design. This diagram highlights the effects of lime content and moisture levels on the color variation, showing how these two factors interact to influence the final appearance of the extrudate. The obtained data reflect that the color variation is significantly outside the ideal ranges, and this discrepancy is related to moisture levels and the incorporation of lime during the process. Color plays a crucial role in evaluating food products as it influences visual perception and consumer acceptance. In this case, the color variation could suggest that some aspects of the extrusion process are not functioning optimally. Lime (calcium hydroxide): Adding lime to the extrusion process can affect the pH of the final product. A change in pH can influence the activity of certain enzymes and chemical reactions that involve color. According to [66], lime is traditionally used to produce corn tortillas to treat the corn and facilitate the removal of the husk. It also changes the color of the corn kernels and, ultimately, the color of the tortillas. The statistical analysis indicates no significant relationship between the variables or their interactions. However, there is a possible connection that could exist. Still, since the p-value is more critical than 0.05 (the p-value for the variable CAL2 is 0.05646), we have decided not to consider it in this analysis. In other words, although the variables and their interactions might be related somehow, the current statistical results do not provide sufficient evidence to support that relationship as significant.
Statistical techniques such as ANOVA and regression models were used to evaluate the impact of lime quantity and initial moisture content on the final moisture content of the extruded quispiño. This analysis provided insights into how variations in these factors influence the product’s texture and quality, optimizing the extrusion process for a more consistent and desirable result. As illustrated in Figure 3b, a 0.7% lime level and an initial moisture content of 11.5% resulted in a low % moisture content of 3.08% across all pretreated samples. Initial quinoa moisture is identified as a critical factor affecting the extrusion process. The study confirms that moisture significantly influences the extrusion process, highlighting the importance of monitoring and adjusting moisture levels for consistent and desired outcomes. Increased moisture levels, ranging from 13% to 19%, led to a reduced expansion ratio, water absorption index, and water solubility index while increasing density and hardness [67,68]. Statistically, this value aligns with the extrusion context and provides a basis for additional analyses and predictive modeling. The quadratic model, with an intercept value of K = −3.23 and a minimum coefficient of 2.00445, demonstrates high precision, achieving an R² of 91.38%, underscoring the model’s ability to represent the process accurately. The average hardness, shown in Figure 3c, presents saddle plots illustrating how humidity and lime incorporation affect the average hardness of the quispiño product. The data clearly show that the average hardness values are significantly deviated from the optimal levels, with this discrepancy being directly related to moisture levels and lime addition during the extrusion process. Average hardness is crucial in evaluating food products, significantly impacting visual perception and consumer acceptance.
Figure 3d shows that the gelatinization effect does not demonstrate statistical significance, as the error rate exceeds 1%. This error is 5% higher than the errors observed in the previous analyses, suggesting that the variability in the data may be masking any true effect of gelatinization. This degree of error cannot be dismissed. Additionally, the average moisture does not seem related to gelatinization, even with a 5% margin of error. Similarly, lime does not appear to influence gelatinization substantially, given that the multiple determination coefficient (R2) is relatively low, although sometimes tolerable up to an additional 5%. Notably, the p-value of 0.0971, when compared with humidity and hardness, is increasing, suggesting lower reliability in the results and more significant uncertainty.
The solubility index results (Figure 4a) show a significant increase from a technical perspective. Moisture content plays a fundamental role, indicating that the degradation would not occur without adequate moisture. This relationship extends to other characteristics, such as hardness, gelatinization, and solubility, supporting previous findings. The high determination coefficient (R2) of 0.88, almost reaching 90%, indicates that the model can explain the variability in the data. Additionally, the minimal p-value of 0.003 confirms the statistical significance of these variables concerning the doses studied. In summary, these results support the critical importance of humidity and suggest that this model could effectively estimate results under previously unexplored humidity conditions.
Statistically, the current model does not sufficiently explain the variability in water absorption, despite some significant indications suggesting it could still be a relevant factor to consider. Therefore, exploring other value options related to this factor is recommended to improve the model’s accuracy concerning this index (Figure 4b). In contrast, the situation is not as discouraging when considering different levels of lime and moisture. Approximately 89% of the variability can be significantly explained, even with a 5% (or 0.05) margin of error. Although the current equation is usable, it is crucial to recognize that there is room for model optimization, and the choice of optimization will depend on how this model is intended to be used in the future.
The expansion index (Figure 4c) shows the optimization of the response surface and central composite design of the effect of lime and moisture on the expansion index of extruded quispiño, which presents a valley-shaped graph. The values available so far have not been sufficient to support the inclusion of this factor in the model, as it does not fit the final objective related to ISE. At least with the values we have used so far, it is evident that different doses of moisture and lime need to be explored. Although the determination coefficient R is 0.597, it is essential to note that the associated errors are considerably high, and values below 0.05% have not been obtained. Finally, bulk density, caused by the low doses of moisture and lime related to this factor, prevents the identification of significant values. Different levels of humidity and lime need to be explored to gain a clearer understanding. The graph does not show a clear optimum, leaving us uncertain about the direction in which to find the optimal value (Figure 4d).

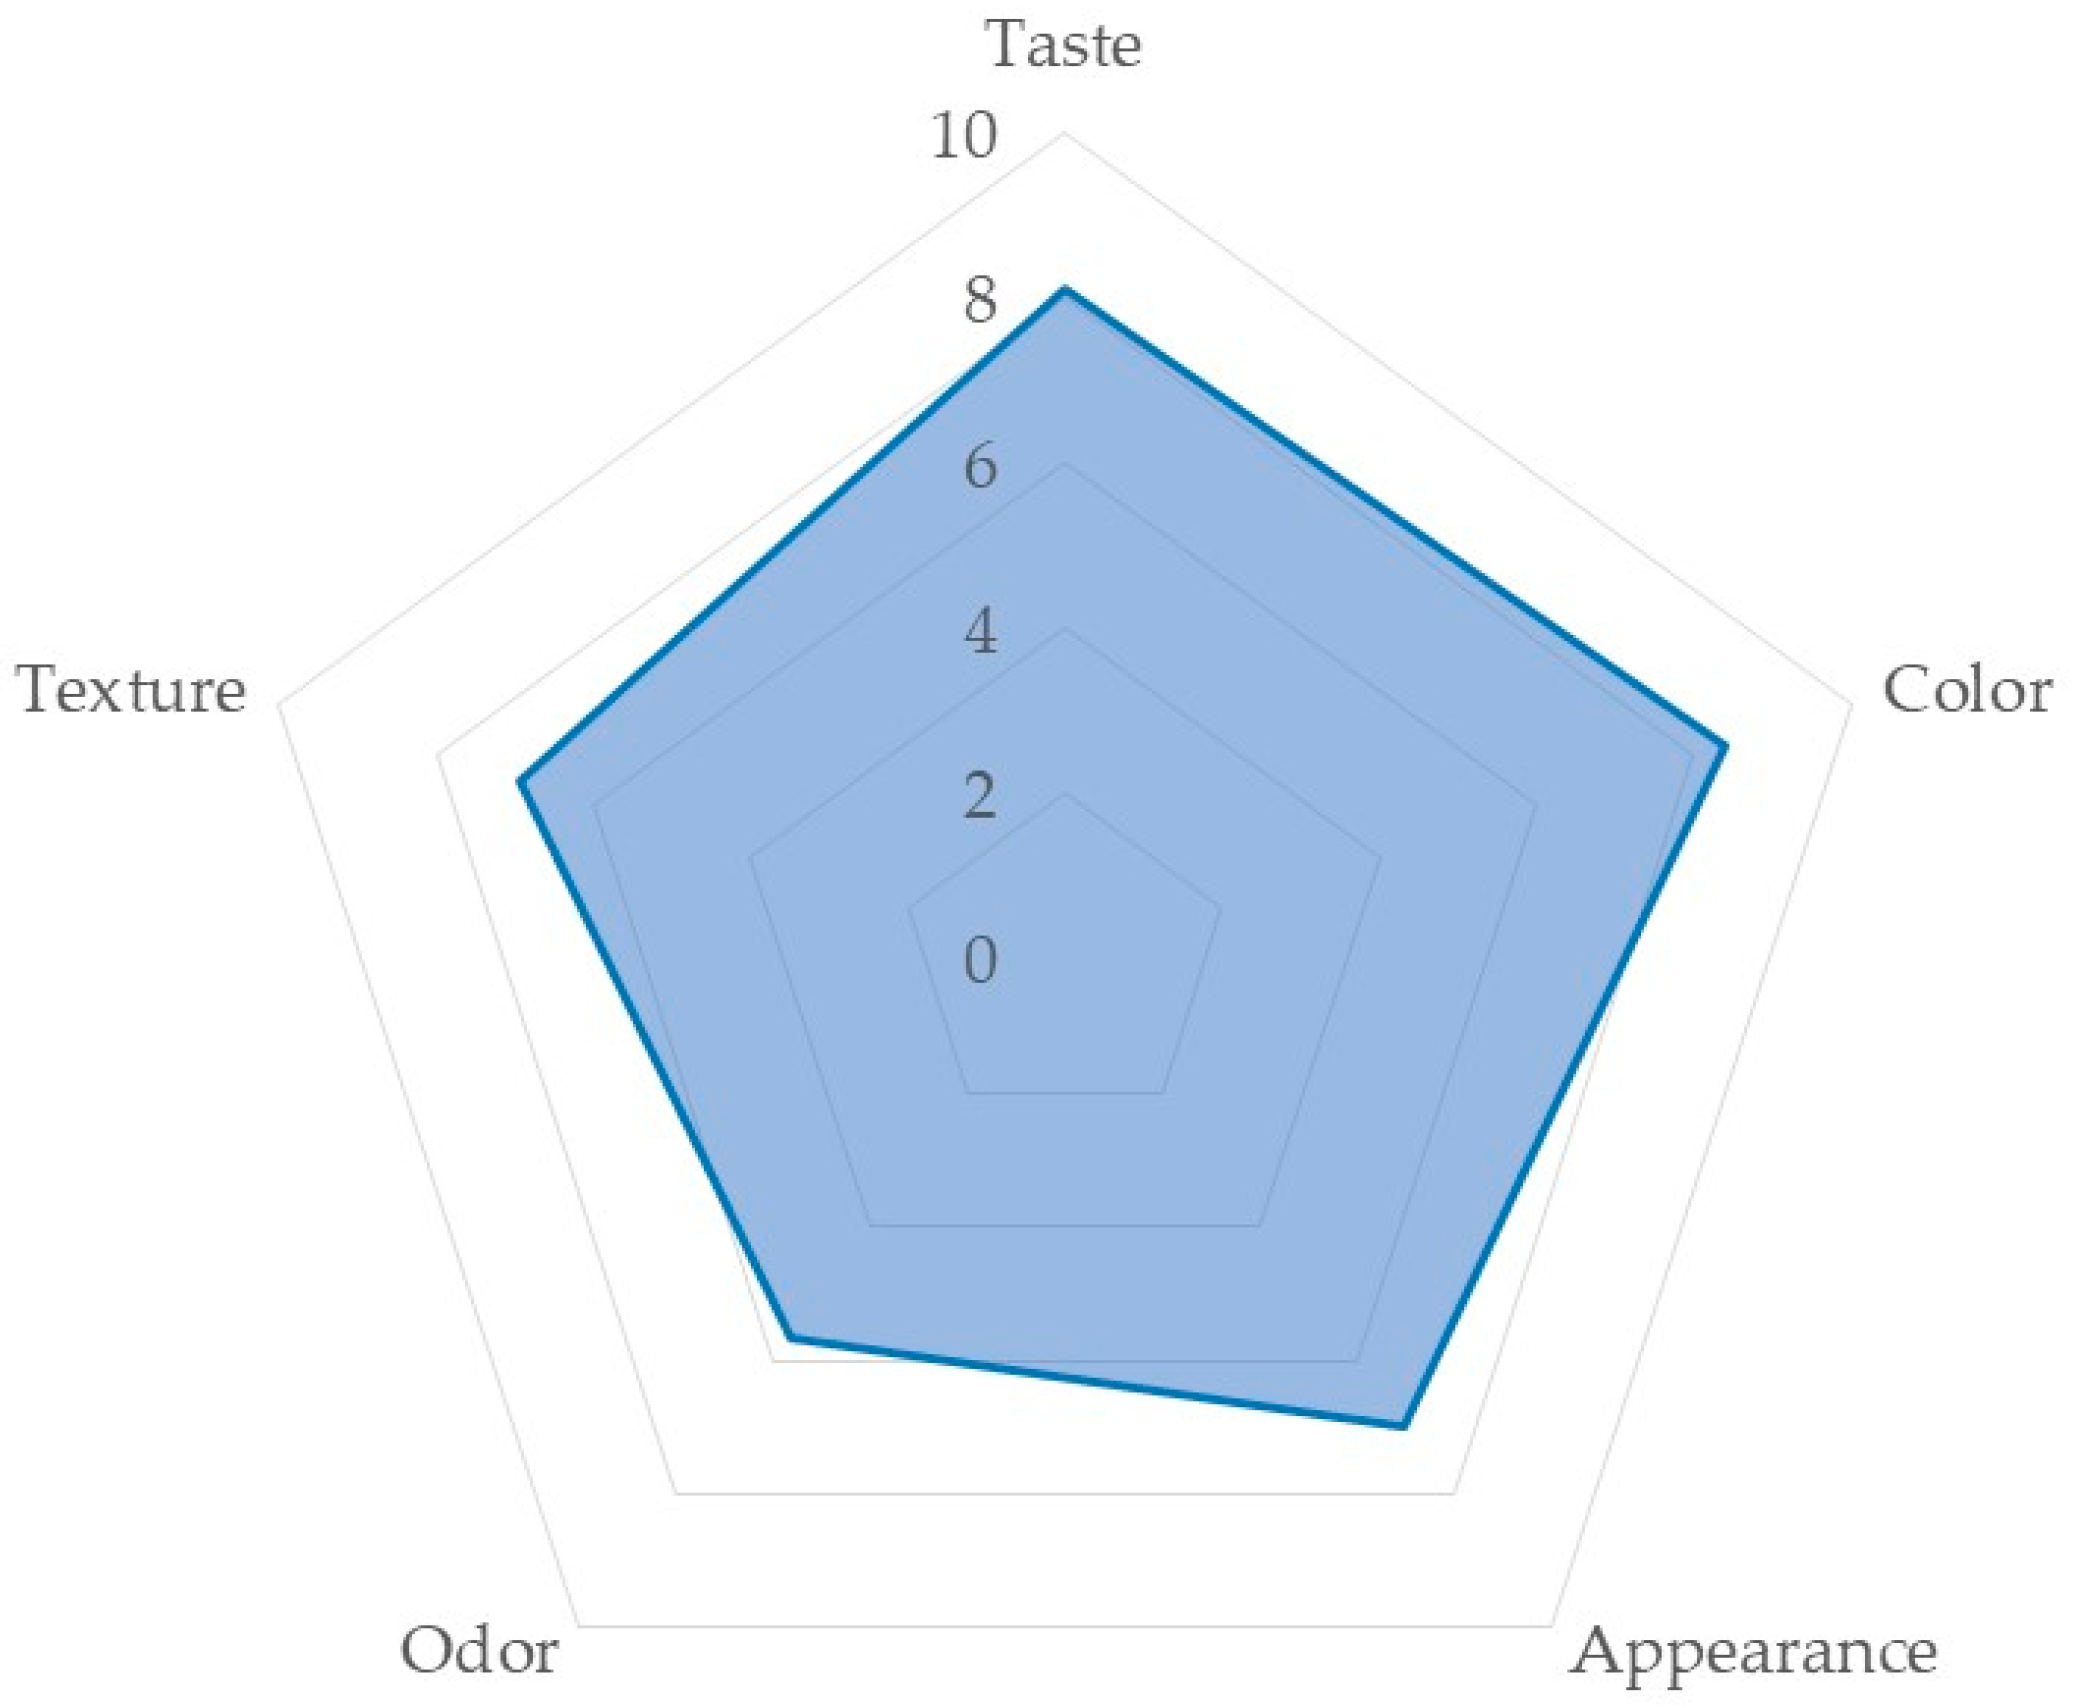
3.4. Sensory Evaluation of Extruded Quispiño

The lime content of 0.7% and the initial quinoa moisture of 12.5% significantly affected (p ≤ 0.05) the attributes of extruded quispiño, resulting in consumer acceptability scores (Table 6). The formulation of extruded quispiño was significantly (p ≤ 0.05) necessary and acceptable; thus, it was selected for optimization. The acceptability of this formulation could be attributed to the lime and moisture content, which improved the quality of appearance, taste, and texture of the extruded quispiño. The radar chart (Figure 5) indicates that most judges or individuals who tasted and rated the extruded quispiño snack noted that it had a good appearance, texture, and flavor (receiving high ratings), meaning they liked it very much. Conversely, the ratings for smell and color were neutral, with comments indicating neither like nor dislike. Regarding smell, there was no consensus between men and women, showing relative discordance in the ratings. This discrepancy is also reflected in the variability coefficient, which shows a value of 86.69%.

3.5. Components of Acceptability of Extruded Quispiño

The principal component analysis related to the acceptability of extruded quispiño indicates that the first two components explain 56.4% (x + y axis) of the data variability associated with acceptability (Figure 6). In this context, the color variable stands out as one of the most significant attributes, influencing how consumers perceive food quality and playing a crucial role in its acceptance. Additionally, color can provide insights into non-sensory characteristics such as moisture level, degree of processing, and presence of pigments [69]. Similarly, the flavor variable shows an influence on data variability, suggesting that flavor is a relevant factor in the acceptability of extruded quispiño. Overall, the analysis underscores the importance of color and flavor in terms of their impact on acceptability. Appearance, color, odor, and flavor are critical parameters for perceiving quinoa quality, with the ideal being a light, slightly yellowish color and a distinctive field fruit aroma and flavor characteristic of organic Andean quinoa.
In Figure 6, the vector lengths indicate each variable’s contribution to data variability, with longer vectors reflecting a higher impact. The proximity of variables in the biplot, such as the near alignment of odor and color, suggests a positive correlation between them, implying that as color intensity increases, so does the odor. Quinoa’s generally neutral aroma and varying color, depending on the variety, add both visual appeal and culinary versatility [70]. The analysis consistently shows that flavor (CP2) and color and appearance (CP1) are the most influential factors in consumer ratings, accounting for 56.4% of the variability in these ratings, with consistent patterns observed across both male and female evaluators.

4. Conclusions

The conclusions of this study reveal notable changes in the physicochemical composition of Salcedo quinoa and its extruded products, primarily driven by the de-saponification and extrusion processes. De-saponification led to a decrease in carbohydrates (from 69.75 g to 64.02 g per 100 g) and proteins (from 13.27 g to 12.90 g per 100 g), while fiber content significantly dropped (from 4.39 g to 2.76 g per 100 g). Meanwhile, the moisture content remained relatively stable at around 11.5%. The extrusion process caused significant darkening in the extruded products, with the L* value decreasing from 75.28 to a range of 63.70–69.12 due to the Maillard reaction. The moisture content of the extrudates ranged between 3.08% and 6.12%, while firmness values varied from 7.25 N to 25.86 N, showing the significant influence of extrusion temperature on texture.
The water solubility index (WSI) displayed a wide range, from 0.17% to 71.61%, suggesting high starch dextrinization during extrusion. The water absorption index (WAI) increased notably, indicating extrusion-induced physical changes. Additionally, the sectional expansion index (SEI) ranged from 7.33 to 13.08, reflecting the impact of extrusion on the final product’s structure.
Additionally, the study showcased the nutritional benefits of the optimized snack, which featured higher levels of calcium and iron compared to the raw quinoa grains. This research underscores the potential of ancient Andean crops, particularly quinoa from Puno, Peru, to meet the growing global demand for healthy, gluten-free snacks. It provides a strong foundation for further innovation in the food industry, highlighting the market potential of these nutritious and culturally significant crops.

Author Contributions

Conceptualization, C.M., E.O.B. and FC; Investigation, C.M., E.O.B., F.C. and V.I.; Methodology, C.M., E.O.B. and F.C.; Formal analysis, C.M., E.O.B., V.I., F.C. and C.T.; Data curation, C.M., V.I., C.T. and J.Z.; Validation, C.M., E.O.B. and V.I.; Project administration, C.M., J.Z. and M.P.; Visualization, C.M., E.O.B., C.T., J.Z., M.P. and F.C.; Resources, C.M., F.C., C.T. and M.P.; Software, C.M., F.C. and V.I.; Supervision, C.M., E.O.B. and F.C.; Funding acquisition, C.M., V.I., F.C., J.Z., M.P., C.T. and E.O.B.; Writing—original draft, C.M., F.C., V.I. and C.T.; Writing—review and editing, C.M., E.O.B., V.I., F.C., C.T., J.Z. and M.P. All authors have read and agreed to the published version of the manuscript.

Funding

This research received no external funding.

Institutional Review Board Statement

Not applicable.

Informed Consent Statement

Not applicable.

Data Availability Statement

Data are contained within the article.

Acknowledgments

The authors acknowledge and appreciate the support of the Universidad Nacional Agraria La Molina Lima, Peru; the Universidad Nacional del Altiplano—Puno, Peru; and the Universidad Nacional de Moquegua, Ilo, Peru. Recognizing the institutions contributing to their research demonstrates gratitude and a sense of community. Furthermore, it is touching to note that the authors have expressed their appreciation of the primary author’s mother, Carmen Caceres Tapia, who unfortunately passed away in December 2023. Such dedications carry emotional significance and honor the memory of those who have played essential roles in the authors’ lives.

Conflicts of Interest

The authors declare no conflicts of interest.

References

  1. Haros, C.M.; Repo-Carrasco-Valencia, R.; Basilio-Atencio, J.; Luna-Mercado, G.I.; Pilco-Quesada, S.; Vidaurre-Ruiz, J.; Molina, L. Andean Ancient Grains: Nutritional Value and Novel Uses. Biol. Life Sci. Forum 2021, 8, 15. [Google Scholar] [CrossRef]
  2. Maldonado-Alvarado, P.; Abarca-Robles, J.; Pavón-Vargas, D.J.; Valencia-Chamorro, S.; Haros, C.M. Effect of Quinoa Germination on Its Nutritional Properties. Biol. Life Sci. Forum 2022, 17, 7. [Google Scholar] [CrossRef]
  3. Calizaya, F.; Gómez, L.; Zegarra, J.; Pozo, M.; Mindani, C.; Caira, C.; Calizaya, E. Unveiling Ancestral Sustainability: A Comprehensive Study of Economic, Environmental, and Social Factors in Potato and Quinoa Cultivation in the Highland Aynokas of Puno, Peru. Sustainability 2023, 15, 13163. [Google Scholar] [CrossRef]
  4. Filho, A.M.M.; Pirozi, M.R.; Borges, J.T.D.S.; Pinheiro Sant’Ana, H.M.; Chaves, J.B.P.; Coimbra, J.S.D.R. Quinoa: Nutritional, Functional, and Antinutritional Aspects. Crit. Rev. Food Sci. Nutr. 2017, 57, 1618–1630. [Google Scholar] [CrossRef]
  5. Maradini-Filho, A. Quinoa: Nutritional Aspects. J. Nutraceuticals Food Sci. 2017, 2, 3. [Google Scholar]
  6. Bastidas, E.G.; Roura, R.; Rizzolo, D.A.D.; Massanés, T.; Gomis, R. Quinoa (Chenopodium quinoa Willd), from Nutritional Value to Potential Health Benefits: An Integrative Review. J. Nutr. Food Sci. 2016, 6. [Google Scholar] [CrossRef]
  7. Abugoch, J.L.E. Quinoa (Chenopodium quinoa Willd.): Composition, Chemistry, Nutritional, and Functional Properties. Adv. Food Nutr. Res. 2009, 58, 1–31. [Google Scholar] [CrossRef]
  8. Valcárcel-Yamani, B.; Caetano Da, S.; Lannes, S. Applications of Quinoa (Chenopodium quinoa Willd.) and Amaranth (Amaranthus spp.) and Their Influence in the Nutritional Value of Cereal Based Foods. Food Public Health 2012, 2012, 265–275. [Google Scholar] [CrossRef]
  9. Repo-Carrasco-Valencia, R. Andean Indigenous Food Crops: Nutritional Value and Bioactive Compounds; Publisher TURUN YLIOPISTO: Turku, Finland, 2011; ISBN 9789512946044. [Google Scholar]
  10. Repo-Carrasco, R.; Pilco, J.J.; Rene, C.; Zelada, E. Desarrollo y Elaboración de Un Snack Extruido a Partir de Quinua (Chenopodium quinoa Willd.) y Maíz (Zea mays L.); Universidad Nacional Agraria La Molina: Lima, Peru, 2011; Volume 29. [Google Scholar]
  11. Repo-Carrasco, R.; Espinoza, C.; Jacobsen, S.E. Nutritional Value and Use of the Andean Crops Quinoa (Chenopodium quinoa Willd.) and Kañiwa (Chenopodium pallidicaule). In Proceedings of the Food Reviews International; Haworth Press, Inc.: Binghamton, NY, USA, 2003; Volume 19, pp. 179–189. [Google Scholar]
  12. Berti, C.; Riso, P.; Monti, L.D.; Porrini, M. In Vitro Starch Digestibility and in Vivo Glucose Response of Gluten-Free Foods and Their Gluten Counterparts. Eur. J. Nutr. 2004, 43, 198–204. [Google Scholar] [CrossRef]
  13. Ruíz, F.; Nelina, A. Efectos Beneficiosos de Una Dieta Rica En Granos Enteros. Rev. Chil. Nutr. 2005, 32, 191–199. [Google Scholar] [CrossRef]
  14. Repo-Carrasco-Valencia, R.; Vidaurre-Ruiz, J.; Luna-Mercado, G.I. Development of Gluten-Free Breads Using Andean Native Grains Quinoa, Kañiwa, Kiwicha and Tarwi. Proceedings 2020, 53, 15. [Google Scholar] [CrossRef]
  15. Jaimes, A.; Ignacio, P.; Rivas, H. Glycemic Index of Quinoa (Chenopodium quinoa) in Healthy Subjects of Venezuela Venezuelan Nutrition and Health Study View Project Fruits and Vegetables in Venezuela View Project; Instituto Nacional de Nutrición: Caracas, Venezuela, 2017. [Google Scholar]
  16. Mindani, C.C.G.; Calizaya, L.; Fredy, G.; Cahuana, J.J.L.; Baldeón, E.O. Evaluación Del Cambio En El Quispiño Por La Adición de Hidróxido de Calcio. Rev. Soc. Quím. Perú 2023, 1, 1–10. [Google Scholar]
  17. Miguel, M. Betalains in Some Species of the Amaranthaceae Family: A Review. Antioxidants 2018, 7, 53. [Google Scholar] [CrossRef]
  18. Ortiz, M.R. Platos Típicos en el Aprendizaje de la Segunda Lengua en Educación Intelectual Bibligue de los Niños del Tercer Grado de Educación Primaria de Chucahuacas Chupa; Tesina; Universidad Nacional del Altiplano: Puno, Peru, 2011. [Google Scholar]
  19. Baker, P.T.; Mazess, R.B.; Collazos, C.C.; Moscoso, I.; Bravo, Y.; Castellanos, A.; Caceres, C.; Rosa, A.; Bradfield, R.B.; White, S.; et al. References and Notes; American Journal of Physical Anthropology: New York, NY, USA, 1962; Volume 102. [Google Scholar]
  20. Ofstehage, A. The Gift of the Middleman: An Ethnography of Quinoa Trading Networks in Los Lipez of Bolivia; University of New Mexico Press: Albuquerque, NM, USA, 2012. [Google Scholar]
  21. Burey, P.; Bhandari, B.R.; Rutgers, R.P.G.; Halley, P.J.; Torley, P.J.J. Confectionery Gels: A Review on Formulation, Rheological and Structural Aspects. Int. J. Food Prop. 2009, 12, 176–210. [Google Scholar] [CrossRef]
  22. Gomez, M.H.; Aguilera, J.M. Changes in the Starch Fraction During Extrusion-Cooking of Corn. J. Food Sci. 1983, 48, 378–381. [Google Scholar] [CrossRef]
  23. Kirby, A.R.; Ollett, A.-L.; Parker, R.; Smith, A.C. An Experimental Study of Screw Configuration Effects in the Twin-Screw Extrusion-Cooking of Maize Grits; The Institute of Food Science and Technology: London, UK, 1988; Volume 8. [Google Scholar]
  24. Kowalski, R.J.; Medina-Meza, I.G.; Thapa, B.B.; Murphy, K.M.; Ganjyal, G.M. Extrusion Processing Characteristics of Quinoa (Chenopodium quinoa Willd.) Var. Cherry Vanilla. J. Cereal Sci. 2016, 70, 91–98. [Google Scholar] [CrossRef]
  25. Ragaee, S.; Seetharaman, K.; Abdel-Aal, E.S.M. The Impact of Milling and Thermal Processing on Phenolic Compounds in Cereal Grains. Crit. Rev. Food Sci. Nutr. 2014, 54, 837–849. [Google Scholar] [CrossRef]
  26. Zhao, X.; Wei, Y.; Wang, Z.; Chen, F.; Ojokoh, A.O. Reaction Kinetics in Food Extrusion: Methods and Results. Crit. Rev. Food Sci. Nutr. 2011, 51, 835–854. [Google Scholar] [CrossRef]
  27. Song, J.; Shao, Y.; Chen, X.; Li, X. Release of Characteristic Phenolics of Quinoa Based on Extrusion Technique. Food Chem. 2022, 374, 128780. [Google Scholar] [CrossRef]
  28. Chandrasekara, A.; Naczk, M.; Shahidi, F. Effect of Processing on the Antioxidant Activity of Millet Grains. Food Chem. 2012, 133, 1–9. [Google Scholar] [CrossRef]
  29. Pitts, K.F.; Favaro, J.; Austin, P.; Day, L. Co-Effect of Salt and Sugar on Extrusion Processing, Rheology, Structure and Fracture Mechanical Properties of Wheat-Corn Blend. J. Food Eng. 2014, 127, 58–66. [Google Scholar] [CrossRef]
  30. Bergesse, A.E.; Boiocchi, P.N.; Calandri, E.L.; Cervilla, N.S.; Gianna, V.; Guzmán, C.A.; Miranda, V.; Patricia, P.; Montoya, P.A.; Mufari, J.R. Aprovechamiento Integral del Grano de Quinua; Editorial Universitaria: La Paz, Bolivia, 2015. [Google Scholar]
  31. Uauy, R.; Teresa, M. Estimación de Las Necesidades de Energía a Nivel Nacional: Uso Del Enfoque FAO/OMS/UNU 1985. Arch. Latinoam. Nutr. 1988, 38, 466–482. [Google Scholar] [PubMed]
  32. INEM 517:2012; Norma Técnica Ecuatoriana. Instituto Ecuatoriano de Normalizacion: Quito, Ecuador, 2012; pp. 1–6.
  33. Paula, A.M.; Conti-Silva, A.C. Texture Profile and Correlation between Sensory and Instrumental Analyses on Extruded Snacks. J. Food Eng. 2014, 121, 9–14. [Google Scholar] [CrossRef]
  34. Coulter, L.A.; Lorenz, K. Extruded Corn Grits Quinoa Blends: II. Physical Characteristics of Extruded Products. J. Food Process. Preserv. 1991, 15, 243–259. [Google Scholar] [CrossRef]
  35. Ilo, S.; Liu, Y.; Berghofer, E. Extrusion Cooking of Rice Flour and Amaranth Blends. LWT-Food Sci. Technol. 1999, 32, 79–88. [Google Scholar] [CrossRef]
  36. Nayak, B.; Berrios, J.D.J.; Powers, J.R.; Tang, J.; Ji, Y. Colored Potatoes (Solanum tuberosum L.) Dried for Antioxidant-Rich Value-Added Foods. J. Food Process. Preserv. 2011, 35, 571–580. [Google Scholar] [CrossRef]
  37. Saeleaw, M.; Dürrschmid, K.; Schleining, G. The Effect of Extrusion Conditions on Mechanical-Sound and Sensory Evaluation of Rye Expanded Snack. J. Food Eng. 2012, 110, 532–540. [Google Scholar] [CrossRef]
  38. Menis, M.E.C.; Milani, T.M.G.; Jordano, A.; Boscolo, M.; Conti-Silva, A.C. Extrusion of Flavored Corn Grits: Structural Characteristics, Volatile Compounds Retention and Sensory Acceptability. LWT 2013, 54, 434–439. [Google Scholar] [CrossRef]
  39. Liu, Y.; Chen, J.; Luo, S.; Li, C.; Ye, J.; Liu, C.; Gilbert, R.G. Physicochemical and Structural Properties of Pregelatinized Starch Prepared by Improved Extrusion Cooking Technology. Carbohydr. Polym. 2017, 175, 265–272. [Google Scholar] [CrossRef]
  40. Anderson, R.A.; Conway, H.F.; Peplinski, A. 1 Gelatinization of Corn Grits by Roll Cooking, Extrusion Cooking and Steaming. Starch-Stärke 1970, 22, 130–135. [Google Scholar] [CrossRef]
  41. Vílchez, T.L.M.; Guevara, P.A.; Zelada, C.R.E. Influencia Del Tamaño de Partícula, Humedad y Temperatura En El Grado de Gelatinización Durante El Proceso de Extrusión de Maca (Lepidium Meyenii Walp). Rev. Soc. Quím. Perú 2018, 78, 126–137. [Google Scholar]
  42. Akande, O.A.A.; Nakimbugwe, D.; Mukisa, I.M. Optimization of Extrusion Conditions for the Production of Instant Grain Amaranth-Based Porridge Flour. Food Sci. Nutr. 2017, 5, 1205–1214. [Google Scholar] [CrossRef] [PubMed]
  43. Muñoz-Pabon, K.S.; Roa-Acosta, D.F.; Hoyos-Concha, J.L.; Bravo-Gómez, J.E.; Ortiz-Gómez, V. Quinoa Snack Production at an Industrial Level: Effect of Extrusion and Baking on Digestibility, Bioactive, Rheological, and Physical Properties. Foods 2022, 11, 3383. [Google Scholar] [CrossRef] [PubMed]
  44. Maldonado-Alvarado, P.; Trujillo, M. Gluten-Free Couscous Made from Quinoa Sprouts: Study of Shelf Life. Biol. Life Sci. Forum 2022, 17, 9. [Google Scholar] [CrossRef]
  45. Park, J.-H.; Lee, Y.-J.; Lim, J.-G.; Jeon, J.-H.; Yoon, K.-S.; Fernández-López, J.; Pateiro, M.; Victoria, M.; Martínez, S. Effect of Quinoa (Chenopodium quinoa Willd.) Starch and Seeds on the Physicochemical and Textural and Sensory Properties of Chicken Meatballs during Frozen Storage. Foods 2021, 10, 1601. [Google Scholar] [CrossRef]
  46. Solaesa, Á.G.; Villanueva, M.; Beltrán, S.; Ronda, F. Characterization of Quinoa Defatted by Supercritical Carbon Dioxide. Starch Enzymatic Susceptibility and Structural, Pasting and Thermal Properties. Food Bioprocess Technol. 2019, 12, 1593–1602. [Google Scholar] [CrossRef]
  47. Ward, S.M. Response to Selection for Reduced Grain Saponin Content in Quinoa (Chenopodium quinoa Willd.). Field Crops Res. 2000, 68, 157–163. [Google Scholar] [CrossRef]
  48. Mezzatesta, P.; Farah, S.; Di Fabio, A.; Emilia, R. Variation of the Nutritional Composition of Quinoa According to the Processing Used. Proceedings 2020, 53, 4. [Google Scholar] [CrossRef]
  49. Coţovanu, I.; Ungureanu-Iuga, M.; Mironeasa, S. Investigation of Quinoa Seeds Fractions and Their Application in Wheat Bread Production. Plants 2021, 10, 2150. [Google Scholar] [CrossRef]
  50. De Bock, P.; Van Bockstaele, F.; Muylle, H.; Quataert, P.; Vermeir, P.; Eeckhout, M.; Cnops, G. Yield and Nutritional Characterization of Thirteen Quinoa (Chenopodium quinoa Willd.) Varieties Grown in North-west Europe—Part i. Plants 2021, 10, 2689. [Google Scholar] [CrossRef]
  51. Amiryousefi, M.; Tadayon, M.R.; Ebrahimi, R. Energy and Exergy Efficiencies Assessment for Two Quinoa Cultivars Productions. Energy Rep. 2021, 7, 2324–2331. [Google Scholar] [CrossRef]
  52. NTP 205.062; Norma Técnica Peruana: Métodos de Ensayo de Productos de Panadería. Instituto Nacional de Calidad (INACAL): Lima, Peru, 2014; pp. 1–31.
  53. Koziol, M.J. Chemical Composition and Nutritional Evaluation of Quinoa (Chenopodium quinoa Willd.). J. Food Compos. Anal. 1992, 5, 35–68. [Google Scholar] [CrossRef]
  54. Rafik, S.; Rahmani, M.; Rodriguez, J.P.; Andam, S.; Ezzariai, A.; El Gharous, M.; Karboune, S.; Choukr-Allah, R.; Hirich, A. How Does Mechanical Pearling Affect Quinoa Nutrients and Saponin Contents? Plants 2021, 10, 1133. [Google Scholar] [CrossRef] [PubMed]
  55. Basilio, A.J. Obtención de Una Mezcla Alimenticia a Partir de Quinua (Chenopodium quinoa) y Kiwicha (Amaranthus caudatus) Extruidas y Molidas Lupinus Mutabilis); Universidad Nacional Agraria La Molina: Lima, Peru, 2020. [Google Scholar]
  56. Menegassi, B.; Pilosof, A.M.R.; Arêas, J.A.G. Comparison of Properties of Native and Extruded Amaranth (Amaranthus cruentus L.—BRS Alegría) Flour. LWT 2011, 44, 1915–1921. [Google Scholar] [CrossRef]
  57. Kaspchak, E.; de Oliveira, M.A.S.; Simas, F.F.; Franco, C.R.C.; Silveira, J.L.M.; Mafra, M.R.R.; Igarashi-Mafra, L. Determination of Heat-Set Gelation Capacity of a Quinoa Protein Isolate (Chenopodium quinoa) by Dynamic Oscillatory Rheological Analysis. Food Chem. 2017, 232, 263–271. [Google Scholar] [CrossRef]
  58. Chávez-Jáuregui, R.N.; Silva, M.E.M.P.; Arêas, J.A.G. Extrusion Cooking Process for Amaranth (Amaranthus caudatus L.); Institute of Food Technologists: Chicago, IL, USA, 2000; Volume 65. [Google Scholar]
  59. Ramos, D.J.M.; Kirjoranta, S.; Tenitz, S.; Penttilä, P.A.; Serimaa, R.; Lampi, A.M.; Jouppila, K. Use of Amaranth, Quinoa and Kañiwa in Extruded Corn-Based Snacks. J. Cereal Sci. 2013, 58, 59–67. [Google Scholar] [CrossRef]
  60. Doğan, H.; Karwe, M. V Physicochemical Properties of Quinoa Extrudates. Food Sci. Technol. Int. 2003, 9, 101–114. [Google Scholar] [CrossRef]
  61. Ruales, J.; Valencia, S.; Nair, B. Effect of Processing on the Physico-Chemical Characteristics of Quinoa Flour (Chenopodium quinoa, Willd). Starch-Stärke 1993, 45, 13–19. [Google Scholar] [CrossRef]
  62. Robin, F.; Théoduloz, C.; Srichuwong, S. Properties of Extruded Whole Grain Cereals and Pseudocereals Flours. Int. J. Food Sci. Technol. 2015, 50, 2152–2159. [Google Scholar] [CrossRef]
  63. Ramos-Diaz, J.M.; Rinnan, Å.; Jouppila, K. Application of NIR Imaging to the Study of Expanded Snacks Containing Amaranth, Quinoa and Kañiwa. LWT 2019, 102, 8–14. [Google Scholar] [CrossRef]
  64. González, R.; Carrara, C.; Tosi, E.; Añón, M.C.; Pilosof, A. Amaranth Starch-Rich Fraction Properties Modified by Extrusion and Fluidized Bed Heating. LWT 2007, 40, 136–143. [Google Scholar] [CrossRef]
  65. Oliveira, L.C.; Schmiele, M.; Steel, C.J. Development of Whole Grain Wheat Flour Extruded Cereal and Process Impacts on Color, Expansion, and Dry and Bowl-Life Texture. LWT 2017, 75, 261–270. [Google Scholar] [CrossRef]
  66. Pérez, K.; Elías, C.; Delgado, V. High-Protein Snack: An Extruded from Quinoa (Chenopodium quinoa Willd.), Tarwi (Lupinus mutabilis Sweet), and Sweet Potato (Ipomoea batatas L.). Sci. Agropecu. 2017, 8, 377–388. [Google Scholar] [CrossRef]
  67. Dushkova, M.; Simitchiev, A.; Petrova, T.; Menkov, N.; Desseva, I.; Mihaylova, D. Physical and Functional Characteristics of Extrudates Prepared from Quinoa Enriched with Goji Berry. Appl. Sci. 2023, 13, 3503. [Google Scholar] [CrossRef]
  68. Zambrano, Y.; Contardo, I.; Moreno, M.C.; Bouchon, P. Effect of Extrusion Temperature and Feed Moisture Content on the Microstructural Properties of Rice-Flour Pellets and Their Impact on the Expanded Product. Foods 2022, 11, 198. [Google Scholar] [CrossRef]
  69. Granato, D.; Masson, M.L. Instrumental Color and Sensory Acceptance of Soy-Based Emulsions: A Response Surface Approach Cor Instrumental e Aceitação Sensorial de Emulsões à Base de Soja: Uma Abordagem Através Da Metodologia de Superfície de Resposta. Cienc. Tecnol. Aliment. 2010, 30, 1090–1096. [Google Scholar] [CrossRef]
  70. Aguiar, E.V.; Santos, F.G.; Centeno, A.; Capriles, V. Defining Amaranth, Buckwheat and Quinoa Flour Levels in Gluten-Free Bread: A Simultaneous Improvement on Physical Properties, Acceptability and Nutrient Composition through Mixture Design. Foods 2022, 11, 848. [Google Scholar] [CrossRef]
Figure 1. The flow of operations is applied to obtain extruded quispiño.
Agriengineering 06 00223 g001
Figure 2. Percentages of lime and initial moisture content of extruded quinoa quispiño.
Agriengineering 06 00223 g002
Figure 3. Response surface and central composite design of the effect of lime and moisture on the variation of: (a) color, (b) humidity, (c) hardness, (d) gelatinization of the extruded quispiño.
Agriengineering 06 00223 g003
Figure 4. Response surface and central composite design of the effect of lime and moisture on the variation of (a) solubility index, (b) water absorption index, (c) index of expansion, and (d) bulk density of the extruded quispiño.
Agriengineering 06 00223 g004
Figure 5. Graph of the consumer acceptability score of extruded quispiño with 0.7% lime and 12.5% initial humidity content.
Agriengineering 06 00223 g005
Figure 6. Multivariate analysis of consumer acceptability and bagging of extruded quispiño. The black circles represent 19 males (42%) and the white circles represent 26 females (58%), who are the untrained judges who evaluated the extruded chypre treatments.
Agriengineering 06 00223 g006
Table 1. Physicochemical composition of quinoa Salcedo before and after processing.
ComponentQuinoa Grains (g/100 g)Quinoa Scarified Washed and Dried (g/100 g)
Carbohydrates (g/100 g)62.97 ± 0.0664.02 ± 0.22
Starch (g/100 g)NR60.7 ± 0.02 4
Amylopectin (%)NR20.65
Protein (g/100 g)13.27 ± 0.0612.90 ± 0.10
Moisture content (%)11.2 ± 0.0111.81 ± 0.03
Fiber (g/100 g)4.39 ± 0.012.76 ± 0.14
Fat (g/100 g)5.53 ± 0.016.18 ± 0.03
Ash (g/100 g. dry basis)2.66 ± 0.012.34 ± 0.03
Energy (kJ/100 g)1485.31 ± 0.381520.55 ± 1.80
Calcium (mg/100 g)NR9.49 ± 0.01 3
Iron (mg/100 g)NR2.26 ± 0.01 3
Table 2. Comprenhensive amino acid profile in pearled quinoa salcedo.
Parametersg/100 g of Proteinsmg/kg1 mg/kg/day
Glutamic Ac. 13.02130,200-
Arginine8.1481,400-
Aspartic acid7.7877,800-
Leucine 6.5265,20014
Phenylalanine and Tyrosine6.4564,50014
Isoleucine5.9459,40010
Lysine5.8858,80012
Glycine4.9249,200-
Methionine ** and Cystine4.5145,10013
Alanine3.9139,100-
Serine3.7237,200-
Threonine3.5135,1007
Valine3.4534,50010
Proline3.2632,600-
Histidine2.8228,200-
Tryptophan1.2412,4003.5
Table 3. Water mass is required for final moisture.
Moisture Content12.5 (%)13.5 (%)
ml (g)Mass of Water (g) Mass of Water (g)
10000.10010.2003
20000.20030.4005
40000.40050.8011
60000.60081.2016
Table 4. Color parameters of extruded quispiño and salcedo quinoa grains values are the mean ± standard deviation. L* = lightness, a* = yellow, b* = green, C* = chroma and °H = hue angle.
RunExtrusion ParametersColor Parameters
Lime (%)Moisture (%)L*a*b*C*°H
10.511.569.12 ± 0.644.52 ± 0.0923.80 ± 0.8624.23 ± 0.8379.23 ± 0.59
20.711.568.84 ± 0.284.97 ± 0.2123.77 ± 0.8424.29 ± 0.8678.19 ± 0.08
30.911.567.36 ± 0.354.45 ± 0.2024.69 ± 0.5225.09 ± 0.5479.78 ± 0.33
40.512.566.66 ± 0.505.38 ± 0.0223.98 ± 0.3024.57 ± 0.2977.34 ± 0.15
50.712.567.53 ± 0.714.16 ± 0.4324.54 ± 0.8224.90 ± 0.7780.37 ± 1.18
60.912.563.70 ± 0.655.21 ± 0.1025.34 ± 0.8025.87 ± 0.8078.37 ± 0.23
70.513.566.96 ± 1.315.79 ± 0.1724.92 ± 0.2325.59 ± 0.2076.92 ± 0.46
80.713.563.82 ± 0.746.35 ± 0.1524.55 ± 0.6425.36 ± 0.6375.50 ± 0.39
90.913.564.17 ± 0.267.59 ± 0.2924.55 ± 0.6325.69 ± 0.6972.81 ± 0.24
Unextruded quinoa grains75.28 ± 0.433.41 ± 0.1622.09 ± 0.2622.35 ± 0.2381.23 ± 0.50
Table 5. Physical characteristics of extruded quispiño values are the mean ± standard deviation.
RunExtrusion ParametersPhysical Characteristics
Lime (%)Moisture (%)ΔEHf (%)Hardness (N)DGWSI (%)WAI (g/g)SEIAD (g/cm3)
10.511.56.54 ± 0.894.51 ± 0.0211.60 ± 3.0647 ± 41.6828.06 ± 7.273.73 ± 0.6313.08 ±3.920.13 ± 0.03
20.711.56.90 ± 0.413.08 ± 0.039.94 ± 2.03237 ± 21.5127.33 ± 2.714.68 ± 0.9811.41 ± 2.970.11 ± 0.06
30.911.58.41 ± 0.883.33 ± 0.0612.42 ± 2.64247 ± 33.7360.73 ± 4.6466.62 ± 0.079.00 ± 2.430.17 ± 0.07
40.512.59.07 ± 0.846.12 ± 0.1313.25 ± 2.9522 ± 3.548.94 ± 0.116.94 ± 0.648.41 ± 1.730.16 ± 0.03
50.712.58.24 ± 0.846.12 ± 0.1613.16 ± 4.2084 ± 7.078.70 ± 0.436.35 ± 0.399.20 ± 2.000.15 ± 0.09
60.912.512.20 ± 0.246.00 ± 0.0625.86 ± 8.8569 ± 15.4131.83 ± 17.2566.89 ± 0.038.24 ± 1.620.16 ± 0.07
70.513.59.14 ± 1.475.66 ± 0.157.25 ± 1.60133 ± 103.6228.29 ± 1.284.18 ± 0.519.27 ± 2.140.09 ± 0.06
80.713.512.12 ± 0.935.04 ± 0.099.97 ± 2.46137 ± 62.8571.61 ± 9.6066.51 ± 0.069.43 ± 2.700.12 ± 0.06
90.913.512.14 ± 0.224.63 ± 0.0611.92 ± 2.99102 ± 49.5047.09 ± 16.3966.65 ± 0.267.33 ± 1.230.17 ± 0.09
Quinoa flour---4 ± 3.540.17 ± 7.88---
Extruded chocolate-flavored corn11.65 ± 0.47
Table 6. Consumer acceptability score of extruded quispiño with 0.7% lime and 12.5% initial moisture.
AspectsTasteColorAppearanceOdorTexture
Average7 ± 2.068 ± 3.006 ± 2.594 ± 3.296 ± 3.19
Coefficient of variation27.7439.8642.7386.6957.53
Disclaimer/Publisher’s Note: The statements, opinions and data contained in all publications are solely those of the individual author(s) and contributor(s) and not of MDPI and/or the editor(s). MDPI and/or the editor(s) disclaim responsibility for any injury to people or property resulting from any ideas, methods, instructions or products referred to in the content.

