Article

Two-Stage Ensemble Deep Learning Model for Precise Leaf Abnormality Detection in Centella asiatica

by
Budsaba Buakum
1,
Monika Kosacka-Olejnik
2,
Rapeepan Pitakaso
3,
Thanatkij Srichok
3,
Surajet Khonjun
3,*,
Peerawat Luesak
4,
Natthapong Nanthasamroeng
5 and
Sarayut Gonwirat
6
1
Department of Horticulture, Faculty of Agriculture, Ubon Ratchathani University, Ubon Ratchathani 34190, Thailand
2
Faculty of Engineering Management, Poznan University of Technology, 60965 Poznan, Poland
3
Artificial Intelligence Optimization SMART Laboratory, Industrial Engineering Department, Faculty of Engineering, Ubon Ratchathani University, Ubon Ratchathani 34190, Thailand
4
Department of Industrial Engineering, Faculty of Engineering, Rajamangala University of Technology Lanna, Chiang Rai 57120, Thailand
5
Artificial Intelligence Optimization SMART Laboratory, Engineering Technology Department, Faculty of Industrial Technology, Ubon Ratchathani Rajabhat University, Ubon Ratchathani 34000, Thailand
6
Department of Computer Engineering and Automation, Kalasin University, Kalasin 46000, Thailand
*
Author to whom correspondence should be addressed.
AgriEngineering 2024, 6(1), 620-644; https://doi.org/10.3390/agriengineering6010037
Submission received: 6 October 2023 / Revised: 8 February 2024 / Accepted: 27 February 2024 / Published: 4 March 2024

Abstract

:
Leaf abnormalities pose a significant threat to agricultural productivity, particularly in medicinal plants such as Centella asiatica (Linn.) Urban (CAU), where they can severely impact both the yield and the quality of leaf-derived substances. In this study, we focus on the early detection of such leaf diseases in CAU, a critical intervention for minimizing crop damage and ensuring plant health. We propose a novel parallel-Variable Neighborhood Strategy Adaptive Search (parallel-VaNSAS) ensemble deep learning method specifically designed for this purpose. Our approach is distinguished by a two-stage ensemble model, which combines the strengths of advanced image segmentation and Convolutional Neural Networks (CNNs) to detect leaf diseases with high accuracy and efficiency. In the first stage, we employ U-net, Mask-R-CNN, and DeepNetV3++ for the precise image segmentation of leaf abnormalities. This step is crucial for accurately identifying diseased regions, thereby facilitating a focused and effective analysis in the subsequent stage. The second stage utilizes ShuffleNetV2, SqueezeNetV2, and MobileNetV3, which are robust CNN architectures, to classify the segmented images into different categories of leaf diseases. This two-stage methodology significantly improves the quality of disease detection over traditional methods. By employing a combination of ensemble segmentation and diverse CNN models, we achieve a comprehensive and nuanced analysis of leaf diseases. Our model’s efficacy is further enhanced through the integration of four decision fusion strategies: unweighted average (UWA), differential evolution (DE), particle swarm optimization (PSO), and Variable Neighborhood Strategy Adaptive Search (VaNSAS). Through extensive evaluations of the ABL-1 and ABL-2 datasets, which include a total of 14,860 images encompassing eight types of leaf abnormalities, our model demonstrates its superiority. The ensemble segmentation method outperforms single-method approaches by 7.34%, and our heterogeneous ensemble model excels by 8.43% and 14.59% compared to the homogeneous ensemble and single models, respectively. Additionally, image augmentation contributes to a 5.37% improvement in model performance, and the VaNSAS strategy enhances solution quality significantly over other decision fusion methods. Overall, our novel parallel-VaNSAS ensemble deep learning method represents a significant advancement in the detection of leaf diseases in CAU, promising a more effective approach to maintaining crop health and productivity.

1. Introduction

Agriculture is a vital pillar of many economies, facing significant challenges due to climate change. Among these challenges, crop susceptibility to diseases has profound implications for growth and yield [1]. Centella asiatica (Linn.) Urban (CAU), commonly known as Gotu Kola, is of particular interest due to its extensive medicinal properties [2]. However, like other crops, CAU is prone to leaf abnormalities, which can adversely impact its growth and the quality of its bioactive compounds, especially asiaticoside, a crucial triterpenoid saponin [3]. Leaf abnormalities have been found to reduce the concentration of asiaticoside, potentially diminishing its medicinal properties [4]. Therefore, the early detection and classification of leaf abnormalities is essential to mitigate the impact of these diseases [5].
Currently, leaf disease detection in plants, including CAU, relies on visual inspection by human experts such as agricultural professionals and botanists [6]. However, this subjective approach has limitations, leading to inconsistencies in disease identification due to varied interpretations of visual symptoms [7]. Additionally, it is time-consuming and may not effectively identify early-stage or subtle diseases, resulting in increased crop losses and reduced medicinal properties for CAU [8]. Thus, there is a clear research gap that necessitates the development of automated and efficient methods for disease detection in CAU and other crops [9]. Deep learning-based ensemble techniques, such as Convolutional Neural Networks (CNNs) and feature extraction methods, offer a promising solution, enabling more precise and timely disease identification and classification.
Recently, a novel double artificial multiple intelligence system (AMIS) was proposed for skin cancer detection [10]. The AMIS integrated various image segmentation techniques, including U-net, the threshold method, edge detection, and the clustering method, and fused CNN architectures, such as ConvNeXtSmall, EfficientNetV2B3, and EfficientNetV2S, resulting in a superior performance over other state-of-the-art methods. However, pertinent research gaps remain to be addressed. Recent studies by Triki et al. [11] and Wang et al. [12] have introduced effective segmentation methods such as Mask-R-CNN and DeepLabV3+ for leaf detection. Zhao and Wang [13], Setiawan et al. [14], and Zhang et al. [15] presented compact yet powerful CNN architectures, including MobileNetV3-Small, SqueezeNetV2, and ShuffleNetV2, which have shown outstanding results in image classification tasks, including crop detection. Moreover, Pitakaso et al. [16] introduced the Variable Neighborhood Strategy Adaptive Search (VaNSAS), offering a promising alternative to AMIS with a comparable solution quality and reduced computational time.
In this study, we propose a two-stage VaNSAS ensemble deep learning approach, incorporating novel image segmentation methods and CNN architectures, to enhance the accuracy and efficiency of leaf disease detection in CAU. The primary research contribution lies in the development of this two-stage ensemble deep learning model, which effectively integrates modified CNN architectures with efficient decision fusion strategies. This study effectively addresses the research gap concerning the automated and efficient detection of leaf abnormalities in CAU. By implementing this ensemble approach, this research overcomes the limitations of traditional methods, such as subjective visual inspection, providing a precise and timely disease identification and classification system tailored for detecting leaf abnormalities in CAU leaves. This advancement holds promising implications for the field of plant disease detection, potentially fostering enhanced agricultural practices and safeguarding crop yields and medicinal properties in CAU.
The organization of this paper is as follows: Section 2 will present the related literature, while Section 3 and Section 4 will illustrate the proposed model and computational results. Finally, Section 5 and Section 6 will provide the discussion and conclusion.

2. Related Literature

This research covers two essential aspects, highlighting its contributions. The first aspect concerns existing methodologies for detecting leaf diseases or abnormalities in plants, especially CAU. The second aspect explores the emerging field of deep learning-based ensemble techniques, specifically examining relevant studies that employ ensemble models for early disease identification. This discussion emphasizes the potential advantages of ensemble approaches compared to conventional methods.

2.1. Contemporary Methods for Detecting Leaf Diseases in CAU: Limitations, Challenges, and Our Approach

The early and accurate detection of leaf diseases in crops like C. asiatica (CAU) is crucial for maintaining agricultural productivity and food security. Recent advancements in this field have primarily centered around deep learning techniques, notably convolutional neural networks (CNNs), which have shown promising results in identifying and diagnosing plant leaf diseases with high accuracy [17,18,19]. These modern approaches, including the use of transfer learning with pre-trained models and image processing techniques, have marked a significant shift in disease detection methodologies [20,21].
Deep learning has emerged as a transformative technique in agricultural disease detection, utilizing various CNN architectures such as AlexNet, GoogLeNet, VGGNet, DenseNet, SqueezeNet, ResNet, and MobileNet. These models have demonstrated high accuracy levels, with some achieving rates between 96.58% and 99% [22,23,24,25]. Transfer learning, especially using architectures such as AlexNet and MobileNetV2, has been effective in feature extraction and disease classification [26,27].
Despite these advancements, the application of such models to specific crops, such as CAU, presents notable limitations and challenges. The primary challenge lies in the development of specialized models and datasets that consider the unique characteristics and disease patterns of individual crops. There is also a need for models that can operate effectively with limited data, a common scenario in specific crop disease detection. Additionally, improving the scalability and accessibility of these methods is crucial for their practical implementation in diverse agricultural settings.
Our study aims to address these limitations by developing a novel parallel-Variable Neighborhood Strategy Adaptive Search (parallel-VaNSAS) ensemble deep learning method that is tailored for CAU leaf disease detection. This approach employs a two-stage model that first uses advanced image segmentation techniques, such as U-net, Mask-R-CNN, and DeepNetV3++, for the precise identification of diseased regions. The second stage involves the application of robust CNNs, such as ShuffleNetV2, SqueezeNetV2, and MobileNetV3, for accurate disease classification. This method not only enhances the accuracy of disease detection but also overcomes the challenges of limited data and model generalization, making it a more viable solution for CAU and rendering it potentially adaptable for other crops.

2.2. Deep Learning-Based Ensemble Techniques in Leaf Disease Detection: Focused Approaches and Advancements

The application of ensemble methods in the domain of leaf disease detection represents a significant advancement, leveraging the combined strengths of multiple deep learning models to enhance detection accuracy and robustness. These ensemble techniques, particularly tailored for plant leaf disease detection, offer improved performance through error reduction and overfitting mitigation, which is crucial for accurate and reliable disease diagnosis in crops such as C. asiatica (CAU) [28,29,30].
In the context of leaf disease detection, ensemble deep learning models primarily focus on integrating various Convolutional Neural Network (CNN) architectures. This integration allows for a comprehensive analysis of leaf imagery, leveraging diverse perspectives from multiple models to enhance disease classification accuracy [31,32,33,34]. Key to this approach is the use of advanced image segmentation techniques, which enable the precise identification of diseased areas on leaves. Prominent models such as U-Net, Mask R-CNN, and DeepLabV3 have been employed for this purpose, demonstrating their efficacy in accurately segmenting leaf images [35,36,37,38,39,40].
Further, these ensemble methods often incorporate image augmentation techniques to expand the dataset and introduce variability, thereby improving the model’s ability to generalize and recognize diverse disease patterns. Techniques such as flipping, rotation, scaling, and color adjustments are commonly used to augment the training data, contributing significantly to the model’s performance [41,42].
An efficient decision fusion strategy forms an integral component of these ensemble models. By optimizing the combination of outputs from various CNN architectures, these strategies ensure that the final disease classification leverages the strengths of each constituent model. Recent advancements in this area include metaheuristic approaches, such as differential evolution (DE) and particle swarm optimization (PSO), which have been adapted to optimize ensemble model weights for enhanced accuracy in disease detection [43].
In our research, we aim to capitalize on these advancements by developing a two-stage ensemble deep learning model specifically for leaf disease detection in CAU. This model combines diverse segmentation techniques and CNN architectures, employing a novel decision fusion approach to maximize accuracy. Our approach is expected to address the unique challenges met in detecting leaf diseases in CAU, setting a new standard in precision and reliability in this critical agricultural task.

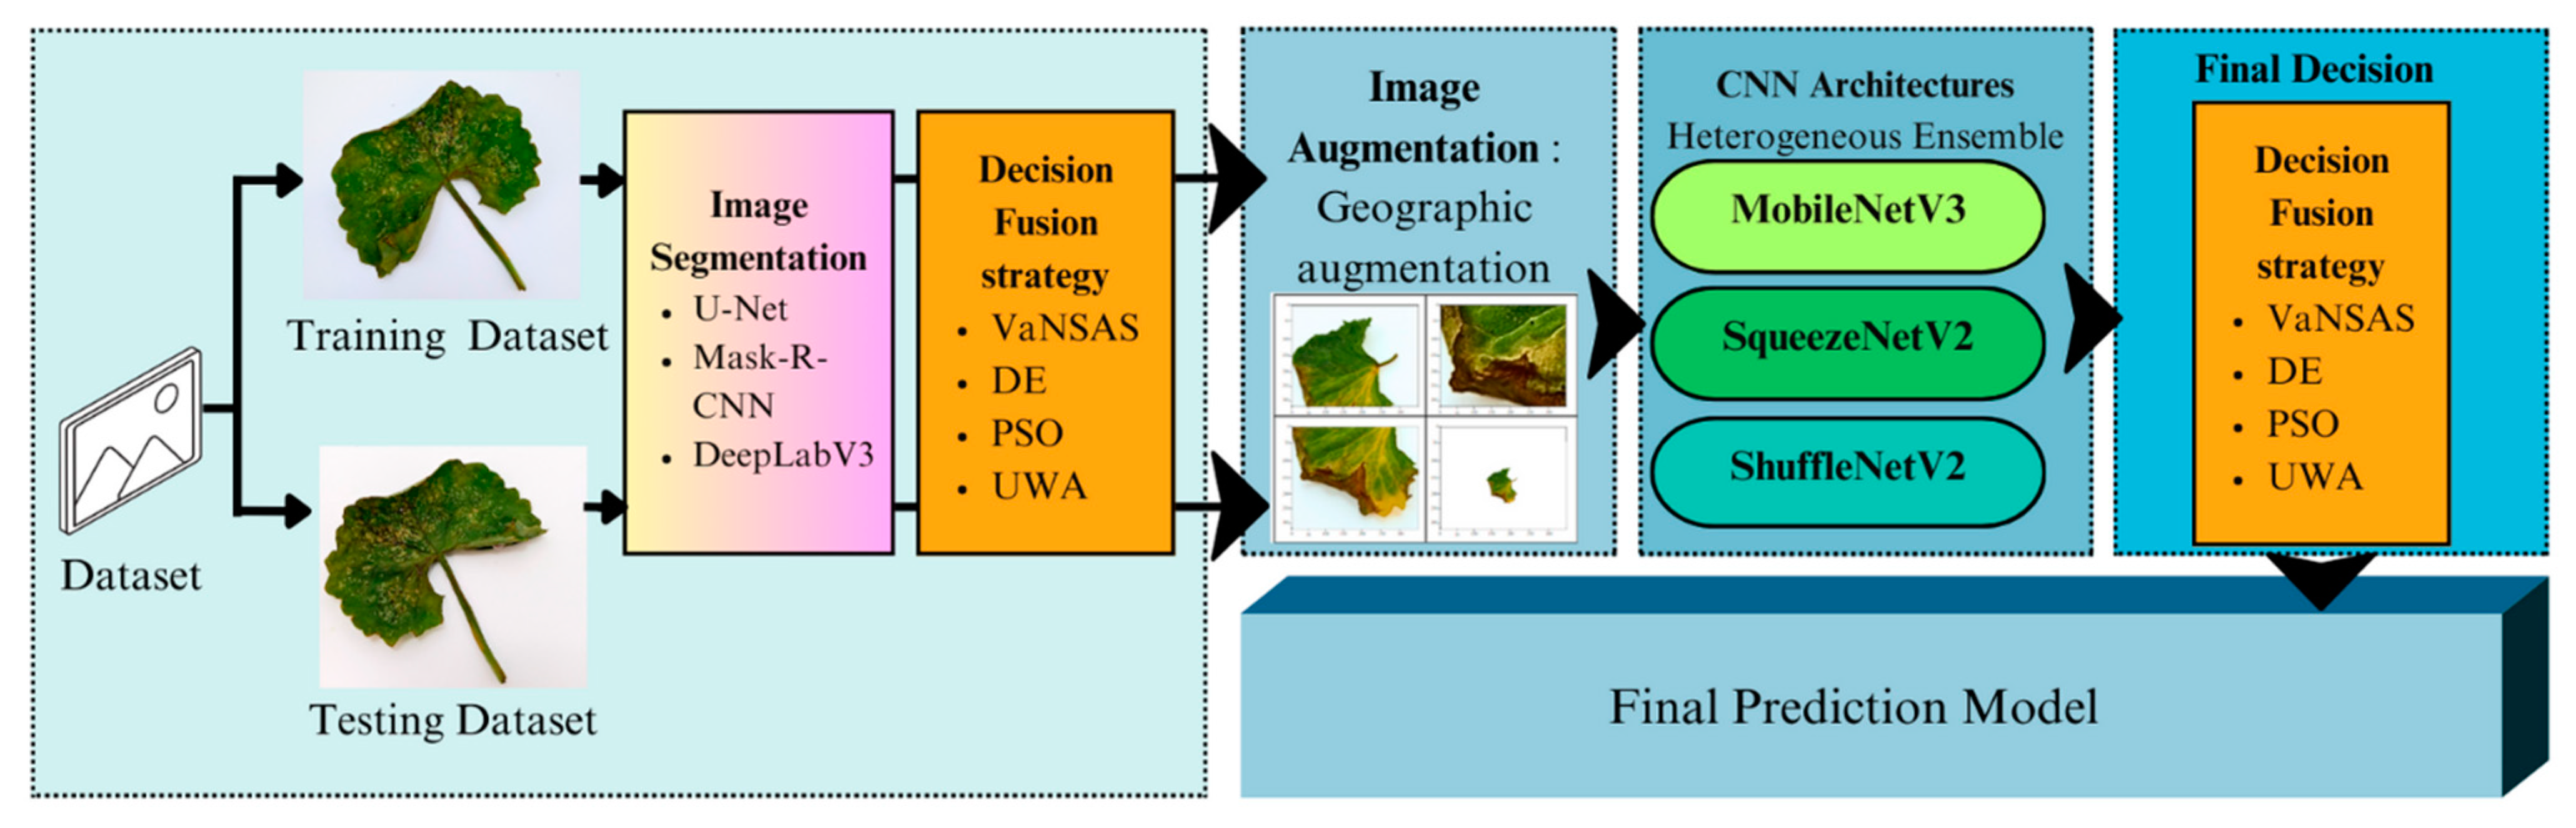
3. Research Methodology

The research methodology for creating a deep learning model to classify leaf abnormalities in CAU comprises data collection, preprocessing, feature extraction, and deep learning model development. Model performance evaluation will employ metrics such as accuracy, precision, recall, and an F1-score, and testing will be conducted with a new set of images to assess generalizability. This study seeks to showcase the efficacy of deep learning techniques in detecting and managing leaf abnormalities in CAU, thereby contributing to advancements in agricultural management.

3.1. Dataset Preparation

To prepare datasets for various types of leaf abnormalities in CAU, leaf images should be collected and labeled according to their corresponding abnormality type or health status in Table 1. The dataset should be balanced and split into training, validation, and testing sets to ensure the model’s accuracy and generalizability. In addition, preprocessing the dataset is important to remove any noise, such as background clutter or lighting variations. Properly preparing the dataset is crucial in training deep learning algorithms to accurately differentiate between healthy and abnormal leaves and develop an effective classification model for efficient abnormality detection and management in agricultural practices.
The images of leaf abnormalities in CAU were obtained from a smart farm system where the plant’s growth is controlled and monitored using hydroponics and lighting systems. The smart farm can regulate the amount of light and nutrients provided to the plant, among other factors. To obtain the images of the leaf abnormalities, plants were grown for 12 weeks under these controlled conditions, and leaves with various abnormalities were collected and photographed. These images are used to create a dataset for the development of a machine learning model to classify the different types of leaf abnormalities. All images have been divided into five classes: (1) normal leaf (NL), (2) red mite disease (RM), nitrogen deficiency (ND), potassium deficiency (PD), and phosphorus deficiency (PHD).
In our study, we divided the image data into two groups, namely, ABL-1 and ABL-2, which contain different numbers of images. ABL-1 was further divided into two subsets, each comprising a training set (80%) and a testing set (20%). On the other hand, ABL-2 was reserved as an unseen dataset and was used solely for testing the algorithm. Table 2 provides a breakdown of the number of images in each class, which were distributed across the training and testing datasets. This approach allowed us to train and validate the algorithm using multiple datasets, ensuring that the results obtained were reliable and robust.
Table 2 shows dataset ABL-1, comprising 14,860 images classified into classes NL, RM, ND, PD, LI, WD, WCD, and PHD, with corresponding image counts of 1250, 1200, 1300, 1350, 1340, 1330, 1280, and 1300, respectively. Furthermore, dataset ABL-2 displays varying image counts in each class, ranging from 500 to 600 images. The datasets are available at https://doi.org/10.34740/KAGGLE/DS/3619913 (accessed on 6 October 2023).
In this study, we have strategically divided our dataset into two distinct types, ABL-1 and ABL-2, to comprehensively assess the performance of our proposed model. ABL-1, constituting a diverse range of leaf images, serves as the training set, enabling the model to learn and adapt to a wide spectrum of leaf disease manifestations. To validate the model’s performance during training and prevent overfitting, we employed a cross-validation approach within ABL-1. This technique allowed us to iteratively use different subsets of ABL-1 as a validation set, providing us with essential feedback on the model’s adaptability and generalizability.
ABL-2, an entirely unseen dataset, was reserved exclusively for final testing. This approach was crucial in evaluating the model’s effectiveness in real-world scenarios where it would encounter data not present during the training phase. The use of ABL-2 as a separate testing set ensures that we assess the model’s generalization capabilities thoroughly. The combination of rigorous cross-validation within ABL-1 and the subsequent testing on ABL-2 offers a robust framework for validating our model’s performance, addressing concerns of overfitting, and ensuring its applicability in practical settings.

3.2. Model Building Classification

The models developed in our study are designed to identify and classify leaf diseases in plants, specifically focusing on C. asiatica. The input for these models is high-resolution images of plant leaves, which are subjected to various preprocessing steps to enhance their features. The output of these models is the classification of leaf conditions, categorizing them into healthy or various disease states. This is clearly illustrated in this paper, particularly in the sections discussing the methodology and model implementation.
Our He-Meta model features an advanced, multi-layered neural network architecture specifically tailored for plant disease detection. The model commences with preprocessing layers that normalize and condition the input data, preparing it for deeper analysis. This is followed by a series of convolutional layers, each intricately designed to extract and refine features, capturing detailed patterns essential for identifying diseases in plant leaves.
Subsequent pooling layers effectively reduce dimensionality, ensuring computational efficiency while preserving key information. The architecture culminates with fully connected layers, leading to a final softmax classification layer. This layer outputs a probabilistic distribution across potential disease categories, enabling accurate diagnostics.
The model’s design is visually represented in our manuscript through detailed schematics, offering an intuitive understanding of its operation. Each layer is clearly defined, elucidating its individual and collective roles in disease detection. The He-Meta model is not just technically robust but also practically viable for agricultural applications, showcasing its ability to differentiate effectively between healthy and diseased plant leaves.
The model consists of two stages: image segmentation and classification. In the first stage, the input image is segmented into regions of interest using multiple segmentation methods, including Otsu’s thresholding, K-means clustering, and watershed segmentation. These segmented regions are then used as inputs for the second stage, which involves classification using an ensemble of three convolutional neural network (CNN) architectures: ShuffleNetV2, SqueezeNetV2, and MobileNetV3. The outputs of these three CNNs are combined using a meta-learner to make the final classification decision.
To further improve the performance of the model, geometric image augmentation techniques are applied to the input images. This involves applying random transformations to the images, such as rotation, scaling, and flipping, to increase the diversity of the training data and improve the model’s ability to generalize to new images.
Overall, the proposed model is a heterogeneous ensemble approach that combines multiple segmentation methods, geometric image augmentation, and an ensemble of CNN architectures to achieve improved solution quality and classification accuracy. The model’s performance is evaluated using multiple metrics such as accuracy, AUC, and an F1-score to ensure a comprehensive evaluation of the model’s performance.
The proposed approach to develop the leaf abnormality classification model in CAU involves a multi-stage process aimed at enhancing model accuracy and performance. Firstly, image segmentation techniques will be employed to eliminate extraneous information and reduce the computational burden by focusing on regions of interest. Secondly, image augmentation techniques will expand the training dataset, increasing image variety and complexity for improved generalization and robustness. Finally, an ensemble deep learning approach will be adopted, combining diverse CNN architectures for a powerful and accurate classification model. This ensemble strategy ensures reliable predictions of leaf abnormalities in CAU by capitalizing on the strengths of multiple models while mitigating their weaknesses.

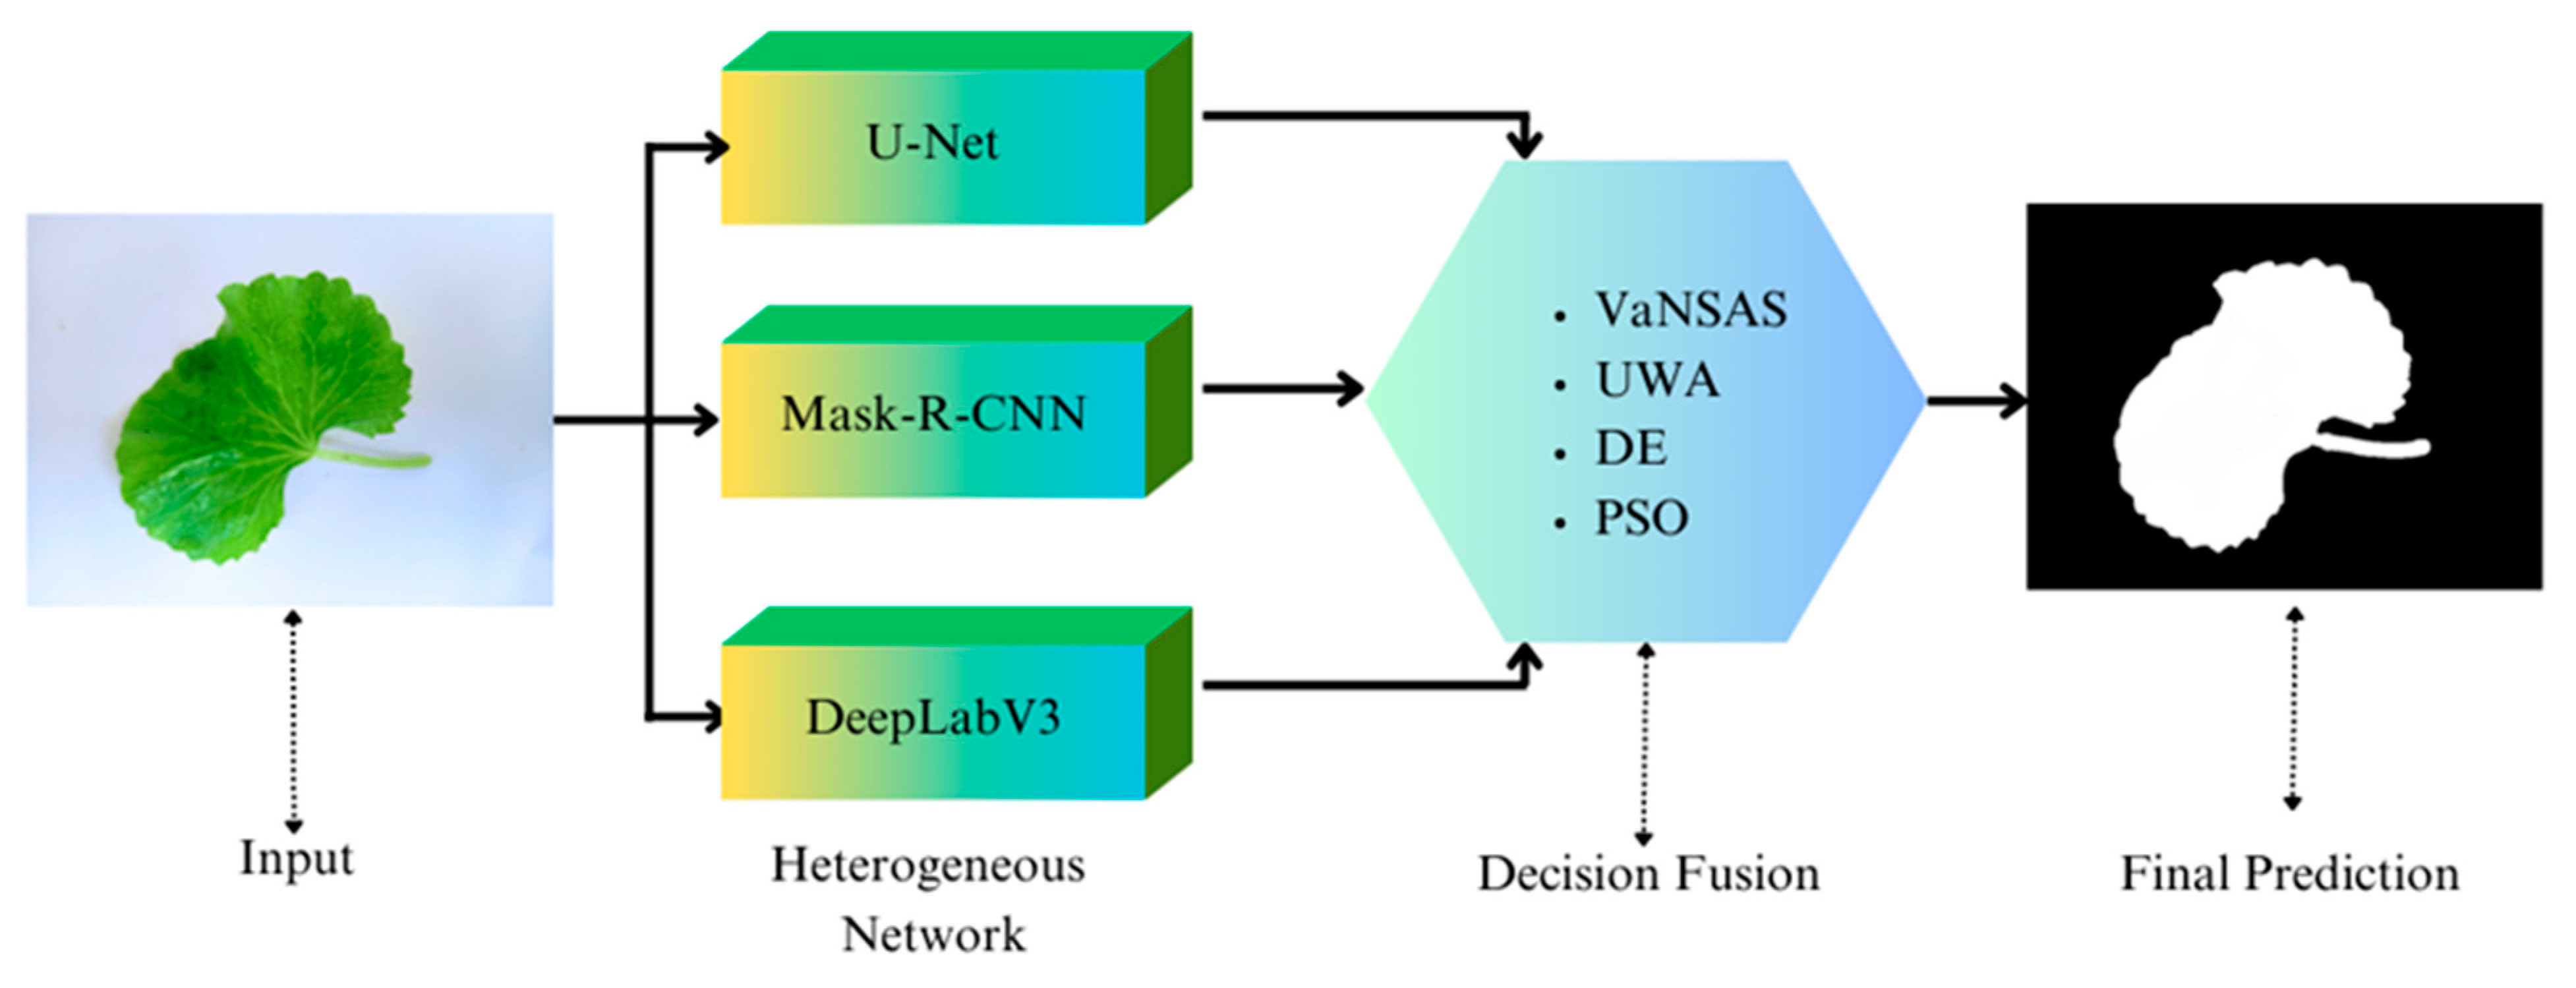
3.2.1. Image Segmentation

Image segmentation plays a pivotal role in ensuring the accuracy and efficacy of deep learning-based models for leaf abnormality classification in CAU. By discerning and distinguishing various leaf regions, including healthy and abnormal ones, segmentation enables precise diagnosis and classification. To develop the leaf abnormality classification model in CAU, various image segmentation methods are available, among which the U-net, Mask R-CNN, and DeepLabV3+ architectures stand out as popular and effective.
The selection of U-net, Mask R-CNN, and DeepLabV3+ as the image segmentation methods for our ensemble leaf disease classification system is well-founded and justifiable due to their distinct and complementary strengths. U-net excels in accurately delineating intricate object boundaries, which is crucial for precise leaf disease localization. Meanwhile, Mask R-CNN’s capability to perform instance segmentation empowers the system to distinguish between multiple overlapping instances of the same disease, enhancing classification accuracy in crowded leaf images. Moreover, the incorporation of DeepLabV3+ makes available its exceptional ability to capture multi-scale contextual information, facilitating the robust segmentation of diverse leaf structures and background elements. By leveraging the unique advantages of these three state-of-the-art models, our ensemble segmentation technique aims to combine their complementary strengths, thereby bolstering the accuracy and efficacy of our leaf disease classification system and instilling confidence in its ability to yield superior performance compared to using any single segmentation method.
U-net is known for its encoder–decoder architecture, where the encoder captures the contextual information from the input image, and the decoder recovers the spatial information by up-sampling the feature maps [44,45]. The skip connections between the corresponding encoder and decoder layers enable the preservation of fine-grained details during the up-sampling process. This characteristic makes U-net particularly effective in tasks where the precise localization of object boundaries is crucial. It excels in medical image segmentation and in other applications where the objects of interest exhibit intricate shapes and fine structures.
Mask R-CNN extends the popular Faster R-CNN object detection framework to perform instance segmentation [11]. It is capable of both object detection and pixel-level segmentation within the same model. The key advantage of Mask R-CNN is its ability to generate individual object masks, allowing it to differentiate between instances of the same object class. This makes Mask R-CNN well-suited for scenarios with multiple overlapping objects, where distinguishing between instances is critical. Applications include computer vision tasks involving crowded scenes, object counting, and interactive image segmentation.
DeepLabV3+ is a state-of-the-art semantic image segmentation model that utilizes dilated convolutions to capture multi-scale contextual information effectively [12]. This helps in preserving both local and global information within the segmented regions. Additionally, DeepLabV3+ incorporates an Atrous Spatial Pyramid Pooling (ASPP) module, which further enhances the model’s ability to handle objects of various sizes. Its remarkable performance on large-scale datasets and complex scenes with diverse objects makes it particularly advantageous for semantic segmentation tasks in areas such as autonomous driving, urban scene comprehension, and satellite imagery analysis.
All methods will be used in the same model as the heterogeneous image segmentation methods. The solutions yielded by different techniques will be combined using the meta-learner, which will be used as the decision fusion strategy (explained in a later section). The heterogeneous image segmentation framework is depicted in Figure 1.
Figure 1 illustrates the process whereby the CAU undergoes segmentation using three distinct image segmentation techniques, each generating its own respective solutions. Subsequently, a meta-learning approach is employed to fuse these individual solutions into a unified segmentation result. This methodology increases the likelihood of selecting the most appropriate segmentation method for specific image types, in contrast to relying solely on a single segmentation technique. The resultant solution is further augmented by optimal weights adjusted through the meta-learning process, thereby yielding the most optimal image-segmented outcomes.

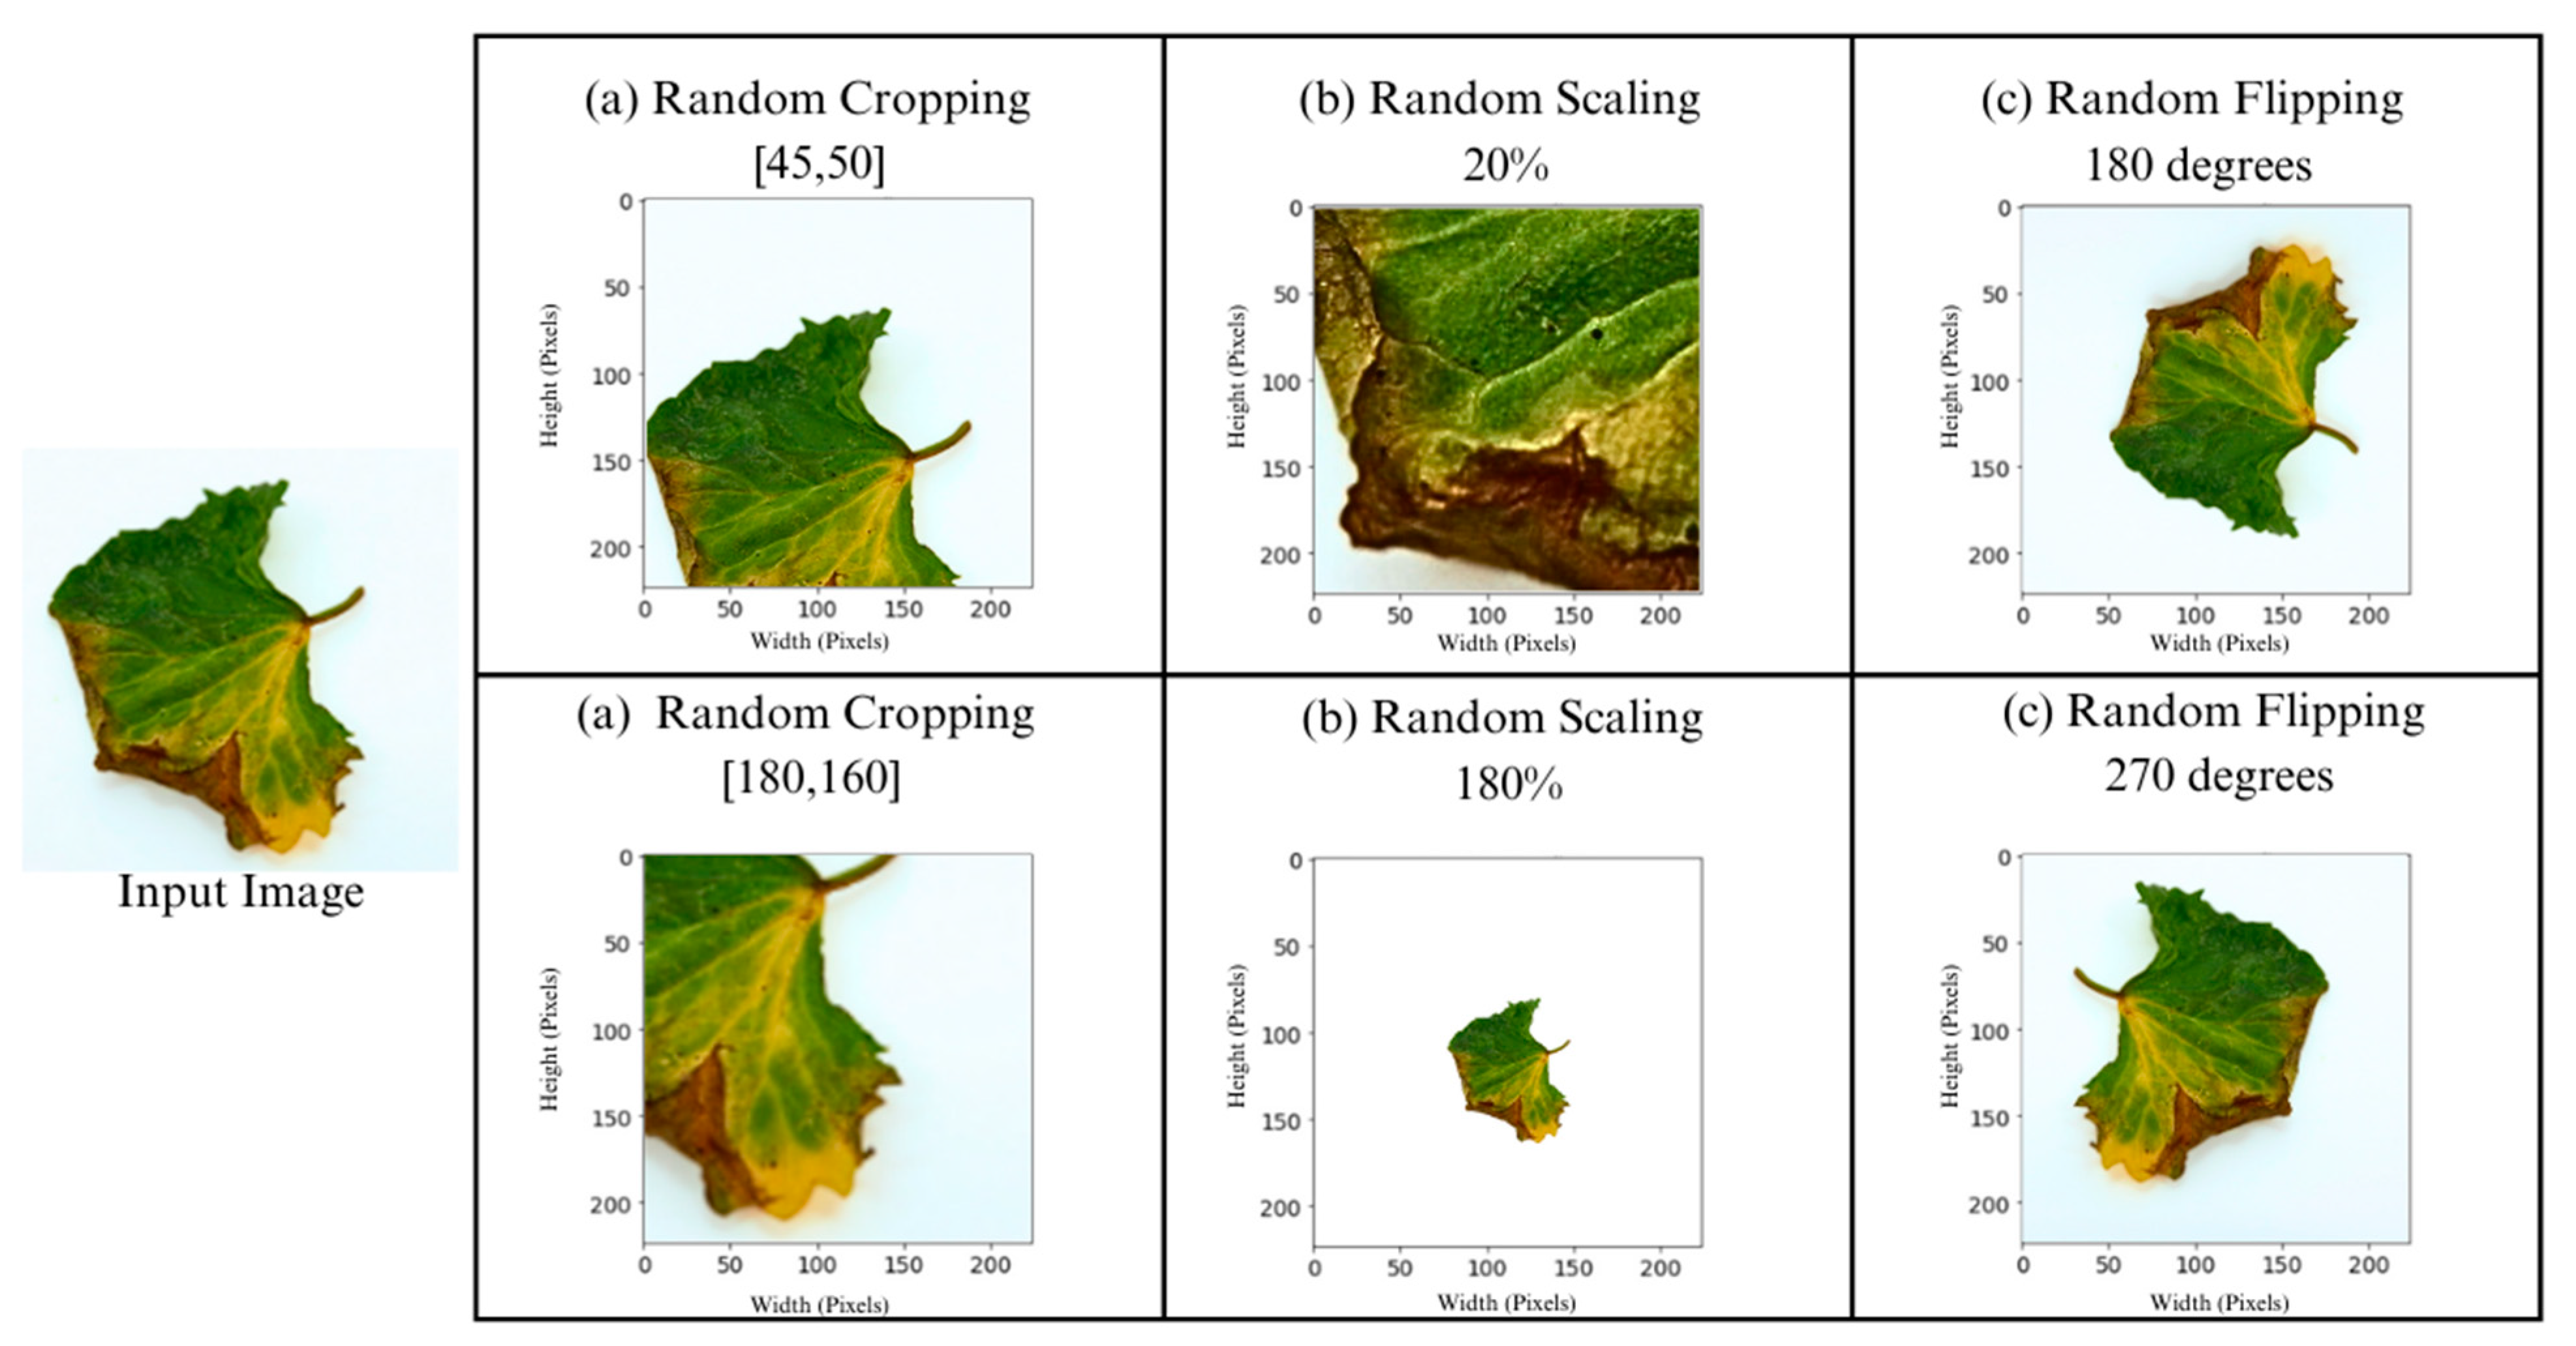
3.2.2. Image Augmentation

Image augmentation constitutes a fundamental and indispensable technique for enhancing model performance and accuracy. It involves artificially expanding the training dataset by applying diverse transformations to the images, encompassing rotations flips, zooms, and color jittering. This process fosters an increased image variety and complexity, thereby facilitating superior model generalization and robustness. In the context of CAU, the integration of image augmentation aids the model in recognizing a broader spectrum of leaf abnormalities and variations.
Various image augmentation techniques have been proposed and effectively employed in prior research [46,47]. These include random cropping, random rotation, random scaling, and random flipping. These techniques have demonstrated significant improvements in model performance and generalization. Random cropping generates additional training images by randomly selecting sub-regions from the original image, while random rotation and scaling simulate variations in leaf orientation and size, respectively. Incorporating these augmentation methods bolsters the model’s capability to accurately detect and classify leaf abnormalities, contributing to more comprehensive and reliable agricultural management and disease prevention. Figure 2 shows an example of the image augmentation used in this research.

3.2.3. CNN Architectures

Our proposed ensemble deep learning-based model for classifying leaf abnormalities in CAU comprises three selected CNN architectures: MobileNetV3-Small [13], SqueezeNetV2 [14], and ShuffleNetV2 [15]. These CNN architectures were chosen due to their small size, high accuracy, and efficiency in various computer vision tasks, particularly on mobile and embedded devices. Their sizes range from 0.5 to 5 MB, and they have a demonstrated accuracy exceeding 90% in diverse applications [44,48,49].
By effectively fusing the strengths of these models and minimizing their weaknesses, our proposed model significantly enhances the accuracy and effectiveness of leaf abnormality detection and diagnosis in CAU. This provides farmers with a reliable and efficient tool to manage and prevent plant diseases, leading to improved crop yields and enhanced farm profitability.
MobileNetV3-Small was selected for its efficiency and suitability for mobile and embedded applications. It achieves high accuracy in image classification while requiring fewer computational resources. This CNN was trained on a substantial dataset of healthy and abnormal CAU leaves, and its output was combined with other integrated CNNs to enhance the classification system’s accuracy.
SqueezeNetV2 was chosen for its compact size and low computational complexity, yet it maintains high accuracy in image classification. The ensemble was trained on a dataset of healthy and abnormal CAU leaves, and its output was combined with other CNNs using model stacking.
ShuffleNetV2 was selected for its high accuracy and low computational cost, which are achieved through channel shuffle operations. It was trained on a large dataset of labeled images of CAU leaves with different types of abnormalities. In the ensemble model, its output was combined with other CNNs using a weighted average approach.
The utilization of an ensemble deep learning model, combining multiple CNN outputs, results in improved accuracy and robustness in the CAU leaf abnormality classification system. Each CNN’s unique characteristics in the ensemble model enable the more accurate and efficient identification of diseased leaves, ultimately enhancing the overall productivity and quality of CAU leaf production.

3.2.4. Optimizing of the Decision Fusion Strategy

In our research, we have embraced a tailored variant of the Variable Neighborhood Strategy Adaptive Search (VaNSAS) as the preferred decision fusion approach, which has been effectively employed in both image segmentation and CNN architecture integration. Originally introduced by Pitakaso et al. [16], VaNSAS successfully addresses a specialized case of the vehicle routing problem (VRP), showcasing exceptional efficacy in solving network-based challenges. In light of the integration of diverse segmentation techniques and CNN architectures, akin to a network flow problem, the determination of optimal weights for solutions derived from distinct sectors significantly impacts the accuracy of our model’s predictions. It is with a sense of confidence that we have chosen VaNSAS as the most suitable decision fusion strategy, enabling us to effectively ascertain these crucial optimal weights, thus bolstering the overall prediction accuracy in our proposed model.
The Variable Neighborhood Strategy Adaptive Search (VaNSAS) technique will be employed to determine the optimal weight for fusing diverse solution types obtained from various architectures. This approach will be compared with other decision fusion strategies, namely, the unweighted average model (UWM), the differential evolution algorithm (DE) [50], and particle swarm optimization (PSO) [51].
The unweighted average model (UAM) assigns equal weight to each prediction value ( Y i j ), where i denotes the CNN label, and j indicates the prediction class (also applicable to segmented image classes, represented as 0 or 1). For fusion processes, the UAM employs Equation (1), while VaNSAS, DE, and PSO adopt Equation (2) to compute the final weight. Here, Y i j represents the predicted value of CNN i for class j before applying both equations. Subsequently, following the fusion of multiple CNN results, V j is utilized for categorizing class j, with CNN i assigned weight W i , considering I as the number of CNNs/segmentation methods and J as the number of classes.
V j = i = 1 I Y i j I
V j = i = 1 I W i Y i j
VaNSAS, DE, and PSO were employed to determine the optimal value of W i for the given scenario. The unweighted average decision fusion strategy (UWA) offers a straightforward and computationally efficient approach for ensemble deep learning model integration. UWA assigns equal weights to each CNN, ensuring ease of implementation and interpretation. However, UWA’s lack of optimization capabilities restricts its ability to finely tune ensemble performance. In contrast, differential evolution (DE) exhibits robust global search capabilities, making it suitable for intricate optimization problems, particularly in noisy landscapes. DE adapts well to multimodal search spaces but may converge slower and require more memory due to its population-based approach. On the other hand, particle swarm optimization (PSO) strikes a balance between exploration and exploitation, enabling faster convergence. Nonetheless, PSO’s performance may be sensitive to parameter settings, and it may encounter challenges in highly complex landscapes.
VaNSAS, in essence, comprises four integral steps: (1) the generation of a set of initial tracks or solutions; (2) the track touring process facilitated by black box operators (improvement box: IB); (3) the regular updating of heuristics information; and (4) the iterative repetition of steps (2) and (3) until a predetermined termination criterion is met.

3.3. The Initial Tracks Generation

This section involves the generation of NT (number of tracks) random tracks. Each track possesses dimensions of 1 × D, where D denotes the number of image segmentation methods or the CNN’s architectures. The initial track utilized in this study is a real number, uniformly and randomly generated between 0 and 1, following Equation (3):
X k i 1 = U 0,1
In this context, X k i 1 represents the value in track k at position i during the first iteration. Here, i denotes the number of available CNN/segmented methods, and k signifies the predefined number of tracks. Additionally, two additional sets of tracks, namely, the best tracks (BT) and random tracks (RT), were also randomly generated during the initial iteration.
B k i 1 = U 0,1
R k i 1 = U 0,1
In the given context, B k i t represents the set of best solutions obtained from iteration one to iteration t, while R k i t is randomly selected using a specific formula. For the first iteration, the initial B k i t and R k i t are randomly generated using Equations (4) and (5), respectively. Subsequently, Equation (6) is utilized to update X k i t , where the value of X k i in iteration t + 1 corresponds to the value of X k i in iteration t, considering a selected improvement box (IB) operator. An example of the track that has D = 5 is as follows: {0.45, 0.03, 0.45, 0.14, 0.54}. The value of the track will be re-calculated to obtain the value of W i .
P k i = X k i i = 1 i X k i
Equation (7) is modified to deal with k number of tracts. C k j is utilized for categorizing class j using track k, and P k i is the weight of CNN/segmentation method i using track k values.
C k j = i = 1 I P k i Y i j

3.4. Track Touring Process

The tracks iteratively tour by improving the solution using the improvement box (IB). In this context, 4 IBs will be used to improve the solution. These methods are differential evolution-inspired (DEI), random crossover (RC), single-bit mutation-inspired (SMI), and scaling factors (SF). These methods use Equations (8), (9), (10), and (11), respectively.
X k i t = ρ X r i t 1 + F 1 B i g b e s t X r i t 1 + F 2 X m i t 1 X r i t 1
X k i t = X k i t 1 i f   R k i C R R k i t 1     o t h e r w i s e
X k i t = X k l t 1 i f   R k i C R X n l t 1     o t h e r w i s e  
X k i t = X k i t 1 i f   R k i C R R k i X k i t 1     o t h e r w i s e  
In this context, ρ denotes the evaporation rate, set to 0.05, while F1 and F2 represent the enhancing factors, set to 3 and 5, respectively. X k i t represents a random number lying within the range of 0 to 1 for track k, position i, iteration t, and R k i corresponds to the random number for track k at position i. CR is the crossover rate, set to 0.6, and r, n, and m are random tracks distinct from track k.
The track can select an IB in the current iteration regardless of the selection made in the last or previous iterations, but the chances to select each IB can be reduced or increased depending on the solution quality generated using that IB. The probability function of selecting an IB b in iteration t is shown in Equation (12). When F is set to 0.2, A b t 1 is the average solution quality of all tracks that have selected IB b so far, and N b t 1 is the number of tracks that have been selected (IB p) up to the current iterations. I b t 1 will be increased by 1 if the IB contains B i g b e s t , and increase by zero otherwise; K is set to 20 (constant number). All predefined parameters have been set according to the preliminary test of this research.
P b t = F N b t 1 + ( 1 F ) A b t 1 + K I b t 1 + ρ | A b t 1 A t 1 b e s t | b = 1 B F N b t 1 + ( 1 F ) A b t 1 + K I b t 1 I b t 1 + ρ | A b t 1 A t 1 b e s t |

3.5. Probability Update for the IB

For every iteration, the values of the following parameters need to be updated according to the current situation. These factors are R k i , X k i t N b t , A b t , B i g b e s t , and I b t 1 . Then, the steps in Section 3.2 and Section 3.3 need to be iteratively executed until the termination condition is met (limited computational time or number of iterations).

3.6. The Comparison Methods

In this study, we compared the proposed methods using the differential evolution algorithm (DE) and particle swarm optimization (PSO), which is adaptive, allowing it to fit to our method [52,53]. Figure 3 shows the framework of the proposed model, which we have developed to classify the types of leaf abnormalities seen in C. asiatica (Linn.) Urban.
Figure 3 shows image segmentation for the training dataset using three distinct methods. After this, the segmented results are subjected to one of four decision fusion strategies: unweighted average (UWA), differential evolution algorithm (DE), particle swarm optimization (PSO), and Variable Neighborhood Strategy Adaptive Search (VaNSAS). Subsequently, the segmented images are processed through image augmentation before being fed into a heterogeneous ensemble of MobileNetV3, SqueezeNetV2, and ShuffleNetV2 CNN models. Similar to the segmentation step, the CNNs are fused using the same decision fusion strategies. Finally, the classification is predicted. On the other hand, the testing dataset follows the same procedure but omits image augmentation.

3.7. Evaluation of Performance Metrics

The assessment of performance across a varied collection of models, encompassing both cutting-edge and previously established models tailored to analogous datasets, will be undertaken utilizing the ensuing metrics: (1) accuracy, (2) F1-score, and (3) AUC (Area Under the Curve). The computation of accuracy and the F1-score are delineated through Equations (13) and (14), respectively. Furthermore, an elaborate exposition of the AUC is provided in the subsequent sections for comprehensive understanding.
A c c u r a c y = n T P + n T N n T P + n P N + n F P + n F N
F 1 - score = 2 n T P 2 n T P + n F P + n F N
where n T P denotes the number of true positives, n T N corresponds to the number of true negatives, n F P signifies the number of false positives, and n F N represents the number of false negatives. Beyond accuracy, the Area Under the Receiver Operating Characteristic (ROC) Curve (AUC) emerges as a pivotal metric for evaluating performance, particularly within the realm of binary classification endeavors. The ROC curve delineates the equilibrium between the true positive rate and the false positive rate, with the AUC quantifying the extent of this curve. Elevated AUC values signify enhanced model efficacy, rendering it an indispensable instrument for the comparative analysis of diverse models. Collectively, these metrics furnish a holistic appraisal of the deep learning model’s capabilities and limitations, which is imperative for informed model selection and optimization processes. The algorithm employed to compute the AUC in our study is accessible via the Scikit-learn documentation at ‘https://scikit-learn.org/stable/modules/generated/sklearn.metrics.roc_auc_score.html.(accessed on 2 October 2023)’.

4. Computational Framework and Result

In this study, we utilized two computing resources to develop and evaluate our algorithm. For the training phase, we used Google Collaboratory’s resources, including an NVIDIA Tesla V100 with 16 GB of RAM, for efficient model training. To evaluate our model’s performance, simulations were conducted on a separate system with two Intel Xeon-2.30 GHz CPUs, 52 GB of RAM, and a Tesla K80 GPU with 16 GB of GPU RAM, capable of handling computational demands and providing reliable results. All methods proposed and evaluated in this study were developed in Python 3.10.8 and executed on the hardware configuration previously described. To achieve the best results, we divided the computational work into three phases. Firstly, we tested various combinations of entities to identify the optimal configuration for our proposed model. Secondly, we compared the effectiveness of our optimized model with state-of-the-art methods from the literature. Lastly, the model was tested with an unseen dataset using the leaf abnormality dataset collected in-house. This two-part approach ensures that our proposed model is both optimized and effective compared to existing approaches.

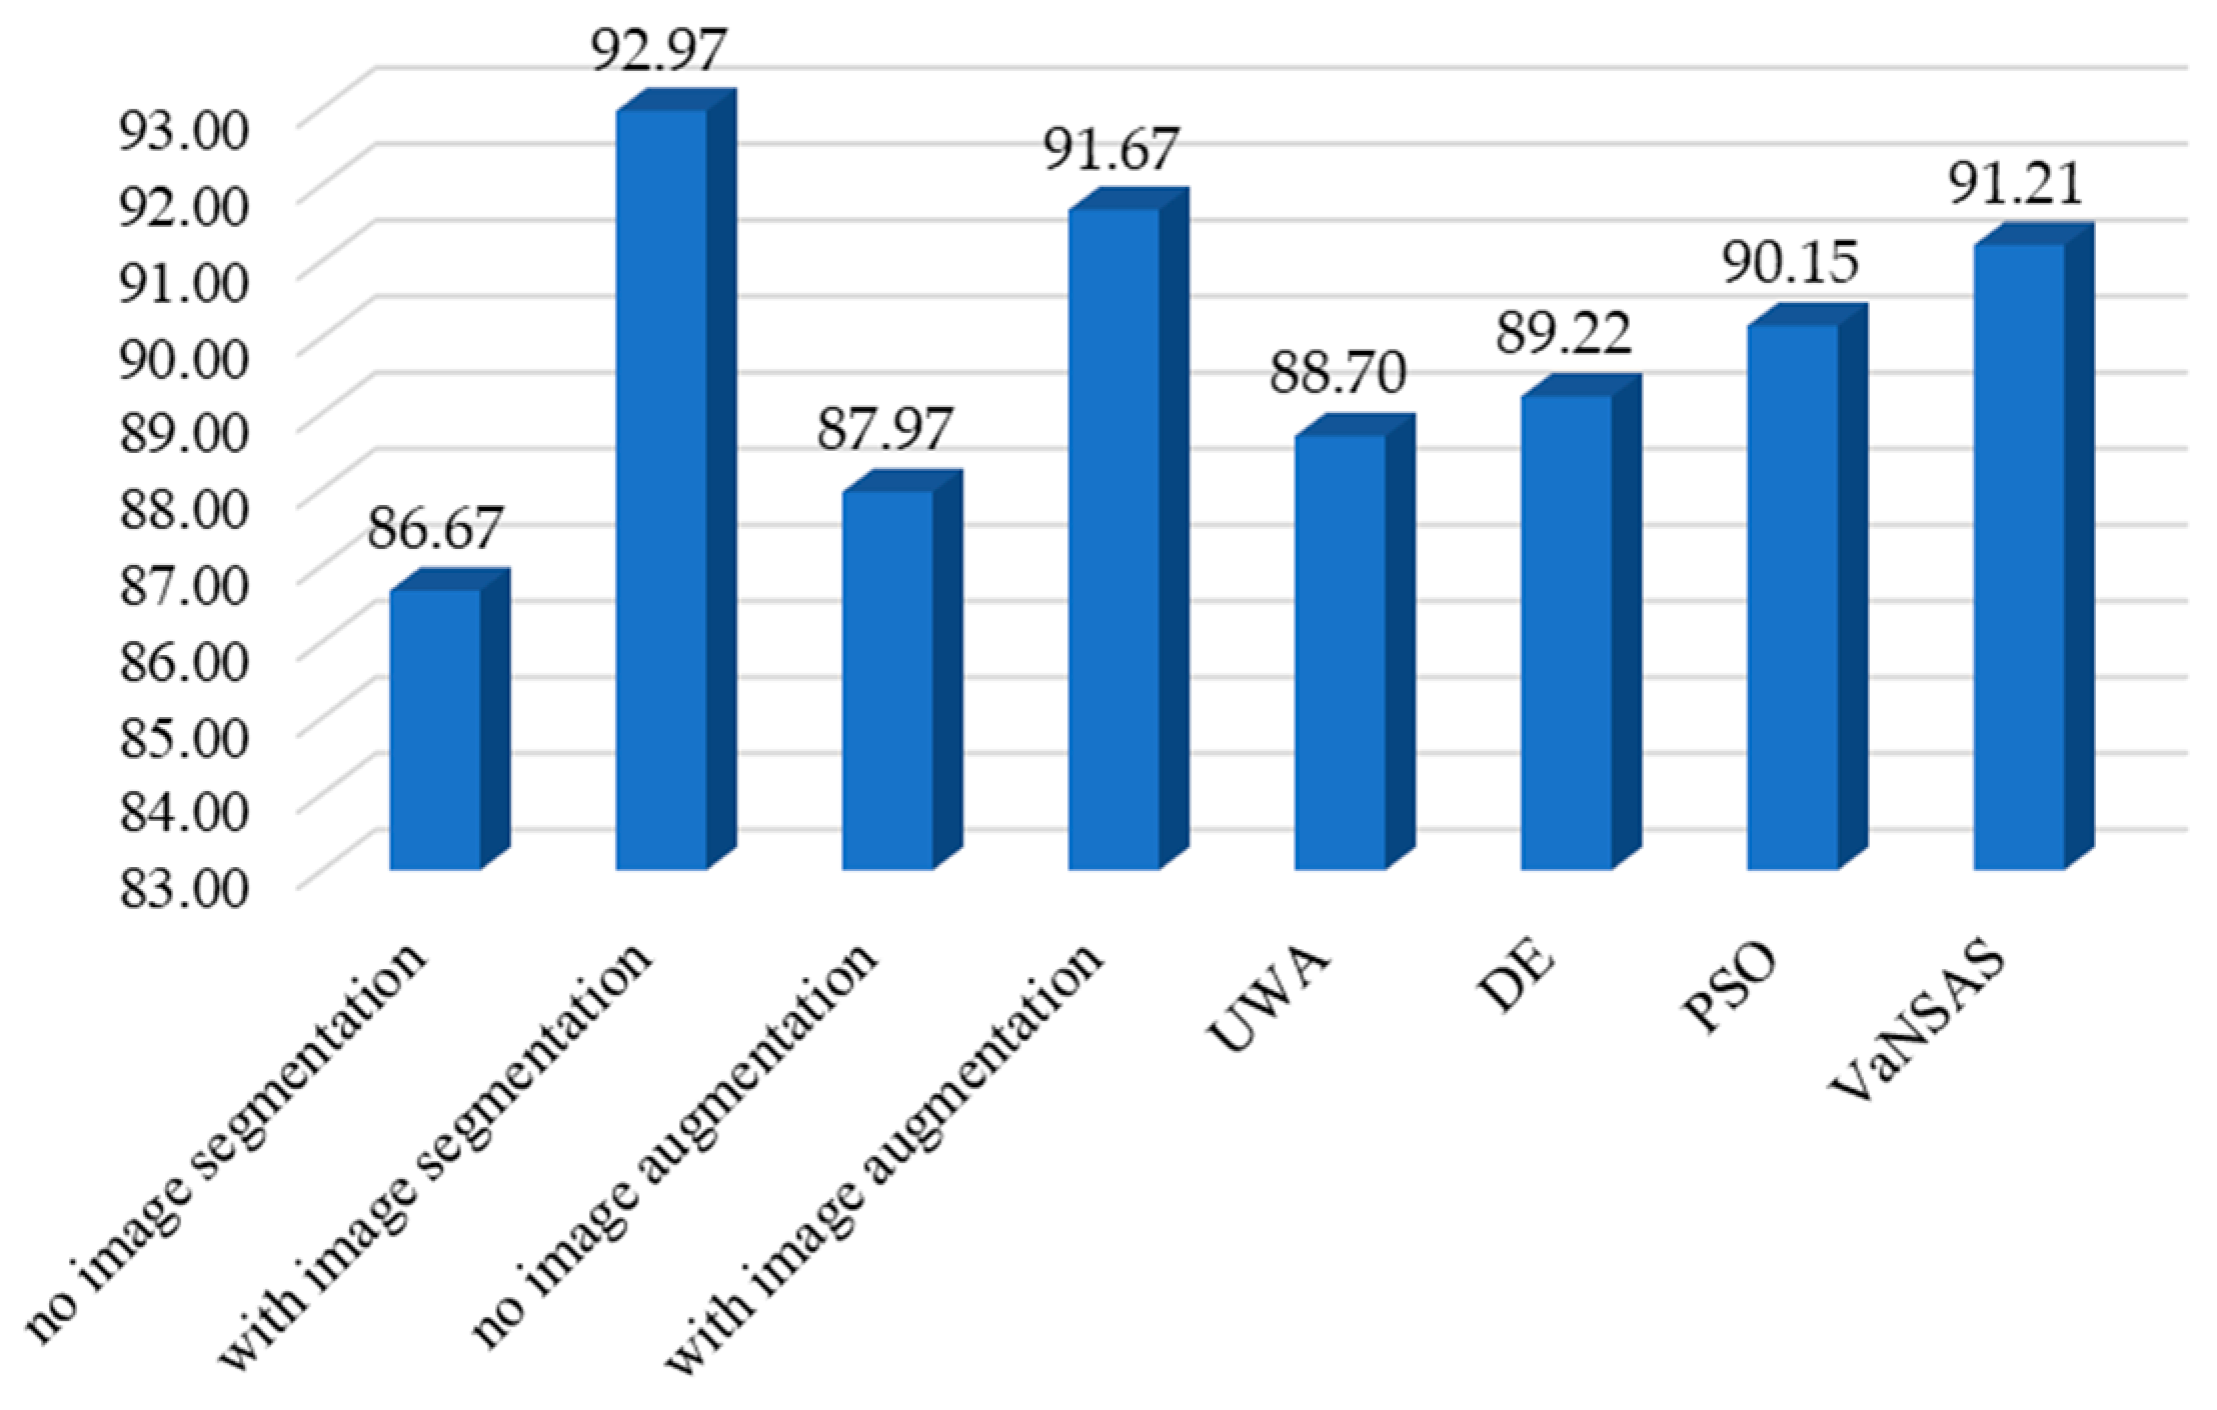
4.1. Optimizing the Model Entities

The entities of the proposed model are the exiting of image segmentation, image augmentation, and the use of meta-learning or the simple unweighted average (UWA) as the decision fusion strategy. The CAU leaf abnormality classification deep learning model should be evaluated using multiple metrics, such as “accuracy”, “AUC”, and “F1-score”, to ensure a comprehensive understanding of the model’s performance. These metrics take into account the various aspects of the classification task, such as true positive rate, false positive rate, and precision. Using these metrics can help researchers accurately evaluate the model’s performance and compare it to other models proposed in the literature. The computational results for the accuracy, AUC, and F1-score of each experimental treatment using different inputs of the model entities are shown in Table 3. The average accuracy values using different types of entities are shown in Figure 4.
Based on the computational results presented in Table 3 and Figure 4, it is evident that image segmentation plays a crucial role in improving the accuracy of the classification model, with an increase of 7.26% compared to the model that does not use it. The use of image augmentation also leads to significant improvement, with a 4.21% increase in accuracy compared to the model that does not use it. Moreover, using VaNSAS as the decision fusion strategy further enhances the solution quality by 2.83%, 2.23%, and 1.18% compared to using UWA, DE, and PSO, respectively. Therefore, it can be concluded that incorporating image segmentation, image augmentation, and VaNSAS as a decision fusion strategy are effective techniques for improving the accuracy of the CAU leaf abnormality classification deep learning model.

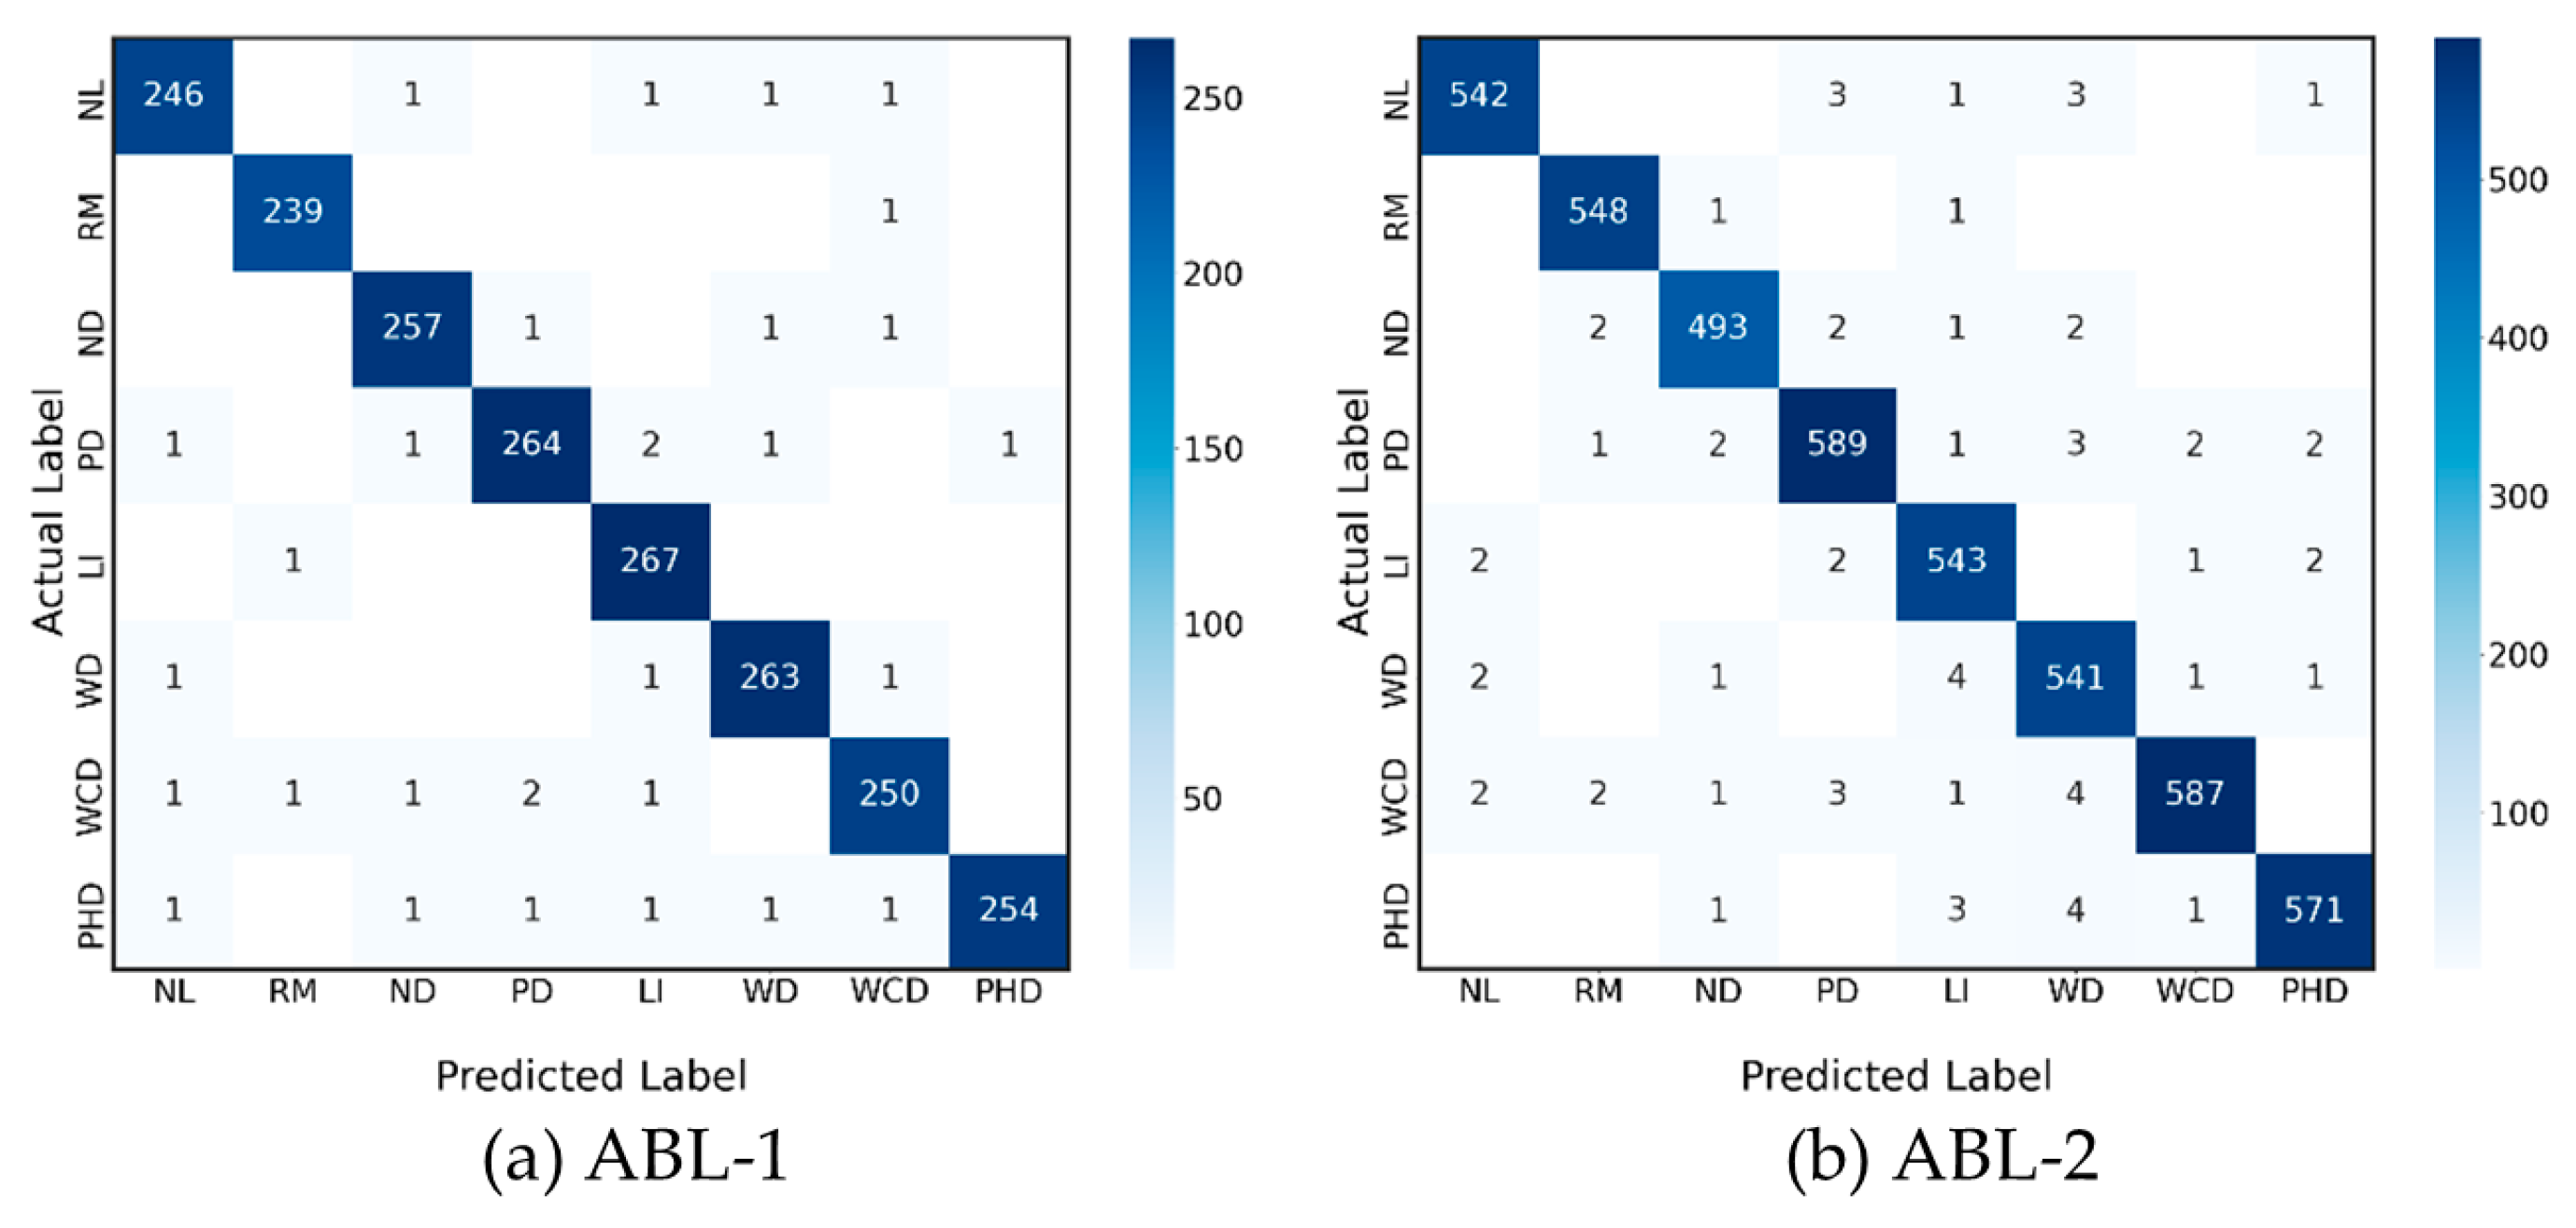
4.2. Comparison of Optimal Proposed Model with the State-of-Art Methods (ABL-1)

In this research, we compare our proposed model with state-of-the-art methods listed in Table 4. To ensure a fair comparison, all compared methods were reprogrammed for testing and training with our dataset. Initially, we compared the homogenous ensemble of selected architectures, which included MobileNetV2, SqueezeNetV2, and ShuffleNetV2. Subsequently, we selected single state-of-the-art methods with sizes less than 56 MB to compare with the proposed model while ensuring that the model’s size was no more than 1.6 times that of our proposed model. The computational results of all compared methods are presented in Table 5, and we also include the results of 3- and 5-fold cross-validations in Table 6 [26,27].
After conducting a thorough analysis of the results presented in Table 5 and Table 6, it is evident that the proposed method (He-Meta) outperforms other methods proposed in the literature by an average of 4.85%. Specifically, the He-Meta model provides significantly better accuracy when compared to other models, such as Ho-Mo [19], Ho-SQ [17], and Ho-Sh [18], which are homogenous ensemble models, as well as single models, including EfficientNet-B2 [21], EfficientNet-B3 [21], ResNet-50 [22], DenseNet121 [58], and Inception-ResNet-v2 [21]. The He-Meta model yielded a 4.02%, 3.90%, 5.49%, 4.95%, 4.89%, 6.21%, 8.16%, and 1.16% higher accuracy than the aforementioned models, respectively. When categorized into three groups based on model type, the He-Meta model showed a 4.47% improvement over homogenous ensemble models and a 5.07% improvement over single models with similar or larger sizes. It is important to note that the proposed model achieves these results while maintaining a relatively small model size, making it an efficient and effective solution for image classification tasks.

4.3. Comparison with the Unseen Dataset (ABL-2)

The unseen dataset is an important aspect when evaluating the performance of a machine learning model. This dataset consists of new data that have not been seen by the model during training or validation. Testing the model on the unseen dataset provides a more accurate assessment of how well the model will perform on new and unseen data in the real world. This helps to ensure that the model is not overfitting or memorizing the training data but rather generalizing and learning patterns that can be applied to new data. Therefore, evaluating the model’s performance on both the training and testing datasets, as well as the unseen dataset, is important to ensure the model’s effectiveness and generalizability. The computational result of the testing of ABL-2 is shown in Table 7 and Table 8.
Based on the computational results presented in Table 7 and Table 8, we can observe that our proposed model, He-Meta, outperforms other methods by an average of 4.83% higher accuracy. Specifically, He-Meta achieved 3.99%, 3.91%, 5.46%, 4.97%, 4.87%, 6.19%, 8.14%, and 1.12% higher accuracy than EfficientNet-B2, EfficientNet-B3, ResNet-50, DenseNet121, and Inception-ResNet-v2, respectively. Comparing the three groups of methods, we found that the single model performed worse than the other two types of methods, with 4.45% and 6.05% lower accuracy than the homogenous and heterogeneous ensemble models, respectively.
It is important to note that using ABL-2 as the unseen dataset yielded results consistent with using ABL-1 as the test and train dataset. These findings provide strong evidence supporting the effectiveness and reliability of our proposed method.
Furthermore, our proposed model employs a heterogeneous ensemble approach, which combines different architectures to improve the model’s overall performance. This strategy has been demonstrated to be effective, as our model outperforms existing methods that use single architectures or homogenous ensembles. Figure 5 shows the confusion matrix of the proposed model while it classifies images that have been labeled.
When employing the dataset shown in Figure 5a,b, encompassing the confusion matrices pertaining to datasets ABL-1 and ABL-2, a discernible pattern emerged; the classes NL, RM, ND, PD, LI, and WD exhibited a diminished frequency of misclassifications in comparison to classes WCD and PHD. This phenomenon can be attributed to the intrinsic nature of WCD and PHD, wherein significant visual congruities occurred with the aforementioned classes. For instance, WCD showcased residual verdant portions akin to those characterizing NL, albeit with certain sections subjected to insect-induced damage. This nuanced variation, despite being minimal, engenders ambiguity within the classification process.
Equally, PHD, distinguished by its discrete brown blemishes, showed similarities to the PM, ND, PD, and LI categories. The differentiation lay in the precise location and extent of the brown spotting, thereby engendering confounding similarities across these classes. This equivocal presentation poses challenges to accurate classification.
Notwithstanding these instances of misclassification, it is noteworthy that the cumulative accuracy rate of the model remained notably robust at 98.77%. Ergo, the system, despite its occasional errors, stands as an efficacious tool for the classification of leaf abnormalities.
The outcomes gleaned from these analyses underscore the model’s commendable accuracy; nonetheless, it is patently apparent that targeted enhancements are imperative to surmount such specific and nuanced challenges. In this context, Figure 6 expounds upon the visual manifestations of these classification decisions, leveraging heat maps to delineate the regions of paramount significance within the leaf structure that exert a dominant influence upon the model’s classifications.
The heatmap in Figure 6 provides valuable insights into the model’s classification process for leaf abnormality. It is evident that the model primarily utilizes the visual appearance of the leaf to determine the type of abnormality. The parts of the leaf that are visibly different from the norm are the most influential in determining the classification, as the model searches for patterns that distinguish one type of abnormality from another. This information is critical in understanding how the model operates and can provide guidance in making future improvements to the classification process.

5. Discussion and Implications

Section 5 will analyze the research findings, which are divided into two main parts. Firstly, it will address the utilization of an automated leaf disease classification system for CAU. Secondly, it will assess the effectiveness of the proposed model in comparison to existing methods.

5.1. Enhancing Leaf Abnormality Detection in C. asiatica: An Ensemble Deep Learning Approach

This study presents the development of two novel datasets for leaf abnormalities and diseases, encompassing seven types of leaf anomalies in CAU plants, including yellow leaf, insect bite, brown leaf, black leaf, white leaf, worn leaf, mixed-color leaf, and green leaf. The datasets were collected both from the field and laboratory settings. To evaluate the effectiveness of existing leaf disease detection methods for different crops, we employed DenseNet121 [56], ResNet50 [55], MobileNetV2 [22,26,27], EfficientNet-B2 [54], EfficientNet-B3 [54], and Inception-ResNet-v2 [57] architectures. However, our proposed ensemble deep learning model, which combines ShuffleNetV2, SqueezeNetV2, and MobileNetV3 as the CNN architectures, along with U-net, geometric, and meta-learner for image segmentation, augmentation, and decision fusion, outperformed these methods with an accuracy improvement ranging from 1.16% to 8.61% for CAU leaf abnormality detection.
Remarkably, the proposed model demonstrated remarkable robustness, as its accuracy on an unseen dataset (ABL-2) was only slightly lower compared to the test and train datasets (ABL-1), with a minimal percent difference of 0.020%. This observation suggests the model’s ability to handle variations in datasets and its adaptability to different data distributions. In contrast, when adapting existing methods from the literature, e.g., [17,18,19], to our dataset, their performance was notably lower than the original reports (around 92.28%), underscoring the efficacy of our proposed model in overcoming the challenges associated with new datasets. As a result, our proposed model not only demonstrates effective classification of leaf abnormalities but also exhibits robustness across various types of datasets, setting it apart from other approaches proposed in the literature.
This study contributes significantly to the advancement of leaf abnormality detection in agriculture. Through the introduction of new datasets and an extensive evaluation of various CNN architectures [43,59,60,61], our research expands the scope of leaf disease research, particularly for C. asiatica leaves. The proposed ensemble deep learning model, coupled with innovative image segmentation and decision fusion strategies, presents a novel and effective approach to address the complexities of leaf abnormality classification.
The superior performance of our proposed model, surpassing existing methods by a substantial margin, highlights its accuracy in detecting leaf abnormalities in CAU plants. Furthermore, the model’s robustness in handling unseen datasets emphasizes its generalizability and adaptability to diverse data distributions, reinforcing its practicality for real-world agricultural applications.
The findings of this research hold significant implications for precision agriculture and sustainable crop management. Leveraging the high accuracy and robustness of the proposed model can enable the early detection and precise classification of leaf abnormalities in CAU, empowering farmers to make informed decisions for targeted interventions, minimizing crop losses, and optimizing resource utilization. Implementing this technology in agricultural practices holds promise for enhancing crop productivity and promoting more efficient and environmentally friendly farming practices.

5.2. Advancing Leaf Disease Classification in CAU: A Meta-Learner Guided Ensemble Deep Learning Model

This research introduces a novel ensemble deep learning model specifically designed for the classification of leaf diseases in CAU. The model leverages three distinct image segmentation methods, namely, U-net, Mask R-CNN, and DeepLabV3+, integrated through a meta-learner, resulting in a unified segmentation output. The integration of these techniques leads to a noteworthy improvement of 5.86% in solution quality compared to individual segmentation approaches. Notably, this represents the first instance wherein image segmentation has been shown to significantly enhance the accuracy of the proposed model, aligning with previous works [62,63,64,65,66], which also affirm the efficacy of image segmentation in enhancing model accuracy across various applications.
To enhance the robustness and generalization capabilities of the model, geometric image augmentation has been implemented. This augmentation technique effectively expands the training dataset and contributes to an 8.57% increase in classification accuracy. By incorporating this augmentation strategy, the model becomes more adaptable to variations in leaf disease patterns, leading to more reliable and accurate predictions. The merits of this finding are consistent with the results of Akhyar Ahmed Kathawala et al. [41], Bharati Devi and Amarendra [42], Narayanapur et al. [67], Pandian et al. [46], and Venkatesh et al. [54], wherein image augmentation was successfully applied across diverse problem domains. It is evident that the inclusion of image augmentation in the proposed model for leaf disease classification represents a valuable enhancement.
The proposed ensemble deep learning model for leaf disease classification in CAU combines multiple image segmentation methods and geometric image augmentation to achieve improved solution quality and classification accuracy. This study’s findings highlight the importance of image segmentation and augmentation techniques in enhancing the overall performance of the model and are in agreement with existing literature that recognizes the value of such approaches in diverse applications.
Additionally, the ensemble model leverages three diverse CNN architectures—ShuffleNetV2, SqueezeNetV2, and MobileNetV3—integrated through the meta-learner. This integration results in a notable 2.03% improvement in leaf abnormality classification over the single-model approach. The utilization of multiple CNN architectures enhances the model’s capacity to capture complex and subtle patterns, allowing for a more comprehensive understanding of leaf diseases in CAU.
The computational findings provide compelling evidence of the effectiveness of the proposed model in addressing the challenges associated with leaf disease classification. Furthermore, the model’s superior performance over existing single-model and homogeneous ensemble models, including DenseNet121, ResNet50, MobileNetV2, EfficientNet-B2, EfficientNet-B3, and Inception-ResNet-v2, demonstrates its potential to become a new state-of-the-art solution for this domain; it can be adapted to classify diverse datasets as mentioned in Bjånes et al. [68], Hirasen et al. [69], Lee et al. [70], Mohammed and Kora [29], and Wei and Liu [71].
From an academic standpoint, this research contributes to the growing body of literature on advanced deep learning techniques for agricultural applications. The successful implementation of ensemble methods, along with the utilization of meta-learners to combine diverse CNN architectures, showcases the potential of ensemble learning in tackling complex image-based classification tasks. Researchers interested in deep learning methodologies can draw valuable insights from this study and potentially apply similar strategies to other image analysis tasks in various domains.
Moreover, this research has significant policy implications for the agricultural sector. The high accuracy and generalization capability of the proposed model can aid in the early detection and effective management of leaf diseases in CAU, contributing to enhanced crop health and improved agricultural productivity. Policymakers and agricultural stakeholders should consider integrating this advanced deep learning model into their disease monitoring and crop management strategies to make informed decisions and optimize agricultural outcomes.

5.3. In-Depth Analysis of Model Performance and Comparative Evaluation

The computational results of the accuracy, AUC, and F1-score of each experiment treatment using different combinations of model entities were thoroughly analyzed and compared. The experimental results revealed the optimal combination of model entities, showcasing the model’s superior performance in terms of classification accuracy, the area under the curve (AUC), and the F1-score. These metrics were used to accurately evaluate the model’s performance and compare it to other models proposed in the literature.
Furthermore, the proposed ensemble deep learning model leverages three diverse CNN architectures—ShuffleNetV2, SqueezeNetV2, and MobileNetV3—which are integrated through the effective decision fusion strategy. This integration resulted in a notable 8.13% improvement in leaf abnormality classification over the single-model approach. The utilization of multiple CNN architectures enhanced the model’s capacity to capture complex and subtle patterns, allowing for a more comprehensive understanding of leaf diseases in C. asiatica.
The computational findings provide compelling evidence of the effectiveness of the proposed model in addressing the challenges associated with leaf disease classification. The model’s superior performance over existing single-model and homogeneous ensemble models, including DenseNet121, ResNet50, MobileNetV2, EfficientNet-B2, EfficientNet-B3, and Inception-ResNet-v2, demonstrates its potential to become a new state-of-the-art solution for leaf disease classification in C. asiatica plants.
The superior performance of the He-Meta model across multiple metrics does not only showcase its technical excellence but also its practical applicability in the agricultural sector. The advancement over existing models highlighted by our comprehensive and comparative analysis indicates the potential of the He-Meta model to revolutionize plant disease detection methods. Our findings bear significant implications for agricultural practices, particularly in enhancing early disease detection, which is vital for effective crop management and yield improvement.
In addressing the critical challenge of accurate disease detection in agricultural fields, our research introduces a novel two-stage ensemble model that synergistically combines segmentation and classification techniques. The first stage employs an ensemble of advanced segmentation models, including U-net, Mask R-CNN, and DeepLabV3++, to precisely delineate areas of interest within the imagery. This ensemble approach leverages the unique strengths of each model to achieve superior segmentation accuracy, which is crucial for the subsequent classification task.
To mitigate the potential issue of false positives—erroneously identified regions of interest—which could adversely affect the classification accuracy, we implemented a sophisticated post-segmentation analysis. This involved the application of morphological operations and contextual analysis to refine the segmentation output, ensuring that only the most relevant features are forwarded for classification. This step was vital for maintaining the integrity and reliability of the disease detection process.
Following segmentation, the second stage of our model comes into play, focusing on the classification of the identified regions into disease categories. This stage utilizes a complementary ensemble of lightweight, efficient classification models, including ShuffleNetV2, SqueezeNetV2, and MobileNetV3. These models are specifically chosen for their ability to deliver high accuracy with minimal computational overhead, making them ideal for deployment in resource-constrained environments. The integration of segmentation and classification models into a cohesive framework allows for a streamlined workflow that enhances both the accuracy and efficiency of disease detection.
Our approach not only demonstrates the feasibility of combining multiple deep learning models for agricultural disease detection but also underscores the importance of a systematic, two-stage process where segmentation and classification tasks are effectively interconnected. This methodology ensures that the classification stage is primed with the highest quality inputs, significantly reducing the likelihood of false positives influencing the final disease identification, thereby paving the way for more reliable and actionable insights in precision agriculture.

6. Conclusions

In this study, we addressed the limitations of traditional leaf disease detection methods in CAU by introducing a novel ensemble deep learning approach. Our proposed method utilizes two-time decision fusion strategies to integrate multiple machine sectors, aiming to overcome the challenges associated with visual inspection by human experts.
Through ensemble image segmentation, employing U-net, Mask-R-CNN, and DeepNetV3++ as segment methods, and the combination of various types of CNNs, such as ShuffleNetV2, SqueezeNetV2, and MobileNetV3, we achieved significant improvements in solution quality. The ensemble approach, employing four decision fusion strategies, namely, unweighted average (UWA), the differential evolution algorithm (DE), particle swarm optimization (PSO), and Variable Neighborhood Strategy Adaptive Search (VaNSAS), further enhanced the effectiveness of our model.
Our evaluations of the ABL-1 and ABL-2 datasets, comprising 14,860 images with eight distinct leaf abnormalities, revealed the superiority of our ensemble segmentation and heterogeneous ensemble CNN methods. The results indicate significant improvements in solution quality; ensemble segmentation methods led to a 7.34% increase compared to single segmentation methods, while heterogeneous ensemble segmentation outperformed homogeneous segmentation by 6.43%. Similarly, the use of heterogeneous ensemble CNN resulted in an 8.43% enhancement over homogeneous ensemble models and a remarkable 14.59% improvement over single models. Moreover, image augmentation techniques contributed to a 5.37% increase in solution quality. The employment of VaNSAS as the decision fusion strategy yielded substantial enhancements of 15.42% compared to UWA, 11.23% compared to DE, and 9.84% compared to PSO. These numerical results firmly demonstrate the effectiveness of our proposed approach in achieving significantly higher-quality solutions than traditional methods.
To advance the field, future research could explore advanced image augmentation techniques and refine decision fusion strategies to achieve an even higher solution quality. Investigating transfer learning and fine-tuning approaches on larger and more diverse datasets could extend the generalizability of our proposed method for various plant species. Moreover, exploring the integration of multi-modal data sources, such as spectral and hyperspectral imaging, holds promise in further enhancing the accuracy and robustness of leaf disease detection systems.
Ultimately, our goal is to create a user-friendly and automated platform that can be readily utilized by agricultural professionals in the field. By continually advancing research in this direction, we aim to contribute to the ongoing development and application of cutting-edge technologies in agriculture, ultimately fostering increased crop yield, reduced losses, and improved medicinal properties pertaining to CAU.

Author Contributions

B.B.: conceptualization, data curation, methodology, validation, formal analysis, software, and writing (original draft). M.K.-O.: review. R.P.: supervision, conceptualization, writing (review), and editing. T.S.: writing (review and editing). S.K.: funding acquisition, resources, conceptualization, and writing (review and editing). P.L.: resources and writing (review and editing). N.N.: resources. S.G.: data curation and software. All authors have read and agreed to the published version of the manuscript.

Funding

This research was funded by the National Science, Research, and Innovation Fund (NSRF) grant number 4233050.

Data Availability Statement

Data will be made available on request.

Conflicts of Interest

The authors declare no conflicts of interest.

References

  1. Gleiser, G.; Leme Da Cunha, N.; Sáez, A.; Aizen, M.A. Ecological Correlates of Crop Yield Growth and Interannual Yield Variation at a Global Scale. Web Ecol. 2021, 21, 15–43. [Google Scholar] [CrossRef]
  2. Hemalatha, R.; Alagar, M.; Rameshbabu, P.; Azhagu Parvathi, A.; Hepzi Pramila Devamani, R. Development of Medicinal Plant (Centella Asiatica–Gotu Kola) Based Proton Conducting Polymer Electrolytes for Electrochemical Device Applications. Mater. Today Proc. 2023, 81, 330–335. [Google Scholar] [CrossRef]
  3. Ranjith, G.P.; Jisha, S.; Hemanthakumar, A.S.; Saji, C.V.; Shenoi, R.A.; Sabu, K.K. Impact of Potential Stimulants on Asiaticoside and Madecassoside Levels and Expression of Triterpenoid-Related Genes in Axenic Shoot Cultures of Centella asiatica (L.) Urb. Phytochemistry 2021, 186, 112735. [Google Scholar] [CrossRef]
  4. Gupta, S.; Bhatt, P.; Chaturvedi, P. Determination and Quantification of Asiaticoside in Endophytic Fungus from Centella asiatica (L.) Urban. World J. Microbiol. Biotechnol. 2018, 34, 111. [Google Scholar] [CrossRef]
  5. Trivedi, N.K.; Gautam, V.; Anand, A.; Aljahdali, H.M.; Villar, S.G.; Anand, D.; Goyal, N.; Kadry, S. Early Detection and Classification of Tomato Leaf Disease Using High-Performance Deep Neural Network. Sensors 2021, 21, 7987. [Google Scholar] [CrossRef] [PubMed]
  6. Spadaro, D.; Agustí, N.; Ortega, S.F.; Hurtado Ruiz, M.A. Diagnostics and Identification of Diseases, Insects and Mites. In Integrated Pest and Disease Management in Greenhouse Crops; Gullino, M., Albajes, R., Nicot, P., Eds.; Springer: Cham, Switzerland, 2020; pp. 231–258. [Google Scholar] [CrossRef]
  7. Raina, S.; Gupta, A. A Study on Various Techniques for Plant Leaf Disease Detection Using Leaf Image. In Proceedings of the 2021 International Conference on Artificial Intelligence and Smart Systems (ICAIS), Coimbatore, India, 25 March 2021; pp. 900–905. [Google Scholar]
  8. Bondre, S.; Sharma, A.K. Review on Leaf Diseases Detection Using Deep Learning. In Proceedings of the 2021 Second International Conference on Electronics and Sustainable Communication Systems (ICESC), Coimbatore, India, 4 August 2021; pp. 1455–1461. [Google Scholar]
  9. Maheswaran, S.; Sathesh, S.; Rithika, P.; Shafiq, I.M.; Nandita, S.; Gomathi, R.D. Detection and Classification of Paddy Leaf Diseases Using Deep Learning (CNN). In Proceedings of the Computer, Communication, and Signal Processing; Neuhold, E.J., Fernando, X., Lu, J., Piramuthu, S., Chandrabose, A., Eds.; Springer International Publishing: Cham, Switzerland, 2022; Volume 651, pp. 60–74. [Google Scholar]
  10. Sethanan, K.; Pitakaso, R.; Srichok, T.; Khonjun, S.; Thannipat, P.; Wanram, S.; Boonmee, C.; Gonwirat, S.; Enkvetchakul, P.; Kaewta, C.; et al. Double AMIS-Ensemble Deep Learning for Skin Cancer Classification. Expert Syst. Appl. 2023, 234, 121047. [Google Scholar] [CrossRef]
  11. Triki, A.; Bouaziz, B.; Gaikwad, J.; Mahdi, W. Deep Leaf: Mask R-CNN Based Leaf Detection and Segmentation from Digitized Herbarium Specimen Images. Pattern Recognit. Lett. 2021, 150, 76–83. [Google Scholar] [CrossRef]
  12. Wang, C.; Du, P.; Wu, H.; Li, J.; Zhao, C.; Zhu, H. A Cucumber Leaf Disease Severity Classification Method Based on the Fusion of DeepLabV3+ and U-Net. Comput. Electron. Agric. 2021, 189, 106373. [Google Scholar] [CrossRef]
  13. Zhao, L.; Wang, L. A New Lightweight Network Based on MobileNetV3. KSII Trans. Internet Inf. Syst. 2022, 16, 1–15. [Google Scholar] [CrossRef]
  14. Setiawan, W.; Ghofur, A.; Hastarita Rachman, F.; Rulaningtyas, R. Deep Convolutional Neural Network AlexNet and Squeezenet for Maize Leaf Diseases Image Classification. Kinet. Game Technol. Inf. Syst. Comput. Netw. Comput. Electron. Control. 2021. [Google Scholar] [CrossRef]
  15. Zhang, Y.; Xie, W.; Yu, X. Design and Implementation of Liveness Detection System Based on Improved Shufflenet V2. SIViP 2023, 17, 3035–3043. [Google Scholar] [CrossRef]
  16. Pitakaso, R.; Sethanan, K.; Theeraviriya, C. Variable Neighborhood Strategy Adaptive Search for Solving Green 2-Echelon Location Routing Problem. Comput. Electron. Agric. 2020, 173, 105406. [Google Scholar] [CrossRef]
  17. Alguliyev, R.; Imamverdiyev, Y.; Sukhostat, L.; Bayramov, R. Plant Disease Detection Based on a Deep Model. Soft Comput. 2021, 25, 13229–13242. [Google Scholar] [CrossRef]
  18. Sharma, A.; Rajesh, B.; Javed, M. Detection of Plant Leaf Disease Directly in the JPEG Compressed Domain Using Transfer Learning Technique. Adv. Mach. Intell. Signal Process. 2022, 858, 407–418. [Google Scholar] [CrossRef]
  19. Sophia, S.; Devi, D.; Lakshmi Prabha, K.; Keerthana, V.; Kavin, V. A Novel Method to Detect Disease in Leaf Using Deep Learning Approach. In Proceedings of the 2021 7th International Conference on Advanced Computing and Communication Systems (ICACCS), Coimbatore, India, 19 March 2021; pp. 1558–1562. [Google Scholar]
  20. Kawatra, M.; Agarwal, S.; Kapur, R. Leaf Disease Detection Using Neural Network Hybrid Models. In Proceedings of the 2020 IEEE 5th International Conference on Computing Communication and Automation (ICCCA), Greater Noida, India, 30 October 2020; pp. 225–230. [Google Scholar]
  21. Pushpa, B.R.; Ashok, A.; Shree Hari, A.V. Plant Disease Detection and Classification Using Deep Learning Model. In Proceedings of the 2021 Third International Conference on Inventive Research in Computing Applications (ICIRCA), Coimbatore, India, 2 September 2021; pp. 1285–1291. [Google Scholar]
  22. Kartikeyan, P.; Shrivastava, G. Impact Evaluation of Deep Learning Models in the Context of Plant Disease Detection. In Proceedings of International Conference on Data Science and Applications; Saraswat, M., Roy, S., Chowdhury, C., Gandomi, A.H., Eds.; Springer: Singapore, 2022; Volume 288, pp. 527–540. [Google Scholar]
  23. Kumar, N.A.; Sathish Kumar, S. Deep Learning-Based Image Preprocessing Techniques for Crop Disease Identification. In Futuristic Communication and Network Technologies; Sivasubramanian, A., Shastry, P.N., Hong, P.C., Eds.; Springer: Singapore, 2022; Volume 792, pp. 1–10. [Google Scholar] [CrossRef]
  24. Sowmiya, M.; Krishnaveni, S. Deep Learning Techniques to Detect Crop Disease and Nutrient Deficiency—A Survey. In Proceedings of the 2021 International Conference on System, Computation, Automation and Networking (ICSCAN), Puducherry, India, 30 July 2021; pp. 1–5. [Google Scholar]
  25. Rohit, V.; Boominathan, P. Crop Diseases and Pest Detection Using Deep Learning and Image Processing Techniques. Int. J. Res. Appl. Sci. Eng. Technol. 2021, 9, 372–380. [Google Scholar] [CrossRef]
  26. Anh, P.T.; Duc, H.T.M. A Benchmark of Deep Learning Models for Multi-Leaf Diseases for Edge Devices. In Proceedings of the 2021 International Conference on Advanced Technologies for Communications (ATC), Ho Chi Minh City, Vietnam, 14 October 2021; pp. 318–323. [Google Scholar]
  27. Smetanin, A.; Uzhinskiy, A.; Ososkov, G.; Goncharov, P.; Nechaevskiy, A. Deep Learning Methods for The Plant Disease Detection Platform. AIP Conf. Proc. 2021, 2377, 060006. [Google Scholar]
  28. Ray, A.; Chakraborty, T.; Ghosh, D. Optimized Ensemble Deep Learning Framework for Scalable Forecasting of Dynamics Containing Extreme Events. Chaos Interdiscip. J. Nonlinear Sci. 2021, 31, 111105. [Google Scholar] [CrossRef] [PubMed]
  29. Mohammed, A.; Kora, R. An Effective Ensemble Deep Learning Framework for Text Classification. J. King Saud Univ. Comput. Inf. Sci. 2022, 34, 8825–8837. [Google Scholar] [CrossRef]
  30. Sharma, S.; Yadav, N.S. Ensemble-Based Machine Learning Techniques for Attack Detection. In Proceedings of the 2021 9th International Conference on Reliability, Infocom Technologies and Optimization (Trends and Future Directions) (ICRITO), Noida, India, 3 September 2021; pp. 1–6. [Google Scholar]
  31. Ahuja, S.; Panigrahi, B.K.; Gandhi, T.K. Fully Automatic Brain Tumor Segmentation Using DeepLabv3+ with Variable Loss Functions. In Proceedings of the 2021 8th International Conference on Signal Processing and Integrated Networks (SPIN), Noida, India, 26 August 2021; pp. 522–526. [Google Scholar]
  32. Dogan, R.O.; Dogan, H.; Bayrak, C.; Kayikcioglu, T. A Two-Phase Approach Using Mask R-CNN and 3D U-Net for High-Accuracy Automatic Segmentation of Pancreas in CT Imaging. Comput. Methods Programs Biomed. 2021, 207, 106141. [Google Scholar] [CrossRef] [PubMed]
  33. Dong, L.; Wang, H.; Song, W.; Xia, J.; Liu, T. Deep Sea Nodule Mineral Image Segmentation Algorithm Based on Mask R-CNN. In Proceedings of the ACM Turing Award Celebration Conference—China (ACM TURC 2021), Hefei, China, 30 July 2021; pp. 278–284. [Google Scholar]
  34. Durkee, M.S.; Abraham, R.; Ai, J.; Fuhrman, J.D.; Clark, M.R.; Giger, M.L. Comparing Mask R-CNN and U-Net Architectures for Robust Automatic Segmentation of Immune Cells in Immunofluorescence Images of Lupus Nephritis Biopsies. In Proceedings of the Imaging, Manipulation, and Analysis of Biomolecules, Cells, and Tissues XIX; Leary, J.F., Tarnok, A., Georgakoudi, I., Eds.; SPIE: Bellingham, WA, USA, 2021; p. 23. [Google Scholar]
  35. Liu, H.; Zhang, Q.; Liu, Y. Image Segmentation of Bladder Cancer Based on DeepLabv3+. In Proceedings of 2021 Chinese Intelligent Systems Conference; Springer: Singapore, 2022; Volume 805, pp. 614–621. [Google Scholar] [CrossRef]
  36. Minatel, P.G.; Oliveira, B.C.; Albertazzi, A. Comparison of Unet and Mask R-CNN for Impact Damage Segmentation in Lock-in Thermography Phase Images. In Proceedings of the Automated Visual Inspection and Machine Vision IV; Beyerer, J., Heizmann, M., Eds.; SPIE: Bellingham, WA, USA, 2021; p. 26. [Google Scholar]
  37. Quan, B.; Liu, B.; Fu, D.; Chen, H.; Liu, X. Improved Deeplabv3 for Better Road Segmentation in Remote Sensing Images. In Proceedings of the 2021 International Conference on Computer Engineering and Artificial Intelligence (ICCEAI), Shanghai, China, 27–29 August 2021; pp. 331–334. [Google Scholar]
  38. Quoc, T.T.P.; Linh, T.T.; Minh, T.N.T. Comparing U-Net Convolutional Network with Mask R-CNN in Agricultural Area Segmentation on Satellite Images. In Proceedings of the 2020 7th NAFOSTED Conference on Information and Computer Science (NICS), Ho Chi Minh City, Vietnam, 26 November 2020; pp. 124–129. [Google Scholar]
  39. Wang, Z.; Wang, J.; Yang, K.; Wang, L.; Su, F.; Chen, X. Semantic Segmentation of High-Resolution Remote Sensing Images Based on a Class Feature Attention Mechanism Fused with Deeplabv3+. Comput. Geosci. 2022, 158, 104969. [Google Scholar] [CrossRef]
  40. Wu, Z.; Yang, R.; Gao, F.; Wang, W.; Fu, L.; Li, R. Segmentation of Abnormal Leaves of Hydroponic Lettuce Based on DeepLabV3+ for Robotic Sorting. Comput. Electron. Agric. 2021, 190, 106443. [Google Scholar] [CrossRef]
  41. Kathawala, A.A.; Chauhan, A.; Chalmal, A.; Ransubhe, O.; Bhosale, A.A. Plant Leaf Disease Detection Using Data Augmentation and CNN. J. Emerg. Technol. Innov. Res. 2021, 8, b896–b901. [Google Scholar]
  42. Bharati Devi, M.; Amarendra, K. A Convolutional Neural Network Architecture for Tomato Leaf Disease Detection Using Data Augmentation. Smart Comput. Tech. Appl. 2021, 225, 507–516. [Google Scholar] [CrossRef]
  43. Sethanan, K.; Pitakaso, R.; Srichok, T.; Khonjun, S.; Weerayuth, N.; Prasitpuriprecha, C.; Preeprem, T.; Jantama, S.S.; Gonwirat, S.; Enkvetchakul, P.; et al. Computer-Aided Diagnosis Using Embedded Ensemble Deep Learning for Multiclass Drug-Resistant Tuberculosis Classification. Front. Med. 2023, 10, 1122222. [Google Scholar] [CrossRef]
  44. Abraham, S.E.; Kovoor, B.C. Residual Decoder Based U-Net for Semantic Segmentation. Int. Conf. Innov. Comput. Commun. 2022, 1388, 699–708. [Google Scholar] [CrossRef]
  45. Boyina, L.; Sandhya, G.; Vasavi, S.; Koneru, L.; Koushik, V. Weed Detection in Broad Leaves Using Invariant U-Net Model. In Proceedings of the 2021 International Conference on Communication, Control and Information Sciences (ICCISc), Idukki, India, 16 June 2021; pp. 1–4. [Google Scholar]
  46. Arun Pandian, J.; Geetharamani, G.; Annette, B. Data Augmentation on Plant Leaf Disease Image Dataset Using Image Manipulation and Deep Learning Techniques. In Proceedings of the 2019 IEEE 9th International Conference on Advanced Computing (IACC), Tiruchirappalli, India, 13–14 December 2019; pp. 199–204. [Google Scholar]
  47. Min, B.; Kim, T.; Shin, D.; Shin, D. Data Augmentation Method for Plant Leaf Disease Recognition. Appl. Sci. 2023, 13, 1465. [Google Scholar] [CrossRef]
  48. Kant Duggal, J.; El-Sharkawy, M. Shallow SqueezeNext: Real Time Deployment on Bluebox2.0 with 272KB Model Size. JEEE 2020, 8, 127. [Google Scholar] [CrossRef]
  49. Lv, S.; Liu, J.; Gong, C.; Yang, B.; Gan, X. The High Precision Real-Time Facial Landmark Detection Technique Based on ShufflenetV2. Theor. Comput. Sci. 2021, 1494, 59–71. [Google Scholar] [CrossRef]
  50. Wan, X.; Zuo, X.; Zhao, X. A Differential Evolution Algorithm Combined with Linear Programming for Solving a Closed Loop Facility Layout Problem. Appl. Soft Comput. 2022, 121, 108725. [Google Scholar] [CrossRef]
  51. He, Z.; Liu, T.; Liu, H. Improved Particle Swarm Optimization Algorithms for Aerodynamic Shape Optimization of High-Speed Train. Adv. Eng. Softw. 2022, 173, 103242. [Google Scholar] [CrossRef]
  52. Qin, H.; Zhang, W.; Zhai, H. Cooperative Control of Multiple Intersections Combining Agent and Chaotic Particle Swarm Optimization. Comput. Electr. Eng. 2023, 110, 108875. [Google Scholar] [CrossRef]
  53. Song, L.; Dong, Y.; Guo, Q.; Meng, Y.; Zhao, G. An Adaptive Differential Evolution Algorithm with DBSCAN for the Integrated Slab Allocation Problem in Steel Industry. Appl. Soft Comput. 2023, 146, 110665. [Google Scholar] [CrossRef]
  54. Yang, L.; Yu, H.; Cheng, Y.; Mei, S.; Duan, Y.; Li, D.; Chen, Y. A Dual Attention Network Based on efficientNet-B2 for Short-Term Fish School Feeding Behavior Analysis in Aquaculture. Comput. Electron. Agric. 2021, 187, 106316. [Google Scholar] [CrossRef]
  55. Shafiq, M.; Gu, Z. Deep Residual Learning for Image Recognition: A Survey. Appl. Sci. 2022, 12, 8972. [Google Scholar] [CrossRef]
  56. Li, G.; Zhang, M.; Li, J.; Lv, F.; Tong, G. Efficient Densely Connected Convolutional Neural Networks. Pattern Recognit. 2021, 109, 107610. [Google Scholar] [CrossRef]
  57. Tian, Y.; Li, E.; Liang, Z.; Tan, M.; He, X. Diagnosis of Typical Apple Diseases: A Deep Learning Method Based on Multi-Scale Dense Classification Network. Front. Plant Sci. 2021, 12, 698474. [Google Scholar] [CrossRef]
  58. Sanath Rao, U.; Swathi, R.; Sanjana, V.; Arpitha, L.; Chandrasekhar, K.; Chinmayi; Naik, P.K. Deep Learning Precision Farming: Grapes and Mango Leaf Disease Detection by Transfer Learning. Glob. Transit. Proc. 2021, 2, 535–544. [Google Scholar] [CrossRef]
  59. Venkatesh, T.; Prathyush, K.; Deepak, S.; Preetham, U.V.S.A.M. Agriculture Crop Leaf Disease Detection Using Image Processing. Int. J. Innov. Technol. Explor. Eng. 2021, 10, 110–114. [Google Scholar] [CrossRef]
  60. Chainarong, S.; Pitakaso, R.; Sirirak, W.; Srichok, T.; Khonjun, S.; Sethanan, K.; Sangthean, T. Multi-Objective Variable Neighborhood Strategy Adaptive Search for Tuning Optimal Parameters of SSM-ADC12 Aluminum Friction Stir Welding. J. Manuf. Mater. Process. 2021, 5, 123. [Google Scholar] [CrossRef]
  61. Chainarong, S.; Srichok, T.; Pitakaso, R.; Sirirak, W.; Khonjun, S.; Akararungruangku, R. Variable Neighborhood Strategy Adaptive Search for Optimal Parameters of SSM-ADC 12 Aluminum Friction Stir Welding. Processes 2021, 9, 1805. [Google Scholar] [CrossRef]
  62. Nagamani, H.S.; Devi, H.S. Leaf Region Segmentation for Plant Leaf Disease Detection Using Color Conversion and Flood Filling. In Proceedings of the 2021 2nd Global Conference for Advancement in Technology (GCAT), Bangalore, India, 1 October 2021; pp. 1–7. [Google Scholar]
  63. Abusham, E.A. Image Processing Technique for the Detection of Alberseem Leaves Diseases Based on Soft Computing. Artif. Intell. Robot. Dev. J. 2021, 1, 103–115. [Google Scholar] [CrossRef]
  64. Entuni, C.J.; Afendi Zulcaffle, T.M.; Kipli, K. Severity Estimation of Plant Leaf Diseases Using Segmentation Method. Appl. Sci. Eng. Prog. 2021, 14, 108–119. [Google Scholar] [CrossRef]
  65. Mukhopadhyay, S.; Paul, M.; Pal, R.; De, D. Tea Leaf Disease Detection Using Multi-Objective Image Segmentation. Multimed. Tools Appl. 2021, 80, 753–771. [Google Scholar] [CrossRef]
  66. Trecene, J.K.D. Brassicaceae Leaf Disease Detection Using Image Segmentation Technique. In Proceedings of the IEEE EUROCON 2021—19th International Conference on Smart Technologies, Lviv, Ukraine, 6 July 2021; pp. 30–34. [Google Scholar]
  67. Narayanapur, A.; Naik, P.; Kori, P.B.; Kalaburgi, N.; IM, R.; MC, M. Leaf Disease Detection of Agricultural Plant Using Image Processing. Int. J. Sci. Res. Comput. Sci. Eng. Inf. Technol. 2020, 6, 432–435. [Google Scholar] [CrossRef]
  68. Bjånes, A.; De La Fuente, R.; Mena, P. A Deep Learning Ensemble Model for Wildfire Susceptibility Mapping. Ecol. Inform. 2021, 65, 101397. [Google Scholar] [CrossRef]
  69. Hirasen, D.; Pillay, V.; Viriri, S.; Gwetu, M. Skeletal Age Estimation from Hand Radiographs Using Ensemble Deep Learning. Pattern Recognit. 2021, 12725, 173–183. [Google Scholar] [CrossRef]
  70. Lee, K.; Laskin, M.; Srinivas, A.; Abbeel, P. Sunrise: A Simple Unified Framework for Ensemble Learning in Deep Reinforcement Learning. Proc. Mach. Learn. Res. 2021, 139, 6131–6141. [Google Scholar]
  71. Wei, W.; Liu, L. Robust Deep Learning Ensemble Against Deception. IEEE Trans. Dependable Secur. Comput. 2020, 18, 1. [Google Scholar] [CrossRef]
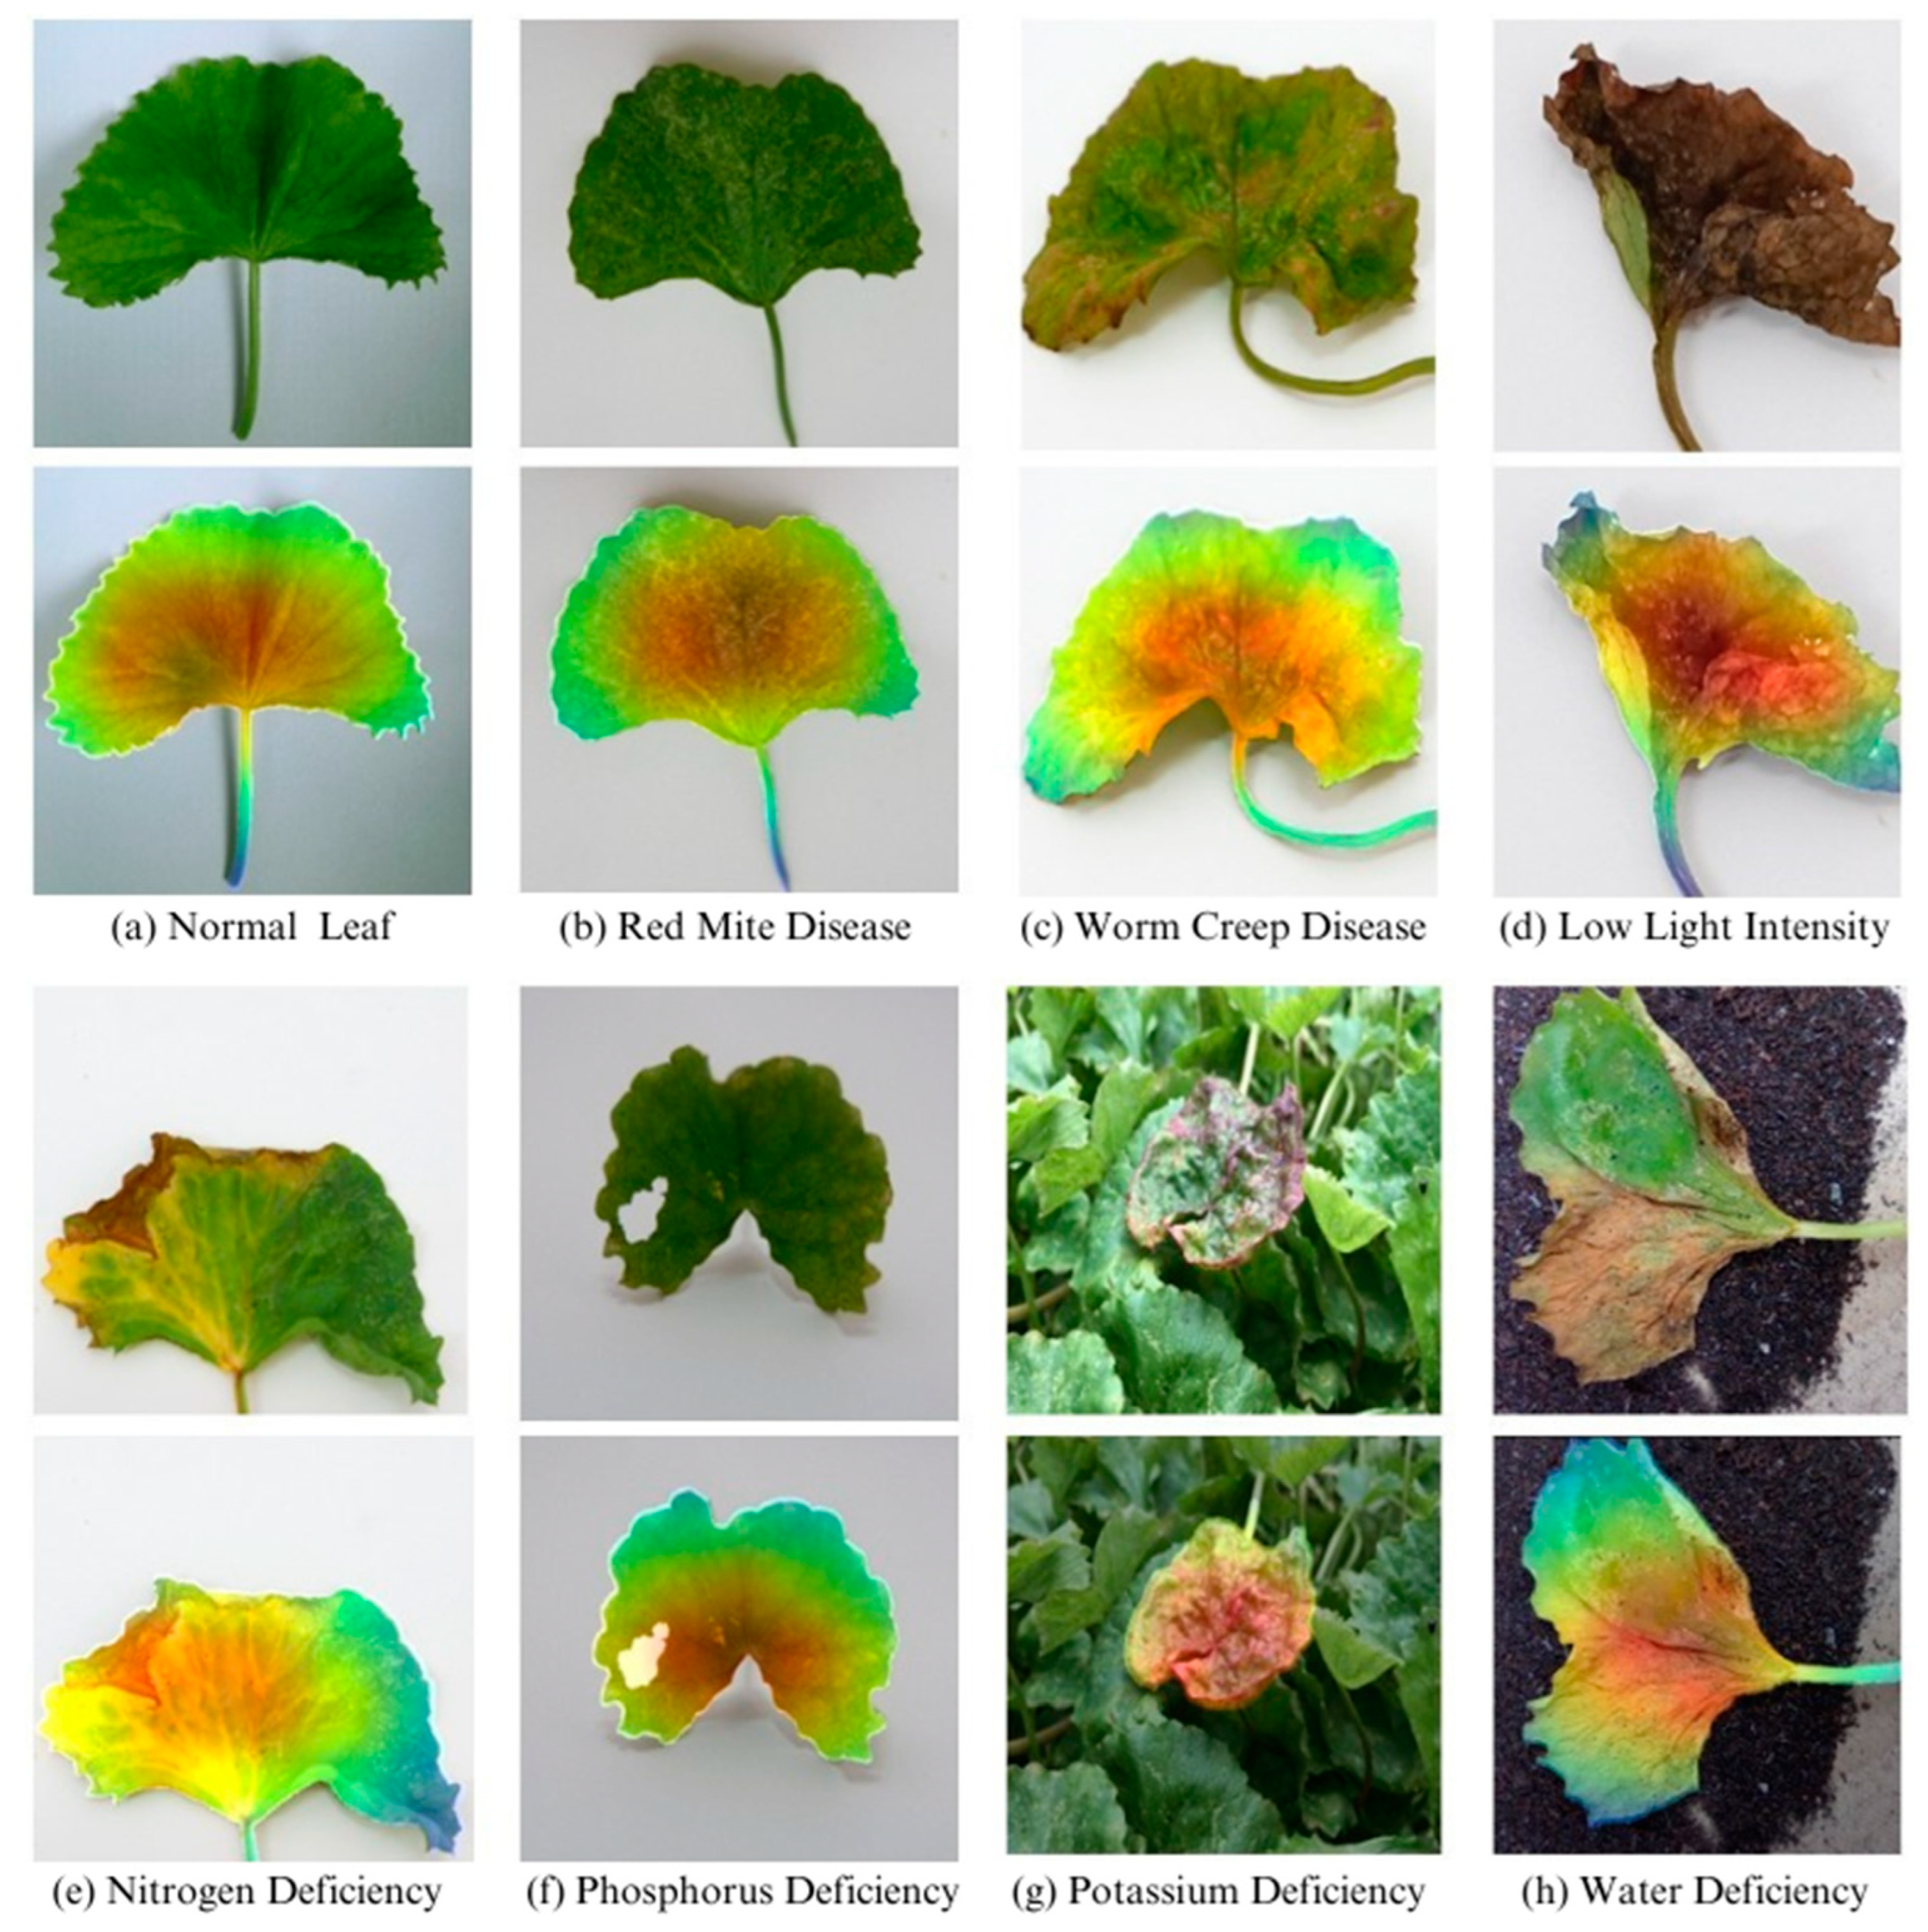
Figure 1. Ensemble image segmentation techniques.
Agriengineering 06 00037 g001
Figure 2. Image augmentation example images: (a) random cropping, (b) random scaling, and (c) random flipping.
Agriengineering 06 00037 g002
Figure 3. Framework of the proposed model.
Agriengineering 06 00037 g003
Figure 4. Average accuracy using the different model entities proposed.
Agriengineering 06 00037 g004
Figure 5. Confusion matrix of the proposed model.
Agriengineering 06 00037 g005
Figure 6. Heatmap of the leaf abnormality for all classes.
Agriengineering 06 00037 g006
Table 1. Detail of the leaf abnormality types used in this research.
Name of Leaf AbnormalityDescriptionLeaf Image Example
Normal Leaf (NL)Plant leaves are spreading, green, no lesions.Agriengineering 06 00037 i001
Red Mite Disease (RM)Red mites suck the sap from the leaves, causing the loss of chlorophyll. Red mites cause the upper surfaces of the leaves to become pale yellow spots, burn shoots, wither leaves, and fall off.Agriengineering 06 00037 i002
Worm Creep Disease (WCD)The caterpillars will eat young and old leaves until only the stems and branches remain.Agriengineering 06 00037 i003
Low Light Intensity (LI)Plant leaves reduce chlorophyll production. The leaves turn yellow.Agriengineering 06 00037 i004
Nitrogen Deficiency (ND)The leaves are pale yellow. The tip of the leaf and the edge of the leaf will gradually dry and this will spread continuously until the leaves fall from the tree prematurely.Agriengineering 06 00037 i005
Phosphorus Deficiency (PHD)Phosphorus deficiency manifests as stunted growth, dark green or purple pigmentation in leaves, and underdeveloped root systems in plants.Agriengineering 06 00037 i006
Potassium Deficiency (PD)Older leaves are pale yellow, starting from the leaf margin and leaf tip.
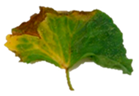
Agriengineering 06 00037 i007
Water Deficiency (WD)The leaves wither, and dry leaves cannot spread.
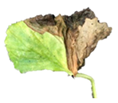
Agriengineering 06 00037 i008
Table 2. Number of sets of data in ABL-1 and ABL-2.
ABL-1ABL-2
NLRMNDPDLIWDWCDPHDNLRMNDPDLIWDWCDPHD
Training set1000960104010801072106410241040--------
Testing set250240260270268266256260550550500600550550600580
Total12501200130013501340133012801300550500600550550600580580
Table 3. Experimental results reveal the optimal combination of model entities.
No.SegmentationAugmentationDecision Fusion StrategyAccuracyAUCF1-Score
No SegmentWith SegmentNo AugmentWith AugmentUWADEPSOVaNSAS
1-----85.6586.0686.74
2-----83.8184.1785.09
3-----84.0284.2385.11
4-----84.5985.9486.32
5-----86.7186.8287.03
6-----88.2888.4089.55
7-----89.8590.0391.28
8-----90.4890.8592.47
9-----89.6390.5891.38
10-----90.4190.9691.57
11-----92.1993.1793.26
12-----93.4693.6394.02
13-----92.8294.0194.23
14-----94.3994.4894.75
15-----94.5495.0195.34
16-----96.3196.4796.69
Table 4. Detail of the compared methods.
MethodDescriptionNumber of CNNTotal Size
(MB)
Training Time
(min)
Testing Time
(min/image)
Ho-Mo [13]Homogenous Ensemble Mobile NetV3735.065.380.62
Ho-SQ [14]Homogenous Ensemble Squeeze NetV2838.467.090.64
Ho-Sh [15]Homogenous Ensemble Shuffle NetV253766.270.64
EfficientNet-B2 [54]Single Model14170.500.68
EfficientNet-B3 [54]Single Model14473.940.70
ResNet-50 [55]Single Model14474.110.72
DenseNet121 [56]Single Model13358.430.56
Inception-ResNet-v2 [57]Single Model15678.080.84
He-Meta (proposed model)Heterogeneous Ensemble ShuffleNetV2, Squeeze NetV2 and Mobile NetV3634.460.410.61
Table 5. KPIs of the tested dataset using various methods.
MethodAUCF1-ScoreAccuracy
Ho-Mo [13]96.0995.7894.70
Ho-SQ [14]95.4295.0194.81
Ho-Sh [15]94.2794.1393.38
EfficientNet-B2 [54]95.0794.1993.86
EfficientNet-B3 [54]94.5194.4093.92
ResNet-50 [55]93.4693.0792.75
DenseNet121 [56]93.2692.1191.08
Inception-ResNet-v2 [57]97.6997.7497.38
He-Meta (proposed model)98.9598.8298.51
Table 6. Cross-validation metrics.
Method3-cv5-cv
AUCF1-ScoreAccuracyAUCF1-ScoreAccuracy
Ho-Mo [13]96.11 ± 0.0795.81 ± 1.8194.71 ± 0.6496.14 ± 0.3595.83 ± 0.2794.70 ± 0.37
Ho-SQ [14]95.46 ± 0.7695.05 ± 1.8794.83 ± 0.4795.43 ± 0.6595.03 ± 0.2994.83 ± 0.53
Ho-Sh [15]94.32 ± 0.5894.18 ± 0.9893.41 ± 0.7294.31 ± 0.8694.13 ± 0.3693.38 ± 0.41
EfficientNet-B2 [54]95.10 ± 0.7694.23 ± 0.8593.88 ± 0.8695.10 ± 0.2994.21 ± 0.8593.89 ± 0.25
EfficientNet-B3 [54]94.54 ± 0.4894.41 ± 0.7893.93 ± 1.8294.51 ± 0.6794.43 ± 0.5293.97 ± 0.31
ResNet-50 [55]93.51 ± 0.9493.08 ± 0.6792.76 ± 0.9893.46 ± 0.7393.11 ± 0.5892.77 ± 0.26
DenseNet121 [56]93.28 ± 0.3292.13 ± 0.5691.12 ± 0.4593.29 ± 0.2792.16 ± 0.9791.10 ± 0.12
Inception-ResNet-v2 [57]97.72 ± 0.4397.76 ± 0.4297.39 ± 0.3797.70 ± 0.4797.74 ± 0.1297.41 ± 0.04
He-Meta (proposed model)98.97 ± 0.1998.86 ± 0.3298.55 ± 0.2998.99 ± 0.2798.83 ± 0.0798.55 ± 0.08
Table 7. KPIs of the tested dataset using various methods of ABL-2.
MethodAUCF1-ScoreAccuracy
Ho-Mo [13]96.0595.7394.67
Ho-SQ [14]95.3994.9794.74
Ho-Sh [15]94.2594.0593.35
EfficientNet-B2 [54]95.0694.1293.78
EfficientNet-B3 [54]94.4894.3293.87
ResNet-50 [55]93.4493.0392.71
DenseNet121 [56]93.1892.0891.04
Inception-ResNet-v2 [57]97.6897.7197.35
He-Meta (proposed model)98.9398.7598.45
Table 8. Cross-validation metrics of ABL-2.
Method3-cv5-cv
AUCF1-ScoreAccuracyAUCF1-ScoreAccuracy
Ho-Mo [13]96.13 ± 2.4895.72 ± 2.0394.64 ± 1.4896.14 ± 1.5795.73 ± 2.0294.65 ± 2.13
Ho-SQ [14]95.43 ± 0.8195.05 ± 0.5494.77 ± 1.5195.45 ± 1.8695.05 ± 2.8194.78 ± 2.56
Ho-Sh [15]94.22 ± 0.8694.16 ± 0.6893.34 ± 0.7494.23 ± 1.4794.18 ± 1.0493.34 ± 0.85
EfficientNet-B2 [54]95.07 ± 1.4894.15 ± 1.6793.88 ± 1.7495.08 ± 2.1594.15 ± 1.5193.89 ± 1.07
EfficientNet-B3 [54]94.50 ± 1.8594.36 ± 1.7493.89 ± 0.9694.52 ± 1.1694.38 ± 1.0593.91 ± 0.86
ResNet-50 [55]93.44 ± 0.8993.08 ± 0.8592.75 ± 1.4793.44 ± 1.2693.08 ± 1.7492.76 ± 0.94
DenseNet121 [56]93.26 ± 0.5892.07 ± 0.5391.10 ± 0.4793.28 ± 0.3892.08 ± 0.3191.12 ± 0.68
Inception-ResNet-v2 [57]97.68 ± 0.1997.72 ± 0.2497.41 ± 0.2797.69 ± 0.3497.74 ± 0.1997.41 ± 0.48
He-Meta (proposed model)98.98 ± 0.0998.84 ± 0.1198.46 ± 0.1898.98 ± 0.1598.85 ± 0.1398.47 ± 0.07
Disclaimer/Publisher’s Note: The statements, opinions and data contained in all publications are solely those of the individual author(s) and contributor(s) and not of MDPI and/or the editor(s). MDPI and/or the editor(s) disclaim responsibility for any injury to people or property resulting from any ideas, methods, instructions or products referred to in the content.

