Article

Individual Street Tree Detection and Vitality Assessment Using GeoAI and Multi-Source Imagery

Department of Social Studies (Geography), Ewha Womans University, Seoul 03760, Republic of Korea
*
Author to whom correspondence should be addressed.
Smart Cities 2026, 9(2), 31; https://doi.org/10.3390/smartcities9020031
Submission received: 29 December 2025 / Revised: 9 February 2026 / Accepted: 9 February 2026 / Published: 11 February 2026

Highlights

What are the main findings?
  • A GeoAI-based framework was developed to delineate individual street tree crowns from high-resolution aerial imagery and to derive a remote sensing-based vitality proxy by integrating NDVI, NDRE, and NDMI at the individual tree level.
  • The analysis revealed spatially varying vitality patterns across urban environments. Trees along major road corridors generally showed lower spectral vitality signals, while those near parks, riverfront walkways, and recently developed residential areas tended to exhibit higher values. NDMI captured moisture-related variation that was not fully reflected by chlorophyll-related indices.
What are the implication of the main findings?
  • The proposed framework provides a scalable and repeatable approach for screening and monitoring street tree vitality over large urban areas, complementing traditional field-based inspections rather than replacing them.
  • By highlighting areas with clusters of low-vitality tree signals, the method offers a practical decision-support tool for prioritizing field diagnosis and informing data-driven urban green-infrastructure management within smart-city planning contexts.

Abstract

Urban street trees provide essential environmental and social benefits, yet their vitality is often challenged by adverse urban conditions such as traffic emissions, impervious surfaces, and limited soil moisture. Conventional street tree management relies heavily on labor-intensive field inspections, making large-scale and repeatable assessment difficult. To address this limitation, this study proposes a GeoAI-based framework that integrates high-resolution aerial imagery, multispectral satellite data, and deep learning–based semantic segmentation to automatically delineate individual street trees and derive a remote sensing-based vitality proxy. Street trees are detected from orthorectified aerial imagery using semantic segmentation models, and vegetation indices—including NDVI, NDRE, and NDMI—are extracted from multispectral satellite imagery. An area-weighted object–pixel matching strategy is applied to associate spectral indicators with individual crowns across multi-resolution datasets. A composite vitality proxy is then constructed by integrating chlorophyll- and moisture-related indices. The results reveal spatial variability in spectral vitality signals across different urban environments. Trees along major road corridors tended to exhibit lower chlorophyll- and moisture-related indicators, while those near parks, riverfront walkways, and recently developed residential areas generally showed higher values. NDMI provided complementary insights into moisture-related stress that were not fully reflected by chlorophyll-based indices. Although the proposed vitality proxy is not a substitute for field-based diagnosis, the overall framework offers a scalable approach for citywide screening and prioritization of potentially stressed trees, supporting data-informed urban green infrastructure management within smart-city planning contexts.

1. Introduction

Urban street trees provide a wide range of environmental and social benefits. They play a critical role in improving urban air quality by absorbing particulate matter and mitigating the urban heat island effect [1,2]. In addition, street trees offer thermal comfort to pedestrians by blocking intense solar radiation during summer, thereby enhancing walkability and outdoor livability in urban areas [3]. Despite these benefits, street trees in dense urban environments are frequently exposed to adverse conditions such as vehicle exhaust emissions, increased surface runoff from impervious pavements, and prolonged exposure to artificial night lighting, all of which can negatively affect tree growth and physiological functioning [4,5].
Under such stressful urban conditions, maintaining the vitality of street trees is of paramount importance. Tree vitality generally refers to the overall health condition of vegetation or its ability to cope with environmental stress, which is closely associated with growth potential and long-term survivability [6,7]. Because urban trees typically experience higher levels of physiological stress than their rural counterparts, they tend to have shorter lifespans [8,9]. Consequently, systematic and continuous assessment of tree vitality is essential for sustainable urban forest management.
Globally, street tree vitality assessment is commonly conducted through a two-stage process consisting of an initial visual inspection followed by a secondary detailed diagnosis when necessary. Examples include New York City’s tree inventory program, the Runnymede Borough in the United Kingdom, Singapore’s Visual Tree Assessment (VTA) procedures, and methodological frameworks proposed by the Seoul Institute of Technology in South Korea [10,11,12,13]. Although these approaches allow for detailed field-based evaluation, they require substantial time, labor, and financial resources, which limits scalability and repeatability across large urban areas [14].
Recent advances in high-resolution remote sensing and deep learning have opened new opportunities for developing efficient, large-scale vitality assessment methods. These technologies are particularly valuable for urban street trees, which are more vulnerable to vitality decline due to constrained rooting environments, pollution exposure, and limited soil moisture. Therefore, establishing a scalable and systematic framework for monitoring street tree vitality has become increasingly important.
In this context, this study proposes an integrated GeoAI-based framework that combines deep learning-based individual tree detection with multi-source aerial and satellite imagery to derive a remote sensing-based vitality proxy for urban street trees. Unlike conventional field-based inspections and prior remote sensing studies that typically focus on single health-related indicators (e.g., pest infestation, disease occurrence, or dead tree identification), the proposed framework enables object-level analysis by delineating individual tree crowns and integrating multiple vegetation indices related to photosynthetic activity and moisture conditions. While this approach does not replace field-based physiological diagnosis, it provides a scalable and repeatable method for citywide screening and prioritization, offering practical value for data-driven urban green infrastructure management in smart city contexts.
The remainder of this paper is organized as follows. Section 2 reviews related studies on deep learning-based street tree detection and vegetation vitality analysis. Section 3 describes the data and methodologies employed. Section 4 presents the experimental results, followed by a discussion in Section 5. Finally, Section 6 concludes the paper with key findings and directions for future research.

2. Related Works

2.1. Deep Learning-Based Analysis of Tree Vitality Using Remote Sensing Data

To overcome the limitations of field-based street tree vitality assessments, a growing body of research has increasingly adopted remote sensing-based approaches. However, most existing studies using remote sensing data have primarily focused on identifying specific anomalous conditions, such as pest and disease infection or dead tree detection, rather than comprehensively assessing tree vitality [15,16,17,18].
For instance, Kampen et al. [15] treated tree mortality rate as a proxy for tree vitality and classified ash tree vitality into five levels while also analyzing pest infestation in spruce trees. Their study utilized UAV imagery incorporating RGB, near-infrared (NIR), and red-edge bands, together with field survey data. A total of seven vegetation indices, including the Normalized Difference Red Edge Index (NDRE), along with texture features, were used as input variables for a Random Forest classifier. The results showed an overall accuracy of 61.7% for vitality level classification and 86.6% for pest infestation detection. Similarly, Yao et al. [17] employed a Mask R-CNN model to detect individual trees and classified living and dead trees by integrating 4 cm resolution UAV imagery, field survey data, and a Digital Surface Model (DSM). Six vegetation indices, including Normalized Difference Vegetation Index (NDVI), were used as model inputs. Their findings indicated that RGB band combinations were most effective for detecting living trees, whereas a combination of RGB imagery and DSM data yielded the best performance for dead tree detection. These studies largely define tree health or vitality in terms of the presence of pests or mortality status, thereby limiting vitality assessment to specific stress outcomes.
In contrast, several studies have attempted to quantitatively investigate the relationship between tree vitality and vegetation indices [19,20,21]. Einzmann et al. [19] examined whether early-stage growth decline in spruce trees could be detected using remote sensing data. They employed 50 cm resolution RGB aerial imagery, field-based visual assessments, and temporally sampled leaf spectral measurements. Reflectance values from individual spectral bands and 15 vegetation indices, including NDVI and Normalized Difference Water Index (NDWI), were used as input variables for a Random Forest classifier. Their results demonstrated the potential of vegetation indices to capture early vitality decline. Meanwhile, Xiao et al. [20] developed a tree health index based on NDVI to map urban tree health conditions. In their approach, tree health was defined as the proportion of healthy pixels within the total canopy area, where healthy pixels were identified using species-specific NDVI thresholds. Trees with a health index greater than 70% were classified as healthy. When compared with field-based tree health assessments, the proposed method achieved accuracies of 86% for deciduous broadleaf trees and 91% for coniferous trees. These findings suggest that NDVI-based individual-tree analysis can provide meaningful vitality-related information for urban forest management.
With recent advances in deep learning techniques and the increasing availability of high-resolution aerial and satellite imagery, automatic detection of urban street trees has become increasingly feasible. As a result, substantial research efforts have focused on urban canopy mapping, individual tree detection and segmentation, and vegetation change detection [22,23,24,25,26]. Among these studies, Martins et al. [22] mapped urban tree canopies in Brazilian cities using 10 cm resolution RGB aerial imagery and semantic segmentation–based deep learning models. They compared several architectures, including Fully Convolutional Networks (FCN), U-Net, SegNet, and DeepLabV3+, and reported that DeepLabV3+ achieved the best performance, with an overall accuracy of 96%. Similarly, Lv et al. [23] aimed to improve individual tree detection accuracy in complex urban environments by proposing a Mask R-CNN–based instance segmentation model. Using 0.1 m resolution RGB UAV imagery acquired over a university campus, their model achieved a high average precision of 92.4%, demonstrating the effectiveness of deep learning for fine-scale urban tree detection.

2.2. Vegetation Indices for Street Tree Vitality Analysis

Because previous studies that integrate multiple vegetation indices to estimate overall tree vitality remain limited, this study derives a composite vitality indicator by focusing on vegetation indices that are widely used in practice and have demonstrated strong correspondence with field-based observations.
NDVI is the most commonly used indicator for vegetation health assessment. Owing to its strong correlation with photosynthetically active radiation (PAR) [21], NDVI is widely recognized as a representative proxy for photosynthetic activity. Xiao et al. [20] evaluated urban tree health using an NDVI-based Tree Health Index and reported an accuracy of 86% when compared with field-measured tree conditions. More recently, Hocknell et al. [18] employed Landsat NDVI time series to detect canopies infected by Dutch elm disease, achieving a detection precision of 71%. These studies collectively demonstrate that NDVI is effective for quantitatively diagnosing tree physiological conditions, including photosynthetic vigor and stress caused by pests and diseases.
Despite its widespread use, NDVI exhibits a well-known saturation problem at high leaf area index (LAI) levels or during peak vegetation growth periods, beyond which index values no longer increase proportionally [27,28,29,30]. The imagery used in this study was acquired during August–September, when vegetation growth typically reaches its maximum, raising the possibility that NDVI saturation could lead to underestimation of vitality variations. To address this limitation, several alternative indices have been proposed, including the Enhanced Vegetation Index (EVI), the Modified Soil Adjusted Vegetation Index (MSAVI2), and the NDRE.
EVI was developed to mitigate NDVI saturation while reducing the effects of atmospheric aerosol scattering and soil background reflectance. It is designed to remain sensitive in densely vegetated areas [31] and is expressed as:
E V I =   N I R R e d N I R + C 1 R e d C 2 B l u e + L ( 1.5 + L )
MSAVI2 was introduced as an improvement over the Soil Adjusted Vegetation Index (SAVI) by automatically estimating the soil adjustment factor L, thereby minimizing soil reflectance effects. This index is particularly useful during early growth stages or in areas with substantial soil exposure [32]. MSAVI2 partially alleviates NDVI saturation and has been widely applied in arid regions and early-stage vegetation monitoring:
M S A V I 2 = 2 N I R + 1 ( 2 N I R + 1 ) 2 8 ( N I R R E D ) 2
NDRE was specifically designed to retain NDVI’s sensitivity to photosynthetic activity while reducing saturation effects by utilizing the red-edge band. NDRE remains responsive in high-vigor vegetation and is particularly effective for detecting variations in chlorophyll concentration and photosynthetic activity during late growth stages [30,33]. In addition to physiological vitality, NDRE has been shown to be effective for detecting pest- and disease-related stress. For example, Simović et al. [34] demonstrated that NDRE could successfully identify vitality decline in insect-damaged trees. Similarly, Abdollahnejad et al. [16] and Kampen et al. [15] reported that red-edge-based vegetation indices were highly effective for tree health assessment and pest detection. These findings indicate that combining multiple vegetation indices can mitigate the limitations of NDVI while enabling indirect yet robust estimation of vegetation vitality.
In urban environments, trees exposed to high concentrations of particulate matter tend to exhibit lower relative leaf water content [35]. This suggests that accurate assessment of urban tree vitality requires not only chlorophyll-based indicators but also indices that capture vegetation water status. Accordingly, this study incorporates moisture-related indices to jointly reflect photosynthetic activity and water stress in vitality estimation.
Among moisture-related indices, the Normalized Difference Moisture Index (NDMI) is widely used to estimate vegetation water content by normalizing NIR and shortwave infrared (SWIR) reflectance. In addition, the Moisture Stress Index (MSI) quantifies vegetation water stress using an non-normalized ratio of SWIR to NIR reflectance [36], where higher values indicate greater moisture stress (water deficiency) and lower values indicate higher water content. While other moisture indices, such as the Soil Moisture Index and Crop Moisture Index, have been proposed in agricultural studies, they require estimation of parameters such as wilting point, field capacity, or evapotranspiration anomaly indices, resulting in increased computational complexity and limited applicability in urban contexts [37]. The MSI is defined as:
M S I = S W I R N I R
Overall, the reviewed vegetation indices and related studies demonstrate that spectral indices are closely associated with vegetation stress responses, growth decline, and health conditions. These findings suggest that vegetation indices can provide an efficient and quantitative basis for assessing tree vitality, particularly when multiple indices are jointly considered to capture complementary physiological characteristics.

3. Materials and Methods

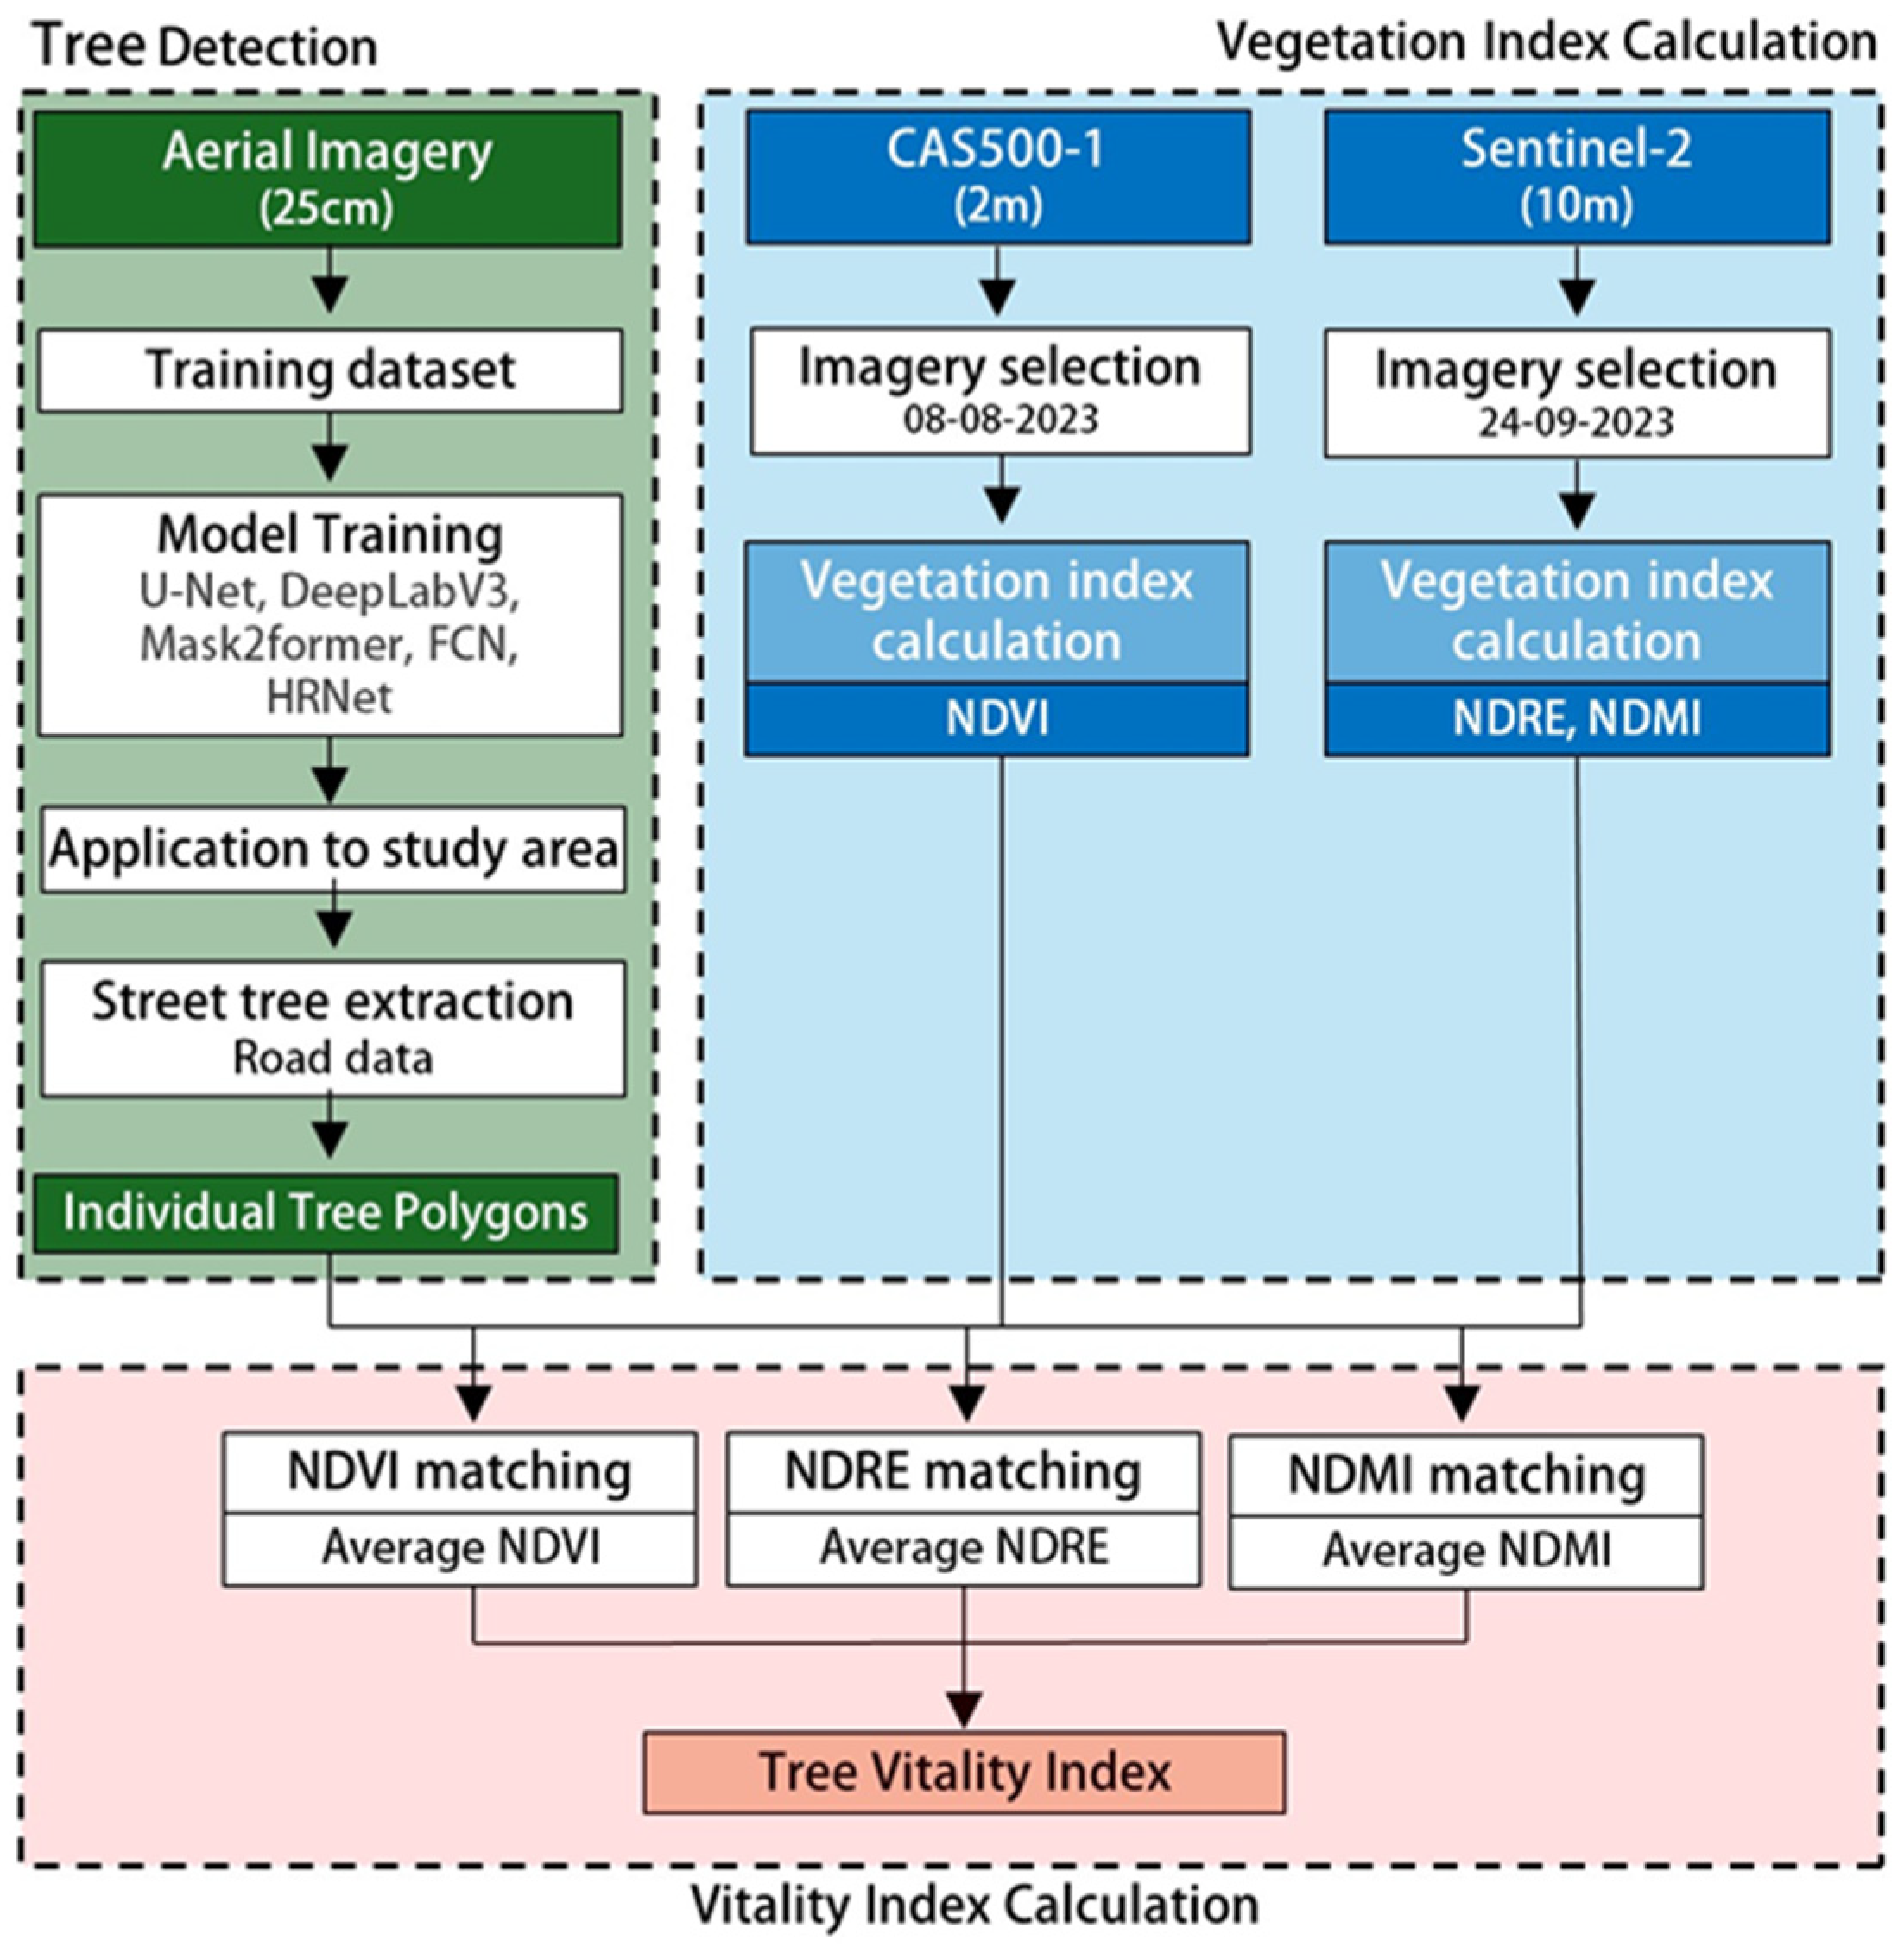
This study aims to accurately detect individual urban street trees using deep learning applied to aerial imagery and to estimate tree vitality at the individual-tree level by computing vegetation indices from multispectral satellite imagery. The proposed framework consists of three main stages. First, individual street trees are detected from high-resolution aerial orthophotos using a deep learning-based approach. Second, multiple vegetation indices are calculated from multispectral satellite imagery. Finally, the vegetation indices are spatially associated with individual tree objects using an area-weighted matching scheme, and a composite tree vitality index is derived by applying score intervals and weights to each vegetation index. The overall workflow of the proposed methodology is illustrated in Figure 1.

3.1. Study Area and Data Sources

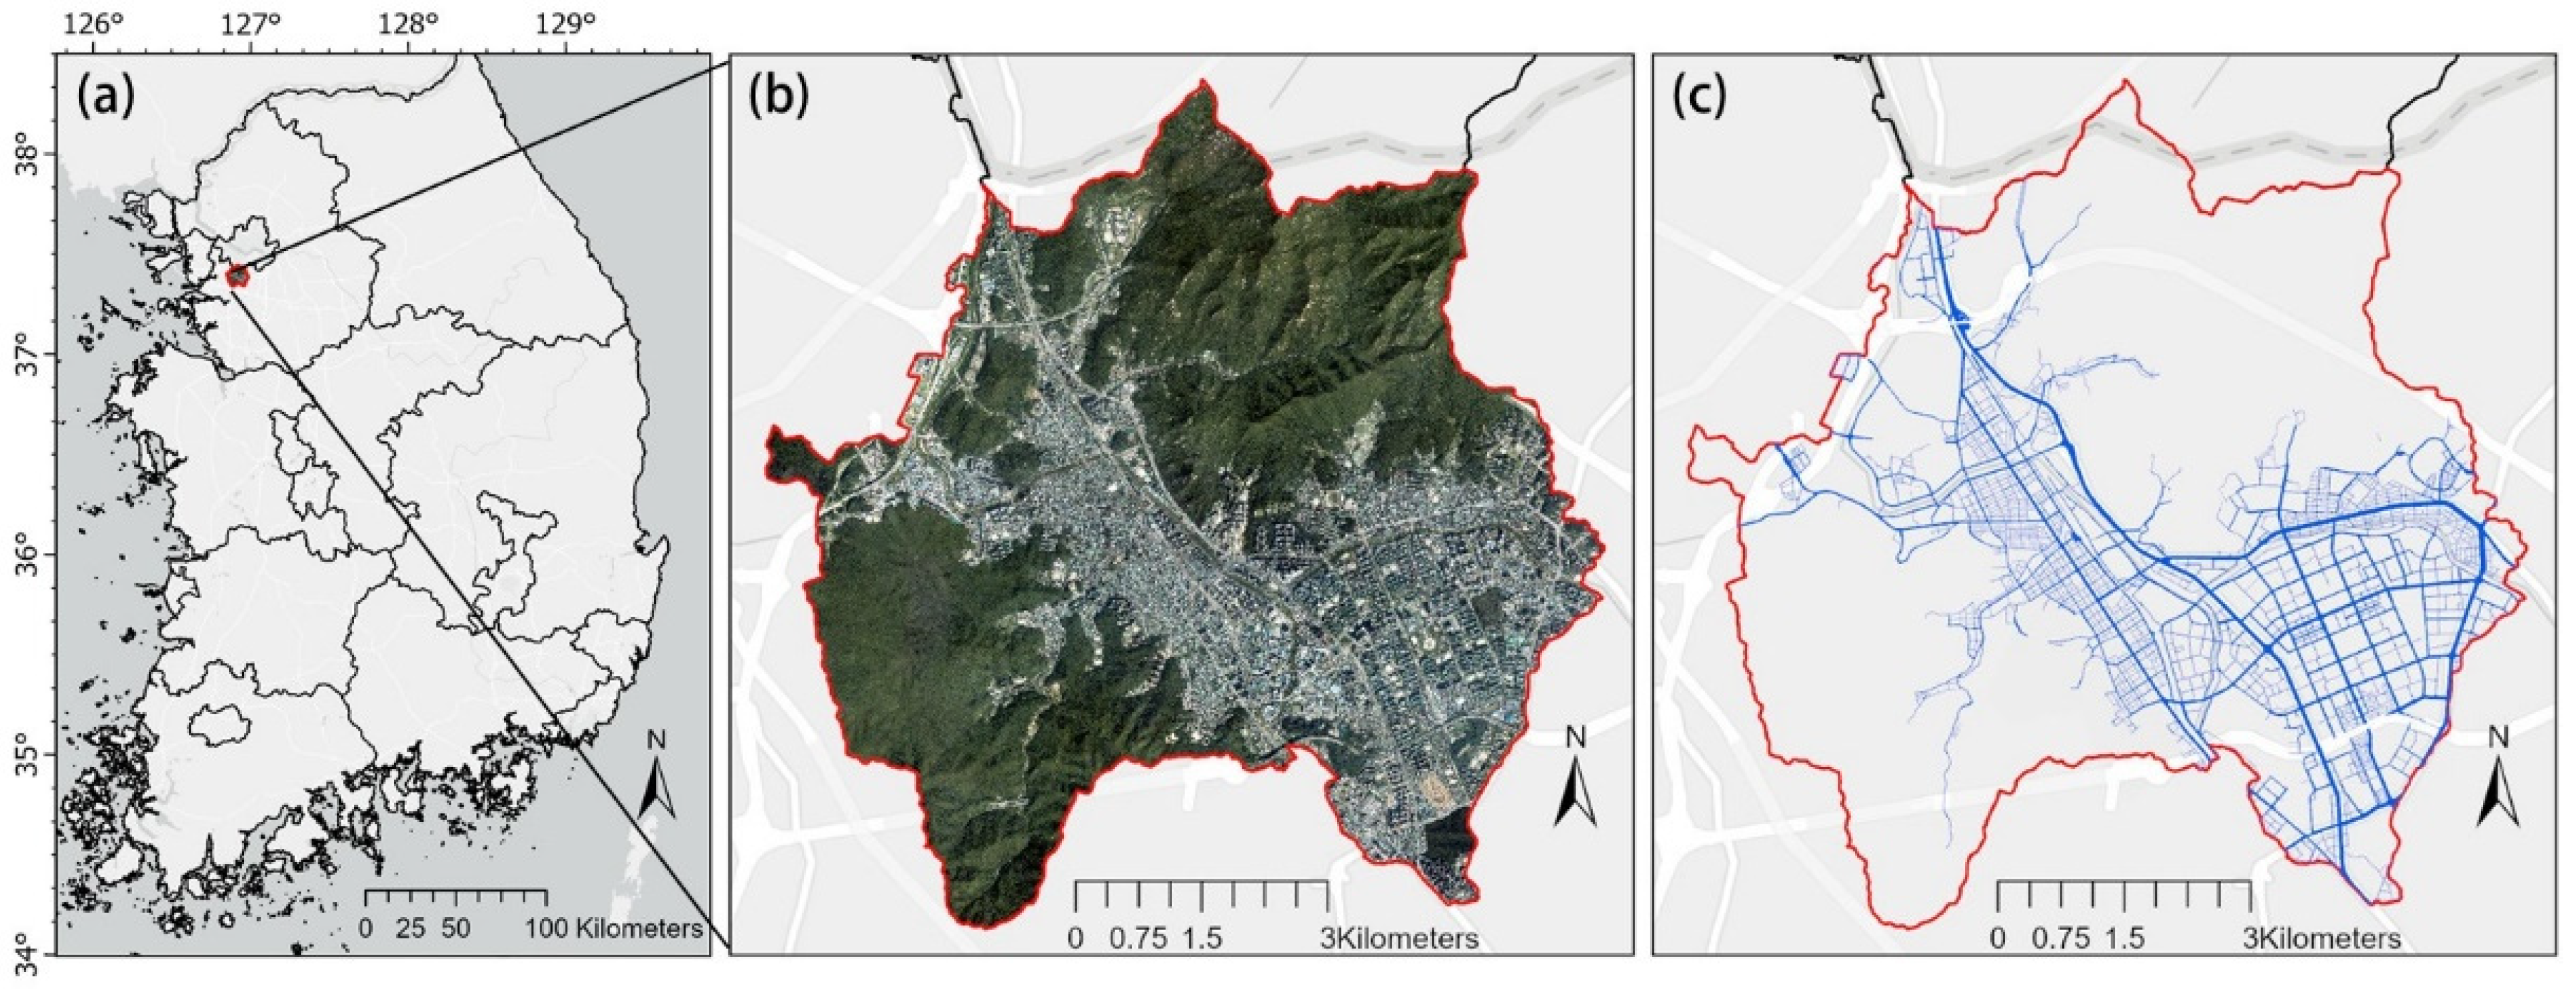
The study area is Anyang, located at approximately 37°23′ N and 126°55′ E (Figure 2). Anyang is a medium-sized city with a population of approximately 560,000 and features a heterogeneous urban landscape characterized by high-rise buildings, linear green corridors such as the Hakui Stream walkway, neighborhood parks, and various types of public green spaces. These diverse urban settings provide a representative range of street tree planting environments, making the study area particularly suitable for training and evaluating deep learning-based street tree detection models. The coexistence of dense built-up areas and multiple forms of urban greenery enables robust assessment of model performance under varying spatial and environmental conditions. The characteristics of the imagery datasets used in this study are described as follows.
  • Orthorectified aerial imagery: To construct the training dataset for street tree detection, this study utilized orthorectified aerial imagery freely provided by the National Geographic Information Institute (NGII). The imagery consists of RGB bands with a spatial resolution of 25 cm and is acquired at flight altitudes of approximately 2000–4000 m. The data are produced through orthorectification and radiometric color correction of aerial photographs collected within the same year, with a nominal acquisition cycle of two years. For this study, aerial imagery acquired in the summer of 2020 was selected, corresponding to the peak vegetation growth period and enabling optimal performance for street tree detection.
  • CAS500-1: To compute vegetation indices and derive tree vitality metrics, this study employed imagery from CAS500-1, a domestically developed Earth observation satellite operated by the South Korean government since October 2021. CAS500-1 has a revisit cycle of approximately 4.6 days and provides a 0.5 m resolution panchromatic band, as well as 2 m resolution multispectral bands, including red, green, blue, and NIR. In this study, cloud-free imagery acquired on 8 August 2023 was used, corresponding to the summer season when vegetation conditions are most pronounced.
  • Sentinel-2 satellite imagery: Multispectral imagery from Sentinel-2, operated by the European Space Agency (ESA), was additionally used to complement the CAS500-1 data. Sentinel-2 provides 13 spectral bands, including red, green, blue, NIR, red-edge, and SWIR bands, with spatial resolutions ranging from 10 to 60 m and a revisit cycle of approximately five days. Imagery acquired on 24 September 2023—temporally close to the CAS500-1 acquisition—was selected. The inclusion of Sentinel-2 data enables the calculation of vegetation indices based on red-edge and SWIR bands, which are not available in CAS500-1 imagery, thereby supporting a more comprehensive vitality analysis.
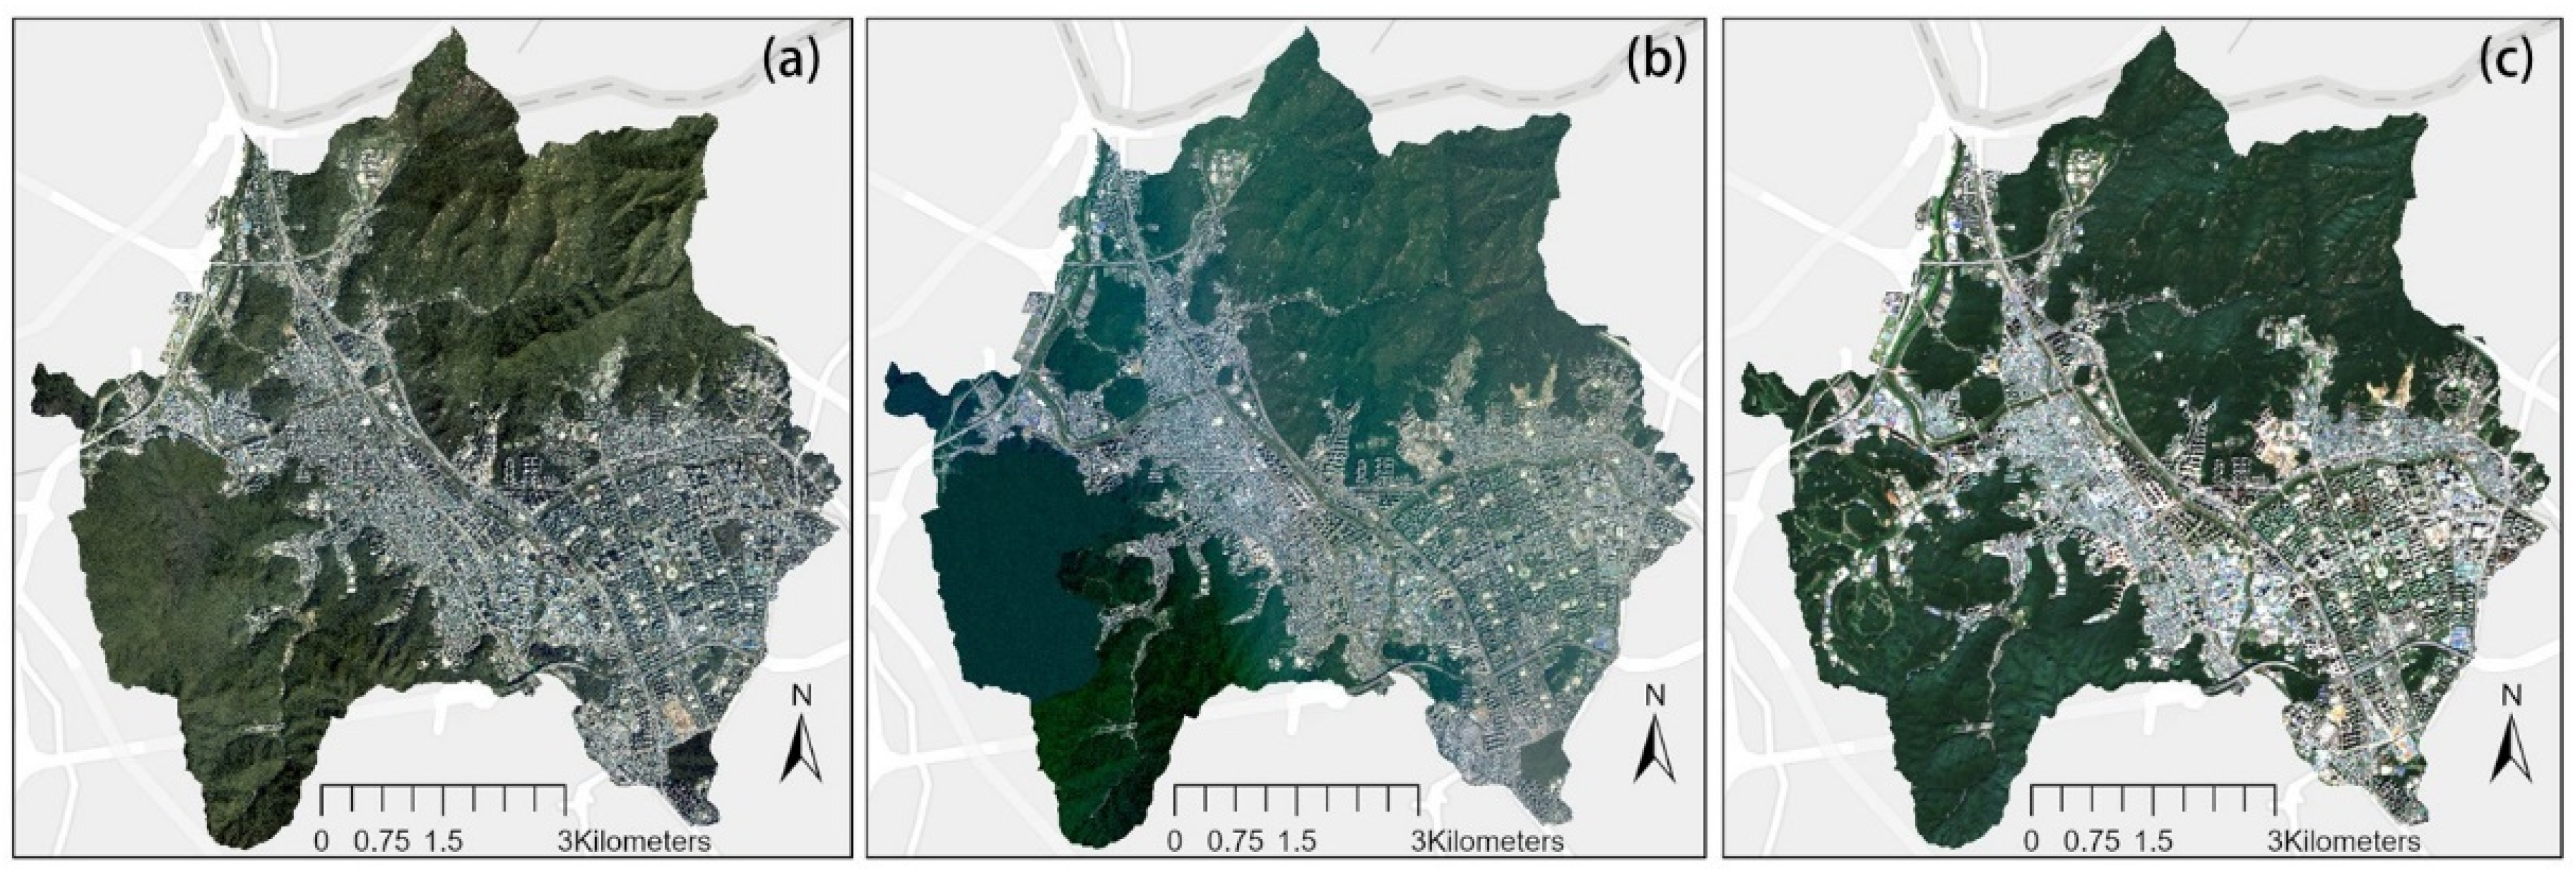
  • It should be noted that the orthorectified aerial imagery and CAS500-1 imagery are subject to security regulations imposed by the data providers; consequently, sensitive facilities such as military installations and thermal power plants are masked prior to data release. In contrast, Sentinel-2 imagery is not subject to such masking procedures. As a result, visual discrepancies between datasets may appear within the same study area, as illustrated in the lower-left portion (approximately the 7 o’clock direction) of Figure 3.

3.2. Street Tree Detection

3.2.1. Training Dataset

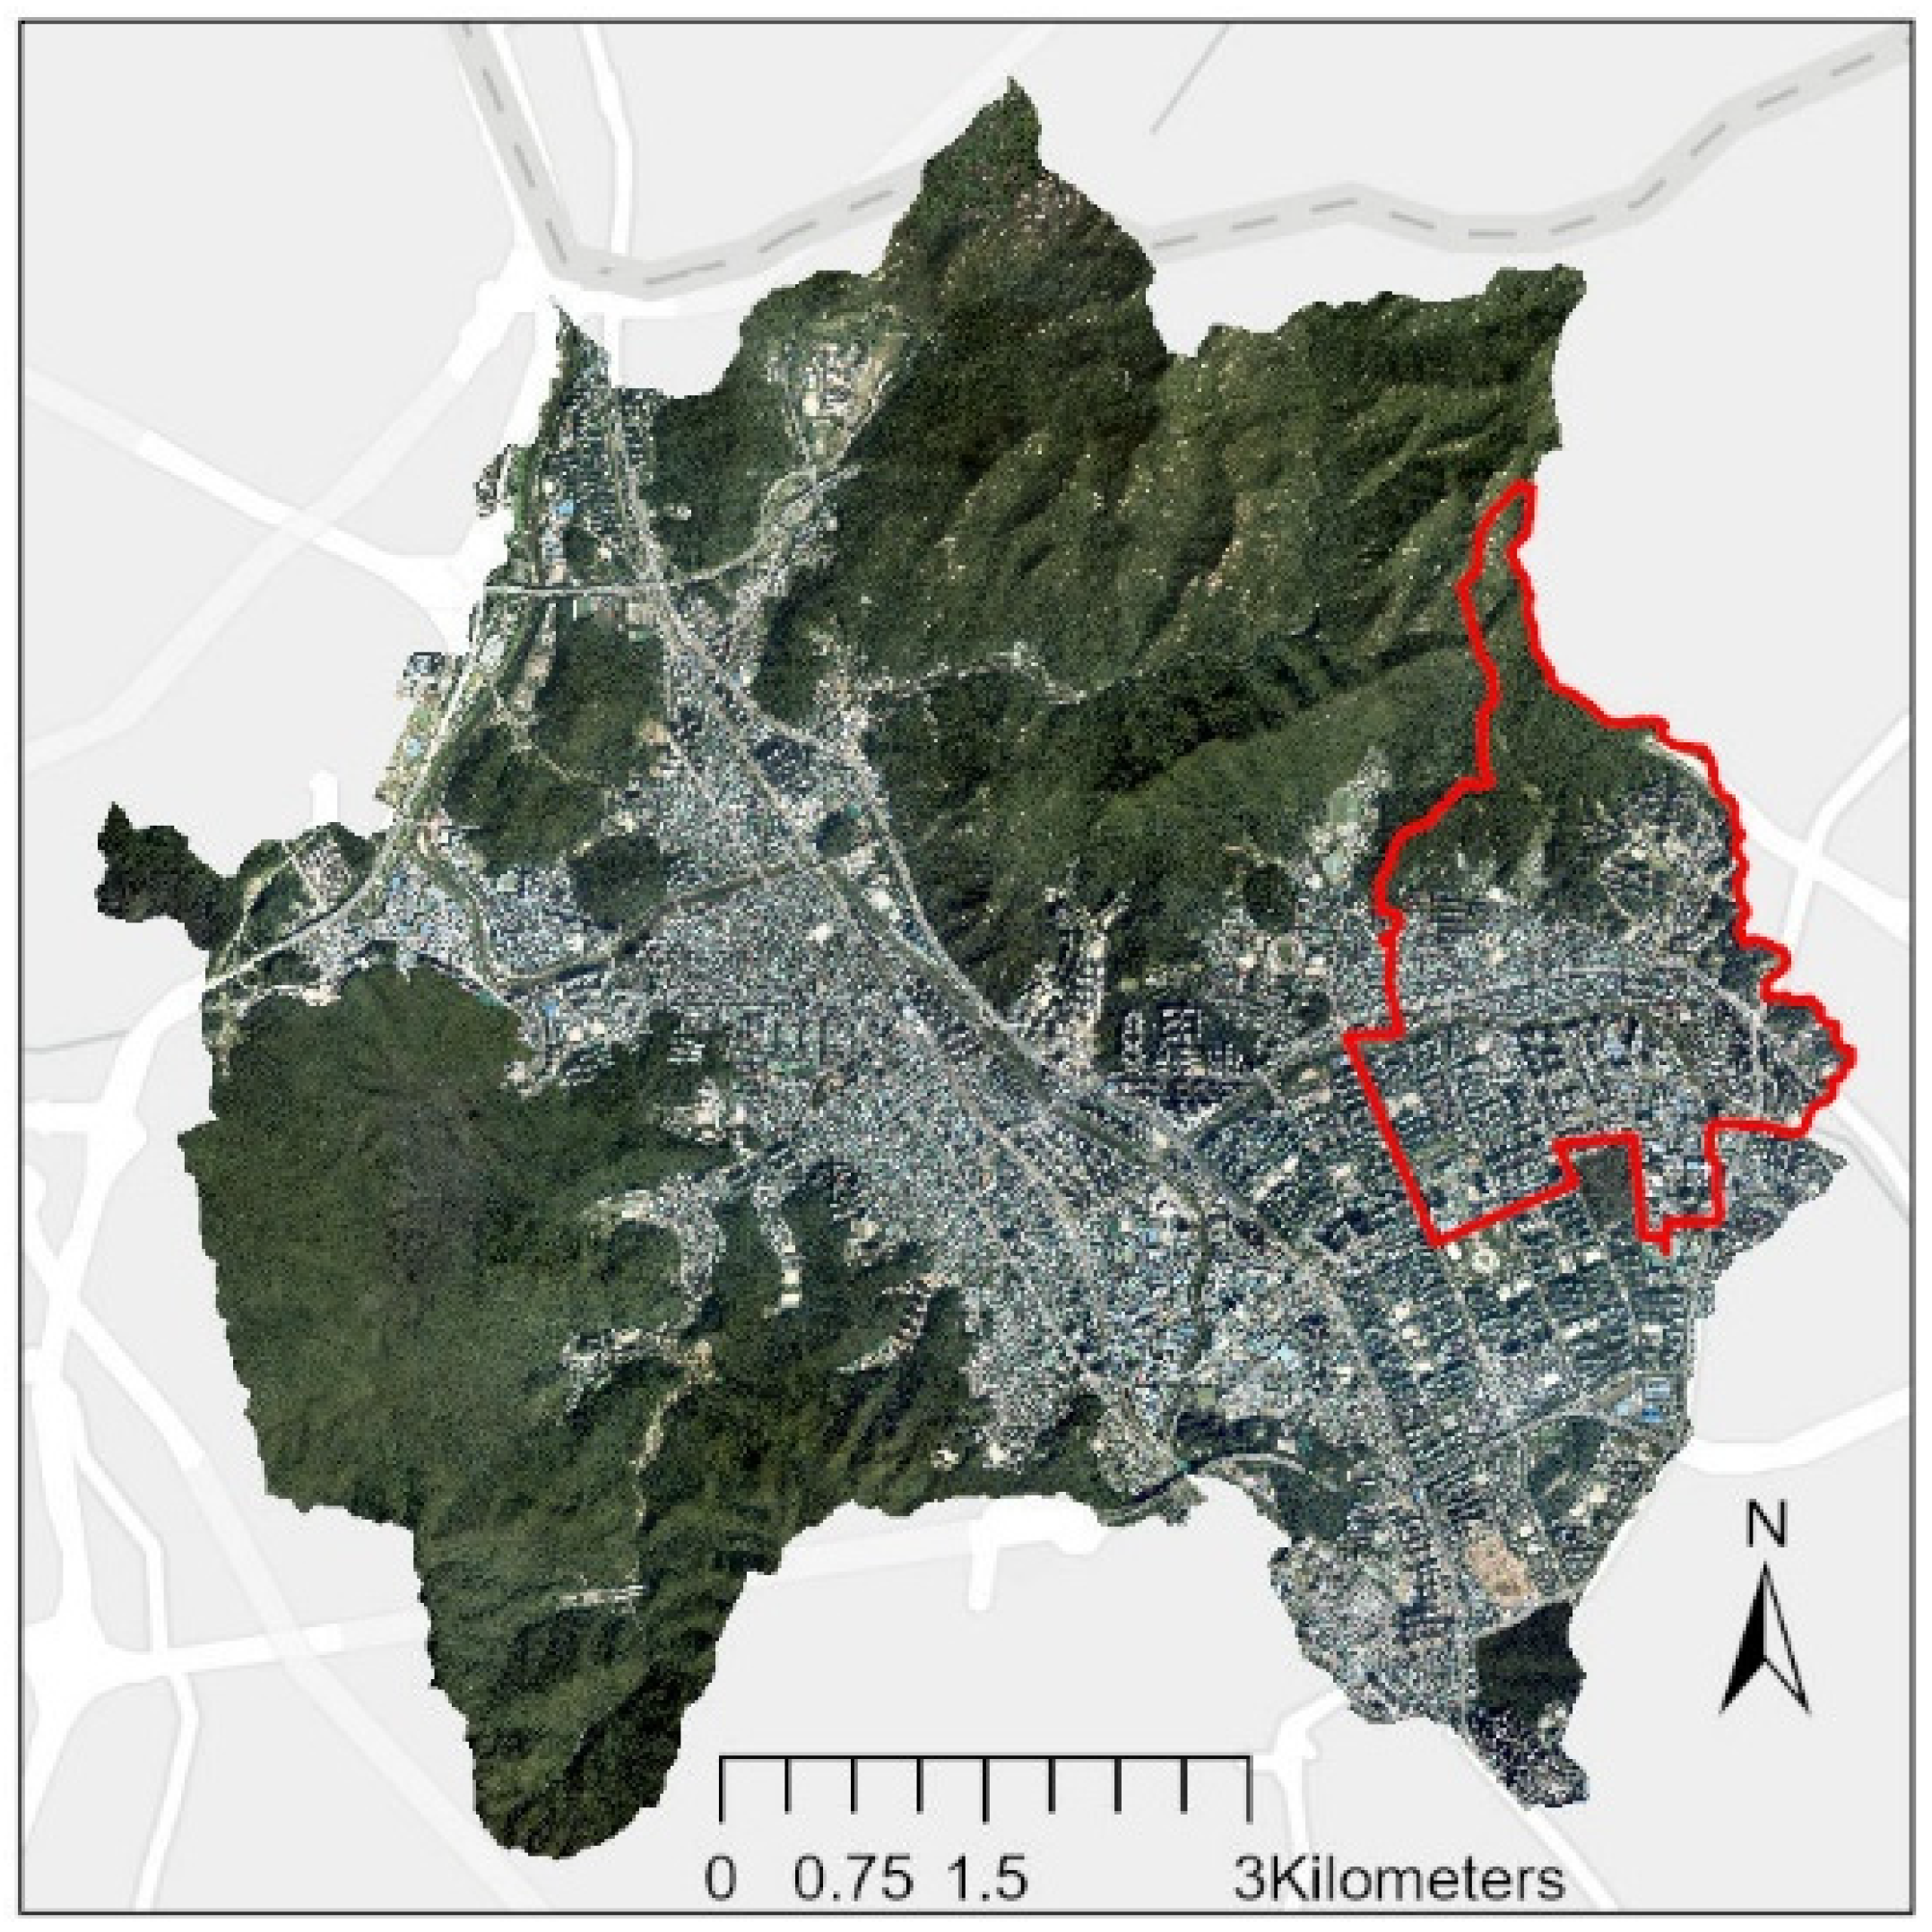
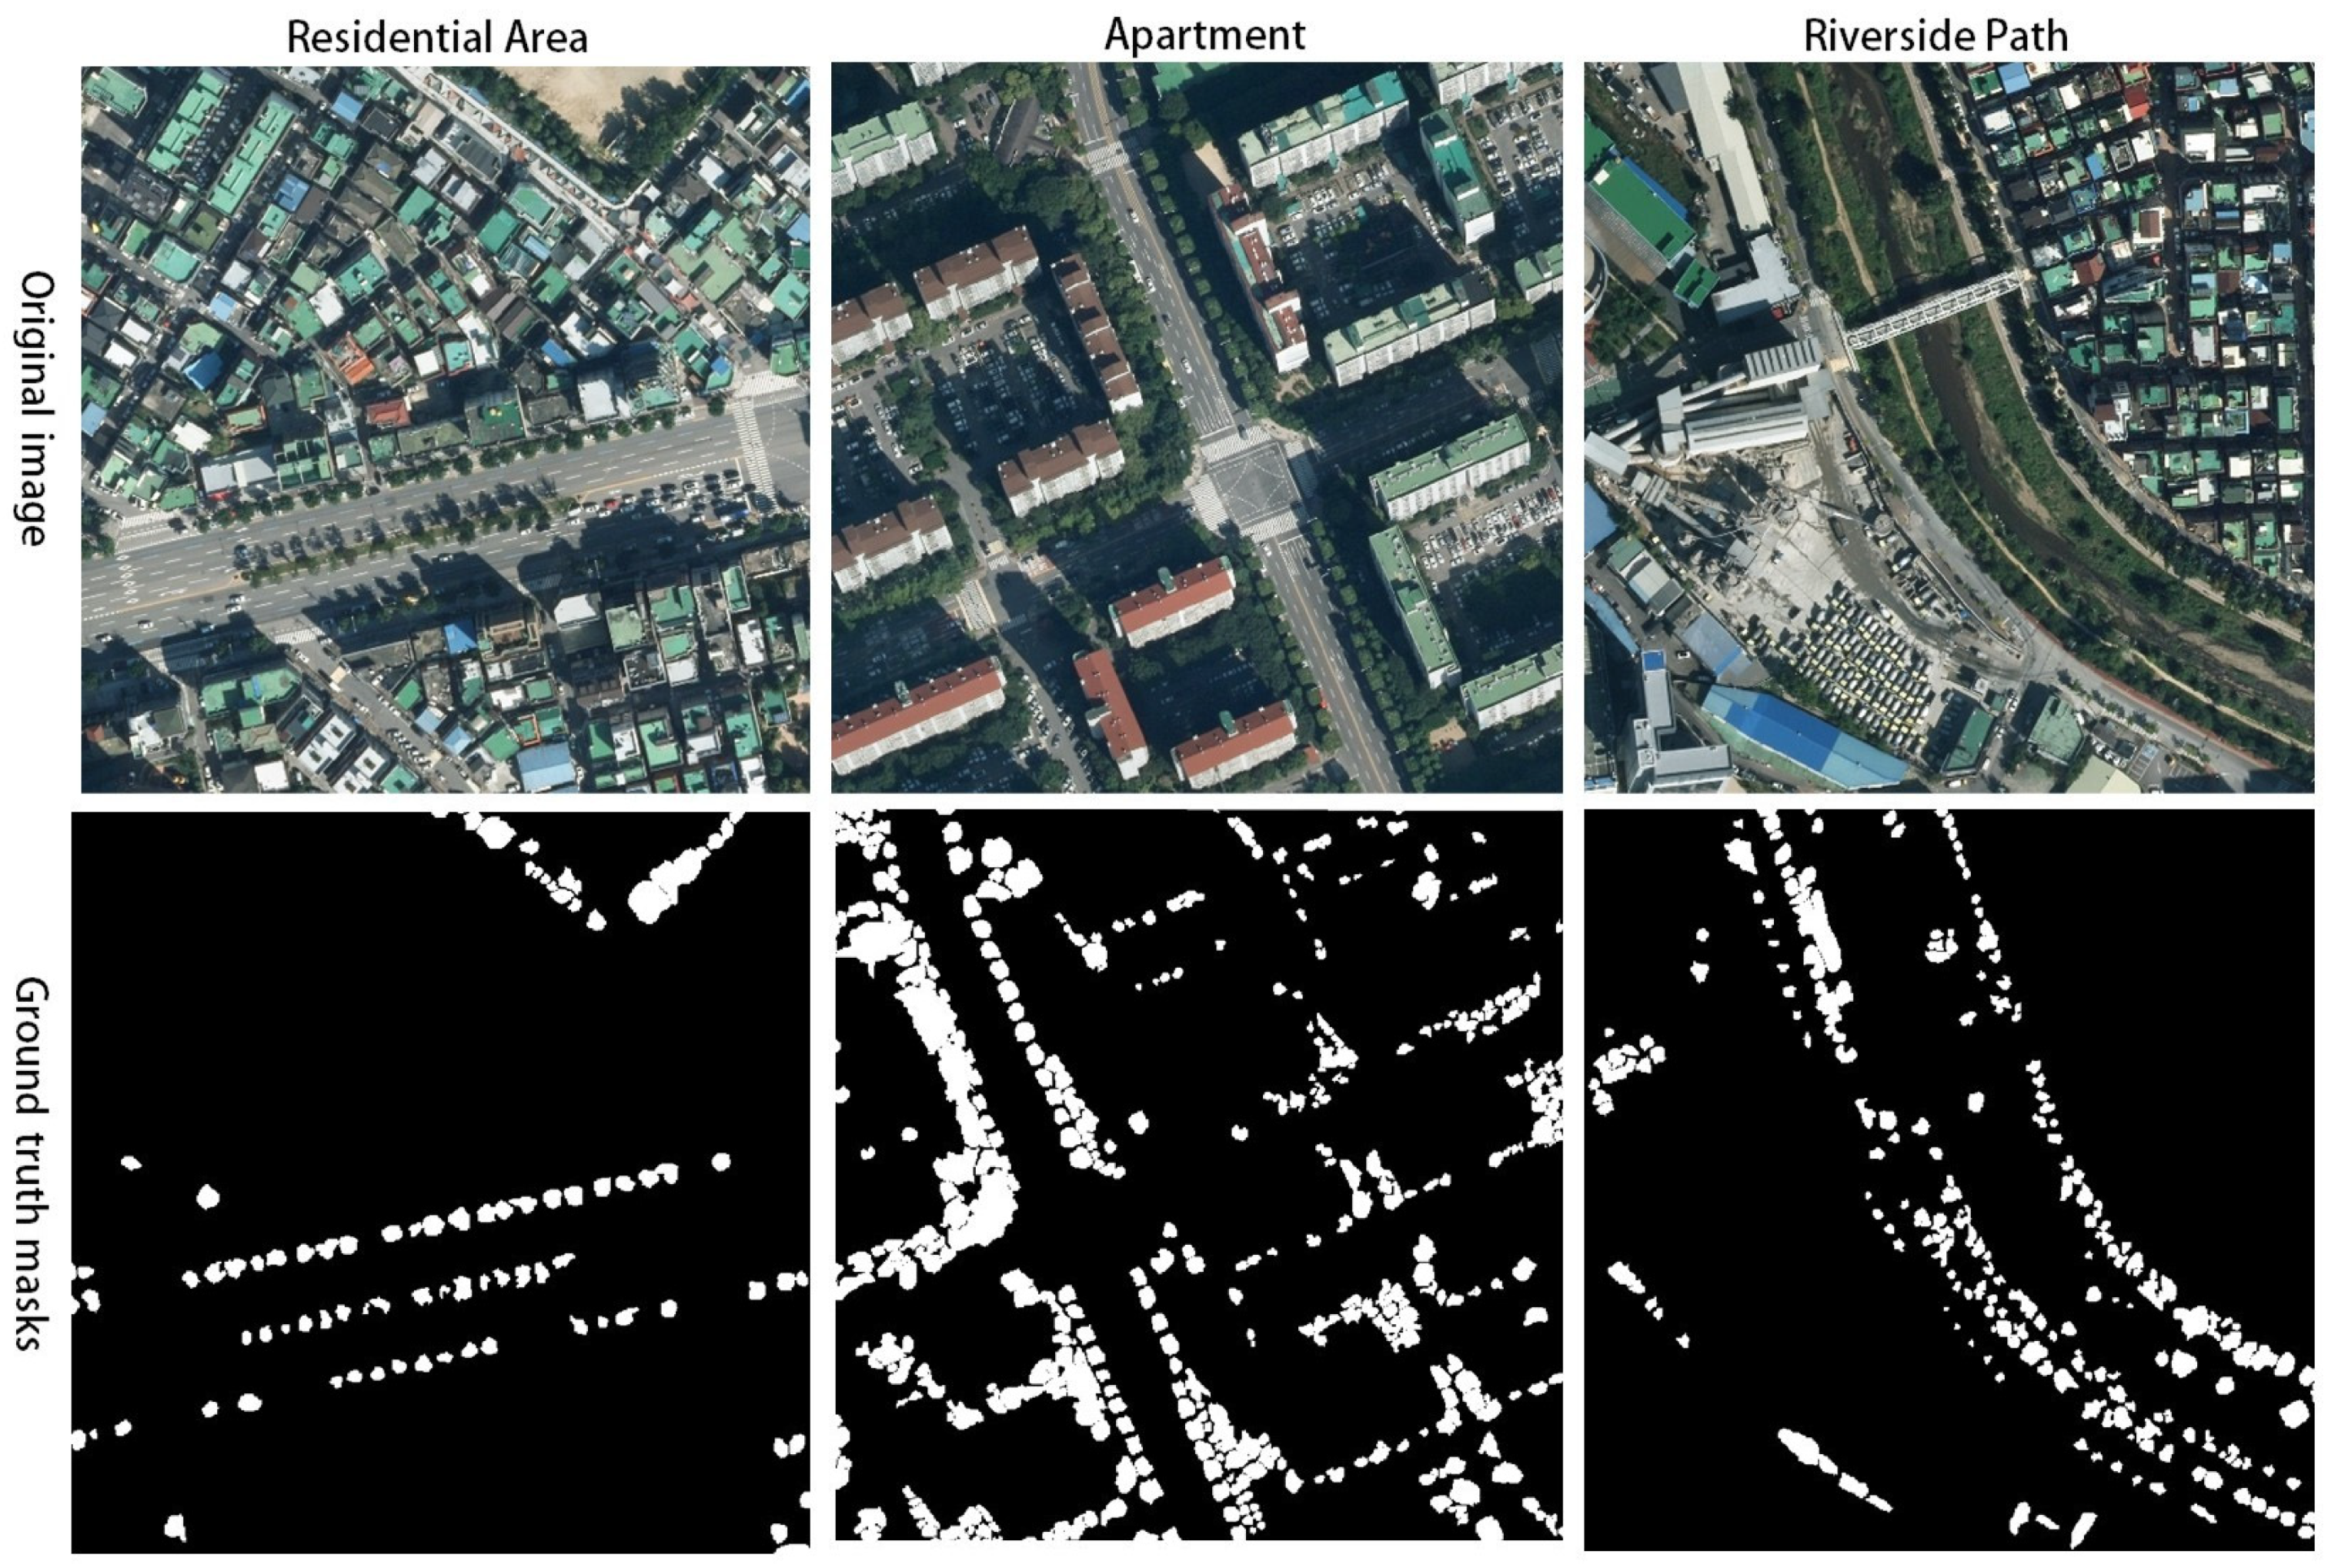
Because no publicly available training dataset adequately reflects the regional characteristics of the study area, and because the local government of Anyang does not provide detailed information on street tree locations or structures, a high-quality training dataset was manually constructed for this study. The dataset was developed for the Gwanyang-dong area and includes a wide range of urban landscapes, such as arterial roads, pedestrian walkways, apartment complexes, and low-rise multi-family residential areas (Figure 4). The primary focus in dataset construction was the accurate delineation of individual tree crowns. Accordingly, all annotations were performed at the crown level. In areas where trees were densely planted or where crown boundaries were ambiguous due to shadows or occlusions, individual tree boundaries were carefully identified by considering crown color, texture, and relative size. Trees whose entire crowns were heavily obscured by shadows cast by high-rise buildings were excluded from the training dataset, as visual interpretation reliability was deemed insufficient.
In total, 10,021 individual tree objects were annotated. By incorporating street trees planted across diverse urban environments—including apartment complexes, multi-family housing areas, major roads, and pedestrian corridors—the dataset was designed to enable the deep learning model to learn the spatial heterogeneity and structural variability of urban trees. For model input preparation, the orthorectified aerial imagery was partitioned into square tiles of 512 × 512 pixels. To mitigate potential detection errors along tile boundaries, a stride of 128 pixels (corresponding to a 75% overlap) was applied. This tiling strategy resulted in a total of 1215 paired training samples. Representative examples of the training data and corresponding ground-truth tree crown masks across different urban contexts are illustrated in Figure 5.

3.2.2. Model Training

In this study, five representative semantic segmentation architectures—U-Net, DeepLabV3, Mask2Former, FCN, and HRNet—were trained to detect individual street trees from high-resolution aerial imagery. All models were implemented within the ArcGIS Pro 3.4 deep learning environment, which is built upon the MMSegmentation framework.
To ensure a fair and reproducible comparison across architectures, all models were trained under identical hyperparameter settings. Specifically, the batch size was set to 4, the number of training epochs to 20, and padding to 128 pixels. A slice-based differential learning rate schedule was applied, in which lower learning rates were assigned to early backbone layers and higher rates to task-specific prediction heads. Table 1 summarizes the learning rate ranges used for each model. All experiments were conducted on a workstation equipped with an NVIDIA RTX 5070 GPU (8 GB memory) and 32 GB RAM.
An Adam optimizer with default momentum parameters (β1 = 0.9, β2 = 0.999) and a weight decay of 0.0005 was used for all models. A learning rate decay policy was applied such that training automatically terminated when loss stagnation or no further improvement was observed during later epochs. This early-stopping mechanism ensured both stable convergence and comparable training behavior across architectures.
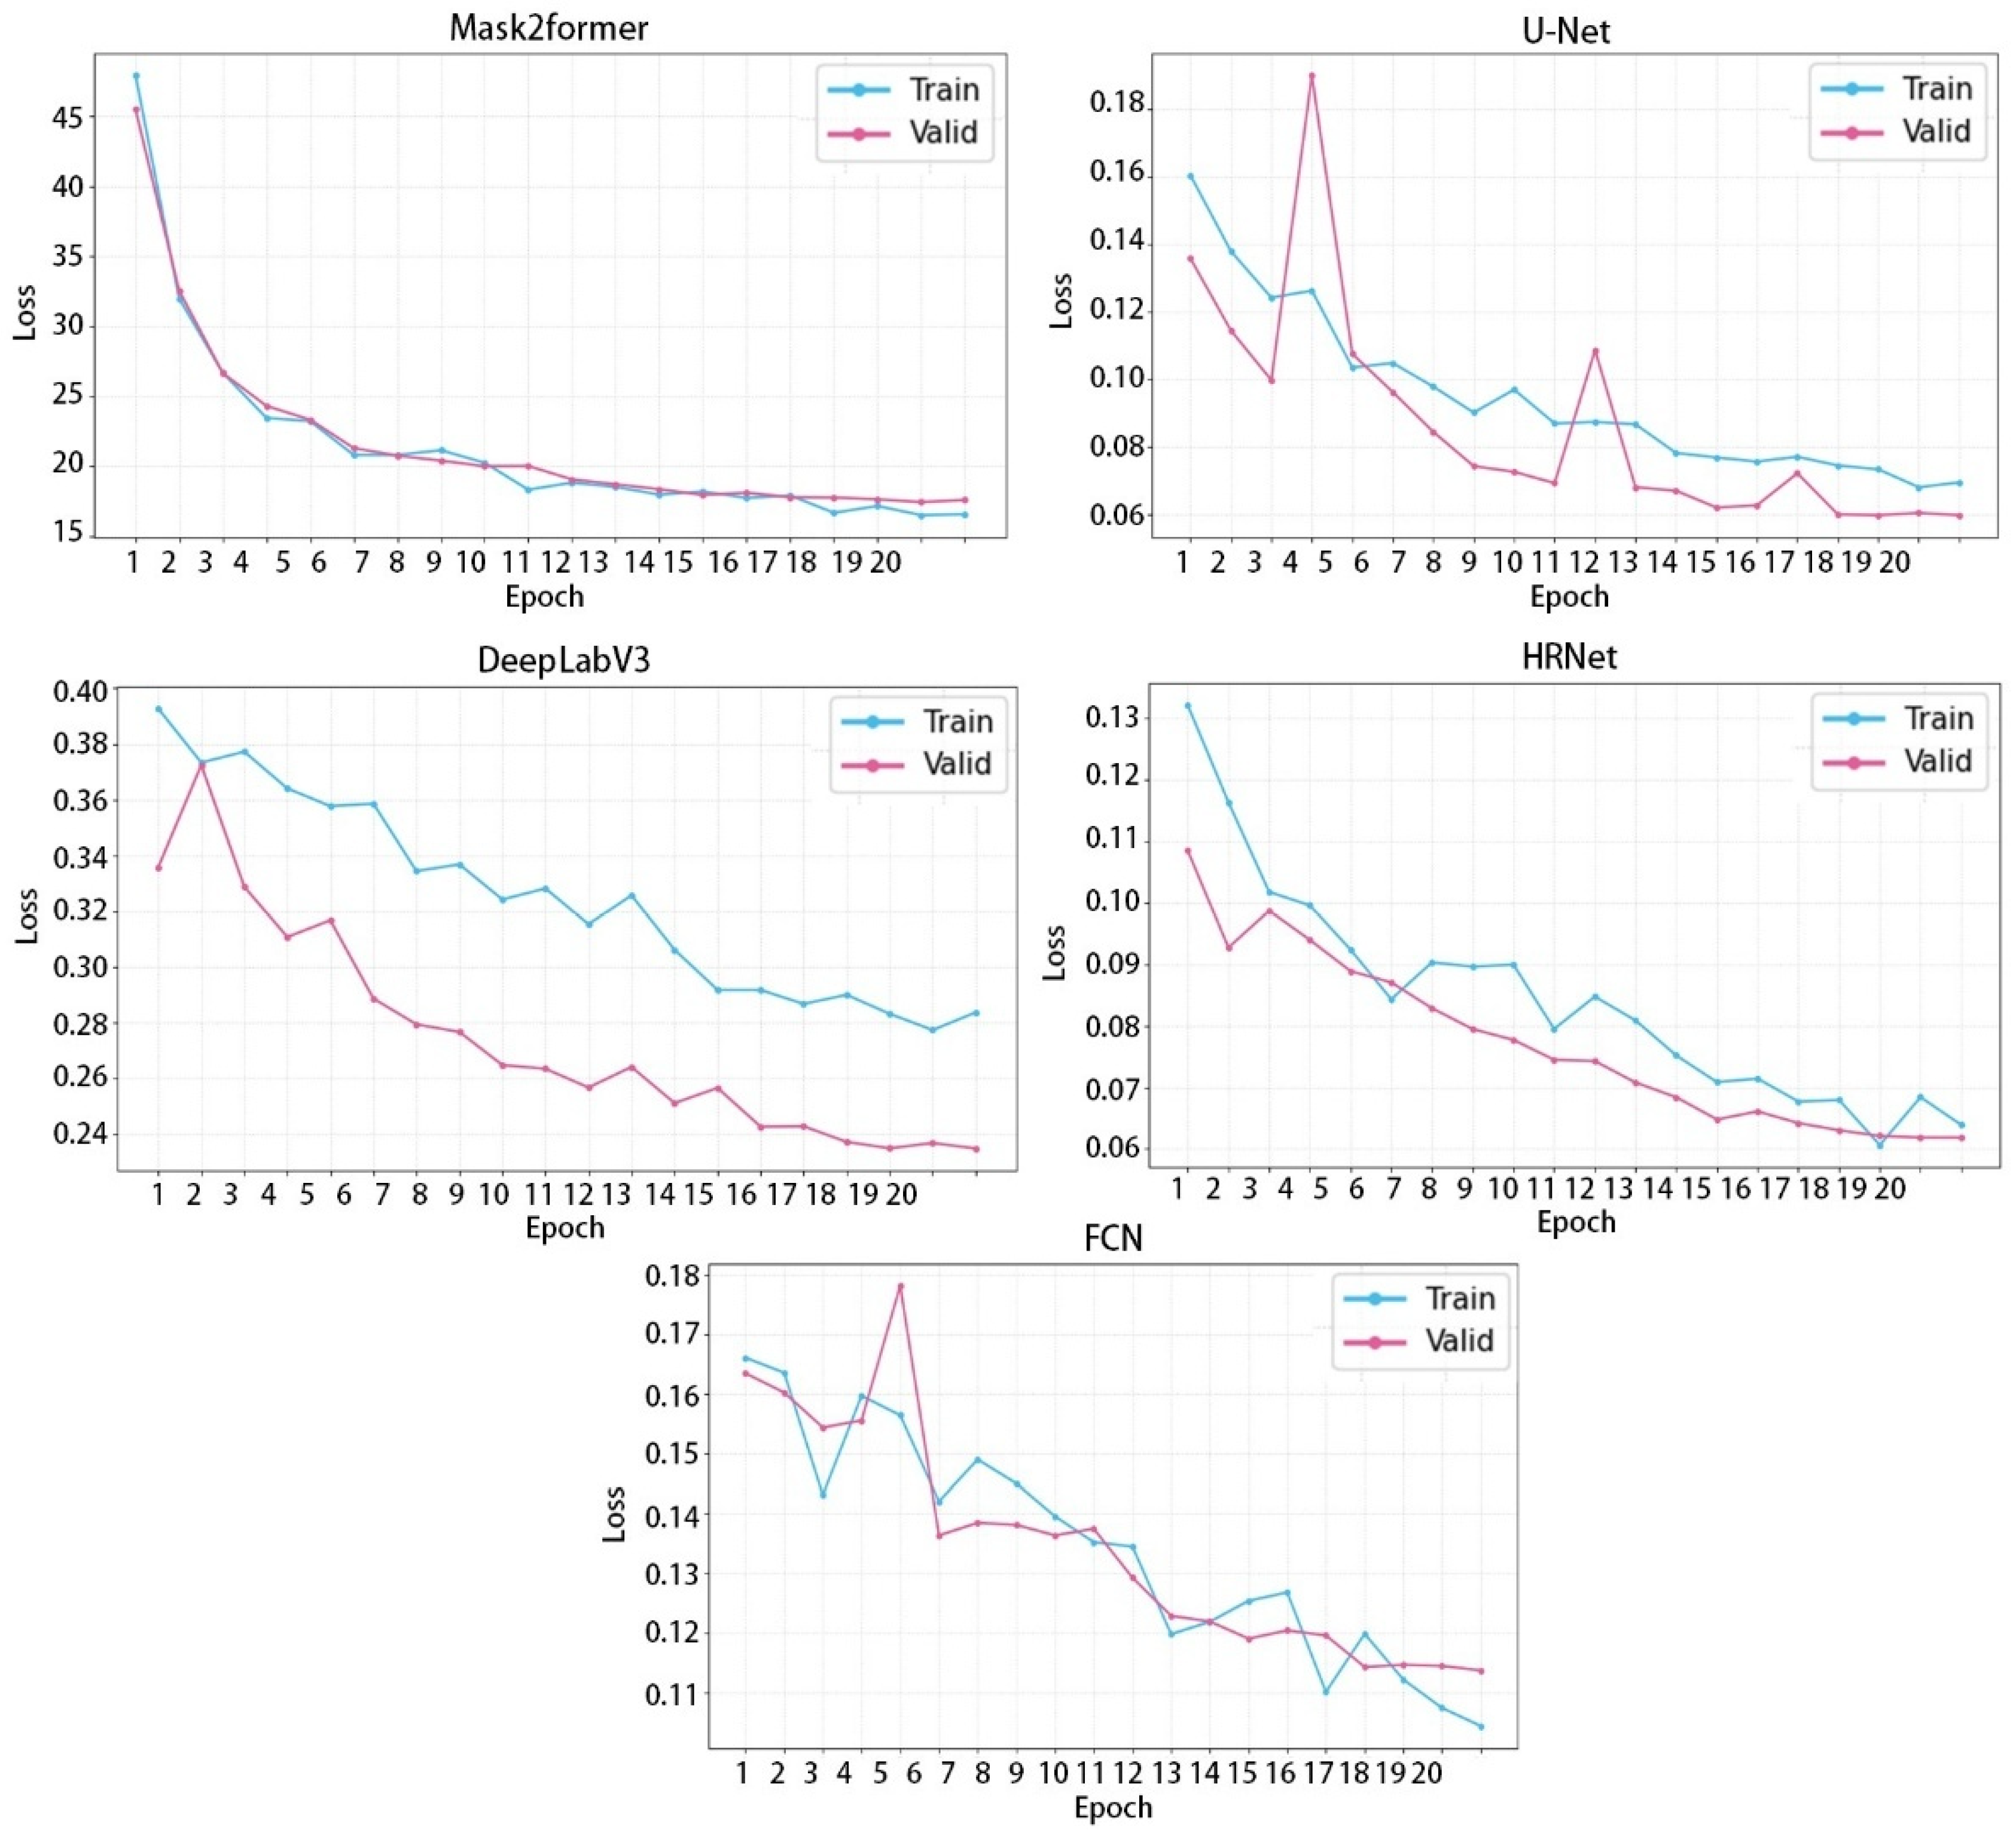
Because ArcGIS Pro’s MMSegmentation-based tools do not provide direct access to internal layer configurations or parameter counts for each architecture, this study focuses on model-level performance comparisons rather than on architectural decomposition. To improve architectural transparency despite these interface limitations, the standard MMSegmentation configurations used for each model are summarized in Table 2. This table outlines the backbone network, segmentation head architecture, and approximate total parameter count for all five models evaluated in this study. Although ArcGIS does not expose internal layer-level definitions, the models strictly follow the official MMSegmentation reference implementations, and the tabulated specifications help clarify the structural differences that contribute to the observed performance variations. For transparency, epoch-wise training and validation loss curves for all models, as well as learning rate progression plots, are included in Appendix A.
Model performance was evaluated using Precision, Recall, and F1 score, which are defined as follows. Precision represents the proportion of pixels predicted as street trees that are correctly classified as street trees and is calculated based on True Positives (TP) and False Positives (FP):
P r e c i s i o n = T P T P + F P
Here, TP denotes pixels that are correctly classified as street trees, while FP represents pixels that are incorrectly classified as street trees despite belonging to non-tree classes.
Recall measures the proportion of actual street tree pixels that are correctly identified by the model and is computed using TP and False Negatives (FN):
R e c a l l = T P T P + F N
In this context, FN refers to pixels that correspond to street trees but are not detected as such by the model.
Finally, the F1 score is defined as the harmonic mean of Precision and Recall, providing a balanced evaluation metric that accounts for both false positives and false negatives:
F 1   S c o r e = 2 × r e c i s i o n × R e c a l l P r e c i s i o n + R e c a l l
The F1 score is particularly useful in evaluation scenarios where a balance between Precision and Recall is critical, as the metric decreases when either component exhibits low performance.

3.3. Vegetation Index Selection and Calculation

To evaluate the vitality of urban street trees, this study selected NDVI, NDRE, and NDMI based on a comprehensive review of remote sensing-based vegetation assessment research. These indices are widely used in monitoring vegetation health and have demonstrated strong correspondence with field-observed physiological indicators reported in previous studies.
NDVI is the most commonly used index for estimating vegetation vigor and has been shown to effectively capture photosynthetic activity, overall tree health, and the presence of pests or diseases [18,20]. However, NDVI exhibits a well-known saturation problem in dense canopies or during peak growing seasons, which can reduce its sensitivity to subtle vitality variations.
Several alternative indices were reviewed as possible complements to NDVI. The Enhanced Vegetation Index (EVI) was designed to reduce NDVI saturation, but it depends on fixed coefficients (G = 2.5, C1 = 6.0, C2 = 7.5, L = 1.0) calibrated specifically for MODIS. As a result, EVI may show inconsistent behavior across sensors due to variations in atmospheric correction procedures and blue-band sensitivity [31]. The MSAVI2 index is effective in arid environments and early phenological stages, but its non-normalized formulation makes it more sensitive to radiometric calibration differences across sensors [38,39]. Given these limitations, both indices were considered less suitable for assessing street trees in dense, built-up urban environments.
In contrast, NDRE incorporates the red-edge band, allowing sensitive detection of chlorophyll concentration and vitality changes during mid-to-late growth stages [30,33]. Because NDRE is normalized, it is less influenced by cross-sensor radiometric variability. Numerous studies have shown that red-edge-based indices effectively detect pest-induced stress and estimate physiological vitality in trees [15,16,34]. Therefore, NDRE was selected as a complementary index to address NDVI saturation while retaining robustness across multispectral satellite platforms.
While NDVI and NDRE capture chlorophyll-related properties, they do not directly represent tree moisture conditions. In operational settings, arboricultural vitality assessments routinely evaluate water status alongside canopy greenness, underscoring the importance of moisture-sensitive indicators. For this reason, the Normalized Difference Moisture Index (NDMI) was included to quantify water stress. NDMI is widely used for assessing vegetation moisture dynamics, and previous studies such as Varouchakis et al. [40] emphasize that combining NDVI and NDMI enables a more comprehensive evaluation of vegetation physiological conditions and soil–plant water interactions.
Taken together, NDVI, NDRE, and NDMI were selected as a complementary set because they collectively capture three essential dimensions of tree vitality—photosynthetic vigor, chlorophyll content, and moisture status—while avoiding the sensor-specific or context-dependent limitations associated with alternative indices. This multi-index approach provides a more balanced and robust proxy for assessing urban street tree vitality in diverse environmental conditions.

3.3.1. NDVI Calculation Using CAS500-1 Imagery

In this study, NDVI was calculated using imagery acquired from the CAS500-1 satellite. NDVI is the most widely used vegetation index in remote sensing for estimating vegetation vitality and is derived from the contrast in reflectance between the red and NIR spectral bands. Vegetation with active photosynthesis strongly absorbs red light while reflecting a large proportion of NIR radiation, allowing NDVI to serve as an indirect indicator of plant growth conditions and physiological status [41].
NDVI values range from −1 to 1, with higher values generally indicating healthier and more vigorous vegetation [42]. Specifically, NDVI values of 0.2 or lower are typically associated with vegetation exhibiting little to no photosynthetic activity and poor health conditions [43]. Values between 0.2 and 0.4 indicate low levels of photosynthetic activity, whereas values exceeding 0.4 are commonly interpreted as representing healthy vegetation. In a related study, Aryal et al. [44] employed an NDVI threshold of 0.6 to distinguish healthy trees from stressed trees, achieving a classification accuracy of 85%.
These empirical thresholds provide a useful reference for interpreting NDVI-derived vitality levels in urban street trees and support the application of NDVI as a core component of the vitality assessment framework in this study.
N D V I = N I R R e d N I R + R e d

3.3.2. NDRE and NDMI Calculation Using Sentinel-2 Imagery

NDRE and NDMI were calculated using multispectral imagery acquired from Sentinel-2. NDRE is computed using the NIR and red-edge bands and is particularly effective for detecting variations in chlorophyll content and vegetation vitality during late growth stages [45,46]. NDRE values in the range of 0.25–0.64 generally indicate healthy vegetation with active photosynthetic processes, whereas values below 0.2 are commonly associated with vegetation under physiological stress [47].
N D R E = N I R R e d   E d g e N I R + R e d   E d g e
NDMI, which is designed to capture vegetation water content, is calculated using the NIR and SWIR bands [48]. NDMI values range from −1 to 1, with values closer to the positive end indicating vegetation with higher moisture content, while values at or below zero represent moisture-deficient or non-vegetated surfaces. Specifically, NDMI values between 0 and 0.2 correspond to high levels of water stress, values between 0.2 and 0.4 indicate relatively low water stress, and values greater than 0.4 represent vegetation experiencing little to no water stress [49,50,51]. By jointly incorporating NDRE and NDMI derived from Sentinel-2 imagery, this study captures both chlorophyll-related vitality and moisture-related stress, enabling a more comprehensive assessment of urban street tree vitality.
N D M I = N I R S W I R N I R + S W I R

3.4. Vegetation Index Aggregation at the Individual Tree Level

In this study, vegetation indices were spatially associated with individual street tree crowns by explicitly accounting for the degree of spatial overlap between crown objects and raster pixels. For the CAS500-1 imagery, the relatively high spatial resolution (2 m) results in multiple pixels being contained within a single tree crown. In contrast, Sentinel-2 imagery has a coarser spatial resolution (10 m), which often causes tree crowns to intersect pixel boundaries.
To address these differing overlap characteristics, an area-weighted averaging approach was adopted, in which the proportion of overlap between each pixel and a given tree crown was used as a weighting factor. Specifically, a pixel that completely overlaps a tree crown is assigned a weight of 1.0, whereas a pixel with a 71% overlap contributes a weight of 0.71 to the crown-level vegetation index calculation (Equation (10)). The area-weighted mean vegetation index for crown object k is defined as:
V k ¯ = j = 1 n k v i × a k j j = 1 n k a k j
where V k ¯ denotes the area-weighted mean vegetation index of crown object k, v i represents the vegetation index value of pixel j, a k j is the overlapping area between pixel j and crown object k, and n k is the total number of pixels overlapping with crown object k. By incorporating pixel-level overlap proportions, this approach enables a more accurate aggregation of vegetation indices at the individual tree level, particularly when integrating multisource imagery with differing spatial resolutions.

3.5. Vitality Index Calculation

To quantitatively assess street tree vitality, NDVI, NDRE, and NDMI values were converted into a five-level scoring scheme based on the interpretation thresholds reported in previous studies (see Section 3.3.1 and Section 3.3.2). In general, vegetation index values exceeding 0.4 are commonly interpreted as indicating healthy vegetation, and several studies have reported that using a threshold of 0.6 enables high-accuracy classification of healthy trees. Based on these findings, tree crowns with NDVI values greater than 0.5 were assigned relatively high scores (≥4 points) in this study (Table 3).
For NDRE, prior studies have suggested that values within the range of 0.25–0.64 represent healthy vegetation conditions. Accordingly, NDRE values of 0.25 or higher were assigned higher scores, while values below 0.25 were assigned lower scores. In the case of NDMI, score intervals were defined at approximately 0.1 increments based on the maximum NDMI value observed in the study area (0.42), allowing relative differentiation of vegetation water status between individual trees.
To construct a composite vitality index, weights were assigned to each vegetation index by considering both their physiological relevance and the spatial resolution of the source imagery. NDVI, which is widely regarded as a representative indicator of vegetation vitality and was derived from relatively high-resolution imagery, was assigned a weight of 0.5. NDRE and NDMI, which serve complementary roles and were derived from comparatively lower-resolution imagery, were each assigned a weight of 0.25.
Finally, the vitality index was defined as the weighted sum of the three index scores, as expressed in Equation (11). Based on the resulting index values, individual street trees were classified into five vitality grades (Table 4), enabling an intuitive and scalable representation of street tree health conditions at the urban scale.
V i t a l i t y   I n d e x = 0.5 × N D V I _ S c o r e + 0.25 × N D R E _ S c o r e + 0.25 × N D M I _ S c o r e
In this study, “vitality” is operationalized as a remote sensing-derived proxy indicator constructed from canopy-level spectral responses (NDVI, NDRE, and NDMI) aggregated to the individual-tree level. This index is intended for large-area screening and relative prioritization of street trees under potentially unfavorable conditions, rather than as a direct measurement of physiological status or an exact substitute for field-based tree condition assessments (e.g., VTA classes or arborist diagnoses).

4. Results

4.1. Street Tree Detection Results: Quantitative and Qualitative Evaluation

The performance of each deep learning model trained on the constructed dataset is summarized in Table 5. Overall, Mask2Former achieved the highest performance across all evaluation metrics, including Precision, Recall, and F1 score. Approximately 80% of the trees detected by Mask2Former corresponded to actual street trees, and about 79% of all street trees were correctly identified, resulting in an F1 score of 79.7%. U-Net exhibited relatively stable performance, ranking second overall. HRNet achieved high Precision but comparatively lower Recall, indicating a tendency to detect only trees with high confidence while missing a portion of actual street trees. In contrast, FCN recorded the lowest Recall and F1 score among all models.
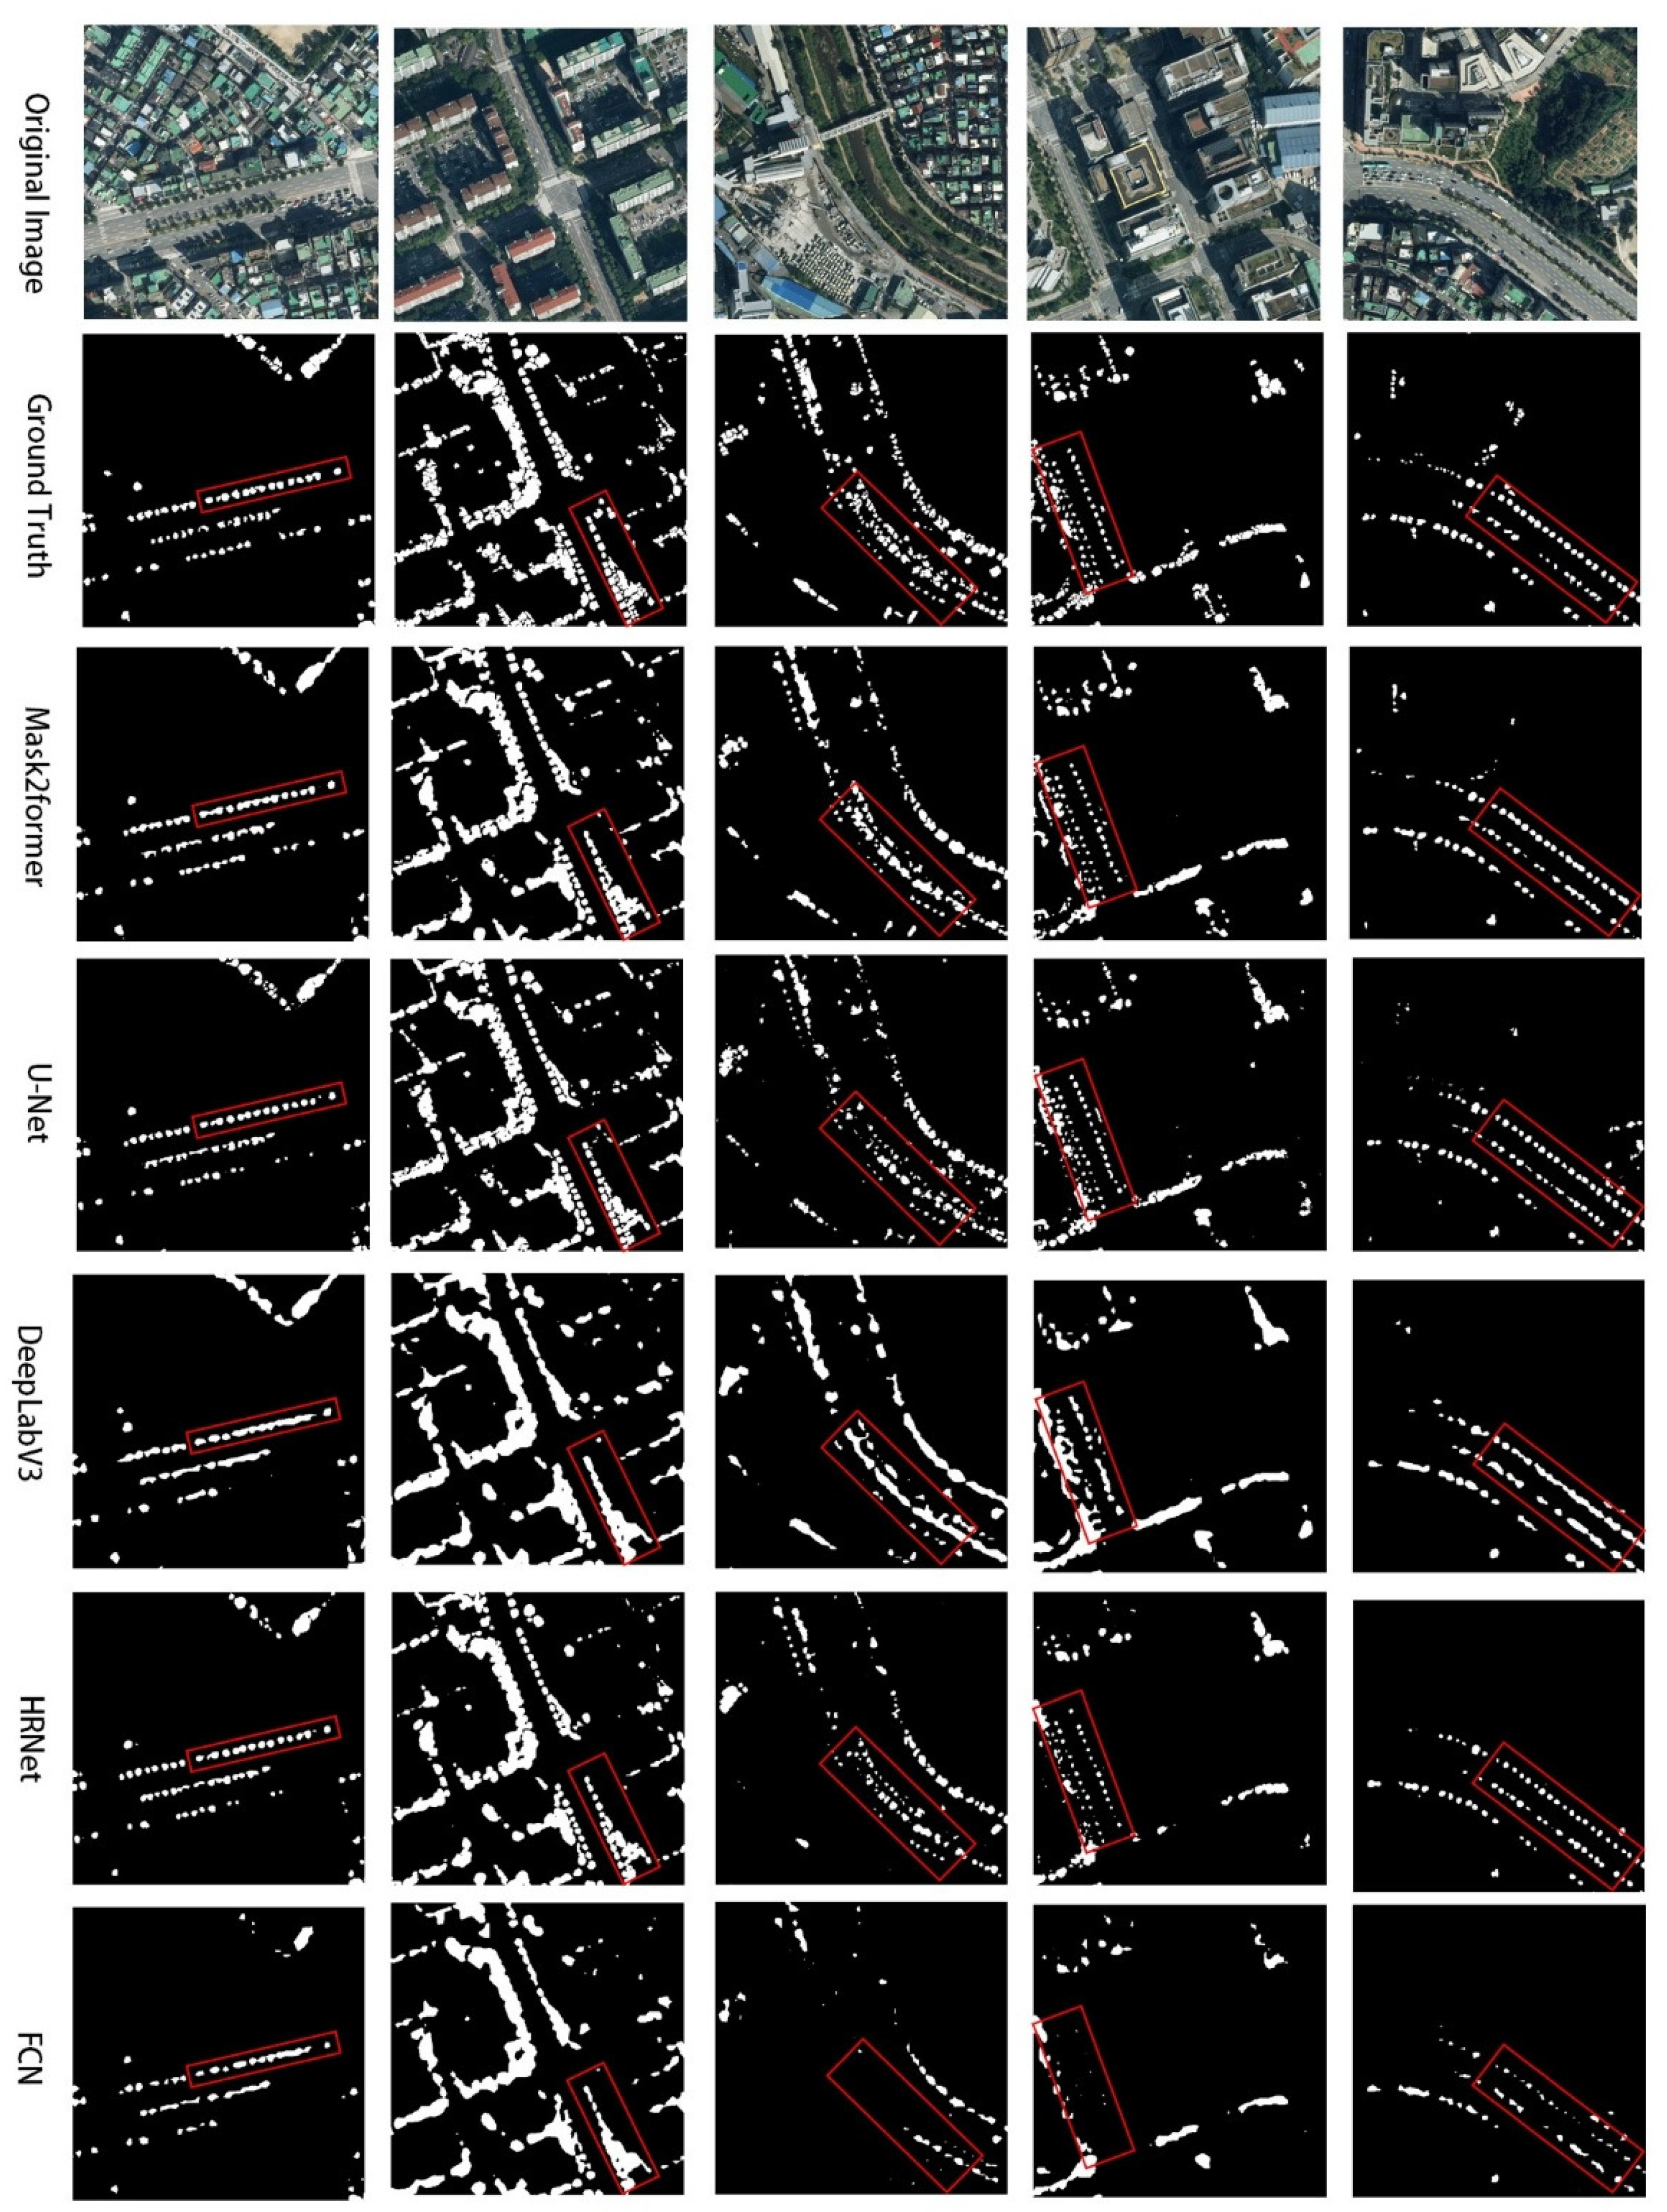
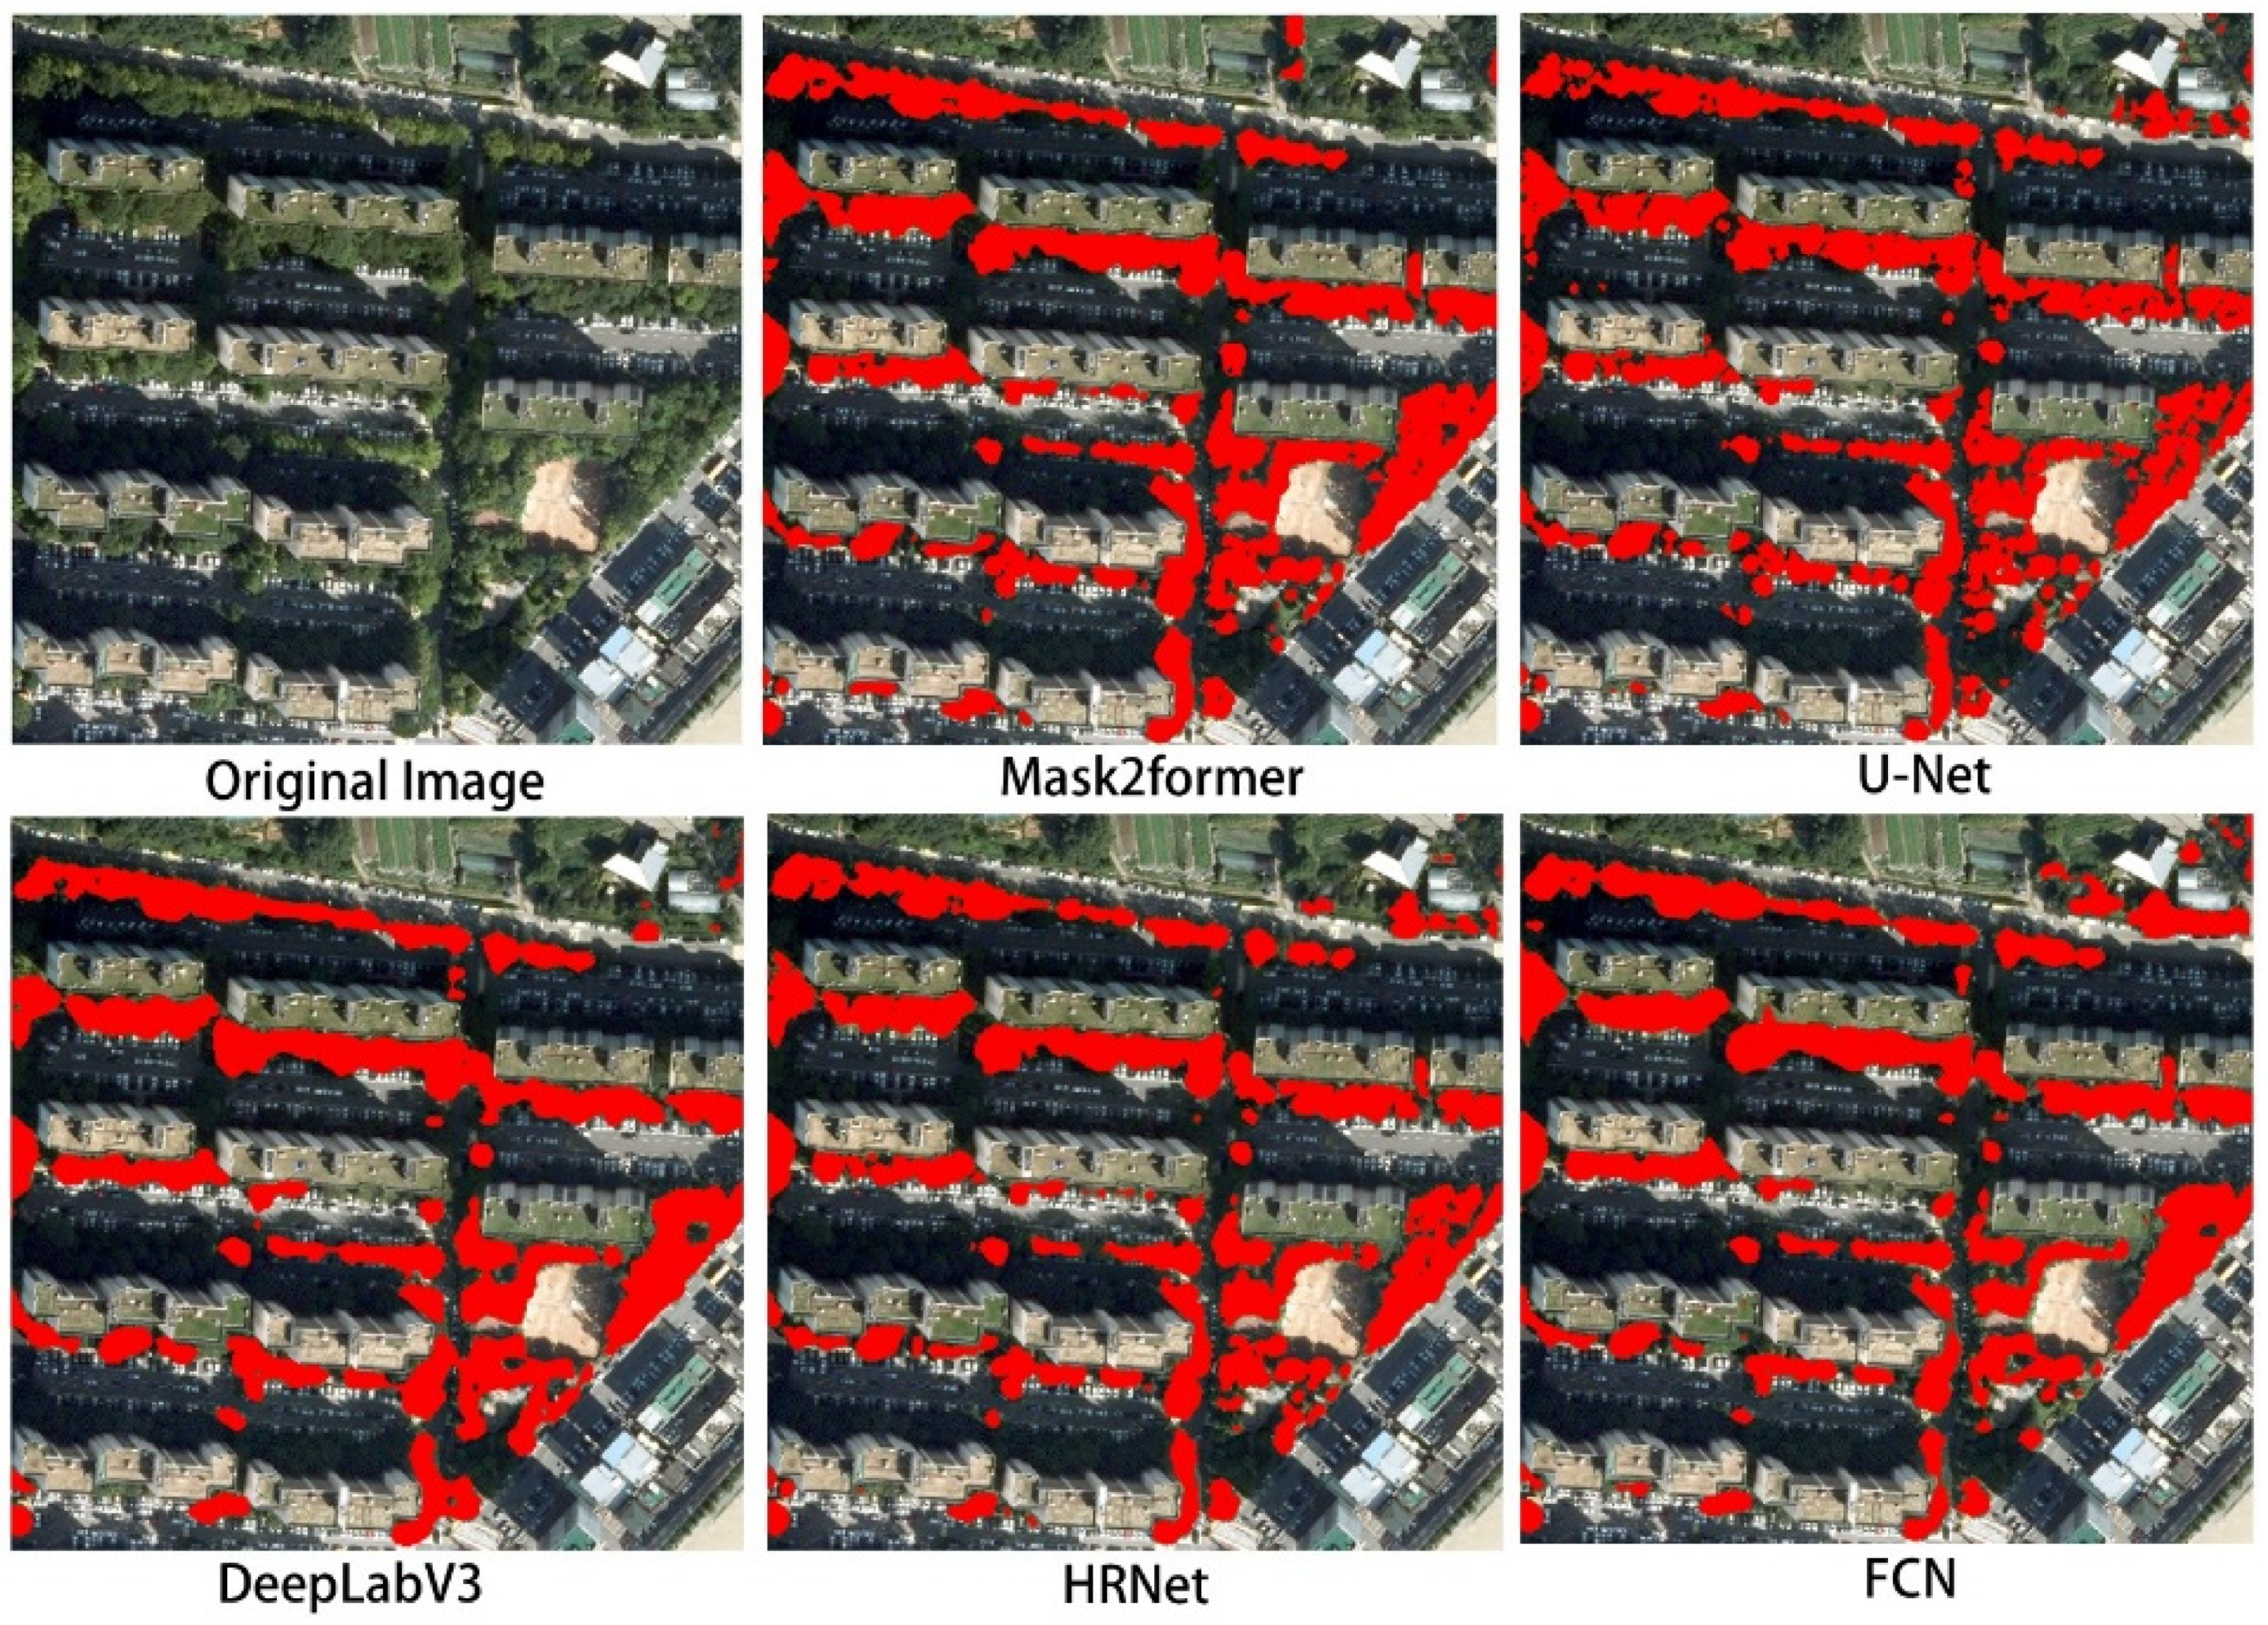
However, these numerical performance metrics were not fully preserved when the trained models were applied to the entire urban extent of Anyang. Although Mask2Former achieved the highest quantitative scores, its detection outputs often exhibited blurred or merged crown boundaries, making it difficult to distinguish individual trees. As shown in Figure 6, adjacent crowns were frequently detected as a single connected object. In contrast, U-Net demonstrated a clear advantage in accurately delineating individual tree crowns and preserving boundary sharpness. To more rigorously quantify boundary-level detection performance, a Boundary Recall metric was computed. Boundary Recall evaluates how accurately a model reproduces ground-truth crown boundaries and was calculated using a ±2-pixel tolerance to account for small spatial misalignments. Both predicted and ground truth boundaries were dilated by two pixels, and the proportion of overlapping boundary pixels was used to compute the metric (Equation (12)). Table 6 summarizes the Boundary Recall values for all models.
B o u n d a r y   R e c a l l = P r e d i c t e d   B o u n d a r y     D i l a t e d   G r o u n d   T r u t h   B o u n d a r y G r o u n d   T r u t h   B o u n d a r y
U-Net achieved the highest Boundary Recall (0.688), indicating the most accurate reproduction of fine-scale crown boundaries and the fewest missed edges. DeepLabV3, FCN, and HRNet exhibited substantially lower Boundary Recall values (<0.51), consistent with their tendency to merge neighboring crowns or lose thin boundary structures. Mask2Former, despite strong overall Precision and F1, also showed reduced Boundary Recall (0.634), reflecting boundary ambiguity observed in qualitative inspection. Because the primary objective of this study is to assess vegetation condition and vitality at the individual-tree level, accurate separation between adjacent crowns is critical. Given its superior boundary reproduction and clearer crown delineation, U-Net was selected as the final model for vegetation index matching and vitality assessment.
To further refine the set of street tree objects detected by U-Net, polygon-based road network data were incorporated to filter out non-street trees. Because street trees are typically planted within or immediately adjacent to road corridors, a 2 m buffer was generated along road boundaries, and only tree crown objects intersecting this buffer were retained as valid street trees. In contrast, trees located outside the buffered road areas were excluded from the final street tree dataset. Highways and tunnels, which are not designated street tree planting areas, were explicitly excluded from this filtering process. This spatial-rule-based post-processing step ensured that the final set of detected trees corresponded more closely to the operational definition of street trees used in urban management practices.

4.2. Vegetation Index Matching Results

4.2.1. NDVI Matching Results

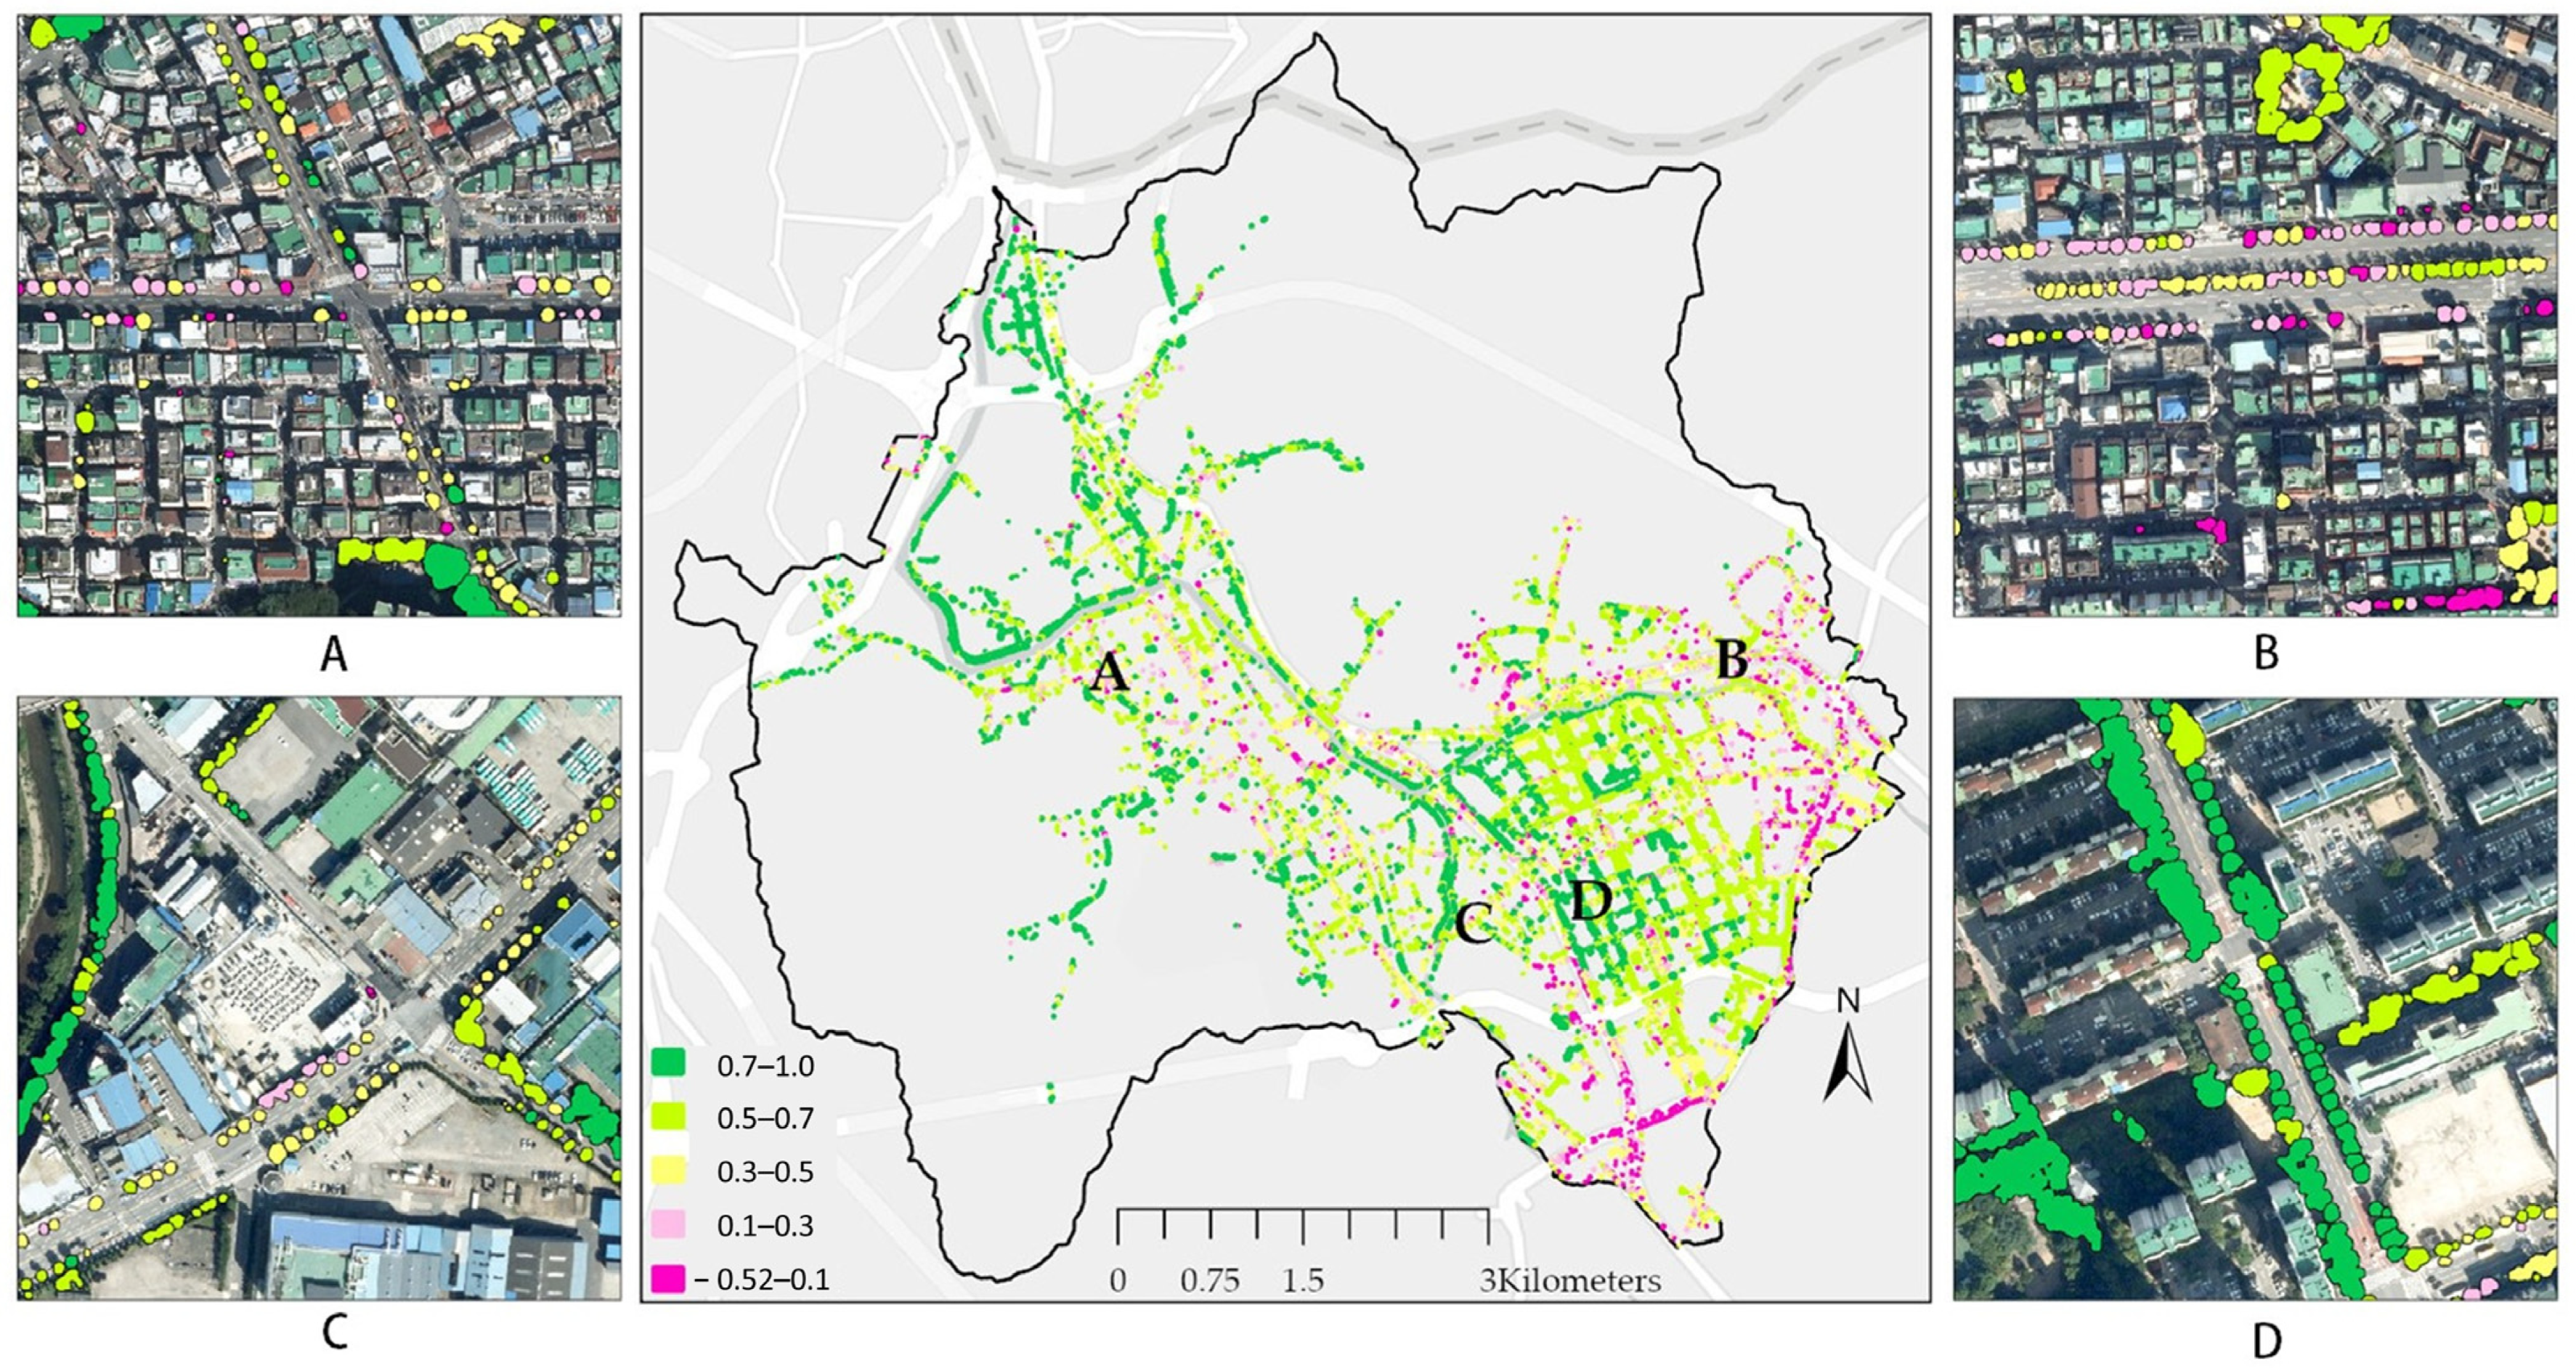
Figure 7 presents the results of street tree detection and the subsequent matching of NDVI values at the individual tree level across the study area. Areas displayed in pink or light pink were more frequently associated with commercial and industrial zones, dense multi-family residential areas (A), and locations adjacent to major road corridors (B). In these areas, NDVI values tended to fall below 0.3, suggesting relatively low photosynthetic activity. In particular, street trees planted along wide arterial roads with six or more lanes (B) often recorded NDVI values below 0.3, indicating that these locations may warrant closer monitoring. In dense multi-family residential areas, overall street tree density was generally low due to compact building arrangements. However, where small neighborhood parks were present (B), street trees within these green spaces more frequently exhibited NDVI values exceeding 0.5, consistent with healthier vegetation conditions. In contrast, areas shown in green correspond largely to landscaped trees within apartment complexes (B) and pedestrian corridors developed along rivers or streams (C). In these locations, NDVI values were generally above 0.5, reflecting relatively active photosynthetic processes. Notably, even under comparable road conditions, street trees located near parks or larger residential green spaces tended to maintain NDVI values above 0.3, indicating comparatively better vitality than trees situated in more heavily built-up surroundings. Overall, these spatial patterns suggest that the surrounding land-use context and the availability of nearby green infrastructure may play an important role in shaping the NDVI-based vitality characteristics of urban street trees, although further statistical validation would be required to confirm these differences.

4.2.2. NDRE Matching Results

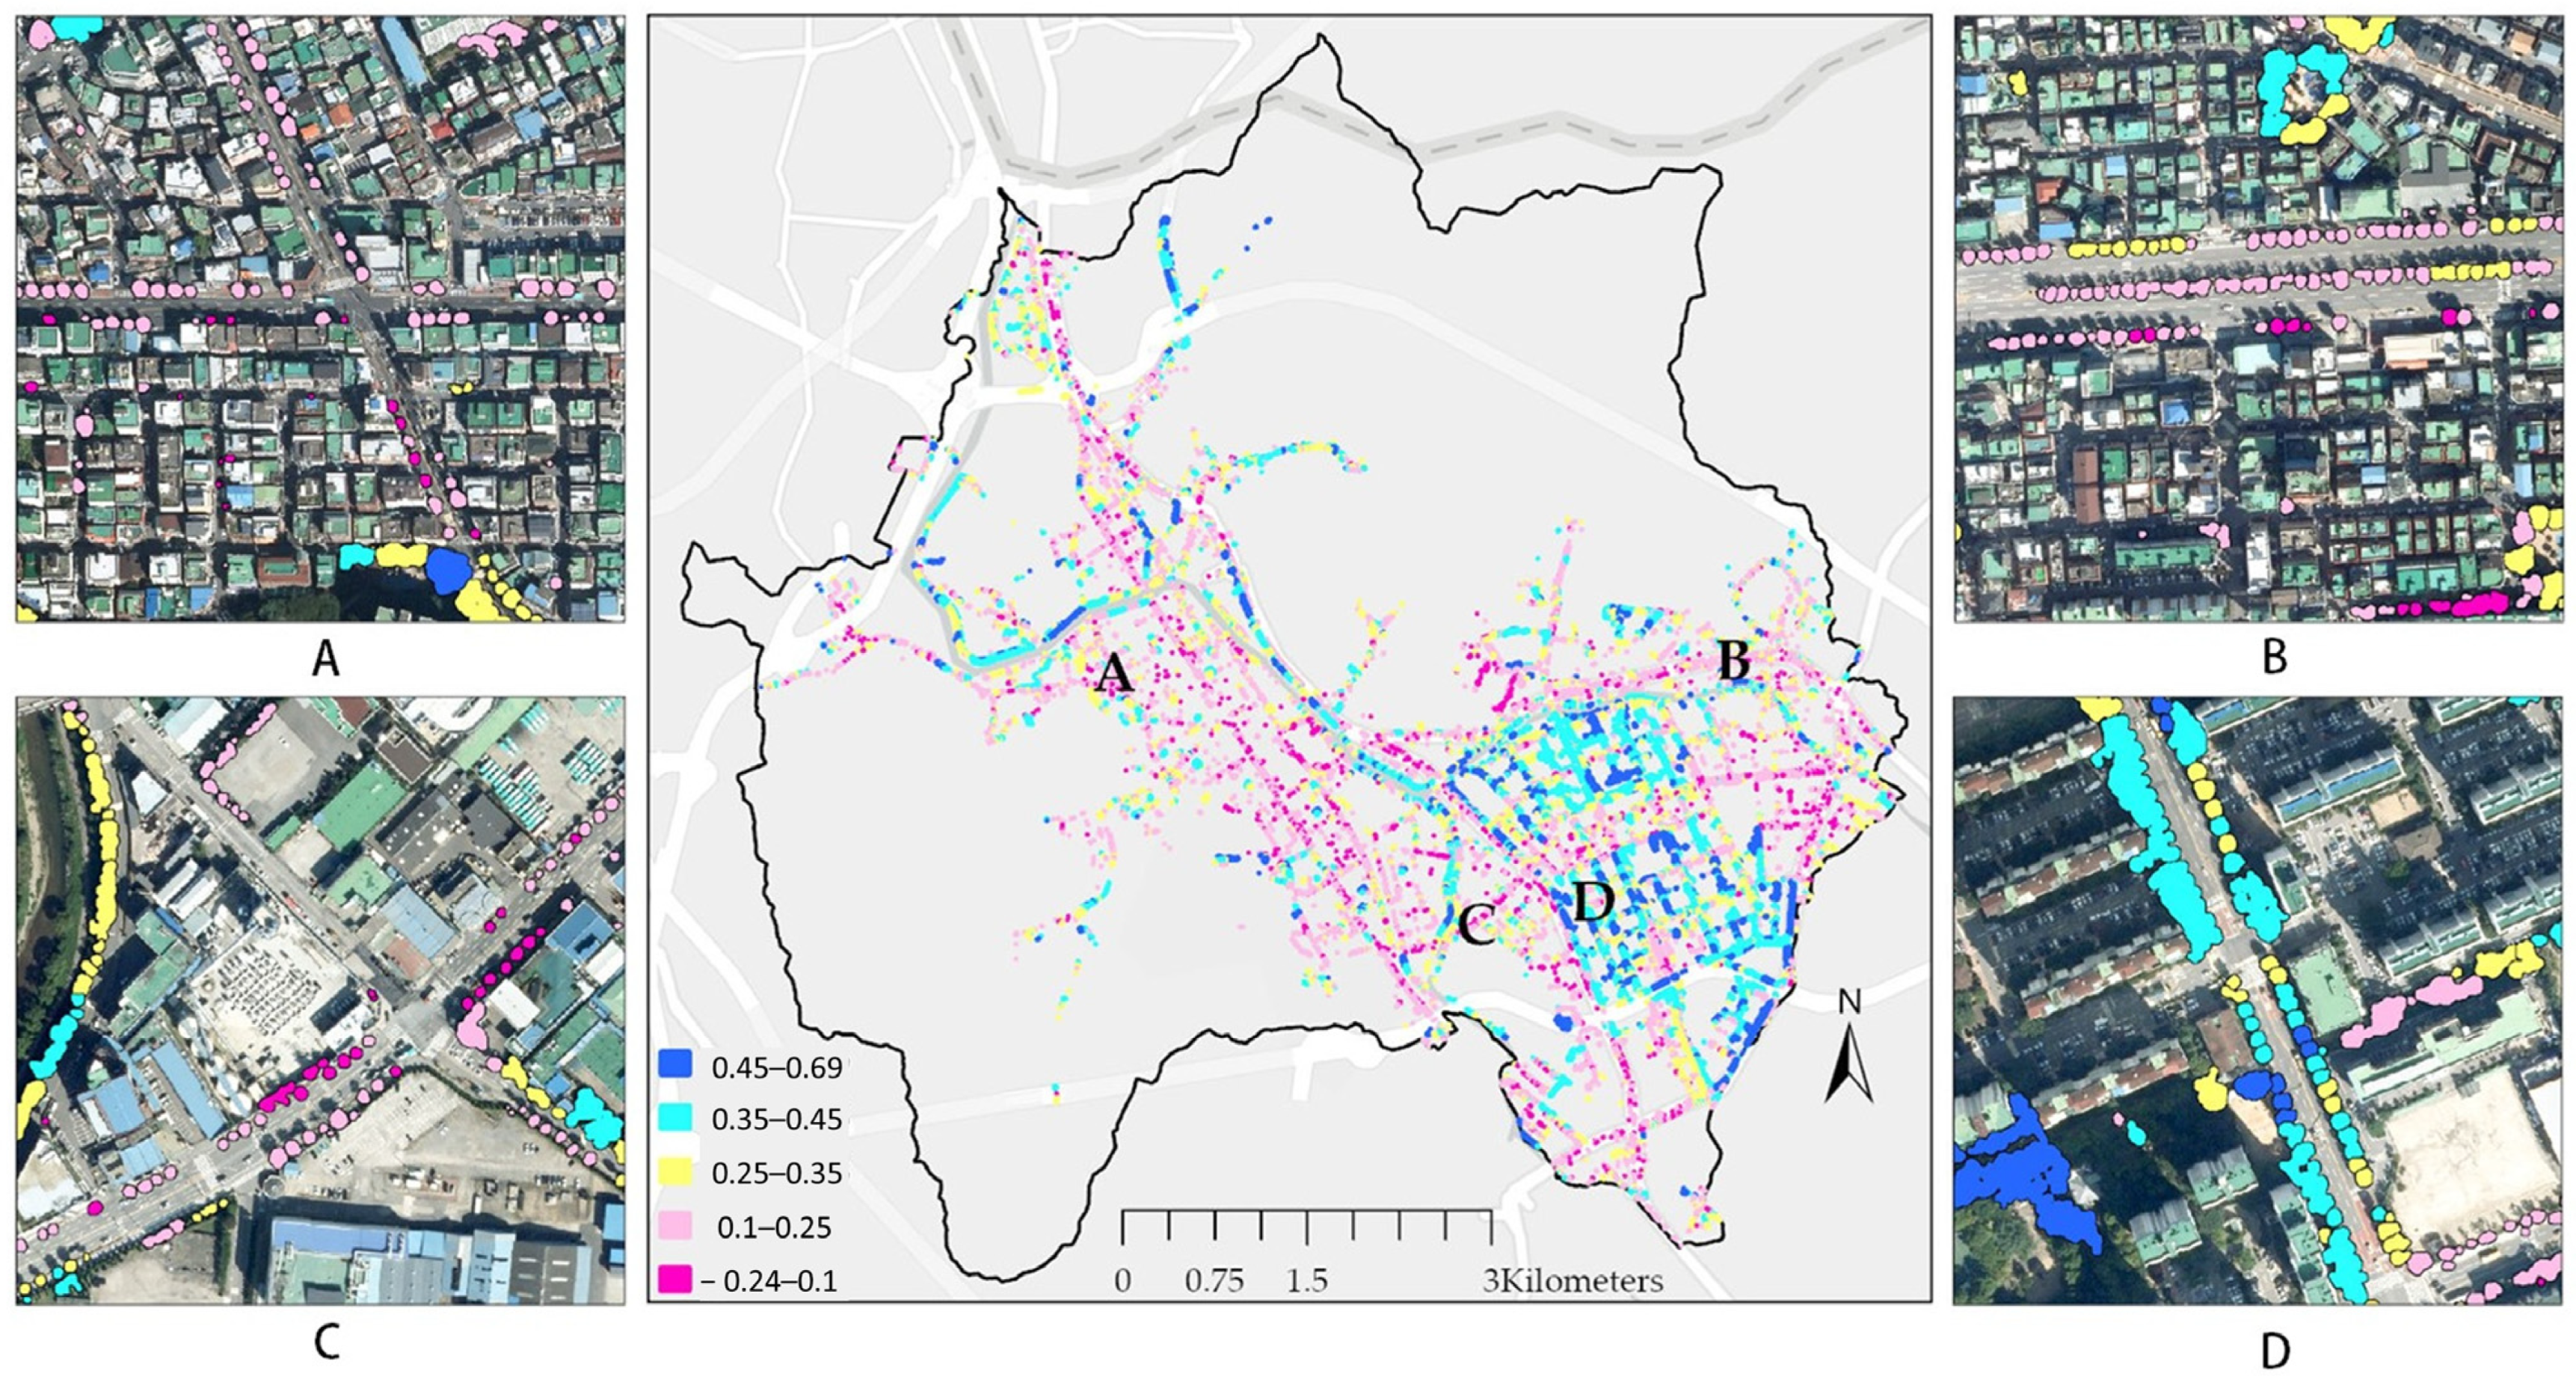
Figure 8 presents the spatial distribution of NDRE values assigned to individual street trees. As illustrated in the figure, areas represented in blue tend to be more frequently observed within recently developed urban districts (D), whereas pink-colored areas appear more commonly in older urban cores, the outskirts of new development zones, and along major road corridors (B). This spatial pattern is likely influenced by the higher presence of apartment complexes and associated green spaces in newly developed districts, which generally provide more favorable growing conditions. While this study does not claim statistical significance regarding differences between urban district types, the mapped results suggest that street trees located in areas with more abundant vegetation (e.g., apartment complexes or riverside greenways) more frequently exhibit NDRE values above 0.35. Conversely, trees in densely built-up areas with limited green space—such as traditional multi-family residential blocks (A) or roadside environments (B, C)—tend to display NDRE values below 0.25. Similar to the NDVI results, street trees situated in small neighborhood parks within dense multi-family housing areas (B) often showed NDRE values above 0.35, contrasting with the generally lower values of nearby roadside plantings. This suggests that the immediate availability of green space may contribute positively to the physiological vitality of urban street trees, although further statistical analysis would be required to formally validate these differences.

4.2.3. NDMI Matching Results

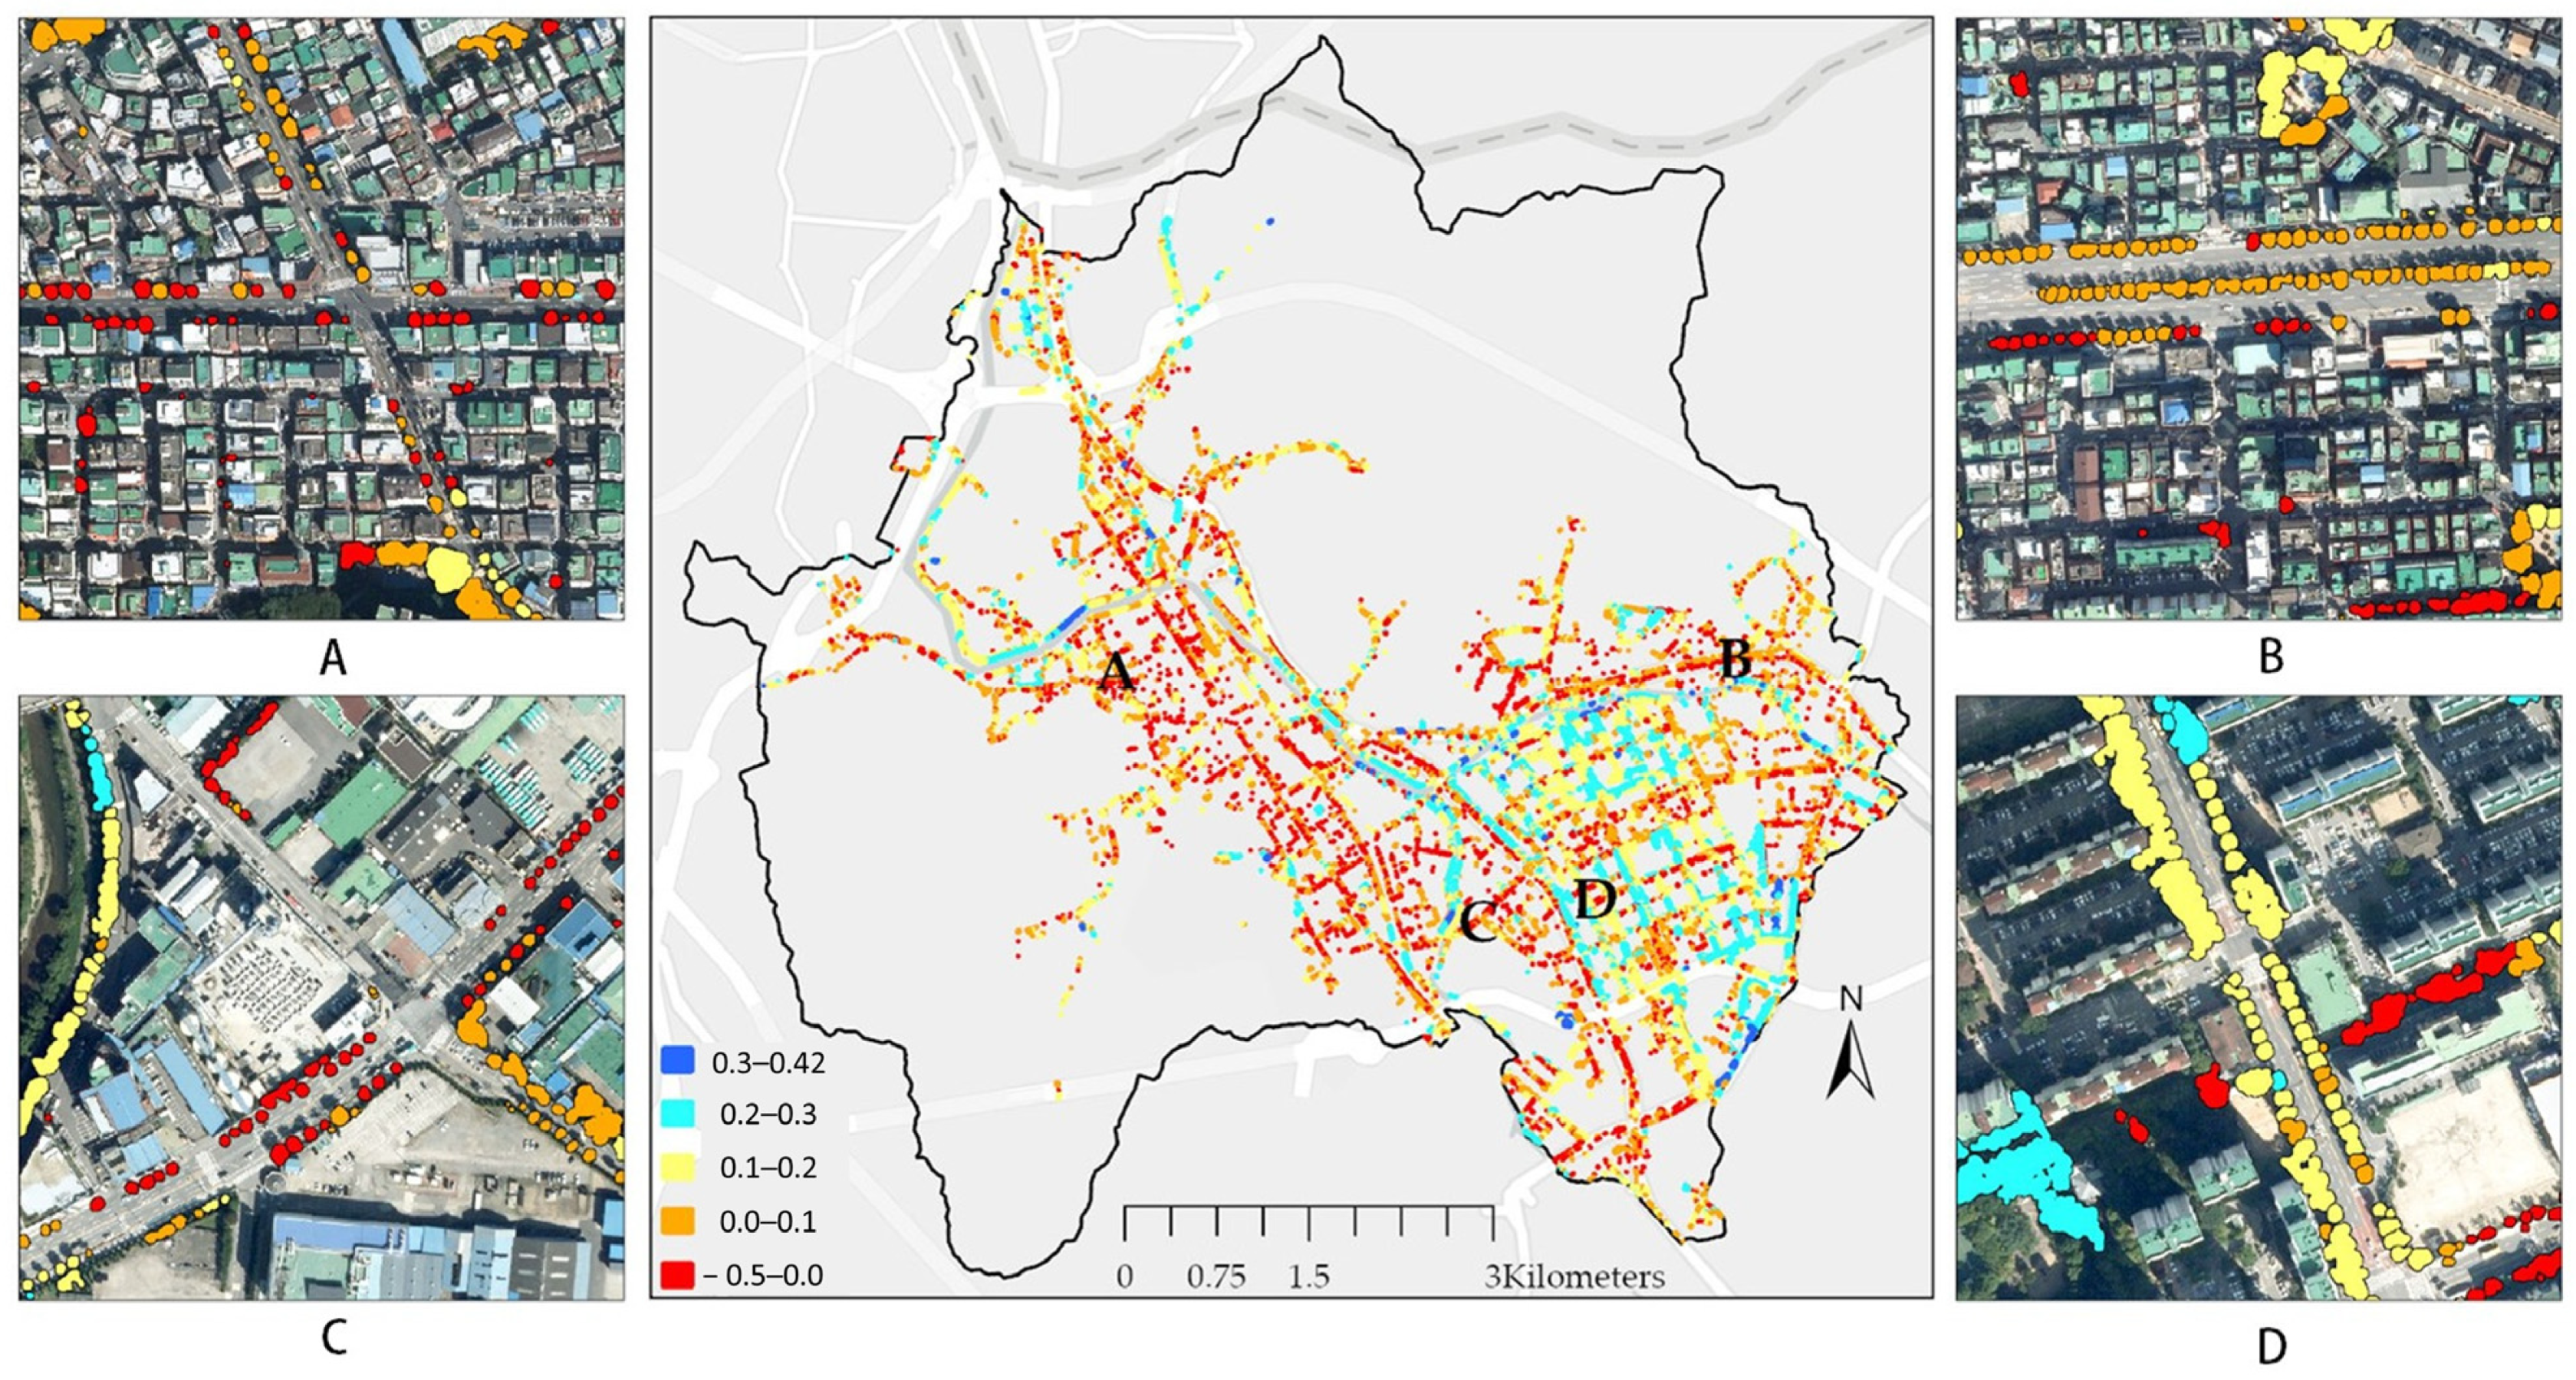
The results of matching NDMI values to individual street trees are presented in Figure 9. Similar to the NDRE patterns, trees exhibiting relatively low moisture stress tended to occur more frequently in recently developed urban districts (D), whereas higher moisture stress was more commonly observed in older urban areas (A) and along major road corridors (B). Overall, NDMI revealed more pronounced moisture-related limitations across the study area than those implied by chlorophyll-based indices. Most street trees appeared in red tones, indicating elevated moisture stress, and only 12 trees exhibited NDMI values above 0.4—a range generally associated with minimal moisture deficit. A closer examination of these 12 trees revealed that nine were located within newly developed, high-density apartment districts, where extensive landscaping and increased infiltration surfaces may contribute to relatively favorable moisture conditions. The remaining three trees were situated near rivers and streams, consistent with prior observations that proximity to water bodies can help stabilize soil moisture and reduce drought-related stress. This spatial distribution aligns with the broader pattern observed across the study area: street trees with adequate moisture availability tend to be concentrated either in newly developed urban environments with improved soil and planting conditions or in areas adjacent to hydrologically favorable settings.
As illustrated in Figure 9, light-blue objects were substantially more common than dark-blue ones, reflecting the limited presence of trees with relatively sufficient moisture availability. Trees with NDMI values greater than 0.3 were largely found near rivers and streams (C), where many street trees recorded NDMI values above 0.1, suggesting comparatively favorable moisture conditions in these areas. While this observation does not constitute statistical evidence, the spatial pattern may indicate that proximity to water bodies contributes to improved soil moisture availability. In contrast, street trees near apartment complexes—despite their generally high NDVI levels—displayed mixed moisture conditions, with some maintaining adequate soil moisture while others appeared to experience substantial stress. Trees planted along major roads (B) consistently exhibited NDMI values below 0.1, which may be associated with increased surface runoff and reduced soil water retention due to impervious pavement. Similarly, street trees in dense multi-family residential areas (A) also tended to show NDMI values below 0.1, reflecting limited moisture availability in environments characterized by high impervious surface coverage and constrained green space. These spatial tendencies underscore the value of incorporating moisture-related indicators alongside chlorophyll-based indices to more comprehensively characterize the vitality constraints experienced by urban street trees.

4.3. Composite Vitality Index Results

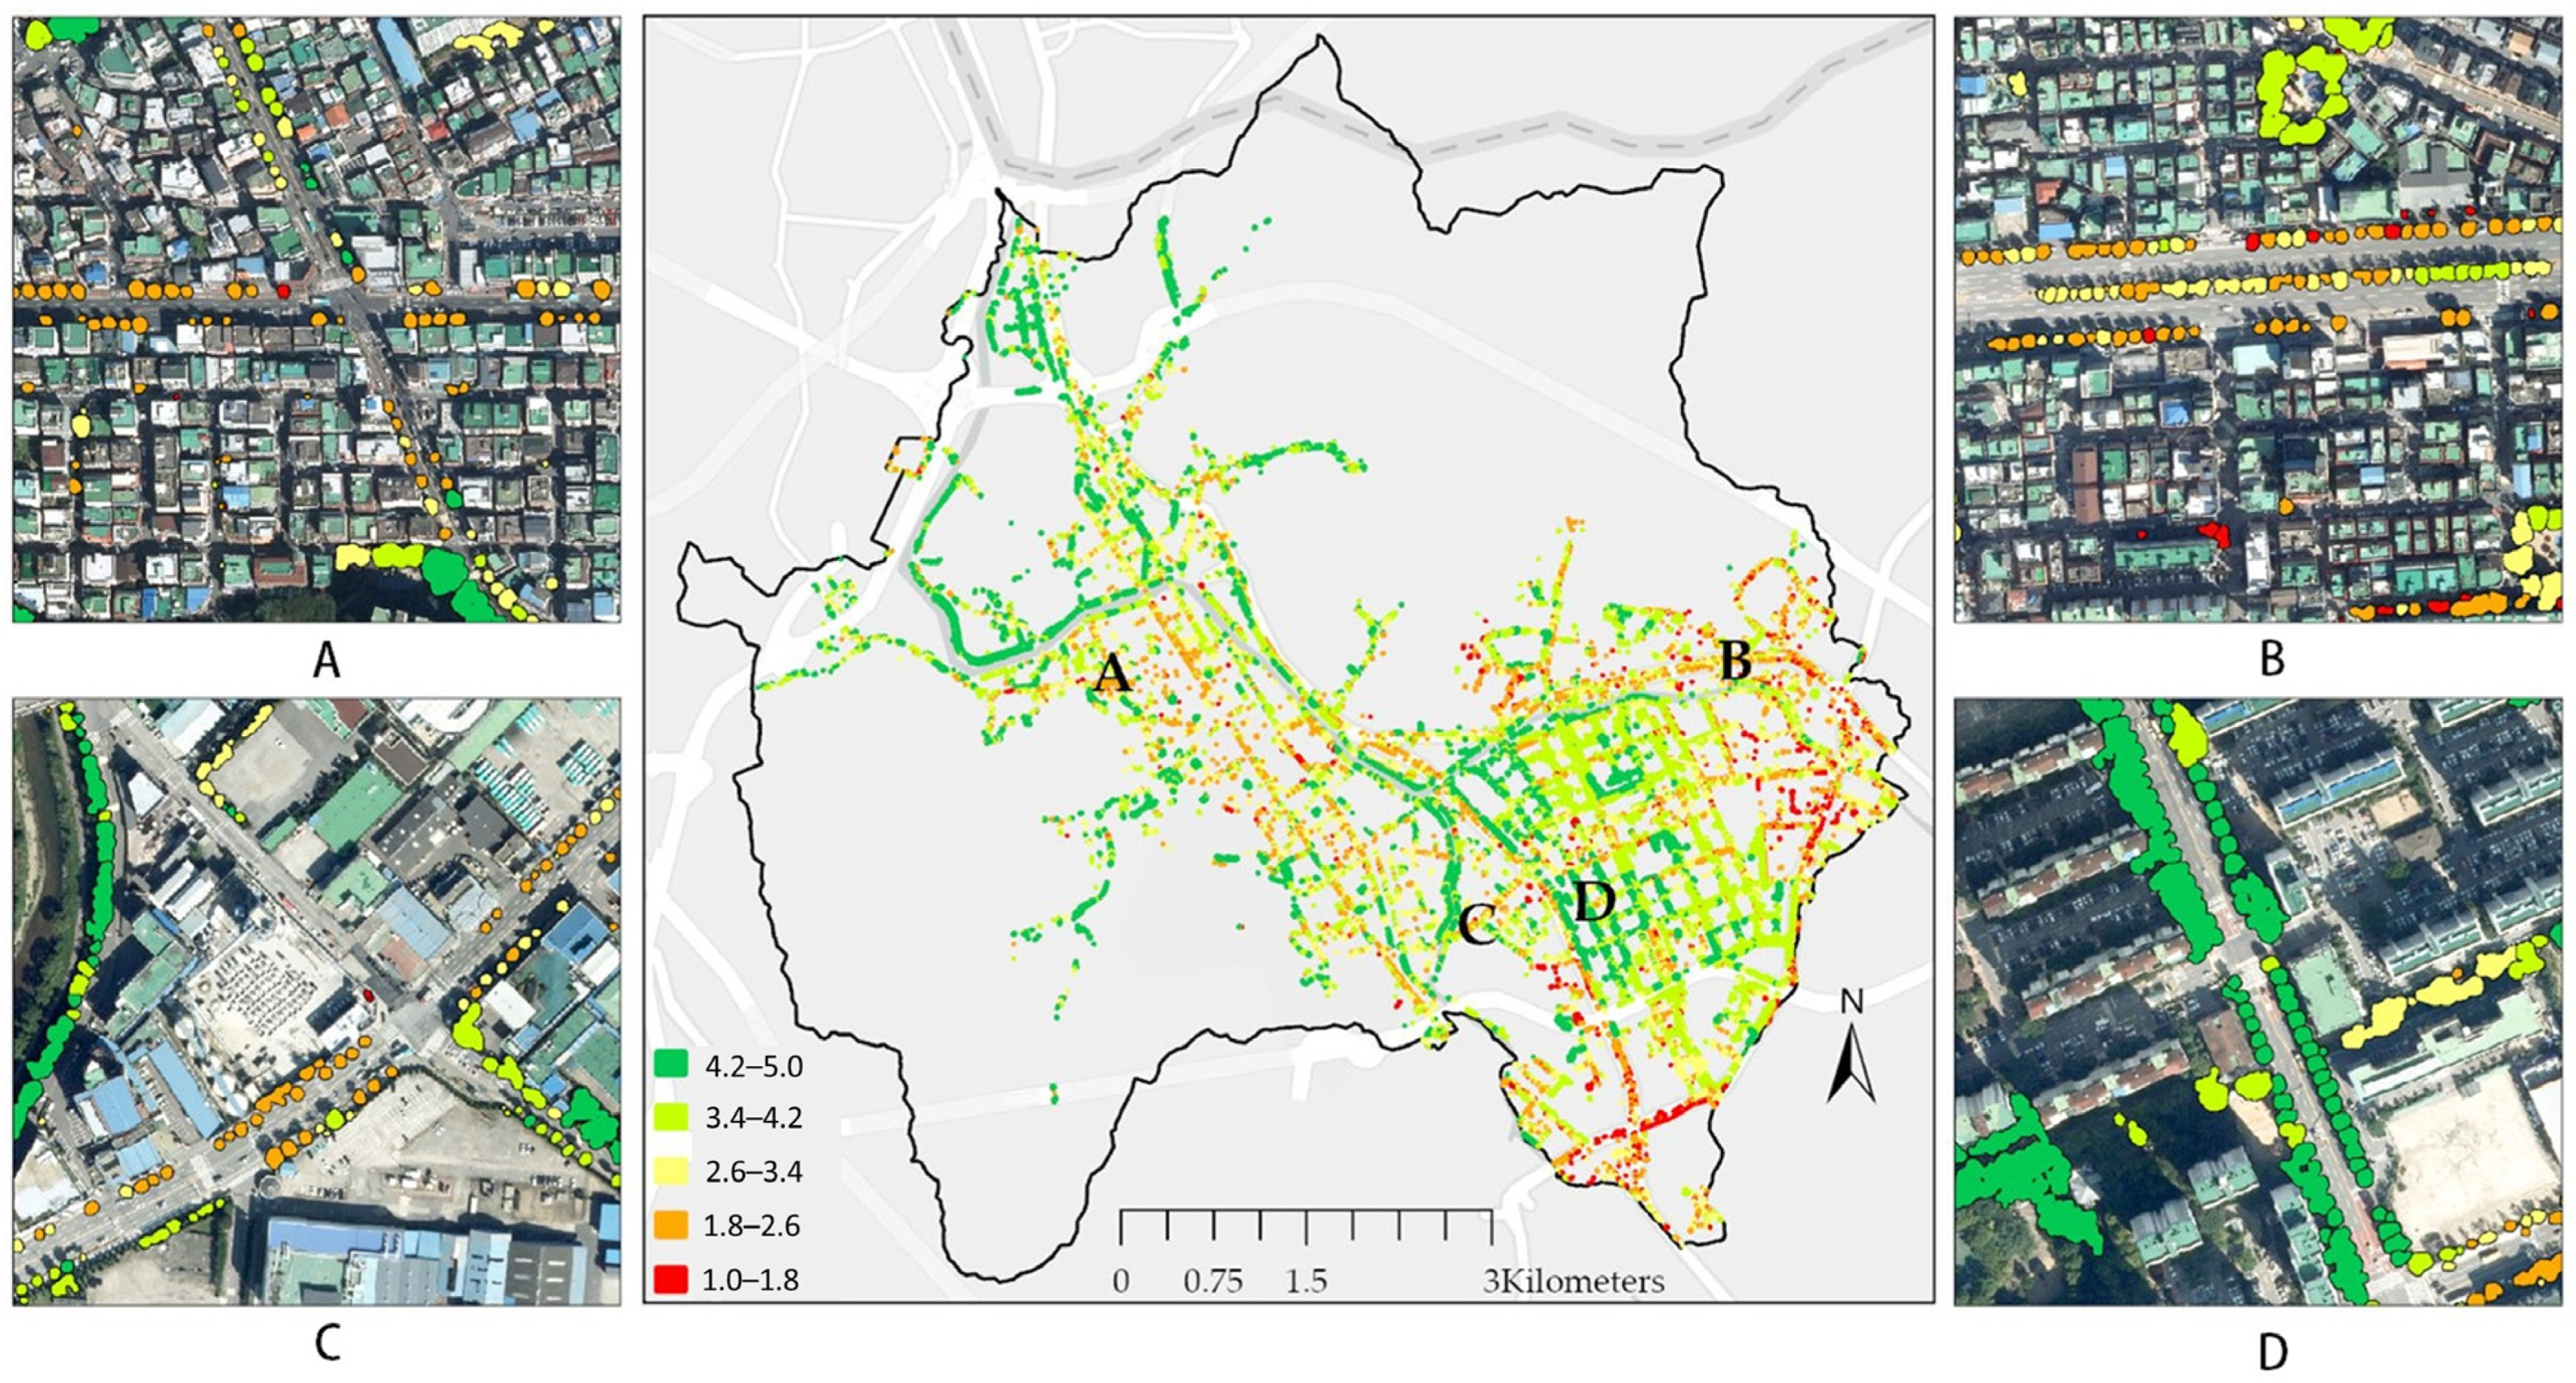
The results of the composite vitality index analysis are presented in Figure 10. Areas shown in green, representing relatively high vitality, were more frequently observed in recently developed urban districts and along pedestrian corridors near rivers and streams. Street trees located within apartment complexes in newly developed areas (D), which tended to record higher values across NDVI, NDRE, and NDMI, generally exhibited higher composite vitality scores. Likewise, street trees along riverfront walkways (C) often showed favorable vitality levels, which may be associated with the presence of adjacent green space and the availability of moisture from nearby water bodies. In contrast, areas characterized by lower vitality values—represented by yellow and red tones—appeared more commonly along major road corridors, within industrial and commercial zones, and in dense multi-family residential areas. Street trees planted near wide arterial roads with six or more lanes (B) tended to exhibit moderate to low vitality, potentially reflecting the influence of impervious asphalt surfaces and associated environmental stresses. Similarly, street trees in dense multi-family housing areas (A) often showed reduced vitality, which may be related to limited green space availability and extensive impervious surface coverage. Nonetheless, even within these dense residential settings, street trees planted in small neighborhood parks frequently demonstrated improved vitality, often reaching moderate or higher levels (B). Rather than implying statistically significant differences between urban district types, these spatial patterns suggest that the composite vitality index provides a useful means of capturing combined variations in photosynthetic activity and moisture availability, allowing for a more integrative understanding of street tree vitality across different urban environments.

5. Discussion

5.1. Interpretation of Vegetation Index Matching

In this study, street tree vitality was categorized into five levels based on interval-based interpretations of vegetation indices. This classification enabled intuitive visualization of areas where trees appear to exhibit relatively lower vitality and facilitated an exploratory assessment of spatial patterns under diverse urban environmental conditions.
Based on the matched vegetation indices, street trees located in newly developed apartment complexes and along riverfront walkways displayed visually higher index values, which may reflect favorable environmental conditions such as greater proportions of unpaved surfaces or more stable moisture supply. In contrast, trees situated in commercial and industrial zones, along major road corridors, or within dense multi-family residential areas exhibited comparatively lower index values, suggesting that these environments may impose constraints on photosynthetic activity or moisture availability. Areas with wide arterial roads and extensive impervious surfaces, in particular, showed relatively low NDVI and NDMI values, indicating potential stress conditions that may warrant further management consideration. It is also notable that within dense residential environments, trees located near small neighborhood parks often showed more favorable index values than those in surrounding streetscapes. This pattern suggests that localized green spaces may help mitigate some environmental stressors commonly found in highly built-up areas.
These interpretations are based on observed spatial patterns in vegetation indices and do not constitute statistically validated differences. Future work incorporating field-based measurements or formal statistical testing would help substantiate the relationships implied by these spatial trends.

5.2. Potential Applications in Street Tree Management

The proposed GeoAI-based framework provides a practical and scalable approach for supporting street tree management by enabling rapid, quantitative assessment of street tree vitality across large urban areas. In particular, this framework can complement the widely adopted two-stage assessment system—consisting of an initial visual inspection followed by a secondary instrument-based diagnosis—by enhancing efficiency and objectivity in the early stages of street tree condition evaluation.
It is important to emphasize that the vitality assessed in this study represents a remote sensing-derived proxy based on canopy-level spectral responses (NDVI, NDRE, and NDMI), rather than a direct physiological or arboricultural diagnosis. Accordingly, the proposed index is intended for citywide screening, hotspot identification, and inspection prioritization in large-area smart monitoring systems. Detailed evaluation of structural defects, pest or disease status, and physiological vitality should continue to rely on field-based assessments such as Visual Tree Assessment (VTA) or professional arborist inspections.
First, by automatically extracting street tree locations, the proposed method can substantially improve the efficiency of inventory development and database management. Primary inspections are typically conducted through on-site visual assessments, where arborists evaluate canopy density, leaf color, and branch damage. Previous studies (e.g., Morales-Gallegos et al. [52]) have demonstrated strong correlations between NDVI and canopy density, suggesting that NDVI-based analysis may offer supportive information that complements subjective visual evaluations.
Furthermore, although NDVI and NDRE are known to correlate with chlorophyll concentration and photosynthetic activity, it is important to note that this study did not perform direct correlation analysis against field-measured chlorophyll data. Thus, these indices should not be interpreted as substitutes for instrument-based chlorophyll measurements. Rather, they offer a means of pre-screening trees that may warrant further investigation, thereby helping prioritize field-based diagnostics.
Overall, the proposed framework has the potential to reduce the time, labor, and financial resources required for municipal street tree management by supporting early-stage assessment and monitoring efforts. While the methodological workflow is broadly transferable to other cities, parameter settings—including vitality thresholds, weighting schemes, and trained model parameters—may not be directly transferable and would require recalibration or transfer learning when applied to different environments.

5.3. Limitations of the Study

Despite the advantages of the proposed approach, several limitations should be acknowledged, particularly regarding the interpretation of the vitality index as a remote sensing-derived proxy rather than a direct physiological or arboricultural measure.
First, accurately delineating individual tree crowns remains challenging in high-density planting environments, such as parks and landscaped areas within apartment complexes. As illustrated in Figure 11, extensive crown overlap and shadow occlusions frequently caused all tested deep learning models to merge adjacent trees into a single object, resulting in under-segmentation. These errors are partly attributable to the 25 cm spatial resolution of the aerial imagery, which often makes even visual interpretation difficult. Improving crown delineation in such areas would require complementary data sources, such as ultra-high-resolution UAV imagery or targeted field inspections.
Second, although multispectral satellite imagery (e.g., Sentinel-2, CAS500-1) contains NIR information that can reveal vegetation signals in shadowed areas, its spatial resolution (10 m and 2 m, respectively) is insufficient for extracting crown-level boundaries. In this study, preliminary tests were conducted to evaluate whether NIR bands could be used to suppress shadow-induced detection errors; however, the coarse pixel size prevented meaningful crown delineation at the individual-tree scale. Because the proposed workflow requires fine-grained crown segmentation, the analysis was ultimately based on high-resolution aerial imagery, despite its susceptibility to shadow. Classical image-processing–based shadow-removal techniques were also tested but did not yield sufficiently sharp crown boundaries. Future studies may explore multi-sensor fusion, pan sharpening, or super-resolution approaches to address this limitation more explicitly.
Third, the vitality index developed in this study integrates NDVI, NDRE, and NDMI due to their demonstrated sensitivity to photosynthetic activity, chlorophyll content, and moisture conditions. However, these indices capture only a subset of physiological signals. Future studies may incorporate additional indices—such as SAVI (soil background adjustment), PSRI (senescence detection), or VARI (visible-band vitality response)—to obtain a more multidimensional representation of vegetation condition.
Fourth, the composite vitality index relies on a weighting scheme informed by spectral relevance and sensor characteristics. Although this provides a reasonable foundation, it inevitably introduces some degree of subjectivity. To assess robustness, a sensitivity analysis testing alternative weighting configurations was conducted. The results showed that the spatial distribution of vitality classes—particularly low-vitality areas—remained largely stable across weighting schemes, suggesting that the proposed index is sufficiently reliable for large-scale operational screening. Nevertheless, future research may further enhance objectivity through expert-informed or data-driven weighting optimization (e.g., AHP, TOPSIS, regression-based learning). In addition, although this study applied a five-level vitality classification scheme (Very Healthy to Very Unhealthy), this categorization was not directly validated using field measurements or arborist-based diagnostic scores. The threshold values for each class were derived from widely referenced criteria in prior remote sensing studies using NDVI, NDRE, and NDMI, and therefore represent a literature-informed operational proxy rather than a physiological ground-truth classification. Accordingly, the proposed vitality classes should be interpreted as indicators for large-scale screening and prioritization, rather than as substitutes for detailed Visual Tree Assessment (VTA) or professional arboricultural diagnosis. Future work incorporating empirical field data would allow calibration and validation of these vitality classes, thereby strengthening both ecological interpretability and operational reliability.
Fifth, because this study was conducted in a single city (Anyang), the transferability of parameter configurations—such as vitality thresholds, index weights, and trained model parameters—to cities with different climates, species compositions, or urban morphologies may be limited. While the methodological framework is broadly transferable, parameter-level transferability is not guaranteed; applying this approach to other regions would require local calibration or transfer learning to ensure reliable performance.
Finally, a temporal mismatch exists between datasets: street tree crowns were delineated from 2020 aerial orthophotos, whereas vegetation indices were extracted from 2023 satellite imagery (CAS500-1 and Sentinel-2). During this three-year interval, street trees and surrounding streetscapes may have changed due to removals, replanting, pruning, or redevelopment. Such changes can introduce uncertainty when 2020-derived crown polygons are used to sample 2023 spectral pixels. In practice, our manual inspection confirmed several locations where trees detected in the 2020 aerial imagery had been removed prior to 2023 due to construction or sidewalk modification. To mitigate this, trees with no observable vegetation signal in the 2023 imagery were cross-checked using the most recent aerial basemap and street-level photographs; when removal was confirmed, these trees were excluded, and the final vitality map was standardized to reflect 2023 on-the-ground conditions. Nevertheless, the remaining vitality estimates should be interpreted as operational, large-area screening outputs under temporal data constraints rather than as fully synchronized physiological measurements. Future studies should reduce this uncertainty by using aerial/UAV and satellite imagery acquired within the same season or year, and by incorporating multi-temporal datasets to explicitly model vitality dynamics and detect tree changes over time.

6. Conclusions

Urban street trees provide essential environmental and social benefits, including particulate matter reduction, mitigation of the urban heat island effect, and the provision of thermal comfort through shading. However, they remain highly vulnerable to adverse urban growing conditions such as vehicle emissions, extensive impervious surfaces, and limited rooting environments, all of which contribute to long-term declines in vitality. Despite these challenges, current urban tree management practices still rely heavily on labor-intensive field inspections, making large-scale, quantitative vitality assessment difficult to operationalize.
To help address this limitation, this study proposed an integrated framework that combines high-resolution aerial imagery, multispectral satellite imagery, and semantic-segmentation-based deep learning models to automatically detect individual street trees and derive a remote sensing–based vitality proxy using NDVI, NDRE, and NDMI. By adopting an object-based workflow at the individual tree level, the proposed approach provides a scalable means of identifying spatial patterns associated with reduced photosynthetic activity and moisture stress across complex urban environments.
The findings revealed notable spatial variation in vegetation-index patterns associated with different urban contexts. Lower index values were commonly observed along major road corridors and in dense built-up areas, whereas higher values appeared more frequently near parks, riverfront walkways, and apartment complexes. While these patterns suggest potential relationships between land-use characteristics and tree condition, they should be interpreted cautiously because the vitality proxy reflects canopy-level spectral responses rather than direct physiological or arboricultural measurements. The five-level classification applied in this study therefore represents an operational screening tool rather than a diagnostic indicator of true physiological vitality.
This study contributes methodologically by extending urban street tree research from detection to proxy-based vitality estimation using multiple vegetation indices. From a practical perspective, the framework can assist municipalities in developing and updating street tree inventories, supporting visual inspections, and prioritizing areas for field-based assessment. Rather than replacing on-site diagnostic procedures, the proposed proxy can serve as an initial, large-scale screening layer that informs resource allocation and management planning within smart city initiatives.
Future research should incorporate field-based measurements to strengthen the interpretability and validation of the vitality proxy. Additionally, the integration of multi-seasonal or ultra-high-resolution UAV imagery would enable more detailed monitoring of temporal changes, supporting the development of long-term, proactive management strategies for urban street trees.

Author Contributions

Conceptualization, Y.K. (Yeonsu Kang) and Y.K. (Youngok Kang); methodology, software, formal analysis, Y.K. (Yeonsu Kang); validation, investigation, resources, Y.K. (Yeonsu Kang) and Y.K. (Youngok Kang); data curation, Y.K. (Yeonsu Kang); writing—original draft preparation, Y.K. (Yeonsu Kang); writing—review and editing, Y.K. (Youngok Kang); visualization, Y.K. (Yeonsu Kang); supervision, Y.K. (Youngok Kang); project administration, Y.K. (Youngok Kang); funding acquisition, Y.K. (Youngok Kang). All authors have read and agreed to the published version of the manuscript.

Funding

This research was supported by the Korea Agency for Infrastructure Technology Advancement (KAIA) and funded by the Ministry of Land, Infrastructure, and Transport of the Korean government (Grant No. RS-2022-00143782).

Data Availability Statement

Data can be provided upon request.

Conflicts of Interest

The authors declare no conflicts of interest.

Appendix A

Figure A1. Loss curves during training and validation for all semantic segmentation models.
Smartcities 09 00031 g0a1

References

  1. Nowak, D.; Crane, D.; Stevens, J. Air pollution removal by urban trees and shrubs in the United States. Urban For. Urban Green. 2006, 4, 115–123. [Google Scholar] [CrossRef]
  2. Akbari, H.; Pomerantz, M.; Taha, H. Cool surfaces and shade trees to reduce energy use and improve air quality in urban areas. Sol. Energy 2001, 70, 295–310. [Google Scholar] [CrossRef]
  3. Nowak, D.J.; McHale, P.J.; Ibarra, M.; Crane, D.; Stevens, J.C.; Luley, C.J. Modeling the effects of urban vegetation on air pollution. In Air Pollution Modeling and Its Application XII; Gryning, S.-E., Chaumerliac, N., Eds.; Plenum Press: New York, NY, USA, 1998; pp. 399–407. [Google Scholar]
  4. Pereira de Camargo, E.; Moreira, T.; Todesco, E.; Andrade, M.; André, C.; Andre, P.; Singer, J.; Ferreira, L.; Paulo, H.; Buckeridge, M. The role of air pollution and climate on the growth of urban trees. Sci. Total Environ. 2019, 666, 652–661. [Google Scholar] [CrossRef]
  5. Czaja, M.; Kołton, A.; Muras, P. The complex issue of urban trees—Stress factor accumulation and ecological service possibilities. Forests 2020, 11, 932. [Google Scholar] [CrossRef]
  6. Östberg, J.; Sandberg, K.; Wiström, B. Rating of parameters used to assess tree vitality by urban foresters and ecologists in Sweden, using the Delphi method. Urban For. Urban Green. 2021, 62, 127134. [Google Scholar] [CrossRef]
  7. Shigo, A.L. Modern Arboriculture; Shigo and Trees Associates: Snohomish, WA, USA, 1991. [Google Scholar]
  8. Callow, D.; May, P.; Johnstone, D. Tree vitality assessment in urban landscapes. Forests 2018, 9, 279. [Google Scholar] [CrossRef]
  9. Sæbø, A.; Borzan, Ž.; Ducatillion, C.; Hatzistathis, A.; Lagerström, T.; Supuka, J.; García-Valdecantos, J.L.; Rego, F.; Van Slycken, J. The Selection of Plant Materials for Street Trees, Park Trees and Urban Woodland. In Urban Forests and Trees; Springer: Berlin, Heidelberg, Germany, 2005; pp. 257–280. [Google Scholar] [CrossRef]
  10. NYC Parks; TreeKIT. Trees Count 2015 Training Manual; NYC Parks: New York City, NY, USA, 2015; pp. 1–30. [Google Scholar]
  11. Runnymede Borough Council. Tree Inspection Policy; Runnymede Borough Council: Runnymede, UK, 2012; pp. 1–15. [Google Scholar]
  12. National Parks Board. Guidelines on Greenery Provision and Tree Conservation for Developments, Version 5; Greenery & Development Planning; National Parks Board: Singapore, 2025; pp. 1–167. [Google Scholar]
  13. Kim, M.K. Evaluation Method of Street Tree Vigor and Hazard in Seoul; Seoul Institute of Technology: Seoul, Republic of Korea, 2022; pp. 1–38. [Google Scholar]
  14. Alonzo, M.; McFadden, J.; Nowak, D.; Roberts, D. Mapping urban forest structure and function using hyperspectral imagery and lidar data. Urban For. Urban Green. 2016, 17, 135–147. [Google Scholar] [CrossRef]
  15. Kampen, M.; Lederbauer, S.; Mund, J.-P.; Immitzer, M. UAV-Based Multispectral Data for Tree Species Classification and Tree Vitality Analysis; Publikationen der DGPF: Vienna, Austria, 2019; pp. 623–639. [Google Scholar]
  16. Abdollahnejad, A.; Panagiotidis, D. Tree species classification and health status assessment for a mixed broadleaf–conifer forest with UAS multispectral imaging. Remote Sens. 2020, 12, 3722. [Google Scholar] [CrossRef]
  17. Yao, S.; Hao, Z.; Post, C.; Mikhailova, E.; Lin, L. Individual tree crown detection and classification of live and dead trees using a Mask Region-Based Convolutional Neural Network (Mask R-CNN). Forests 2024, 15, 1900. [Google Scholar] [CrossRef]
  18. Hocknell, J.; Morso, I.; Graziano, J.; Paramore, K. Assessing tree health conditions in New York City’s Central Park with Earth observation data. In Proceedings of the AGU 2024 Annual Meeting, Washington, DC, USA, 9–13 December 2024; Available online: https://ntrs.nasa.gov/citations/20240014521 (accessed on 8 January 2026).
  19. Einzmann, K.; Atzberger, C.; Pinnel, N.; Glas, C.; Böck, S.; Seitz, R.; Immitzer, M. Early detection of spruce vitality loss with hyperspectral data: Results of an experimental study in Bavaria, Germany. Remote Sens. Environ. 2021, 266, 112676. [Google Scholar] [CrossRef]
  20. Xiao, Q.; McPherson, E. Tree health mapping with multispectral remote sensing data at UC Davis, California. Urban Ecosyst. 2005, 8, 349–361. [Google Scholar] [CrossRef]
  21. Gamon, J.A.; Field, C.B.; Goulden, M.L.; Griffin, K.L.; Hartley, A.E.; Joel, G.; Peñuelas, J.; Valentini, R. Relationships between NDVI, canopy structure, and photosynthesis in three Californian vegetation types. Ecol. Appl. 1995, 5, 28–41. [Google Scholar] [CrossRef]
  22. Martins, J.A.C.; Nogueira, K.; Osco, L.P.; Gomes, F.D.G.; Furuya, D.E.G.; Gonçalves, W.N.; Sant’Ana, D.A.; Ramos, A.P.M.; Liesenberg, V.; dos Santos, J.A.; et al. Semantic Segmentation of Tree-Canopy in Urban Environment with Pixel-Wise Deep Learning. Remote Sens. 2021, 13, 3054. [Google Scholar] [CrossRef]
  23. Lv, L.; Li, X.; Mao, F.; Zhou, L.; Xuan, J.; Zhao, Y.; Yu, J.; Song, M.; Huang, L.; Du, H. A Deep Learning Network for Individual Tree Segmentation in UAV Images with a Coupled CSPNet and Attention Mechanism. Remote Sens. 2023, 15, 4420. [Google Scholar] [CrossRef]
  24. Zhang, Y.; Wang, M.; Mango, J.; Xin, L.; Meng, C.; Li, X. Individual tree detection and counting based on high-resolution imagery and the canopy height model data. Geospat. Inf. Sci. 2024, 27, 2162–2178. [Google Scholar] [CrossRef]
  25. Velasquez-Camacho, L.; van Doorn, N.; Preisler, H.; Etxegarai, M.; Alas, O.; Gonzalez Castro, J.M.; de-Miguel, S. Monitoring temporal changes in large urban street trees using remote sensing and deep learning. PLoS ONE 2025, 20, e0326562. [Google Scholar] [CrossRef]
  26. Ding, Y.; Cui, X.; Chen, Z.; Wang, Z.; Yuan, D.; Meng, X.; Yang, X.; Xu, Y.; Tian, X. Urban tree canopy mapping and analysis using iterative annotation method and deep learning: A case study in Beijing. IEEE J. Sel. Top. Appl. Earth Obs. Remote Sens. 2025, 18, 12645–12659. [Google Scholar] [CrossRef]
  27. Gitelson, A. Wide dynamic range vegetation index for remote quantification of biophysical characteristics of vegetation. J. Plant Physiol. 2004, 161, 165–173. [Google Scholar] [CrossRef]
  28. Motohka, T.; Nasahara, K.; Oguma, H.; Tsuchida, S. Applicability of green–red vegetation index for remote sensing of vegetation phenology. Remote Sens. 2010, 2, 2369–2387. [Google Scholar] [CrossRef]
  29. Wardlow, B.; Egbert, S.; Kastens, J. Analysis of time-series MODIS 250 m vegetation index data for crop classification in the U.S. Central Great Plains. Remote Sens. Environ. 2007, 108, 290–310. [Google Scholar] [CrossRef]
  30. Costa, B.; Oldoni, H.; Silva, T.; Farinassi, L.; Bognola, I.; Bassoi, L. How similar is the zoning of different vegetation indices: Defining the optimal framework for monitoring grapevines’ growth within vigorous vineyards. Sci. Hortic. 2023, 322, 112404. [Google Scholar] [CrossRef]
  31. Fensholt, R.; Sandholt, I.; Stisen, S. Evaluating MODIS, MERIS, and VEGETATION vegetation indices using in situ measurements in a semiarid environment. IEEE Trans. Geosci. Remote Sens. 2006, 44, 1774–1786. [Google Scholar] [CrossRef]
  32. Qi, J.; Chehbouni, A.; Huete, A.; Kerr, Y.; Sorooshian, S. A modified soil adjusted vegetation index. Remote Sens. Environ. 1994, 48, 119–126. [Google Scholar] [CrossRef]
  33. Boiarskii, B.; Hasegawa, H. Comparison of NDVI and NDRE indices to detect differences in vegetation and chlorophyll content. J. Mech. Contin. Math. Sci. 2019, 4, 20–29. [Google Scholar] [CrossRef]
  34. Simović, I.; Šikoparija, B.; Panić, M.; Radulovic, M.; Lugonja, P. Remote sensing of poplar phenophase and leaf miner attack in urban forests. Remote Sens. 2022, 14, 6331. [Google Scholar] [CrossRef]
  35. Chen, X.; Zhou, Z.; Teng, M.; Wang, P.; Zhou, L. Accumulation of three different sizes of particulate matter on plant leaf surfaces: Effect on leaf traits. Arch. Biol. Sci. 2015, 67, 102. [Google Scholar] [CrossRef]
  36. Rock, B.; Vogelmann, J.; Vogelmann, A.; Hoshizaki, T.; Williams, D. Remote detection of forest damage. BioScience 1986, 36, 439–445. [Google Scholar] [CrossRef]
  37. Palmer, W.C. Keeping track of crop moisture conditions, nationwide: The new crop moisture index. Weatherwise 1968, 21, 156–161. [Google Scholar] [CrossRef]
  38. Théau, J.; Sankey, T.; Weber, K. Multi-sensor analyses of vegetation indices in a semi-arid environment. GIScience Remote Sens. 2010, 47, 260–275. [Google Scholar] [CrossRef]
  39. Cundill, S.; van der Werff, H.; Meijde, M. Adjusting spectral indices for spectral response function differences of very high spatial resolution sensors simulated from field spectra. Sensors 2015, 15, 6221–6240. [Google Scholar] [CrossRef]
  40. Varouchakis, E.; Komnitsas, K.; Galetakis, M. Spatiotemporal analysis of vegetation health and moisture dynamics in rehabilitated mining quarries using satellite imagery. Environ. Process. 2025, 12, 45. [Google Scholar] [CrossRef]
  41. Rouse, J.; Haas, R.H.; Schell, J.A.; Deering, D.W. Monitoring vegetation systems in the Great Plains with ERTS. In Proceedings of the 3rd ERTS-1 Symposium; NASA, Goddard Space Flight Center: Greenbelt, MD, USA, 1974; Volume 1, pp. 309–317. [Google Scholar]
  42. Omar, M.; Kawamukai, H. Prediction of NDVI using the Holt–Winters model in high and low vegetation regions: A case study of East Africa. Sci. Afr. 2021, 14, e01020. [Google Scholar] [CrossRef]
  43. Judith, J.; Tamilselvi, R.; Beham, M.P.; Lakshmi, S.; Panthakkan, A.; Al Mansoori, S.; Ahmad, H. Remote sensing based crop health classification using NDVI and fully connected neural networks. arXiv 2025, arXiv:2504.10522. [Google Scholar] [CrossRef]
  44. Aryal, J.; Sitaula, C.; Aryal, S. NDVI threshold-based urban green space mapping from Sentinel-2A at the local governmental area (LGA) level of Victoria, Australia. Land 2022, 11, 351. [Google Scholar] [CrossRef]
  45. Barnes, E.; Clarke, T.R.; Richards, S.E.; Colaizzi, P.; Haberland, J.; Kostrzewski, M.; Waller, P.; Choi, C.; Riley, E.; Thompson, T.L. Coincident detection of crop water stress, nitrogen status, and canopy density using ground-based multispectral data. In Proceedings of the Fifth International Conference on Precision Agriculture, Bloomington, MN, USA, 16–19 July 2000. [Google Scholar]
  46. Rehman, T.H.; Lundy, M.E.; Linquist, B.A. Comparative sensitivity of vegetation indices measured via proximal and aerial sensors for assessing N status and predicting grain yield in rice cropping systems. Remote Sens. 2022, 14, 2770. [Google Scholar] [CrossRef]
  47. Psomiadis, E.; Philippopoulos, P.; Kakaletris, G. Non-invasive estimation of crop water stress index and irrigation management with upscaling from field to regional level using remote sensing and agrometeorological data. Remote Sens. 2025, 17, 2522. [Google Scholar] [CrossRef]
  48. Gao, B.-C. NDWI—A normalized difference water index for remote sensing of vegetation liquid water from space. Remote Sens. Environ. 1996, 58, 257–266. [Google Scholar] [CrossRef]
  49. Koohikeradeh, E.; Gumiere, S.; Bonakdari, H. NDMI-derived field-scale soil moisture prediction using ERA5 and LSTM for precision agriculture. Sustainability 2025, 17, 2399. [Google Scholar] [CrossRef]
  50. Lykhovyd, P.; Sharii, V. Normalised difference moisture index in water stress assessment of maize crops. Agrology 2024, 7, 21–26. [Google Scholar] [CrossRef]
  51. Mihai, B.; Horoias, R. NDMI use in recognition of water stress issues, related to winter wheat yields in southern Romania. Sci. Pap. Ser. Manag. Econ. Eng. Agric. Rural Dev. 2022, 22, 105–112. [Google Scholar]
  52. Morales-Gallegos, L.M.; Martínez-Trinidad, T.; Hernández-de la Rosa, P.; Gómez-Guerrero, A.; Alvarado-Rosales, D.; Saavedra-Romero, L.d.L. Tree health condition in urban green areas assessed through crown indicators and vegetation indices. Forests 2023, 14, 1673. [Google Scholar] [CrossRef]
Figure 1. Workflow of the proposed framework for individual street tree detection and vegetation index-based vitality assessment using aerial and multispectral satellite imagery.
Smartcities 09 00031 g001
Figure 2. Study area of Anyang City, South Korea: (a) its location within the national context; (b) high-resolution aerial imagery of the study area; (c) road network data used to define street tree planting zones.
Smartcities 09 00031 g002
Figure 3. Multi-source imagery used in this study: (a) orthorectified aerial imagery from 2020; (b) true color CAS500-1 imagery on 8 August 2023; (c) true color Sentinel-2 imagery on 24 September 2023.
Smartcities 09 00031 g003
Figure 4. Study sub-area used for constructing the training dataset for street tree detection, with the boundary highlighted in red.
Smartcities 09 00031 g004
Figure 5. Examples of training data for street tree detection, including original aerial imagery and corresponding ground truth masks.
Smartcities 09 00031 g005
Figure 6. Visual comparison of street tree detection results produced by different semantic segmentation models. Red boxes highlight regions where the models show notable differences in boundary delineation or crown separation.
Smartcities 09 00031 g006
Figure 7. Spatial distribution of NDVI values for individual street trees across the study area.
Smartcities 09 00031 g007
Figure 8. Spatial distribution of NDRE values for individual street trees across the study area.
Smartcities 09 00031 g008
Figure 9. Spatial distribution of NDMI values for individual street trees across the study area.
Smartcities 09 00031 g009
Figure 10. Spatial distribution of the composite vitality index for individual street trees across the study area.
Smartcities 09 00031 g010
Figure 11. Examples illustrating limitations in individual street tree delineation under dense canopy and shadow conditions across different semantic segmentation models. The red area indicates the regions detected as street trees by the model.
Smartcities 09 00031 g011
Table 1. Learning-rate ranges applied to each model.
Learning Rate Range
Mask2former6.31 × 10−6~6.31 × 10⁻⁵
U-Net6.31 × 10−6~6.31 × 10⁻⁵
DeepLabV37.59 × 10−4~7.59 × 10⁻³
HRNet1.45 × 10−4~1.45 × 10⁻³
FCN7.59 × 10−4~7.59 × 10⁻³
Table 2. Model Architectures and Parameter Specifications.
Model Name (in the Study)Model
(MMSegmentation)
BackboneHead ArchitectureTotal Parameters
Mask2formerMMSegmentationMask2formerTransformer~44M
U-NetU-NetResNet-50Convolutional Decoder~31M
DeepLabV3DeepLabV3ResNet-50ASPP (Atrous Spatial
Pyramid Pooling)
~41M
HRNetMMSegmentationHRNetHigh-Resolution Multi-Branch~9.6M
FCNMMSegmentationFCNUpSampling
Classified head
~32M
Table 3. Threshold-based scoring scheme for NDVI, NDRE, and NDMI used to quantify street tree vitality.
ScoreNDVINDRENDMI
5≤1.0≤0.69≤0.42
4≤0.7≤0.45≤0.3
3≤0.5≤0.35≤0.2
2≤0.3≤0.25≤0.1
1≤0.1≤0.1≤0.0
Table 4. Score classification and corresponding health classes for the composite street tree vitality index.
ScoreHealth ClassVitality Index
5Very Healthy≤5
4Healthy≤4.2
3Moderate≤3.4
2Unhealthy≤2.6
1Very Unhealthy≤1.8
Table 5. Quantitative performance comparison of semantic segmentation models for street tree detection.
PrecisionRecallF1 Score
Mask2former0.8050060.7911090.797997
U-Net0.7796230.7352500.756786
DeepLabV30.6731730.7663630.716752
HRNet0.8124660.6601170.728411
FCN0.7576280.5510820.638056
Table 6. Boundary Recall of the semantic segmentation models.
Mask2formerU-NetDeepLabV3HRnetFCN
Recall0.6340.6880.4510.5080.41
Disclaimer/Publisher’s Note: The statements, opinions and data contained in all publications are solely those of the individual author(s) and contributor(s) and not of MDPI and/or the editor(s). MDPI and/or the editor(s) disclaim responsibility for any injury to people or property resulting from any ideas, methods, instructions or products referred to in the content.