Article

Evaluating Acoustic vs. AI-Based Satellite Leak Detection in Aging US Water Infrastructure: A Cost and Energy Savings Analysis †

1
Manufacturing Science Division, Oak Ridge National Laboratory, Oak Ridge, TN 37830, USA
2
Building Technology & Urban Systems Division, Lawrence Berkeley National Laboratory, Berkeley, CA 97420, USA
*
Author to whom correspondence should be addressed.
This manuscript has been authored by UT-Battelle, LLC, under contract DE-AC05-00OR22725 with the US Department of Energy (DOE). The US government retains and the publisher, by accepting the article for publication, acknowledges that the US government retains a nonexclusive, paid-up, irrevocable, worldwide license to publish or reproduce the published form of this manuscript, or allow others to do so, for US government purposes. DOE will provide public access to these results of federally sponsored research in accordance with the DOE Public Access Plan (https://www.energy.gov/doe-public-access-plan, accessed on 30 May 2025).
Smart Cities 2025, 8(4), 122; https://doi.org/10.3390/smartcities8040122
Submission received: 6 May 2025 / Revised: 24 June 2025 / Accepted: 26 June 2025 / Published: 22 July 2025

Abstract

Highlights

What are the main findings?
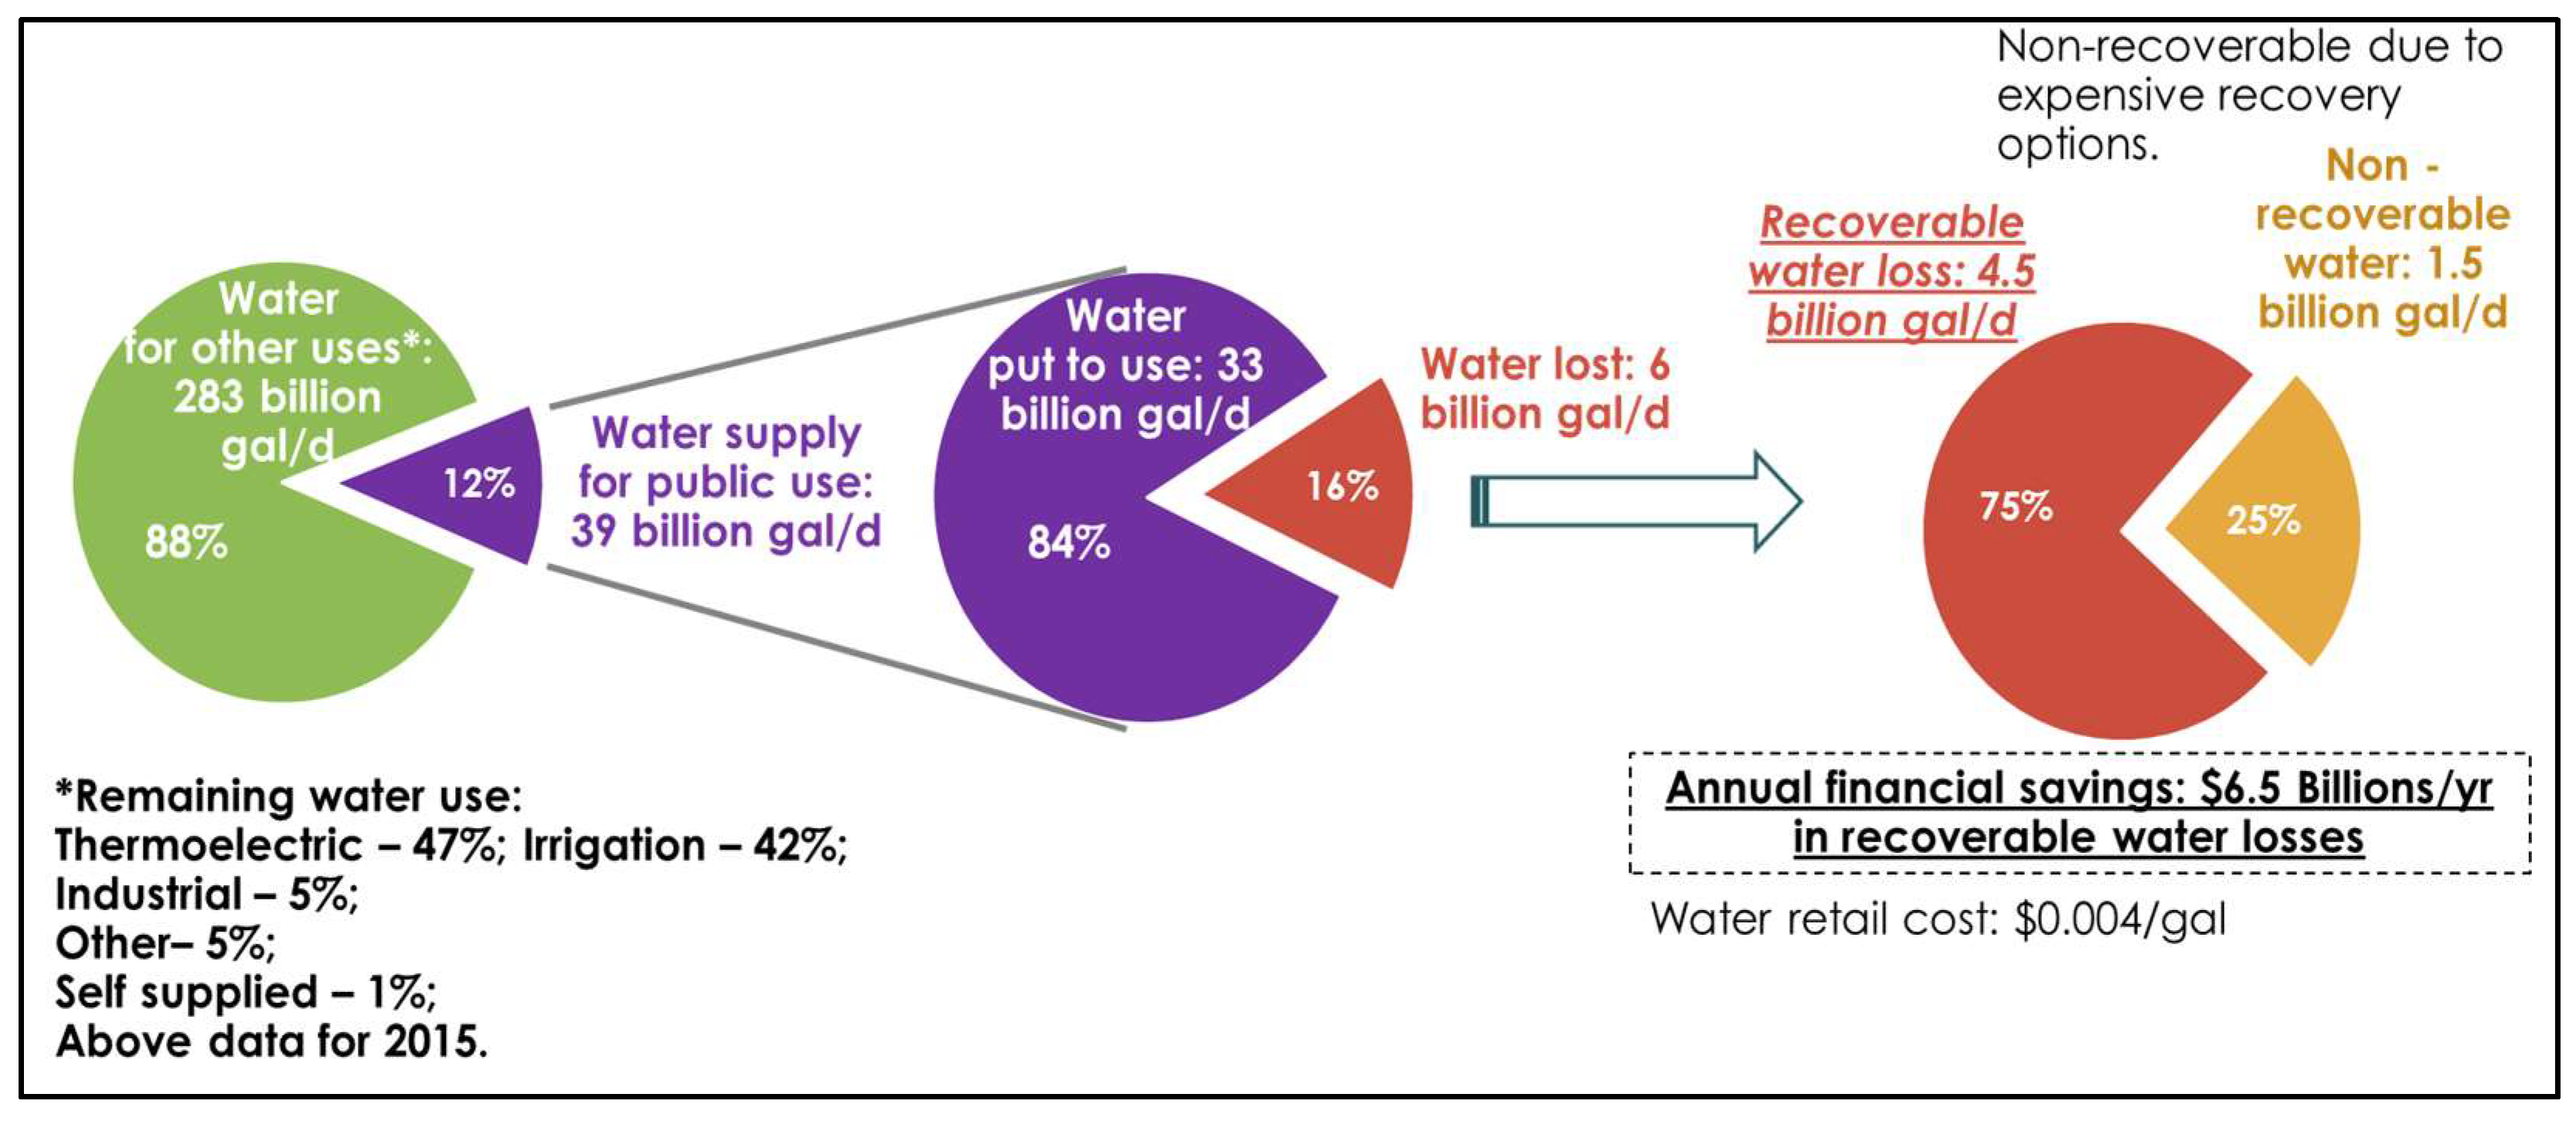
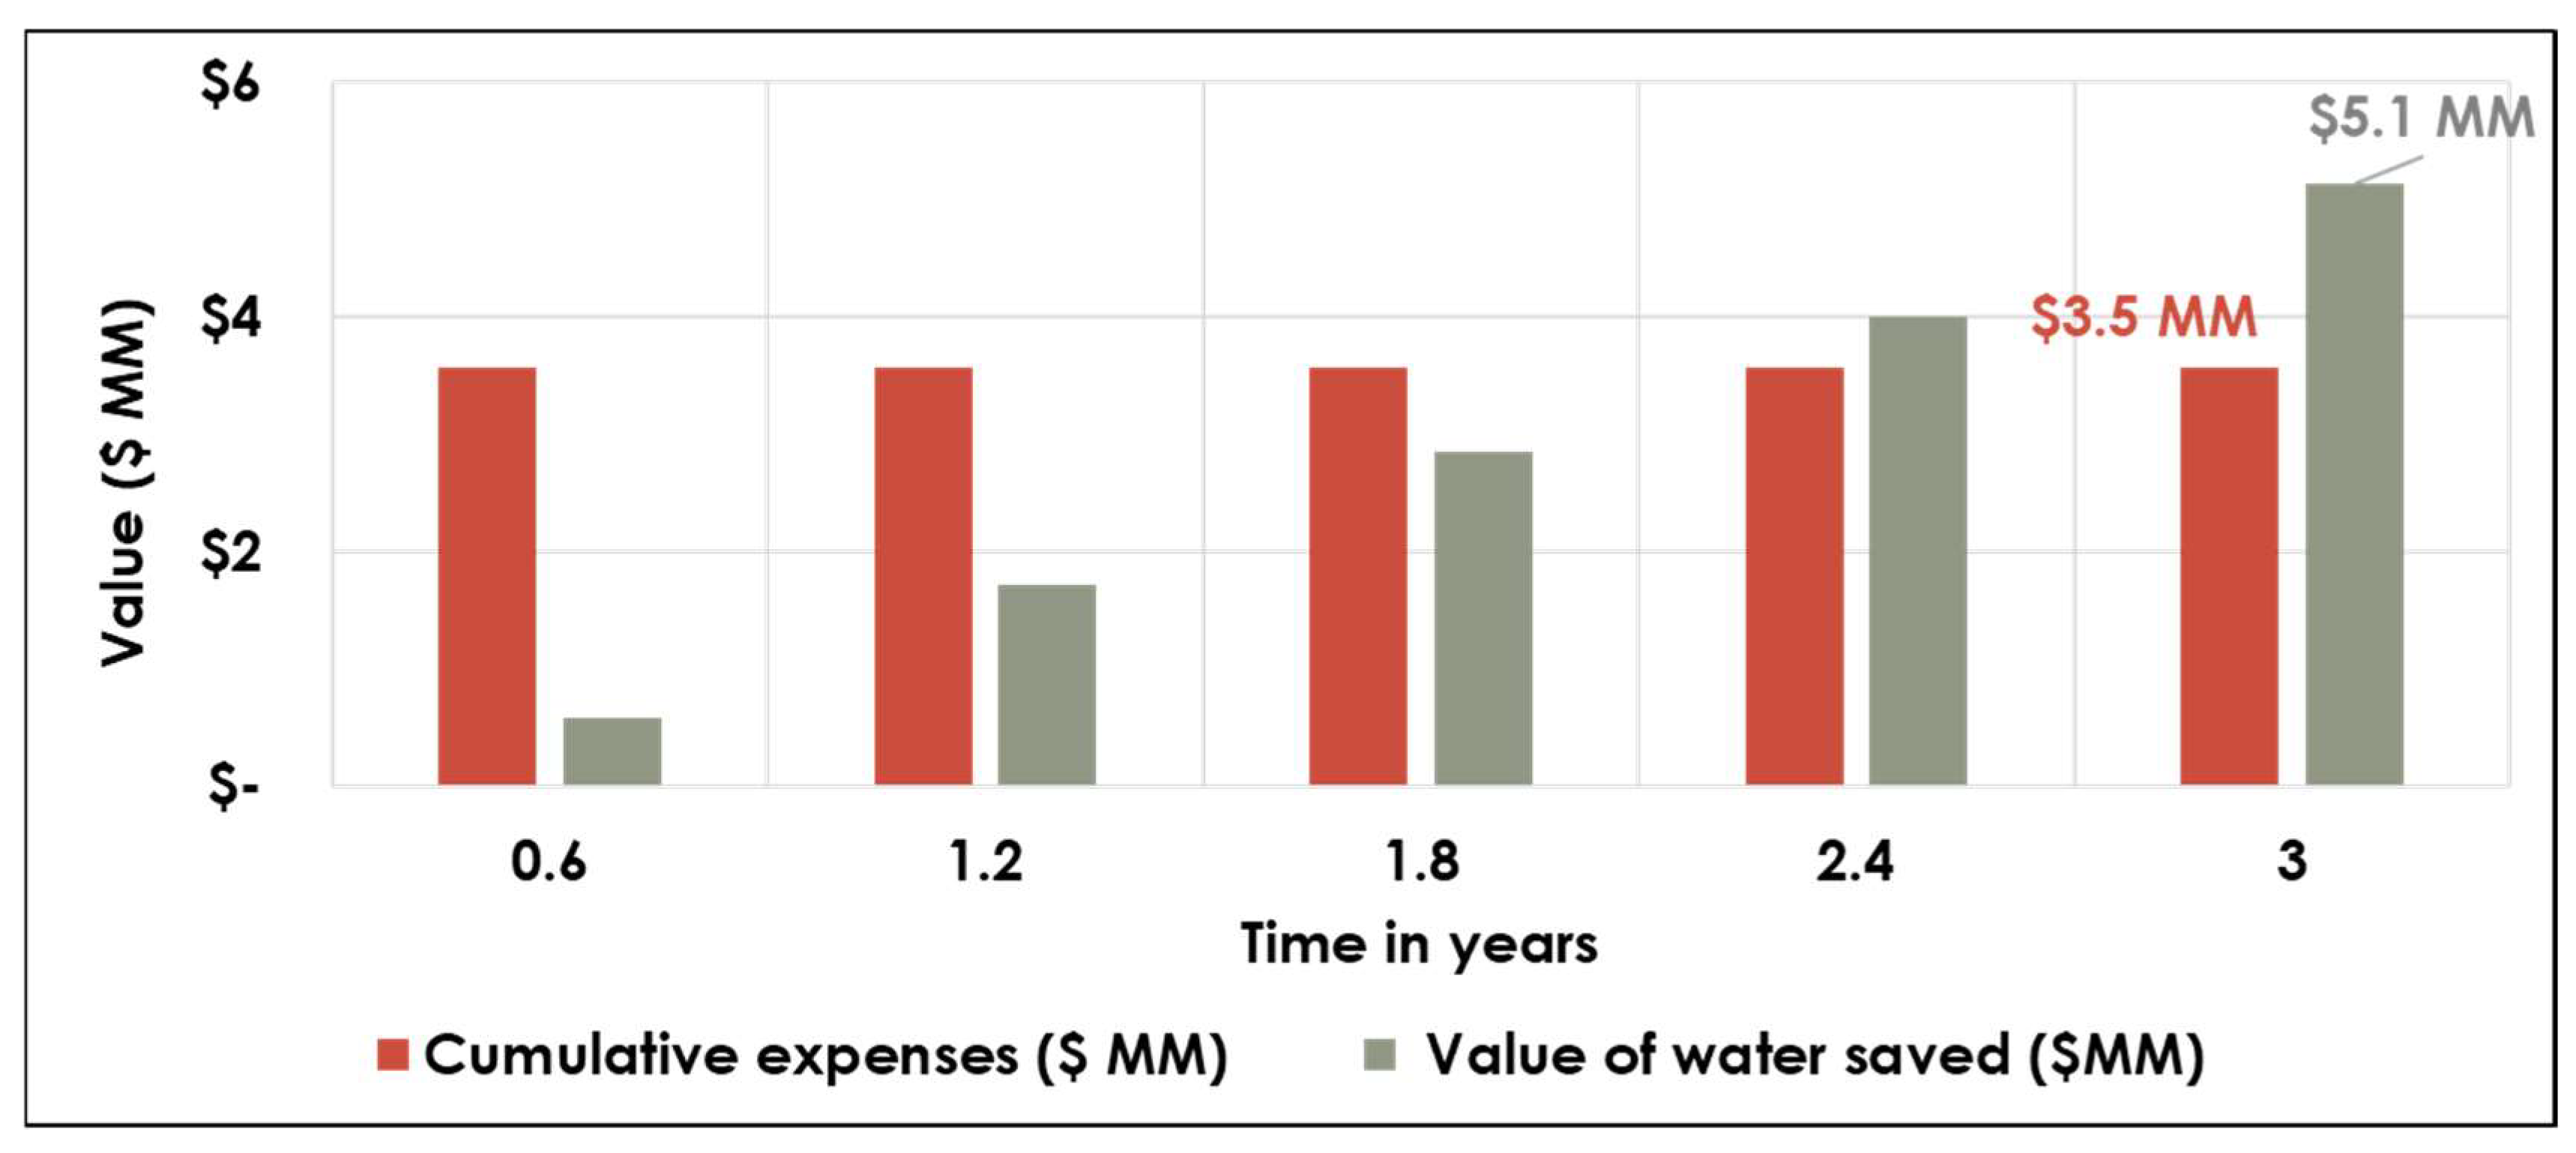
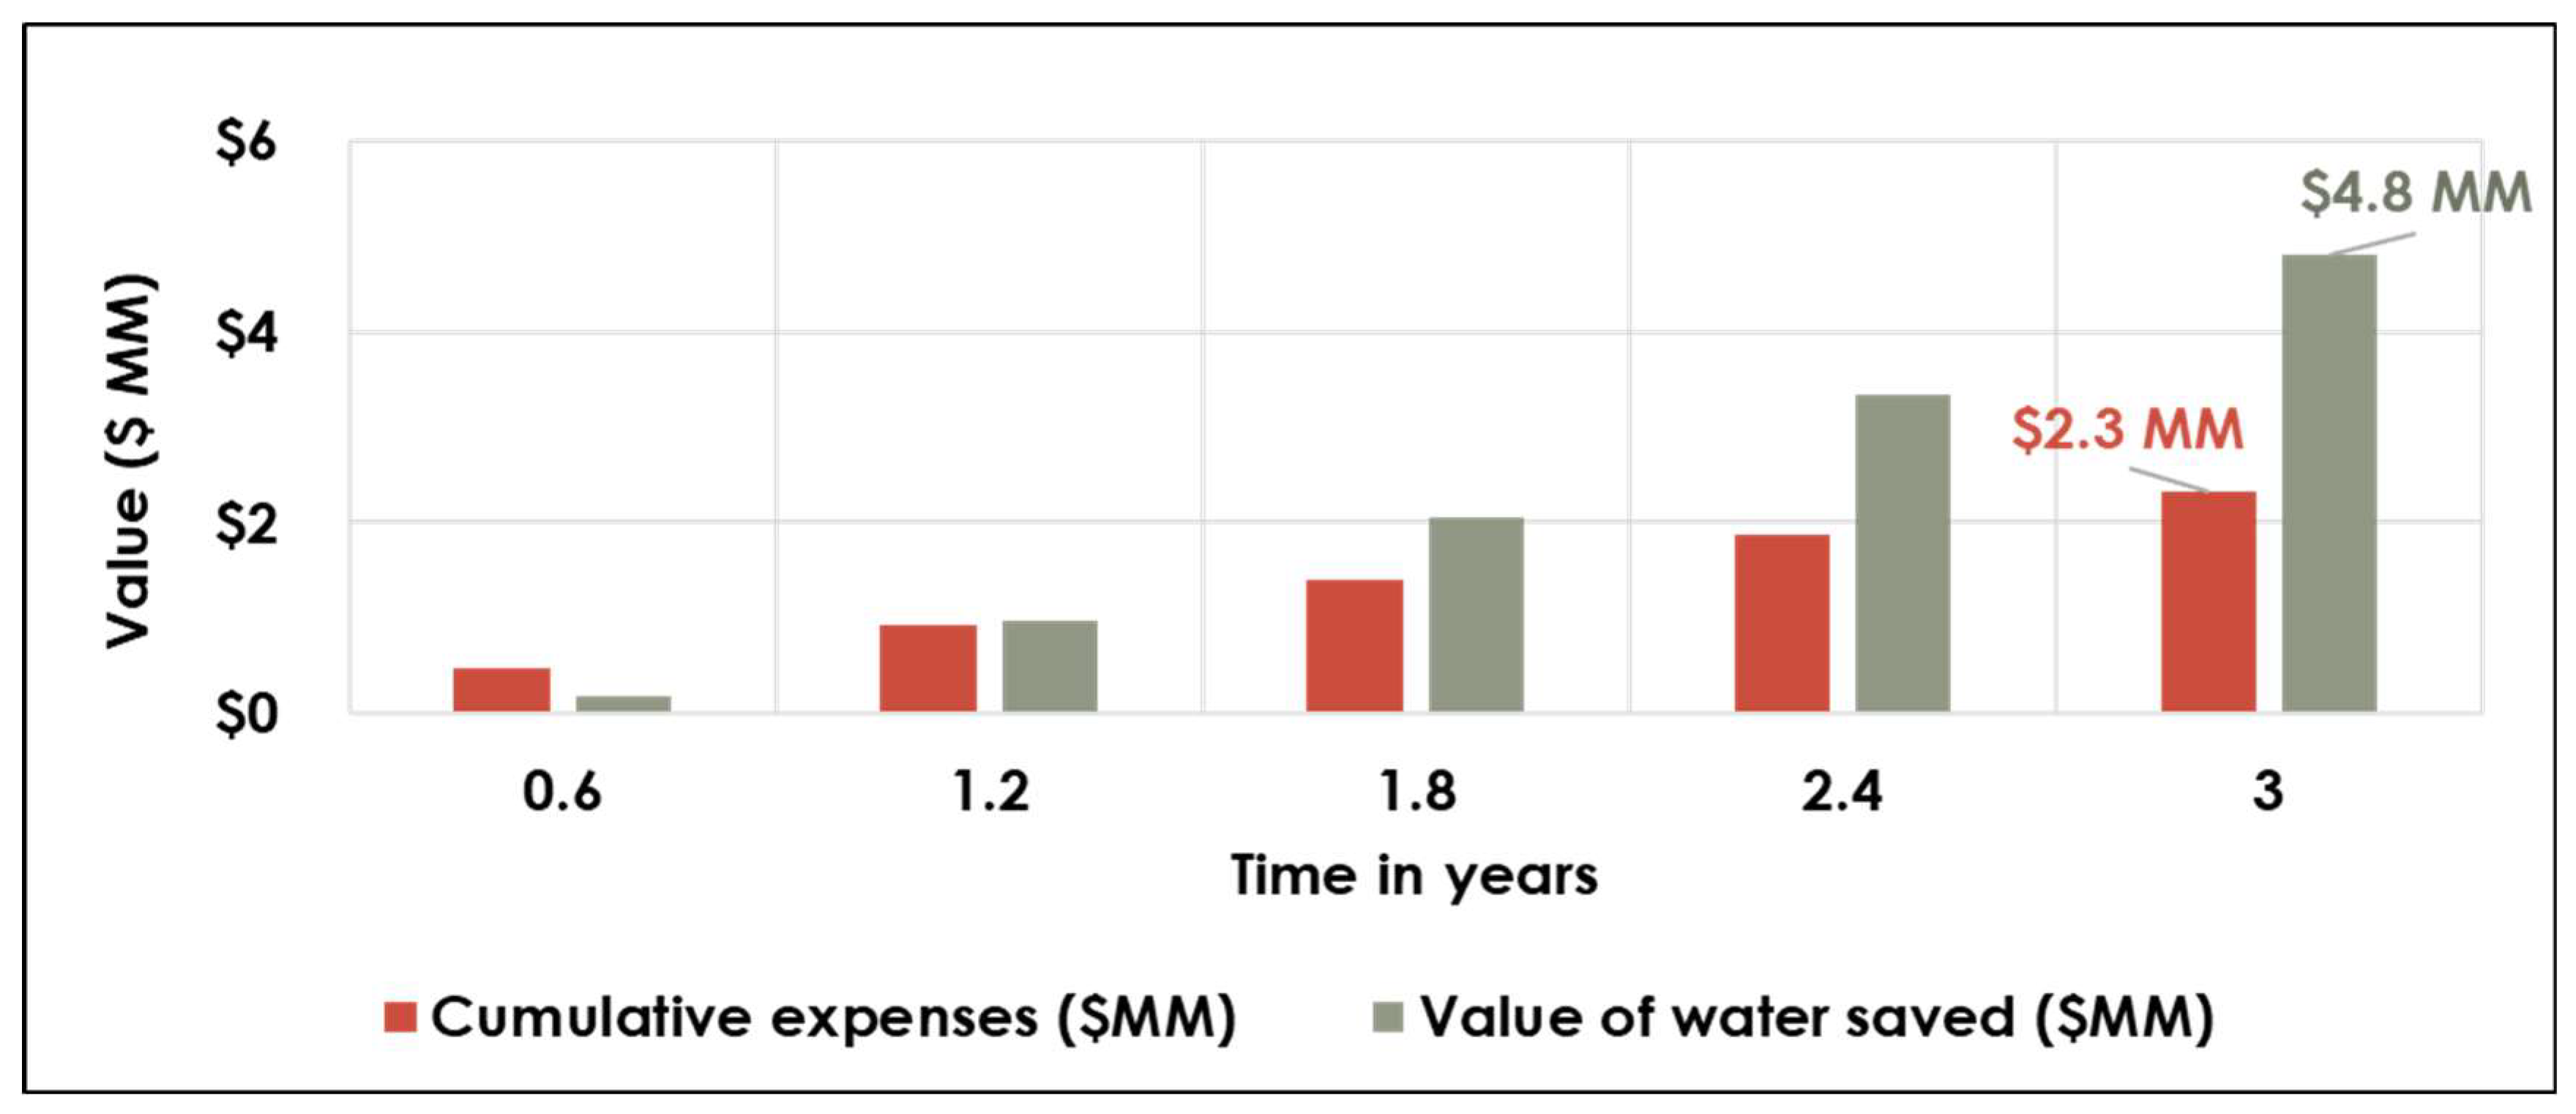
  • In a case study in Atlanta, Georgia, conventional acoustic leak detection was observed to be more cost-effective than AI-assisted satellite leak detection, generating USD 2.4 million in net benefits—50% higher than the satellite approach—over a 3-year period.
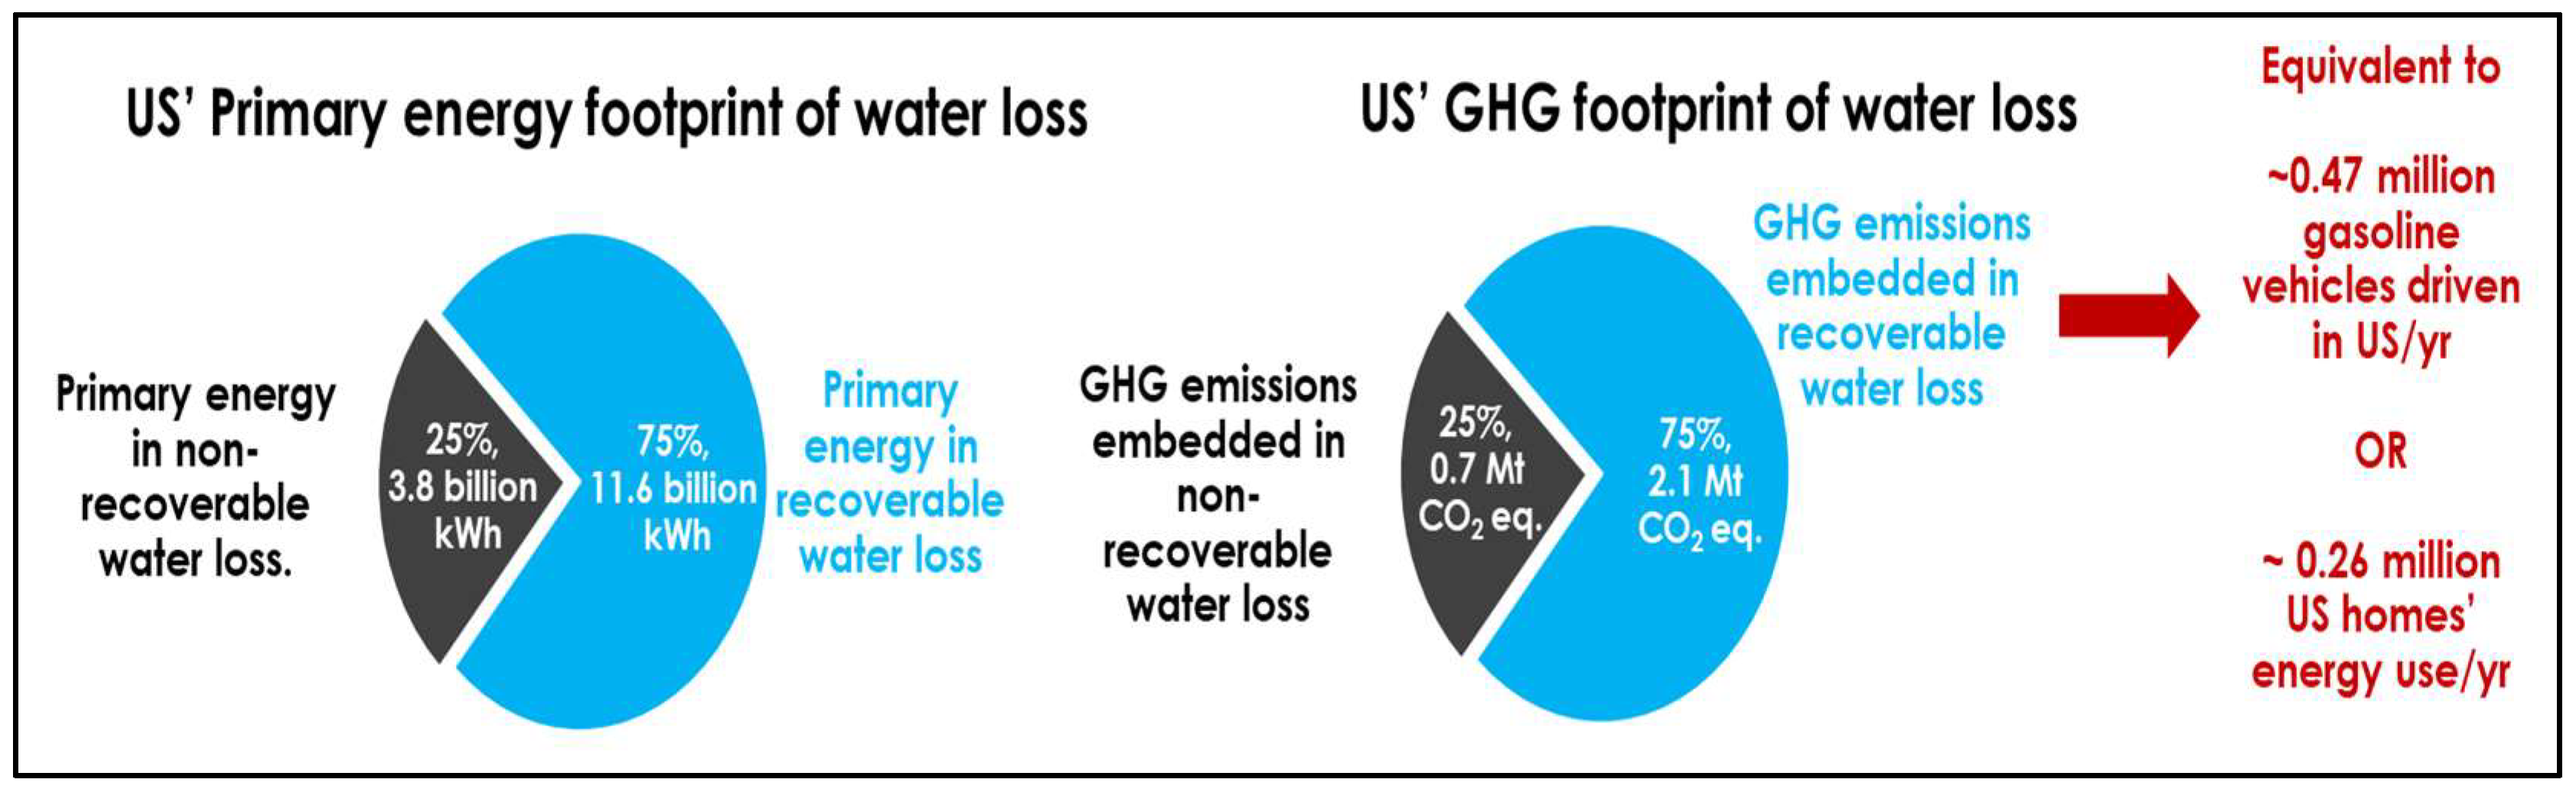
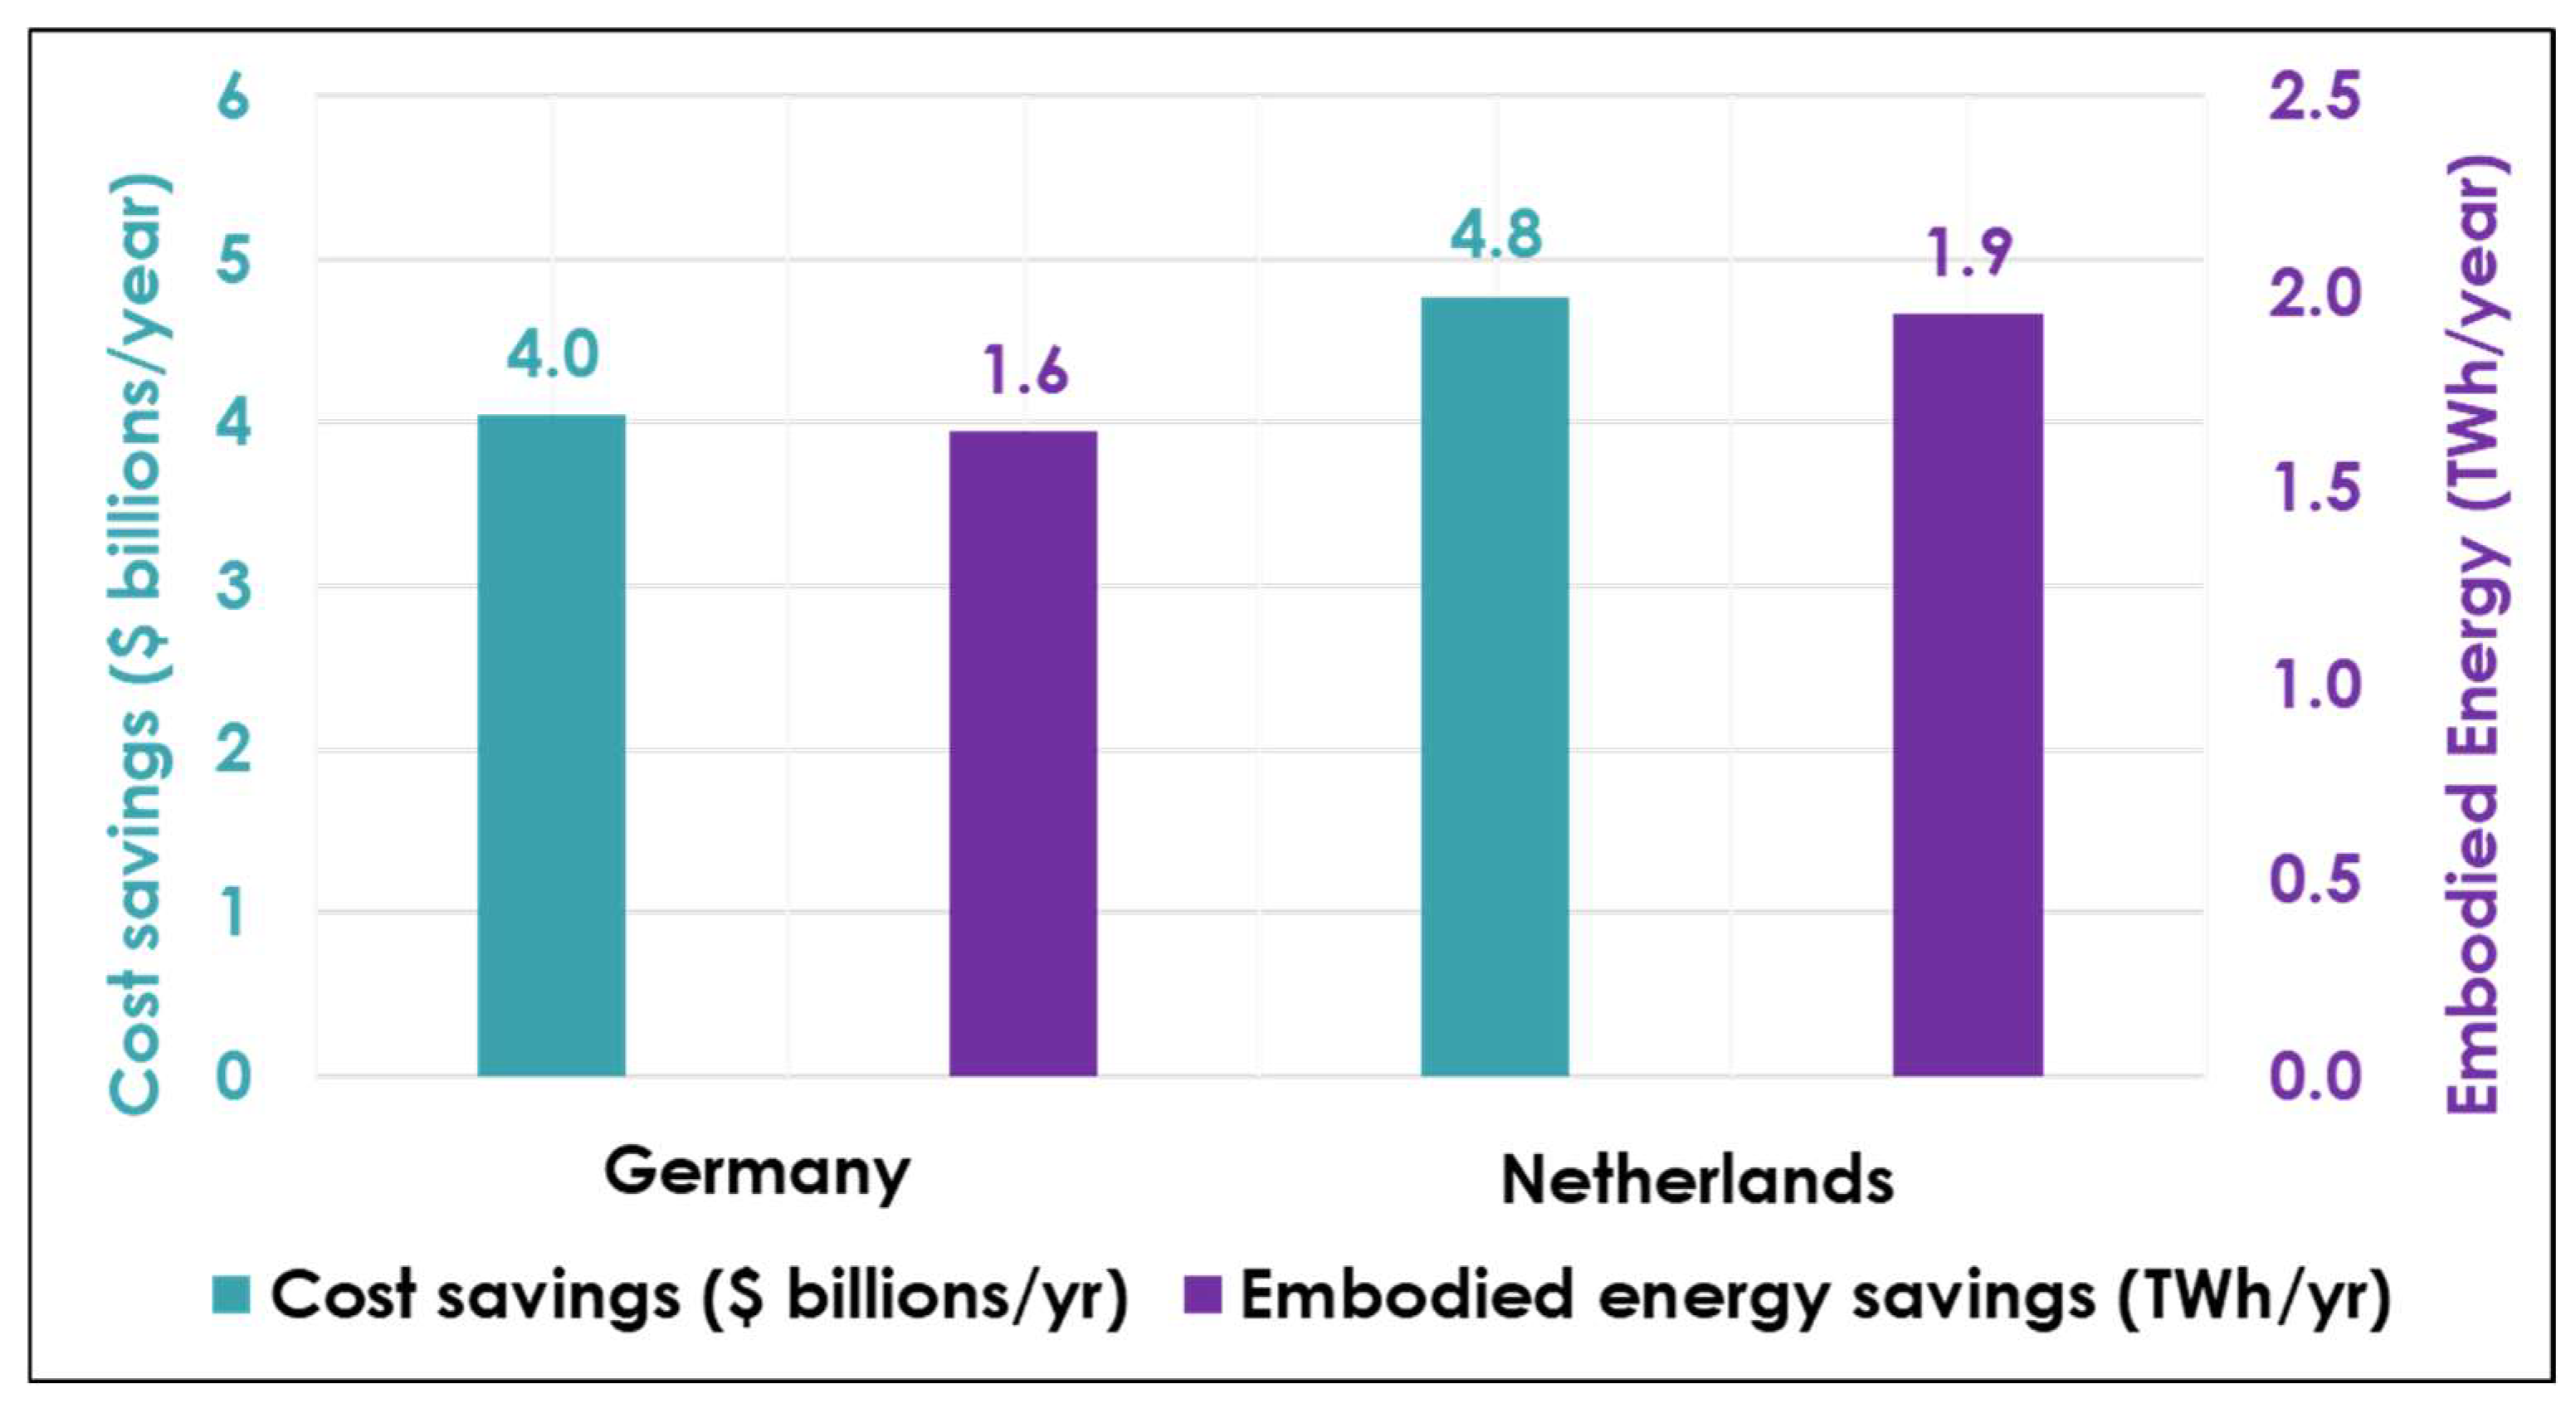
  • On a national level, preventing water loss may result in cost savings of USD 6.5 billion/year and achieve energy savings equivalent to 0.26 million US homes/year.
What is the implication of the main finding?
  • Smart sensing technologies should be evaluated carefully based on cost, scale, and deployment context; while AI/satellite tools are promising, conventional methods may still be cost-optimal in some cases.
  • Improvements in water infrastructure nationwide could significantly contribute to economic savings, energy efficiency, and smart living goals.

Abstract

The aging water distribution system in the United States, constructed mainly during the 1970s with some pipes dating back 125 years, is experiencing significant deterioration leading to substantial water losses. Along with the potential for water loss savings, improvements in the distribution system by using leak detection technologies can create net energy and cost savings. In this work, a new framework has been presented to calculate the economic level of leakage within water supply and distribution systems for two primary leak detection technologies (acoustic vs. satellite). In this work, a new framework is presented to calculate the economic level of leakage (ELL) within water supply and distribution systems to support smart infrastructure in smart cities. A case study focused using water audit data from Atlanta, Georgia, compared the costs of two leak mitigation technologies: conventional acoustic leak detection and artificial intelligence–assisted satellite leak detection technology, which employs machine learning algorithms to identify potential leak signatures from satellite imagery. The ELL results revealed that conducting one survey would be optimum for an acoustic survey, whereas the method suggested that it would be expensive to utilize satellite-based leak detection technology. However, results for cumulative financial analysis over a 3-year period for both technologies revealed both to be economically favorable with conventional acoustic leak detection technology generating higher net economic benefits of USD 2.4 million, surpassing satellite detection by 50%. A broader national analysis was conducted to explore the potential benefits of US water infrastructure mirroring the exemplary conditions of Germany and The Netherlands. Achieving similar infrastructure leakage index (ILI) values could result in annual cost savings of $4–$4.8 billion and primary energy savings of 1.6–1.9 TWh. These results demonstrate the value of combining economic modeling with advanced leak detection technologies to support sustainable, cost-efficient water infrastructure strategies in urban environments, contributing to more sustainable smart living outcomes.

1. Introduction

The United States (US) water infrastructure distributes approximately 71 billion gallons per day (BGD) of drinking water and wastewater through an extensive network of drinking water, wastewater and stormwater systems [1]. The US water infrastructure is aging and deteriorating. With the increasing emphasis on the need for a “replacement era”, the systems put in place in the early 19th and 20th century will be entering a phase of repairs and replacement of existing pipelines by 2030 [2]. The water lost between the treatment plant and the end-point customer is called non-revenue water (NRW). Nearly 16% of the treated drinking water supplies is currently lost due to ~250,000–300,000 water main breaks per year, with losses in the order of ~USD 7.6 billion [1,3]. Water losses in the systems are typically due to leakage on transmission and distribution mains, utility’s storage tanks and leakage on service connections as per the classification of American water works association [4]. US EPA estimates the need to spend USD 97 billion for water loss control in the form of time and financial resources by the water systems [1]. Water leaks are not a minor “engineering” nuisance; they are a compound urban risk that wastes scarce water, drains utility budgets, inflates energy and carbon footprints, threatens public health, and weakens the overall resilience of cities. Because the impacts propagate well beyond the water sector—into climate, health, transport and local economies—reducing Non-Revenue Water (NRW) is one of the highest-return investments most cities can make in their infrastructure portfolios [5].
Positively, up to 75% of the water currently lost due to poor infrastructure is recoverable [3] through efficient use of water loss control programs which involves an iterative process of (i) conducting a system-level water audit to determine flows; (ii) introducing intervention to meter, test, detect and fix the water loss causes; and (iii) evaluating the performance of the interventions applied and optimize the system accordingly. Assuming a water value of USD 0.004/gal, the US can achieve an annual financial savings of USD 6.5 billion/yr by conserving recoverable water loss (Figure 1). Water leak mitigation strategies within water loss control programs can assist not only in cost abatement but also add substantial savings in terms of reduced electricity usage thereby leading to greenhouse gas (GHG) emissions reduction. Stokes et al. note that water loss control technologies could abate ~135,000 Mg of GHGs in 20 years and provide save up to USD 130/Mg in cost savings per water system [6]. On a national scale, 34.6 billion kWh of electricity in the US was consumed via pumping and distribution of water in the public water supply distribution system [7]. Translating the potential for recoverable water loss savings, a primary energy savings of 11.6 billion kWh/yr (~0.26 million US homes’ energy use/yr) and GHG emissions avoidance of 2.1 million metric tons of CO2/yr (~CO2 emissions emitted by 0.47) could be achieved for the US (see Figure 1 and Figure 2). This significant primary energy and GHG avoidance benefits would be realized at the electricity grid as less energy would be needed to pump the water via the public distribution systems if the water leaks would be minimized.

1.1. Literature Review

1.1.1. Real Water Loss and Its Components

Real water losses refer to the actual losses of water from the system and consist of leakage from transmission and distribution mains, leakage and overflows from the water system’s storage tanks and leakage from service connections up to and including the meter [1].
As per the AWWA, the real water loss can be categorized into the following three types [4]:
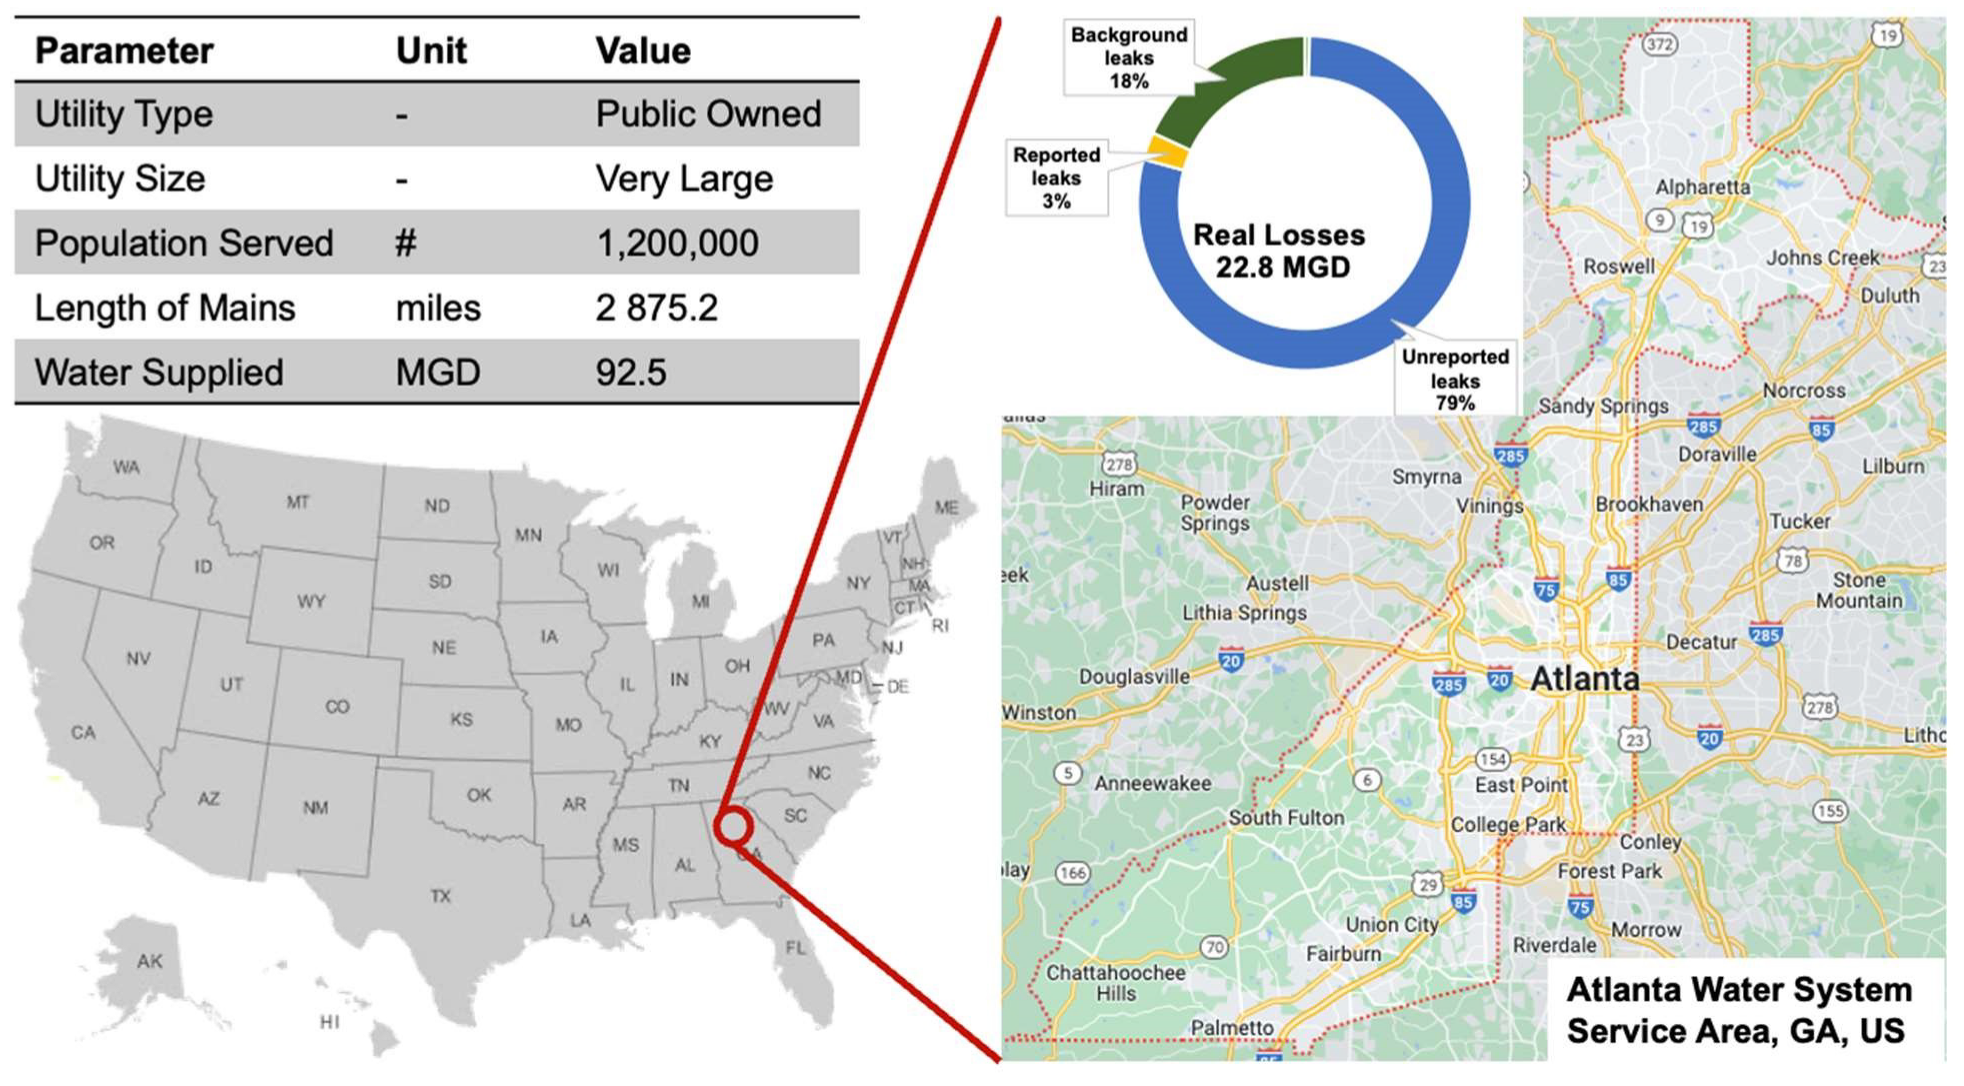
  • Background leaks: Water leaks occurring at low flow rates that cannot be detected via conventional acoustic leak detection equipment nor are visible above ground surface but can only be reduced via pressure management or replacement of pipes. Owing to their low leakage rates, background leaks are not a significant contributor of the amount of water being leaked through the distribution system.
  • Reported leaks: Highest water leakage rates of all three leakage types and easily visible above ground and therefore can be repaired and mitigated within a small typical duration of 3–8 days [9].
  • Unreported leaks: Water leakage rate lies between the values of reported and background leaks, but water quantity lost is higher owing to their low visibility above ground. These leaks have longer repair time and can be detected via acoustic leak detection technique.

1.1.2. Traditional Water Leak Detection Technologies

The water and wastewater industry deploys a multitude of leak detection technology devices such as acoustic, thermal imaging, fiber optics, advanced metering infrastructure with smart meters and satellites based on the operating considerations, utility size, cost and leak types [9]. The cost of individual devices varies from <USD 200 to >USD 20,000 depending on the size of the utility and the number of devices that will be needed to identify leaks. On the lower end of the cost (<USD 200 per device) spectrum and most widely deployed by small to medium size water utilities (serving 500–10,000 people) are the noise loggers and listening sticks that use acoustic signature of the leak to identify leaks. Noise loggers collect data within 100 to 300 ft intervals of each other within the pipeline, whereas the listening sticks are handheld devices used by highly trained technicians to detect acoustic signals of pipe leaks. This acoustic data is then later analyzed to pinpoint leakage points.

1.1.3. Advanced Water Leak Detection Technologies

On the high end of the cost spectrum (>USD 20,000) is satellite-based leak detection technique that uses synthetic aperture radar (SAR) and advanced AI algorithms to detect the leaks for buried (up to 12 ft) and surficial pipes. The satellite leak detection technology is an AI based technology that detects water leaks by identifying subsurface moisture anomalies using a platform that combines SAR and machine learning classifiers. The images captured by the radar are analyzed by proprietary AI algorithms and the most likely leak locations are then identified for subsequent on-field physical inspection. This narrows down the total mains pipe length to <20% of the total that needs to be physically inspected for water leaks resulting in ~80% lower survey time relative to conventional acoustic technique [10]. This method is typically deployed by large water systems (serving >10,000 people) owing to higher costs associated with additional steps of satellite image acquisition and image analysis. While conventional acoustic leak detection remains valuable for targeted, localized water leak identification, AI-assisted satellite leak detection represents a transformative leap for smart cities.
Smart sensor networks and real-time leak detection systems are playing a crucial role in water pipeline management. Smart sensor networks utilize IoT-enabled sensors to continuously track key parameters such as pressure, temperature, flow rate, and water quality throughout the system. These sensors provide utilities with real-time data that allow for immediate detection of drops in pressure or flow rate, which are indicative of water leaks. This immediate detection allows for quick response and repair, minimizing water loss and reducing operational service disruption [11].

1.1.4. Economic Models for Water Infrastructure

Although leaks in water distribution systems are prevalent and have established detection technologies, techno-economic analysis centered on mitigating water loss is scarce. Table 1 summarizes the limited available literature on economic models for water infrastructure. Rudimentary models for approximating the economic magnitude of water leakage within the system, as shown by Hardeman (2008) and Munoz-Truchoz, Smout and Kayaga (2019), coexist alongside a more intricate and all-encompassing model developed by the California Water Board (2022) [12,13,14].

1.2. Objectives and Scope

This paper aims to develop and validate an economic model to estimate the cost and energy savings associated with implementing leak detection techniques in the US water infrastructure. This is performed to address the need for quantifying the savings to emphasize the importance of improved water distribution system. Because utilities may deploy a wide range of leak detection methods, ranging from low-cost acoustic to high-cost advanced satellite-based imaging; to estimate the least and maximum possible savings, a comparative analysis of acoustic vs. satellite-based leak detection method is conducted.
Specifically, the model is also used to estimate the optimum number of surveys to be performed to achieve the maximum economic benefit at the point of economic level of leakage. In addition, the work explores the impact of uncertainty in leak reduction efficiency (%), survey detection cost ($/mile) and variable production water ($/million gallon) on the economic level of leakage. A regional analysis is conducted to estimate the savings on a water utility scale and is then expanded to a national scale to identify the merits of an improved water infrastructure and its accompanying policy implications. Results and discussion from this study are intended to emphasize the need for proactively developing the water leak mitigation strategies in the wake of future climate and water-constrained scenarios.

2. Methodology

2.1. Case Study Description and Data Sources

A water leakage case study has been presented for Atlanta Water System, a very large public water utility serving a population of ~1.2 million in the Fulton County, Georgia (GA), US (Figure 3). This utility was chosen because of having one of the highest real water losses in the state accounting for ~8350 MG of water lost in 2020. Publicly available information from the utility’s 2020 water audit report [15] was used to obtain information water quantity balance sheets (imports, exports, metered, billed, consumption, apparent and real water losses); pipeline mains and service connections; and operational costs of the water distribution system.
There was a lack of granularity in the annual water audit to estimate the detailed background, reported and unreported leaks owing to expensive measurements. Thus, existing values in the American Water Works Association (AWWA)’s M36 water audit manual (Table 2) was used to estimate the individual components of real water losses [4]. Of the total 92.5 MGD water supplied, 25% is lost due to real water losses. Furthermore, of the real water losses of 22.8 MGD, 79% was attributed to unreported leaks, 18% to background leaks and 3% to reported leaks. Recognizing the significant contribution of unreported water leaks to the overall real water loss, this study was focused on technologies solely on mitigating the unreported component of real water loss via acoustic and satellite-based water leak detection technologies.

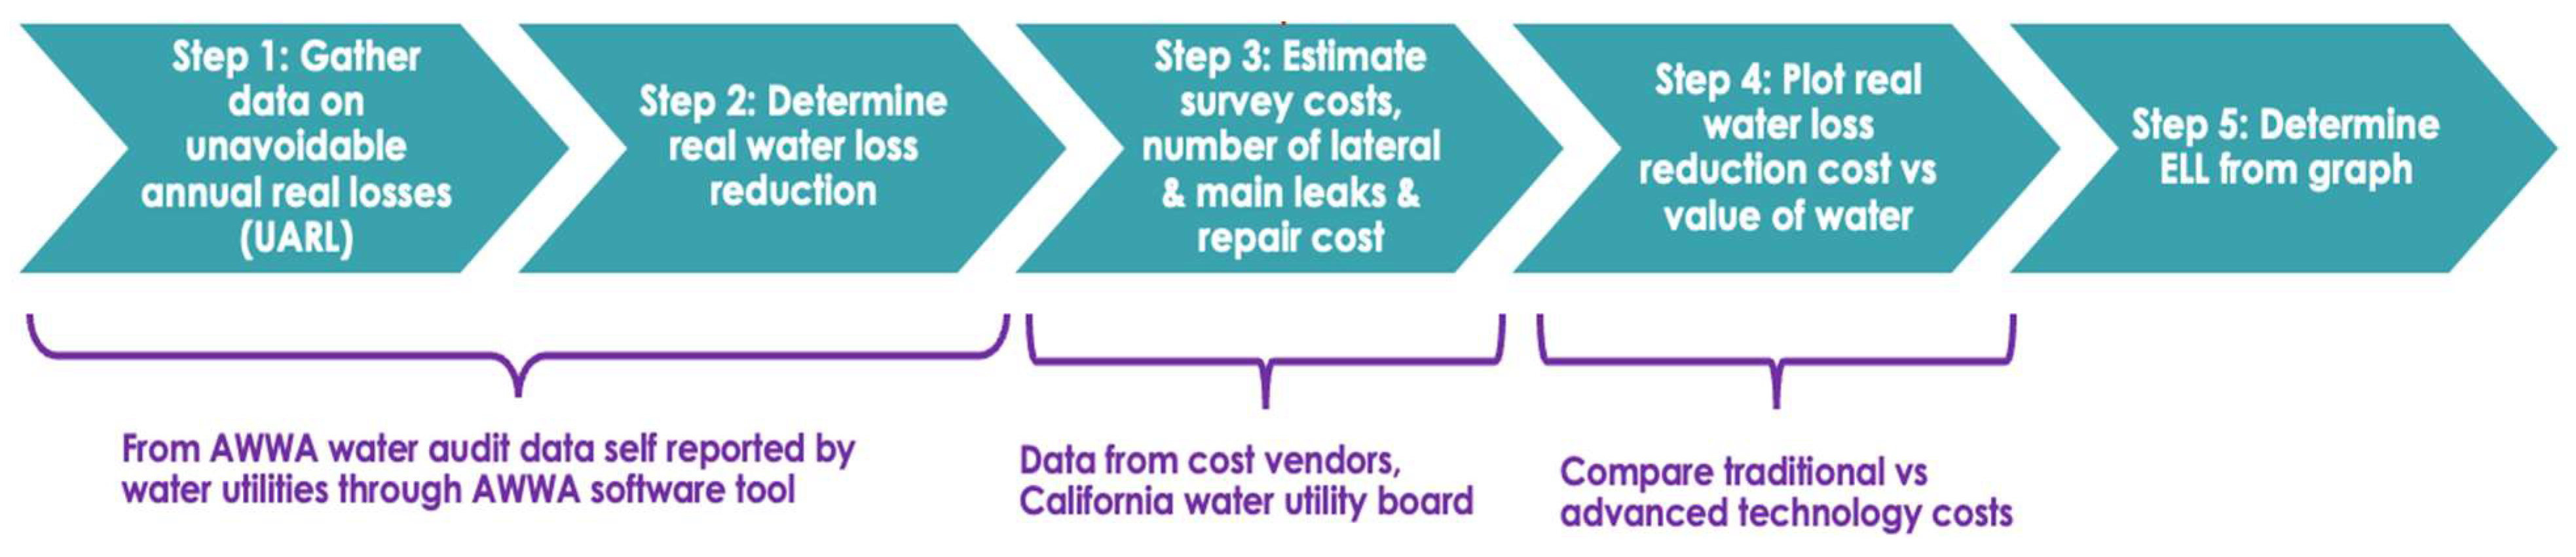
2.2. Economic Analysis Methodology to Mitigate Unreported Water Leaks

Figure 4 describes the new methodology to estimate the economic level of leakage to compare the costs of two technology options for mitigating water leaks—the conventional pipe leak detection method (acoustic leak detection) against the advanced leak detection method (satellite leak detection). In addition, the developed cost assessment methodology estimates the water loss reduction, infrastructure leakage index (ILI) and optimum number of surveys needed to reduce the real water loss reduction in water distribution and supply systems. The proposed methodology performs the economic analysis only based on the service connections and mains pipelines in the water distribution network and excludes other water leakage sources such as water hydrants and household plumbing leaks. Because the proposed methodology calculates cost based on literature and different vendor estimates for the assumed two technology types—acoustic and satellite leak detection, the methodology used is translatable to any water system and therefore easily reproducible. Section 2.2.1, Section 2.2.2 and Section 2.2.3 detail the stepwise model calculations as shown in Figure 4.

2.2.1. Data Collection

In the first step of the analysis, data pertaining to water leaks were gathered from water audit dataset for Atlanta, Georgia. The water audit data-gathering process was analogous to a financial auditing process that tracks the water volumes entering the distribution system as well as the water losses occurring in the system as per the standardized methodology developed by AWWA and the International Water Association (IWA) [4].

2.2.2. Estimation of Water Loss Reduction and Infrastructure Leakage Index (ILI)

In the second step, the potential real water loss reduction was estimated based on its sensitivity to the number of water leak detection surveys conducted. The higher the number of surveys conducted; the larger the amount of water leakage is reduced. In this work, it was assumed that each survey mitigates nearly 70% of the recoverable real water losses as shown by Equation (1) [13]:
R t = R o 1 k s + U A R L ,
where R ( t ) is the remaining recoverable real water loss (million gal/day); k = 0.70, representing 70% of recoverable water loss reduction per survey; s is the number of surveys; R o is the current annual real losses (CARL, million gal/day); and UARL is unavoidable annual real losses (million gal/day). After estimating the amount of recoverable water loss, the economic benefits of saving water were estimated based on the assumed unit cost of water (USD/gal).
The unit cost of water can be valued via two different metrics, namely the customer retail price and the variable production cost of water. The end-use customer typically paid a water rate of $0.004/gal–$0.018/gal in the United States in 2020 [17]. However, the variable production cost of water is the cost required to produce one additional gallon of water and comprises the expenses incurred because of purchased electricity, chemicals, residuals disposal, etc. In comparison to retail unit cost, the variable production unit cost is typically used to estimate the economic value of real water loss. In this work, the variable production unit cost of water was used to estimate the economic value of water loss, which was calculated using the following equation:
Economic   value   of   water   loss $ year = Variable   production   unit   cost   of   water $ gal × Volume   of   real   water   loss gal year .
The ILI values were calculated before and after the water leak reduction surveys were implemented. ILI is a widely used performance indicator of real water loss within the system and was developed by the IWA Water Loss Task Force (WLTF) in 1999. It is a ratio of actual real losses to minimum real losses and can be calculated using the following formula [18]:
Infrastructure   leakage   index ILI = Current   annual   real   water   loss CARL Unavoidable   annual   real   water   loss UARL .

2.2.3. Estimation of Water Survey and Repair Costs

Projected expenses related to water survey and repair were computed for both conventional acoustic leak detection and cutting-edge satellite-based leak detection methodologies, relying upon the presumptions outlined within Table 3. Notably, a significant proportion of previous scholarly investigations, exemplified by Hardeman (2008) and Munoz-Truchoz, Smout, and Kayaga (2019), display a deficiency in cost differentiation between mains distribution lines and lateral leaks [12,13]. These studies operated under a combined model that amalgamated survey and repair costs. This limitation of prior research is effectively addressed in the present study, wherein a segregated calculation of repair costs for primary distribution lines and lateral leaks was performed, reflective of their individual cost intensities as delineated within Table 3.
Repair costs may vary considerably between the mains pipe and the lateral pipe connections owing to different pipe sizes. For instance, the diameter of a mains pipe can be 8–10 in., whereas that of a lateral pipe is only 1 in., which can significantly affect repair costs. Therefore, this study assumed the lateral repair costs to be twice those of service connection repairs (Table 3) as reported by the California State Water Board (2022) based on data on actual repairs conducted [14]. Because actual data for the number of leaks were not reported for Atlanta through the AWWA water audit, the values reported by the California State Water Board were used (Table 3). After every survey, it was assumed that 70% of mains and lateral leaks were repaired, achieving 70% water leak reduction [14].

2.3. Estimation of Economic Leakage Level of Water

The main objective of the present analysis was to estimate the ELL for the acoustic leak detection technique and the novel satellite leak detection technique. Given a leak detection technique, the ELL point aids in the analysis of economic feasibility through the estimation of leak detection technique expenses and compares them against the economic benefits of water being saved by the implementation of the leak detection technique. The ELL is a point at which the sum of the costs of leak detection, repairs, and water loss is at its minimum value as indicated by the following formula [12]:
Economic   level   of   leakage ELL $ day = Min . Leak   detection   technique   cost $ day + Repair   cost $ day + Value   of   water   being   lost $ day
The ELL is unique to each leak detection technique, and the ELL curve follows a law of diminishing returns. At 100% leak reduction in the water pipe distribution system, the leak detection survey and repair costs typically become prohibitively expensive and eclipse the cost benefits of water being saved. Conversely, at 0% leak reduction, the value of real water being lost can be significant, and therefore, a certain amount of leak detection would be needed to achieve a net economic benefit. The ELL tracks the optimum amount of leak detection needed to achieve cost benefits associated with mitigating real water loss. The goal of this proposed analysis was to determine the number of surveys required at the point of ELL for conventional acoustic leak detection as well as the advanced satellite leak detection technique.

2.4. Uncertainty Analysis of Conventional Acoustic Leak Detection Technology and Advanced Satellite Leak Detection Technology

As with all other typical economic analyses, there is considerable uncertainty in the cost inputs assumed in determining the ELL values for the conventional acoustic leak detection technique and for advanced satellite leak detection technology. For instance, as stated earlier, the leak surveying efficiency can be 98–99%, whereas the leak-pinpointing efficiency can be 50–92% [14]. Furthermore, as per vendor quotes from different companies, the leak detection cost may be as low as $177/mile or could be high as USD 386/mile [14]. Therefore, it was necessary to perform uncertainty analyses for conventional acoustic leak detection and for advanced satellite leak detection to analyze the impact of input parameters on the ELLs. In this work, Monte Carlo simulation was chosen as the method to perform uncertainty analysis because of its wide applicability to economic analysis as shown in the literature [20,21].
Furthermore, the survey time can typically be 2–5 years, depending on the length of mains pipe scanned. For the present model, the survey time was assumed to be 3 years owing to the mains pipe length of 2875 mi. For a conventional survey (acoustic) a value of $595/mi of mains pipe length was assumed [14]. For the satellite-based leak detection method, the total survey cost is 2× that of the conventional method and was assumed to be USD 1024/mi for this analysis [15]. In the first step of the Monte Carlo analysis, the major cost input parameters were identified, which were leak reduction efficiency (%), survey detection cost (USD/mi), and variable production cost of water (USD/million gal) for the conventional acoustic leak detection technique and advanced satellite leak detection technique as stated in Table 3. In the second step, probability distributions were assigned to each of the identified parameters. In this work, triangular probability distributions were assigned to the identified input cost parameters based on the knowledge of the maximum and minimum values of the input cost parameters because triangular distributions have been widely utilized for cost uncertainty analyses [22]. Three output parameters that were analyzed were the number of surveys at the ELL, the value of water loss, and survey and repair costs. A total of 10,000 simulation runs were performed to generate the output parameters’ probability distribution curves [23]. The parameters used for Monte Carlo uncertainty analysis have not been shown here but are present in the SID.

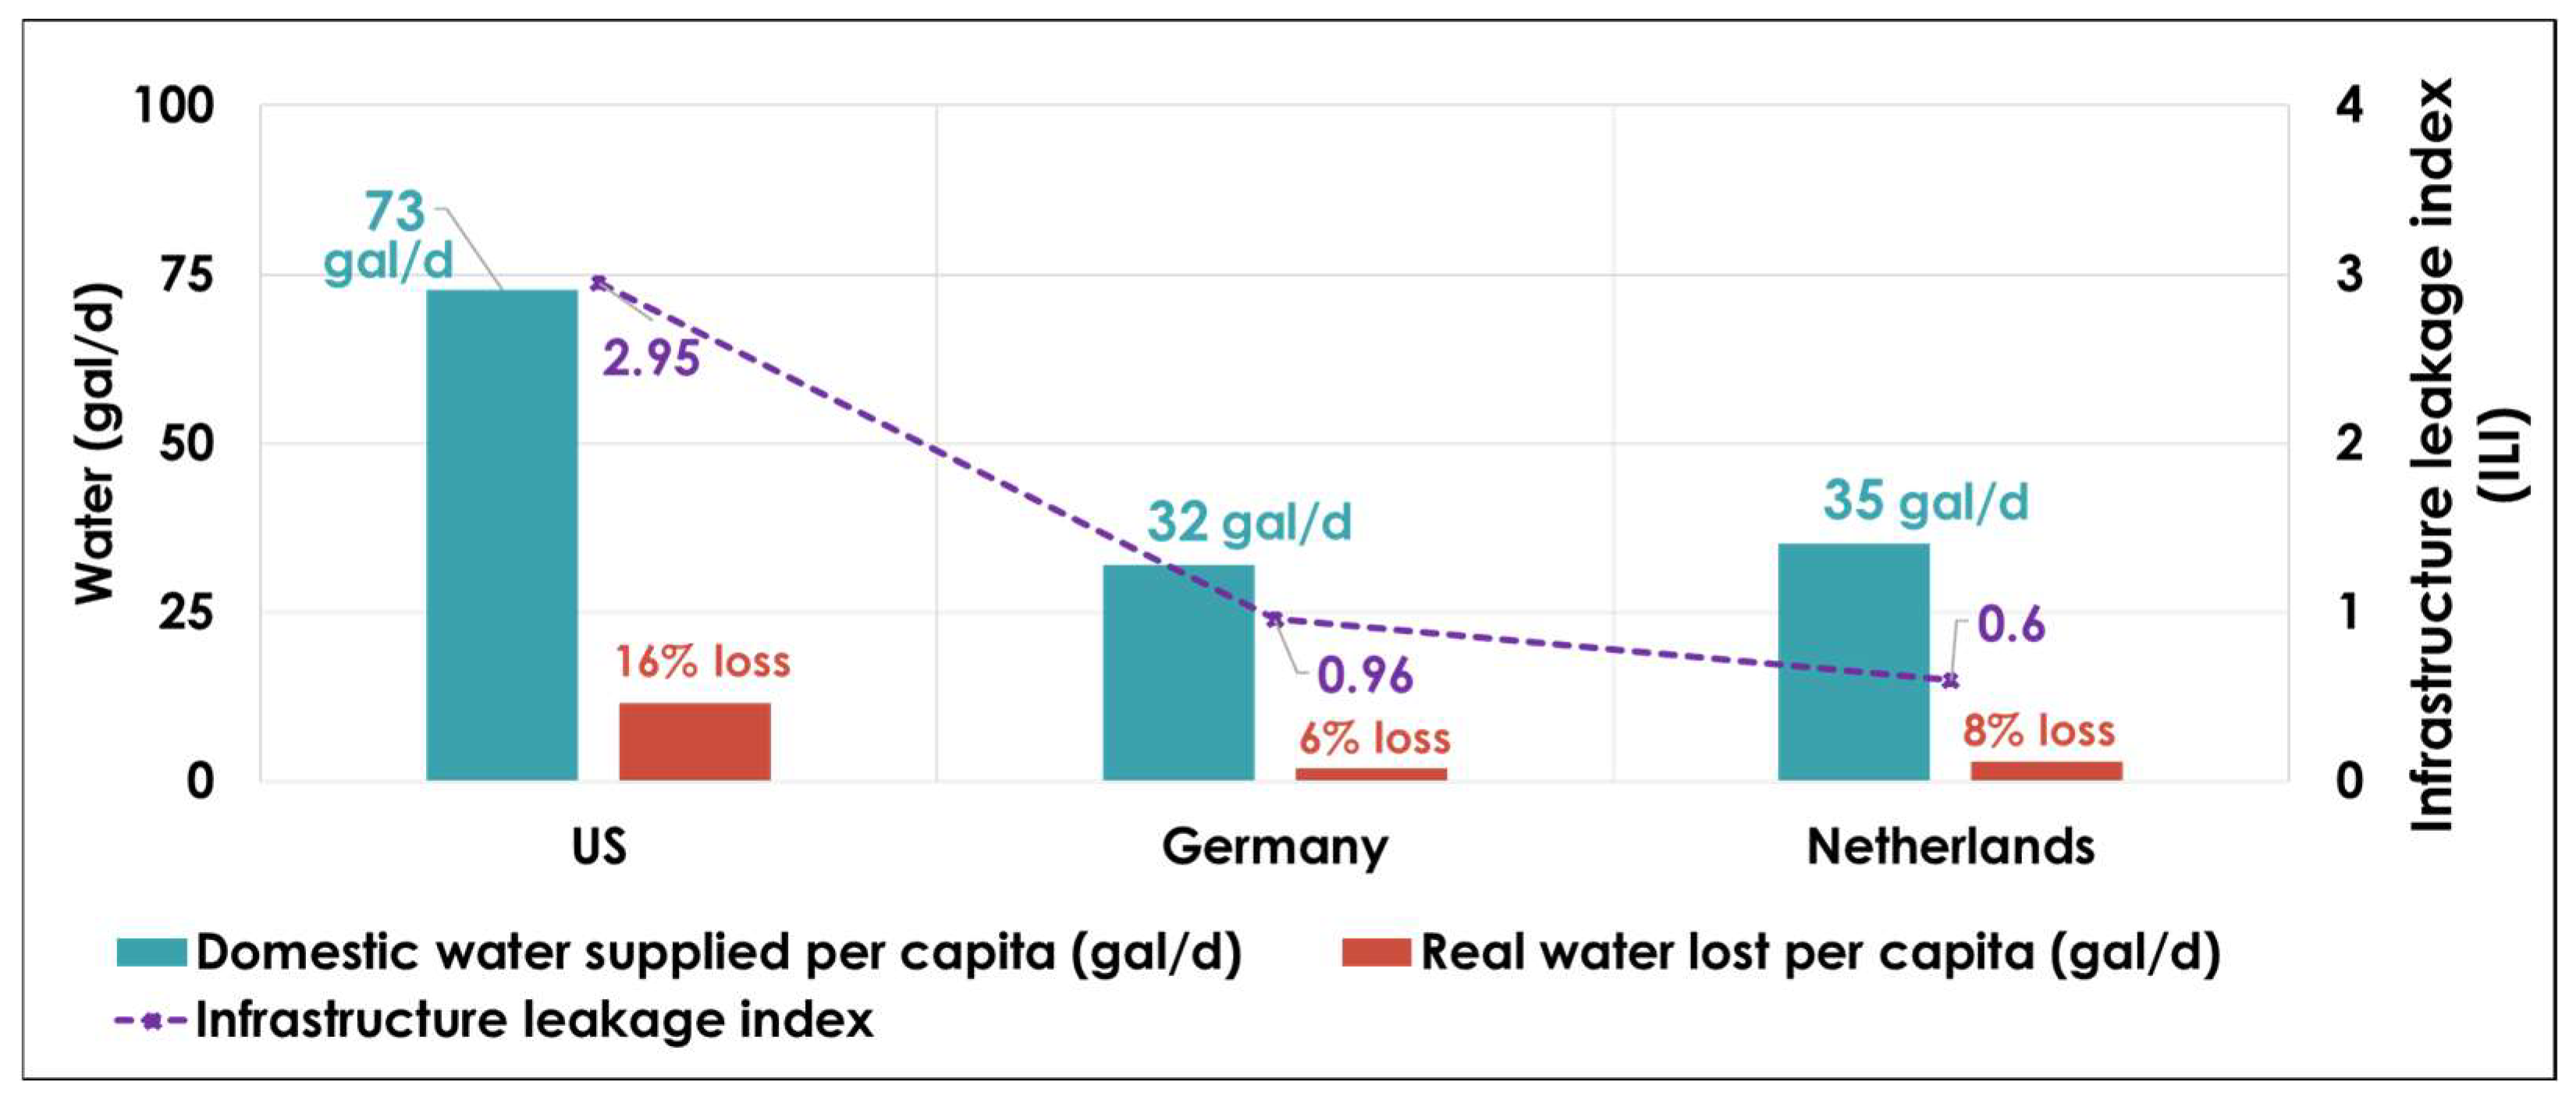
2.5. Domestic Comparison of US Water Loss Against Germany and The Netherlands with Financial and Embodied Energy Savings

After performing the economic analysis for the Atlanta water utility, a national-level analysis was also performed to examine and compare US water infrastructure with other nations such as Germany and The Netherlands for 2015, which was chosen as the reference year because of the availability of the most recent US national dataset on water use, as provided by the USGS. Germany and The Netherlands were selected as reference countries because of the superior condition of their domestic water infrastructure, as evidenced by low values of ILI and real water loss, as depicted in Figure 5. US real water loss was nearly twice as that of Germany or The Netherlands in 2015, and the ILI values of those countries, on average, were nearly one third that of the United States (Figure 5).
Given recent media reports highlighting the deterioration of US water infrastructure [29,30], this analysis aims to assess the financial and embodied energy benefits that could be attained if the United States were to possess a domestic water supply infrastructure comparable to that of Germany or The Netherlands. To estimate the economic benefits of water being saved, a variable production cost factor of USD 0.004/gal was assumed [17] and an embodied energy intensity of 1900 kWh/gal of water was assumed [31]. Embodied energy, also commonly called primary energy, is defined as the cumulative energy associated directly or indirectly with the delivery of a good or service. In this work, the embodied energy includes the energy needed for water’s extraction, conveyance, treatment, and distribution through the supply systems and excludes the energy required for wastewater collection, treatment, and discharge systems. It should be noted that these factors may considerably differ with respect to different US states exhibiting sensitivity to geographic location. However, for a holistic nationwide analysis, the assumed values noted above help provide an estimate of the national average. The following formulas were used to calculate the financial and embodied energy savings of the United States [28]:
A n n u a l   f i n a n c i a l   s a v i n g s   o f   U S $ y e a r = ( I L I U S I L I G e r m a n y   o r   N e t h e r l a n d s ) I L I U S × R e a l   w a t e r   l o s t   p e r   c a p i t a   i n   U S g a l d a y × 365   × P o p u l a t i o n   o f   U S   i n   2015   ×   V a r i a b l e   p r o d u c t i o n   c o s t   o f   w a t e r $ g a l
A n n u a l   e m b o d i e d   e n e r g y   s a v i n g s   o f   U S k W h y e a r = P e r   c a p i t a   w a t e r   s a v i n g s   o f   U S g a l d a y × E m b o d i e d   e n e r g y   i n t e n s i t y   o f   w a t e r k W h g a l × o p u l a t i o n   o f   U S   i n   2015   ×   365

3. Results and Discussion

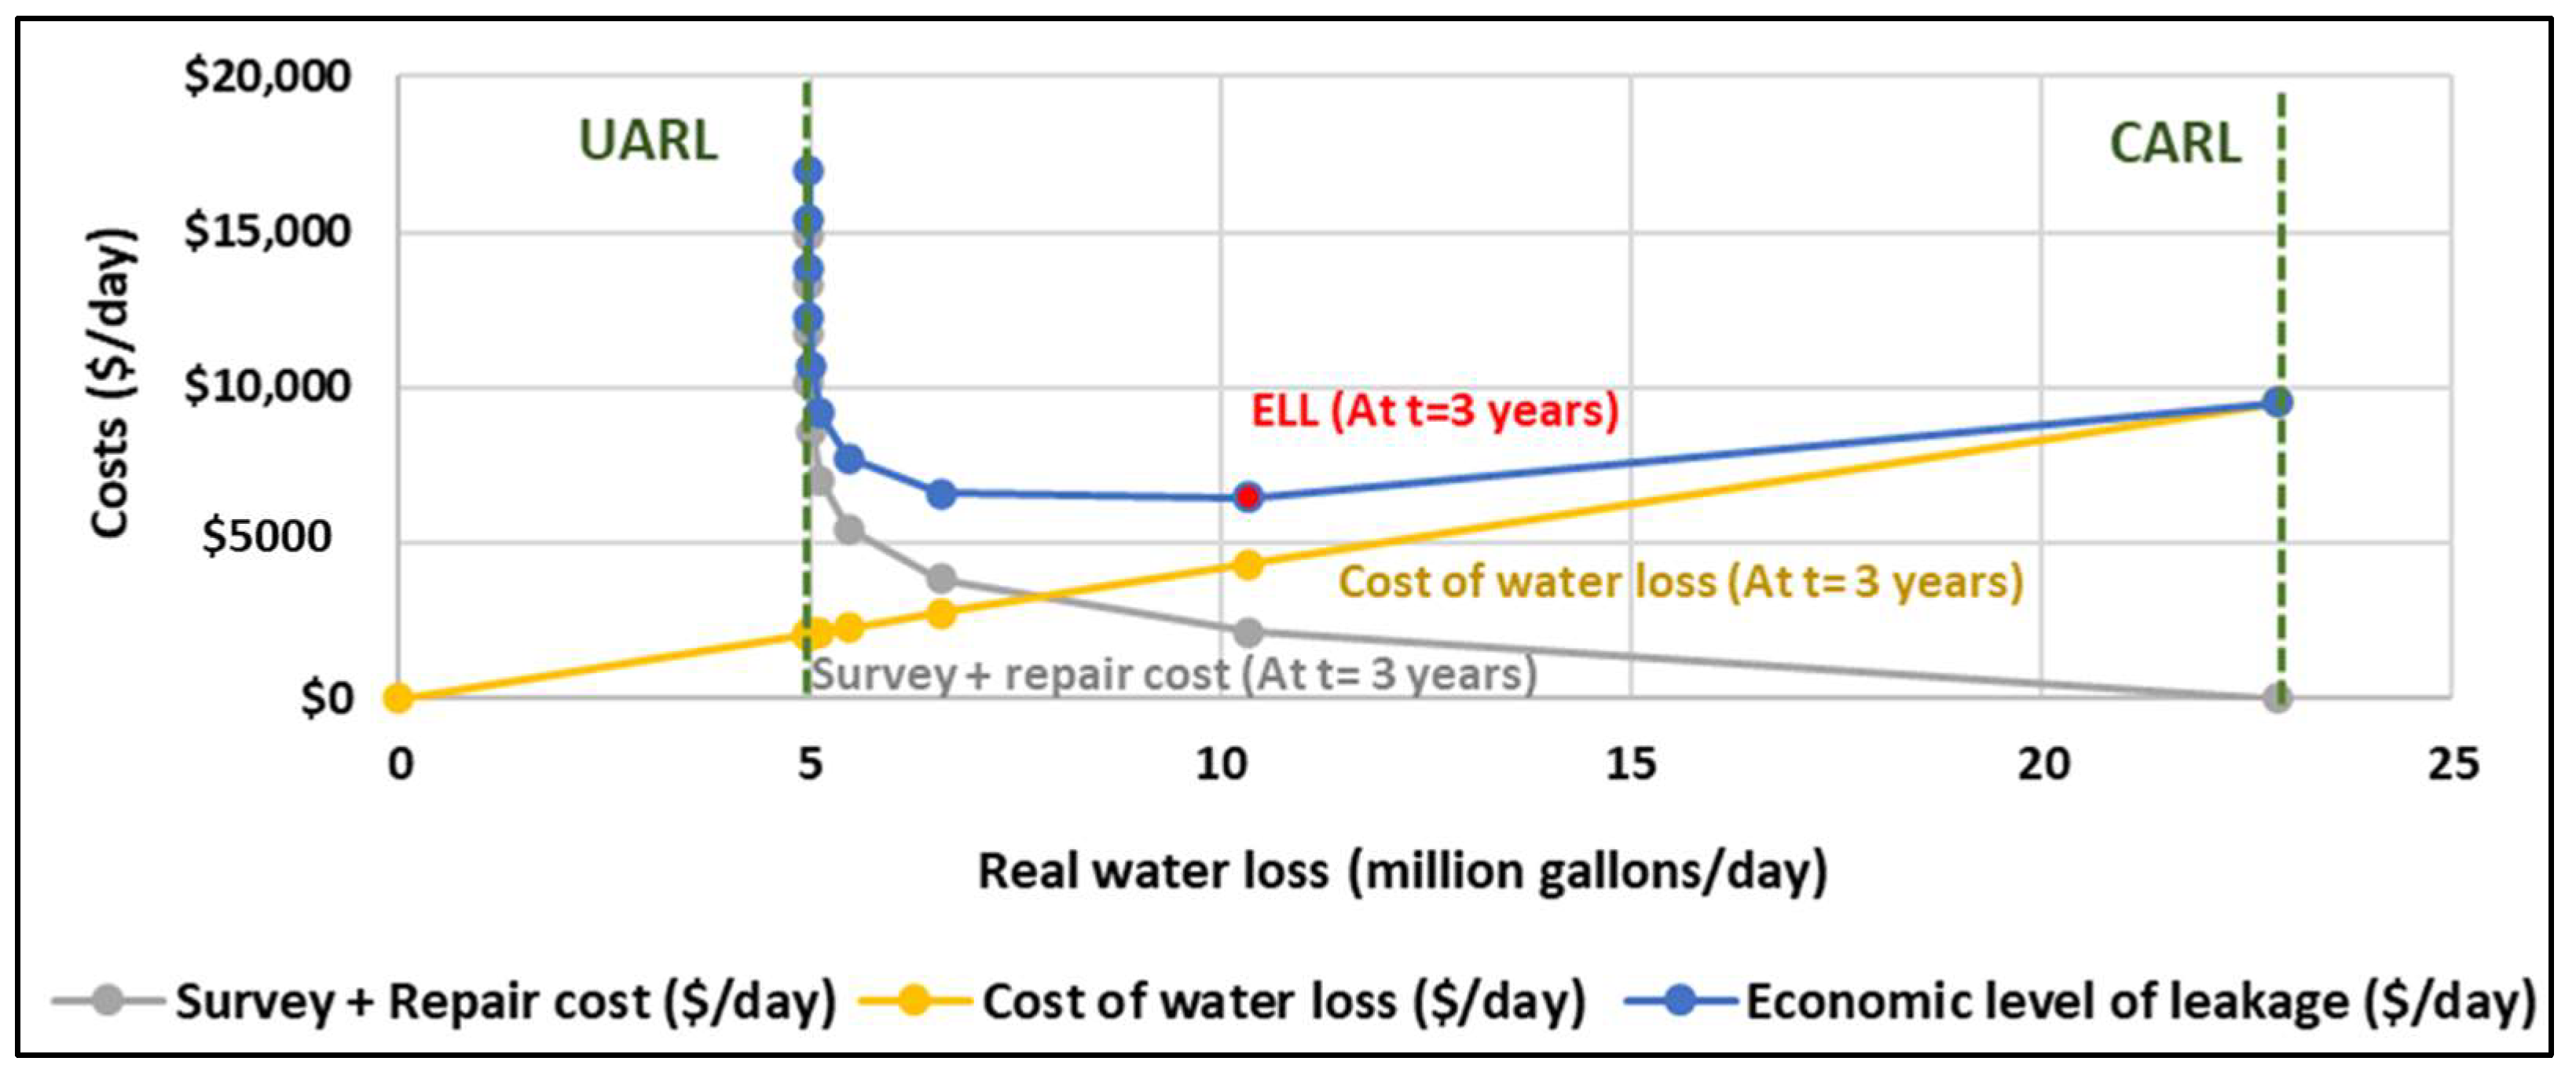
3.1. Estimation of Economic Level of Leakage for Conventional Acoustic Leak Detection Technology

The ELL was observed to occur at the point of first survey for the conventional acoustic leak detection technology. For the conventional acoustic leak detection technique, the total costs at ELL were estimated to be USD 6443/day after the first survey as shown in Figure 6. At two surveys, the total costs rose by only 2% to USD 6610/day, suggesting that conducting two acoustic leak detection surveys instead of one survey may also be an economically viable option. However, conducting three or four acoustic leak detection surveys increased costs by 20% and 43%, respectively, from the first survey value, suggesting more than two surveys may not be economically viable.
Figure 6 also shows that even though more water leaks are identified and mitigated by increasing the number of surveys, the cost of identifying and repairing those leaks offer very little economic incentive in terms of water being saved. The largest economic benefit of water being saved (USD 5220/day) was realized after conducting the first survey. After the second survey, the additional economic benefit from water saved was only USD 1566/day, and a third survey further decreased the benefit to USD 470/day. Therefore, increasing the number of surveys may not generate significant economic incentives in terms of water being saved, thereby exhibiting a law of diminishing returns. Conducting additional water leak detection surveys considerably increases the expenses linearly as revealed by the cost analysis and Figure 6; the first survey increased expenditure by USD 2131/day, and each additional survey increased cost linearly by USD 1611/day.

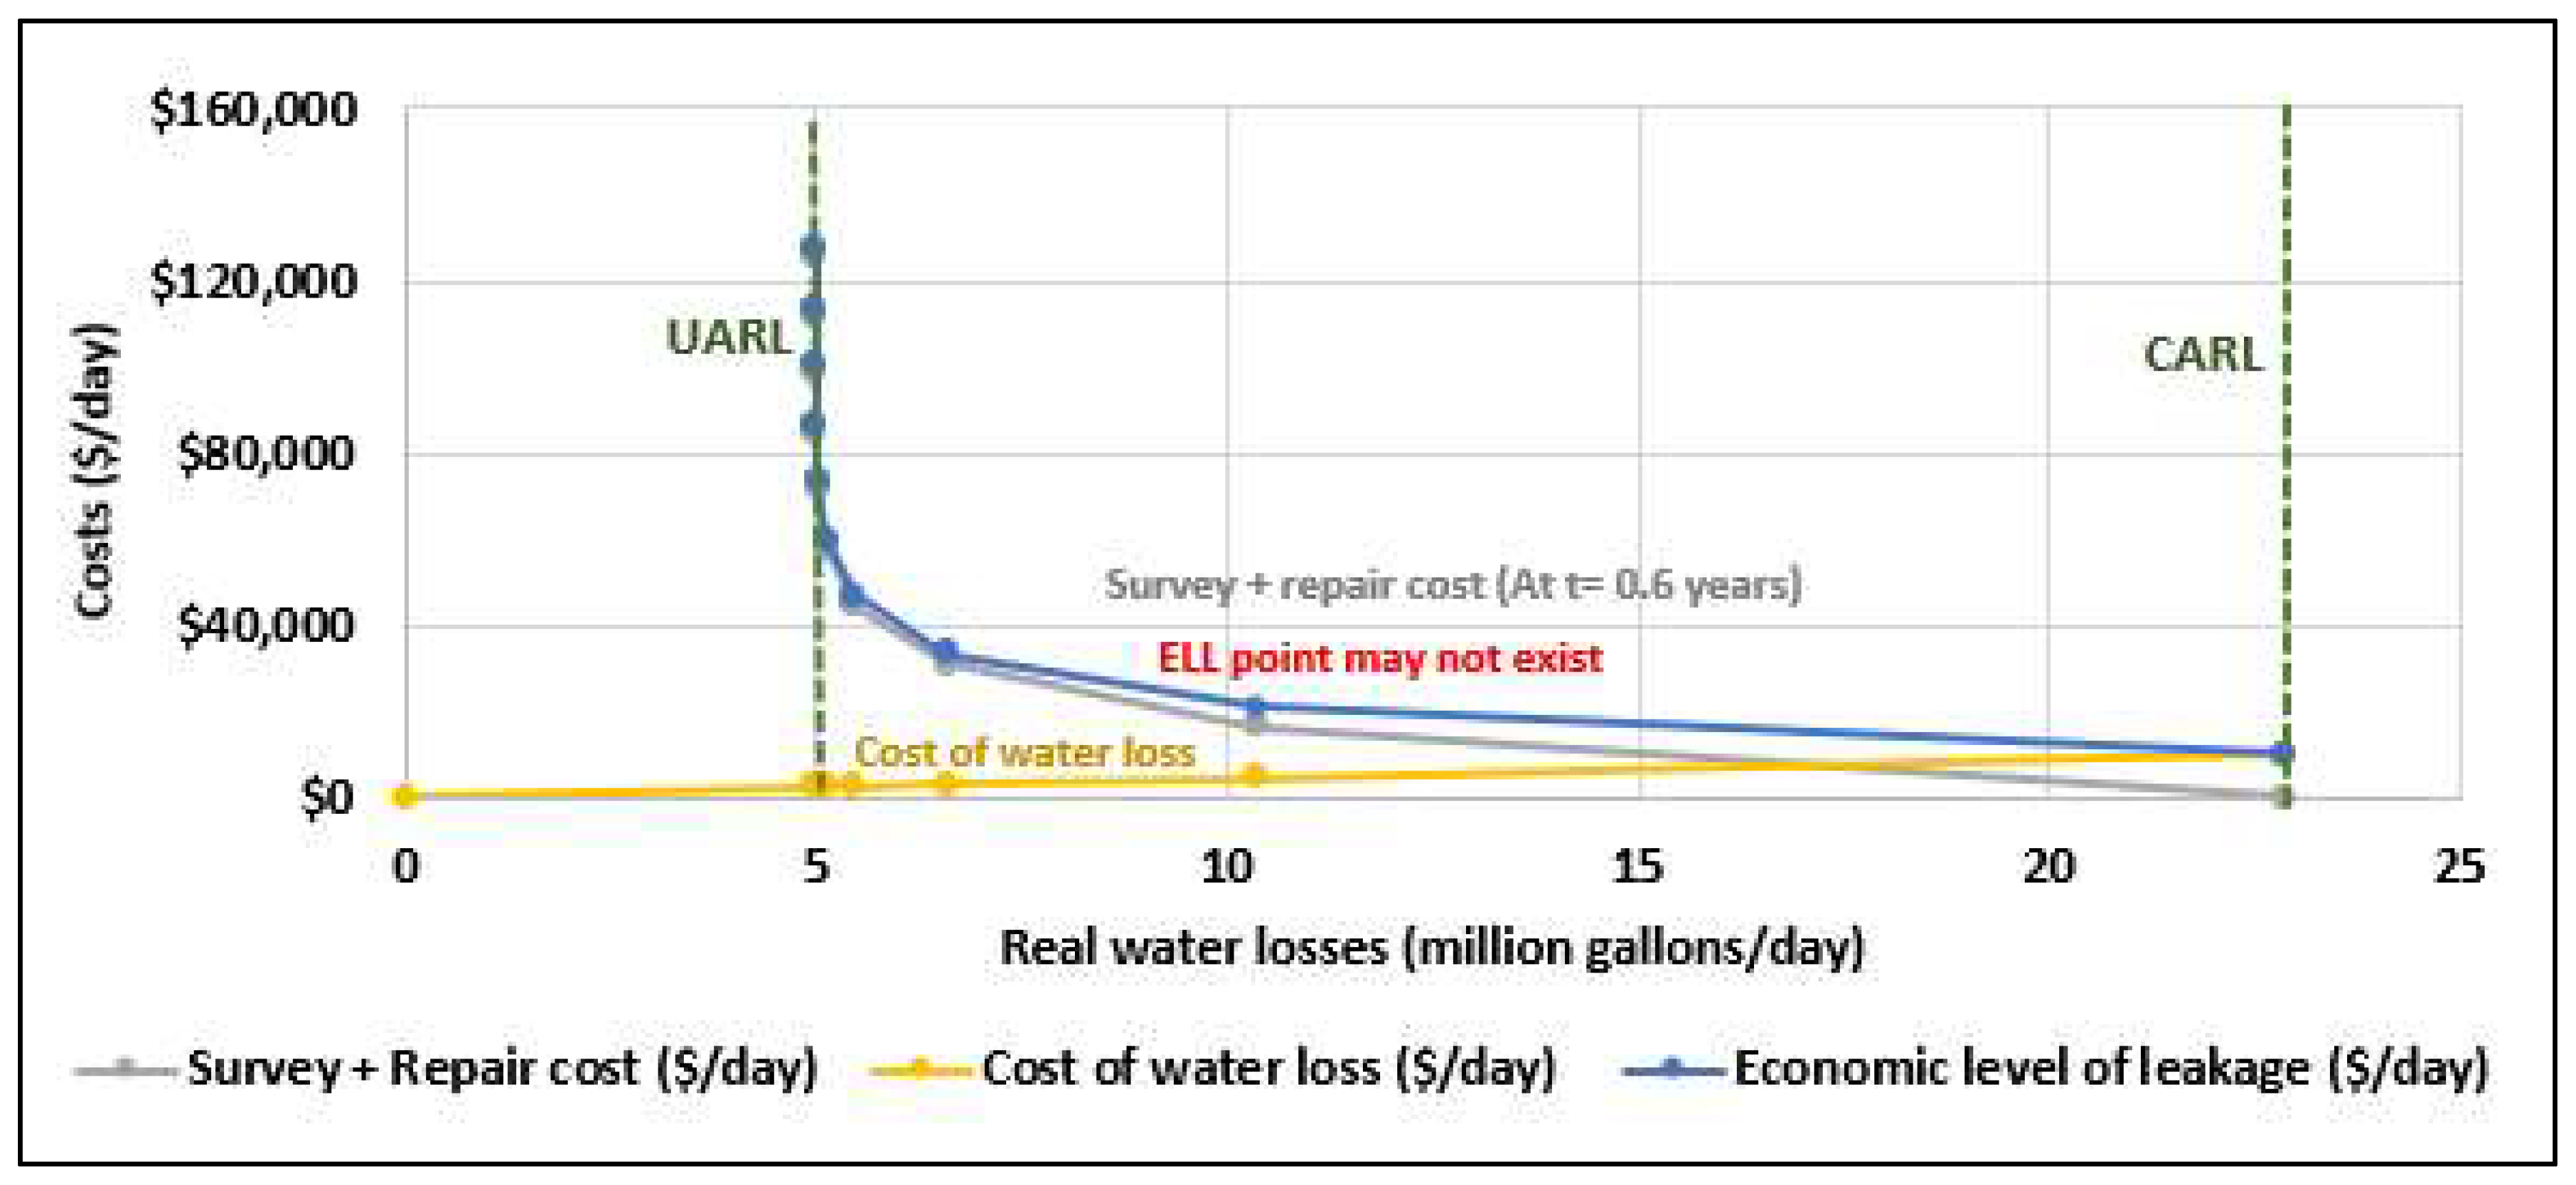
3.2. Estimation of Economic Level of Leakage for Advanced Satellite Leak Detection Technology

The ELL curve for satellite leak detection technology showed a consistent and continuous upward trend without any indication of cost decrease as shown in Figure 7. This was because the expenses of conducting satellite leak detection surveys eclipsed the economic benefits generated by saving water. This was due to the high survey detection cost of satellite leak detection, which was 1.7 times the cost of the conventional leak detection survey. For example, for the satellite leak detection survey, after the first survey the expenses due to leak detection were USD 16,824/day, whereas the economic benefit of water being saved was only USD 5220/day. For comparison, for the conventional acoustic leak detection survey, the survey expenses were USD 2181/day, approximately one eighth those of the satellite leak detection survey, with greater cost savings associated with water being saved. Therefore, the ELL was observed to exist for the conventional acoustic leak detection survey (Figure 7) but was absent for the satellite leak detection survey.
Despite the higher survey costs of the satellite leak detection technique than of the conventional acoustic leak detection method, the satellite-based survey occurs at an exceptionally faster rate, within one sixth the time frame of conventional acoustic leak detection technology. This is the main advantage of satellite leak detection technology as it offers rapid survey time, albeit at a higher cost due to the use of advanced and expensive equipment such as satellites, data servers, etc. The increase in speed efficiency stems from the integration of AI-driven analytics with advanced SAR satellite systems which automate the detection of subsurface moisture anomalies over large areas. The AI components and automation facilitates scalable, repeatable and timely water leak detection.

3.3. Comparison of ELL Results for Conventional Acoustic Leak Detection Technology Against the Advanced Leak Detection Technology

Table 4 shows the comparison of economic analysis results for the conventional acoustic technique against the advanced satellite leak detection technique. Results revealed that for both techniques the real water losses decreased by nearly 55% from an initial value of 23 Mgal/day, representing an identical value of 70% leak reduction efficiency as stated previously in Table 3. Similarly, the values of water savings after the completion of the first survey and repairs were identical for both survey types at a value of $1.9 million/year. Therefore, the state of water infrastructure was also observed to improve in an identical manner as denoted by the identical ILI values after performing the first survey and consequent repairs. The ILI value was revealed to decrease by nearly half owing to the reduction in water leaks in the system. It should be noted that actual leak reduction values can be sensitive to the water leak reduction technique deployed and may be different than the assumed value of 70%; these values can typically be 50–90%.

3.4. Comparison of Total Expenses (Survey and Repair) Against the Value of Water Being Saved

Annual cumulative expenses and value of water saved were also estimated for both the technology types to capture the economic impact of survey time. As stated earlier, one of the major advantages of satellite leak detection was its faster leak detection time, which was 80% lower than that of acoustic leak detection. As a result, the economic benefits of conserving water were realized more promptly. Concurrently, all the expenses associated with satellite leak detection were incurred until 0.6 years as the survey was completed within that time frame. No expenses occurred beyond that time until 3 years as shown in Figure 8. However, as shown in Figure 9, for the conventional acoustic leak detection survey technology, the survey and leak repair expenses were gradually incurred until 3 years, at which point one entire survey was completed.
Similarly, because of the early completion of the satellite leak detection survey, the economic benefits of water being saved were also high initially compared with initial economic benefits realized from conventional leak detection technology. As shown in Figure 8 for satellite leak detection, 70% of leak reduction was already achieved after 0.6 years, which translated into economic benefits of USD 0.57 million in terms of water being saved. Comparatively, for acoustic leak detection technology, it took 3 years to achieve the identical 70% level of water leak reduction, and therefore its value of water being saved was lower at $0.17 million at 0.6 years (Figure 9). Consequently, the cumulative benefits of water being saved (USD 5.1 million) at the end of 3 years for satellite leak detection were larger than the water savings (USD 4.8 million) associated with acoustic leak detection technology. However, the marginal increase in cumulative expenses of USD 1.2 million for satellite leak detection technology relative to the conventional acoustic leak detection technique outweighs the increase in economic benefits of USD 0.3 million realized by the quicker survey time of the satellite-based technology compared with the acoustic technique.
It should be noted that for both the technology types, the economic value of water saved exceeded that of expenses incurred from leak surveys and repairs, thereby making both the propositions economically attractive. However, within these technologies and at the end of 3 years, conventional acoustic leak detection still was observed to generate higher net economic benefits of USD 2.4 million, 50% more than the net economic benefits generated via satellite leak detection technology as shown in Figure 8 and Figure 9, respectively.

3.5. Uncertainty Analysis of Conventional Acoustic Leak Detection Technology and Advanced Leak Detection Technology

Monte Carlo uncertainty analysis was conducted for the two technology types using three input parameters, varying within predefined bounds as shown earlier in Table 3. The resulting mean values of output parameters are presented in Table 5, reflecting the most probable values based on the triangular distribution of inputs. The average value of outputs denotes the most likely value of the output variable, whereas the standard deviation represents the dispersion or spread of the simulated outcomes around the mean. The coefficient of variation (COV) indicates the size of standard of deviation relative to the mean.
As shown in Table 5, for all output parameters, the largest COV of 30% was observed for the survey and repair costs of satellite leak detection, suggesting the survey-repairs’ greatest sensitivity to the uncertainty in input parameters. Conversely, the least impact was observed for the number of surveys needed for satellite leak detection at the ELL as suggested by the standard of deviation of 0. For other output parameters such as water loss value and ILI, the COV values were nearly identical as they were estimated to be around 20–23%, suggesting similar levels of impact due to uncertain input parameters. The probability distribution graphs for each of the output parameters and both the technology types are provided in the Supplementary Materials.
Interestingly, even though a large variation was assumed for the input variable of production of water (i.e., between USD 200/million and USD 800/million gal), the COV observed for the value of water loss was only 23% for both technology types. This suggests that the uncertainty of variable production cost would only affect the final water loss by 23%.

3.6. Cost and Energy Savings with an Improved US Infrastructure

A macro-level national analysis was also performed to examine the economic and embodied energy benefits if the US domestic water infrastructure had the same superior condition of the infrastructures of Germany and The Netherlands. As shown in Figure 10, if the United States had an identical ILI value to that of Germany or The Netherlands, it could save 7.9 and 9.3 gal/day per capita, respectively. This could translate into annual savings of nearly USD 4 and 4.8 billion, respectively, in addition to annual primary energy savings of 1.6 and 1.9 TWh, respectively, for the referenced year of 2015. The US per capita domestic water supplied would decrease by nearly 10% from a value of 73 gal/day assumed in this study. As stated earlier, these cost savings include additional costs required for pumping, treatment, and distribution of water through the public water supply systems. In terms of primary or embodied energy savings, the United States could save primary energy that is needed for water’s extraction, conveyance, treatment, and distribution through the supply systems. This excludes the primary energy for wastewater collection, treatment, and discharge. If these wastewater treatment systems were to be included, the primary energy savings of water supply and distribution would be nearly twice as much, amounting to nearly 3.2–3.8 TWh/year. This elucidates the importance of improving the aging water infrastructure in the US, that can translate to not only water savings but also cost and energy savings attributed to reduced operation, maintenance, and capital improvements.

3.7. Policy Relevance

The American Society of Civil Engineers (n.d.) gave the US infrastructure a C− grade with water main breaks every 2 min, ranked 26th by the World Economic Forum’s Global Competitiveness Index [32,33,34]. Among the developed countries with improved and centralized water infrastructures, the average water losses in the Europe are ~26% with Belgium, Austria, The Netherlands, Denmark, Germany, Luxembourg, and separately Australia having water losses less than the United States (<15%) [25]. Water supply and sanitation expenditures by the European Union are on the order of USD 105 billion/year, whereas in the United States, the total capital spending on water infrastructure was USD 48 billion in 2019 with an underinvestment of USD 81 billion. The continued avoidance of improving the poor infrastructure is projected to cause an increase to USD 3.27 trillion in cumulative water and wastewater capital investment needs from 2019 to 2039 [1]. Hence, every year of the business-as-usual approach by US water utilities adds financial burden to the overall nation capital and consumer spending. As noted in Section 3.4, there is a scope for achieving large cost and energy savings by reducing the US water ILI to levels similar to Germany and The Netherlands.
Instead of reactive strategies, the US water supply system will greatly benefit from proactive approaches in managing the distribution systems. A mix of government funding and higher consumer charges in conjunction with public-private partnerships has aided in infrastructure developments in Germany and The Netherlands [34,35]. In these countries, the roles of local governments tend to be flexible and are actively facilitated by citizens’ initiatives and collaboration with industry partners. The United States recently announced a USD 8.3 billion investment over the 5 years from 2023 for critical water infrastructure projects.
The United States can explore innovative financing mechanisms such as water climate bonds where proceeds are used for assets and projects related to water infrastructure or management impacted by or related to climate change [36].
Toward water loss mitigation, the primary adoption methods include infrastructure management, water loss control programs, and intelligent and high-quality pipe replacement programs. Furthermore, employing statistical methods to georeference-concealed losses, discerning the root causes of consecutive breakages, conducting equipment inspections for age or meter-related issues, and incorporating skilled technical labor support contribute to enhanced efficiency in the water supply system. For new infrastructural needs, communities that are widely scattered with varying water sources and needs may benefit from decentralized systems for ease of operation and maintenance. In the United States, a complete shift to decentralized water systems is not feasible. However, a hybrid approach of smaller decentralized systems for small communities to complement the larger distribution network, as applied in Belgium, may help reduce financial and operational complexities [37]. The work here compared using acoustic vs. satellite-based leak detection technologies. An integrated approach of combining low-cost and high-cost leak mitigation technologies can offer real-time monitoring and precise leak detection capabilities. Collecting and combining data from low-cost leak detection technologies and applying the end data processing, analyses, and reporting from integrated smart sensor techniques will help reduce the cost of and simultaneously add efficiency in leak detection, thereby creating better water loss control programs.

3.8. Limitations of This Work

Despite the comprehensive economic analysis conducted at both the micro (city) and macro (national) levels, it is essential to acknowledge the existence of certain limitations within this study. These limitations provide pathways for future studies to contribute and add to the existing dearth of literature. One significant constraint pertains to the reliance on data reported solely for the year 2015 in the macro level analysis, which, unfortunately, inhibits a thorough examination of current trends and developments. Moreover, the micro-level economic analysis was restricted to a relatively short timeframe of only three years. Due to limited scope, a discounted cash flow analysis for cost comparison was not conducted and expanding the cash flow analysis period to 30 years could have yielded valuable insights into the long-term economic benefits, particularly about the time value of money. Additionally, different levels of economic benefits could be realized when a combination of multiple leak detection and pressure management strategies are simultaneously incorporated to a standard water loss control program. Future studies can use the current model to evaluate the system level cost and energy impacts of an effective water loss control program. Concurrently, there is also a need to add the social benefits of an improved water infrastructure in addition to the cost, energy and emissions savings [38,39]. Studies have shown that often the societal, environmental and financial benefits are not distributed equitably, thereby adding disparities in overall public health and emphasizing the need to address environmental justice [40,41,42]. Although not studied in this work, but a socio-economic analysis of the potentially improved US water infrastructure will be beneficial in informing the urgency in future policy making.

4. Conclusions

Water losses incurred due to the poor US water infrastructure adds a cost, energy and resource burden. These losses not only impact water utilities but also translate the burden to the consumers because of increasing water rates and inflation [43]. In this work, a new framework is presented to calculate the economic level of leakage (ELL) within water supply and distribution systems, an essential step toward enabling smart infrastructure in smart cities. A case study focused on water audit data from Atlanta, Georgia, compared the costs of two leak mitigation technologies: conventional acoustic leak detection and artificial intelligence-assisted satellite leak detection technology, which utilizes machine learning algorithms to analyze satellite imagery and identify patterns indicative of subsurface leaks.
Both technology options analyzed in this study exhibited economic feasibility, as the value of saved water exceeded the expenses of leak survey and repairs over a three-year period. However, conventional acoustic leak detection generated higher net economic benefits of USD 2.4 million, surpassing satellite detection by 50%. Monte Carlo uncertainty analysis revealed a significant coefficient of variation (30%) in survey-repair costs for satellite leak detection, indicating their heightened sensitivity to input parameter variations. A broader national analysis was conducted to explore the potential benefits of US water infrastructure mirroring the exemplary conditions of Germany and The Netherlands. Achieving similar infrastructure leakage index values could result in annual cost savings of USD 4 billion to 4.8 billion and primary energy savings of 1.6–1.9 terawatt-hours, supporting more resilient smart living through efficient urban water management.

Supplementary Materials

The following supporting information can be downloaded at: https://www.mdpi.com/article/10.3390/smartcities8040122/s1, Figure S1: AWWA water audit balance diagram; Figure S2: Uncertainty analysis results for number of surveys of conventional acoustic leak detection technology; Figure S3: Uncertainty analysis of survey and repair costs ($/day) of conventional acoustic leak detection technology; Figure S4: Uncertainty analysis of value of water loss ($/day) of conventional acoustic leak detection technology; Figure S5: Uncertainty analysis results for number of surveys of satellite leak detection technology; Figure S6: Uncertainty analysis of survey and repair costs ($/day) of satellite leak detection technology; Figure S7: Uncertainty analysis of value of water loss ($/day) of satellite leak detection technology; Table S1: Values for input parameters assumed for Monte Carlo uncertainty analysis for the conventional acoustic leak detection method. Table S2: Values for input parameters assumed for Monte Carlo uncertainty analysis for the novel satellite leak detection method. References [44,45,46] are cited in the supplementary materials.

Author Contributions

Conceptualization, S.N. and P.N.; Data curation, P.N. and S.G.; Formal analysis, P.N. and S.G.; Funding acquisition, S.N.; Investigation, P.N. and S.G.; Methodology, P.N. and S.G.; Project administration, S.N.; Resources, S.N.; Software, S.N., P.N. and S.G.; Supervision, S.N.; Validation, S.N., P.N., S.G. and N.S.; Visualization, P.N. and N.S.; Roles/Writing, original draft—P.N., N.S. and N.S.; Writing—review and editing, S.N., P.N. and N.S. All authors have read and agreed to the published version of the manuscript.

Funding

This work was financially supported by the US Department of Energy’s Industrial Technologies Office (ITO), Washington, DC, United States, under contract DE-AC05–00OR22725 with the US Department of Energy.

Data Availability Statement

The data presented in this article are available upon request from the corresponding author.

Acknowledgments

The authors would like to thank Wendy Hames and Kathy Jones for formatting assistance.

Conflicts of Interest

The authors declare no conflicts of interest.

References

  1. American Society of Civil Engineers (ASCE). Failure to Act: Water and Wastewater 2020. 2021. Available online: https://infrastructurereportcard.org/wp-content/uploads/2021/03/Failure-to-Act-Water-Wastewater-2020-Final.pdf (accessed on 3 January 2024).
  2. American Water Works Association (AWWA). Buried No Longer: Confronting America’s Water Infrastructure Challenge. 2012. Available online: https://www.awwa.org/Portals/0/AWWA/Government/BuriedNoLonger.pdf?ver=2013-03-29-125906-653 (accessed on 17 June 2025).
  3. U.S. Environmental Protection Agency (EPA). Water Audits and Water Loss Control for Public Water Systems. 2015. Available online: https://www.epa.gov/sites/default/files/2015-04/documents/epa816f13002.pdf (accessed on 25 June 2024).
  4. AWWA. M36 Water Audits and Loss Control Programs, 4th ed.; American Water Works Association: Denver, CO, USA, 2016. [Google Scholar]
  5. Bluefield Research. Water Losses Cost U.S. Utilities US $6.4 Billion Annually. 2025. Available online: https://www.bluefieldresearch.com/ns/water-losses-cost-u-s-utilities-us6-4-billion-annually/ (accessed on 19 June 2025).
  6. Stokes, J.R.; Hendrickson, T.P.; Horvath, A. Save Water to Save Carbon and Money: Developing Abatement Costs for Expanded Greenhouse Gas Reduction Portfolios. Environ. Sci. Technol. 2014, 48, 13583–13591. [Google Scholar] [CrossRef] [PubMed]
  7. Twomey, K.M.; Webber, M.E. Evaluating the Energy Intensity of the US Public Water Supply. In Proceedings of the ASME 2011 5th International Conference on Energy Sustainability, Washington, DC, USA, 7–10 August 2011. ES2011-54165. [Google Scholar]
  8. U.S. Environmental Protection Agency (EPA). Greenhouse Gas Equivalencies Calculator. Energy and the Environment. 2023. Available online: https://www.epa.gov/energy/greenhouse-gas-equivalencies-calculator#results (accessed on 3 January 2024).
  9. Kilinski, M.A. Overview of Available Leak Detection Technologies. A Summary of Capabilities and Costs; PNNL-28885; Pacific Northwest National Laboratory: Richland, WA, USA, 2019. Available online: https://www.osti.gov/servlets/purl/1571292 (accessed on 25 June 2024).
  10. Water Asset Management. Advanced Leak Detection Technology. 2019. Available online: https://cdn.ymaws.com/oawwa.org/resource/collection/547267D3-8F47-4F9E-9F75-146E783C2BBF/Advanced%20Leak%20Detection%20Technology%20Utilizing%20S.pdf (accessed on 3 January 2024).
  11. Hangan, A.; Chiru, C.-G.; Arsene, D.; Czako, Z.; Lisman, D.F.; Mocanu, M.; Pahontu, B.; Predescu, A.; Sebestyen, G. Advanced Techniques for Monitoring and Management of Urban Water Infrastructures—An Overview. Water 2022, 14, 2174. [Google Scholar] [CrossRef]
  12. Hardeman, S. A Cost-Benefit Analysis of Leak Detection and the Potential of Real Water Savings for New Mexico Water Systems. 2008. Available online: https://digitalrepository.unm.edu/wr_sp/101 (accessed on 3 January 2024).
  13. Munoz-Trochez, C.; Smout, I.K.; Kayaga, S. Economic Level of Leakage (ELL) Calculation with Limited Data: An Application in Zaragoza. In Proceedings of the 35th WEDC International Conference, Loughborough, UK, 6–8 July 2011; Refereed Paper 1104. Loughborough University: Loughborough, UK, 2019. Available online: https://hdl.handle.net/2134/30105 (accessed on 3 January 2024).
  14. California Water Board. Water Loss Control. Conservation. 2022. Available online: https://www.waterboards.ca.gov/conservation/water_loss_control.html (accessed on 3 January 2024).
  15. Georgia EPD. 2020 Water Loss Audit Results. Water Efficiency and Water Loss Audits. Georgia Environmental Protection Division. 2020. Available online: https://epd.georgia.gov/watershed-protection-branch/water-efficiency-and-water-loss-audits (accessed on 3 January 2024).
  16. AWWA. Minimize System Losses by Implementing Water Loss Controls. Water Loss Control. American Water Works Association. Available online: https://www.awwa.org/Resources-Tools/Resource-Topics/Water-Loss-Control (accessed on 3 January 2024).
  17. Indiana Finance Authority (IFA). Water Loss Audit Guide: Cost Data. 2018. Available online: https://www.in.gov/ifa/files/Water-Loss-Audit-Guide_Cost-Data.pdf (accessed on 3 January 2024).
  18. Lenzi, C.; Bragalli, C.; Bolognesi, A.; Fortini, M. Infrastructure Leakage Index Assessment in Large Water Systems. Procedia Eng. 2014, 70, 1017–1026. [Google Scholar] [CrossRef]
  19. Asterra. Sustainable Water Management in Green Bay. 2022. Available online: https://asterra.io/wp-content/uploads/2022/01/US-GreenBay-NEWWA-March2021.pdf (accessed on 3 January 2024).
  20. Ge, H.; Asgarpoor, S. Parallel Monte Carlo simulation for reliability and cost evaluation of equipment and systems. Elec. Power Syst. Res. 2011, 81, 347–356. [Google Scholar] [CrossRef]
  21. Wang, N.; Chang, Y.C.; El-Sheikh, A.A. Monte Carlo simulation approach to life cycle cost management. Struct. Infrastruct. Eng. 2012, 8, 739–746. [Google Scholar] [CrossRef]
  22. Back, W.E.; Boles, W.W.; Fry, G.T. Defining Triangular Probability Distributions from Historical Cost Data. J. Constr. Eng. Manag. 2000, 126, 29–37. [Google Scholar] [CrossRef]
  23. McMurray, A.; Pearson, T.; Casarim, F. Guidance on Applying the Monte Carlo Approach to Uncertainty Analyses in Forestry and Greenhouse Gas Accounting; Winrock International: Arlington, VA, USA, 2017; 26p, Available online: https://winrock.org/wp-content/uploads/2018/03/UncertaintyReport-12.26.17.pdf (accessed on 3 January 2024).
  24. Eurostat. Water Statistics. Available online: https://ec.europa.eu/eurostat/statistics-explained/index.php?title=Water_statistics#Water_uses (accessed on 3 January 2024).
  25. Interreg Central Europe. Digital Learning Resources: Water Loss. Available online: https://programme2014-20.interreg-central.eu/Content.Node/Digital-Learning-Resources/03-Water-Loss.pdf (accessed on 3 January 2024).
  26. Leaks Suite Library. ILI Overviews by Country. Available online: https://www.leakssuitelibrary.com/ili-overviews-by-country/ (accessed on 3 January 2024).
  27. U.S. Geological Survey (USGS). Domestic Water Use. Available online: https://www.usgs.gov/mission-areas/water-resources/science/domestic-water-use (accessed on 3 January 2024).
  28. Voltz, T.; Grischek, T. Energy management in the water sector—Comparative case study of Germany and the United States. Water-Energy Nexus 2018, 1, 2–16. [Google Scholar] [CrossRef]
  29. Fowler, S. A Water System So Broken That One Pipe Leaks 5 Million Gallons a Day. New York Times. 2023. Available online: https://www.nytimes.com/2023/03/22/us/jackson-mississippi-water-crisis.html (accessed on 3 January 2024).
  30. Carver, J.L.; Salhotra, P. Everything You Need to Know about Texas’ Beleaguered Water Systems. The Texas Tribune. 2023. Available online: https://www.texastribune.org/2023/05/03/texas-water-infrastructure-broken-explained/ (accessed on 3 January 2024).
  31. Rao, P.; McKane, A. Energy Savings from Industrial Water Reductions. 2015. Available online: https://www.osti.gov/servlets/purl/1238179 (accessed on 3 January 2024).
  32. Haar, J. Infrastructure and Management: A Vital Meeting for Global Water Needs. 2023. Available online: https://www.wilsoncenter.org/article/infrastructure-and-management-vital-meeting-global-water-needs (accessed on 3 January 2024).
  33. American Society of Civil Engineers (ASCE). Infrastructure Report Card. Available online: https://infrastructurereportcard.org/ (accessed on 3 January 2024).
  34. Mees, H.L.; Uittenbroek, C.J.; Hegger, D.L.; Driessen, P.P. From Citizen Participation to Government Participation: An Exploration of the Roles of Local Governments in Community Initiatives for Climate Change Adaptation in the Netherlands. Environ. Policy Gov. 2019, 29, 198–208. [Google Scholar] [CrossRef]
  35. Peters, S.; Ouboter, M.; Lugt, K.V.D.; Koop, S.; Leeuwen, K.V. Retrospective Analysis of Water Management in Amsterdam, The Netherlands. Water 2021, 13, 1099. [Google Scholar] [CrossRef]
  36. Climate Bonds Initiative. Climate Bonds Water Infrastructure FAQ. 2018. Available online: https://www.climatebonds.net/files/documents/FAQs-April-2018.pdf (accessed on 3 January 2024).
  37. Mbavarira, T.M.; Grimm, C. A Systemic View on Circular Economy in the Water Industry: Learnings from a Belgian and Dutch Case. Sustainability 2021, 13, 3313. [Google Scholar] [CrossRef]
  38. Ahn, J.; Moon, H.; Shin, J.; Ryu, J. Social benefits of improving water infrastructure in South Korea: Upgrading sewage treatment plants. Environ. Sci. Pollut. Res. 2020, 27, 11202–11212. [Google Scholar] [CrossRef] [PubMed]
  39. Yang, Y.; Tatano, H.; Huang, Q.; Wang, K.; Liu, H. Estimating the societal impact of water infrastructure disruptions: A novel model incorporating individuals’ activity choices. Sustain. Cities Soc. 2021, 75, 103290. [Google Scholar] [CrossRef]
  40. Hendricks, M.D.; Van Zandt, S. Unequal protection revisited: Planning for environmental justice, hazard vulnerability, and critical infrastructure in communities of color. Environ. Justice 2021, 14, 87–97. [Google Scholar] [CrossRef]
  41. Van Derslice, J. Drinking water infrastructure and environmental disparities: Evidence and methodological considerations. Am. J. Public Health 2011, 101, S109–S114. [Google Scholar] [CrossRef] [PubMed]
  42. Dunn, A.D.; Derrington, E. Investment in water and wastewater infrastructure: An environmental justice challenge, a governance solution. Nat. Resour. Environ. 2009, 24, 3. [Google Scholar]
  43. CNT. The Case for Fixing the Leaks. 2013. Available online: https://cnt.org/sites/default/files/publications/CNT_CaseforFixingtheLeaks.pdf (accessed on 25 June 2024).
  44. American Water Works Association (AWWA). Opflow. Available online: https://awwa.onlinelibrary.wiley.com/doi/10.1002/opfl.1306 (accessed on 3 January 2024).
  45. Asterra. Texas Water Efficiency Training (TexasWET) Program—Garland 2022. 2022. Available online: https://asterra.io/wp-content/uploads/2022/08/TexasWET-Garland2022.pdf (accessed on 3 January 2024).
  46. Green, J.; Gagliardo, P. Satellite data complement traditional leak detection and repair programs. Opflow 2020, 46, 10–14. [Google Scholar] [CrossRef]
Figure 1. Economic impact of real water loss in the US in 2015 [3,7].
Smartcities 08 00122 g001
Figure 2. Primary energy footprint of water loss and greenhouse gas (GHG) footprint of water loss in 2015 for the US [8].
Smartcities 08 00122 g002
Figure 3. Water system details for Atlanta water system.
Smartcities 08 00122 g003
Figure 4. Cost assessment methodology to mitigate water main leaks and service connections.
Smartcities 08 00122 g004
Figure 5. Per capita water supplied, real water loss (gal/d), and ILI in domestic use for the United States, Germany, and The Netherlands in 2015 [24,25,26,27,28].
Smartcities 08 00122 g005
Figure 6. Estimation of economic level of leakage for conventional acoustic leak detection technology. (UARL—Unavoidable annual real loss; CARL—current annual real loss).
Smartcities 08 00122 g006
Figure 7. Estimation of economic level of leakage for advanced satellite leak (ELL) detection technology (UARL—Unavoidable annual real loss; CARL—current annual real loss).
Smartcities 08 00122 g007
Figure 8. Satellite leak detection survey: expenses incurred vs. value of water saved (after 1 survey).
Smartcities 08 00122 g008
Figure 9. Acoustic leak detection survey: expenses incurred vs. value of water saved (after 1 survey).
Smartcities 08 00122 g009
Figure 10. Financial and embodied energy savings if the United States had the same state of water infrastructure as that of Germany or The Netherlands.
Smartcities 08 00122 g010
Table 1. A brief review of economic analysis methodologies existing in the literature on the cost analysis of water leak mitigation.
Method NameModel OutputAdvantagesShortcomingsReference
Simple economic level of leakage methodNumber of surveys, annual cost of leak detection, total water saved annually & costs.Quick and simple method that can be performed without the need of large level of inputs needing only 9 input parameters.
  • Assumes unrealistic leak survey detection time of one year, irrespective of pipe length.
  • Repair cost is dependent on $/day costs and is independent of number of water mains leaks or service connection leaks.
  • Does not estimate the optimum number of surveys needed for leak detection.
[12]
Economic intervention frequency methodPercentage of pipe length that needs to be surveyed; the annual budget needed for intervention.Quick and simple method that requires variable cost of water ($/m3), estimated cost of intervention ($/mile) and rate of rise (m3/day).
  • Over simplified method uses only 2 equations to estimate results.
  • Does not estimate the repair costs of mains leaks or service connection leaks.
[13]
Complex economic level of leakage methodWater loss in gallons, cost benefit ratio over 30 years with or without intervention
  • Comprehensive model to estimate water loss in gallons, cost benefit ratio over 30 years with or without intervention
  • Assumes a realistic timeframe for leak survey detection of 1–3 years.
  • Complexity of the model calculation methodology as it utilizes >20 equations with a monthly time step for cost calculations of 30 years duration (~360 steps).
  • May need more than 20 input parameters to perform calculations.
[14]
Table 2. Breakdown of components within unavoidable annual real losses into background, reported, and unreported leakage at 70 psi [4,16].
Water Leakage TypeBackground LeaksReported LeaksUnreported Leaks
Mains8.5 gal/mi/h0.2 breaks/mi/year at 50 gpm for 3-day duration0.01 breaks/mi/year at 25 gpm for 50-day duration
Service connections (mains pipe to curb stop)0.33 gal/service connection/h2.25 leaks/1000 service connections at 7 gpm for 8-day duration0.75 leaks/1000 service connections at 7 gpm for 100-day duration
Table 3. Cost assumptions to estimate for conventional acoustic leak detection and advanced leak detection methods.
UnitConventional Acoustic Leak Detection bAdvanced Satellite Leak Detection b,c
Assumptions for survey estimation costs
Water mains lengthmi2875
Number of service connections215,426
Imagery costUSD/miNot applicable591
Analysis costUSD/miNot applicable591
Physical inspection costUSD/mi595595 a
Total survey costUSD/mi5951024
Survey timeyears30.6
Leak reduction efficiency per survey%7070
Average operating pressurepsi104 104
Assumptions for repair estimation costs
Number of mains leaks in unreported leaksleaks/mi/year0.010.01
Number of lateral leaks in unreported leaks leaks/1000 service connections0.750.75
Cost of repairing water mains leaksUSD/leak59465946
Cost of repairing water lateral leaksUSD/leak23302330
a Needed only for 20% of total mains pipe length b [14] c [19].
Table 4. Economic analysis of the conventional acoustic leak detection technique for the Atlanta utility.
Parameter for ComparisonUnitConventional Acoustic TechniqueAdvanced Satellite Leak Detection Technique a
Initial Real Water Losses prior to using leak detection techniqueMgal/day23
Final Real losses at ELL after using leak detection techniqueMgal/day10.3
Total leak detection and repair expensesUSD M2.333.5
Number of leak detection surveys needed at ELL11
Value of water savings after first year of survey implementation USD M/year1.91.9
Water reduction from CARL%5555
New infrastructure leakage index 2.082.08
Old infrastructure leakage index 4.594.59
a ELL point does not exist.
Table 5. Results of the Monte Carlo uncertainty analysis and its impact on output parameters for number of surveys, value of water loss, survey and repair costs, and ILI for both leak detection types.
ParameterUnitMeanStandard DeviationCOV
Conventional acoustic leak detection technology
Number of surveys at ELL1.80.528%
Survey and repair costs at ELLUSD/day266160022%
Value of water loss at ELLUSD/day331171423%
ILI1.450.2820%
Advanced satellite leak detection technology a
Number of surveys10-
Survey and repair costsUSD/day37,303759130%
Value of water lossUSD/day4884146420%
ILI2.070.2914%
a ELL point does not exist.
Disclaimer/Publisher’s Note: The statements, opinions and data contained in all publications are solely those of the individual author(s) and contributor(s) and not of MDPI and/or the editor(s). MDPI and/or the editor(s) disclaim responsibility for any injury to people or property resulting from any ideas, methods, instructions or products referred to in the content.

