Article

Digital Inequality and Smart Inclusion: A Socio-Spatial Perspective from the Region of Xanthi, Greece

by
Kyriaki Kourtidou
1,
Yannis Frangopoulos
2,
Asimenia Salepaki
3 and
Dimitris Kourkouridis
2,*
1
School of Architecture, National Technical University of Athens, 10682 Athens, Greece
2
School of Spatial Planning and Development, Aristotle University of Thessaloniki, 54124 Thessaloniki, Greece
3
Business and Exhibition Research and Development Institute, 54636 Thessaloniki, Greece
*
Author to whom correspondence should be addressed.
Smart Cities 2025, 8(4), 123; https://doi.org/10.3390/smartcities8040123
Submission received: 5 June 2025 / Revised: 13 July 2025 / Accepted: 17 July 2025 / Published: 28 July 2025

Abstract

Highlights

What are the main findings?
  • Digital inequality in Xanthi is driven by geography, socio-economic status, and cultural factors.
  • Rural and minority communities face limited infrastructure and low digital literacy.
What is the implication of the main finding?
  • Smart development must address territorial and social disparities through context-sensitive, inclusive policies.

Abstract

This study explores digital inequality as a socio-spatial phenomenon within the context of smart inclusion, focusing on the Regional Unit of Xanthi, Greece—a region marked by ethno-cultural diversity and pronounced urban–rural contrasts. Using a mixed-methods design, this research integrates secondary quantitative data with qualitative insights from semi-structured interviews, aiming to uncover how spatial, demographic, and cultural variables shape digital engagement. Geographic Information System (GIS) tools are employed to map disparities in internet access and ICT infrastructure, revealing significant gaps linked to geography, education, and economic status. The findings demonstrate that digital inequality is particularly acute in rural, minority, and economically marginalized communities, where limited infrastructure intersects with low digital literacy and socio-economic disadvantage. Interview data further illuminate how residents navigate exclusion, emphasizing generational divides, perceptions of technology, and place-based constraints. By bridging spatial analysis with lived experience, this study advances the conceptualization of digitally inclusive smart regions. It offers policy-relevant insights into how territorial inequality undermines the goals of smart development and proposes context-sensitive interventions to promote equitable digital participation. The case of Xanthi underscores the importance of integrating spatial justice into smart city and regional planning agendas.

1. Introduction

Digital inequality has emerged as a critical issue within the framework of the Information Society, driven by the widespread integration of Information and Communication Technologies (ICTs) into everyday life [1]. As Castells argues, ICTs constitute the backbone of the globalized network society, reshaping work, communication, and social structures [2]. However, this transformation has also revealed stark inequalities in digital access and use across regions and population groups. These disparities are particularly visible in rural and peripheral areas, where infrastructural limitations, low population density, and limited public investment reinforce patterns of exclusion [3]. The term “digital divide” was initially coined to describe the binary gap between those with and without internet access [4], but early definitions failed to capture the socio-economic and cultural dimensions of digital exclusion. Governmental institutions, such as the National Telecommunications and Information Administration, began identifying key structural determinants of access, including education, income, and ethnicity [5]. Scholars subsequently expanded the scope of analysis to include differences in skills, usage practices, and the ability to derive benefit from technology [6]. This more nuanced understanding has revealed that digital inequality is not a singular condition but a stratified phenomenon. As Robinson et al. highlight, digital participation is structured by interlocking forms of disadvantage—what they term the “digital inequality stack” [7,8]. These broader global trends emphasize the importance of investigating digital inclusion within smart development agendas, especially in socially and spatially diverse regions. In this context, examining how digital disparities manifest within marginalized territories is essential to ensuring that smart city initiatives do not inadvertently reinforce existing forms of exclusion.
Wei and Hindman [9] introduced the concept of “usage gaps,” which describes inequalities in the ability to effectively utilize digital resources for social, professional, and educational advancement. Similarly, Van Dijk [10] conceptualized digital inequality as a dynamic phenomenon influenced by technological evolution and socio-economic factors. This broader perspective underscores the need to address not just access but also competencies, motivations, and contextual barriers. Van Deursen et al. [11] reinforce this view, identifying that disparities in digital skills and usage patterns often perpetuate broader socio-economic inequalities, limiting individuals’ ability to achieve meaningful outcomes.
Digital inequality is deeply embedded in socio-spatial contexts. Castells [1] introduced the “space of flows” concept, which highlights the dominance of networked spaces over traditional geographical boundaries. While urban areas often enjoy advanced digital infrastructure, rural and marginalized regions face systemic disadvantages. Sassen [12] further examined the role of global cities as hubs of digital connectivity, reinforcing inequalities at local and regional levels. This urban–rural divide continues to persist, as noted by Robinson et al. [8], with rural communities disproportionately affected by infrastructural and digital literacy gaps, exacerbating exclusion from the digital economy. In South-ern Europe, this divide is particularly evident, where economic and policy neglect have hindered ICT development in rural areas, exacerbating economic and digital marginalization [3]. In this context, the notion of “smart inclusion” has emerged in recent years, calling for equitable access to digital infrastructures and services as a prerequisite for socially sustainable and technologically integrated regions [13,14].
Recent studies have further emphasized the territorial embeddedness of digital inequality, especially in rural and peripheral regions across Europe. Research has shown that infrastructural unevenness, combined with socio-demographic and institutional disadvantages, reinforces digital exclusion at the local level [15,16]. For instance, studies in Spain and Italy have revealed persistent gaps in broadband deployment, digital skills, and civic participation in so-called “left-behind” areas, despite national and EU-level investment in smart growth initiatives [17]. These findings underscore the need for place-sensitive approaches to smart inclusion, particularly in socially and spatially diverse contexts such as the Xanthi region.
This paper focuses on the Regional Unit of Xanthi in northeastern Greece, an area characterized by persistent spatial inequalities and notable ethno-cultural diversity. The region includes both urban and rural communities and is home to a historically significant Muslim minority population. The recognition of this minority was established under the Convention concerning the exchange of populations between Greece and Turkey, signed in Lausanne in 1923, which defined the legal rights of this group [18]. This complex socio-political context provides a unique lens to explore how digital inequalities are spatially embedded and socially reproduced, particularly in territories that have long been marginalized in terms of infrastructure and state attention.
Contemporary research has shifted towards the concept of “digital inequality” to emphasize its multidimensional nature. Unlike the binary notion of the digital divide, digital inequality captures the interplay between access, usage, and benefits. This perspective aligns with Bourdieu’s [19] framework of capital, where digital literacy and access to ICTs are viewed as forms of social and cultural capital that influence an individual’s position within the digital hierarchy. Furthermore, Lefebvre’s [20] spatial theory highlights how digital exclusion is both produced and reproduced within specific socio-spatial settings. Robinson et al. [7] add that digital inequality is not only a symptom of pre-existing social hierarchies but also a mechanism through which these hierarchies are sustained and amplified, particularly among marginalized populations.
The theoretical lens of socio-spatial approaches offers valuable insights into the mechanisms producing and reproducing digital inequality. Drawing on Lefebvre’s [20] spatial theory, digital inequality can be understood as both a product and a producer of social structures, shaped by the interplay of physical space and digital flows. Lefebvre’s concepts of the “production of space” and “social space” underscore how digital exclusion reflects broader patterns of economic and social marginalization [21]. Robinson [22] further highlights the role of “information habitus,” which frames individuals’ attitudes toward technology as being shaped by socio-economic conditions and life experiences, influencing digital participation.
Drawing on Bourdieu’s [19] framework, digital literacy and access to ICTs can be understood as forms of cultural and social capital. These resources not only reflect existing socio-economic inequalities but also contribute to their reproduction by limiting opportunities for disadvantaged groups. The term “digital divide” has evolved into the broader concept of “digital inequality,” which encompasses disparities in access, skills, usage, and outcomes. Van Deursen et al. [11] emphasize that these disparities are most severe among individuals with limited educational and economic resources, reinforcing patterns of social exclusion.
Policy initiatives such as the European Union’s Lisbon Strategy [23] have framed digital inclusion as essential for social cohesion and economic growth. However, Helbig et al. [24] and Robinson et al. [8] argue that effective responses must address the multi-layered nature of digital inequality, including infrastructure, skill development, and localized support systems. As noted by Esteban-Navarro et al. [25], the COVID-19 pandemic made these issues more urgent, as the sudden shift to digital platforms in education, employment, and public services disproportionately impacted those lacking access or skills. The pandemic thus exposed the critical need for integrated interventions that combine infrastructure investment with digital education and socio-economic support, particularly in rural and marginalized communities [3,8].
The evolution of digital inequality from a narrow focus on access to a multidimensional framework reflects its complexity and socio-spatial implications. Addressing this phenomenon requires a holistic understanding of the factors that shape digital exclusion, as well as coordinated efforts to promote digital inclusion at local, national, and global levels.
The present study examines the socio-spatial dynamics of digital inequality in the Regional Unit of Xanthi, Greece. This area represents a compelling case study due to its diverse socio-economic and ethno-cultural composition, which amplifies the multifaceted nature of digital exclusion. By employing both quantitative and qualitative methodologies, this research seeks to map the extent of digital inequality while exploring the lived experiences of individuals within the region. Through this approach, this study contributes to discussions on how digital exclusion can be addressed within smart inclusion frameworks, particularly in multi-cultural and peripheral regions. This study is guided by the following research questions: (a) How are spatial and ethno-cultural inequalities reflected in patterns of internet access across the Xanthi region? (b) What role do territorial, demographic, and policy-related factors play in shaping digital exclusion in marginalized areas? (c) How can spatial analysis tools be used to identify and visualize patterns of digital inequality in the context of smart inclusion?

2. Materials and Methods

2.1. Research Framework

Figure 1 presents the analytical structure of this study, organized into four interrelated components: research objectives, key indicators, methodological approach, and expected insights. This research is driven by three central aims: to understand spatial variation in internet access, to examine the intersection of ethno-cultural identity and digital connectivity, and to identify structural barriers to digital inclusion. These objectives inform the selection of key indicators, including internet access rates (both relative and absolute), education levels, ethno-cultural composition, urban–rural classification, and administrative subdivisions. The methodological approach combines descriptive statistics, spatial disaggregation, comparative analysis, and thematic mapping. These tools allow for the investigation of how digital inequality is distributed across different population groups and geographic areas. The framework ultimately supports the identification of spatial patterns of exclusion, reveals socio-spatial correlations, and provides evidence to inform inclusive digital development strategies.

2.2. Study Area

The Regional Unit of Xanthi, located in northeastern Greece (Figure 2), was chosen as the study area due to its unique socio-economic and ethno-cultural characteristics, as shown in Figure 3. The region includes both urban and rural settings, with significant populations from diverse ethnic and cultural backgrounds, including the Muslim minority. Three groups are the Slavic-speaking Pomaks, living in mountainous areas; the minority Turks, mainly inhabiting the valleys, and finally the Rom (Gypsies) minority, mainly located in the outskirts of suburban areas and cities [26]. This diversity provides a rich context for examining the multidimensional nature of digital inequality.
In the case of the Xanthi Regional Unit, social and ethno-cultural inequalities intersect with hierarchical relations between population groups and state policies that have historically reinforced them. Socio-spatial inequalities and digital lag both reflect and reproduce broader disparities in access to services and opportunities for local development. The Muslim minority of Western Thrace, concentrated in the mountainous and semi-rural areas of the region, represents a unique socio-political feature of the area, as the only minority officially recognized by the Greek state. This demographic and legal status has implications for state engagement, infrastructure distribution, and patterns of inclusion.

2.3. Methodology

This study employs a mixed-methods approach to capture both the quantitative and qualitative dimensions of digital inequality. The research design integrates descriptive analysis, in-depth interviews, and spatial analysis to provide a comprehensive understanding of digital inequality in the study area. This methodological integration supports a multidimensional view of smart inclusion, combining measurable indicators with local lived experiences.
Qualitative interviews were conducted with 13 key informants, as shown in Table A1 (Appendix A). These participants were selected to represent diverse variables, such as ethno-cultural background, age, education level, and employment status. The interviews offered in-depth insights into the barriers and enablers of digital inclusion in the region. Qualitative data from interviews were coded and thematically analyzed to identify recur-ring narratives, such as perceptions of digital exclusion and strategies for improvement. Thematic coding was carried out iteratively to capture structural, spatial, and generational patterns relevant to smart policy design.
For the quantitative component, we relied exclusively on secondary data, including socio-economic and infrastructural indicators relevant to digital inequality. These were obtained from official statistical sources and regional administrative records. The selected indicators, such as internet access rates, educational attainment, and employment by sector, were chosen based on their established relevance in digital inclusion research and smart development policy frameworks [11,23,24]. Descriptive statistics were used to summarize spatial and demographic patterns, while comparative analysis highlighted disparities across different sub-regions.
GIS was employed not as a standalone method but as a spatial analysis and visualization tool. It supported techniques such as spatial disaggregation by administrative unit, overlaying demographic and internet access data, and comparative mapping to identify geographic patterns of digital exclusion.

3. Results

3.1. Quantitative Analysis

The findings presented in 
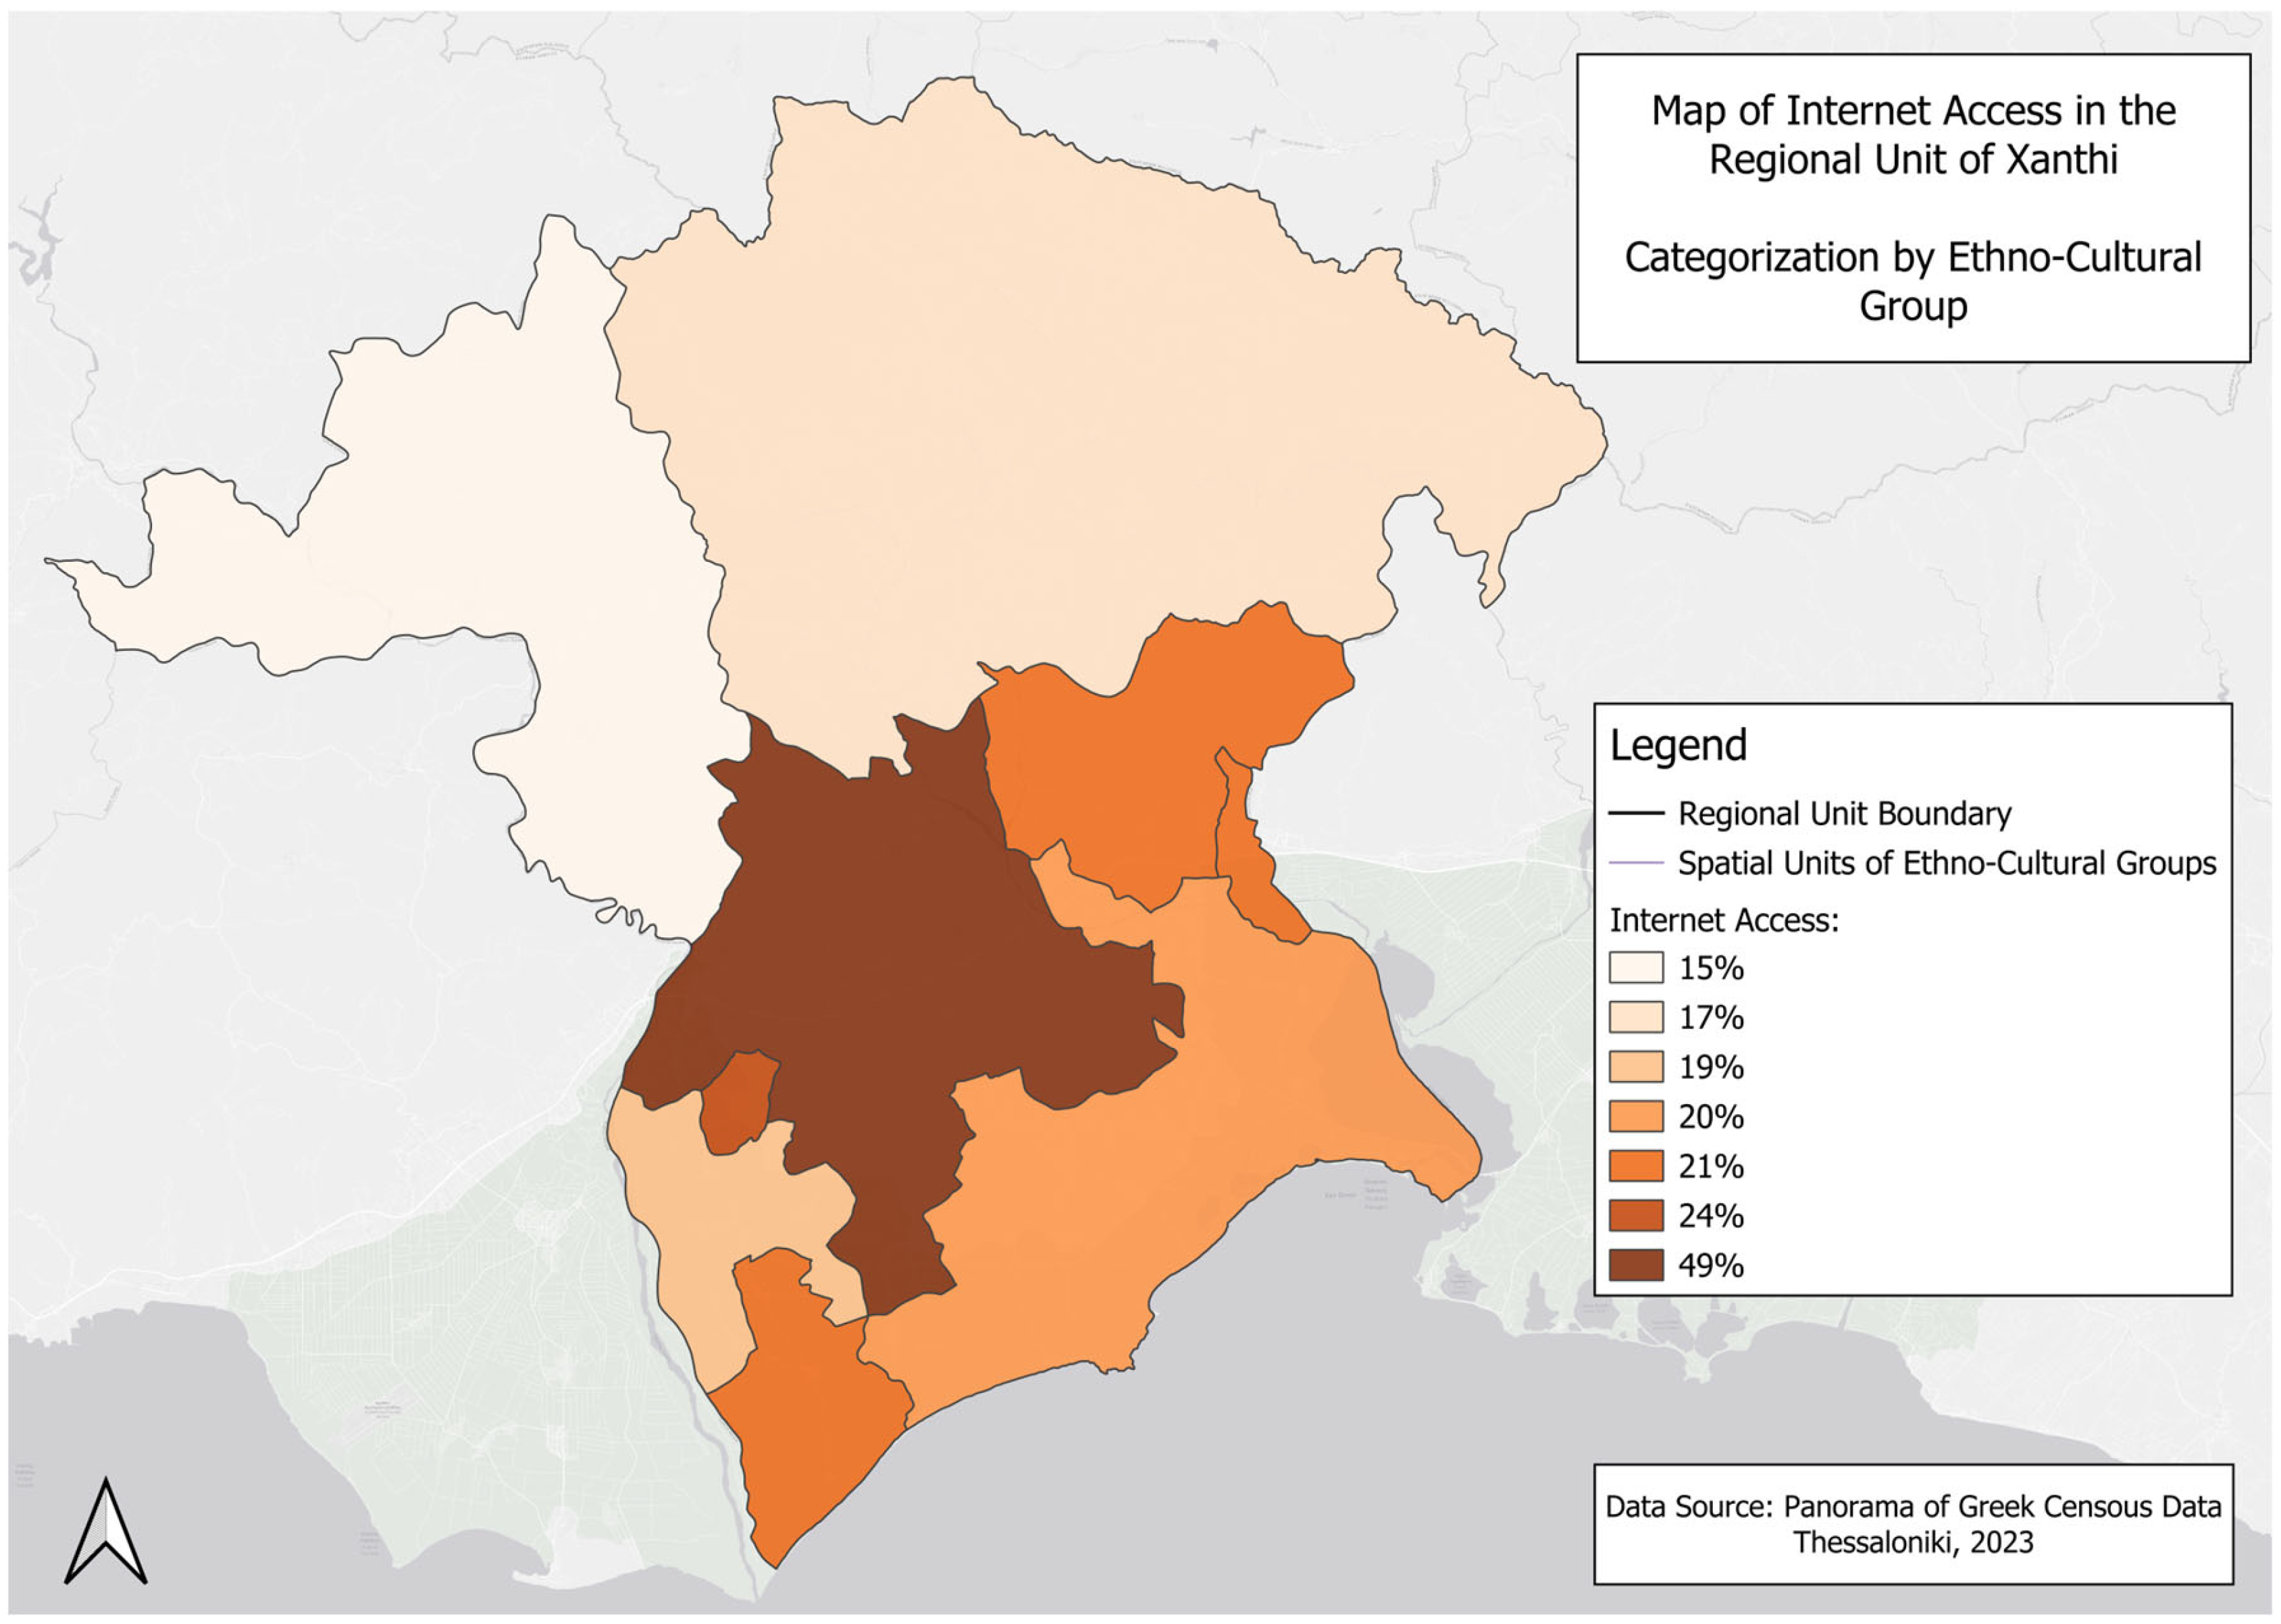
Table 1 highlight significant disparities in internet access across the Regional Unit of Xanthi and its municipalities. Including absolute population figures alongside internet access rates provides important context for interpreting spatial patterns of digital inequality. In small communities such as Paschalia (82 residents), Gerakas (270), and Galani (98), even minor fluctuations in access can result in large percentage changes, potentially exaggerating disparities. These cases highlight the need to consider demographic scale when evaluating connectivity gaps, as low population density often compounds infrastructural and service limitations in rural areas.
Overall, only 38% of the population in the Regional Unit of Xanthi has access to the internet, while 62% remains without access. The municipality-level data reveal striking contrasts: the Municipality of Xanthi, classified as urban, has the highest internet access rate at 48%, followed by Abdera (27%), Topeiros (21%), and Myki, with the lowest rate at just 17%. Within municipal units and local communities, these disparities become even more pronounced. For example, areas like Diomidia (41%) and Magiko (40%) report higher access rates, while remote and rural areas such as Thermi, Kotyli, and Paschalia report no internet access (0%). Similarly, in Myki Municipality, Oraio and Satra show internet access rates of only 5% and 1%, respectively.
The urban–rural divide is evident, with urban areas like Xanthi city (51%) exhibiting relatively higher connectivity compared to extremely underserved regions, including Selino (1%) and Dafnonas (16%). The data also reflects socio-economic and infrastructural disparities that influence access, emphasizing the need for targeted interventions to bridge these gaps and promote equitable digital participation across the region.
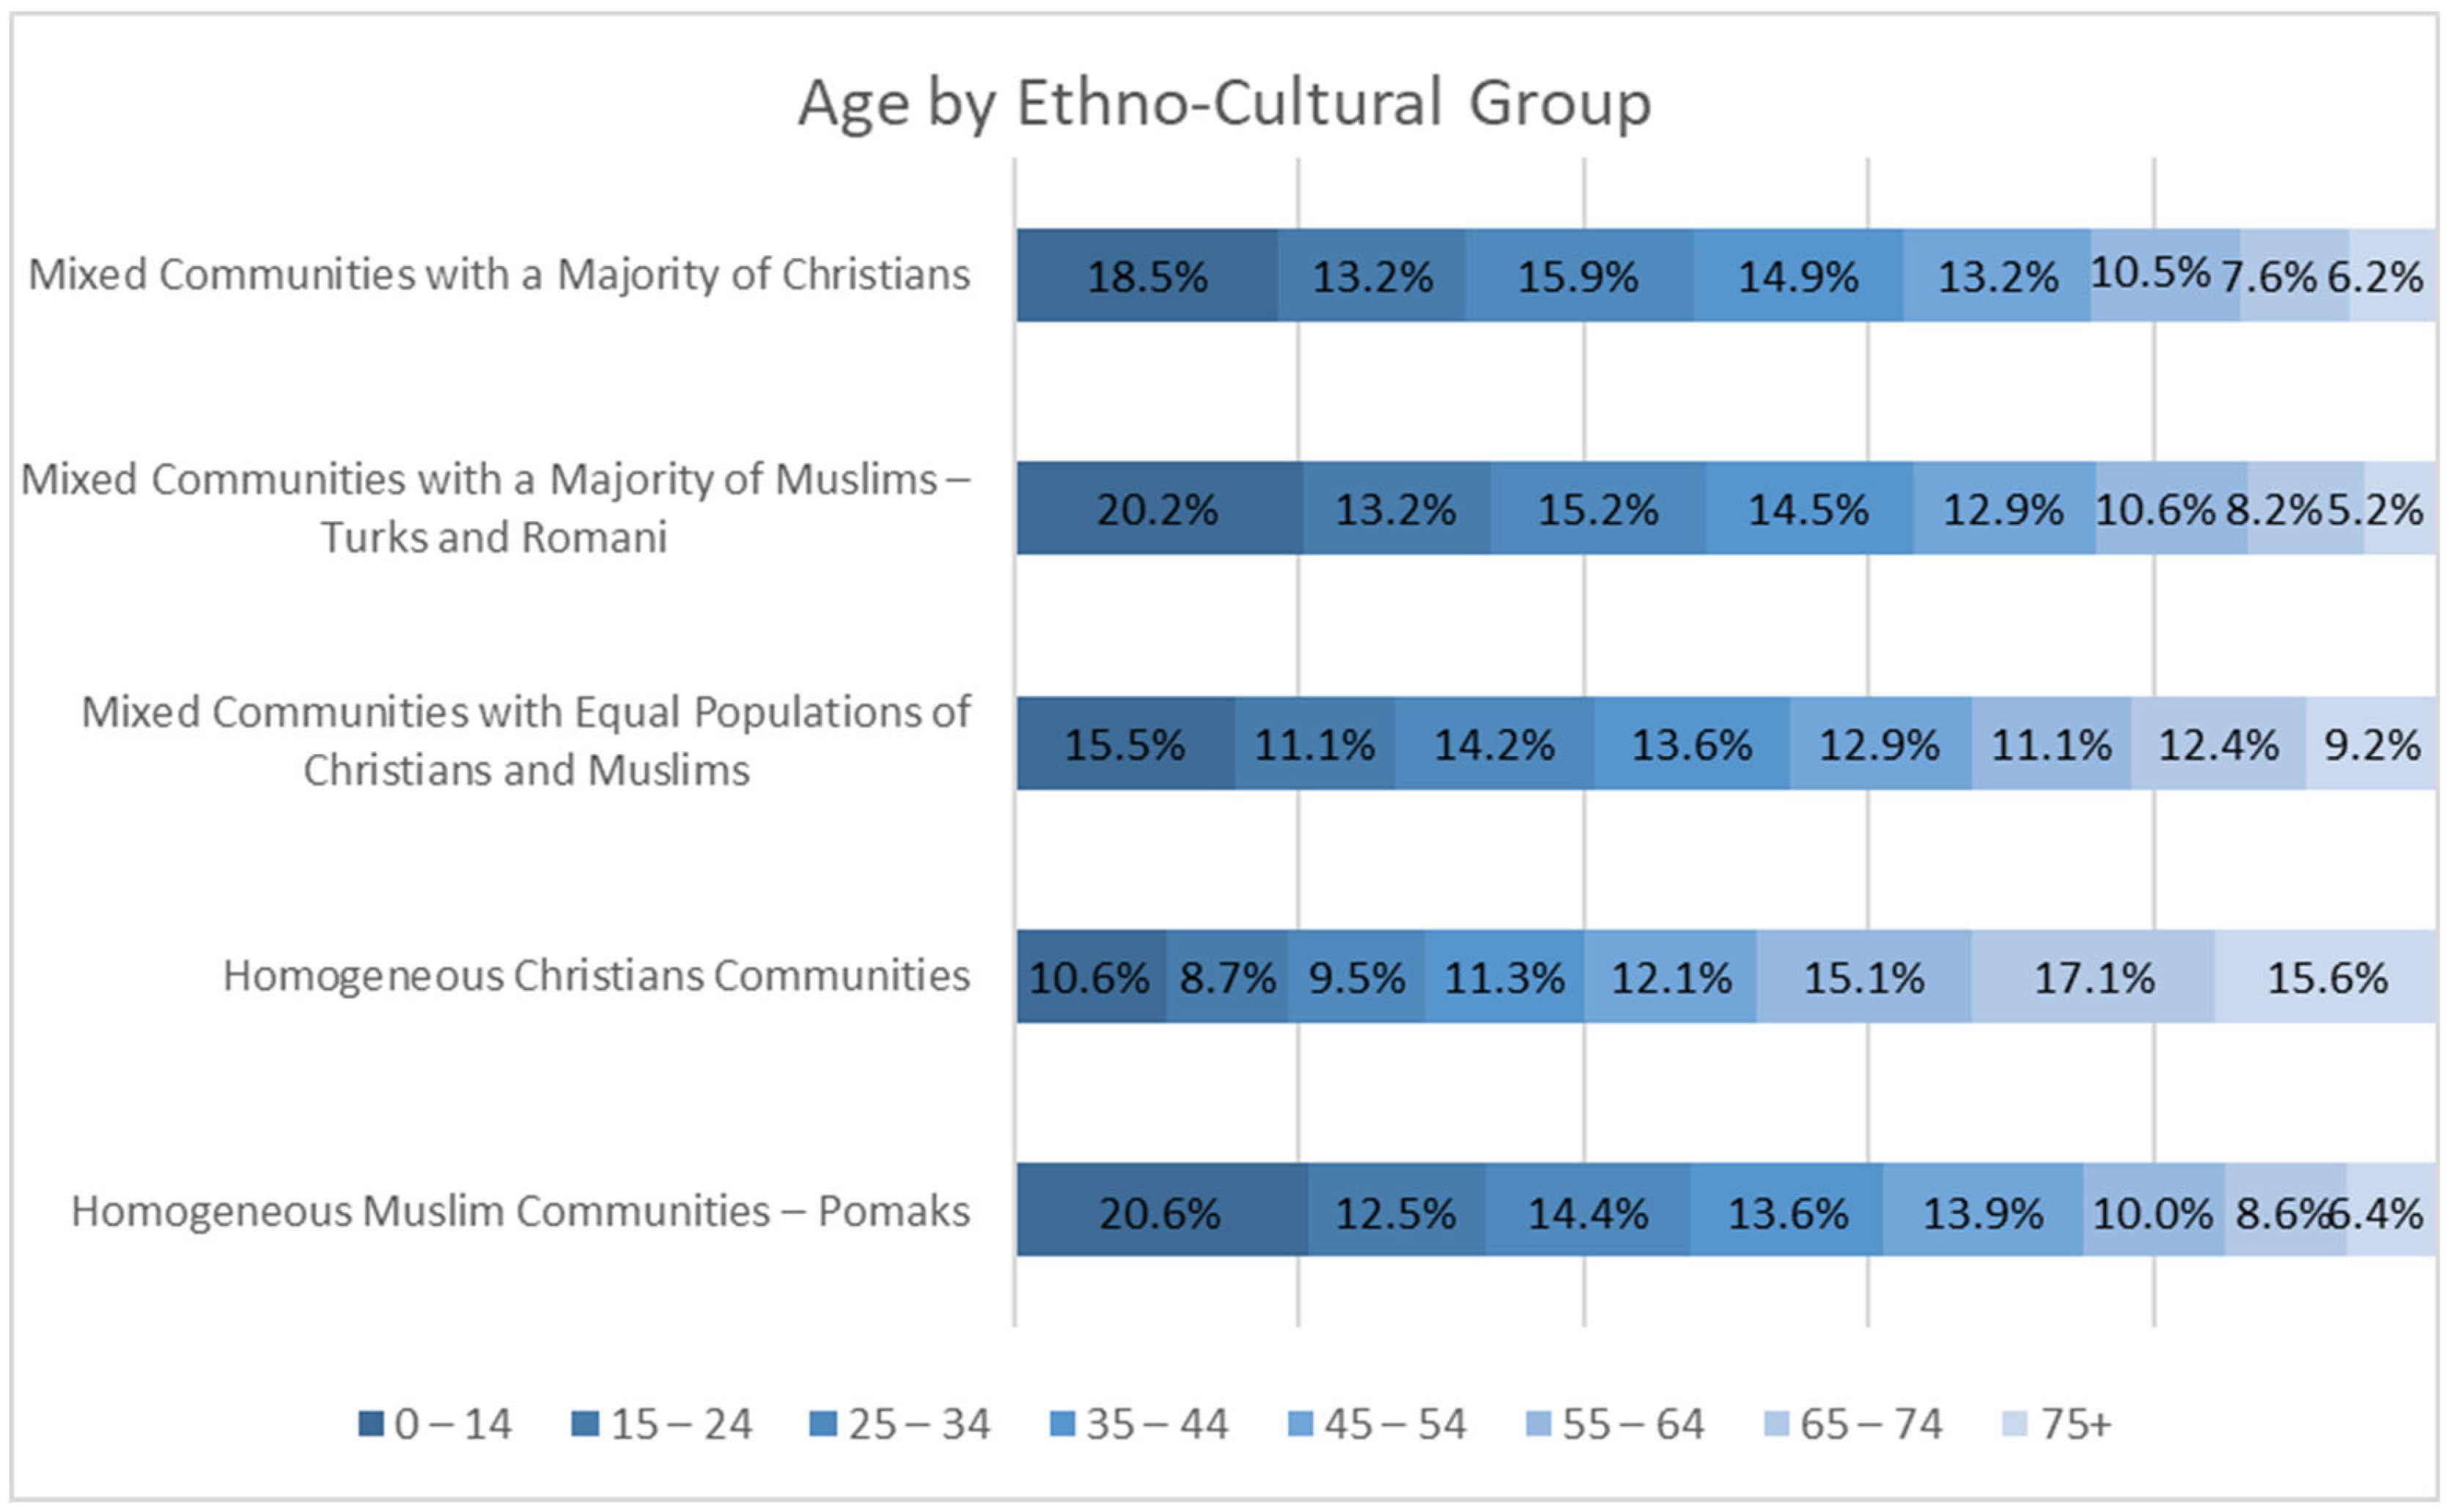
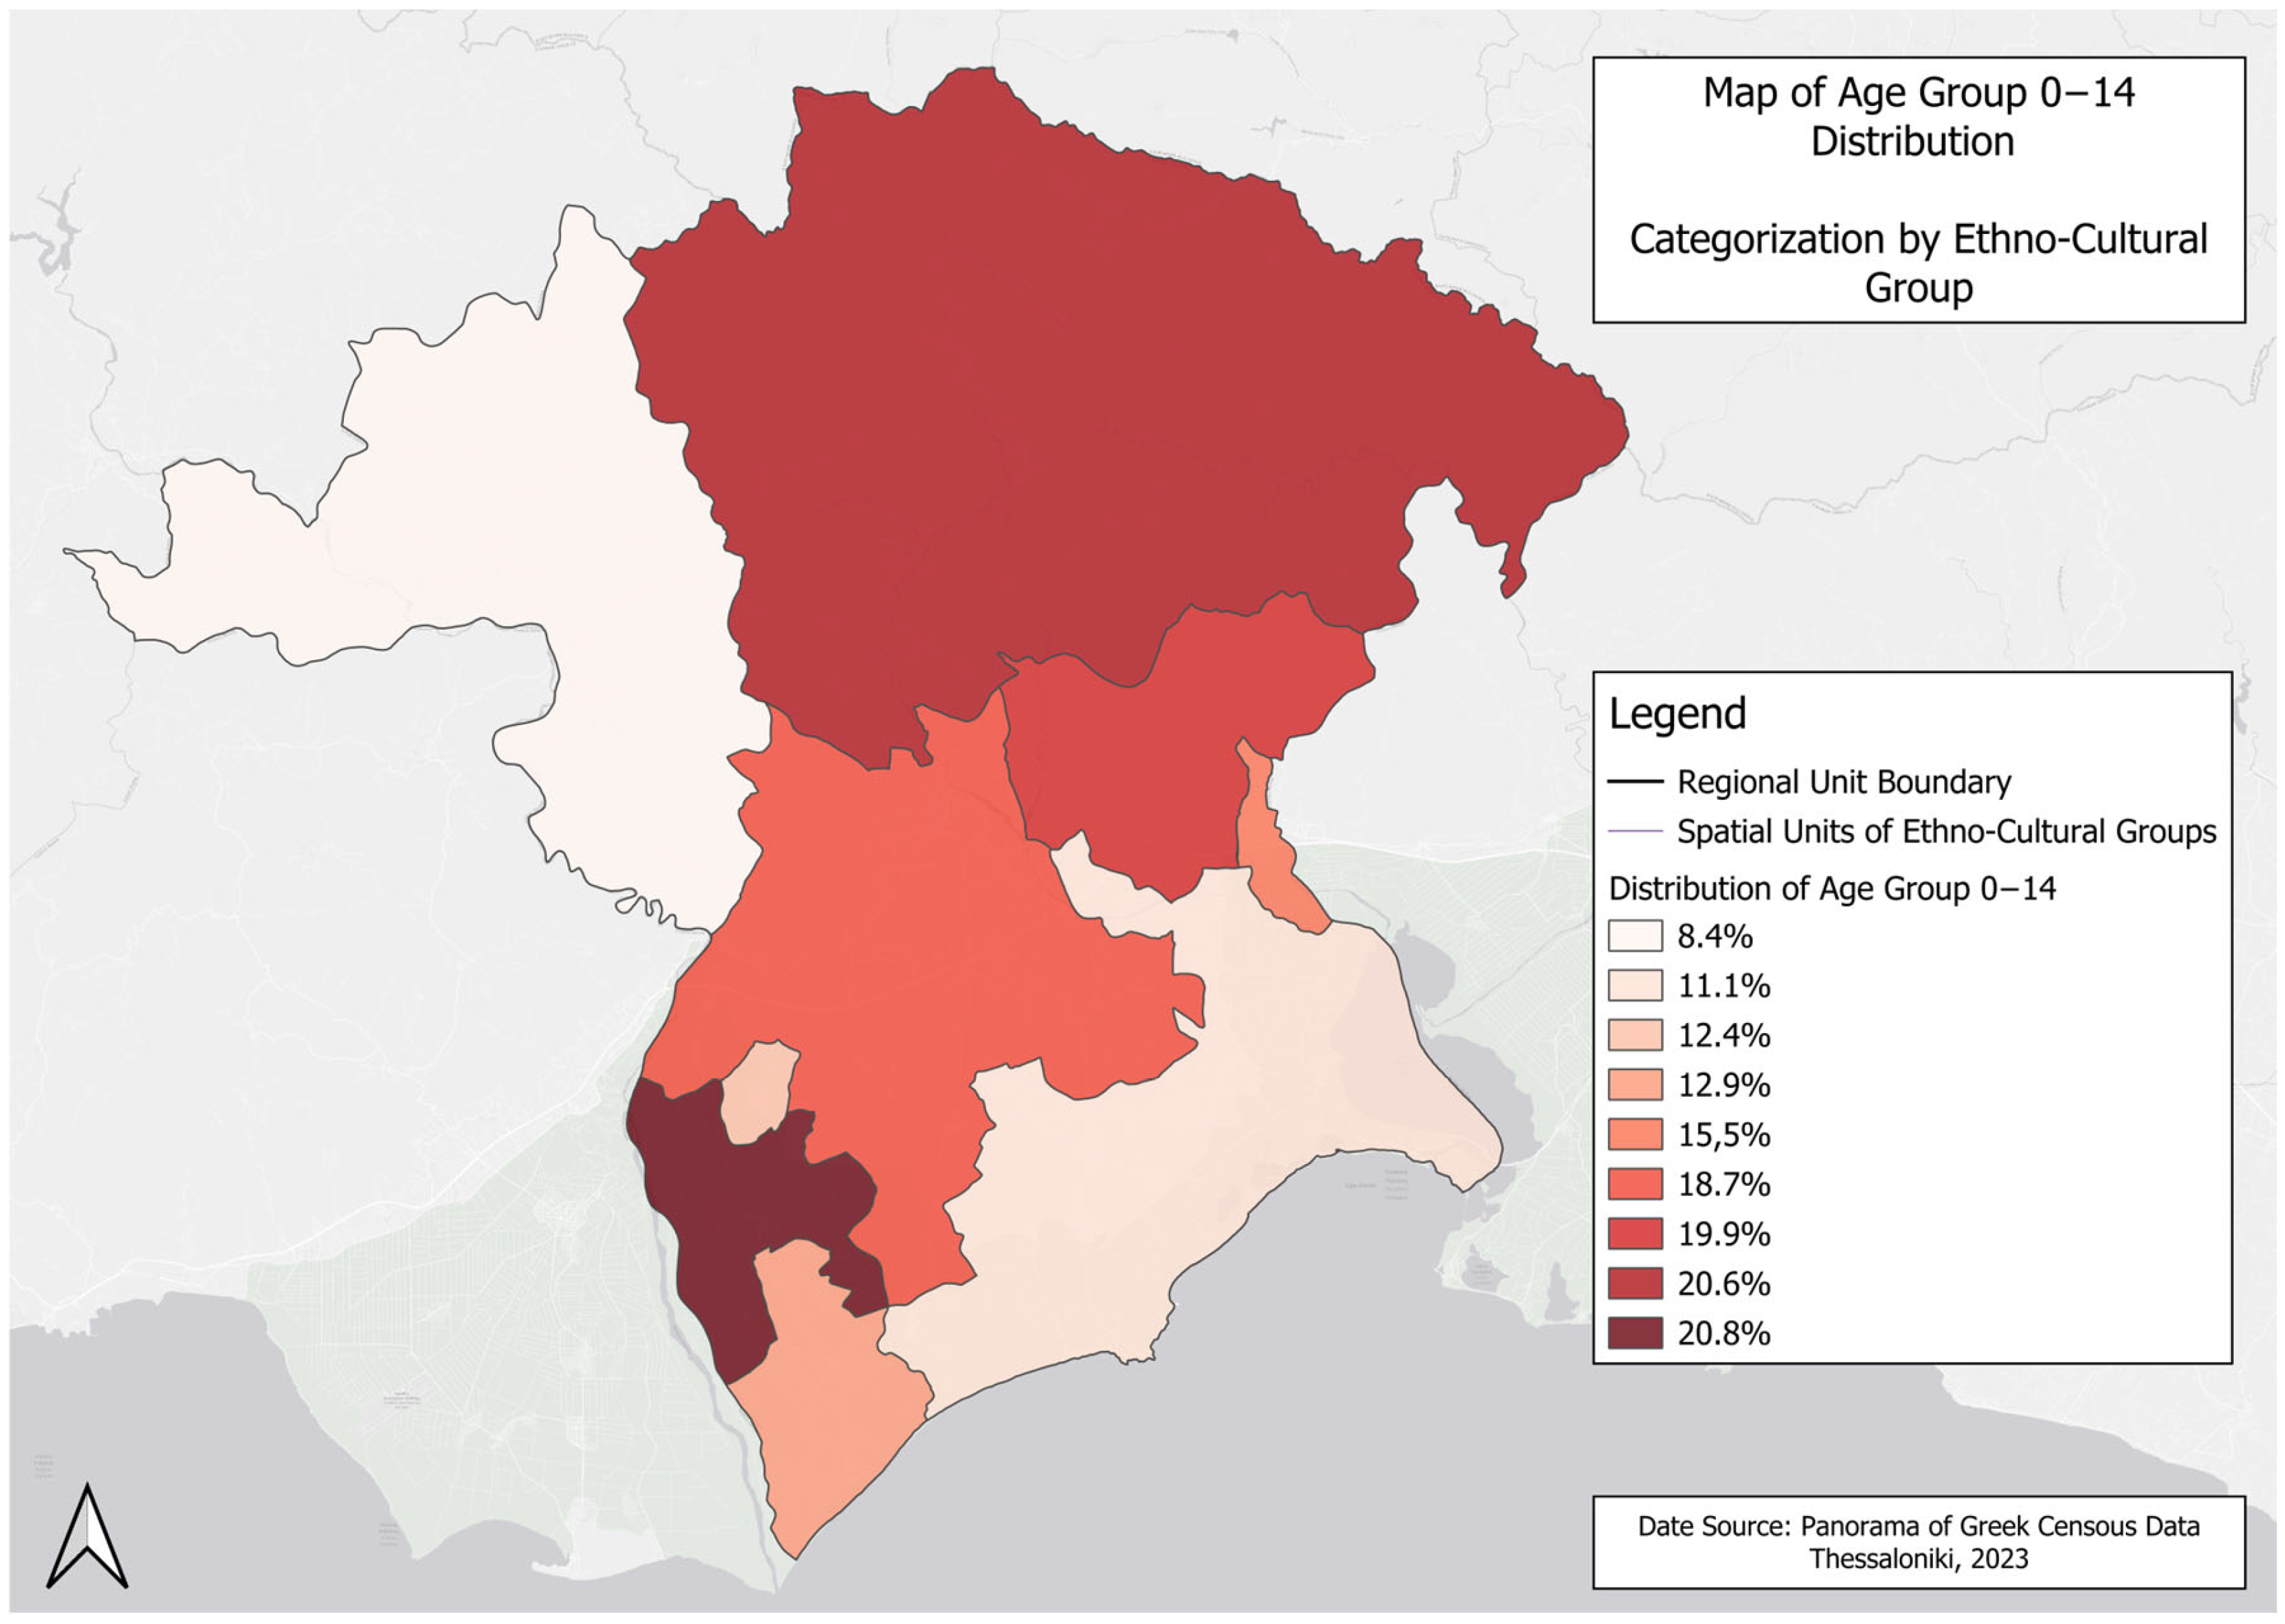
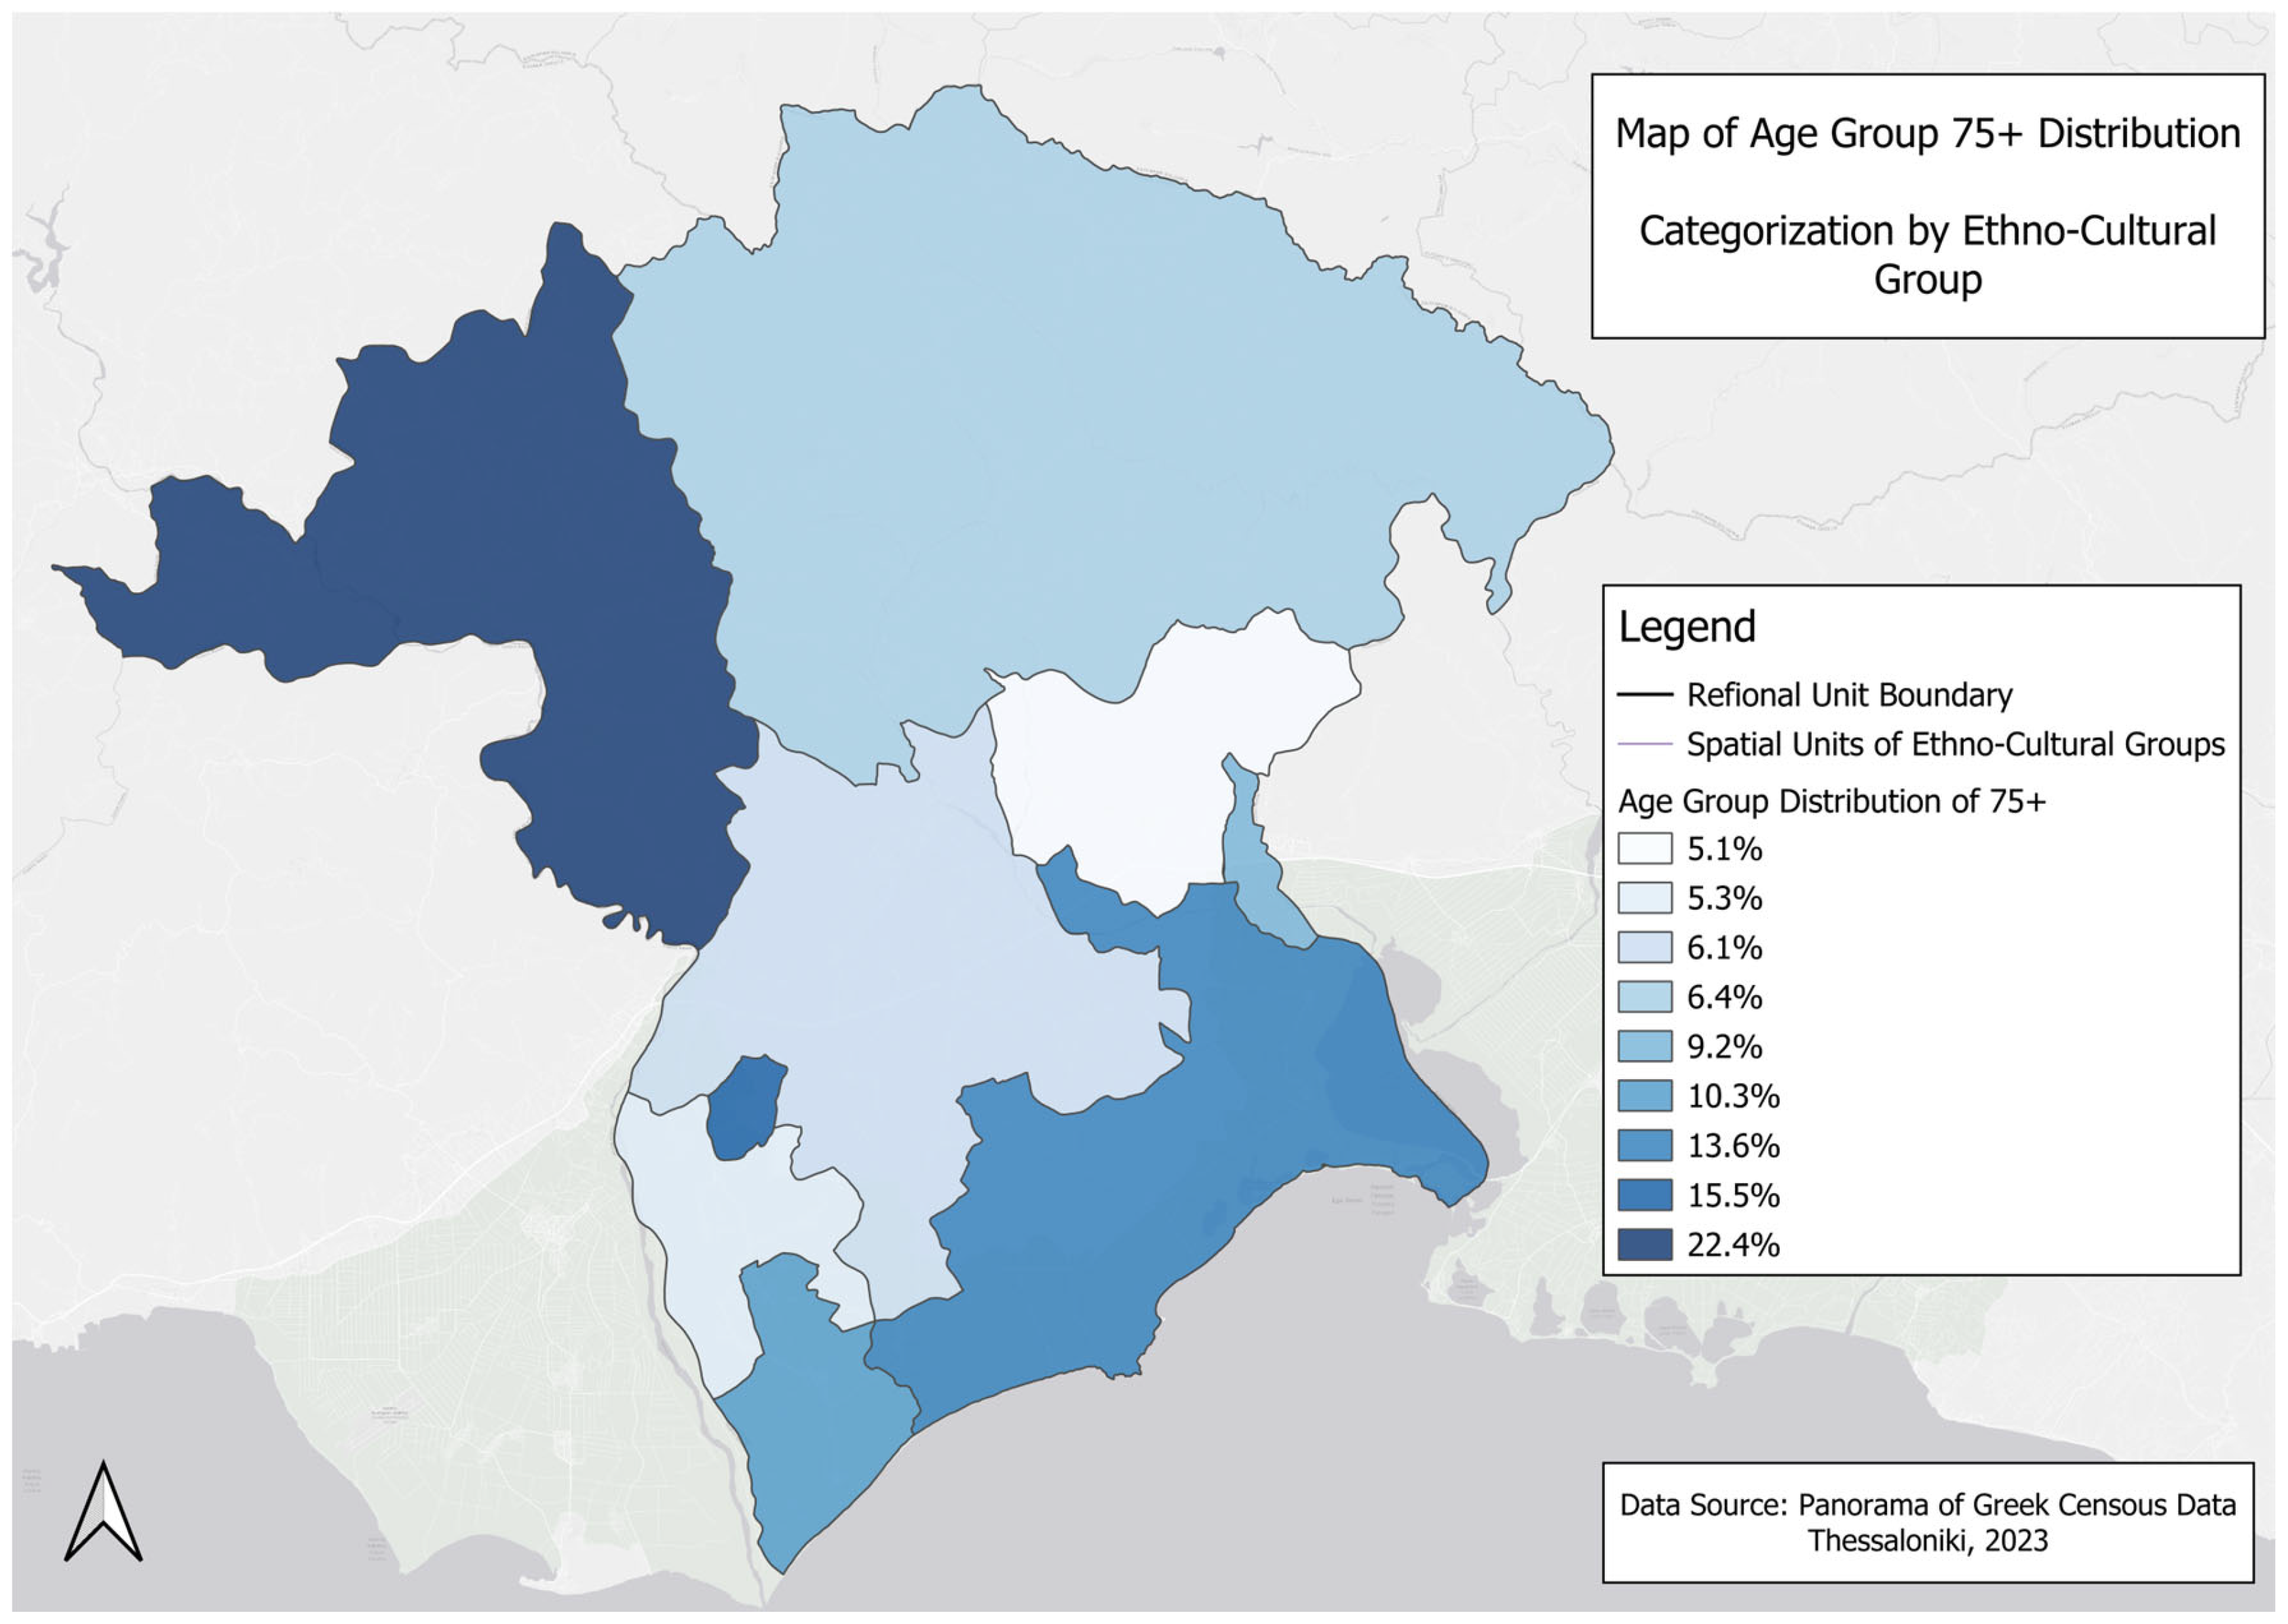
Figure 4 shows the age distribution across different ethno-cultural groups in the study area. Homogeneous Muslim Communities have a notable concentration of younger age groups, with the 0–14 age group at 20.6%, while older age groups, particularly 75+ (6.4%), are much smaller. In contrast, Homogeneous Christian Communities display a larger proportion of older populations, with the 65–74 age group at 17.1% and the 75+ age group at 15.6%, reflecting an aging demographic. Mixed communities with an equal population of Christians and Muslims exhibit a balanced distribution, with the highest concentration in the 25–34 age group (14.2%), while the older age groups are less prominent. Similarly, Mixed communities with a majority of Muslims (Turks and Romani) also show a younger demographic, with the 0–14 age group accounting for 20.2%, and the 75+ group being the smallest (5.2%). Finally, mixed communities with a majority of Christians reflect a slightly older population, with higher proportions in the 35–44 age group (14.9%) and relatively lower percentages in the younger 0–14 group (18.5%). Overall, the diagram highlights that younger age groups dominate in Muslim-majority areas, while Christian-majority areas exhibit a more aging population, particularly in homogeneous communities.
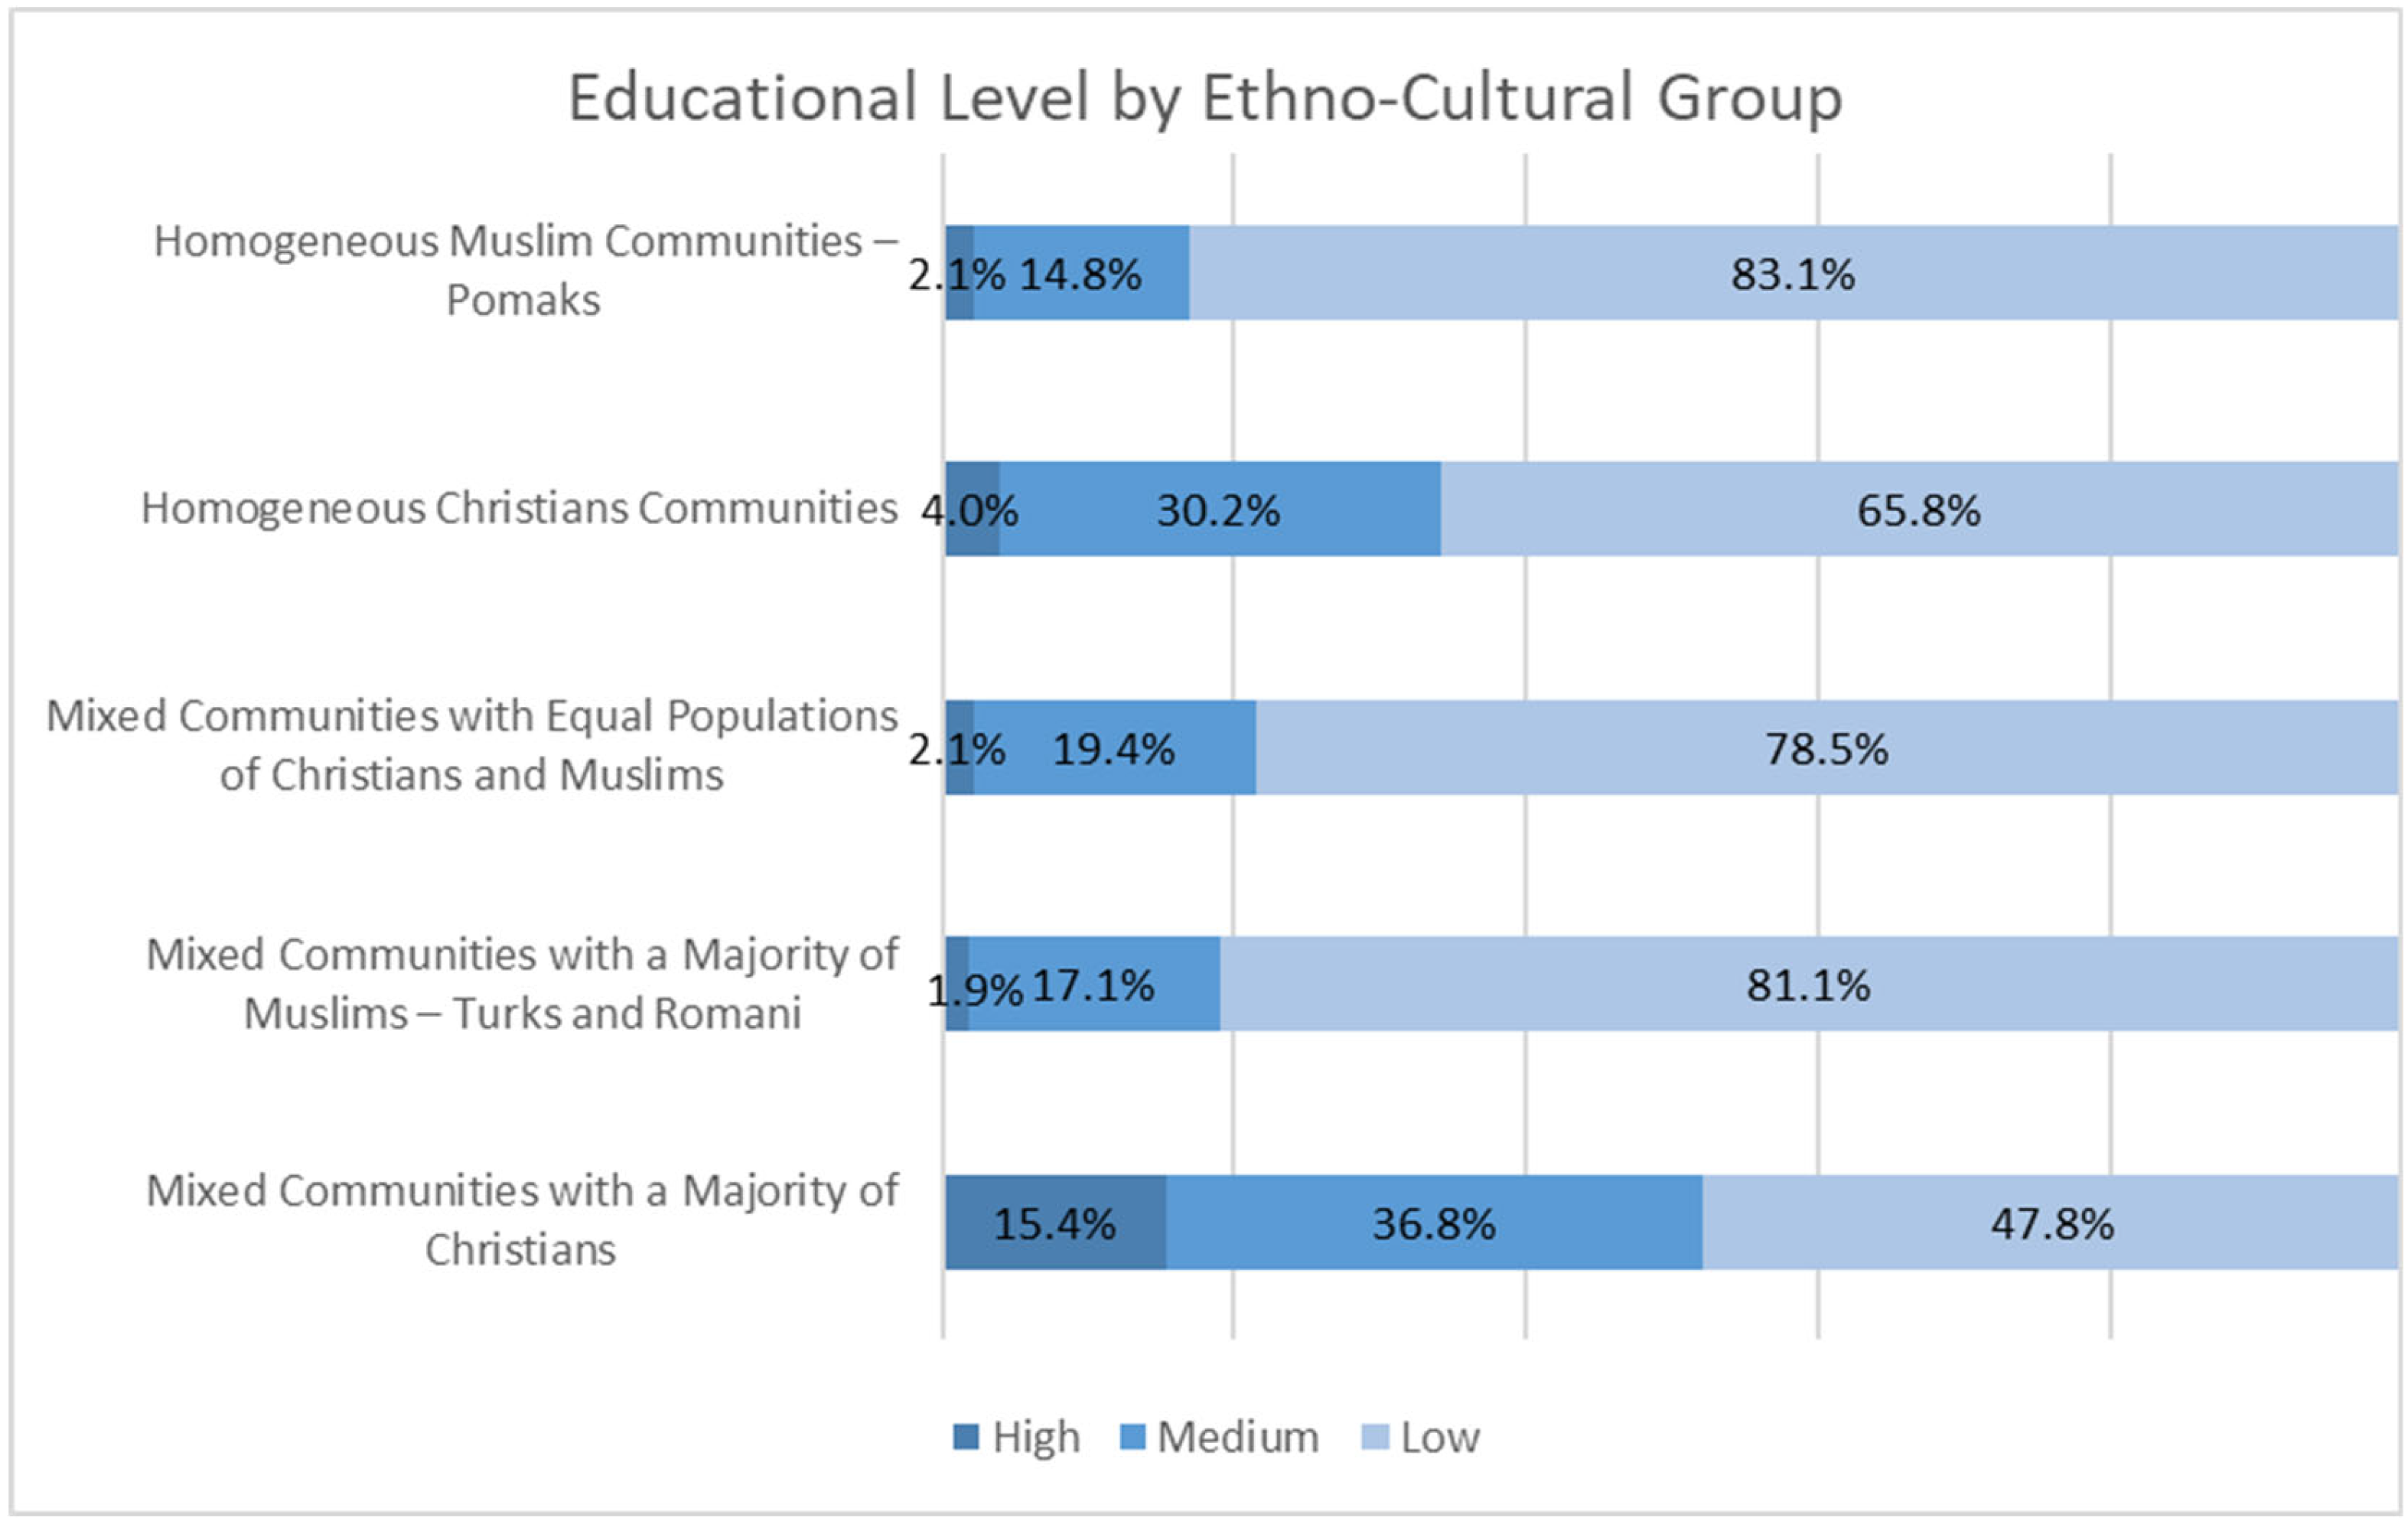
Figure 5 presents aggregated educational attainment grouped into three categories: low (including below primary, primary, and compulsory education), medium (comprising secondary and post-secondary education), and high (encompassing tertiary and postgraduate education). The data reveal pronounced disparities across ethno-cultural groups. Homogeneous Muslim communities and Muslim-majority mixed areas show the highest shares of low education levels (83.2% and 81.0%, respectively), with minimal representation in the high category. In contrast, homogeneous Christian and Christian-majority mixed communities display significantly greater shares in medium and high educational attainment—most notably, 15.4% of residents in Christian-majority mixed communities have completed tertiary or postgraduate education. These differences illustrate how educational inequality aligns with broader patterns of socio-spatial and ethno-cultural exclusion.
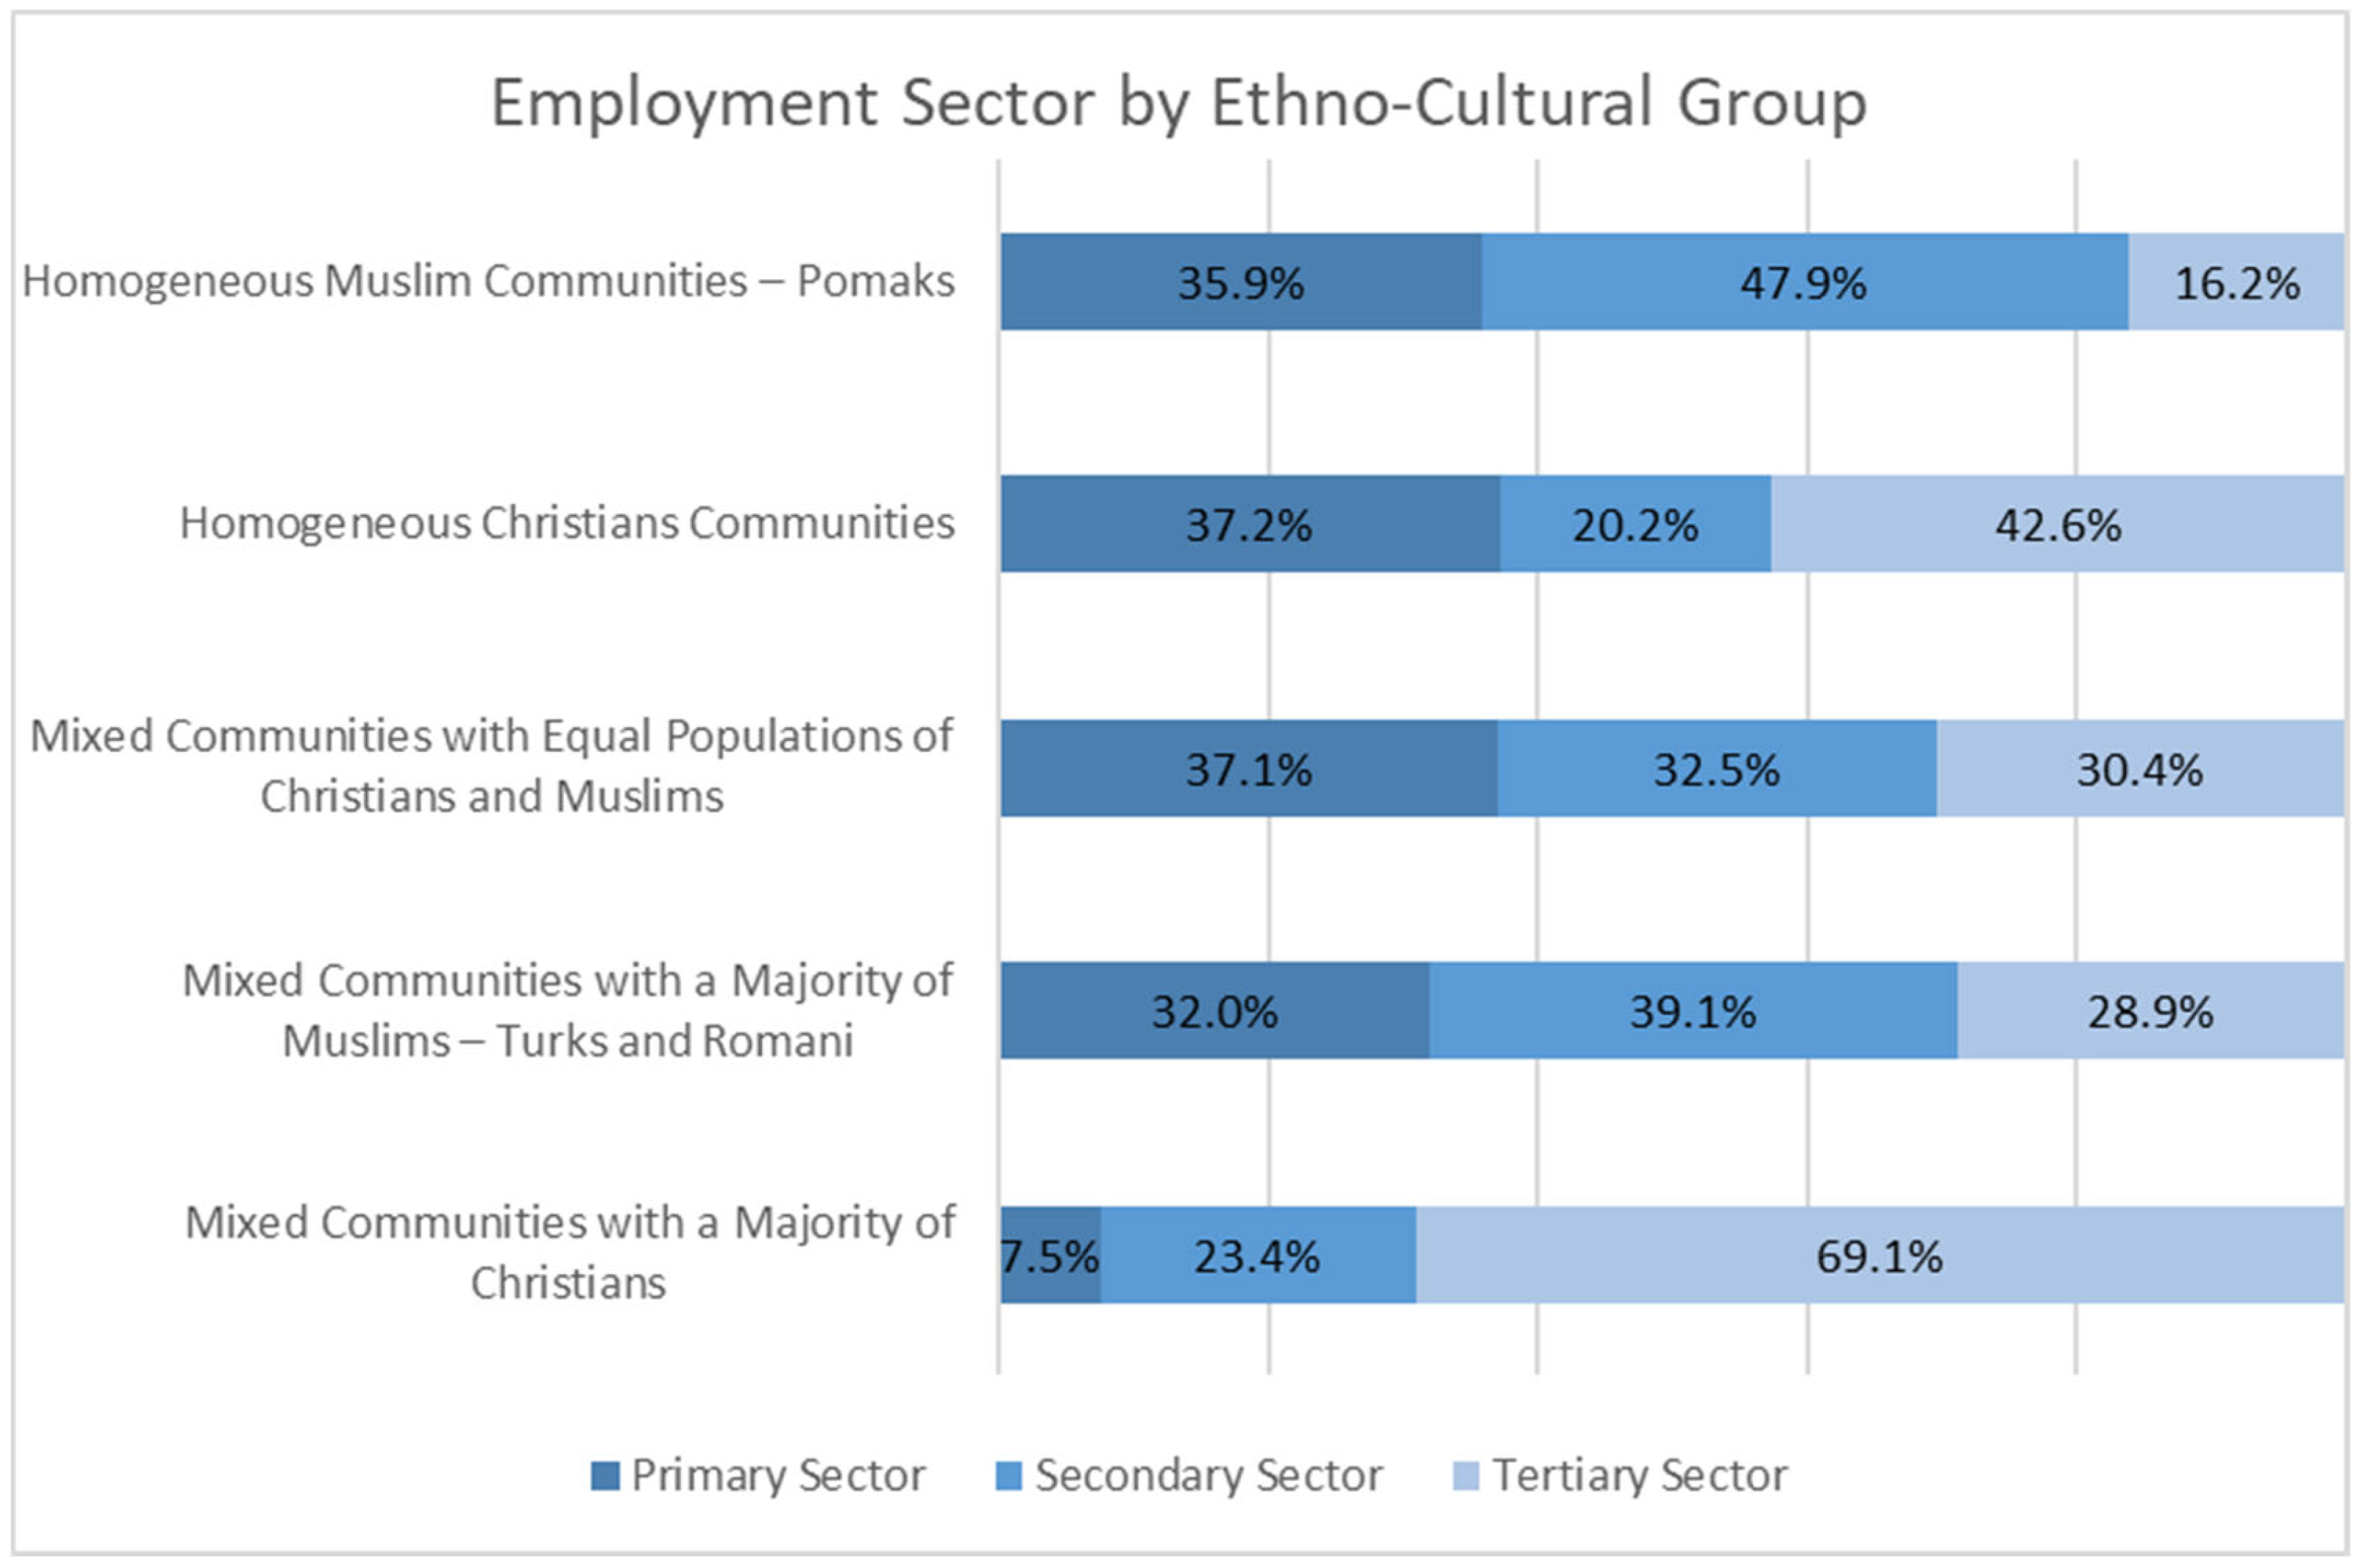
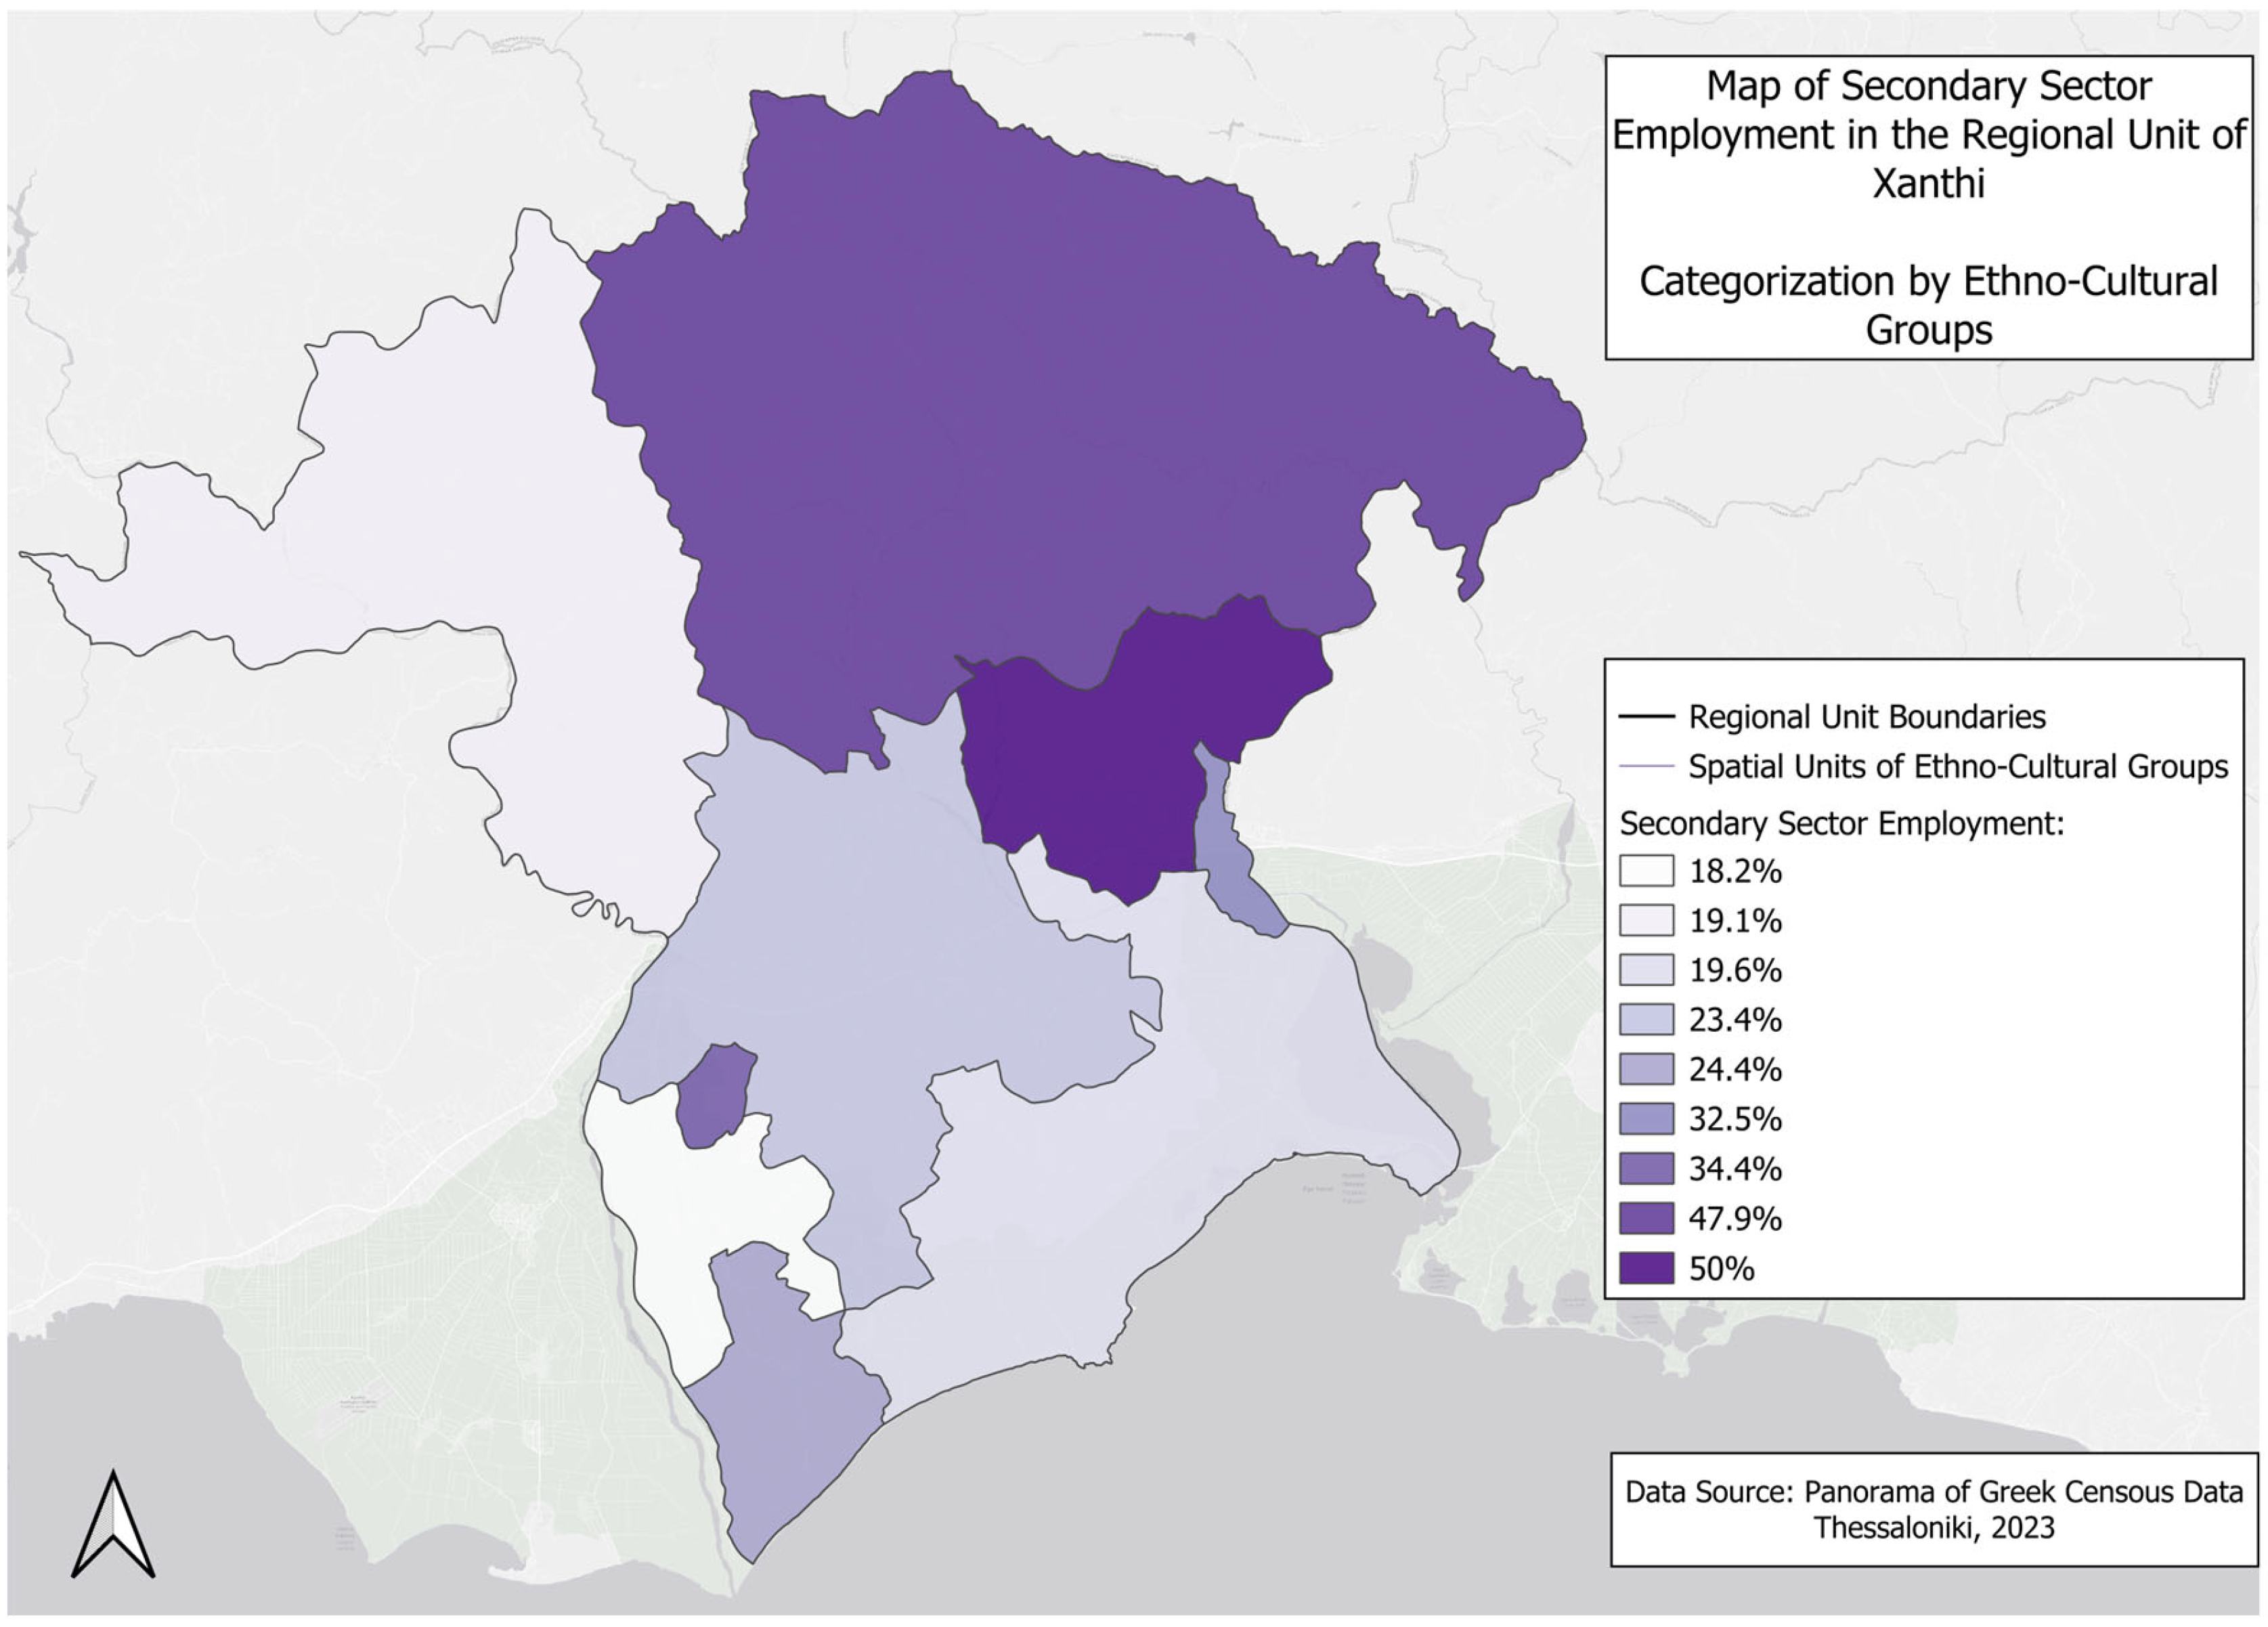
Figure 6 highlights employment sector differences across ethno-cultural groups. Homogeneous Muslim Communities and Muslim-majority mixed communities rely heavily on the Secondary and Primary Sectors, with limited engagement in the Tertiary Sector. In contrast, Homogeneous Christian Communities and Mixed Christian-majority communities show higher employment in the Tertiary Sector, with the latter reaching 69.1%, reflecting a service-oriented economic profile. The data reveal a clear divide, with Muslim-majority and rural communities more dependent on primary and secondary production, while Christian-majority groups are more integrated into the tertiary sector. These disparities highlight the urgent need for context-aware smart inclusion policies tailored to the needs of rural and multiethnic populations.

3.2. Spatial Analysis

The spatial analysis draws on two overlapping but distinct scales: (1) administrative boundaries (municipalities and local communities), which correspond to institutional structures and infrastructural planning, and (2) ethno-cultural groupings, which reflect the social and demographic realities that influence digital behavior and exclusion. By working across these two spatial lenses, the analysis captures both formal governance frameworks and informal socio-cultural dynamics, offering a more nuanced understanding of how digital inequality is produced and experienced in the region
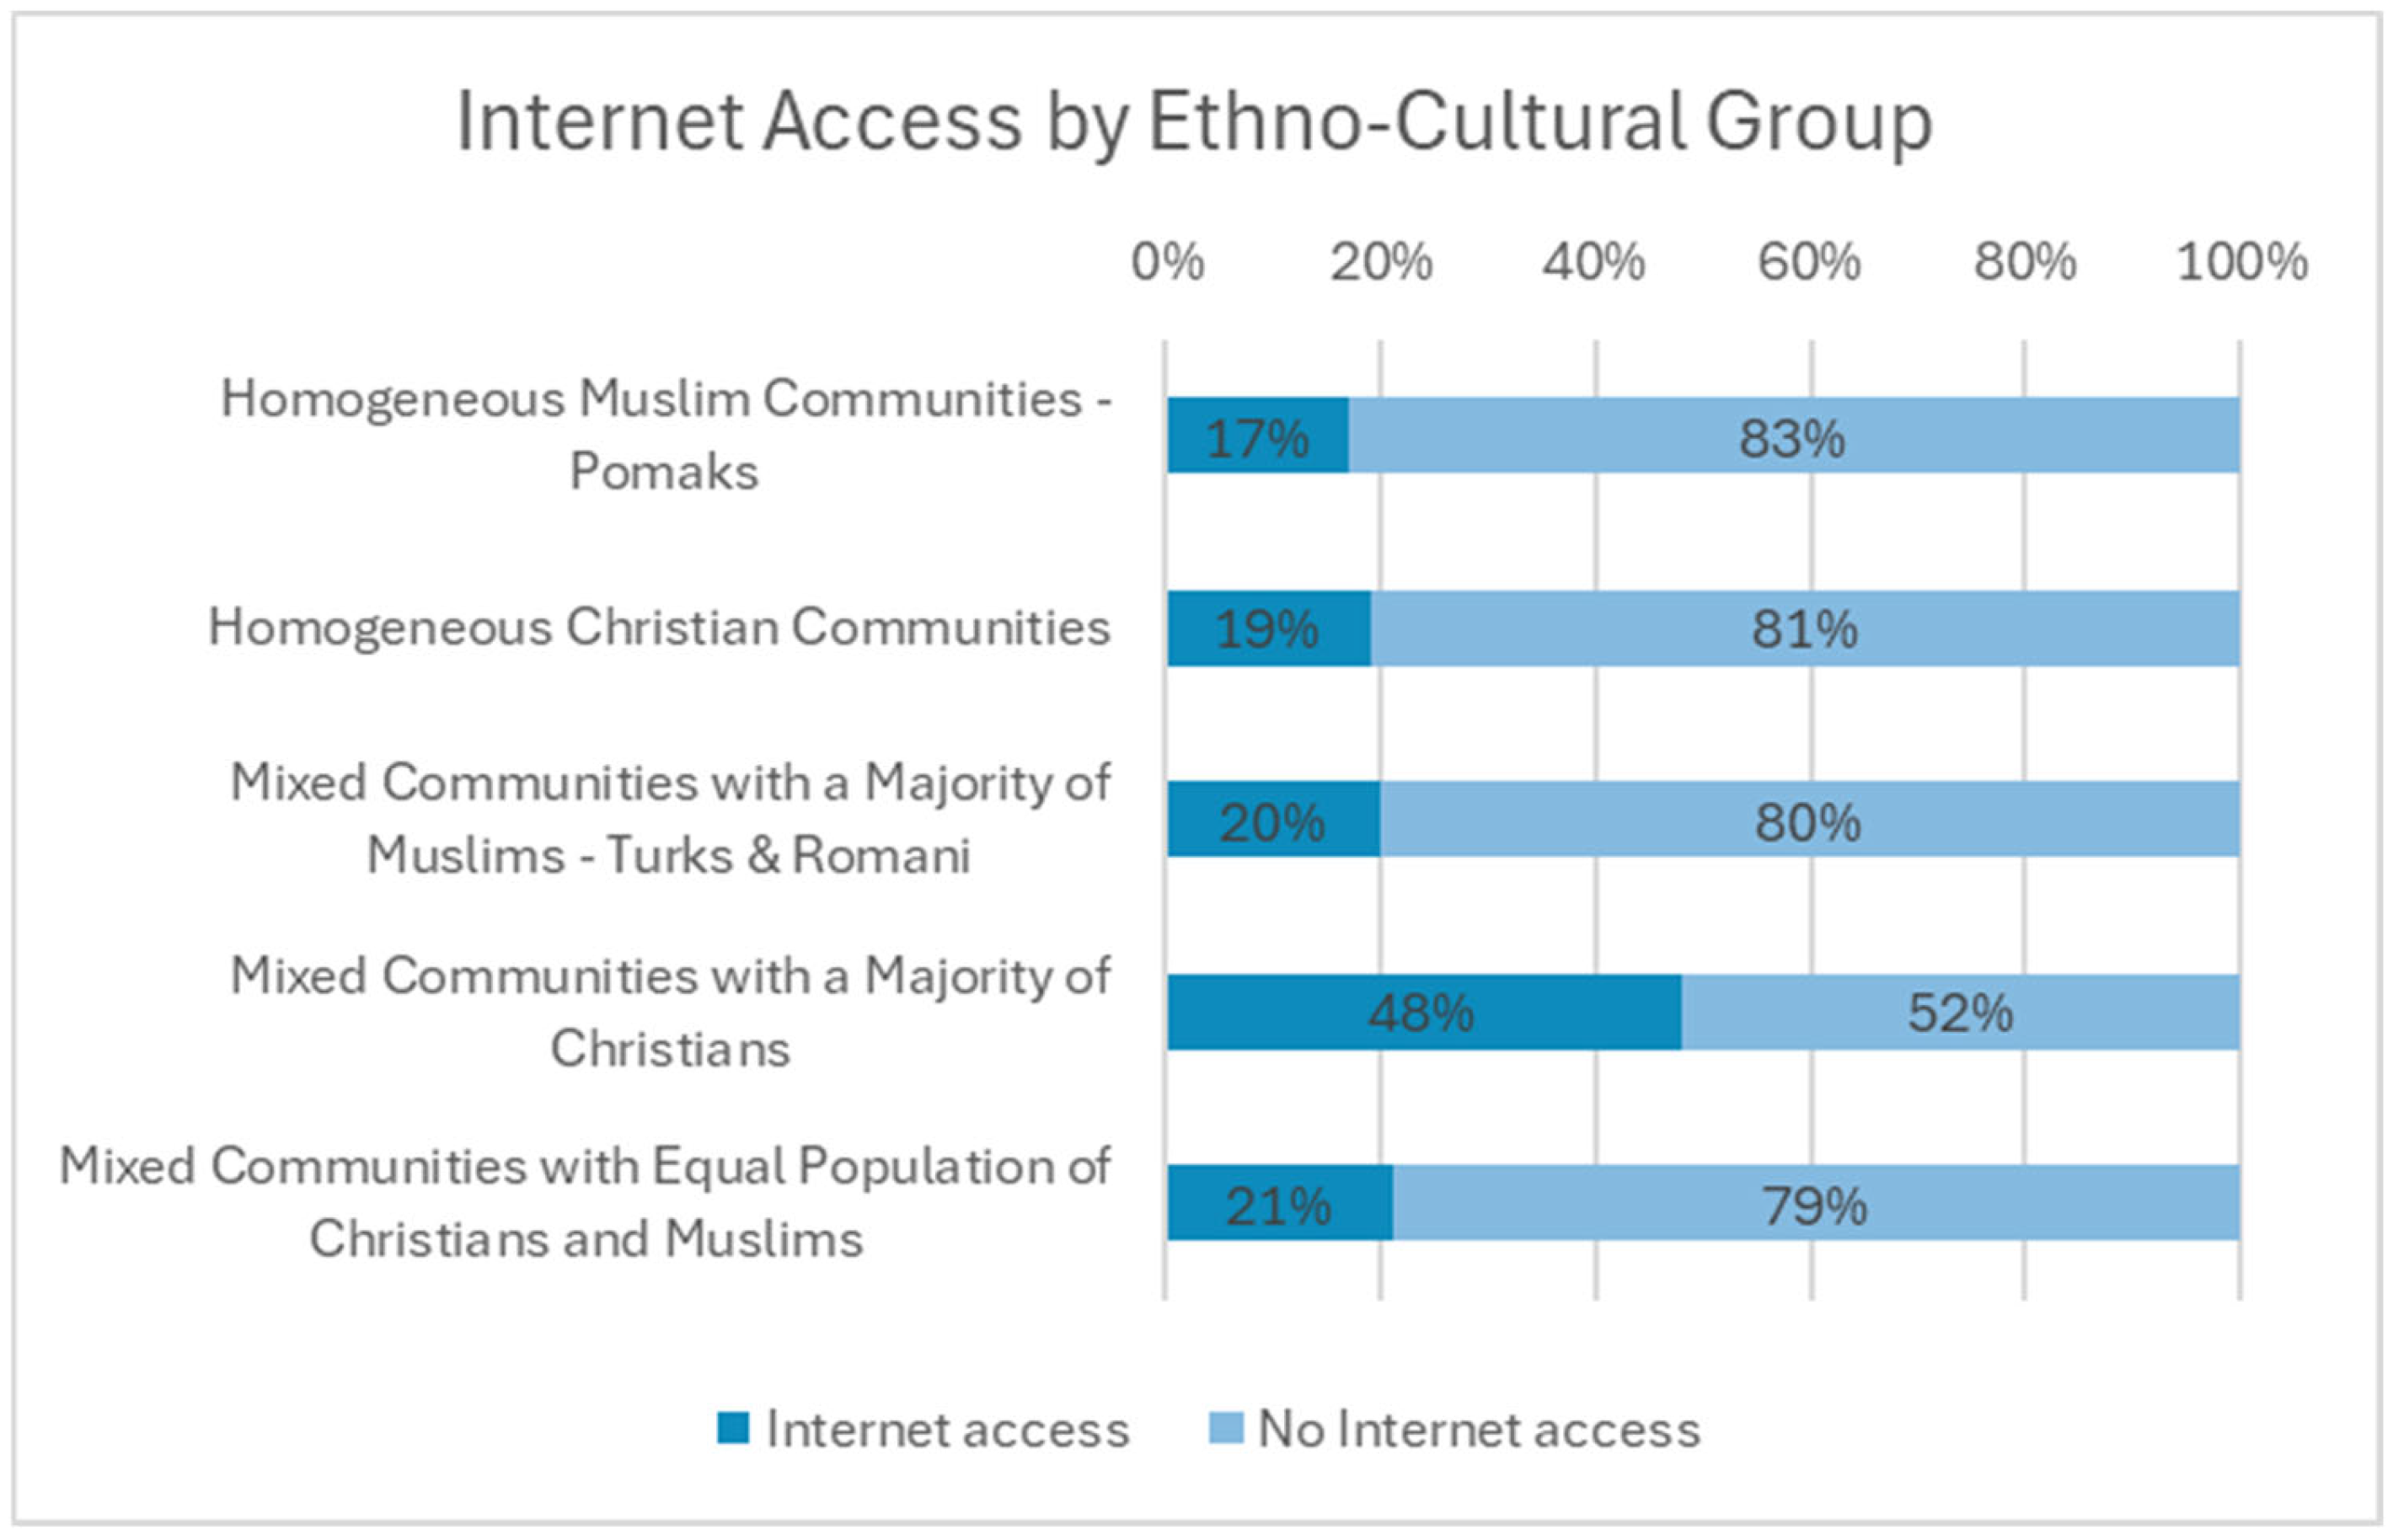
Figure 7 illustrates significant disparities in internet access among ethno-cultural groups within the studied region.
Homogeneous Muslim communities exhibit the lowest internet access rate (17%), followed closely by homogeneous Christian communities (19%) and mixed communities with a majority of Muslims (20%). In contrast, mixed communities with a majority of Christians have the highest internet access rate (48%), indicating better infrastructural and socio-economic conditions. Mixed communities with an equal population of Christians and Muslims show slightly higher access (21%) but remain closer to the access levels of the most disadvantaged groups. These findings underscore the influence of socio-spatial and ethno-cultural factors on digital inequality, with Muslim and rural communities facing significant exclusion, emphasizing the need for targeted policies to address these disparities.
While urban centers, particularly the city of Xanthi, are predominantly inhabited by Christian-majority populations, there are also Christian communities in mountainous rural areas, especially in the northwestern part of the region. Conversely, Muslim groups (including Pomak and Romani communities) are primarily concentrated in rural and semi-rural areas, with limited representation in the urban core. This uneven spatial distribution intersects with both ethnic and urban–rural divides, making it important to distinguish between their respective influences on digital access.
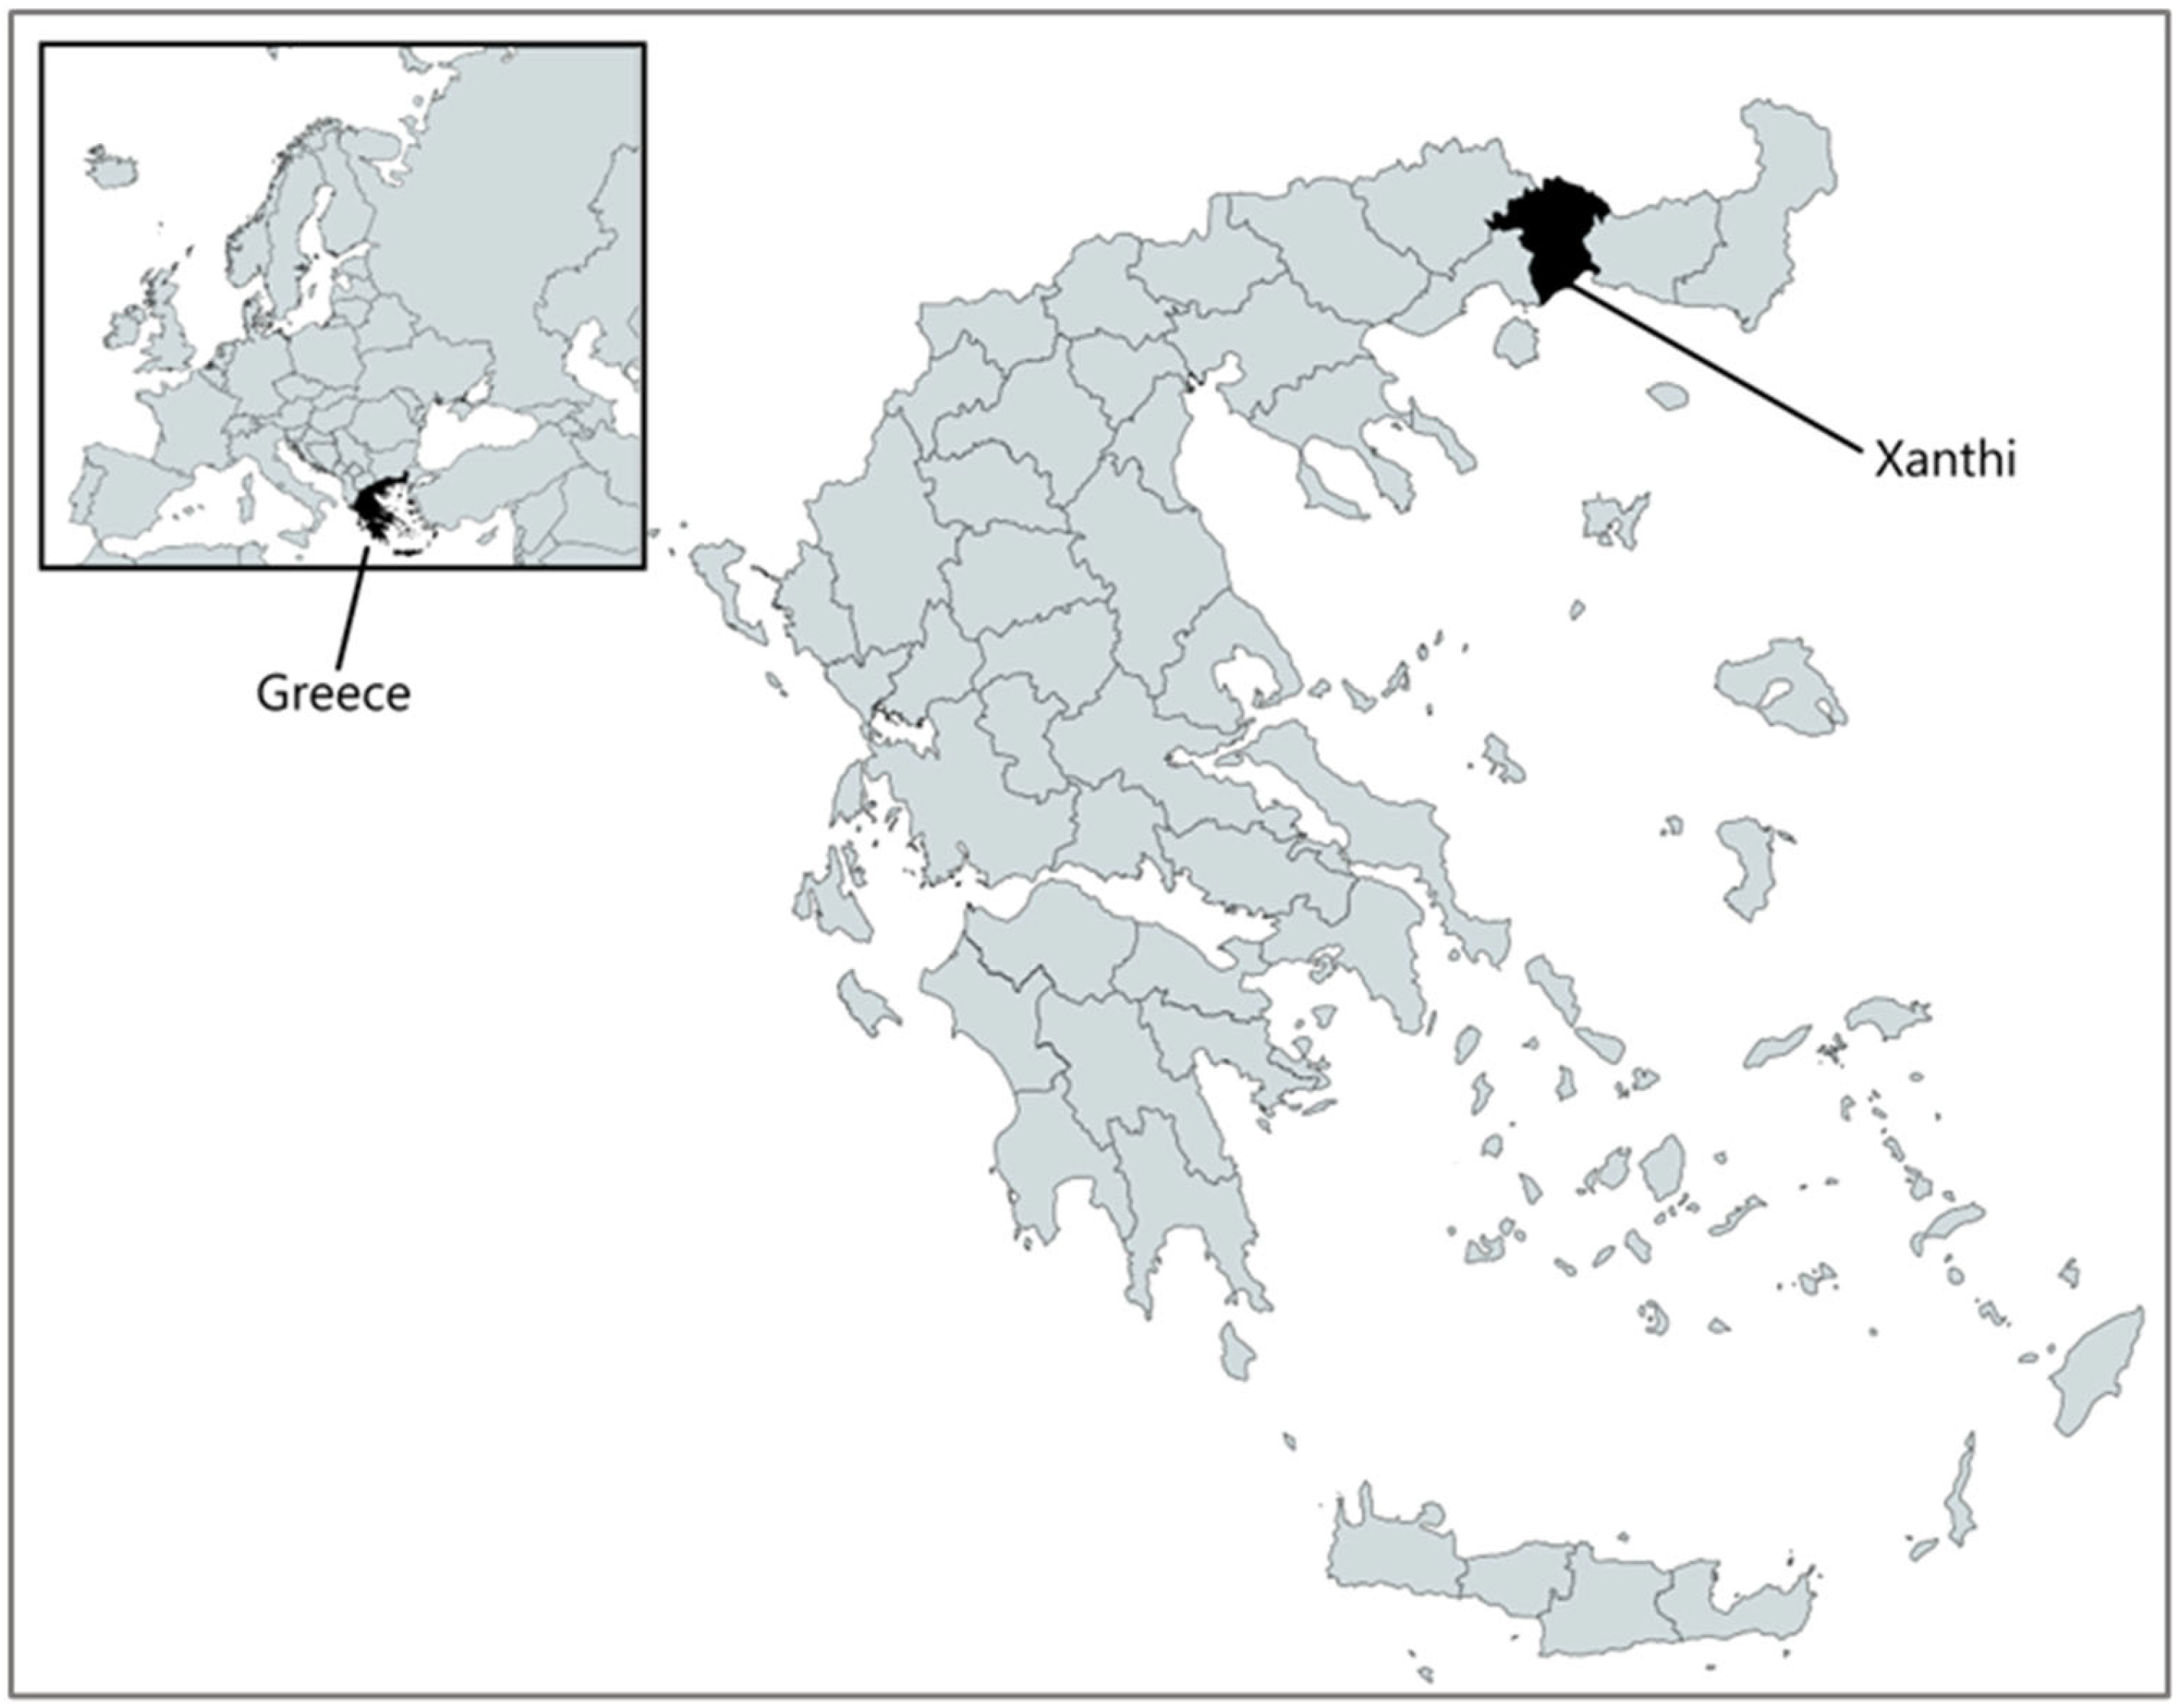
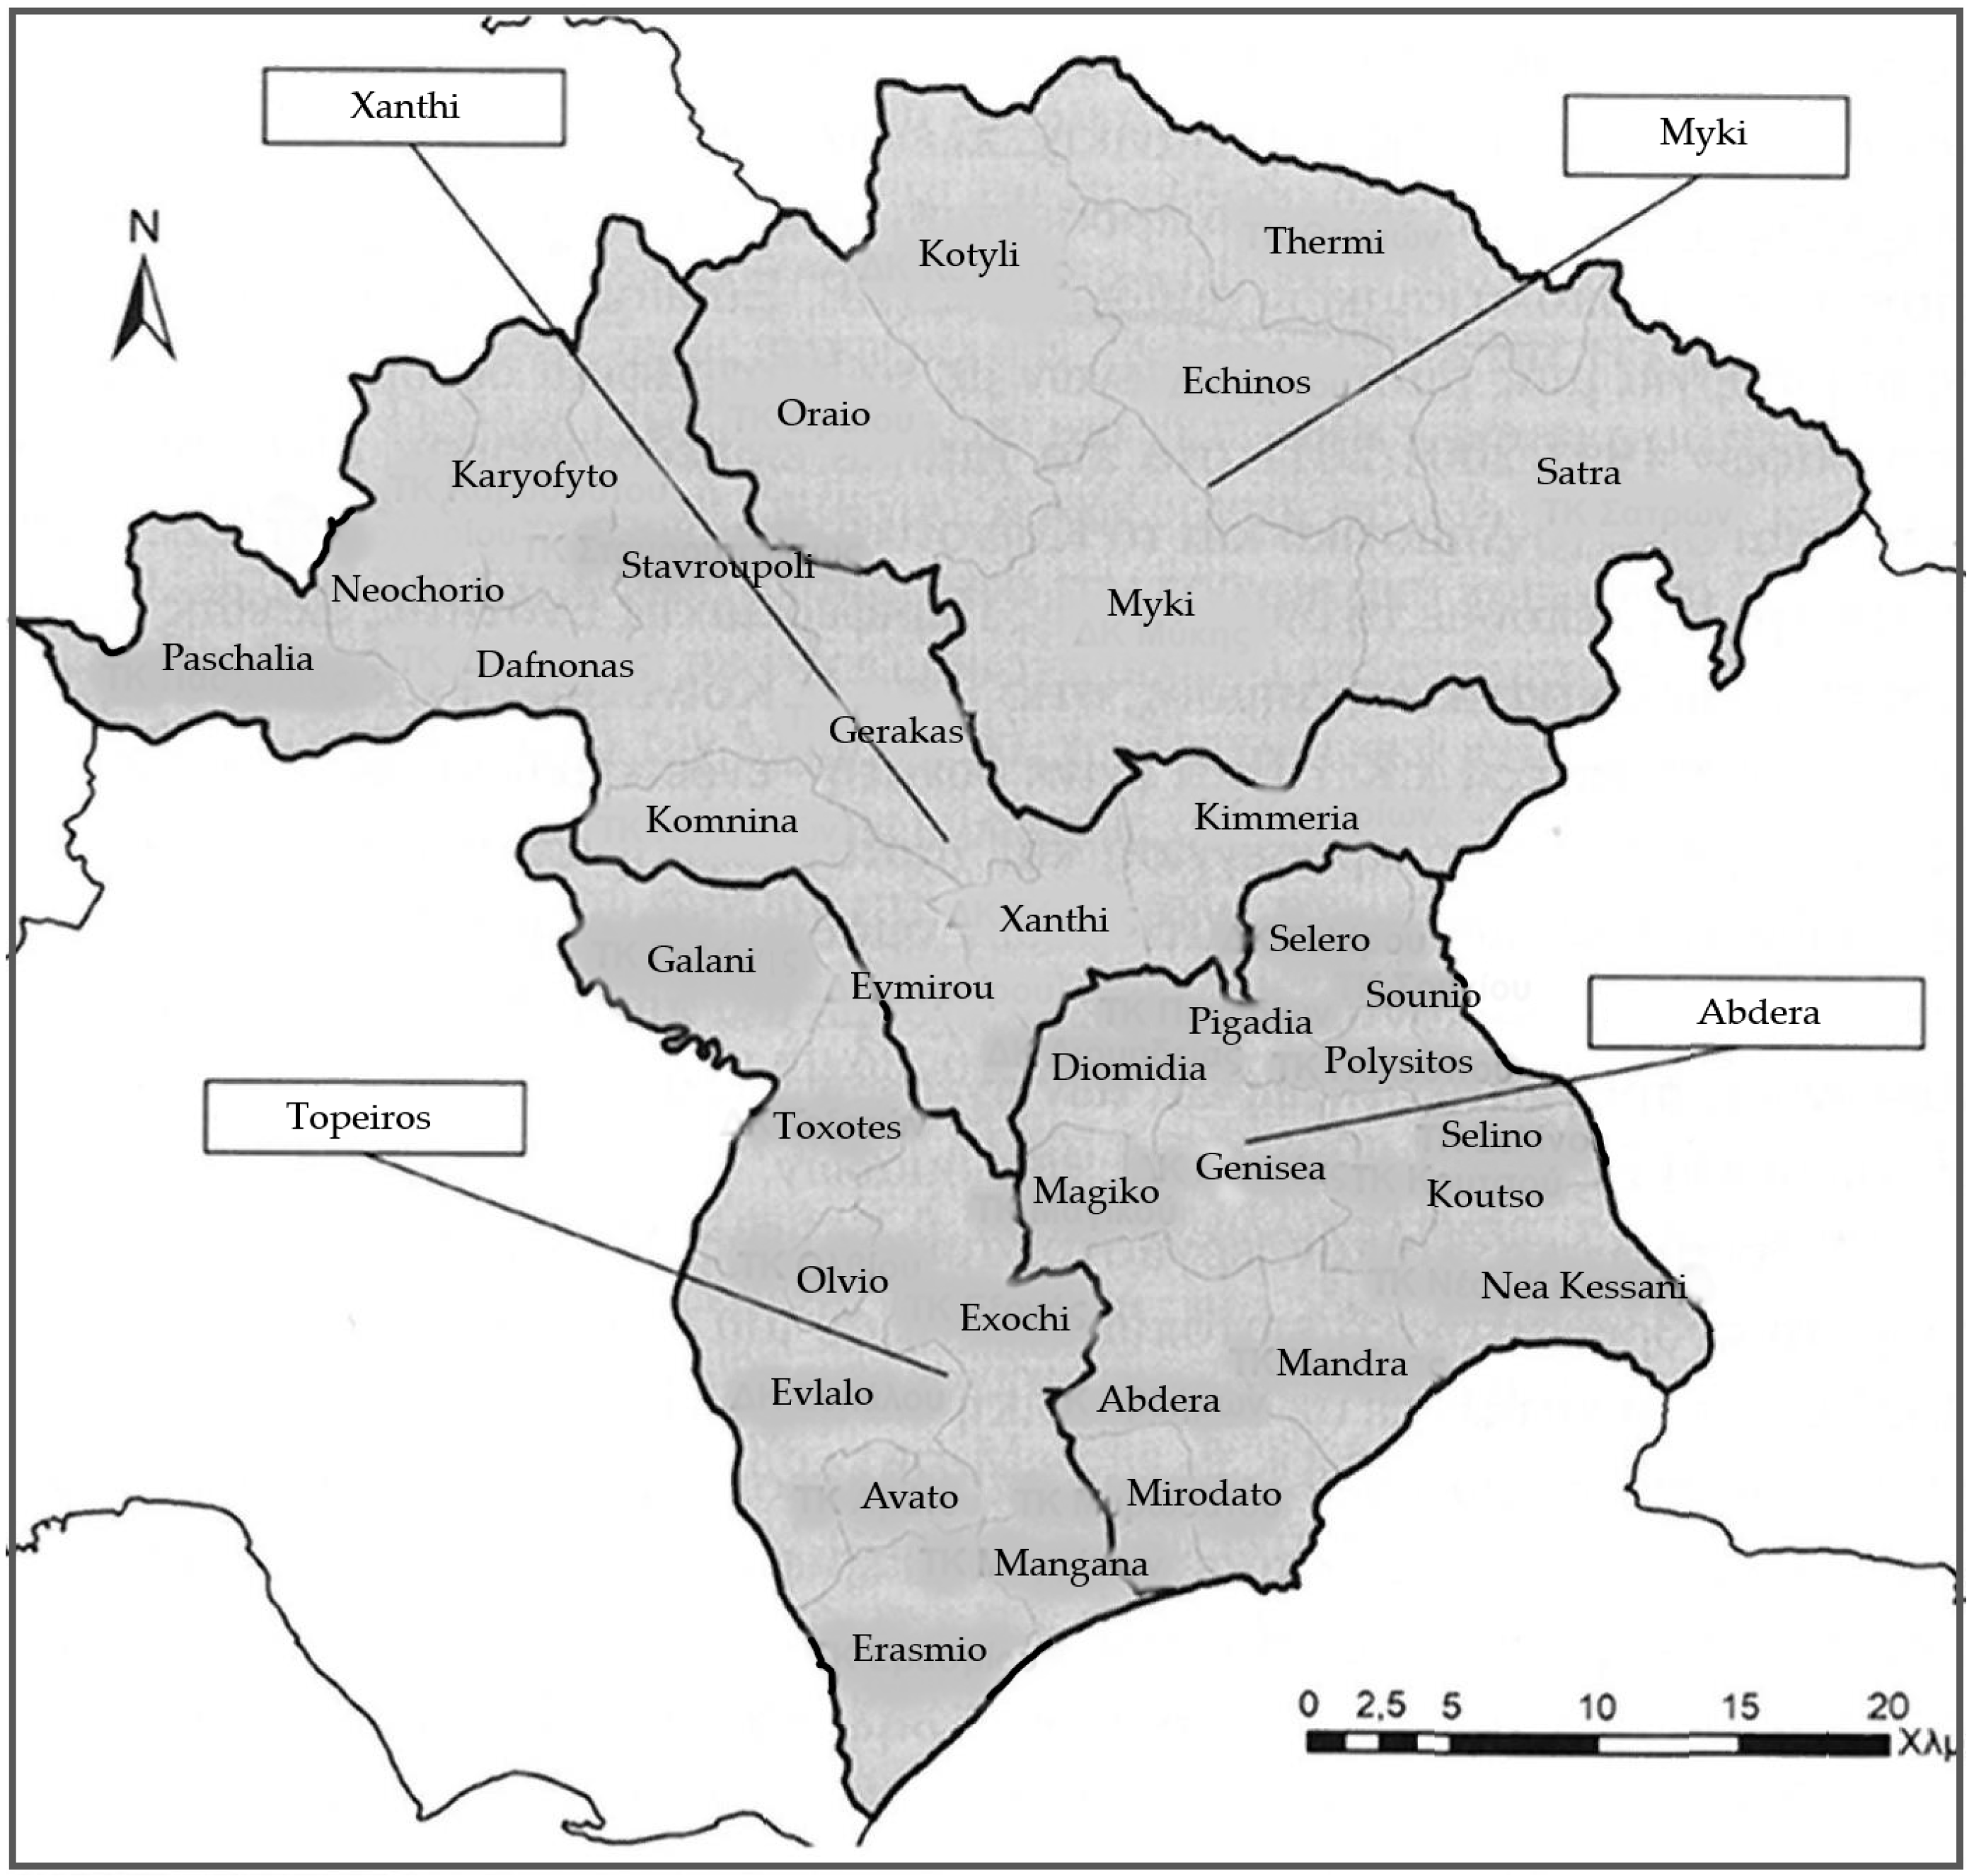
The spatial analysis that follows illustrates internet access across the entire Regional Unit of Xanthi, highlighting the boundaries between the spatial units of each ethno-cultural group, as shown in Figure 3, and subsequent representations. The categorization of these spatial units is based on the boundaries of Municipal Units and Local Communities, as depicted in Figure 8.
The maps that follow provide a combined representation of internet access alongside ethno-cultural groups and variables such as age groups, education levels, and employment sectors. The difference, however, compared to the aggregated data presented above, is that, for the ethno-cultural categories encompassing two or more spatial units, the data were calculated separately. This approach allows conclusions to be drawn not only about ethno-cultural composition but also about geographical location factors that may influence and differentiate the results. The mapping of internet access by ethno-cultural group and spatial unit reveals a multi-layered exclusion pattern not captured in previous national-level digital divide statistics. This finding underscores the importance of spatially disaggregated analysis in understanding the fine-grained dynamics of digital exclusion in multi-cultural rural contexts.
Figure 9 shows the level of internet access across various spatial units. Among areas with a majority Christian population, notable differences emerge. The unit, including Xanthi, has the highest access rate at 48%, while the southern region, covering the local communities of Erasmio and Avato, reports only 21% access. The lowest access rate, at just 15%, is found in the northwestern unit with predominantly Christian residents, contrasting with the higher access observed in the southern part of the same ethno-cultural group. The northwestern area is characterized by mountainous villages, some of which are remote and only accessible via provincial roads, making connectivity a significant challenge.
The analysis of Figure 10 and Figure 11 explores the relationship between internet access rates in specific age groups within the Regional Unit of Xanthi. A key finding is the significant variation in internet access across spatial units, influenced by age demographics and geographical characteristics. Areas with predominantly Christian populations show higher proportions of older age groups and correspondingly lower internet access. For example, the northwestern mountainous unit, which has the highest proportion of residents aged 75 and above (22.4%), records the lowest internet access rate (15%). Conversely, younger populations are more prevalent in ethno-cultural groups such as Pomak and Romani-majority areas, where children aged 0–14 dominate. Despite their younger demographic, these areas still face low internet access, such as 17% in Pomak regions.
In mixed Christian–Muslim populations, younger age groups dominate, with the highest access rate (48%) found in areas with a Christian majority. However, the southern Christian-dominated units report lower internet access (21%) and a relatively older population. These findings highlight the interplay between aging populations and limited digital infrastructure, particularly in remote and rural areas. Ultimately, the analysis underscores how demographic and socio-spatial factors combine to shape digital inequality, revealing distinct patterns of exclusion and highlighting the need for targeted interventions.
Across the analysis of age group distribution compared to internet access levels by spatial units of ethno-cultural groups, mixed patterns emerge. In some cases, the hypothesis linking an aging population to reduced internet access is confirmed, as seen in the mountainous areas predominantly inhabited by Christians. However, in other cases, no such correlation is observed, such as in the Pomak villages and the lowland areas predominantly inhabited by Muslims, Turks, and Romani, where populations are consistently younger with lower aging indices. In the spatial unit that includes the city of Xanthi, which reports the highest internet access rates, the population is also generally younger.
Figure 12, Figure 13 and 
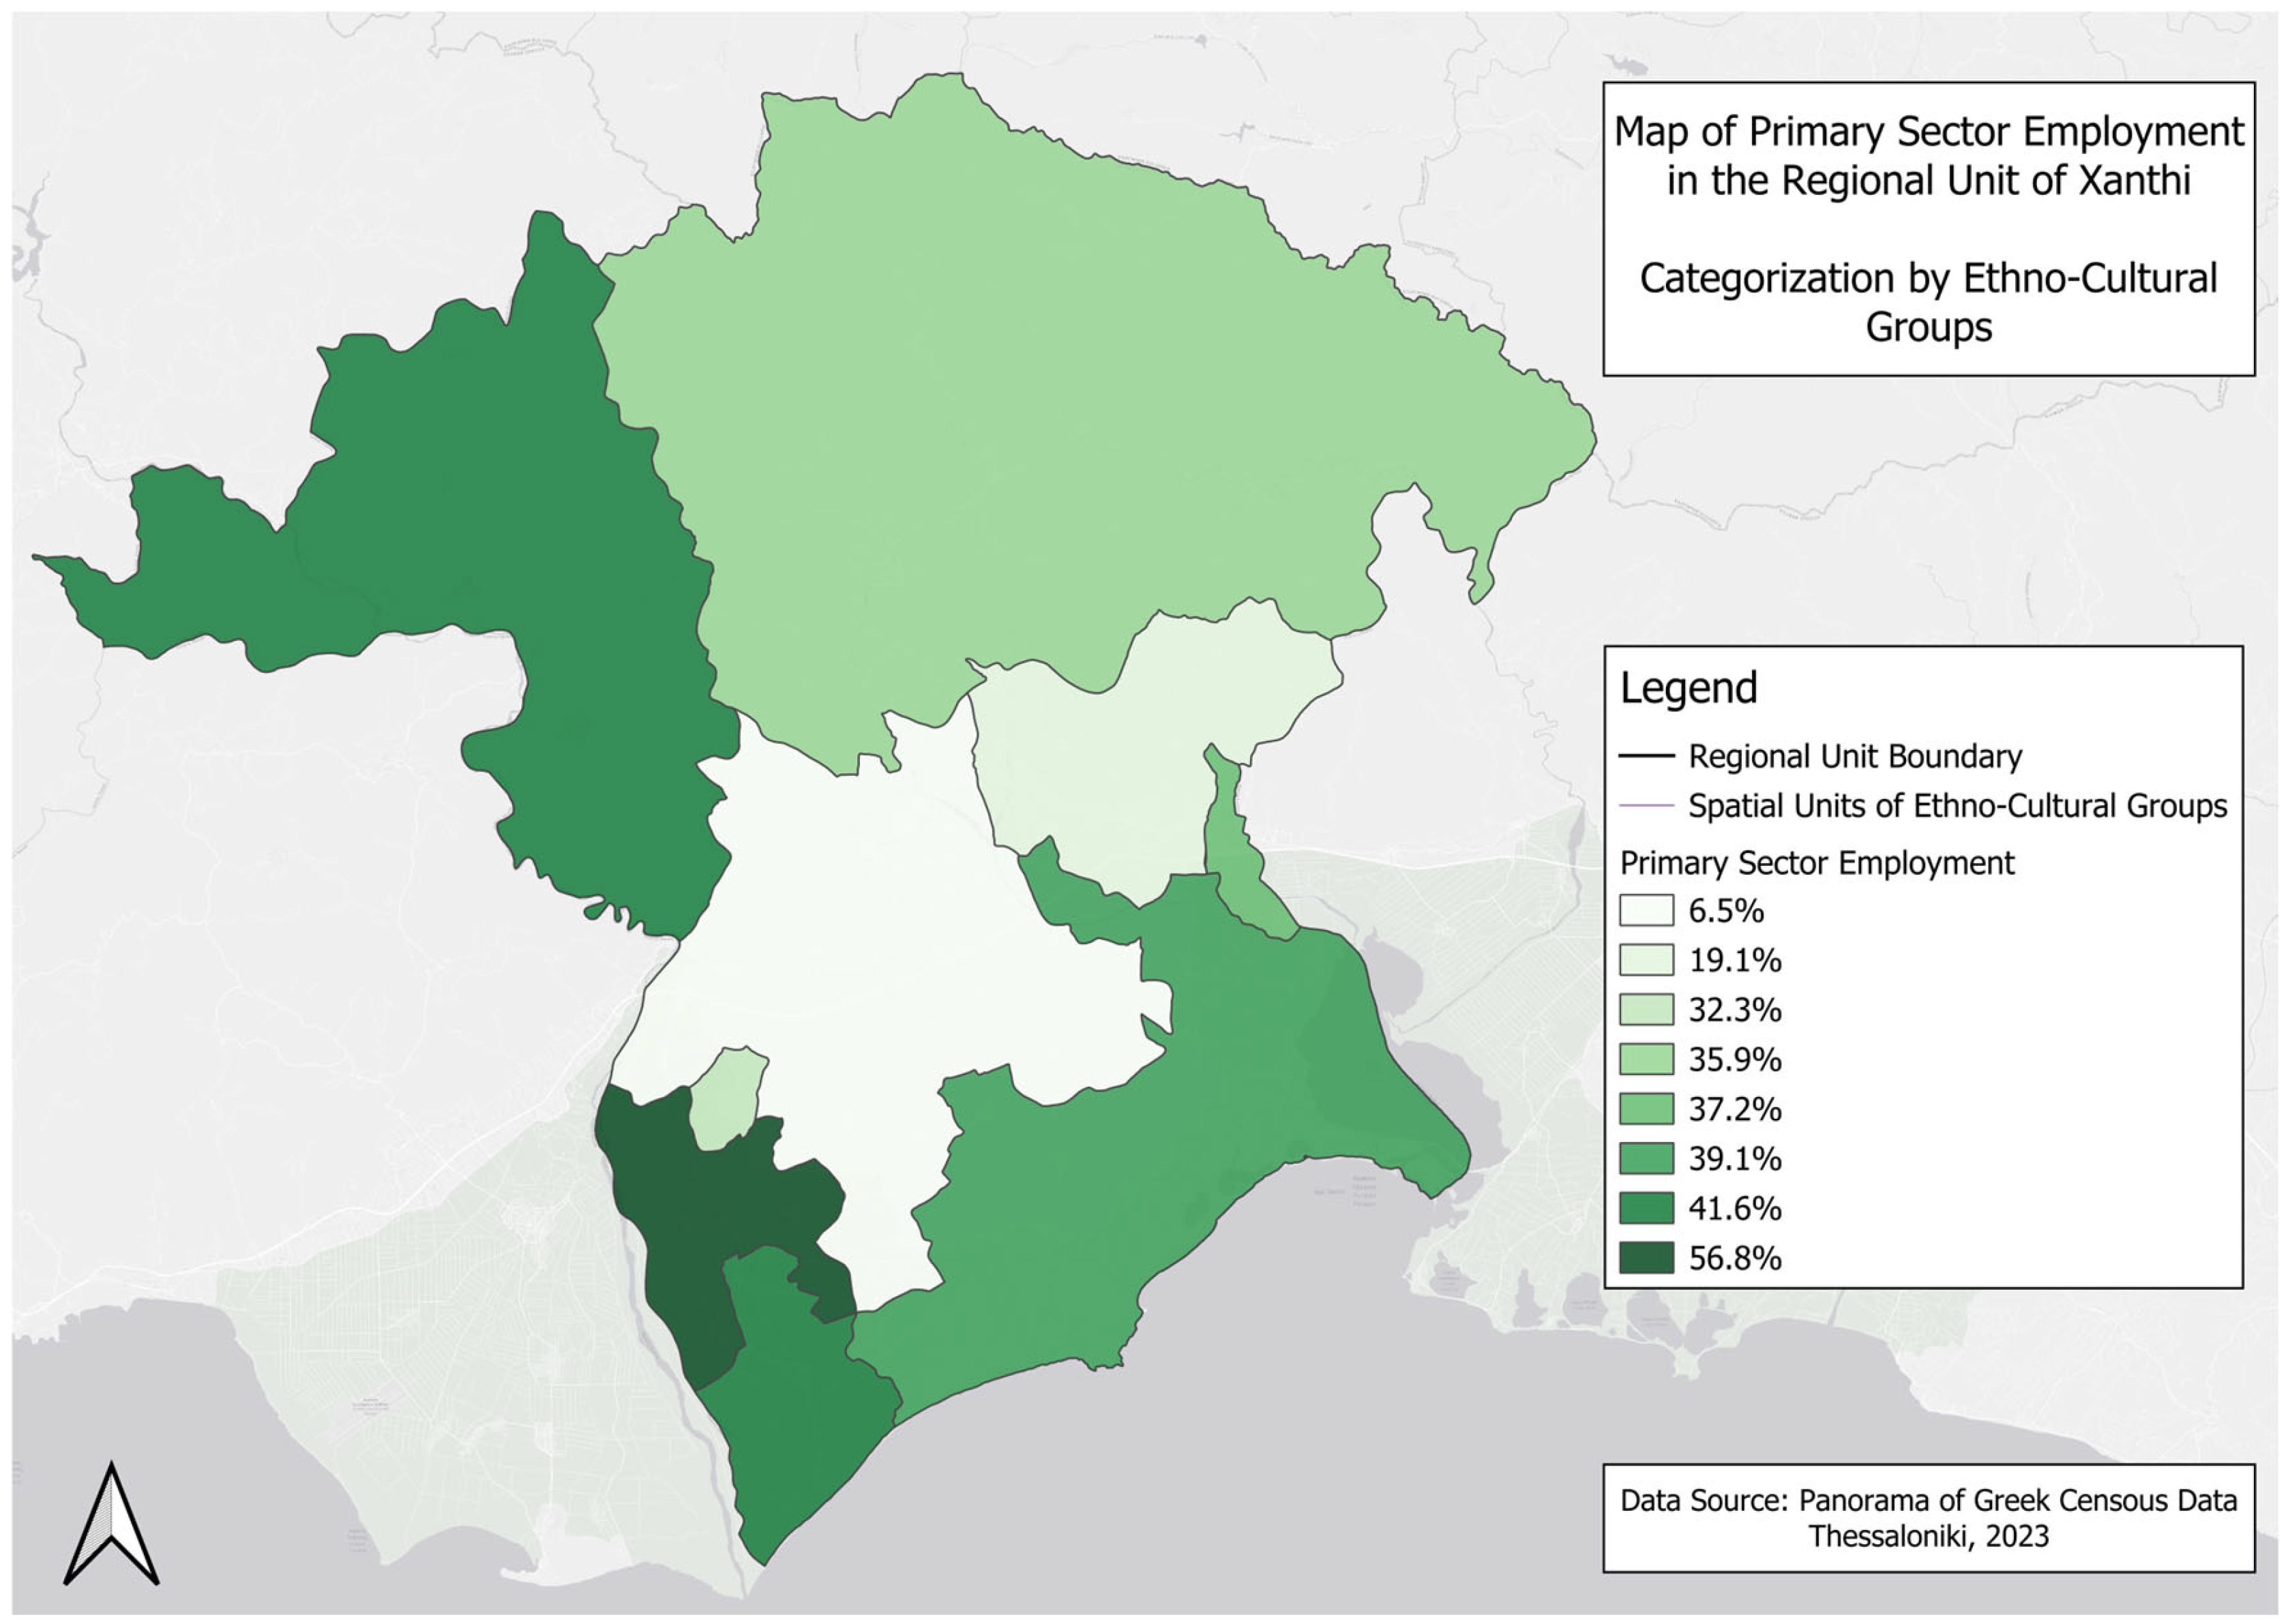
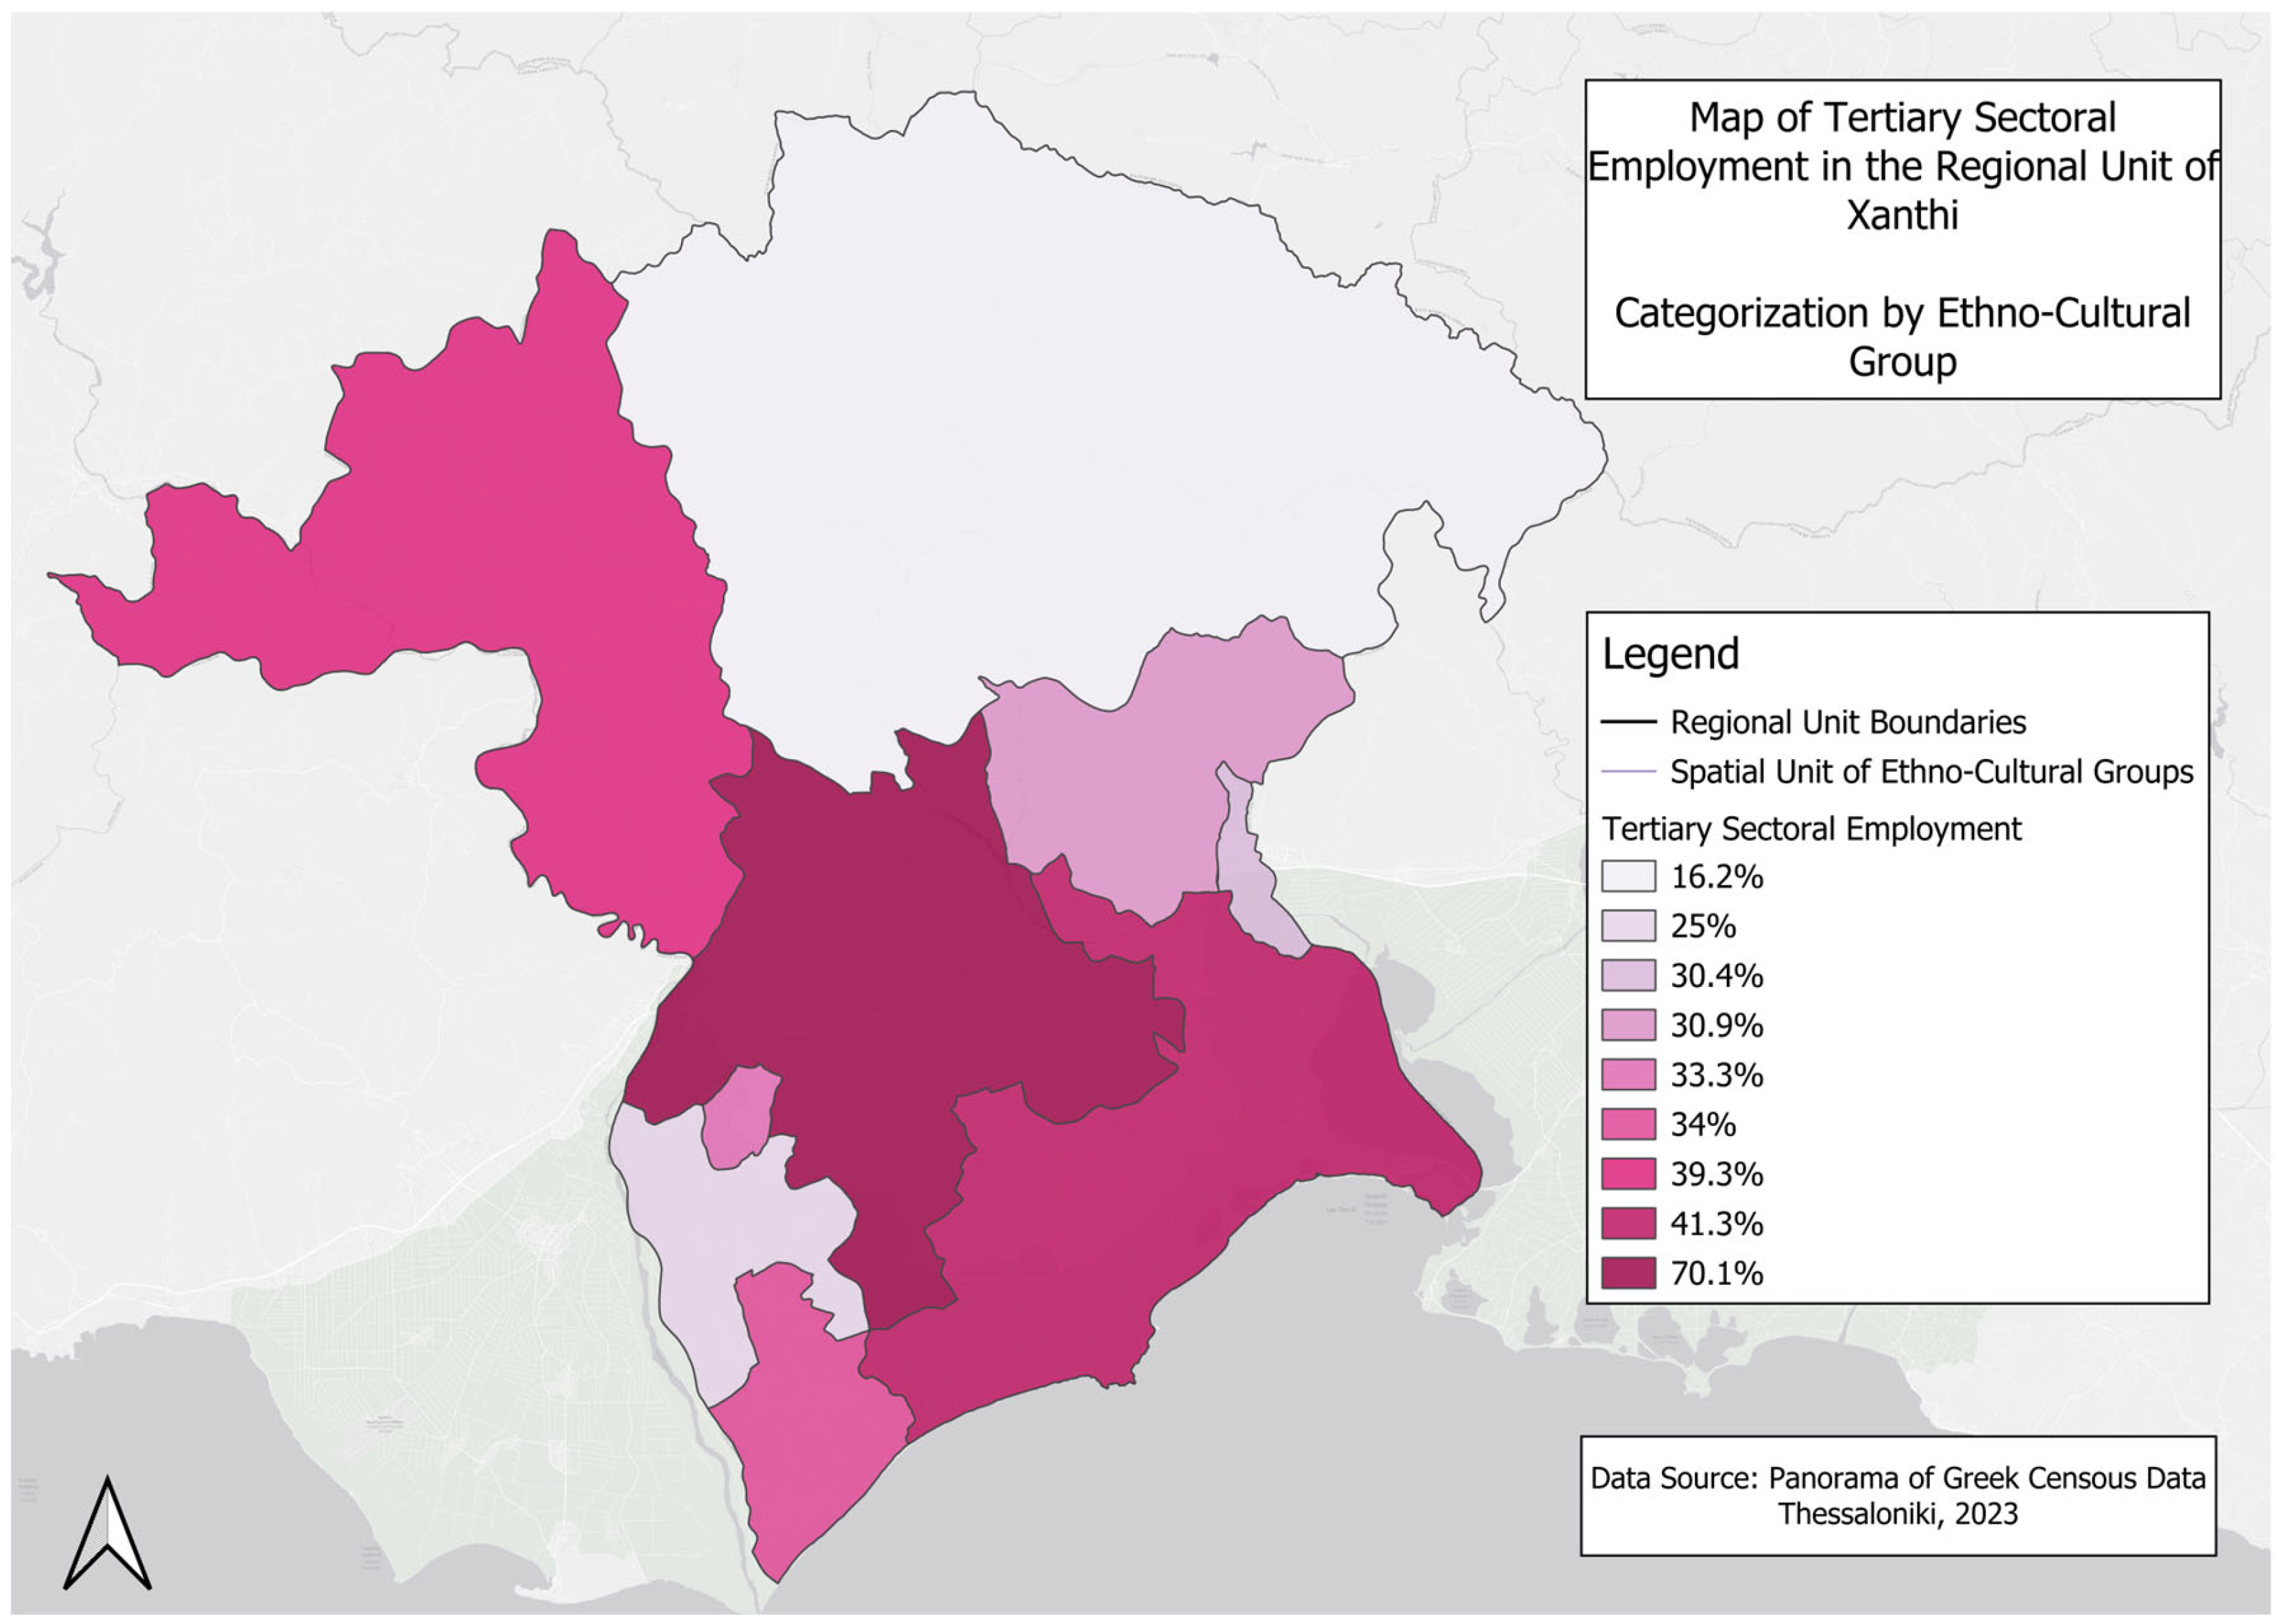
Figure 14 present the relationship between internet access rates in the primary, secondary, and tertiary sectors in the study area. The western region, predominantly inhabited by Muslims, Turks, and Romani, has a striking 56.8% of its population working in the primary sector, representing more than half the total. Similar trends are observed in other areas, including the Pomak villages, mountainous Christian-majority regions, southeastern Christian-majority areas, and mixed regions with equal populations of Muslims and Christians. These areas also share low internet access rates.
In contrast, the mixed Christian-majority areas that include the urban center of Xanthi demonstrate a different pattern. Here, only 6.5% of the population is employed in the primary sector, while an impressive 70.1% work in the tertiary sector. This highlights the urban–rural divide, with higher internet access strongly linked to employment in the tertiary sector.
Across most regions, excluding the mixed Christian-majority areas, low internet access coincides with low educational levels, with primary school graduates as the largest group. In the mixed Christian-majority area that includes Xanthi, the educational profile is notably different, with high school graduates forming the largest group and significantly more university graduates present. Disadvantaged areas are consistently characterized by a high reliance on the primary production sector for employment.
This spatialized understanding supports the development of place-sensitive smart inclusion strategies that bridge infrastructural and demographic divides.

3.3. Qualitative Analysis

A total of thirteen interviews were conducted, focusing on participants’ access to technology, their attitudes toward digital tools, motivations behind their internet usage, and barriers they face. The findings provide a rich and nuanced understanding of digital inequality in the Regional Unit of Xanthi, where geographical location, age, occupation, and socio-economic conditions collectively shape the digital landscape.
A prominent theme in the interviews is the generational divide in digital access and use. Younger participants, particularly students such as P1, P2, and P3, viewed technology as essential to their studies and daily lives. P1 highlighted the convenience of technology: “Faster internet helps me complete my university assignments quickly and efficiently.” These participants demonstrated confidence in navigating digital tools, using them not only for academic purposes but also for communication and entertainment. Similarly, P10, a student and worker, emphasized the role of self-taught digital skills, stating the following: “Online communities have helped me understand technology better; you learn a lot from others who share their knowledge.” This showcases the adaptability and resourcefulness of younger generations in embracing digital platforms.
In contrast, older participants, including P4 and P5, both retirees from Stavroupoli, expressed reluctance to use digital tools due to a lack of familiarity and perceived irrelevance. P4 commented, “I don’t use the internet because I don’t know how, and I don’t see the need.” Similarly, P5 added, “It’s complicated for me. I’ve lived without it for years, so I don’t see why I need it now.” These remarks reflect a generational gap where older individuals remain excluded, not just due to a lack of skills but also because of limited motivation to adapt to technological changes.
The interviews revealed substantial differences in digital access between urban and rural areas, emphasizing the persistent urban–rural divide. Participants residing in urban Xanthi (P1, P2, P6, P9) reported more consistent internet access and greater opportunities to engage with technology. For example, P9, a self-employed worker, noted the following: “I use the internet for work and banking, but I wish I had time to learn how to use more advanced tools.” Urban residents generally described better connectivity, enabling them to integrate technology into their professional and personal lives.
In contrast, rural residents, particularly in mountainous areas like Oraio and Kotyli, reported significant barriers to internet access. P8, a worker from Oraio, described the difficulties: “The internet here is slow, and sometimes it just doesn’t work at all.” Similarly, P10 from Kotyli explained, “For years, we didn’t have access to reliable internet; it arrived late compared to other areas.” These observations highlight how infrastructural deficits in rural and remote areas exacerbate digital exclusion and limit opportunities for residents to meaningfully engage with technology.
Participants working in or closely observing marginalized communities provided critical insights into the social dimensions of digital exclusion. P7, a primary school teacher for Romani students, described the challenges during the COVID-19 pandemic: “Many Romani families didn’t have a computer or even reliable internet, so the children couldn’t attend online classes at all.” This underscores how socio-economic constraints, coupled with limited infrastructure, exclude vulnerable groups from accessing education and other digital opportunities. The interviews reflect how economic hardship and infrastructural deficits intersect to create systemic digital exclusion, particularly in communities that rely on informal, non-digital networks for communication and daily needs.
The participants’ attitudes toward technology were shaped by their familiarity with digital tools, socio-economic context, and daily needs. Students and younger participants generally expressed positive views, seeing technology as essential for efficiency and social connection. However, they also acknowledged its potential downsides. For example, P2 commented the following: “Social media is addictive. It’s easy to waste hours without realizing it.” This reflects a growing awareness of the negative impacts of excessive screen time and digital distractions.
In contrast, older participants expressed skepticism and perceived technology as unnecessary. P12, a retiree, stated the following: “I’ve lived all my life without it, so why start now?” These responses reveal that, for older generations, digital exclusion is often self-reinforcing: limited exposure reduces confidence, and perceived irrelevance further discourages engagement.
Educational and professional backgrounds played a significant role in shaping participants’ digital experiences. Students P3 and P10 demonstrated a clear link between education and digital literacy, using technology for research, learning, and personal development. In contrast, workers such as P8 and P11 reported minimal use of digital tools, often due to the nature of their work and a lack of training opportunities. P11 explained, “I use my phone for basic things, but I don’t really need the internet for my job.”
The findings from the interviews demonstrate that digital inequality in the Regional Unit of Xanthi arises from a complex interplay of age, geography, education, and socio-economic conditions. Younger participants and urban residents reported higher levels of digital engagement, facilitated by better access to infrastructure and greater digital literacy. In contrast, older individuals, rural residents, and marginalized communities face significant barriers, including poor internet connectivity, lack of skills, and limited motivation to adopt digital tools.
These findings emphasize the need for comprehensive interventions to bridge the digital divide, including infrastructure development in rural areas, tailored digital literacy programs for older populations, and targeted support for marginalized groups. Addressing these challenges is essential to promoting equitable digital participation and ensuring that all residents of the region can access the opportunities offered by technology. These lived experiences point to the necessity of participatory smart inclusion policies that account for generational, geographic, and socio-economic differences.

4. Discussion

This study provides a comprehensive analysis of digital inequality in the Regional Unit of Xanthi, emphasizing the ways in which geographical, socio-economic, and demographic factors interact to shape disparities in digital access, usage, and benefits. The findings resonate with prior research conducted across Europe, which illustrates how peripheral regions are disproportionately affected by infrastructural and socio-economic challenges that limit digital participation [15,16]. In line with the works of Van Deursen et al. [11] and Robinson et al. [7,8], the results underscore the stratified nature of digital inequality and the need for multidimensional frameworks that consider both structural and experiential dimensions. By situating these findings within the broader framework of smart regional development, this study also underscores the necessity of inclusive digital strategies tailored to peripheral and multi-cultural contexts.
The urban–rural divide emerged as a dominant factor in digital inequality, with urban areas, particularly the city of Xanthi, reporting higher internet access and engagement with digital technologies. In contrast, rural and mountainous regions, such as Myki and Kotyli, face infrastructural deficits that limit connectivity and digital inclusion. These findings reinforce the observations of Castells [1] and Sassen [12], who describe urban centers as hubs of digital inclusion, while peripheral areas are left behind due to systemic neglect. In the case of Xanthi, spatial isolation remains a key challenge, as participants in rural areas reported limited access to stable internet connections and digital tools, exacerbating their exclusion from the digital economy. These spatial asymmetries mirror patterns observed in other parts of Southern Europe, reinforcing the call for territorially sensitive digital policies [13,14,15]. This urban–rural asymmetry points to the need for spatially sensitive smart inclusion policies that address both connectivity gaps and infrastructural planning in underserved territories. As the European Commission’s regional DESI analysis highlights, these divides are persistent and often resistant to top-down technological interventions unless accompanied by targeted, place-based strategies [17].
This analysis further illustrates that digital inequality is not only a function of geography and socio-economic status but also of demographic scale. Many of the communities with the lowest internet access rates are also among the smallest in population. In such contexts, infrastructural investment tends to lag due to cost-efficiency concerns, while statistical indicators can become unstable, potentially obscuring or exaggerating actual conditions. Recognizing the implications of demographic scale is therefore essential in designing equitable digital inclusion strategies, particularly in sparsely populated rural areas where small numerical changes may mask deeper structural exclusions. The relevance of territorial embeddedness, as emphasized in Philip et al. [16], becomes particularly evident in the analysis of internet access across ethno-cultural and demographic segments.
This study also revealed a significant generational divide in digital skills and usage. Younger participants exhibited greater confidence and reliance on technology, particularly for education, work, and communication. This reflects findings from Hargittai and Hinnant [6] and Van Deursen et al. [11], who associate younger age groups with higher digital literacy and adaptability. In contrast, older participants reported limited digital engagement due to low confidence, a lack of familiarity, and perceived irrelevance of technology. This generational gap reinforces the need for targeted interventions that address both digital skills and motivational barriers among older populations, who remain excluded from the benefits of technology. Integrating age-sensitive digital training into local smart city strategies could mitigate generational digital exclusion and foster intergenerational digital cohesion.
Socio-economic and cultural inequalities further compound digital exclusion, particularly in marginalized communities. Areas with lower educational attainment and higher levels of economic hardship, such as Muslim-majority and Pomak villages, reported some of the lowest rates of internet access. These findings align with Van Dijk’s [10] concept of digital inequality as a dynamic phenomenon influenced by socio-economic constraints and Bourdieu’s [15] framework of cultural capital, where lower access to education and technology perpetuates exclusion. Despite a younger demographic in these communities, limited infrastructure and economic resources create barriers that prevent meaningful engagement with digital tools. Labrianidis and Kalogeressis [3] argue that such communities face dual disadvantages: a lack of institutional support for digital infrastructure and systemic economic marginalization, which reinforces their exclusion from digital participation. Robinson [22] and Frangopoulos et al. [28] note that individuals’ dispositions toward digital tools, what Robinson calls “information habitus”, are shaped by long-term socio-economic conditions, which this study observes in the attitudes and practices of various interviewees. Smart inclusion requires not only technological investment but also socioculturally embedded solutions that recognize the unique needs of multiethnic, rural populations.
In areas with similar levels of urbanization, differences in internet access among ethno-cultural groups tend to be less pronounced. This suggests that infrastructural and territorial factors may play a more significant role than ethnicity alone. However, in rural areas, ethnic identity often aligns with socio-economic marginalization, which reinforces patterns of digital exclusion. Thus, ethnicity matters not as an isolated factor but in how it intersects with geography and resource distribution.
This study also emphasized the influence of educational attainment and occupational roles on digital participation. Urban residents with higher levels of education and employment in tertiary sectors demonstrated greater digital engagement, while participants involved in manual labor or primary-sector occupations reported minimal usage of technology. This reflects findings from Robinson et al. [7], who highlight the relationship between occupational roles and opportunities for digital engagement. The educational struggles faced by vulnerable communities during the COVID-19 pandemic, where limited access to devices and connectivity excluded students from online learning, further illustrate how socio-economic and infrastructural barriers intersect to reinforce digital inequality. Policies aiming to build resilient smart regions must combine digital infrastructure expansion with inclusive educational support mechanisms, especially in digitally lagging zones.
This study contributes novel insights by demonstrating how official state recognition of ethno-cultural minorities—combined with spatial marginalization—produces unique digital inequality dynamics in the Xanthi region. Unlike previous studies that treat rural populations as socio-economically homogeneous, our results reveal how intra-rural diversity (Pomak, Turkish, Romani, and Christian communities) further stratifies digital access and use. This highlights the importance of designing smart inclusion initiatives that account for both horizontal (intergroup) and vertical (intragroup) inequalities.
The integration of GIS-based spatial analysis with ethnographic interviews provides an innovative methodological contribution, enabling the nuanced mapping of both quantitative infrastructure gaps and subjective digital experiences. This methodological innovation sets a precedent for similar studies in peripheral, multiethnic regions. The spatial analysis further enhances this discussion by demonstrating how digital exclusion is not only a product of infrastructural gaps but also of socio-political neglect rooted in territorial governance. Such approaches can serve as blueprints for evidence-based policymaking in smart city and smart region frameworks, allowing for more equitable digital planning.
By combining spatial analysis, quantitative data, and qualitative insights, this study reinforces the multidimensional nature of digital inequality. The findings emphasize that exclusion is not merely a matter of technological access but, as is highlighted by Frangopoulos et al. [28], reflects deeper socio-spatial dynamics, where geography, education, and economic resources collectively shape digital participation. Ultimately, the findings support calls for inclusive digital policies that are context-aware, culturally responsive, and territorially just [24,25]. These localized insights contribute to the broader discourse on digital inequality, demonstrating how global patterns of exclusion manifest in specific cultural and spatial contexts. Ultimately, this research advocates for a model of smart inclusion grounded in territorial equity, sociocultural responsiveness, and infrastructural justice.

5. Conclusions

This study demonstrates that digital inequality in the Regional Unit of Xanthi is shaped by the interplay of geographical, generational, and socio-economic factors, with urban residents and younger populations exhibiting higher levels of digital engagement compared to older individuals, marginalized communities, and rural areas facing infra-structural deficits. The urban–rural divide remains a critical driver of exclusion, exacerbated by socio-economic challenges and cultural barriers, particularly in Muslim-majority and Pomak regions. These findings reaffirm that smart regional development must integrate inclusive digital strategies that address both material access and deeper socio-spatial determinants.
While this study highlights the need for improved digital infrastructure, tailored digital literacy programs, and socio-economic support, it is not without limitations. The small sample size for qualitative interviews may restrict the generalizability of the findings, and the reliance on self-reported data introduces a degree of subjectivity. Furthermore, this study’s localized focus on Xanthi, though offering rich insights, may limit its applicability to broader contexts. However, the methodological framework developed here—combining spatial analysis with ethnographic depth—can inform comparative smart inclusion studies across peripheral and multi-cultural regions in Europe. Future research should include comparative analyses across multiple regions and explore the quality of digital engagement to assess how access translates into tangible benefits.
Despite these limitations, the findings contribute valuable localized evidence to the broader discourse on digital inequality, providing actionable recommendations for fostering inclusive digital participation and addressing systemic barriers. The integration of GIS-based spatial profiling and participant narratives offers a policy-relevant approach for smart city and smart region planning, where data-driven interventions can be aligned with the lived realities of digitally excluded populations.
This study’s key contribution lies in unpacking how digital inequality in Xanthi is shaped not merely by geography or income but by a confluence of spatial remoteness, minority status, and infrastructural neglect—an angle that has received limited attention in existing research on the digital divide in Europe. By illuminating the intersection of formal minority recognition and spatial disadvantage, this study strengthens the theoretical framing of digital inequality as a socio-spatial phenomenon and provides a framework for comparative analysis in similarly structured regions. In this sense, smart inclusion emerges not as a generic policy objective but as a territorially anchored imperative for equitable digital futures.

Author Contributions

Conceptualization, K.K. and Y.F.; methodology, Y.F. and D.K.; software, K.K. and D.K.; validation, Y.F., D.K. and A.S.; formal analysis, K.K. and Y.F.; investigation, K.K.; resources, K.K. and A.S.; data curation, K.K.; writing—original draft preparation, K.K. and A.S.; writing—review and editing, K.K., Y.F., D.K. and A.S.; visualization, K.K. and A.S.; supervision, Y.F.; project administration, Y.F. All authors have read and agreed to the published version of the manuscript.

Funding

This research received no external funding.

Data Availability Statement

The data presented in this study are available upon request from the corresponding author.

Conflicts of Interest

The authors declare no conflicts of interest.

Appendix A

Table A1. Participants’ characteristics.
CodeGenderOccupationLocationInterview Date
P1MaleStudentXanthi24 January 2024
P2FemaleStudentXanthi25 January 2024
P3MaleStudentXanthi25 January 2024
P4FemaleRetireeStavroupoli, Xanthi27 January 2024
P5MaleRetireeStavroupoli, Xanthi27 January 2024
P6MaleStudentXanthi30 January 2024
P7MalePrimary School Teacher (Romani Students)Xanthi1 February 2024
P8MaleEmployerOraio, Municipality of Myki1 February 2024
P9MaleSelf-employedXanthi1 February 2024
P10MaleStudent–employerKotyli, Municipality of Myki10 February 2024
P11MaleEmployer Sminthi, Xanthi14 February 2024
P12MaleRetireeChryso, Xanthi14 February 2024
P13MaleEmployerAbdera, Xanthi20 February 2024

References

  1. Castells, M. The Information Age: Economy, Society and Culture. The Rise of the Network Society; Blackwell’s: Oxford, UK, 1996; Volume I. [Google Scholar]
  2. Castells, M. The Internet Galaxy: Reflections on the Internet, Business, and Society; Oxford University Press: Oxford, UK, 2002. [Google Scholar]
  3. Labrianidis, L.; Kalogeressis, T. The digital divide in Europe’s rural enterprises. Eur. Plan. Stud. 2006, 14, 23–39. [Google Scholar] [CrossRef]
  4. Van Dijk, J.; Hacker, K. The digital divide as a complex and dynamic phenomenon. In Proceedings of the 50th Annual Conference of the International Communication Association, Acapulco, Mexico, 1–5 June 2000. [Google Scholar]
  5. NTIA. Falling Through the Net: Defining the Digital Divide; NTIA: Washington, DC, USA, 1999. Available online: https://www.ntia.gov/ (accessed on 18 December 2024).
  6. Hargittai, E.; Hinnant, A. Digital inequality: Differences in young adults’ use of the Internet. Commun. Res. 2008, 35, 602–621. [Google Scholar] [CrossRef]
  7. Robinson, L.; Cotten, S.R.; Ono, H.; Quan-Haase, A.; Mesch, G.; Chen, W.; Stern, M.J. Digital inequalities and why they matter. Inf. Commun. Soc. 2015, 18, 569–582. [Google Scholar] [CrossRef]
  8. Robinson, L.; Schulz, J.; Blank, G.; Ragnedda, M.; Ono, H.; Hogan, B.; Khilnani, A. Digital inequalities 2.0: Legacy inequalities in the information age. First Monday 2020, 25, 7. [Google Scholar] [CrossRef]
  9. Wei, L.; Hindman, D.B. Does the digital divide matter more? Comparing the effects of new media and old media use on the education-based knowledge gap. Mass Commun. Soc. 2011, 14, 216–235. [Google Scholar] [CrossRef]
  10. Van Dijk, J. The Network Society: Social Aspects of New Media, 1st ed.; Sage Publications: Thousand Oaks, CA, USA, 1999. [Google Scholar]
  11. Van Deursen, A.J.; Helsper, E.; Eynon, R.; Van Dijk, J.A. The Compoundness and Sequentiality of Digital Inequality. Int. J. Commun. 2017, 11, 452–473. Available online: http://eprints.lse.ac.uk/id/eprint/68921 (accessed on 19 December 2024).
  12. Sassen, S. The Global City: New York, London, Tokyo; Princeton University Press: Princeton, NJ, USA, 2001. [Google Scholar]
  13. Kolotouchkina, O.; Ripoll González, L.; Belabas, W. Smart cities, digital inequalities, and the challenge of Inclusion. Smart Cities 2024, 7, 3355–3370. [Google Scholar] [CrossRef]
  14. Colding, J.; Nilsson, C.; Sjöberg, S. Smart cities for all? Bridging digital divides for socially sustainable and inclusive cities. Smart Cities 2024, 7, 1044–1059. [Google Scholar] [CrossRef]
  15. Tranos, E.; Mack, E. The Spatial Distribution of Internet Backbone Networks in Europe: A Metropolitan Knowledge Economy Perspective. Eur. Urban Reg. Stud. 2009, 16, 423–437. [Google Scholar] [CrossRef]
  16. Philip, L.; Cottrill, C.; Farrington, J.; Williams, F.; Ashmore, F. The digital divide: Patterns, policy and scenarios for connecting the ‘final few’ in rural communities across Great Britain. J. Rural. Stud. 2017, 54, 386–398. [Google Scholar] [CrossRef]
  17. European Commission. Digital Economy and Society Index (DESI) 2022—Regional Cohesion Report; EU Publications Office: Brussels, Belgium, 2022.
  18. Frangopoulos, Y. Socio-Spatial Relations, Representations and Politics of Difference: The Muslim Minority and the Pomaks; Alexandria: Athens, Greece, 2019. [Google Scholar]
  19. Bourdieu, P. Forms of capital. In Handbook of Theory and Research for the Sociology of Education; Richards, J.C., Ed.; Greenwood Press: New York, NY, USA, 1983; pp. 241–258. [Google Scholar]
  20. Lefebvre, H. The Production of Space; Blackwell: Oxford, UK, 1991. [Google Scholar]
  21. Frangopoulos, I.; Papasimeon, C.; Kourkouridis, D.; Kapitsinis, N. The mall as heterotopia under Greece’s economic crisis: A sociospatial analysis in Thessaloniki. Int. Plan. Stud. 2024, 29, 268–286. [Google Scholar] [CrossRef]
  22. Robinson, L. A taste for the necessary: A Bourdieuian approach to digital inequality. Inf. Commun. Soc. 2009, 12, 488–507. [Google Scholar] [CrossRef]
  23. European Council. Lisbon European Council 23 and 24 March 2000: Presidency Conclusions. 2000. Available online: https://www.europarl.europa.eu/summits/lis1_en.htm (accessed on 18 December 2024).
  24. Helbig, N.; Gil-Garcia, J.R.; Ferro, E. Understanding the complexity of electronic government: Implications from the digital divide literature. Gov. Inf. Q. 2009, 26, 89–97. [Google Scholar] [CrossRef]
  25. Esteban-Navarro, M.-A.; García-Madurga, M.-A.; Morte-Nadal, T.; Nogales-Bocio, A.-I. The rural digital divide in the face of the COVID-19 pandemic in Europe—Recommendations from a scoping review. Informatics 2020, 7, 54. [Google Scholar] [CrossRef]
  26. Frangopoulos, Y. Religion, Identity and Political Conflict in a Pomak Village in Northern Greece. In Islam in Europe: The Politics of Religion and Community; Vertovec, S., Peach, C., Eds.; Macmillan Press Ltd.: London, UK, 1997; pp. 73–90. [Google Scholar] [CrossRef]
  27. Panorama of Greek Census Data 2011. Available online: https://panorama.statistics.gr/en/ (accessed on 17 December 2024).
  28. Frangopoulos, Y.; Lalenis, K.; Kiosses, I.; Kipouros, S. Ethno-Cultural Diversity, Social Structures, and Urban Planning in Minority Settlements of Thrace. Geographies 2012, 20, 117–139. Available online: https://ejournals.epublishing.ekt.gr/index.php/geographies/article/view/33259 (accessed on 18 December 2024).
Figure 1. Research framework. Source: Authors’ own work.
Smartcities 08 00123 g001
Figure 2. Location of the Regional Unit of Xanthi within Greece and Europe. Source: authors’ own work.
Smartcities 08 00123 g002
Figure 3. Spatial units of ethno-cultural composition in the Regional Unit of Xanthi. Source: Translated from Frangopoulos 2019 [18].
Smartcities 08 00123 g003
Figure 4. Age by ethno-cultural group in the Regional Unit of Xanthi. Data Source: Panorama of Greek Census Data 2011 [27].
Smartcities 08 00123 g004
Figure 5. Educational level by ethno-cultural group in the Regional Unit of Xanthi. Data Source: Panorama of Greek Census 2011 Data [27].
Smartcities 08 00123 g005
Figure 6. Employment sector by ethno-cultural group in the Regional Unit of Xanthi. Data Source: Panorama of Greek Census Data 2011 [27].
Smartcities 08 00123 g006
Figure 7. Internet access by ethno-cultural group in the Regional Unit of Xanthi. Data Source: Panorama of Greek Census Data 2011 [27].
Smartcities 08 00123 g007
Figure 8. Municipal and local communities of the Regional Unit of Xanthi. Source: Translated from Frangopoulos 2019 [18].
Smartcities 08 00123 g008
Figure 9. Internet access and ethno-cultural group [27].
Smartcities 08 00123 g009
Figure 10. Internet access in the Regional Unit of Xanthi for the 0–14 age group [27].
Smartcities 08 00123 g010
Figure 11. Internet access in the Regional Unit of Xanthi for the 75+ age group [27].
Smartcities 08 00123 g011
Figure 12. Internet access in the primary sector in the Regional Unit of Xanthi [27].
Smartcities 08 00123 g012
Figure 13. Internet access in the secondary sector in the Regional Unit of Xanthi [27].
Smartcities 08 00123 g013
Figure 14. Internet access in the tertiary sector in the Regional Unit of Xanthi [27].
Smartcities 08 00123 g014
Table 1. Internet access in the Regional Unit of Xanthi. Data Source: Panorama of Greek Census Data 2011 [27].
Region/SubdivisionPopulationInternet Access (%)No Internet Access (%)
Regional Unit
Xanthi108,19538.062.0
Municipalities
Myki14,23717.083.0
Xanthi66,87548.052.0
Abdera17,61027.073.0
Topeiros947321.079.0
Municipal Communities
MykiEchinos278030.070.0
Myki769716.084.0
Oraio8115.095.0
Thermi6460.0100.0
Kotyli20310.0100.0
Satra2721.099.0
XanthiEvmirou270947.053.0
Kimmeria377122.078.0
Xanthi58,76051.049.0
Gerakas2700.0100.0
Dafnonas23516.084.0
Karyofyto13710.090.0
Komnina21711.089.0
Neochorio2746.094.0
Paschalia820.0100.0
Stavroupoli42027.073.0
AbderaAbdera1.17224.076.0
Mandra49818.082.0
Mirodato40233.067.0
Nea Kessani72722.078.0
Genisea2.04927.073.0
Diomidia4.57441.059.0
Koutso54610.090.0
Magiko73540.060.0
Pigadia37023.077.0
Polysitos34720.080.0
Selino1851.099.0
Sounio92421.079.0
Selero5.08120.080.0
TopeirosEvlalo403219.081,0
Toxotes148426.074,0
Avato95622.078.0
Galani9832.068.0
Exochi97925.075.0
Erasmio108721.079.0
Mangana55114.086.0
Olvio28624.076.0
Disclaimer/Publisher’s Note: The statements, opinions and data contained in all publications are solely those of the individual author(s) and contributor(s) and not of MDPI and/or the editor(s). MDPI and/or the editor(s) disclaim responsibility for any injury to people or property resulting from any ideas, methods, instructions or products referred to in the content.

