1. Introduction
Underserved communities often face multiple, interlinked issues: disproportionate exposure to transportation-related pollutants, limited mobility options, a need to travel outside of regular work hours, and restricted access to fresh, affordable food. While electric vehicles (EVs) have the potential to improve air quality, ensuring equitable access to these benefits remains a critical challenge [
1,
2,
3]. In the United States (U.S.), 23.5 million people live in low-income areas more than a mile away from a grocery store, and among them, 2.3 million households lack vehicle access [
4]. Furthermore, approximately 40% of low-income households report working irregular hours [
5], based on findings from the Survey of Household Economics and Decision-making conducted by the Federal Reserve Board. This sometimes results in the need to carry out household activities outside the typical operating hours of many transit systems and businesses. In Los Angeles County, around 27% of households below 300% of the Federal Poverty Level (i.e., approximate annual income of USD 36,000 for a single individual or USD 75,000 for a family of four in 2018) experienced food insecurity that year. By mid-2020, amid the COVID-19 pandemic, food insecurity surged to 41.6% among these households [
6]. Without personal vehicles, many residents rely on convenience or dollar stores with limited product variety, exacerbating food insecurity. According to the United States Department of Agriculture (USDA) Food Store Survey, which examines a market basket spanning major food groups (e.g., dairy products, fresh meats, fresh produce), supermarkets stock 95% of these items whereas convenience stores carry only 50%, compounding access challenges in food deserts [
7]. Public transit, although available, can be time-consuming and inflexible—especially for grocery trips involving heavy or bulky items [
8].
Carsharing has long been used to accommodate trip purposes commonly made by the private automobile, with grocery shopping especially benefitting from the carrying capacity of a personal vehicle. These intersecting issues of environmental justice, mobility barriers, and grocery access highlight the potential role of EV carsharing in alleviating both transportation and grocery access constraints in an environmentally sustainable manner. Research shows that carsharing systems can provide a flexible mobility option and reduce emissions, despite ongoing operational (e.g., maintenance, insurance) and financial (e.g., costs, user retention) challenges [
9]. Most studies have emphasized mobility and environmental benefits, but the nexus between EV carsharing and improved grocery access remains underexplored. To address this gap, our study integrates a dynamic accessibility measurement to assess the potential of EV carsharing to improve grocery access in underserved communities in Los Angeles. Building on prior research that relied on static proximity measures, our analysis incorporates third-party data sources (e.g., Google and Mapbox APIs) and user-reported survey data to evaluate access using a scenario-based approach that accounts for travel time, store operating hours, traffic conditions, and vehicle rental cost.
In 2018, BlueLA, a one-way, station-based EV carsharing service was launched in Los Angeles through a grant from the California Air Resources Board (CARB) under the California Climate Investments (CCI) program. BlueLA operates 40 stations in neighborhoods with high socio-environmental vulnerability. Nearly 29% of the census tracts within its service area fall within the top 95th percentile of CalEnviroScreen—a statewide tool that evaluates 21 environmental, public health, and demographic factors (e.g., air pollution, poverty rates) to identify communities most susceptible to environmental harm [
10]. Although stations are concentrated in neighborhoods with high socio-environmental vulnerability, BlueLA vehicles can be picked up and dropped off by any registered member. BlueLA’s tiered pricing structure aims to improve affordability for lower-income users: “Standard” members pay USD 5 per month plus USD 0.25 per minute, while low-income qualified “Community” (Community eligibility is determined by the operator (i.e., Blink Mobility) based on household income thresholds (e.g., USD 41,700 or less gross annual income for a single-person household) or enrollment in public assistance programs (e.g., SNAP, Medicaid, CalWORKS). SNAP refers to the Supplemental Nutrition Assistance Program, a federal food assistance program; Medicaid is a state-administered health insurance program for low-income individuals; and CalWORKS is California’s welfare-to-work program providing cash aid and services to eligible families.) members pay USD 1 per month plus USD 0.20 per minute; both groups are subject to a one-hour minimum (BlueLA implemented changes to its rental rates as of 20 March 2024. While monthly membership fees remained unchanged, per-minute rates increased from USD 0.15 to USD 0.20 for Community members and from USD 0.20 to USD 0.25 for Standard members. The cost calculations in this study reflect the updated rates for accuracy, while survey and trip activity data were collected prior to these changes). The service also offers discounted three-hour and five-hour rental packages. In this study, we hypothesize that BlueLA has the potential to improve grocery access for underserved households by expanding their spatial-temporal reach to grocery stores. Specifically, we test two hypotheses: (1) spatial-temporal accessibility from BlueLA stations to different grocery store types varies based on store type, traffic conditions, and trip departure times; and (2) Standard and Community members differ in their perceived grocery access and station usage patterns.
Grocery stores differ widely in quality, affordability, product variety, and operating hours, ranging from supermarkets and super stores offering diverse options to smaller outlets (e.g., convenience stores) that offer a more limited range of items. Understanding how a one-way EV carsharing service expands or constrains accessibility to these diverse store types is critical for gauging its role in improving grocery access. To achieve this objective, we employ a mixed-methods approach integrating multiple datasets. First, we apply walking thresholds from a 2022 BlueLA user survey (n = 215) to delineate walking-based service areas around stations. We then enrich the USDA Supplemental Nutrition Assistance Program (SNAP) Retailer Locator (n = 5888 SNAP-eligible grocery stores) using Google and Yelp Application Programming Interfaces (APIs) to add store operating hours and price level. This database covers all SNAP-eligible grocery stores across Los Angeles County, ensuring that our analysis reflects the full range of potential grocery destinations for BlueLA users, regardless of where SNAP participants live. Using these data, we conduct spatial-temporal analyses to model grocery access under various traffic conditions and store operating hours, integrating travel times, distances, and BlueLA rental costs. Finally, we analyze user survey insights and BlueLA trip activity data (n = 59,122 trips) to understand grocery shopping behaviors, perceived accessibility improvements, and station usage patterns among Standard and Community members. This allowed us to assess the potential of BlueLA to improve grocery access, offering actionable insights that can inform operational and policy decisions as well as support the broader objectives of funding programs like BlueLA.
This paper is structured as follows: First, we contextualize our study within the broader literature on EV carsharing, mobility equity, and grocery access. Next, we detail our methodological framework and present key findings on how BlueLA improves access to grocery stores. Last, we discuss the implications of our results and future research directions, emphasizing the potential of EV carsharing to improve access to healthy food and bridge the gap between environmental goals and social equity.
2. Literature Review
2.1. Carsharing Overview
Carsharing dates to 1948, with the first documented system in Switzerland. The concept grew slowly in Europe and the United Kingdom during the 1970s before gaining global prominence by the 1990s [
11]. EV carsharing first emerged in the mid-1990s, integrating EVs into station car programs and shared fleets, and has evolved into a strategy to reduce tailpipe and greenhouse gas (GHG) emissions, depending on the electrical grid’s energy mix. Carsharing systems are broadly categorized into two models: roundtrip services, where vehicles must be returned to their pickup location (e.g., Zipcar), and one-way services, which allow for pickup and drop-off at different locations [
12]. One-way systems are further categorized into (1) free-floating models (e.g., Evie Carshare) where vehicles can be picked up and returned anywhere within a service area and (2) station-based models (e.g., BlueLA) in which vehicles must be picked up and returned at designated stations.
Research consistently demonstrates that carsharing reduces private vehicle ownership, vehicle miles traveled (VMT), and associated GHG emissions. Although some participants drive more upon gaining access to a shared vehicle, many others sell their cars or avoid purchasing one, thus reducing overall driving far more than the increase experienced by new drivers. Additionally, carsharing makes the cost of each trip more transparent, unlike annual insurance or maintenance fees for a privately owned car, which can feel disconnected from per-trip decisions. Studies of City CarShare in San Francisco reported that 30% and 29% of members got rid of at least one vehicle after two and four years, respectively [
13,
14]. In Philadelphia, each PhillyCarShare vehicle replaced an average of 23 private cars, including 10.8 vehicles relinquished and 12 avoided purchases [
15]. Evaluations of car2go across five North American cities revealed that 2% to 5% of members sold a vehicle and 7% to 10% avoided acquiring one, resulting in a VMT reduction of 20 to 37.5 million and GHG reductions of 5300 to 10,000 metric tons annually [
16]. In Ulm, Germany, 13.5% of car2go members forewent vehicle purchases [
17]. A North American survey of carsharing members (
n = 6281) found that average household vehicle ownership dropped from 0.47 to 0.24 vehicles, with many one-car households becoming carless [
18]. Although some households marginally increased emissions by gaining shared vehicle access, net impacts produced significant GHG savings [
19]. Additional evaluations show similar results: Modo in Vancouver and a roundtrip carsharing pilot in New York City reduced GHG emissions by over 30% and 6%, respectively [
20,
21]. A more recent study compared the VMT and associated GHG emissions in the presence and absence of BlueLA’s EV carsharing service and found that VMT and GHG emissions were reduced by 34% and 48%, respectively. Furthermore, each BlueLA vehicle replaced 16 personally owned vehicles (including sold vehicles and avoided purchases). The study also showed that using a fleet of EVs lowered emissions by 43% relative to internal combustion engine (ICE) vehicles [
22].
2.2. Grocery Access and Measurement
Grocery access is a critical component of food security, especially in low-income neighborhoods. As noted earlier, in Los Angeles County, 26.8% of households below 300% of the Federal Poverty Level experienced food insecurity in 2018, and by mid-2020, this figure had surged to 41.6% [
6]. Nationally, 23.5 million people live in low-income areas more than a mile from a grocery store, and among them, 2.3 million households lack vehicle access [
4]. Without private transportation, lower-income households in the USDA’s National Household Food Acquisition and Purchase Survey (FoodAPS) encountered time burdens despite traveling shorter distances (i.e., traveling 13.5 min and 2.95 miles per trip compared with 10.7 min and 3.85 miles for average households) [
4,
23].
These patterns echo findings from specific regions. For instance, research in Massachusetts showed that communities with higher poverty rates and lower vehicle ownership experience pronounced food accessibility gaps, particularly when relying on walking or public transit [
24]. Other analyses documented similar patterns. For example, in a predominantly low-income sample in Los Angeles County, about half of grocery shoppers traveled more than a mile to shop, based on Euclidean distances between residential and store census tracts [
25]. In Atlanta, average grocery trips span about 4.7 miles, with lower-income households traveling farther than higher-income ones [
26]; and in Seattle, 88% of grocery trips were by car, averaging around 3 miles in length [
27]. In Cincinnati, average grocery distances were about three miles with a high standard deviation of four miles, reflecting substantial variation in shopping behaviors [
28].
Beyond distance, shopping frequency and store types reveal further disparities. A survey in Houston showed that 57% of households rely on weekly or biweekly “big trip” shopping models supplemented by smaller outings [
29]. In South Carolina, very low food security (VLFS) households traveled shorter distances to their primary grocery stores (mean 2.4 miles, with a standard deviation of 1.4 miles) compared with food-secure (FS) households (2.8 miles, with a standard deviation of 3.2 miles), but both groups conducted longer trips to their second and third most-frequented stores (i.e., a mean of five miles, with a standard deviation of 15 miles) [
30]. Despite these shorter primary distances, VLFS households encountered compounded transportation challenges, including limited private vehicle access and greater reliance on public transit or family support. Moreover, they were twice as likely to frequent convenience or dollar stores, whereas FS households predominantly shopped at supermarkets or super stores.
These findings underscore the compounded disadvantages faced by food-insecure households, including limited mobility and access to healthful food environments, leading to a higher reliance retail options with limited product variety. In addition, the timing of grocery access can be particularly constrained for households without cars, especially those with irregular or inflexible work schedules, such as shift workers or single parents balancing caregiving responsibilities. While 84% of wage and salary workers followed a regular daytime schedule in 2017–2018, 16% worked non-daytime hours—including 6% in the evening, 4% at night, and others on rotating, split, or irregular shifts [
31]. Many workers might have flexibility or shared responsibilities within the household, but this is not universally true. For these groups, access to nearby stores with broader product offerings—and that are open outside traditional shopping hours—can significantly shape food access opportunities.
While previous grocery access studies have relied on static proximity metrics (e.g., measuring straight-line distances or fixed network distances to grocery stores), accessibility measurement can provide a more dynamic understanding of how people reach essential destinations and consider both the spatial distribution of opportunities and the ability to reach them [
32]. Hansen [
33] defined accessibility as the potential for opportunities for interaction, emphasizing that ease of travel alone is insufficient without considering the availability and desirability of destinations. In this study, we incorporate a dynamic, route-based accessibility measure that accounts for traffic conditions, trip departure times, store operating hours, and BlueLA rental costs. To reflect different access scenarios, we calculate accessibility across multiple thresholds based on the number of reachable grocery stores. This allows us to examine trade-offs between travel distance, time, cost, and the number of store options. However, we do not assess individual shopping behavior or decision-making. Prior research has shown that having more store options can lead to choice overload, particularly when individuals face complex decisions or lack clear preferences [
34,
35,
36]. Although we do not directly evaluate these behavioral effects, the tiered accessibility thresholds in our analysis help illustrate how access expands and becomes more costly as more store options are included, a trade-off future studies may explore in greater depth.
2.3. Carsharing Use Characteristics
Carsharing has historically attracted younger, educated, and employed individuals, often from higher-income households [
18,
37,
38,
39]. In Europe, users of station-based EV carsharing frequently reported higher incomes (over EUR 4000 per month, approximately USD 5300 at the time of the study) [
40], and North American users were often younger, carless, and multimodal travelers [
41]. Subsequent segmentation studies revealed that EV carsharing can also appeal to young couples living without cars or families who supplement their household vehicles [
42]. Income-related differences continue to shape usage: in Oakland’s GIG Car Share, low-income users (<USD 35,000) relied on carsharing largely due to lack of personal vehicles (70% carless), while high-income users (>USD 100,000) often owned at least one car (55%) and considered carsharing a supplement. Notably, grocery shopping was cited as a top trip purpose by around 60% of both groups [
43]. Similar disparities emerge in San Francisco, where only 25% of those earning under USD 50k used carsharing versus 46% above USD 150k, with wealthier users employing it more frequently (i.e., two to three times per week) [
44]. Within BlueLA, both Standard and Community members valued the service. Standard members tended to choose carsharing as a lifestyle preference, while Community members relied on it for essential trips, including grocery shopping, although user retention challenges remained due to limited vehicle and charging station availability [
45,
46].
In terms of trip patterns, across 12 free-floating systems in the U.S. and Europe, median rental times were around 27 min, and average trip lengths (straight-line distance) were about 1.8 miles [
47]. Temporal distributions were observed to be relatively even in China, with peak usage occurring from early afternoon through to evening [
48]. Roundtrip EV carsharing pilots like Miocar in California’s Central Valley predominantly served large, low-income households, who averaged 1.25 reservations per month, traveling 92 miles and spending over 18 h monthly with the service [
49]. During the COVID-19 pandemic, Envoy, a station-based EV carsharing service located at residential buildings in Sacramento where half of its deployments were situated in USDA-designated food deserts, was essential for grocery trips, with 87% of respondents depending on the service for food access [
50].
2.4. EV Carsharing’s Potential to Improve Environmental and Social Equity
EV carsharing systems are positioned to advance environmental goals and promote social equity by providing cleaner, more flexible transportation options to underserved communities [
51]. The “green divide” concept highlights how low-income and marginalized groups disproportionately suffer from transportation-related emissions, facing elevated exposure to pollutants [
1,
3,
52,
53]. In response, policy frameworks in states like California have supported EV carsharing as a dual strategy, reducing tailpipe emissions and improving access to essential services, including grocery shopping, for communities often excluded from such advancements [
54]. Programs such as Clean Cars 4 All, emerging from the foundation laid by the Advanced Clean Cars (ACC) I and II regulations, the Zero-Emission Vehicle (ZEV) and Low-Emission Vehicle (LEV) programs, and the Clean Vehicle Rebate Project (CVRP) aim to ensure that low- and middle-income Californians benefit from electrification by offering substantial incentives for replacing older, polluting vehicles or transitioning to alternative mobility options (e.g., public transit, shared mobility) [
55]. The California Climate Investments (CCI) program further supports these initiatives, directly funding EV carsharing projects like BlueLA in Los Angeles, Our Community CarShare in Sacramento, and Miocar in San Joaquin [
56]. These policy-backed efforts underscore California’s commitment to an inclusive electrification transition, ensuring that clean mobility benefits extend to all residents [
57].
Across the U.S., diverse EV carsharing programs illustrate tailored approaches to meet local mobility needs [
58]. Initiatives such as Minneapolis–St. Paul’s Evie Carshare, the Clean Rural Shared Electric Mobility (CruSE) Project in Hood River, Oregon, and the Hacienda Community Development Corporation (CDC) Carsharing Pilot in Portland, Oregon, have adapted their service models to specific contexts, whether they be urban, suburban, or rural. They place EVs in affordable housing complexes, offer subsidized membership rates, and engage communities to support residents’ daily routines and priorities. These initiatives emphasize the importance of community partnerships, targeted funding, and equitable infrastructure deployment as essential strategies in making the electrification transition both inclusive and impactful.
2.5. Summary and Research Gaps
Existing research demonstrates that carsharing, including EV-based services, can reduce vehicle ownership, VMT, and GHG emissions while offering more flexible mobility options. Yet, much of this work focuses on user groups that are younger, higher-income, and highly educated, reflecting the historical deployment of carsharing in wealthier neighborhoods. Although newer initiatives like BlueLA target underserved populations, most studies have emphasized mobility and environmental benefits rather than examining how these services might improve access to essential resources such as healthy, affordable groceries. Studies highlight that limited transportation options, store availability, and pricing combine to exacerbate food insecurity, but the nexus between EV carsharing and improved grocery access remains underexplored.
To address these gaps, our study integrates a dynamic accessibility measurement using trip activity data and survey insights to assess the potential of EV carsharing to improve grocery access in underserved communities. We specifically investigate how spatial-temporal accessibility from BlueLA stations to different grocery store types varies under different traffic conditions and trip departure times, as well as how Standard and Community members differ in their perceived grocery access and station usage patterns. By doing so, we offer a replicable mixed-methods framework to evaluate the broader social equity implications of EV carsharing in improving access to grocery shopping.
3. Methods
3.1. Data Sources
This study adopts a mixed-methods approach to investigate the role of BlueLA in improving access to grocery shopping. Our analysis is supported by four primary data sources: (1) the USDA SNAP Retailer dataset (n = 5888 stores); enriched with store attributes from Google’s Places and Yelp’s Fusion APIs; (2) trip activity data from BlueLA (n = 59,112 trips); (3) a user survey (n = 215) implemented to gather insights into user behavior and perceptions; and (4) demographic and socio-economic data from the 2020 Decennial Census and 2022 American Community Survey (ACS) five-year estimates.
3.1.1. SNAP Retailer Data
The SNAP Retailer dataset for Los Angeles County (The SNAP Retailer dataset for Los Angeles County is publicly accessible at
https://www.fns.usda.gov/snap/supplemental-nutrition-assistance-program accessed on 27 October 2024) comprised 5888 grocery outlets authorized to accept SNAP benefits, spanning various store types defined by the USDA. These categories include (1)
Convenience Store, (2)
Combination Grocery/Other Outlet, (3)
Super Store, (4)
Supermarket, (5)
Large Grocery Store, (6)
Medium Grocery Store, and (7)
Small Grocery Store. USDA definitions of the different store types are as follows:
Convenience Store (e.g., 7 Eleven): small retail outlets, often open long hours, offering a limited selection of packaged grocery items, non-food products, and prepared items (e.g., coffee, tobacco, alcohol).
Combination Grocery/Other Outlet (e.g., Dollar Tree, CVS Pharmacy): general merchandise retailers that also sell a variety of food products, including dollar stores, drug stores, and other general purpose outlets.
Super Store (e.g., Target, Walmart, Sam’s Club, Ralphs, Costco): very large stores offering a wide selection of groceries alongside general merchandise.
Supermarket (e.g., Albertsons, Trader Joe’s): full-line grocery stores selling a wide array of staple foods and other store merchandise.
Large Grocery Store: retailers carrying a broad selection across all major food categories.
Medium Grocery Store: stores with a moderate range of staple food categories.
Small Grocery Store: outlets stocking a limited assortment of staple foods.
To ensure the data’s accuracy, we used Google’s Places API to verify operational status, confirming that 96% of the listed outlets were active. Additionally, we enriched the dataset with store operating hours and price level. The price level, represented by a scale of “
$” (Level 1: least expensive) to “
$$$$” (Level 4: most expensive), provides an indicator of the store’s general affordability. Although this metric is based on aggregated user reviews and may vary in precision, we further validated these price levels using data from Yelp’s Fusion API, adding another layer of reliability. To focus on affordability, we excluded the few
Supermarkets and
Super Stores at Level 3 pricing or above (e.g., Gelson’s Market, Whole Foods, Bristol Farms), resulting in the majority (85% of
Supermarkets and 87% of
Super Stores) offering price levels at or below Level 2. We then restricted our analysis to stores within a 15-mile driving distance from BlueLA stations, inspired by our literature review. The remaining data are shown in
Table 1.
3.1.2. Trip Activity Data
The trip activity data cover BlueLA trip reservations for the years 2021 and 2022 across 38 stations operational during that period. This dataset includes 59,112 trips, with 49% completed by Standard members and 51% by Community members. A total of 3074 users contributed to the dataset, comprising 63% Standard members and 37% Community members. Each trip includes key attributes including start and end times, start and end station locations, total distance traveled, and the vehicle’s charge level at the beginning and end of each trip. Additionally, the data include identifiers like vehicle ID and user ID, as well as user-specific information such as membership type (i.e., Standard or Community), age, and member join date.
3.1.3. User Survey
To better understand user experiences with BlueLA, we conducted a user survey in early December 2022. The survey was deployed to the entire BlueLA user base (n = 4122 users at the time of the survey) and was made available in both English and Spanish. Participants were incentivized with the chance to win one of 40 Amazon gift cards, each valued at USD 50. The survey collected responses anonymously, using two types of user De-IDs. One De-ID allowed us to link survey responses to trip activity data, while the other identified the respondent’s membership status, distinguishing between “active” members (currently subscribed) and “inactive” members (previously subscribed but not active at the time). We received 215 responses, including two in Spanish, with 60% from active and 40% from inactive members; from the respondents, 56% were Standard members and 44% were Community members. For this study, we consider only responses from active members to understand current trip patterns, while inactive members were included in the survey to explore barriers to sustained use, which was the focus of a separate study.
3.1.4. U.S. Census Data
To support our analysis, we used the 2020 Decennial Census and the 2022 ACS five-year estimates to characterize the demographic and socio-economic context of the BlueLA service area (e.g., vehicle ownership, receipt of SNAP).
3.2. Dynamic Accessibility Measurement
Accessibility has been a widely studied concept in transportation planning, traditionally measured through distance-based metrics, travel time calculations, or cumulative opportunity counts [
32,
33,
59]. Prior grocery access research discussed in the literature review has primarily relied on static proximity metrics, such as straight-line distances or fixed network distances to grocery stores. Building on these established methods, we incorporated a dynamic, route-based accessibility measure that accounts for traffic conditions, trip departure times, store operating hours, and BlueLA rental costs. To assess the impact of BlueLA on grocery store access, we employed spatial-temporal walking and driving isochrone analyses. First, we used the Mapbox Isochrone API to generate walking isochrones around each station, aligning the service area boundaries with walking thresholds identified through the user survey. Demographic and socio-economic variables from U.S. Census data were then spatially joined to these service areas. Next, we generated time- and distance-based driving isochrones using the Mapbox Directions API to capture accessibility to grocery stores across multiple scenarios. These dynamic scenarios accounted for variations in store operating hours and travel times resulting from differing traffic conditions on weekdays versus weekends and at various times of day. This allowed us to construct cumulative accessibility measures to examine trade-offs between travel distance, time, cost, and the number of store options and to identify which store categories were most accessible under different conditions.
3.3. User Behavior Integration
To contextualize these accessibility measures, we integrated user trip data and survey results. Trip data were used to analyze station-level usage patterns among Standard and Community members, while the user survey provided insights on perceived changes in grocery access and general travel flexibility.
4. Results and Discussion
In this section, we synthesize the findings from our spatial-temporal, survey, and trip data analyses to understand how BlueLA influences grocery store access for underserved communities.
4.1. Accessibility to BlueLA Stations and Demographic Context
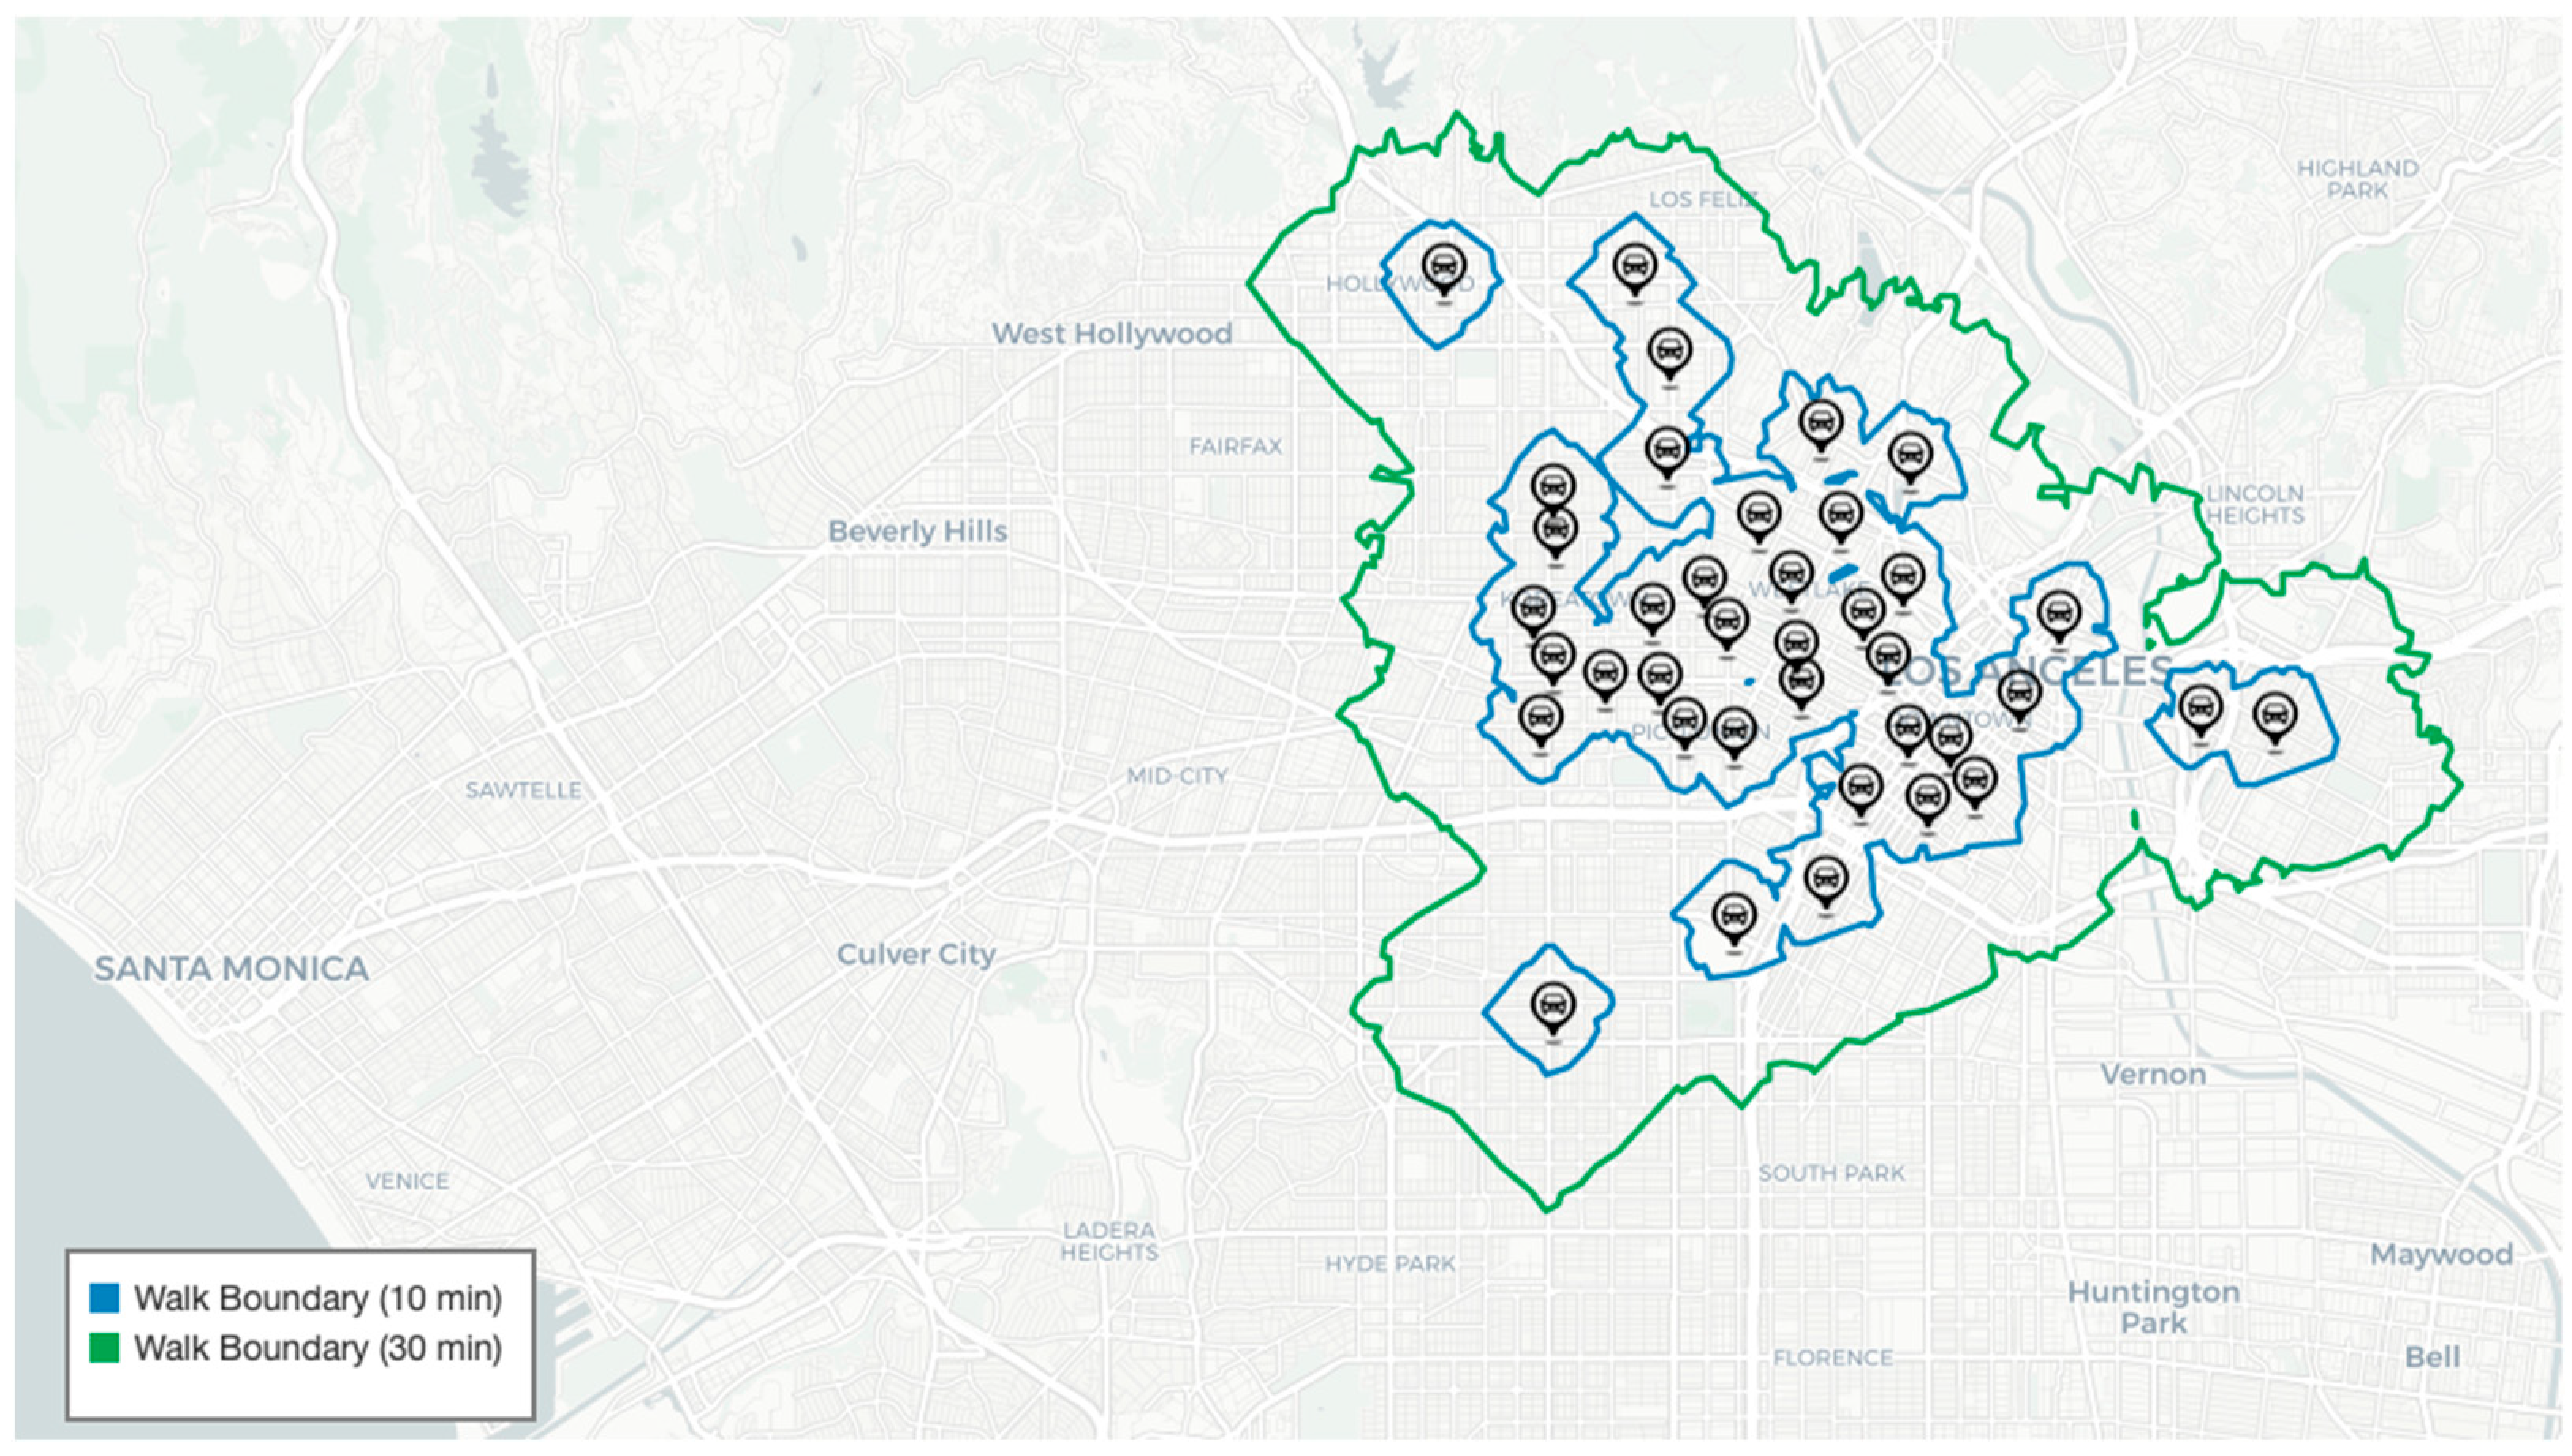
To examine the spatial coverage of BlueLA stations and its relationship to neighborhood demographics, we incorporate user-reported walking thresholds and walking isochrones to delineate service areas (
Figure 1 and
Figure 2).
Figure 1 shows the distribution of carsharing stations delineated by 10 and 30 min walking thresholds, which correspond to average distances of approximately 0.5 miles and 1.5 miles, respectively. Based on the distribution of user-reported walking thresholds in
Figure 2, we define the 30 min walk isochrone as the maximum service area for our case study. While the City of Los Angeles as a whole has a population of about 3.88 million and 1.46 million households (of which 12% are carless and 18% receive cash public assistance or food stamps/SNAP), our defined BlueLA service area—covering approximately 891,283 residents (23% of the city total) and 377,280 households—exhibits higher proportions of carless (22%) and SNAP-receiving (19%) households (
Figure 3). Stations are densely clustered in central neighborhoods (e.g., Downtown Los Angeles, Koreatown, Westlake), which typically feature multi-story residential units and limited parking availability. By contrast, peripheral zones (e.g., Hollywood) display sparser station placement. This variation suggests that while some neighborhoods benefit from a dense network of stations within short walking distances, others rely on fewer stations that cover broader catchment areas.
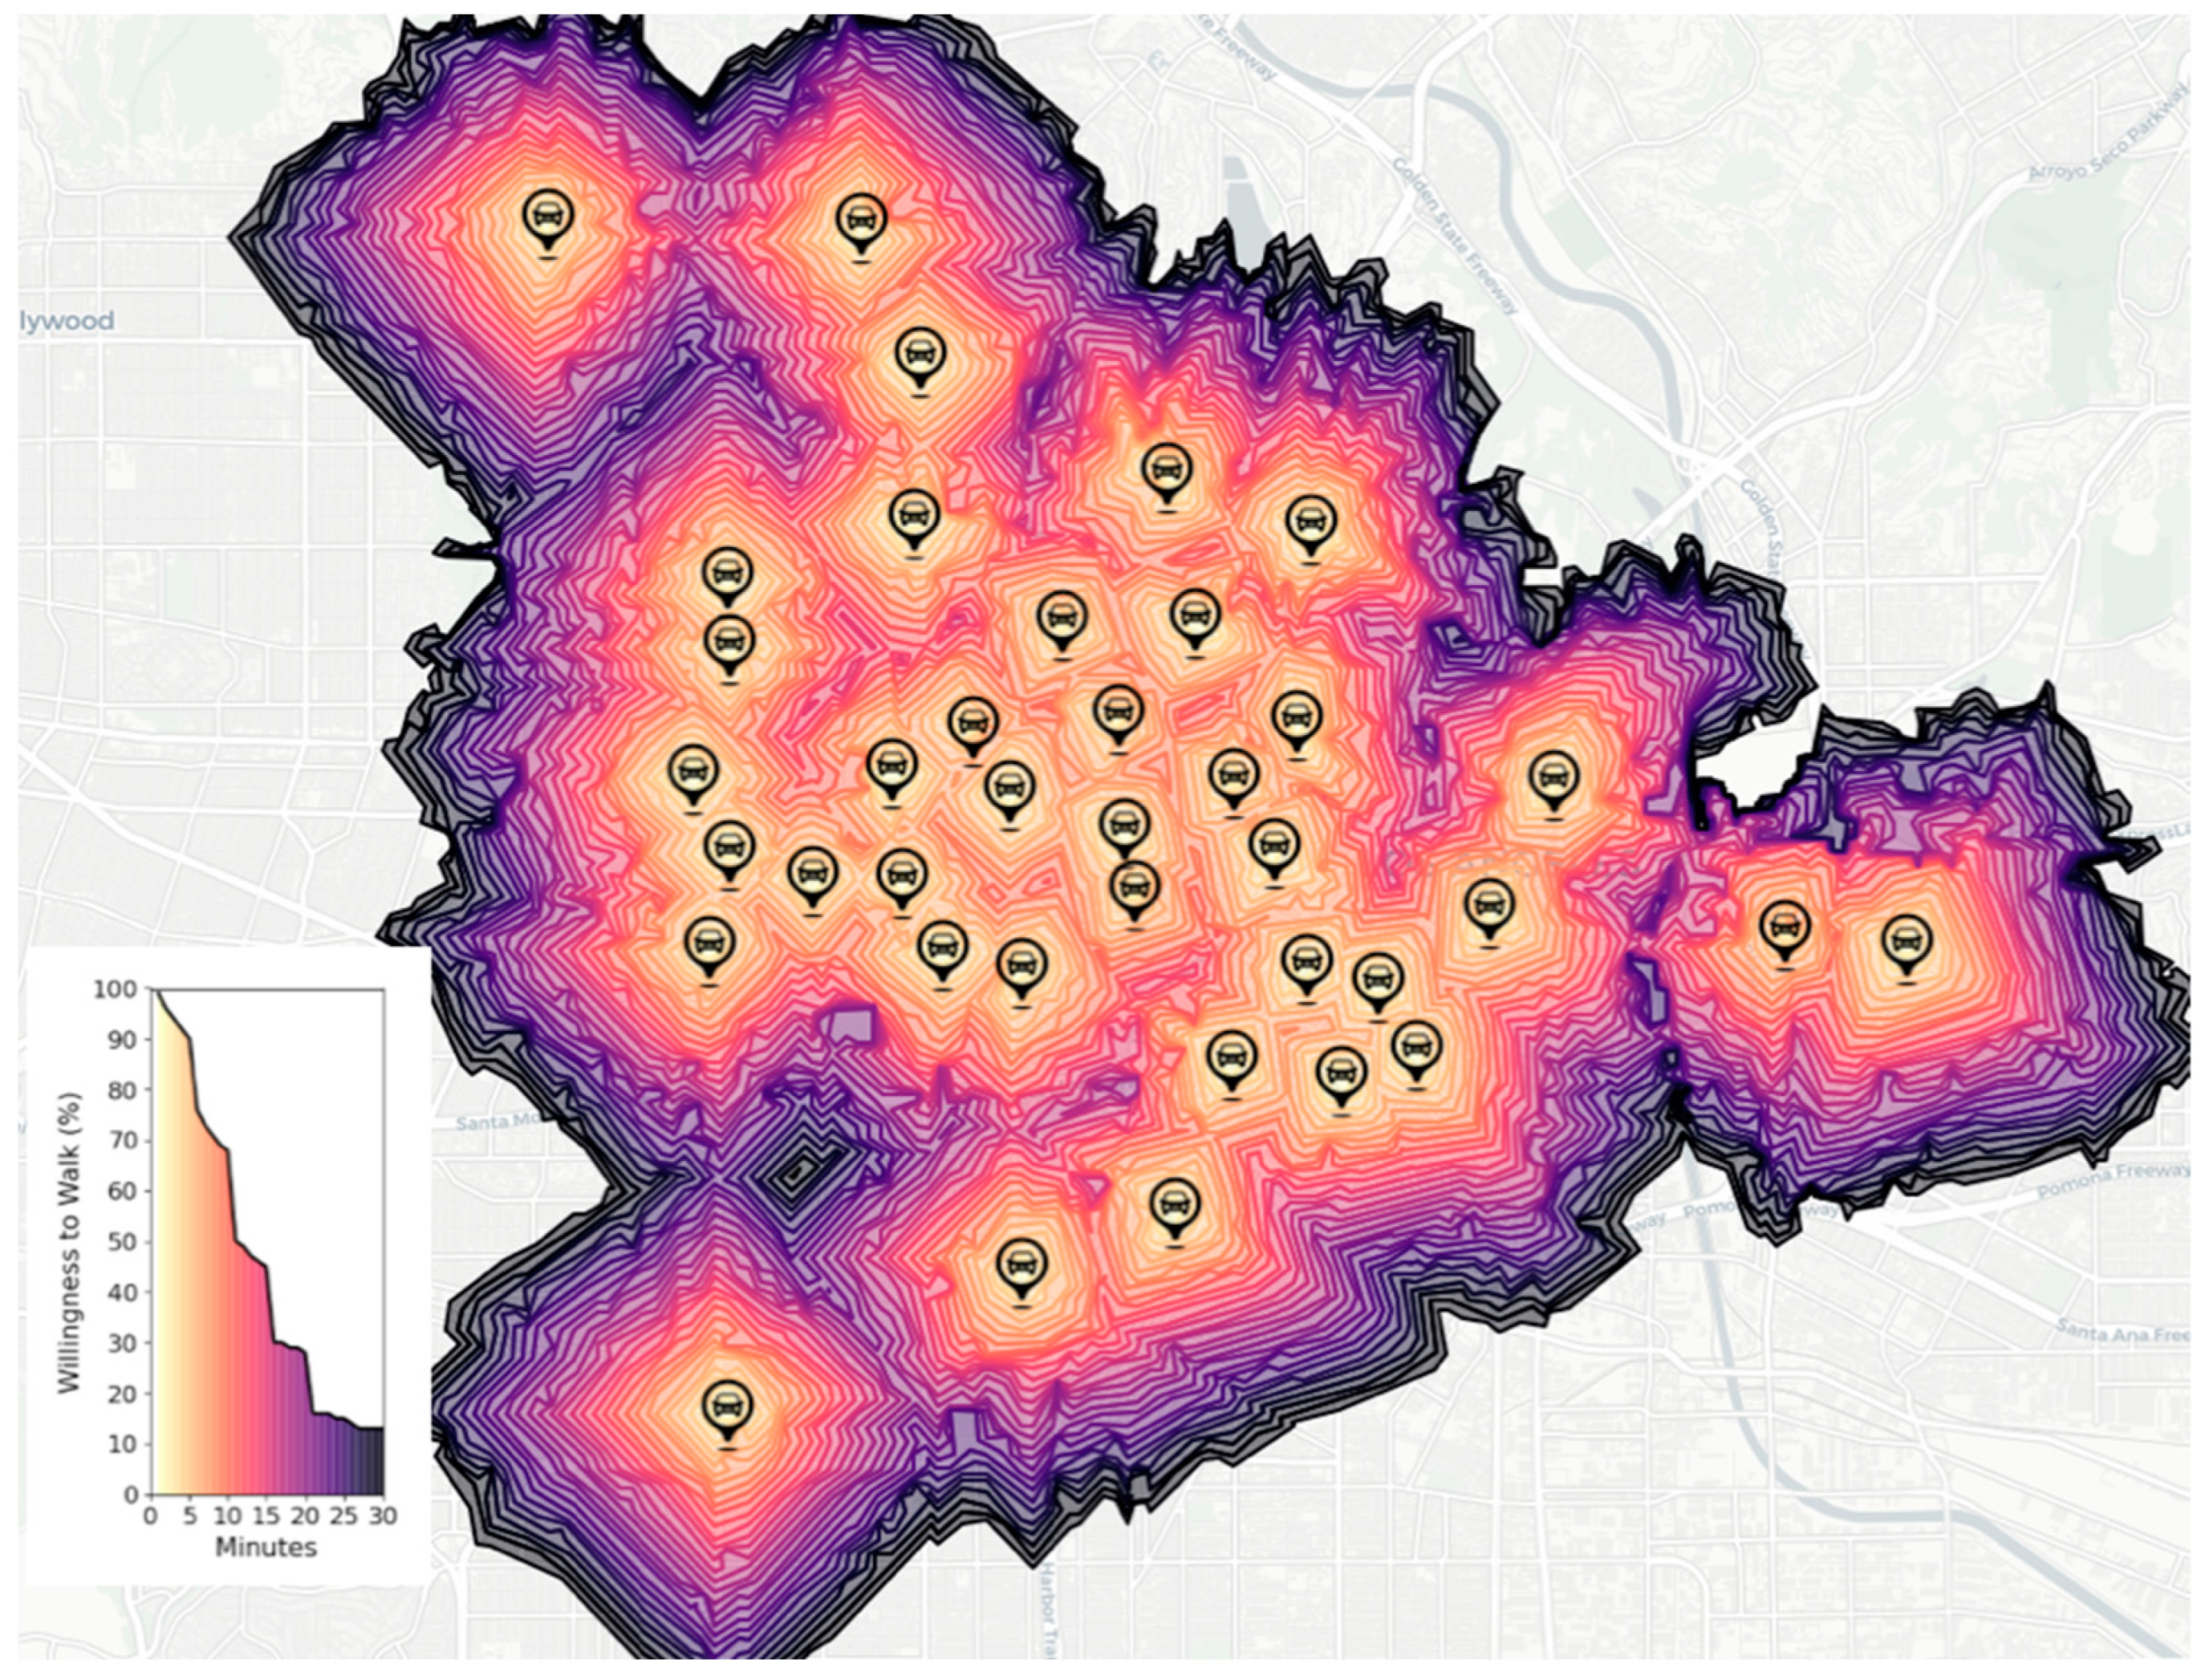
User willingness to walk emerges as another factor in understanding accessibility to BlueLA stations (
Figure 2), revealing that the percentage of users willing to walk to a station drops substantially with increasing walking time. While 90% of users are comfortable walking five minutes, willingness to walk declines to 68% at 10 min, 45% at 15 min, and just 13% at 30 min. This decrease underscores the importance of station density; even if a station’s nominal service area extends to 30 min of walking, the effective user catchment may be considerably smaller.
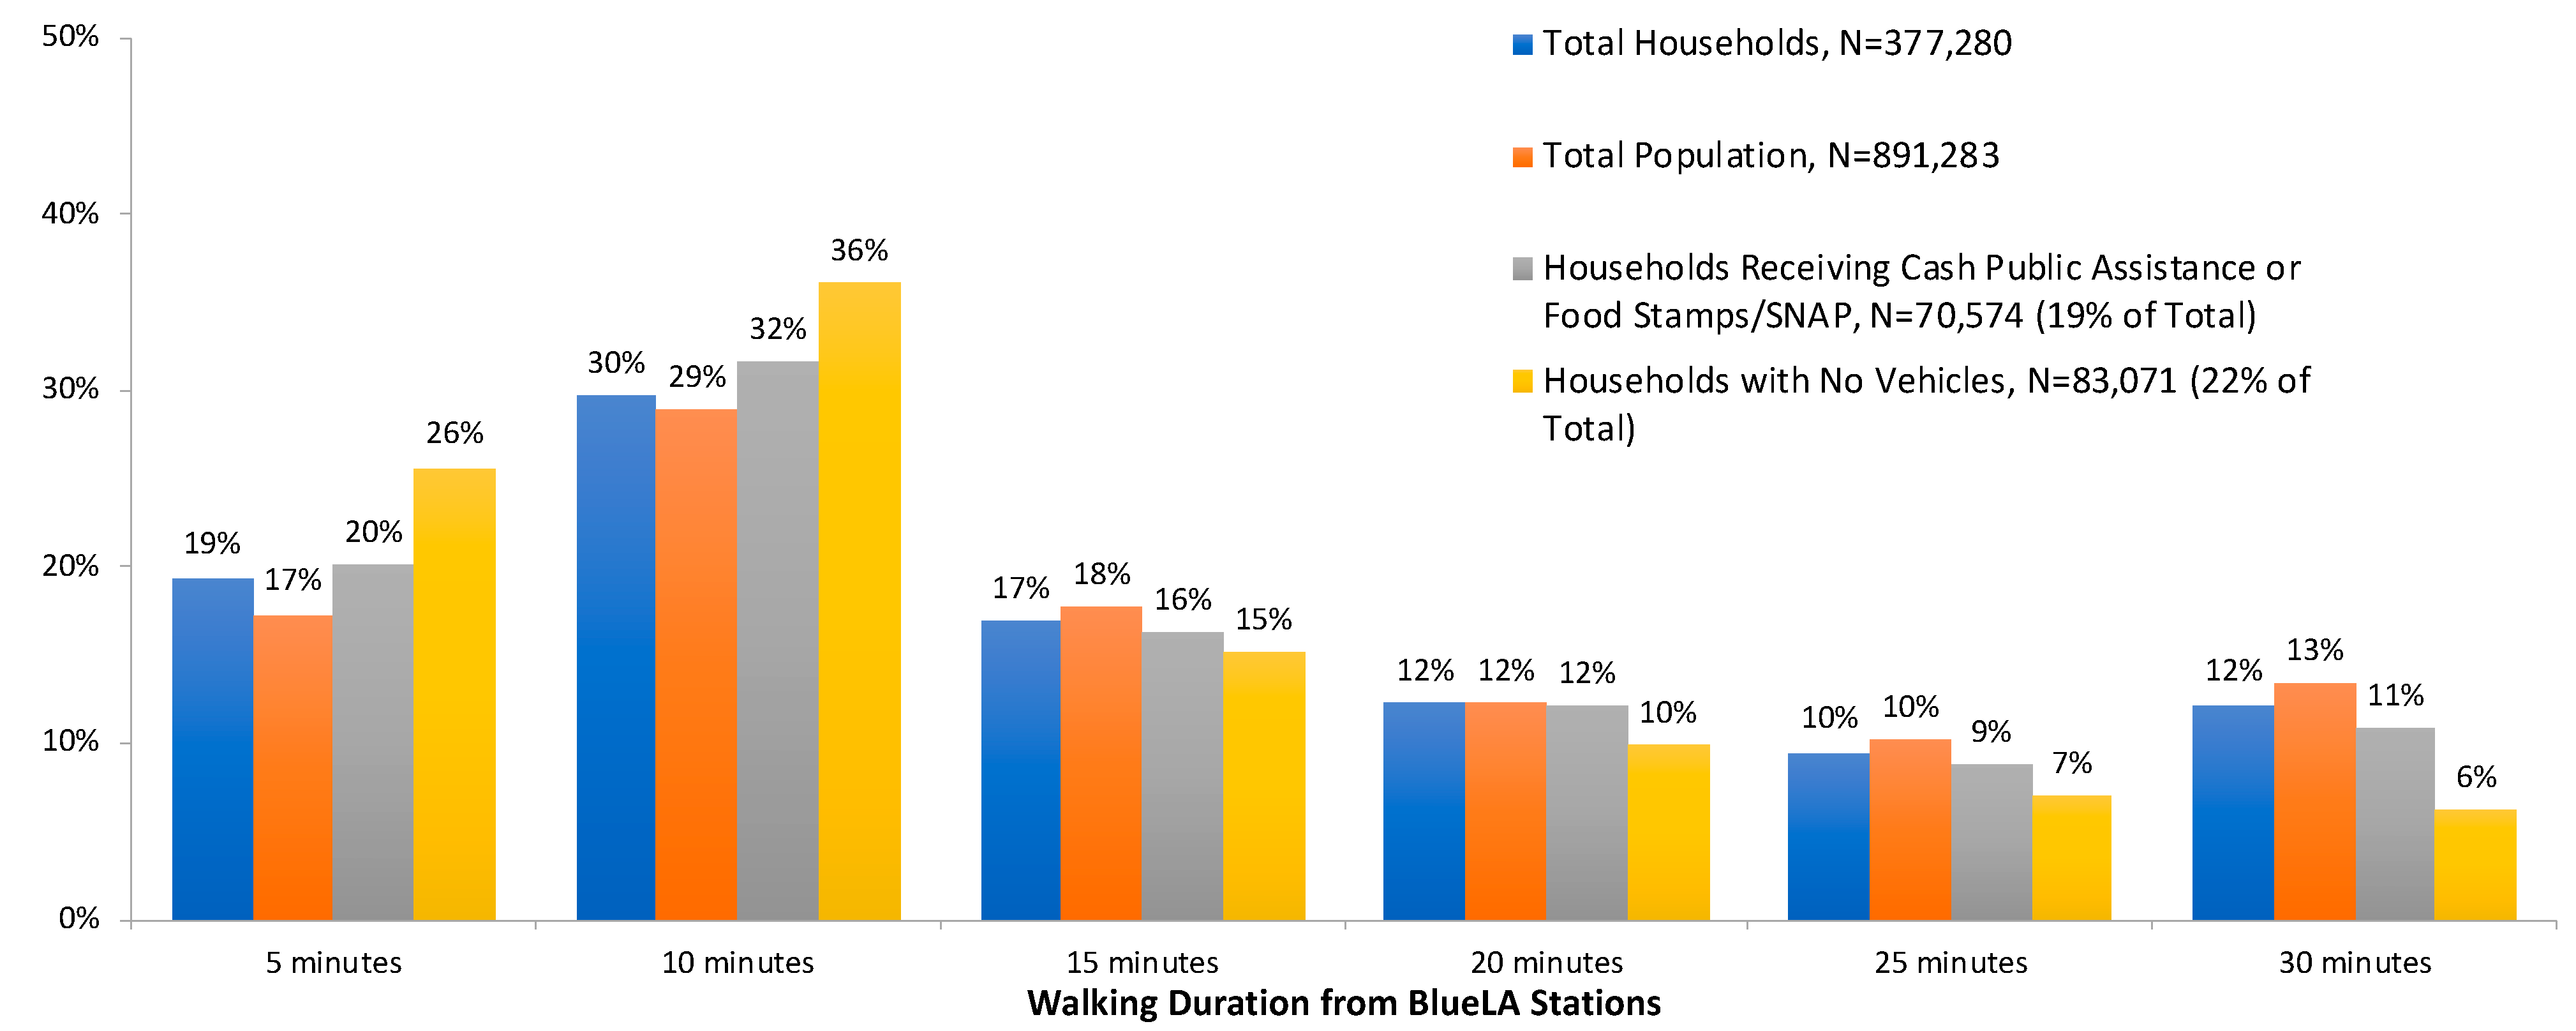
Combining the above results with demographic data,
Figure 3 below shows that within a five-minute walk, roughly 19% of total households and 17% of the total population are captured, while 20% of SNAP-recipient households and 26% of carless households fall within this range. At a 10 min walk, the cumulative shares increase to 49% of total households, 46% of the population, 52% of SNAP-recipient households, and 62% of carless households, showing that a disproportionately higher share of SNAP-receiving and carless households comes into reach and highlighting the potential of BlueLA to provide access for underserved populations.
4.2. Grocery Store Accessibility Across Dynamic Scenarios
To measure the spatial-temporal dynamics of grocery store availability and capture the influence of store operating hours and traffic congestion, we considered multiple scenarios: weekday and weekend conditions at six distinct times of day (8 AM, 12 PM, 3 PM, 6 PM, 9 PM, and 1 AM). These time windows reflect common grocery shopping patterns, including peaks observed on Saturday mornings and midday hours across the week [
60].
4.2.1. Grocery Store Availability
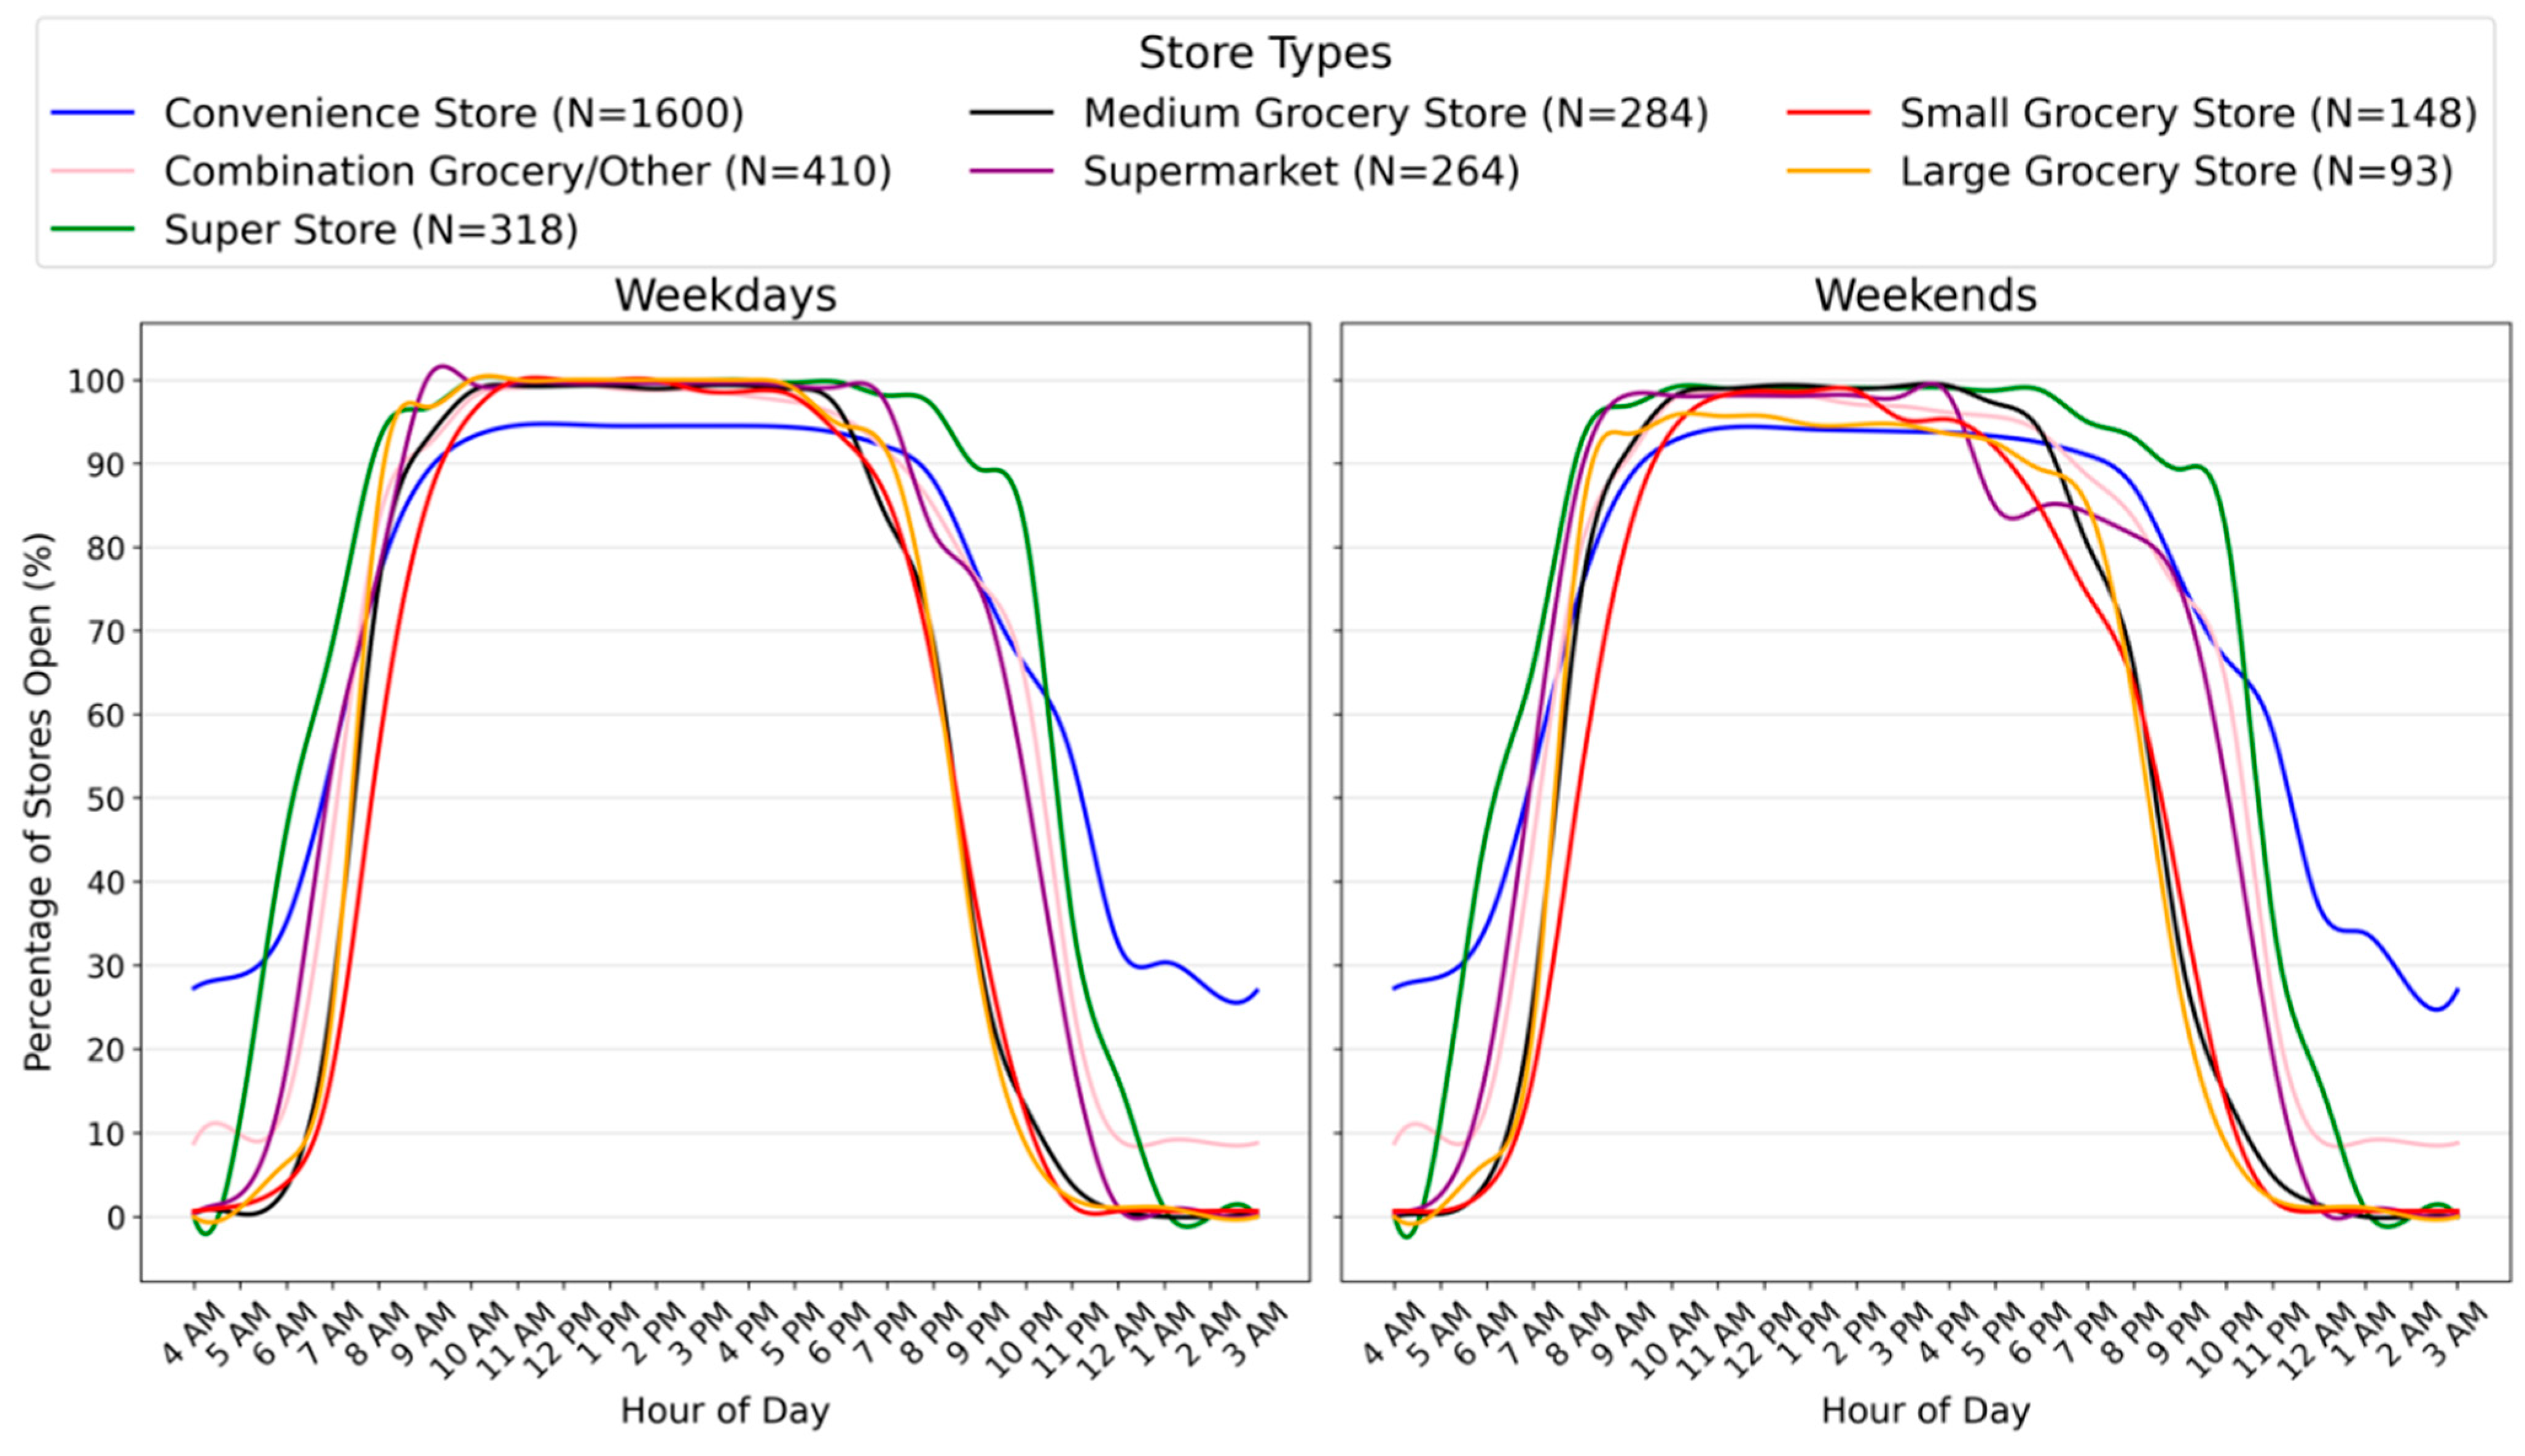
Figure 4 below depicts the percentage of stores open throughout the day for each store type on weekdays and weekends, revealing distinct temporal patterns that shape access to varying levels of product variety.
Super Stores (e.g., Walmart, Ralphs) lead the market in early morning availability, with nearly half of these outlets open by 6 AM, which is an hour before
Supermarkets (e.g., Sprouts Farmers Market, Vons) reach a similar 50% operating threshold at around 7 AM. By mid-morning, nearly all store types approach full operational capacity, maintaining near-100% availability between 10 AM and 6 PM. As the evening progresses, half of
Small,
Medium, and
Large Grocery Stores close by 9 PM, followed by
Supermarkets closing at a similar rate by 10 PM and
Super Stores by 11 PM. Ralph’s
Super Stores are the only chain open past midnight, with 49 locations operating until 1 AM and 3 until 2 AM. Meanwhile, only two Vons
Super Markets stay open beyond midnight—one until 1 AM and the other 24 h. Weekend patterns generally mirror weekday trends, except that around 20% of
Supermarkets close earlier in the evening (i.e., by 6 PM).
Overnight and late evening periods illustrate important differences in availability. Convenience Stores (e.g., 7-Eleven) and Combination Grocery/Other Outlets (e.g., CVS, Dollar Tree) provide around-the-clock access, albeit at reduced levels between midnight and 6 AM (i.e., 30% and 10% open, respectively), when other store types remain largely closed. These variations suggest that while large-format, full-service stores are broadly accessible during daytime and evening hours, households needing late-night access must often rely on Convenience Stores and Combination Grocery/Other Outlets.
4.2.2. Spatial Distribution of Grocery Stores
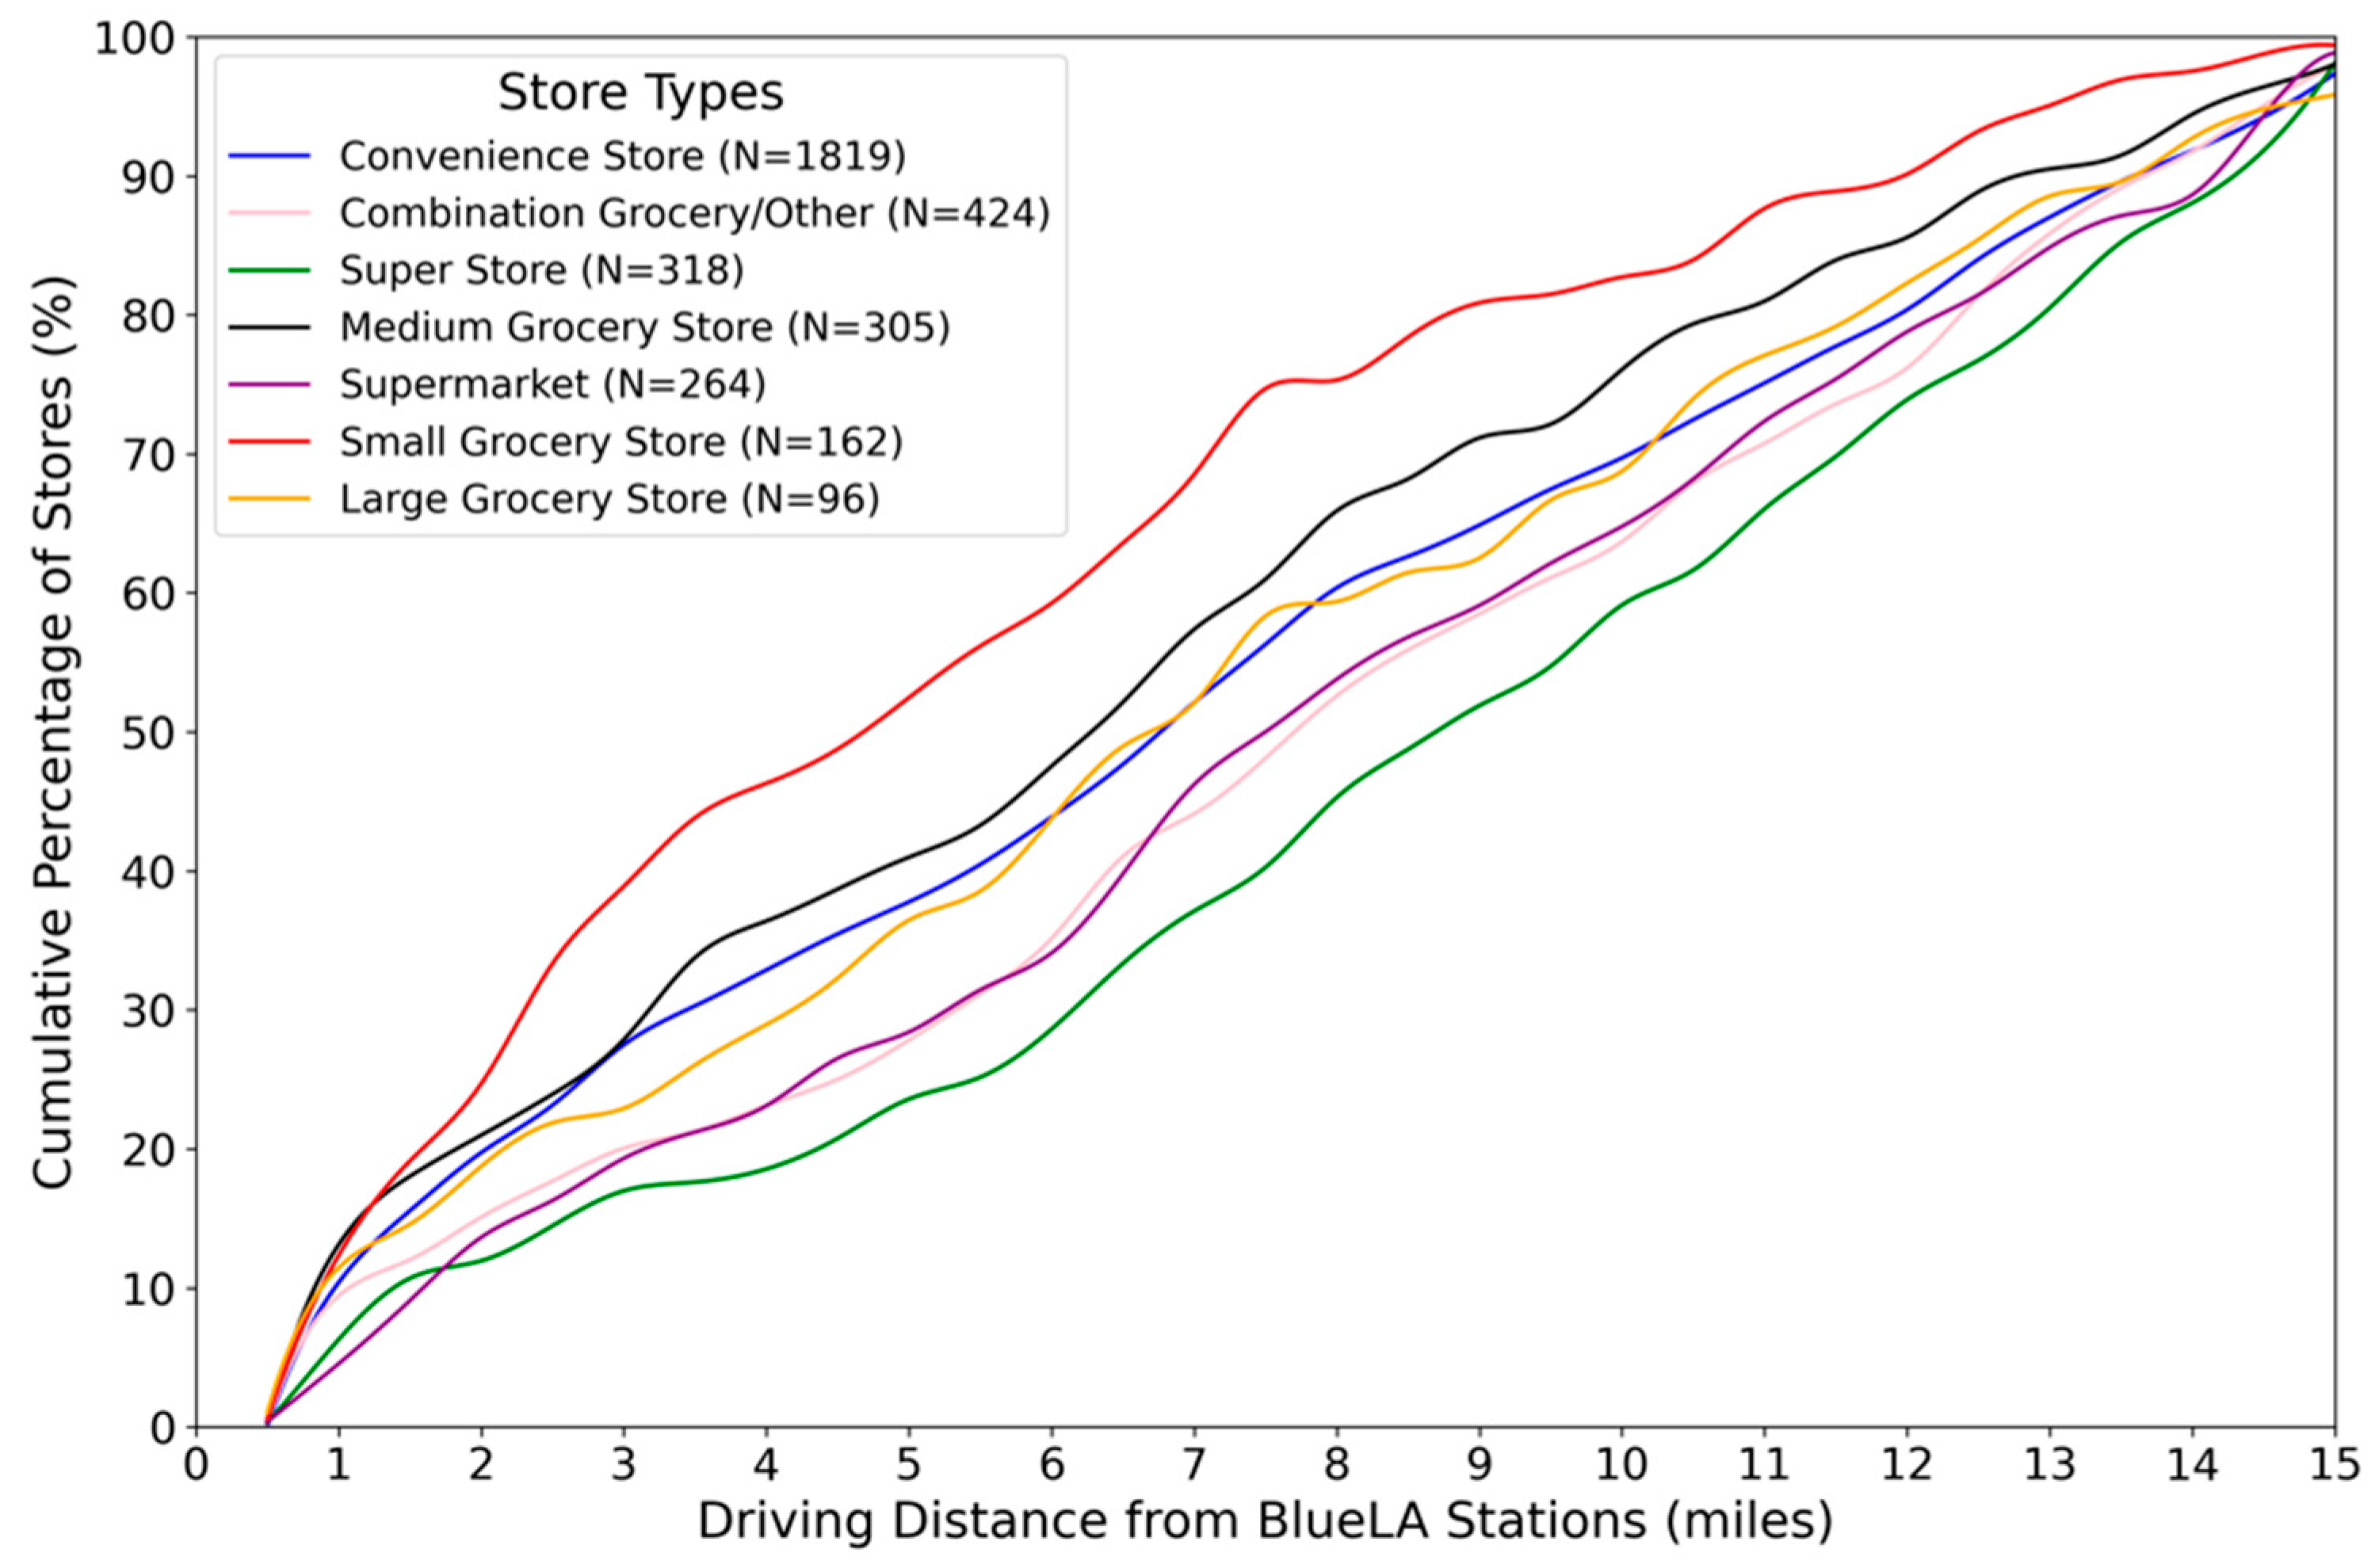
Building upon the temporal analysis of store operating hours,
Figure 5 below presents the cumulative distribution of accessible grocery stores by driving distance from BlueLA stations.
Small Grocery Stores, while limited in both scale and product offerings, are the most proximate on average, with half of them being located within about five miles of a BlueLA station.
Medium Grocery Stores reach a similar 50% threshold at around 6.5 miles, followed closely by
Large Grocery Stores and
Convenience Stores, both at approximately seven miles. Although
Convenience Stores (
N = 1819, the largest subset) are plentiful and relatively accessible, their inventory is often restricted to packaged snacks and beverages, offering minimal fresh produce and tending to carry higher prices for staple goods. In contrast,
Supermarkets and
Super Stores—both essential for providing a wider range of product options—require longer travel distances, with 50% of
Supermarkets and
Super Stores being located around seven and eight miles, respectively.
Combination Grocery/Other Outlets, which mix general merchandise and food products, typically fall between these extremes in terms of both distance and product variety. Additionally,
Table 1 shows that at shorter distance thresholds (e.g., 0.5 to one mile), only 6% to 10% of
Super Stores lie within this range, whereas 10% to 16% of Convenience Stores do. This is an important point given user willingness to walk often drops sharply beyond one mile, as previously shown in
Figure 2. These spatial patterns highlight a central equity concern: while the nearest, most abundant options are
Convenience Stores and
Combination Grocery/Other Outlets, larger stores (e.g.,
Supermarkets and
Super Stores) are less frequent and situated farther away.
4.2.3. Influence of Time-of-Day and Day-of-Week Scenarios
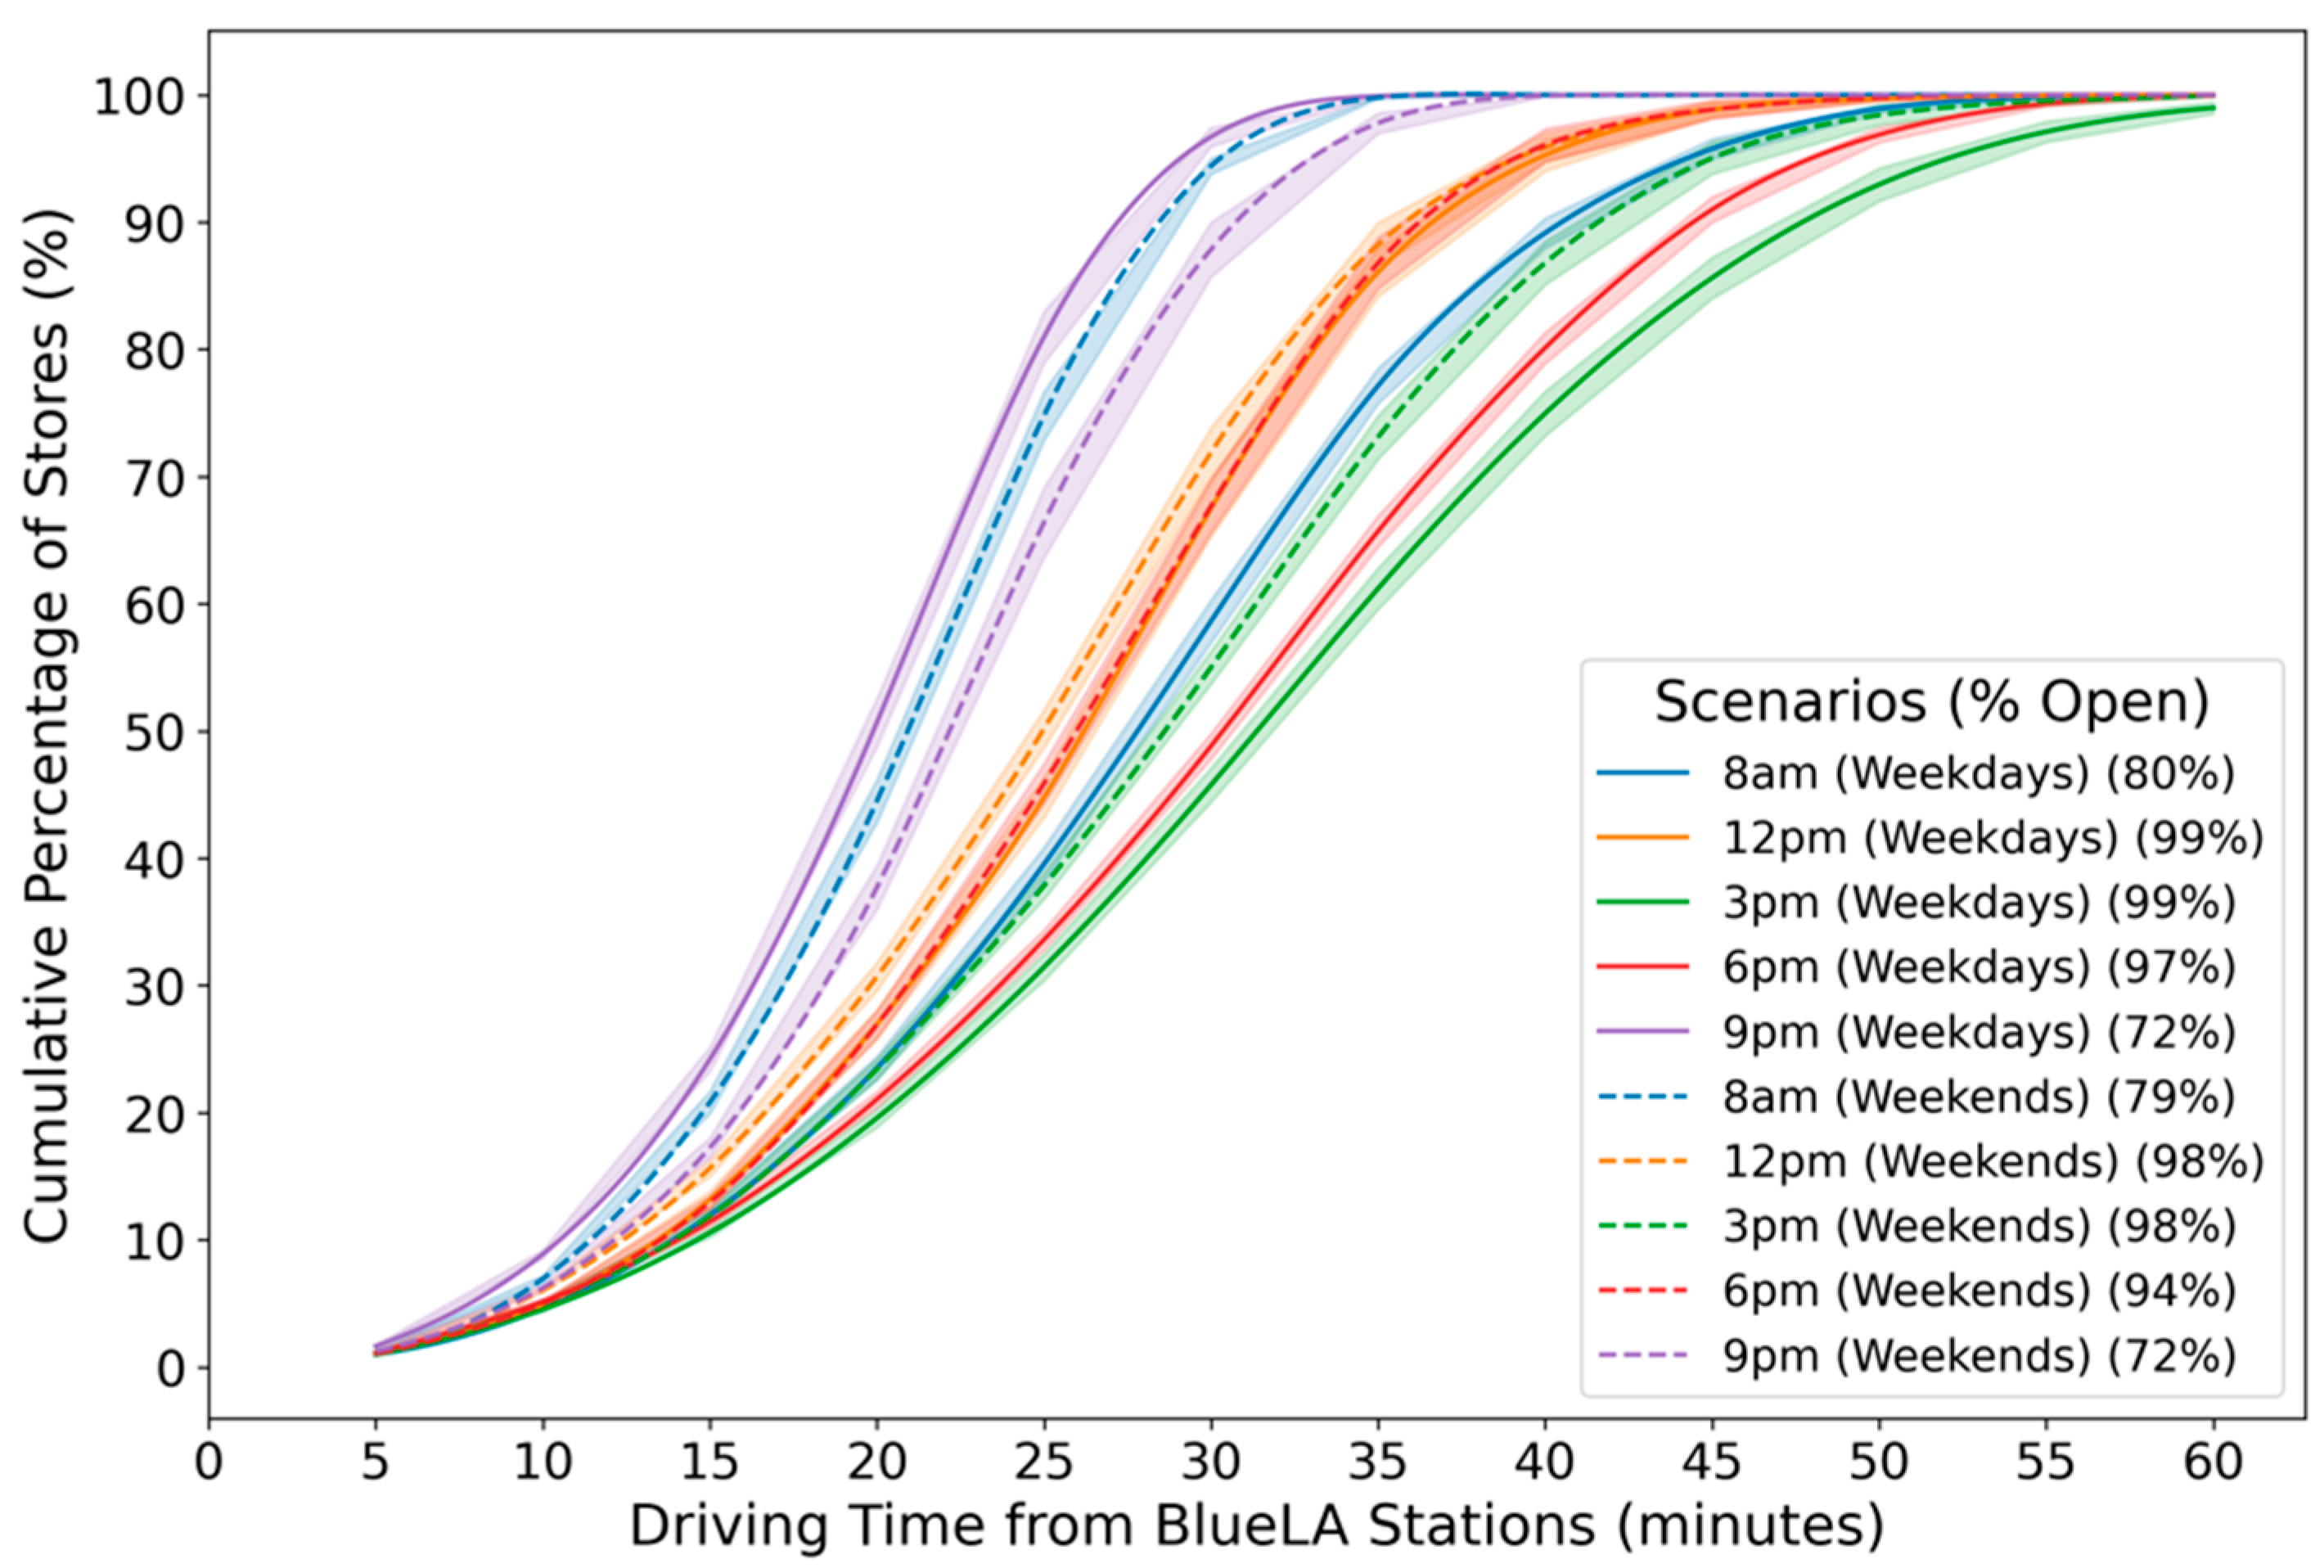
To better understand the dynamic effect of store operating hours and travel conditions, we modeled cumulative accessibility curves under varying temporal scenarios (
Figure 6), with shaded bands representing 95% confidence intervals of variability across BlueLA stations. Each scenario considers a given day (weekday or weekend) and time (8 AM, 12 PM, 3 PM, 6 PM, 9 PM, or 1 AM).
During midday hours (12 PM and 3 PM), when 98% to 99% of stores are open, weekend scenarios generally yield more efficient access times than their weekday counterparts. For instance, on weekends at 12 PM, half of the stores become accessible in under 24 min on average, and at 3 PM, this increases slightly to around 28 min. By comparison, on weekdays at 12 PM, the same 50% threshold is reached in about 25 min on average, and by 3 PM, this extends to approximately 32 min, despite similarly high store availability. Moreover, at 3 PM on weekdays, all stores within 15 miles of BlueLA stations remain accessible within one hour of driving, while this maximum required travel time shrinks to about 30 min by around 9 PM due to reduced traffic congestion. Morning and evening periods present contrasting dynamics: at 8 AM, both weekday and weekend scenarios feature around 80% of stores open, yet weekend morning trips reach 50% of stores within an average of 21 min compared with 27 min on weekdays. Conversely, late evening scenarios at 9 PM show a different pattern: while both weekday and weekend evenings have similar proportions of open stores (about 72%), the weekday scenario achieves 50% accessibility in 19 min compared with 22 min on weekends, possibly due to weekend leisure traffic. At 1 AM, store availability diminishes significantly, with only about 19% open on weekdays and 21% on weekends. While travel times at this hour are minimal due to low congestion, the limited number of stores operating at night (primarily
Convenience Stores and
Combination Grocery/Other Outlets as previously shown in
Figure 4) reduces the overall variety of available options, underscoring the trade-off between travel ease and the benefit of late-night grocery access. These temporal dynamics reveal that, even with identical spatial distributions of stores, the time at which a user departs can influence both the quantity and type of reachable grocery stores. During peak traffic periods, longer driving times can diminish the practical accessibility of distant
Supermarkets or
Super Stores. Off-peak periods, conversely, can improve accessibility, but they may coincide with reduced store operating hours. The interplay of these factors suggests that EV carsharing has the potential to provide carless households in underserved communities with flexible access to grocery stores.
We next focused on
Supermarkets and
Super Stores, which offer a broader product range compared with other store types.
Table 2 presents incremental accessibility metrics for three contrasting scenarios—labeled as “Low Traffic,” “Medium Traffic,” and “High Traffic”—across five coverage thresholds (one to five stores, five stores to 25% of reachable stores, 25% to 50%, 50% to 75%, and 75% to 100%). The “one to five stores” threshold captures common consumer shopping patterns and addresses concerns about choice overload, as research shows that 76% of weekly shoppers visit more than one retailer and typically frequent two to three grocery stores per week [
61]. At the other end, measuring accessibility up to 100% of reachable stores allows us to evaluate the full potential of the network, providing insight into the upper bounds of service coverage and the trade-offs involved in achieving additional spatial access. Each increment reflects the additional expenditure required to access an increased share of
Supermarkets and
Super Stores, including several key metrics:
Average Distance (miles): the mean driving distance (one-way) to all stores within the current threshold.
Incremental Travel Time (min) and Distance (miles): the additional minutes and miles of travel needed based on roundtrip travel, excluding shopping time.
Incremental Cost (USD): the corresponding additional cost in USD, based on BlueLA rental rates (USD 0.2 per minute for Community members) and roundtrip travel.
Stores per Minute and Stores per USD: measures indicating how many additional stores are gained per unit of time or cost.
In comparing increments, we see that initial improvements (e.g., the first 1–5 stores) often require more time and cost but establish a baseline of accessible stores. As coverage increases, smaller increments of additional travel time or cost can substantially boost store access, particularly in scenarios with lighter traffic or at times when stores are fully operational (as previously shown in
Figure 6 above). For example, under low-traffic conditions, accessing 1–5 stores requires around 11 min of roundtrip travel and costs about USD 4.40, not including shopping time. Adding an average of 46 min in-store [
62] brings the total time to approximately 57 min. Because BlueLA charges Community members USD 0.20 per minute with a one-hour minimum rental (i.e., USD 12 for the first hour), grocery shopping at one of the nearest five stores would cost around USD 12. As coverage expands to 25%, travel time increases to about 20 min, and total cost rises to around USD 14 including in-store time. The jump to 50% store access adds only about four more minutes of travel and USD 1.50 in additional cost, yielding higher gains in stores per minute and stores per USD. Similarly, reaching 100% coverage under low-traffic conditions requires about 33 min of travel time, yielding a total of about 79 min and around USD 16 per trip. To shop within 100% coverage of stores under medium traffic would lead to around 92 min and USD 19 per trip. In a high-traffic scenario, this would exceed 100 min total and cost around USD 20 per trip. At this point, the total cost may begin to approach those of alternatives such as taxi, Uber, or grocery delivery, depending on the provider, distance, and type of service. While delivery fees for standard orders can sometimes be relatively low, other factors such as priority delivery, subscription requirements, and additional fees can increase the total cost. These patterns illustrate that although EV carsharing can improve grocery store accessibility, the realized benefits depend on balancing additional travel and rental time with the fixed and variable costs of car use, including in-store shopping durations. At the same time, research on consumer behavior suggests that while measuring up to 100% coverage indicates theoretical maximum potential based on our defined threshold of a 15-mile driving distance, actual shopper satisfaction may plateau after a handful of choices [
35].
From a policy perspective, these findings suggest that EV carsharing systems have the potential to bridge grocery access gaps, particularly during off-peak hours with low traffic congestion and late hours when transportation options are limited, as well as the potential to be suitable for households with limited vehicle ownership. Strategies that reduce travel times, align trips with low-traffic periods, or provide incentives for shorter rentals could help individuals fulfill their grocery shopping needs while managing overall expenses. For example, investing in neighborhood-based carsharing stations and offering targeted incentives (e.g., loyalty programs, short-trip pricing) can reduce mobility costs and encourage efficient system use. Service providers could prioritize station placement in areas with high concentrations of carless or SNAP-receiving households and align rental pricing with typical grocery shopping durations (e.g., 1 to 1.5 h windows). Additionally, SNAP-eligible grocery retailers could expand store locations in or near underserved areas, and carsharing services could coordinate with them to install stations at or near these stores. This could help reduce user costs by eliminating charges while the vehicle is parked during shopping or offering a reduced per-minute rate at designated store locations.
4.3. User Behavior Integration
Having examined the spatial-temporal dimensions of grocery accessibility, we next consider how these potentials align with actual BlueLA usage patterns and user perceptions.
4.3.1. Survey Insights on Perceived Accessibility
Survey responses highlight that grocery shopping is a common trip purpose among active BlueLA members, with 69% of Community users and 61% of Standard users reporting using BlueLA for grocery trips. Additionally, 74% of respondents across both membership types indicated they do not own a car. Meanwhile, 67% used BlueLA for other errands and 62% used the service for social or recreational purposes. Less common uses included healthcare appointments (38%), commuting (22%), accessing public transit (11%), and attending school (5%). When asked why they joined BlueLA, 63% of respondents indicated they did not have a personal vehicle and joined to gain additional mobility. Other motivations included avoiding replacement of an inoperative vehicle (11%), lifestyle changes (7%), the need for an additional vehicle (6%), and parking convenience (4%). Income levels varied significantly between membership types: 74% of Community members reported household incomes under USD 50,000, while 68% of Standard members reported incomes over USD 75,000. Educational attainment was generally high across both groups, with 74% of Standard members and 54% of Community members holding a bachelor’s degree or higher. This may reflect a sampling bias toward more educated individuals, which is common in survey data. The age distribution of respondents included 7% under 25, 31% ages 25 to 34, 28% ages 35 to 44, 18% ages 45 to 54, 12% ages 55 to 64, and 4% age 65 or older.
When asked about perceived changes in grocery access (
Figure 7), approximately 71% of Standard members and 84% of Community members reported some level of improvement. Notably, within those improvements, 30% of Standard and 38% of Community members noted a significant improvement in their grocery access, underscoring the potential role of EV carsharing in enhancing food access, particularly for Community members.
Beyond grocery access, users were asked whether BlueLA improved their ability to travel longer distances, reach destinations faster, gain greater scheduling flexibility, and make late-night trips (
Table 3). Across these dimensions, the majority of Standard and Community members responded positively. For example, approximately 61% of Standard members and 78% of Community members agreed they could travel longer distances, while about 58% of Standard and 83% of Community users perceived faster travel times. Similar patterns emerged for flexibility and late-night travel, with Community users often reporting somewhat higher levels of agreement. Additionally, around 58% of Standard members and 63% of Community members agreed they had greater flexibility in their travel times. However, due to the limited sample size, these differences were not statistically significant. Meanwhile, for late-night trips, approximately 37% of Standard users and 66% of Community users reported that BlueLA enabled them to make such trips—a difference that was statistically significant at the 95% confidence level.
4.3.2. Trip Activity Patterns
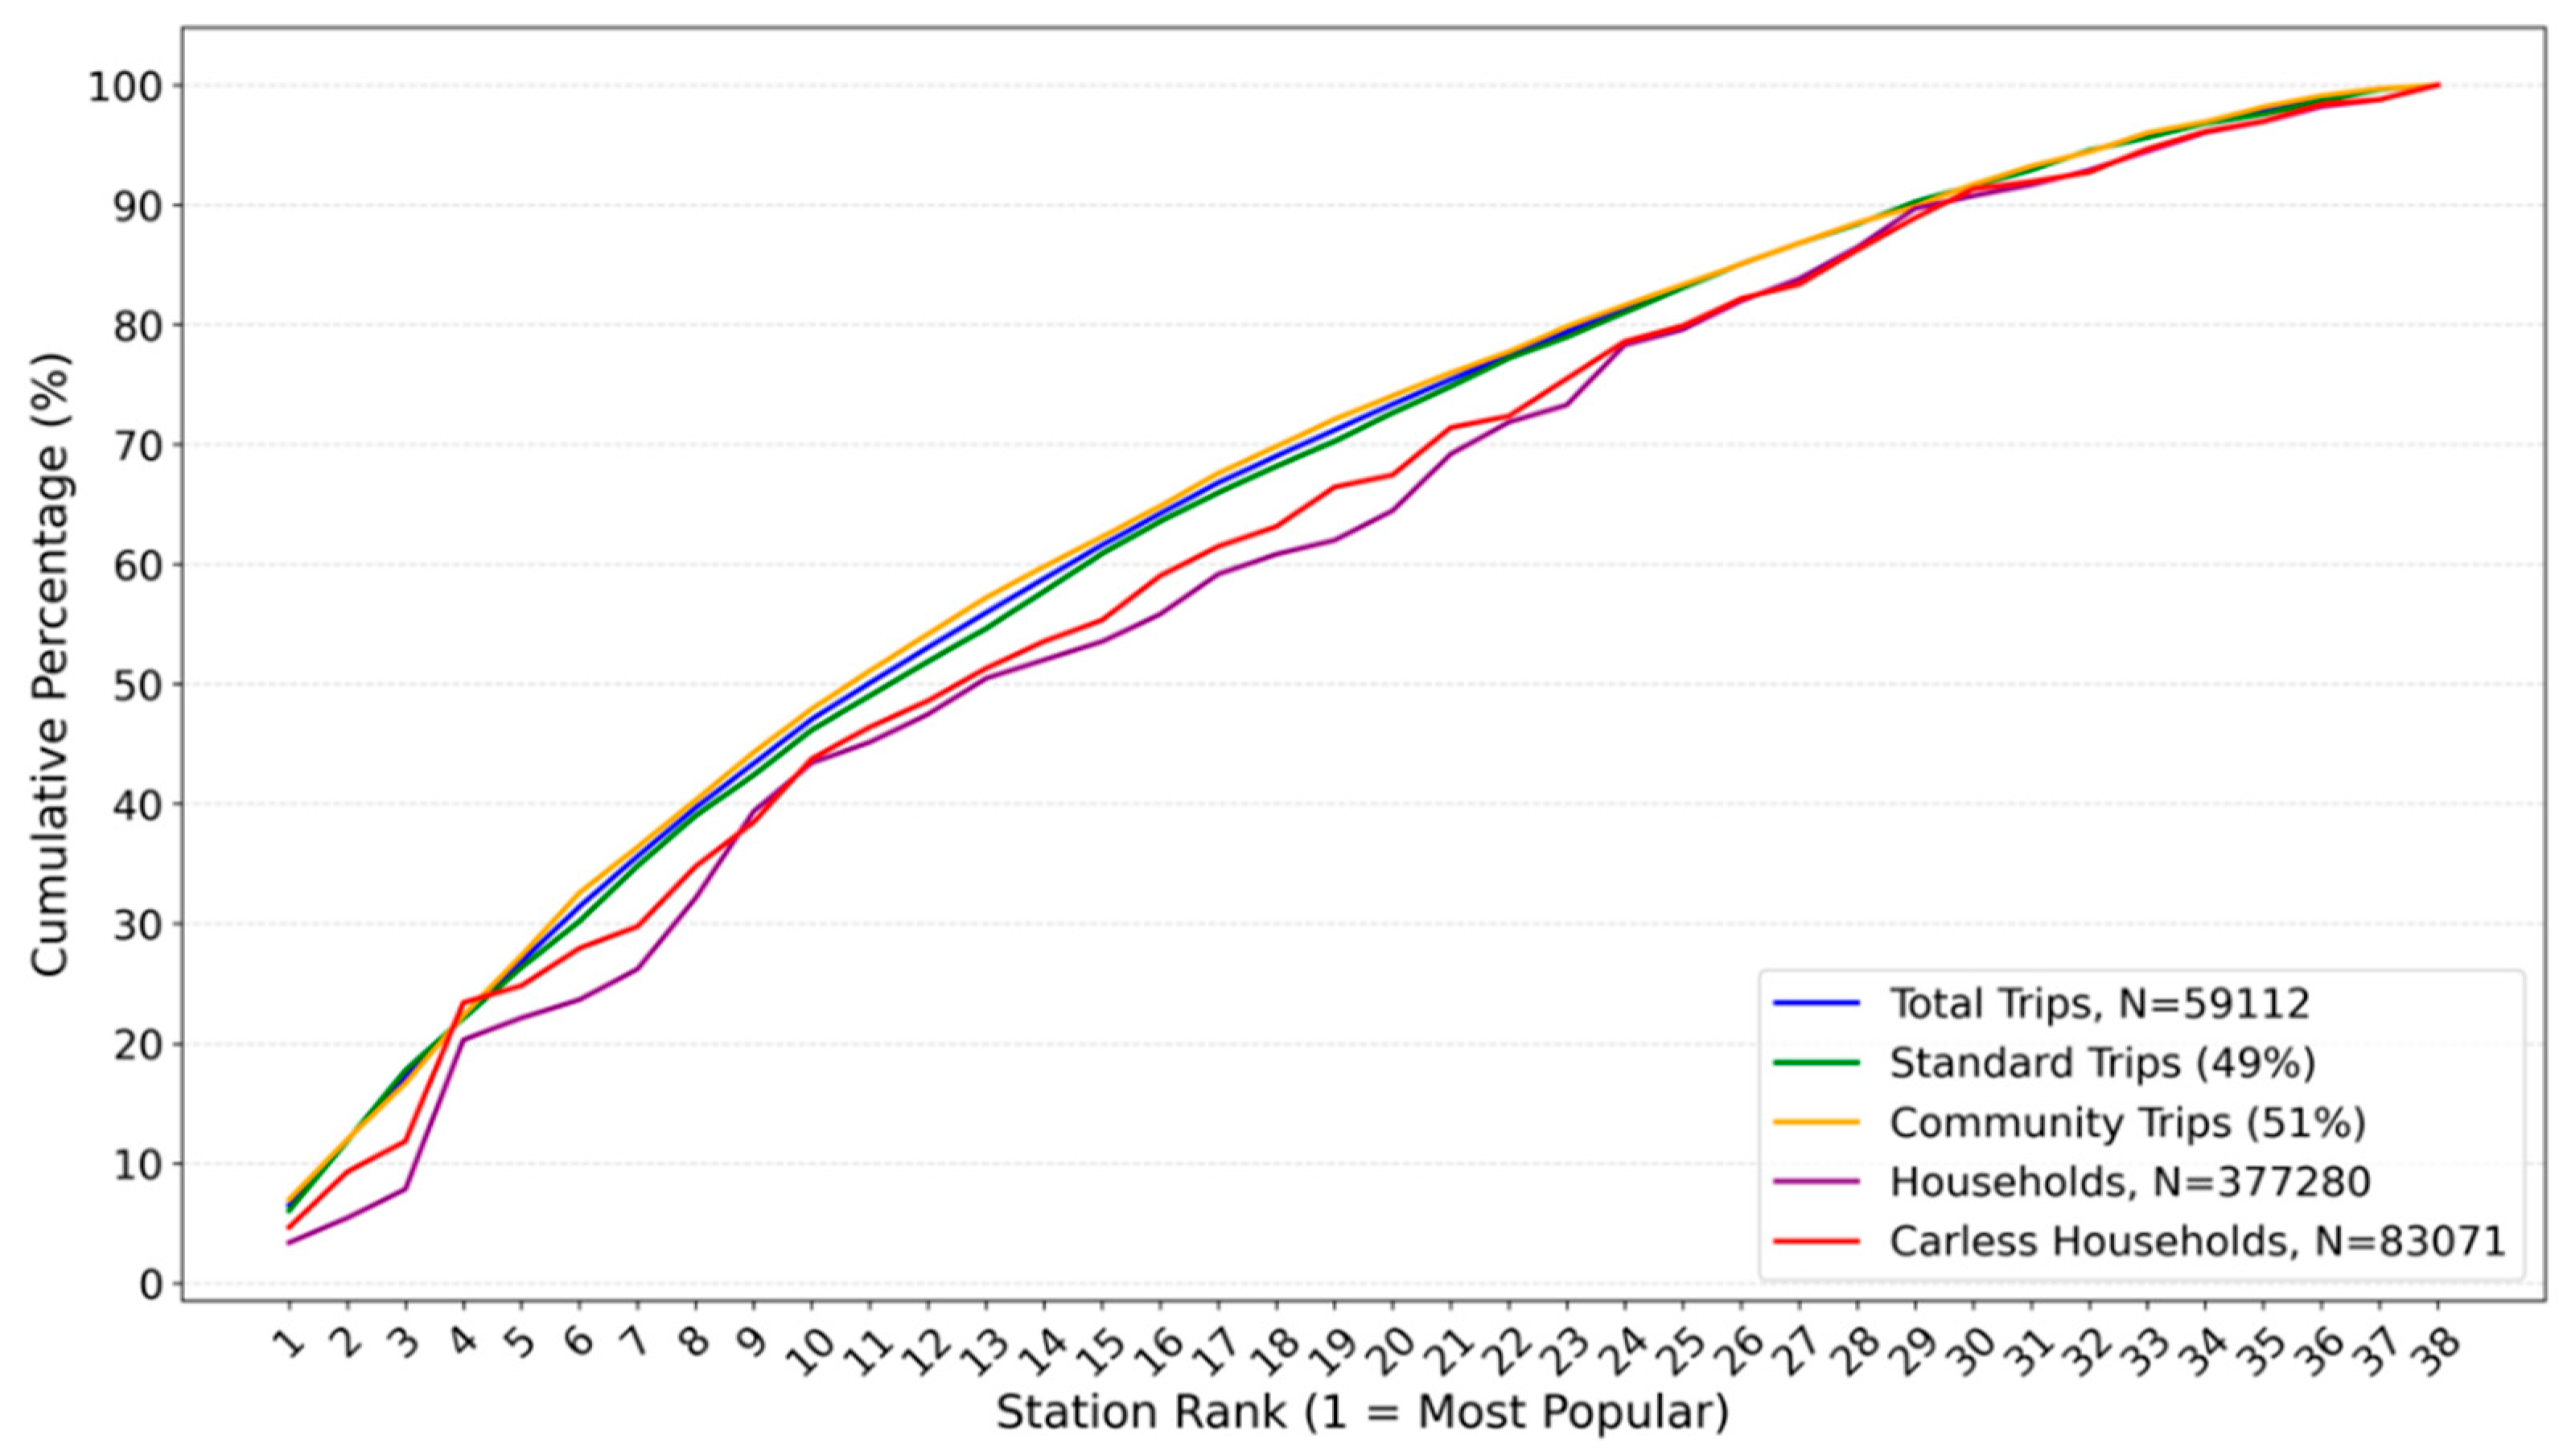
Trip data further contextualize these survey findings. Cumulative trip distributions (
Figure 8) reveal that 11 of the 38 BlueLA stations account for approximately 50% of all recorded trips. At least one of these high-volume stations is within a 30 min walk for 46% of carless households within our defined service area (
Figure 9). Specifically, at least one of these 11 stations is within a 5 min walk for 11% of carless households and within a 10 min walk for 26%.
The correlation between the cumulative share of trips and the cumulative shares of both total and carless households is remarkably strong, with a correlation coefficient of 0.99 significant at the 99% confidence level. This indicates that BlueLA’s actual usage patterns closely track the distribution of households lacking private vehicles, suggesting that the system is reaching communities that could most benefit from improved mobility options. Notably, both Standard and Community members contributed roughly equally to usage rates, and differences in station-level activity by membership type were minor and statistically insignificant.
4.4. Study Limitations
This study acknowledges several limitations that may influence the interpretation and applicability of its findings. First, while the user survey provided valuable insights into station walking thresholds, perceived mobility changes, and grocery shopping behaviors, the sample size was relatively small and subject to potential selection and self-reporting biases. A larger, more stratified sample based on different individual characteristics and preferences could enable modeling variations in walking thresholds across different population groups. Future studies could improve representation by oversampling low-income users in underserved communities or offering increased incentives to encourage participation. Additionally, our user survey and trip data time periods (2021 to 2022) coincided with the ongoing effects of the COVID-19 pandemic and related economic uncertainties, potentially affecting car ownership decisions and travel behaviors.
Second, our analyses rely on scenario-based routing and store-level attributes from third-party APIs, which may contain inaccuracies, temporal fluctuations, and incomplete information on store operations. Also, we only examined travel times by automobile. Future studies could apply similar scenario-based analyses to estimate the travel time and cost to access grocery stores using other transportation modes (e.g., ridehailing, public transit).
Third, we assumed that larger-format stores inherently provide greater product variety than Convenience Stores and Combination Grocery/Other Outlets, based on the literature. Future work could refine this by collecting more detailed data on inventory quality and itemized prices to better capture product availability and affordability.
Fourth, although we accounted for variations in store operating hours, weekday/weekend conditions, and multiple times of day, we did not fully explore differences across individual weekdays or specific weekend days, nor did we assess seasonal variations.
Fifth, because we did not have the data, our analysis did not incorporate users’ home locations, limiting our ability to calculate door-to-door accessibility. Future studies could integrate residential location data to produce more precise estimates of roundtrip travel time and cost, better reflecting the real-world grocery shopping experience.
In addition, while we measured access to different numbers of reachable grocery stores to reflect trade-offs in time, distance, and cost, we did not capture individual decision-making behavior or preferences regarding store choice. Prior research has shown that presenting users with a large number of options can lead to choice overload, particularly in situations involving complex decisions or limited information. Future studies could model these behavioral effects by incorporating measures of consumer preference, perceived effort, or satisfaction with store choices.
Finally, focusing on a single, one-way EV carsharing model in a specific urban setting may limit the transferability of our results to other carsharing models (e.g., roundtrip or free-floating) or geographic contexts.
Future studies could address these challenges through longitudinal research encompassing more diverse timeframes and conditions. Incorporating qualitative methods (e.g., interviews, focus groups) or discrete choice modeling could capture behavioral factors and motivations for carsharing adoption, while exploring additional carsharing models and regions could validate and refine our findings. Future work could also examine the potential of alternative policy interventions—such as providing eligible households with flexible transportation cards usable across transit, ridehailing, carsharing, or bikeshare platforms—as a means to support mobility and access. Despite these limitations, this study provides a mixed-methods framework and empirical evidence that highlights the potential of EV carsharing to enhance grocery store access for underserved populations.
5. Conclusions
This study examines the potential of one-way EV carsharing, as exemplified by the BlueLA program, to improve access to grocery stores in underserved communities. The service, which offers a tiered pricing structure including Standard and discounted Community memberships, aims to reduce emissions, enhance mobility, and ensure affordability for lower-income users who often face disproportionate exposure to transportation-related pollutants, limited mobility options, a need to travel outside of regular work hours, and restricted access to nutritious and affordable groceries. We hypothesized that BlueLA has the potential to improve grocery access for underserved households by expanding their reach to diverse store types. We tested two hypotheses: (1) spatial-temporal accessibility from BlueLA stations to grocery stores varies by store type, traffic conditions, and trip departure times; and (2) Standard and Community members differ in their perceived grocery access and station usage patterns. To test these hypotheses, we integrated spatial-temporal analyses, enriched SNAP store data, BlueLA trip activity data, and a user survey to evaluate both the potential and realized benefits of EV carsharing in improving access to grocery stores.
Survey findings confirmed that grocery shopping was a prevalent trip purpose for both Community (69%) and Standard (61%) members using BlueLA. Moreover, 84% of Community members and 71% of Standard members reported at least some improvement in grocery access. When asked about specific mobility benefits, Community members consistently reported higher agreement than Standard members across several dimensions, including the ability to travel longer distances, reach destinations faster, and gain greater scheduling flexibility; however, these differences were not statistically significant. The only statistically significant difference was observed in the ability to make late-night trips, with 66% of Community members and 37% of Standard members indicating that BlueLA enabled them to do so. We also found that proximity to BlueLA stations disproportionately benefited carless and SNAP-receiving households, with 26% of these underserved populations within a 5 min walk and 62% within a 10 min walk of at least one BlueLA station. Trip activity data showed that 11 BlueLA stations accounted for 50% of all trips using the service, and at least one of these high-volume stations is within a 30 min walk to 46% of carless households within our defined service area. Specifically, at least one of these 11 stations is within a 5 min walk for 11% of carless households and within a 10 min walk for 26%. However, differences in station-level activity among Standard and Community members were minor and statistically insignificant.
Our analysis revealed that while Convenience Stores and smaller outlets tend to be more accessible, Supermarkets and Super Stores require longer travel times and additional costs, particularly as access expands beyond a small number of nearby stores. Under low-traffic conditions, accessing just 1–5 stores takes around 11 min of roundtrip travel before accounting for in-store shopping time. Including an average in-store shopping duration of 46 min and because BlueLA charges Community members USD 0.20 per minute with a one-hour minimum rental (i.e., USD 12 for the first hour), grocery shopping at one of the nearest five stores would cost around USD 12. Under the same conditions, reaching 25% of available stores takes about 20 min of roundtrip travel by car. Pushing to 50% coverage adds about four more minutes, yielding access gains of around 33 stores per minute. Including the shopping duration, a trip under these conditions could total around 70 min and cost about USD 14 for Community members—an amount that increases to 79 to 100 min and USD 16 to USD 20 as coverage extends to 100% or as traffic intensifies. At this point, trip costs may begin to approach those of alternatives such as taxi, Uber, or grocery delivery, depending on the provider, distance, and type of service. While delivery fees for standard orders can sometimes be relatively low, other factors such as priority delivery, subscription requirements, and additional fees can increase the total cost. Carsharing, in contrast, tends to remain more cost-stable over longer distances. Importantly, all such services—including carsharing, ridehailing, and delivery—continue to present access barriers for underserved populations, particularly those without smartphones, credit cards, or bank accounts. Moreover, the timing of trips is important given store operating hours: nearly all store types reach near-100% operational capacity between 10 AM and 6 PM, ensuring full access to diverse options during these peak daytime hours. In contrast, reduced evening and late-night availability may force some households to rely on less desirable options (e.g., Convenience Stores), potentially limiting product variety. These findings underscore the importance of users optimizing accessibility by aligning grocery trips with lower congestion periods (i.e., off-peak travel windows) and the importance of service providers potentially offering targeted incentives (e.g., discounted short-term rentals for periods less than three hours or loyalty programs) during these periods to help households manage overall expenses. Such strategies can make EV carsharing more cost-effective and appealing, enabling underserved communities to access healthier, more diverse grocery options without incurring excessive travel and rental costs.
BlueLA’s tiered pricing model serves as an example of how targeted affordability measures can support equity by reducing cost barriers for low-income users. By subsidizing EV access, carsharing services can offer underserved households an alternative to car ownership to fulfill essential trips like grocery shopping while achieving environmental sustainability goals. Although the specific findings from the Los Angeles case presented here may not be generalizable, the methodological framework presented provides a foundation for future studies seeking to more realistically measure grocery store access. Some findings may be transferable to other carsharing systems, particularly those operating in dense urban areas with tiered pricing structures aimed at improving social equity. These include the time and cost trade-offs of accessing different store types, the benefits of locating carsharing infrastructure near populations with low vehicle ownership, and the value of aligning trip timing with congestion and store availability.
Future research could expand on these findings by examining other carsharing models (e.g., roundtrip, free-floating) and incorporating more granular cost and inventory data, such as itemized prices and store-specific food quality metrics, to expand upon this paper’s understanding of affordability and nutritional choices. In addition, exploring the potential of targeted transportation subsidies—such as multimodal transport cards usable across transit, taxis, carshare, bikeshare, or ridehailing services—could offer flexible support for low-income households navigating complex mobility and access challenges. These approaches can help develop more robust strategies for aligning EV carsharing services with the needs of underserved populations and broader sustainability goals.
Author Contributions
The authors confirm contribution to the paper as follows: study conception and design: Z.Y., E.D., E.W.M., and S.A.S.; funding acquisition: S.A.S.; data collection: Z.Y., E.W.M., and S.A.S.; analysis and interpretation of results: Z.Y., E.D., E.W.M., and S.A.S.; draft manuscript preparation: Z.Y., E.D., E.W.M., and S.A.S. All authors have read and agreed to the published version of the manuscript.
Funding
This research was funded by the California Air Resources Board under CARB Agreement No. 19MSC006.
Data Availability Statement
The data used in this study are not publicly available due to IRB-related restrictions. Additionally, the trip activity data employed in this research were provided to researchers by the operator under the understanding of business confidentiality. The authors must adhere to these privacy and confidentiality considerations in place.
Acknowledgments
This study is supported by the California Air Resources Board (CARB) under the Clean Mobility Options Pilot Program and South Los Angeles Universal Basic Mobility Pilot Program. Please note that this article is based in part on research conducted on behalf of the CARB. Shaheen is a member of CARB’s Board. The research contract was executed before she was appointed to the CARB Board. Shaheen conducted a substantial portion of this research prior to her appointment. After joining the Board, Shaheen no longer serves as the Principal Investigator for this effort. She continued her contributions to this study without compensation, as Ziad Yassine’s doctoral advisor. We are grateful to BlueLA powered by Blink Mobility for their provision of the crucial data necessary for this research. Our appreciation extends to our research team for their diligent efforts in research design, data collection, and analysis, as well as our survey participants for their valuable input. While the views expressed in this paper are those of the authors, the contributions of all parties involved in this research are deeply valued.
Conflicts of Interest
The authors declare no conflicts of interest.
References
- Bullard, R.D. Addressing urban transportation equity in the United States. Fordham Urban Law J. 2003, 31, 1183. [Google Scholar]
- Deakin, E. Equity and Environmental Justice in Sustainable Transportation: Toward a Research Agenda; University of California Transportation Center: Berkeley, CA, USA, 2007. [Google Scholar]
- Sheller, M. Theorizing mobility justice in contexts of climate mobilities. In Handbook on Forced Migration; Edward Elgar Publishing: Cheltenham, UK, 2023; pp. 227–233. [Google Scholar]
- Ver Ploeg, M.; Breneman, V.; Farrigan, T.; Hamrick, K.; Hopkins, D.; Lin, B.-H.; Nord, M.; Smith, T.A.; Williams, R.; Kinnison, K.; et al. Access to Affordable and Nutritious Food: Measuring and Understanding Food Deserts and Their Consequences: Report to Congress; Diane Publishing: Collingdale, PA, USA, 2009. [Google Scholar]
- Bauer, L.; East, C.; Howard, O. Low-Income Workers Experience—By Far—The Most Earnings and Work Hours Instability; Brookings: Washington, DC, USA, 2025; Available online: https://www.brookings.edu/articles/low-income-workers-experience-by-far-the-most-earnings-and-work-hours-instability/ (accessed on 15 January 2025).
- Los Angeles County Department of Public Health. Food Insecurity in Los Angeles County: Before and During the COVID-19 Pandemic; Los Angeles County Department of Public Health: Los Angeles, CA, USA, 2021. [Google Scholar]
- Cohen, B.E.; Andrews, M.; Kantor, L.S. Community Food Security Assessment Toolkit; US Department of Agriculture, Economic Research Service: Washington, DC, USA, 2002; pp. 2–13.
- Niedzielski, M.A. Grocery store accessibility: Different metrics–Different modal disparity results and spatial patterns. J. Transp. Geogr. 2021, 96, 103160. [Google Scholar] [CrossRef]
- Shaheen, S.A.; Pan, A. Behavioral and sociodemographic impacts of carsharing. In Handbook of Travel Behaviour; Edward Elgar Publishing: Cheltenham, UK, 2024; pp. 339–363. [Google Scholar]
- California Air Resources Board. South Los Angeles Universal Basic Mobility Pilot Program; STEP-IG-02; Los Angeles Department of Transportation: Los Angeles, CA, USA, 2021. [Google Scholar]
- Shaheen, S.A.; Sperling, D.; Wagner, C. A Short History of Carsharing in the 90’s; UC Davis Institute of Transportation Studies: Davis, CA, USA, 1999. [Google Scholar]
- Shaheen, S.; Cohen, A.; Randolph, M.; Farrar, E.; Davis, R.; Nichols, A. Shared Mobility Policy Playbook; Transportation Sustainability Research Center: Berkeley, CA, USA, 2019. [Google Scholar]
- Cervero, R.; Tsai, Y. City CarShare in San Francisco, California: Second-year travel demand and car ownership impacts. Transp. Res. Rec. 2004, 1887, 117–127. [Google Scholar] [CrossRef]
- Cervero, R.; Golub, A.; Nee, B. City CarShare: Longer-term travel demand and car ownership impacts. Transp. Res. Rec. 2007, 1992, 70–80. [Google Scholar] [CrossRef]
- Lane, C. PhillyCarShare: First-year social and mobility impacts of carsharing in Philadelphia, Pennsylvania. Transp. Res. Rec. 2005, 1927, 158–166. [Google Scholar] [CrossRef]
- Martin, E.; Shaheen, S. Impacts of Car2go on Vehicle Ownership, Modal Shift, Vehicle Miles Traveled, and Greenhouse Gas Emissions: An Analysis of Five North American Cities; Transportation Sustainability Research Center: Berkeley, CA, USA, 2016. [Google Scholar]
- Firnkorn, J.; Müller, M. What will be the environmental effects of new free-floating car-sharing systems? The case of car2go in Ulm. Ecol. Econ. 2011, 70, 1519–1528. [Google Scholar] [CrossRef]
- Martin, E.; Shaheen, S.A.; Lidicker, J. Impact of carsharing on household vehicle holdings: Results from North American shared-use vehicle survey. Transp. Res. Rec. 2010, 2143, 150–158. [Google Scholar] [CrossRef]
- Martin, E.W.; Shaheen, S.A. Greenhouse gas emission impacts of carsharing in North America. IEEE Trans. Intell. Transp. Syst. 2011, 12, 1074–1086. [Google Scholar] [CrossRef]
- Martin, E.; Stocker, A.; Nichols, A.; Shaheen, S. Roundtrip Carsharing in New York City: An Evaluation of a Pilot Program and System Impacts; Transportation Sustainability Research Center: Berkeley, CA, USA, 2021. [Google Scholar]
- Namazu, M.; Dowlatabadi, H. Characterizing the GHG emission impacts of carsharing: A case of Vancouver. Environ. Res. Lett. 2015, 10, 124017. [Google Scholar] [CrossRef]
- Yassine, Z.; Martin, E.W.; Shaheen, S.A. Can Electric Vehicle Carsharing Bridge the Green Divide? A Study of BlueLA’s Environmental Impacts among Underserved Communities and the Broader Population. Energies 2024, 17, 356. [Google Scholar] [CrossRef]
- Ver Ploeg, M.; Larimore, E.; Wilde, P.E. The influence of food store access on grocery shopping and food spending. Economic Information Bulletin 180; U.S. Department of Agriculture, Economic Research Service: Washington, DC, USA, 2017. [CrossRef]
- Kostopoulou, E.; Christofa, E.; Gonzales, E.; Krevat, D. Measuring and modeling food accessibility by transportation mode. J. Transp. Geogr. 2024, 118, 103907. [Google Scholar] [CrossRef]
- Inagami, S.; Cohen, D.A.; Finch, B.K.; Asch, S.M. You are where you shop: Grocery store locations, weight, and neighborhoods. Am. J. Prev. Med. 2006, 31, 10–17. [Google Scholar] [CrossRef] [PubMed]
- Kerr, J.; Frank, L.; Sallis, J.F.; Saelens, B.; Glanz, K.; Chapman, J. Predictors of trips to food destinations. Int. J. Behav. Nutr. Phys. Act. 2012, 9, 58. [Google Scholar] [CrossRef] [PubMed]
- Jiao, J.; Moudon, A.V.; Drewnowski, A. Grocery shopping: How individuals and built environments influence choice of travel mode. Transp. Res. Rec. 2011, 2230, 85–95. [Google Scholar] [CrossRef]
- Li, J.; Kim, C. Exploring relationships of grocery shopping patterns and healthy food accessibility in residential neighborhoods and activity space. Appl. Geogr. 2020, 116, 102169. [Google Scholar] [CrossRef]
- Yoo, S.; Baranowski, T.; Missaghian, M.; Baranowski, J.; Cullen, K.; Fisher, J.O.; Watson, K.; Zakeri, I.F.; Nicklas, T. Food-purchasing patterns for home: A grocery store-intercept survey. Public Health Nutr. 2006, 9, 384–393. [Google Scholar] [CrossRef]
- Ma, X.; Liese, A.D.; Hibbert, J.; Bell, B.A.; Wilcox, S.; Sharpe, P.A. The association between food security and store-specific and overall food shopping behaviors. J. Acad. Nutr. Diet. 2017, 117, 1931–1940. [Google Scholar] [CrossRef]
- US Bureau of Labor Statistics. Job Flexibilities and Work Schedules—2017–2018 Data from the American Time Use Survey [Press release]. 2019. Available online: https://www.bls.gov/news.release/pdf/flex2.pdf (accessed on 15 January 2025).
- Miller, E.J. Accessibility: Measurement and application in transportation planning. Transp. Rev. 2018, 38, 551–555. [Google Scholar] [CrossRef]
- Hansen, W.G. How accessibility shapes land use. J. Am. Inst. Plan. 1959, 25, 73–76. [Google Scholar] [CrossRef]
- Chernev, A.; Böckenholt, U.; Goodman, J. Corrigendum to “Choice overload: A conceptual review and meta-analysis” [J Consum Psychol 22 (2015) 333–358]. J. Consum. Psychol. 2016, 26, 312. [Google Scholar] [CrossRef]
- Iyengar, S.S.; Lepper, M.R. When choice is demotivating: Can one desire too much of a good thing? J. Personal. Soc. Psychol. 2000, 79, 995. [Google Scholar] [CrossRef] [PubMed]
- Schwartz, B. The paradox of choice. In Positive Psychology in Practice: Promoting Human Flourishing in Work, Health, Education, and Everyday Life; John Wiley & Sons: Hoboken, NJ, USA, 2015; pp. 121–138. [Google Scholar]
- Cartenì, A.; Cascetta, E.; de Luca, S. A random utility model for park & carsharing services and the pure preference for electric vehicles. Transp. Policy 2016, 48, 49–59. [Google Scholar]
- Martin, E.; Pan, A.; Shaheen, S. An Evaluation of Free- Floating Carsharing in Oakland, California; Transportation Sustainability Research Center: Berkeley, CA, USA, 2020. [Google Scholar]
- Prieto, M.; Baltas, G.; Stan, V. Car sharing adoption intention in urban areas: What are the key sociodemographic drivers? Transp. Res. Part A Policy Pract. 2017, 101, 218–227. [Google Scholar] [CrossRef]
- Wappelhorst, S.; Sauer, M.; Hinkeldein, D.; Bocherding, A.; Glaß, T. Potential of electric carsharing in urban and rural areas. Transp. Res. Procedia 2014, 4, 374–386. [Google Scholar] [CrossRef]
- Burkhardt, J.E.; Millard-Ball, A. Who is attracted to carsharing? Transp. Res. Rec. 2006, 1986, 98–105. [Google Scholar] [CrossRef]
- Burghard, U.; Dütschke, E. Who wants shared mobility? Lessons from early adopters and mainstream drivers on electric carsharing in Germany. Transp. Res. Part D Transp. Environ. 2019, 71, 96–109. [Google Scholar] [CrossRef]
- Pan, A.Q.; Martin, E.W.; Shaheen, S.A. Is access enough? A spatial and demographic analysis of one-way carsharing policies and practice. Transp. Policy 2022, 127, 103–115. [Google Scholar] [CrossRef]
- Blomqvist, A. Transforming Transportation: Community Perspectives on e-Mobility—Autonomous Vehicles, Electric Vehicles & Shared Mobility; EVNoire: Atlanta, GA, USA, 2022. [Google Scholar]
- Paul, J.; Pinski, M.; Brozen, M.; Blumenberg, E. Can Subsidized Carshare Programs Enhance Access for Low-Income Travelers? A Case Study of BlueLA in Los Angeles. J. Am. Plan. Assoc. 2024, 90, 537–550. [Google Scholar] [CrossRef]
- Yassine, Z.; Martin, E.W.; Shaheen, S.A. Is electric vehicle carsharing for everyone? From activity patterns to user retention. Transp. Res. Part D Transp. Environ. 2025, 139, 104544. [Google Scholar] [CrossRef]
- Sprei, F.; Habibi, S.; Englund, C.; Pettersson, S.; Voronov, A.; Wedlin, J. Free-floating car-sharing electrification and mode displacement: Travel time and usage patterns from 12 cities in Europe and the United States. Transp. Res. Part D Transp. Environ. 2019, 71, 127–140. [Google Scholar] [CrossRef]
- Hu, S.; Chen, P.; Lin, H.; Xie, C.; Chen, X. Promoting carsharing attractiveness and efficiency: An exploratory analysis. Transp. Res. Part D Transp. Environ. 2018, 65, 229–243. [Google Scholar] [CrossRef]
- Rodier, C.; Harold, B.; Zhang, Y. Early Results from an Electric Vehicle Carsharing Service in Rural Disadvantaged Communities in the San Joaquin Valley; University of California Institute of Transportation Studies: Berkeley, CA, USA, 2021. [Google Scholar]
- Envoy Technologies Inc. Update: Envoy Technologies Inc. Intends on Remaining Open to Support Our Communities During the Coronavirus/COVID-19 Crisis; Envoy Technologies Inc.: Culver City, CA, USA, 2020. [Google Scholar]
- Espino, J.; Truong, V. Electric Carsharing in Underserved Communities; The Greenlining Institute: Berkeley, CA, USA, 2015. [Google Scholar]
- Deakin, E. Transportation, Land Use, and Environmental Planning; Elsevier: Amsterdam, The Netherlands, 2019. [Google Scholar]
- Su, J.G.; Jerrett, M.; Morello-Frosch, R.; Jesdale, B.M.; Kyle, A.D. Inequalities in cumulative environmental burdens among three urbanized counties in California. Environ. Int. 2012, 40, 79–87. [Google Scholar] [CrossRef] [PubMed]
- Shaheen, S.; Farrar, E. Vehicle Electrification in Carsharing and Transportation Network Company (TNC) Fleets: Current and Future Trends. In Electric Vehicles in Shared Fleets: Mobility Management, Business Models, and Decision Support Systems; World Scientific: Singapore, 2022; pp. 5–29. [Google Scholar]
- California Air Resources Board. California’s Clean Vehicle Rebate Program Will Transition to Helping Low-Income Residents. 2023. Available online: https://ww2.arb.ca.gov/news/californias-clean-vehicle-rebate-program-will-transition-helping-low-income-residents (accessed on 14 February 2024).
- Yusuf, Y.; Brozen, M.; Blumenberg, E. Electric Carsharing Models for Low-Income Households in California; UCLA, The Ralph and Goldy Lewis Center for Regional Policy Studies: Los Angeles, CA, USA, 2022. [Google Scholar]
- Rodier, C.; Randall, C.; Garcia Sanchez, J.C.; Harrison, M.; Francisco, J.; Tovar, A. Challenges and Opportunities for Publicly Funded Electric Vehicle Carsharing; National Center for Sustainable Transportation: Davis, CA, USA, 2022. [Google Scholar]
- Sener, I.N.; Cline, J.C.; Elgart, Z.; Hansen, T.; Wilson, J.; Viggiano, C.; Blaire, A.; Okunieff, P. Transformational Technologies and Mobility Inclusion Playbook; No. TCRP Project B-47; The National Academies Press: Washington, DC, USA, 2024. [Google Scholar]
- Boisjoly, G.; El-Geneidy, A.M. The insider: A planners’ perspective on accessibility. J. Transp. Geogr. 2017, 64, 33–43. [Google Scholar] [CrossRef]
- Drive Research The State of Grocery Shopping: An Analysis of, 1000, U.S. Grocery Shoppers. 2024. Available online: https://www.driveresearch.com (accessed on 15 January 2025).
- Acosta. Trip Drivers: Top Influencers Driving Shopper Traffic; Acosta Sales & Marketing: Brea, CA, USA, 2017. [Google Scholar]
- Anekwe, T.D.; Zeballos, E. Food-Related Time Use: Changes and Demographic Differences (EIB-213); U.S. Department of Agriculture, Economic Research Service: Washington, DC, USA, 2019.
| Disclaimer/Publisher’s Note: The statements, opinions and data contained in all publications are solely those of the individual author(s) and contributor(s) and not of MDPI and/or the editor(s). MDPI and/or the editor(s) disclaim responsibility for any injury to people or property resulting from any ideas, methods, instructions or products referred to in the content. |
© 2025 by the authors. Licensee MDPI, Basel, Switzerland. This article is an open access article distributed under the terms and conditions of the Creative Commons Attribution (CC BY) license (https://creativecommons.org/licenses/by/4.0/).


