Review

Wireless Sensor Networks for Urban Development: A Study of Applications, Challenges, and Performance Metrics

Department of Computer Science and Engineering, American University of Sharjah, Sharjah P.O. Box 26666, United Arab Emirates
*
Author to whom correspondence should be addressed.
Smart Cities 2025, 8(3), 89; https://doi.org/10.3390/smartcities8030089
Submission received: 26 March 2025 / Revised: 23 May 2025 / Accepted: 23 May 2025 / Published: 28 May 2025

Abstract

Highlights

What are the main findings?
  • Tailored WSN architectures designed for specific urban applications enhance system performance regarding data throughput, accuracy, and execution time. This work evaluates the WSN architectures for the following applications: power grid monitoring, traffic management, healthcare services, waste collection, gas leak detection, water supply tracking, and asset monitoring.
  • The overall performance of these systems largely depends on the design of the network and the roles assigned to sensor nodes. Adaptive architectures help reduce energy usage, minimize processing load, and extend the lifespan of the sensor network.
What are the implications of the main findings?
  • These findings highlight the need for intelligent, application-specific WSN designs to efficiently support complex urban systems and ensure reliable real-time data handling in smart cities.
  • The proposed metric-based evaluation framework offers a valuable reference for developers and policymakers to design resilient, scalable, and energy-efficient WSN solutions across diverse urban infrastructure domains.

Abstract

Wireless sensor networks (WSNs) have emerged to address unique challenges in urban environments. This survey dives into the challenges faced in urban areas and explores how WSN applications can help overcome these obstacles. The diverse applications of WSNs in urban settings discussed in this paper include gas monitoring, traffic optimization, healthcare, disaster response, and security surveillance. The innovative research is considered in an urban environment, where WSNs such as energy efficiency, throughput, and scalability are deployed. Every application scenario is distinct and examined in details within this paper. In particular, smart cities represent a major domain where WSNs are increasingly integrated to enhance urban living through intelligent infrastructure. This paper emphasizes how WSNs are pivotal in realizing smart cities by enabling real-time data collection, analysis, and communication among interconnected systems. Applications such as smart transportation systems, automated waste management, smart grids, and environmental monitoring are discussed as key components of smart city ecosystems. The synergy between WSNs and smart city technologies highlights the potential to significantly improve the quality of life, resource management, and operational efficiency in modern cities. This survey specifies existing work objectives with results and limitations. The aim is to develop a methodology for evaluating the quality of performance analysis. Various performance metrics are discussed in existing research to determine the influence of real-time applications on energy consumption, network lifetime, end-to-end delay, efficiency, routing overhead, throughput, computation cost, computational overhead, reliability, loss rate, and execution time. The observed outcomes are that the proposed method achieves a higher 16% accuracy, 36% network lifetime, 20% efficiency, and 42% throughput. Additionally, the proposed method obtains 36%, 30%, 46%, 35%, and 32% reduction in energy consumption, computation cost, execution time, error rate, and computational overhead, respectively, compared to conventional methods.

1. Introduction

Wireless sensor networks (WSNs) are crucial in transforming urban cities into smart cities by utilizing sensor nodes to monitor environmental parameters and transmit data to a central sink node. These sensor nodes detect changes in the surroundings, enabling applications such as environmental monitoring, smart infrastructure management, healthcare, and public safety. However, urban deployments face limited energy resources, data security concerns, network scalability, and environmental factors. The focus is on leveraging suitable network architectures and topologies to address these challenges and enhance urban systems, including transportation systems, energy grids, water supply networks, communication networks, waste management systems, and more. The design and implementation of network architectures and topologies within these systems are crucial for addressing various challenges and enhancing their efficiency, resilience, and sustainability.
Figure 1 provides a comprehensive overview of WSNs, highlighting their advantages, diverse applications, key challenges, and performance analysis criteria. It visually summarizes the essential aspects discussed in this survey, offering insights into the effectiveness and limitations of WSNs in real-world scenarios. The motivation behind deploying WSNs in urban areas lies in optimizing data collection, analysis, and decision-making processes to create smarter and more connected urban environments. By strategically integrating sensor nodes, sink nodes, network architectures, and topologies, WSN deployments can effectively overcome the challenges posed by urban environments. This strategic integration helps mitigate signal interference, space limitations, and energy-efficiency issues, ensuring the seamless operation of WSN applications in urban settings.
WSN applications in urban areas are designed to address specific problems faced by urban environments. For example, in environmental monitoring, WSNs can help detect pollution levels, monitor air quality, and manage waste disposal, all of which contribute to a healthier urban environment. In smart infrastructure management, WSNs enable the real-time monitoring of critical infrastructure, such as bridges, roads, and buildings, helping prevent accidents and minimize maintenance costs. Similarly, in healthcare and public safety, WSNs can facilitate remote patient monitoring, emergency response coordination, and surveillance, ensuring timely interventions and improving overall urban safety and well-being. In general, the focus is on deploying WSNs to address challenges and problems in urban areas, ultimately leading to more efficient, sustainable, and livable cities.
Various WSN architectures and topologies are utilized in different applications based on their requirements. Figure 2 shows the different types of network architectures and network topologies in WSN. The mesh topology, for example, stands out for its ability to provide redundant paths for data transmission, ensuring continuous communication even in the presence of node failures. This redundancy improves reliability, making mesh topologies particularly suitable for critical applications such as transportation systems, where uninterrupted communication is essential for dynamic routing management and traffic monitoring. However, managing the numerous connections in a mesh network can introduce complexities in network management and resource allocation, which must be carefully addressed.
The star topology is another network topology that offers centralized communication, simplifying network management by routing all data through a central hub or base station. This architecture is well suited for applications requiring centralized control and monitoring, such as healthcare. For example, a star topology can facilitate efficient data transmission to centralized monitoring stations in remote patient monitoring scenarios, enabling timely intervention and personalized care. However, reliance on a single central hub also introduces a potential single point of failure, necessitating robust backup systems to maintain communication integrity.
In other environmental monitoring applications, such as forest fire detection or pollution monitoring, the grid topology divides the monitoring area into grids or clusters, ensuring comprehensive coverage and redundancy. This approach improves reliability by systematically deploying sensor nodes in the monitoring area. However, the grid topology may require more nodes and infrastructure than other topologies, resulting in increased deployment costs and power consumption. Alternatively, circular topologies with a central sink node can offer efficient data aggregation and transmission, but they may be limited in scalability and coverage range due to the fixed communication radius from the central node. In general, the selection of the network topology and architecture in WSNs is driven by the specific requirements of each application, balancing factors such as reliability, scalability, cost, and power efficiency to optimize performance and functionality.
The reviewed approaches for the specified applications play a significant role in enabling smart urban systems by providing a foundation for reliable, real-time monitoring and data-driven decision-making. In smart cities, where urban infrastructures are highly interconnected and data-intensive, it is essential to identify the adequate architectures and techniques that meet specific application requirements. This leads to responsive public services, improved sustainability, and enhanced quality of life. The improvements in energy consumption, execution time, and computational cost are critical for managing increasing urban population densities, resource limitations, and environmental stress. Furthermore, understanding the strengths and limitations of the existing approaches helps municipal planners and engineers to design more resilient, adaptive, and intelligent systems to meet the evolving needs of smart cities.
This work aims to compare the metrics presented in Table 1 for various applications, including power systems, gully pot monitoring, transportation, disasters, healthcare, gas monitoring, solid waste monitoring, water pipeline monitoring, and commercial asset tracking while using specific WSN sensors and network topologies.
The contributions of this work are as follows:
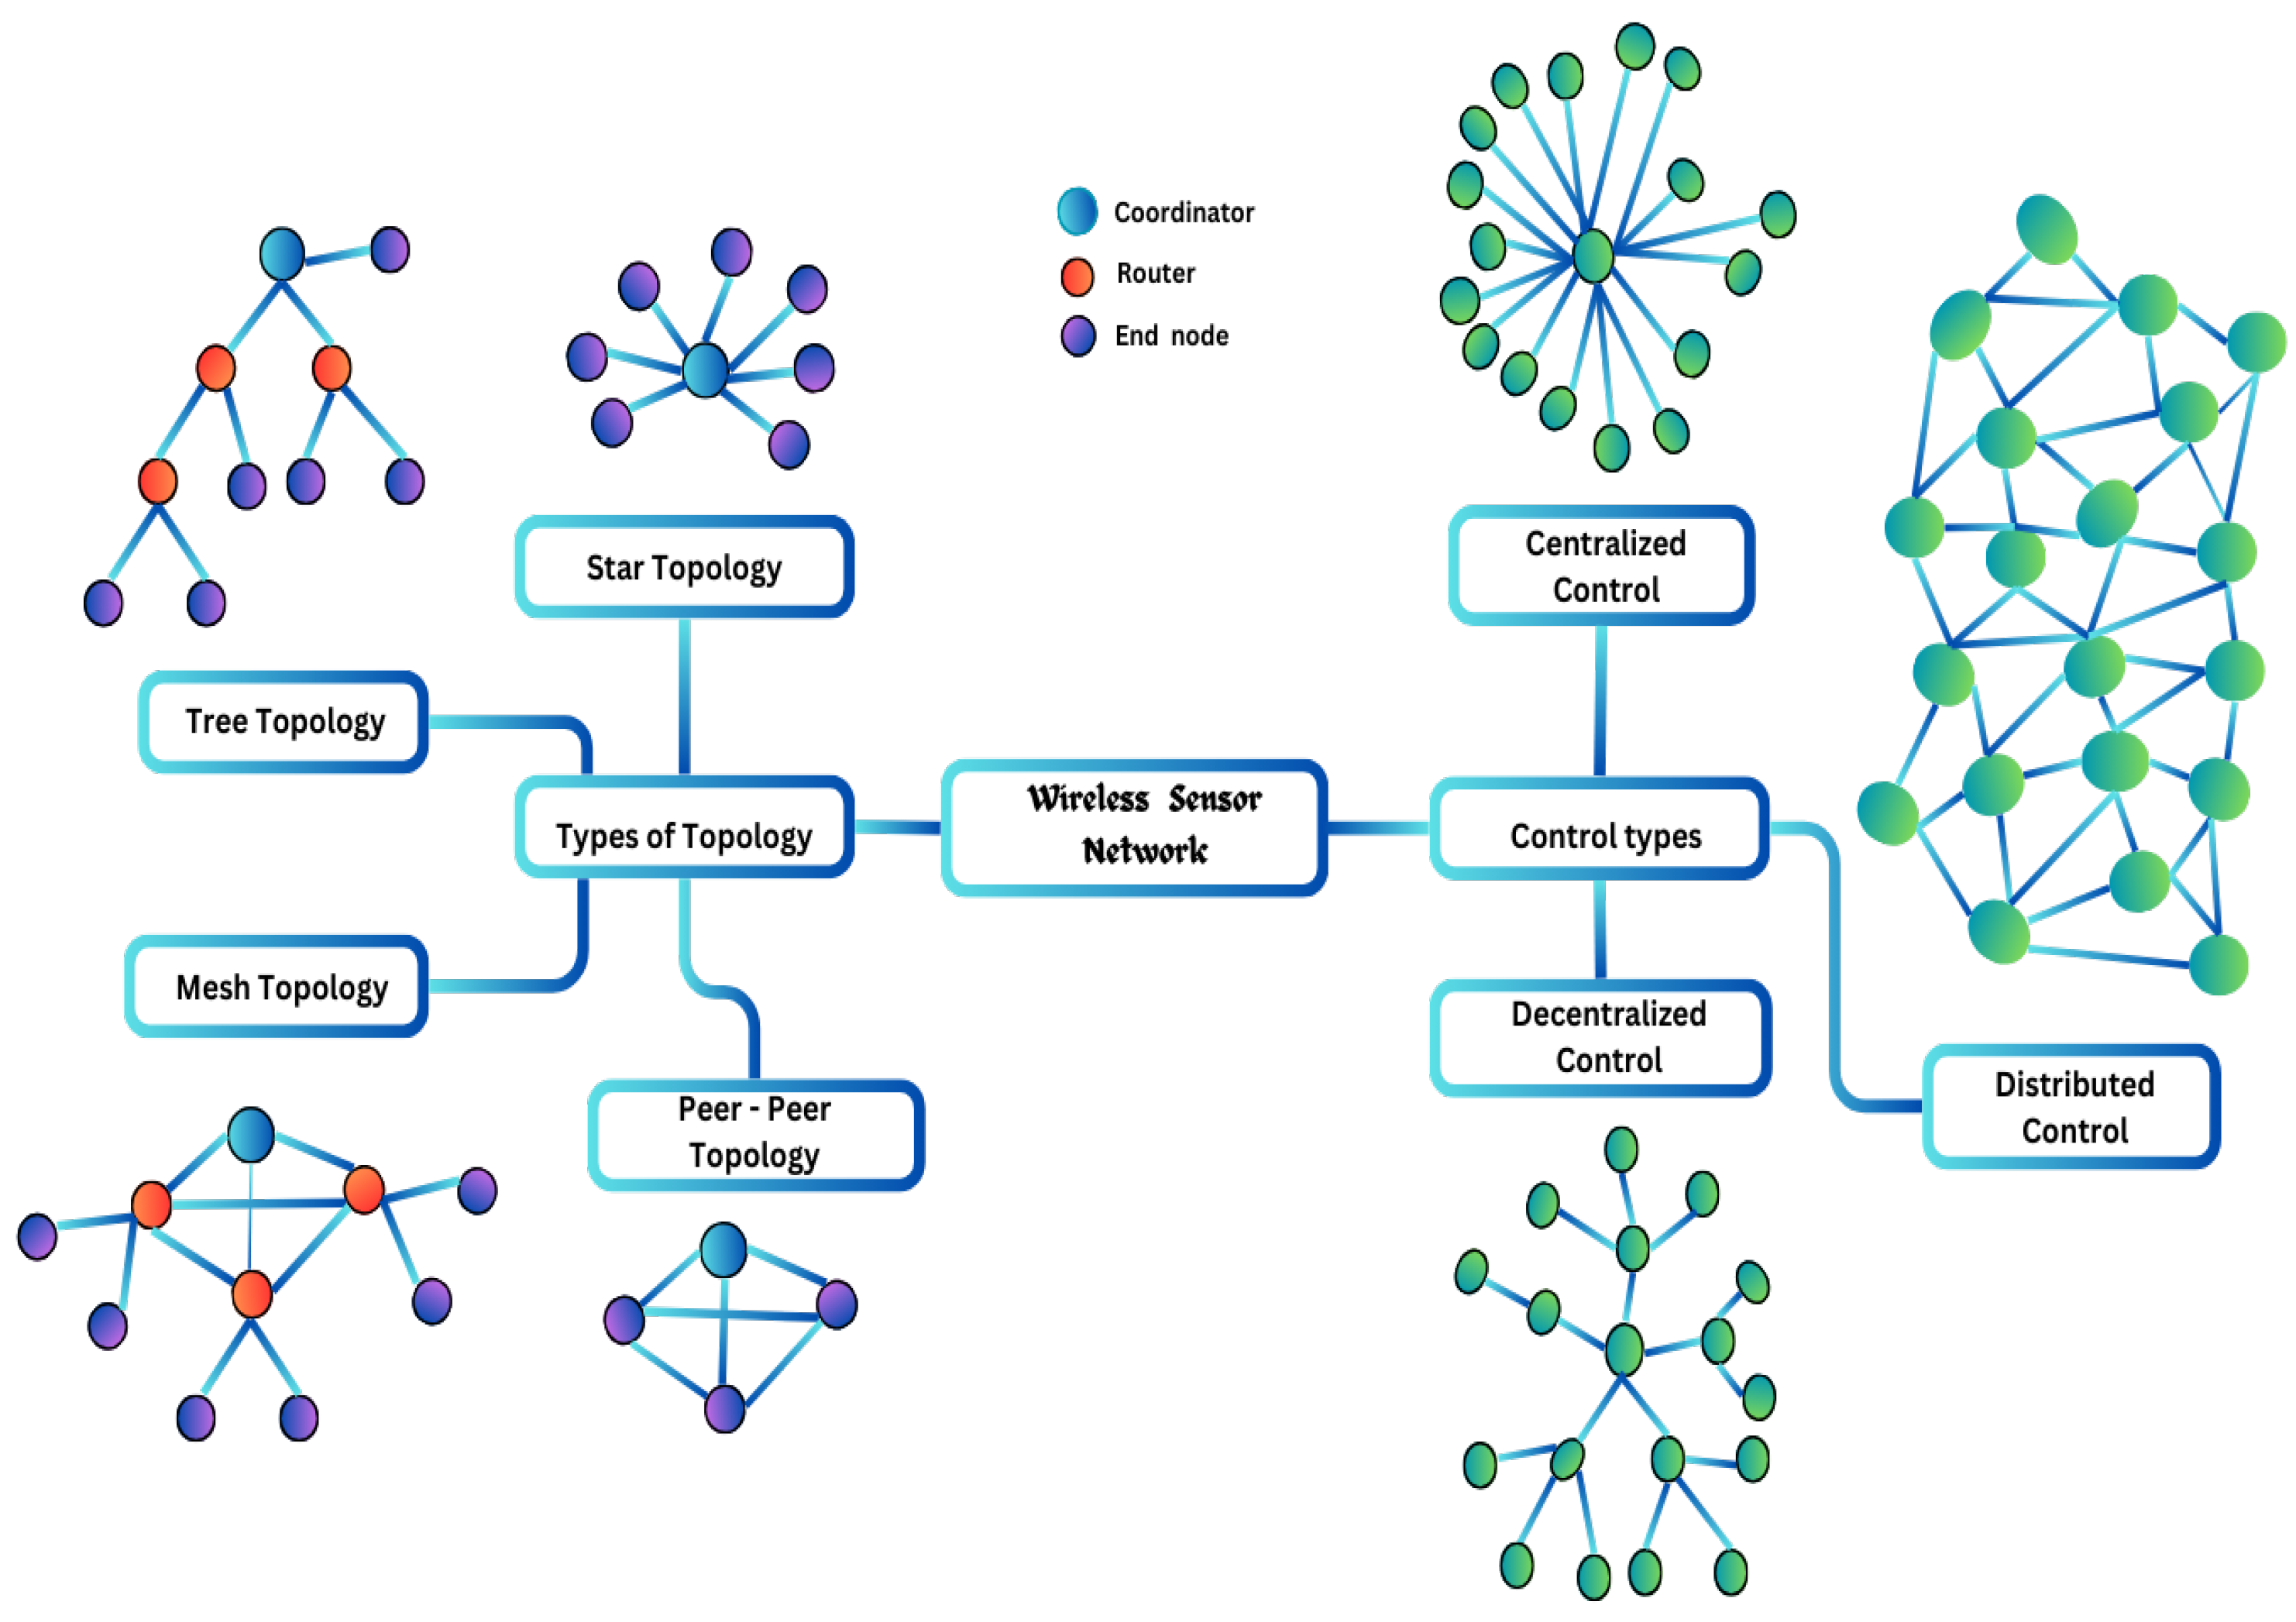
  • Functionalities of sensor and sink nodes within WSN deployments are examined to provide network architecture and communication dynamics.
  • Classifying network types and topologies in WSNs are discussed for design considerations, communication patterns, and scalability in urban settings. The analyses enhance the understanding of how network structures influence application performance and efficiency.
  • Analyze the characteristics and identify the core challenges within the following WSN applications, which include power system monitoring, transportation optimization, healthcare delivery enhancement, solid waste management optimization, continuous surveillance of gas leaks and water distribution systems, and efficient asset tracking and inventory management in commercial sectors.
  • Provide a comprehensive study of the different network topologies considered in the literature when applied to different applications, emphasizing the performance comparison and current limitations.
  • Performance analysis of WSN methodologies in urban applications and different metrics such as energy consumption, accuracy, delay, cost, efficiency, network lifetime, reliability, etc., are conducted. In addition, the most efficient methods are determined, and future research is presented in urban regions.
This paper is organized as follows. Section 1 provides a background on network architectures and topologies. Section 2 discusses the background and different types of sensors, and Section 3 discusses the summary of various methodologies and their attributes. Section 4 provides summaries and conclusions of WSN applications in urban environments. Section 5 illustrates the performance analysis of different metrics that identify the efficient methods. Section 6 discusses the conclusion and future of urban areas.

2. Background

WSN is a large-scale network with numerous sensor nodes deployed within a particular region for sensing, collecting the information, and transmitting it to the base station (BS). WSN nodes observe temperature, health conditions, intrusion detection, fire detection, and military applications. The development of sensor networks is employed in military applications, namely, enemy tracking, soldier surveillance, and battlefield surveillance. WSNs are also utilized in other applications such as wildlife monitoring, habitat monitoring, fire surveillance, etc.
WSNs possess several key characteristics that enhance their functionality and applicability. Energy efficiency is crucial as WSNs are designed to maximize network lifetime while operating with limited power resources. Scalability ensures that these networks can accommodate a large number of sensor nodes, making them suitable for extensive deployments. Mobility allows nodes to move dynamically, optimizing communication efficiency and coverage. Fault tolerance is another essential feature, enabling WSNs to continue functioning even when some nodes fail. Heterogeneity is inherent in WSNs, consisting of diverse sensor nodes with varying capabilities. Additionally, environmental resilience allows WSNs to operate effectively in harsh conditions such as deserts, mountains, and rivers. Ease of use makes these networks simple to deploy, operate, and troubleshoot. Furthermore, low cost ensures affordability, making WSNs accessible for various applications. Lastly, their small size enables discreet and efficient deployment, allowing seamless integration into various environments. These characteristics collectively make WSNs highly adaptable and efficient for real-world applications.
WSNs face several key challenges that impact their performance and efficiency. Node and link heterogeneity arise from the diversity of sensor types and nodes with varying capabilities, making it challenging to ensure seamless network functionality. Limited energy and power are another critical concern as battery-powered sensors operate with constrained energy resources. Power consumption is primarily divided among sensing, communication, and data processing functions, necessitating efficient energy management. Security remains a significant issue as WSNs are vulnerable to attacks such as eavesdropping, jamming, and spoofing, requiring strong protective measures to ensure data confidentiality. Additionally, signal interference from other wireless devices can disrupt communication among sensor nodes, making reliable data transmission challenging. Scalability is also a concern as WSNs must handle a large number of sensor nodes and manage vast amounts of data efficiently. Furthermore, limited bandwidth affects sensor message interactions, making synchronization impractical without frequent message exchanges. Lastly, node deployment is crucial in network performance and topology control. Whether deterministic or arbitrary, proper deployment strategies can significantly reduce complexity and improve efficiency. In a deterministic arrangement, sensors are physically placed with pre-defined data transmission paths, ensuring structured communication. Addressing these challenges is essential for enhancing the reliability and effectiveness of WSNs.
Signal interference in wireless communications is defined as the disturbances interrupting data transmission between nodes, whether legitimate or illegitimate. Signal interference is essential in WSNs and impacts the network’s performance, reliability, and energy efficiency. It is vital to optimize WSN across different applications, namely, environmental monitoring, industrial automation, and healthcare. Once signals from several nodes overlap, the received data are degraded with noise, leading to inaccurate readings and unreliable information. Maximum interference levels lead to network congestion, where nodes struggle to discover available channels to broadcast data for impacting network throughput. Energy is needed to handle interference during retransmissions for the network’s operational lifespan. Interference is a complex routing protocol for choosing the paths to reduce signal interference and guarantee reliable data delivery.
The practical deployment challenges comprise node position and coverage optimization, energy consumption management, environmental factors impacting signal quality, network connectivity problems, complexity in replacing or recharging batteries in remote locations, security vulnerabilities, and deployment scenarios. The network is preserved for sufficient sensing coverage for the monitored area. Due to different laws, policies, and guidelines, regulatory hurdles in WSNs refer to the challenges that arise when implementing, managing, and deploying WSNs. These networks often involve wireless communication technologies that must comply with regulations like spectrum usage, data privacy, safety standards, and network security.
Various techniques have been proposed for monitoring and forecasting environmental factors using IoT-enabled sensors in urban areas. A method presented in Huynh A.D. Nguyen et al. (2024) [1] focuses on the accurate and reliable monitoring and forecasting of air pollution at various scales, integrating data from IoT sensors and state-run air quality monitoring stations. However, the accuracy of the system was not improved. Another approach discussed by Zhao et al. (2024) [2] involves a wireless environmental sensing system developed for monitoring soil moisture dynamics across seven diverse urban green spaces over a year. Despite its utility, the system failed to reduce execution time. A similar wireless sensor network (WSN)-based urban monitoring system was proposed by Mattia et al. (2023) [3] for monitoring the structural health of houses located on hillsides prone to land movement. Unfortunately, energy consumption was not reduced as anticipated.
Remote sensing technology, as outlined by Xu et al. (2024) [4], uses high-resolution urban green space images, applying an image enhancement algorithm to improve the clarity and recognition of these images. However, this approach did not succeed in reducing computational costs. Furthermore, a new framework proposed by Khalifeh et al. (2024) [5] adopts WSNs for remote sensing and monitoring in smart city applications. Despite its promising capabilities, the framework did not address the underlying time complexity issues. A dependable monitoring network designed by Nguyen and Ha (2024) [6] aimed to achieve high availability with energy consumption and data assurance, yet it failed to reduce execution time.
In the realm of cost-effective architecture, the Smart Sensor Surveillance System (4S-UEM) was developed by Bhaskar et al. (2023) [7] for environmental monitoring in urban zones of smart cities. On a similar note, the research by Prakash et al. (2023) [8] presented the status of ocean environment monitoring using WSNs, including the general architecture of WSN-based ocean environment systems. However, it did not succeed in reducing time complexity. Additionally, a smart clustering model combined with trust-based spectrum sensing, introduced by Aldawsari (2025) [9], extends network lifetimes by optimizing energy consumption, but execution time remained unchanged. The study by Shakhov et al. (2022) [10] explored the time of pollution detection as a random variable. However, the study did not account for the cumulative distribution function of air pollution detection time by mobile sensors, which remains a critical consideration in this context. WSNs often operate in harsh or remote environments, making efficient node deployment critical. Optimizing deployment reduces redundancy and cost while enhancing energy efficiency, coverage, and network lifetime. A recent approach uses perceived environmental awareness in [11] to deploy sensor nodes, effectively minimizing blind spots and adapting to various application scenarios.

Different Types of Sensors

A sensor is a device that identifies and captures specific readings when deployed in an environment. A sensor transfers physical phenomena into digital signals that are displayed, read, or processed. Different types of sensors are used in WSN applications. In WSN, several sensor types are considered for environmental monitoring, air and water quality monitoring, smart lighting, traffic management, and healthcare applications.
  • Temperature sensors: These sensors monitor temperature variations, where the variations could trigger certain actions.
  • Humidity sensors: These sensors detect water content in the air, and their application could activate after reaching a predetermined threshold.
  • Wind speed sensors: These are also known as anemometers, employed to compute wind speed in the environment.
  • Rain sensors: These find the presence and intensity of rainfall.
  • Proximity sensors: These are motion sensors that detect the presence of objects and calculate their distance.
  • Pressure sensors: These sensors identify pressure, and their application may alert system administrators to pressure range divergences.
  • Air and water-quality sensors: These sensors observe the integrity of air that is activated by the presence of contaminants.
  • Electrical sensors: These sensors determine the active electrical current in voltage or amperage. This sensor is associated with an alert or preservation ticketing program.
  • Status sensors: These sensors function as simple on–off switches and vary in status based on different stimuli.
  • Motion sensors: These sensors are designed to detect motion, and their application may activate the appropriate tangential action.
  • Optical sensors: These optical sensors are devices that use light, radiation, electric, and magnetic fields to monitor various variables. They are often used in industries such as healthcare.
  • Gas sensors: These determine precise gaseous pollutants, namely, nitrogen dioxide (NO2), carbon monoxide (CO), sulfur dioxide (SO2), ozone (O3), and volatile organic compounds (VOCs).
  • pH sensors: These are vital for assessing water quality, detecting pollution, and safeguarding aquatic ecosystems.
  • Conductivity sensors: These compute the presence of certain gases in the air for finding changes in the heat transfer rate depending on their thermal conductivity.
  • Dissolved oxygen sensors: These estimate the concentration of dissolved oxygen in water.
  • UV sensors: These sensors measure the level of ultraviolet radiation in the atmosphere.
  • Water-quality sensors: These sensors are utilized in ecological organizations to measure the levels of chemicals and ions present in water.
  • Chemical sensors: These sensors can detect the presence of chemicals in water and are often used to monitor air and water quality in urban areas and industrial processes.
  • Smoke sensors: These identify the presence of smoke in the air.
  • Level sensors: These calculate the levels of fluids and other substances in both open and closed systems. While they are commonly used to determine fuel levels, they can also be used to measure the levels of reservoirs.
  • Image sensors: These sensors are used in digital cameras and medical imaging.
  • Vehicle detection sensors: These sensors find the presence of vehicles on the road to estimate changes in electromagnetic fields, reflected light, or sound waves based on the sensor type.
  • Ultrasonic sensors: These determine the presence of vehicles for real-time traffic monitoring.
  • Body temperature sensors: These observe the patient’s temperature for detecting and managing complications.
  • Heart rate sensors: These examine heart rate, assess cardiovascular health, and recognize irregular heartbeats.
  • Blood pressure sensors: These measure patients’ blood pressure.
  • Respiration sensors: These compute breathing activity to monitor respiration in healthcare.
  • Accelerometer sensors: These measure the rate of change in velocity of an object in terms of acceleration. They detect and quantify movement or vibrations in objects along different axes. Accelerometers are used in various applications, such as the aircraft and aviation industries, for stability control.
  • Gyroscope sensors: These sensors measure the rotation or angular velocity rate around one or more axes. They provide information about an object’s orientation in space and can detect changes in direction. Gyroscopes are often used in navigation systems, where they help determine the vehicle’s orientation and movement accurately.

3. Related Works

The related works summarized in the Table 2 present various methodologies applied across multiple domains, including power quality monitoring, transport systems, disaster risk management, healthcare, gas monitoring, solid waste management, and water pipeline monitoring. These methodologies aim to optimize energy consumption, reduce computational cost, improve efficiency, and enhance reliability. Despite achieving significant improvements in specific metrics such as network lifetime, throughput, and delay minimization, most approaches still face limitations, including high complexity, suboptimal reliability, and increased overhead. The monitoring schemes and attributes analyzed provide insights into the diverse parameters considered for performance evaluation. This comprehensive review is crucial to identifying existing gaps and challenges, guiding the development of more efficient and robust solutions for real-time monitoring and decision-making in smart urban environments.
The existing research has focused on solving problems in Wireless Sensor Networks (WSNs) for various applications, including healthcare, disaster management, and transportation. Many conventional methods have been explored for these areas, often using Machine Learning (ML) techniques in urban environments. However, these existing methods have several limitations, such as higher delays, lower accuracy, increased costs, shorter network lifetimes, lower efficiency, and higher energy consumption. To overcome these challenges, this study investigates WSN applications specifically for transport monitoring, traffic optimization, healthcare, disaster response, and security in urban areas. The goal is to improve efficiency, reduce delays, and enhance overall system performance.

4. Applications of WSN in Urban Areas

4.1. Power System Applications

Power systems face numerous challenges in urban areas, such as excessive loads, malfunctions, and the risk of blackouts, leading to significant economic and human losses. The safe and reliable operation of power systems is crucial for maintaining stability and meeting the daily needs of urban populations. Power systems consist of generation, transmission, and distribution components, each requiring continuous monitoring and fault diagnostics to prevent disruptions and ensure uninterrupted power supply. WSNs offer a promising solution by providing real-time monitoring of power grid components, detecting faults, and enabling timely interventions to prevent outages. By deploying sensors across the power grid, WSNs can collect data on voltage levels, current flows, and equipment conditions, allowing operators to identify potential issues and take preventive measures proactively. Additionally, WSNs can facilitate predictive maintenance by analyzing data patterns to predict equipment failures before they occur, thus improving the reliability and resilience of power systems in urban areas. Precautions such as regular maintenance, redundancy in critical components, and cybersecurity measures can further enhance the effectiveness of WSN-based power system monitoring and ensure uninterrupted power supply for urban residents.
R. Raja Singh et al. (2020) [12] introduced an intelligent power quality monitoring method to efficiently collect data on power quality events while minimizing coverage area and analysis time. By utilizing a power meter in a centralized network with a mesh network topology, the methodology aims to address issues such as voltage sags and harmonic resonance modes. The method allows for more targeted monitoring, reducing the resources required for analysis and enhancing the efficiency of power quality monitoring in electrical networks. The proposed method is faster, more economical, more accurate, and easier to operate for many real-time applications.
Sina Shakeri et al. (2022) [13] introduced the harmonic resonance mode analysis approach. The designed approach focused on mitigating susceptibility to voltage sags and harmonic resonance modes in power systems by optimizing the placement of power quality monitors (PQMs) within a decentralized architecture and star network topology. By leveraging RMS voltage and RMS current measurements, the methodology aims to overcome budget limitations by strategically distributing a restricted number of monitors to check for severe conditions effectively. The designed approach ensures efficient monitoring of power quality events through optimizing resource allocation.
Min-gang Tan et al. (2023) [14] discussed an optimal configuration method for power quality monitors (PQMs) with a focus on voltage sag location. By employing light and motion sensors in a decentralized network with a peer-to-peer topology, the methodology utilizes co-connectivity examination-based integer linear programming to achieve optimal placement of PQMs. Additionally, decision trees are utilized to remove PQM deployment in areas with higher costs, ensuring cost-effective and efficient monitoring of power quality events.
H.M.G.C. Branco et al. (2018) [15] presented a multi-objective optimization approach to distributing power quality monitors (PQMs) in the distribution system. By utilizing ammeters and cameras in a centralized network with a tree network topology, the methodology aims to reduce monitoring costs while enhancing load monitoring and reducing voltage sags. The Multi-objective Evolutionary Algorithm with Tables (MEAT) addresses the monitoring issues, leading to improved monitoring redundancy and reliability in power quality monitoring.
Fernando Bambozzi Bottura et al. (2023) [16] proposed a Fault Position Method (FPM) and Harmonic Resonance Modal Analysis (HRMA) that focuses on efficiently allocating PQMs in distribution systems to address issues related to fault location and harmonic resonance modes. By employing Root Mean Square (RMS) voltage and RMS current sensors in a centralized network with a mesh network topology, the methodology utilizes optimization procedures to compute insertion nodes for monitoring power quality disturbances. This approach enhances fault location and mitigation strategies, resulting in improved reliability and efficiency in power quality monitoring.
Table 3 compares various power quality monitoring methods, focusing on their objectives, sensor types, network configurations, results, and limitations. The methods use various sensors in power system applications such as power meters, RMS voltage and current, light and motion sensors, and ammeters and cameras within centralized or decentralized networks employing mesh, star, P2P, or tree topologies. While each method effectively addresses specific aspects such as EC, NL, E, Delay, R, and T. These approaches exhibit certain limitations, such as the cost is not minimized, the LR during monitoring is not reduced, reliability for observability is not increased, and power quality disturbances are not reduced. Despite their varied approaches, optimizing the placement and utilization of PQ monitors remains a common challenge across these methods. The Smartcities 08 00089 i001 in Table 3 shows that the method increases the performance of the particular metric, whereas the blank space indicates that the method does not consider the performance of the particular metric. The summary conclusions of power system applications are listed below.
  • The studies provide cost-effective solutions for power quality monitoring in urban areas, addressing voltage sags, harmonic resonance, and power quality issues.
  • Network topologies optimize power quality monitor deployment, enhancing data collection, resource optimization, redundancy, and cost-effectiveness.
  • Mesh topology is most efficient for its reliability, scalability, and data collection in urban power quality monitoring.
  • Star topology is effective for targeted monitoring and resource optimization, while P2P topology excels in cost-efficiency and observability.
  • Decentralized architectures offer valuable insights into urban power system challenges, improving power quality management and reliability.

4.2. Gully Pot Monitoring

In urban areas, sewer flooding is a major issue caused by factors like heavy rainfall, poor drainage, and blockages. Gully pot monitoring through WSNs provides a proactive solution by placing sensors in gully pots to monitor water levels and detect issues in real time. These data are sent to a central system for prompt action, preventing overflows. Precautions include regular sewer maintenance, improved drainage infrastructure, green solutions like permeable pavements, and public awareness on waste disposal. This approach helps mitigate sewer flooding, enhancing public health and environmental sustainability.
Haoyu Wei et al. (2023) [17] examined the sediment accumulation process in urban drainage systems, focusing on gully pots (GPs), which function to limit pollutant transport during sedimentation. The technical approach involved using a distributed network with Zigbee routing protocol and acoustic sensors to monitor sediment accumulation and composition in GPs. The problem addressed was the inefficient sediment and pollutant transport management in urban drainage systems. The solution proposed involved analyzing sediment organic matter to update occurrence and net accumulation rates, thereby improving sediment management efficiency. Advantages of this approach include enhanced pollutant control, better sediment management, and real-time monitoring capabilities. However, limitations may include the reliance on the accuracy and maintenance of acoustic sensors, potential challenges in network connectivity, and the need for continuous data management and analysis.
In a related study by Haoyu Wei et al. (2021) [18], the EU Water Framework is discussed. The deposited sediments from gully pots are further analyzed to identify their potential contribution. Zigbee routing protocol and acoustic sensors are utilized within a centralized network type. A basal sediment scour deterministic model is introduced to predict sediment behavior at sites, aiding in future rainfall prediction and the determination of sediment sources. This model helps to improve the understanding and management of sediment-related issues in urban drainage systems. The recipients’ actual/targeted ecological status in scheduling gully pot maintenance operations reduces the impacts of increased rainfall intensity/duration on the magnitude of sediment scour.
Demmelash Mengistu et al. (2021) [19] proposed Simultaneous Thermal Analysis (STA), Fourier Transform Infrared (FTIR) spectroscopy, and Parallel Factor Analysis (PARAFAC) methodology for identifying and quantifying Total Water Pollutants (TWPs) in gully pot sediments. Using Zigbee routing protocol within a distributed network type and acoustic sensors, the study analyzes sediment samples from diverse traffic densities without pretreatment. This methodology offers insights into pollutant composition and distribution within gully pot sediments, aiding in effective pollutant management strategies. The designed methodology performs safe disposal of gully pot sediments for environmental pollution management.
Yujie Chen et al. (2017) [20] developed a maintenance policy to address the gully pot maintenance problem for preventative and corrective maintenance actions. Using the Zigbee routing protocol within a distributed network type and acoustic sensors, the study constructs optimized routes for maintenance vehicles, considering factors such as the location and impact of gully pot failure. This methodology helps in optimizing maintenance efforts and minimizing the risk of sewer flooding in urban environments.
Table 4 compares various methodologies for managing sediment-related issues and their objectives, sensor types, network configurations, results, and limitations. Each method utilizes acoustic or temperature sensors within distributed or centralized networks with mesh, star, or tree topologies. The methods aim to inform sediment accumulation, reduce the impacts of increased rainfall, quantify tire wear particles in gully pot sediments, and adjust maintenance policies to minimize surface flooding risk. While effective in improving certain aspects such as EC, NL, E, Delay, R, and Cost, the limitations include not improving throughput levels, reliability, or computational complexity and failing to minimize energy consumption during surface flooding. Each approach addresses specific sediment management challenges but encounters unique constraints in its implementation. The Smartcities 08 00089 i001 in Table 4 shows that the method increases the performance of the particular metric, whereas the blank space indicates that the method does not consider the performance of the particular metric. The summary conclusions of gully pot monitoring are listed below.
  • The summary offers proactive solutions for managing sewer flooding, addressing extreme rainfall, poor drainage, and blockages with strategically placed sensors for monitoring and preventing overflows.
  • Advanced sensor technologies and network configurations, including Zigbee protocols, optimize gully pot sediment management, pollutant control, and maintenance scheduling.
  • Distributed network topology excels in real-time monitoring and data collection for sediment management. The star network topology, while useful for resource optimization, faces challenges with complexity and energy consumption.
  • The methodologies improve sewer flooding management, enhance public health, and promote environmental sustainability through innovative sensor technologies and network configurations.

4.3. Transportation Applications

WSNs play a crucial role in improving transportation by enhancing driver assistance and convenience. These networks enable seamless communication between vehicles and roadside infrastructure, allowing the exchange of critical data like traffic conditions and road hazards. This integration supports advanced driver assistance systems, smoother traffic flow, and more effective traffic management, ultimately boosting safety, efficiency, and convenience for all road users.
M. Thondoo et al. (2020) [21] introduced a mixed approach to address the alignment between urban transport policies and citizen requirements in Port Louis City. The mixed approach utilizes GPS sensor devices and logistic regression methods to identify associations between citizen requirements and demographic indicators. The study focused on addressing problems such as inefficiencies in urban transport systems and discrepancies between policy objectives and citizens’ needs. Using a centralized network type and mesh network topology, the approach facilitated comprehensive data collection and analysis. The results revealed key insights into the relationship between urban transport policies and citizen demands, enabling policymakers to make informed decisions. The importance of incorporating citizen feedback and demographic considerations in the formulation and implementation of urban transport policies is discussed. Thus, the designed methodology enhances the effectiveness and responsiveness of the transport system to meet the needs of the residents of Port Louis city.
Saul A. Obregón-Biosca et al. (2022) [22] introduced a discrete choice model to investigate transportation choices by employing multimedia mobile nodes for data collection. The study facilitated comprehensive data gathering across urban and peri-urban zones using a decentralized network type and a cluster-based network topology. The discrete choice model enabled the calculation of user features influencing transportation choices, providing insights into factors driving mode selection. Through various case studies conducted in a Quality Management Area (QMA), the research addressed issues such as understanding the determinants of transportation choices and optimizing transportation systems to meet diverse user needs. The results yielded valuable insights into the preferences and behaviors of commuters in different zones, informing policymakers and urban planners about strategies to enhance transportation infrastructure and services. It is important to consider user preferences and characteristics in the design and planning of transportation systems to improve efficiency, accessibility, and sustainability.
Masanobu Kii et al. (2014) [23] introduced the land-use transportation model for urban policy assessment in smart community building, employing light, temperature, and acoustic sensor nodes. Using a centralized network type and mesh network topology, the model addressed urban policy formulation and assessment challenges, particularly concerning energy consumption. The model provided a comprehensive framework for evaluating the impact of city policies on energy consumption in a reliable manner by incorporating actor location-related decisions and travel behavior. Through simulations and analysis, the study offered insights into the effectiveness of different policy interventions in promoting smart and sustainable urban development. Then, the results highlighted the potential for integrating sensor technologies and transportation modeling to support evidence-based decision-making in urban planning and policy development, ultimately creating more efficient and resilient smart communities. The importance of leveraging technological advancements to address complex urban challenges and achieve sustainable development goals.
An integrated approach was designed by Bhargav Adhvaryu et al. (2021) [24] who aimed to enhance the functionality of cities by incorporating public infrastructure systems. Using Radio Frequency Identification (RFID) and Hall Effect sensors, coupled with a centralized network type and mesh network topology, this approach sought to optimize urban planning procedures, particularly in public transportation, using the Public Transport Accessibility Level (PTAL) methodology. By integrating sensors and network technologies, the study addressed challenges related to transportation efficiency and accessibility, ultimately aiming to improve the overall functionality of cities. The conceptual model by Andrew Glazener et al. (2021) [25], on the other hand, focused on connecting transportation and health. Employing multimedia sensors and a centralized network type with a grid-based network topology, the model aimed to leverage expert knowledge and information to assess the health outcomes associated with transportation systems. By integrating sensor data and expert insights, this model provided a comprehensive framework for understanding the health implications of transportation decisions. These two methodologies highlight the potential of integrating sensor technologies with urban planning and health assessment to address complex challenges and improve the overall well-being of urban residents.
An integrated urban transportation system (IUTS) developed by Szymon Fierek et al. (2012) [26] aimed to address challenges in metropolitan transportation by integrating various modes of transportation through the use of magneto resistive sensors. Using a decentralized network type with a star network topology, the system facilitated data collection and decision-making processes involving city planners, traffic engineers, and municipal authorities. By combining public and private transportation options, the IUTS sought to improve mobility standards in metropolitan areas and positively influence resident travel behavior. Implementing the IUTS led to the design of advanced transportation solutions and changes in resident travel habits, ultimately enhancing the efficiency and effectiveness of urban transportation systems. The planning process relied on Multi-Criteria Decision Making/Analysis (MCDM/A) methodology for ensuring a comprehensive and systematic approach to addressing transportation challenges. Thus, the study highlighted the potential of integrated transportation systems to transform urban mobility and improve the overall quality of life for residents in metropolitan areas.
Table 5 compares various urban transport methodologies aimed at improving transportation systems and understanding user behavior. Each method employs different sensors, such as GPS devices, multimedia mobile nodes, light, temperature, acoustic sensors, RFID, and magneto-resistive sensors, within centralized or decentralized networks featuring mesh, cluster-based, star, and grid topologies. Objectives include assessing policy alignment with citizen needs, analyzing discrete choices, studying land-use and travel behavior, integrating urban planning with public transport, connecting transportation with health, and enhancing travel standards. While these methods effectively address aspects like EC, NL, E, Delay, R, and Cost, they each have specific limitations. These include not reducing computational complexity, failing to minimize energy consumption, not reducing delays, failing to improve network lifetime, and not increasing the efficiency of transportation-health connections. Despite their varied goals and approaches, each methodology encounters challenges in optimizing its respective systems. The Smartcities 08 00089 i001 in Table 5 shows that the method increases the performance of the particular metric, whereas the blank space indicates that the method does not consider the performance of the particular metric. The summary conclusions of the transportation applications are listed below.
  • The studies highlight the importance of sensor networks and integrated methodologies in addressing urban transportation challenges like policy alignment, transportation choice analysis, and energy consumption, focusing on efficiency, safety, and sustainability.
  • Different network topologies, such as centralized mesh and grid and decentralized cluster-based and star, optimize transportation systems for policy assessment, health impact analysis, and transportation mode integration.
  • Mesh network topology offers scalability and efficiency for policy alignment and public transport integration. Grid topology is robust for linking transportation with health outcomes.
  • Star network topology is effective for integrating various transportation modes and improving travel standards, while cluster-based topology excels in detailed transportation choice analysis.
  • Decentralized architectures enhance urban transportation systems by providing insights into user preferences, policy effectiveness, and system efficiency, each topology contributing to resilience and responsiveness.

4.4. Disaster, Emergency, and Security Applications

WSNs are vital for disaster, security, and emergency applications in urban areas, where unforeseen disasters pose significant risks. They are used for surveillance, early-warning systems, and real-time monitoring of critical infrastructure. By deploying WSNs in vulnerable areas, authorities can detect threats early, enabling prompt evacuation and emergency response. Integrating WSNs with advanced analytics and communication systems enhances rapid decision-making and coordination, improving urban resilience to disasters and security threats.
Figure 3 illustrates the diverse applications of WSNs in disaster, emergency, and security scenarios. WSNs enable early-warning systems for natural disasters, monitor critical infrastructure during emergencies, and enhance public safety through surveillance and intrusion detection. They also support environmental monitoring to detect pollution or hazardous material leaks. Overall, WSNs provide comprehensive solutions for proactive risk management, efficient emergency response, and effective threat mitigation in urban areas.
Nuha Etinaya et al. (2018) [27] proposed the Sendai Framework for Disaster Risk Reduction (SFDRR) to achieve sustainable development by focusing on constructing sustainable surroundings. This approach helps to study the historical evolution of Disaster Risk Management (DRM) and Disaster Risk Reduction (DRR) by examining disaster damage, infrastructure, and service disruption. By analyzing historical data and adopting a constructivist perspective, it identified key challenges and issues in DRM and DRR implementation. Applying this to WSNs, the study highlights challenges such as energy consumption, data management, scalability, security, and reliability. The solutions proposed include energy-efficient protocols, data aggregation, hierarchical network structures, advanced encryption techniques, and redundancy measures. However, WSNs face limitations like energy constraints, complexity in large-scale deployments, environmental impact, initial costs, and limited computational power. Despite these limitations, WSNs offer significant advantages, including real-time monitoring, scalability, autonomous operation, flexibility, and cost-effectiveness. Integrating technological innovations with historical insights into disaster risk reduction emphasizes the need for collaborative and multi-dimensional efforts to build resilient and sustainable urban environments amidst increasing disaster risks.
Joao Paulo Just Peixoto et al. (2023) [28] utilized a technical approach that integrates geospatial data analysis and positioning algorithms to enhance emergency response infrastructure in urban areas. This approach involves the strategic use of geospatial data to identify optimal locations for critical facilities like hospitals and police stations, ensuring their efficient distribution to maximize coverage and accessibility. Positioning algorithms were employed to analyze spatial patterns and urban layouts, optimizing the placement of these facilities based on factors such as population density and proximity to high-risk areas. Additionally, the researchers developed infrastructure with designated mitigation zones, incorporating communication systems to enhance urban resilience. These mitigation zones were delineated using a set of recognition units, likely combining technological tools and protocols for precise identification and demarcation. The approach emphasizes proactive planning and the integration of advanced technology to improve the coordination and efficiency of emergency response efforts, ultimately enhancing urban resilience and minimizing the impact of emergencies on communities.
Si-Yu Zhou et al. (2022) [29] introduced a mathematical model to assess the crisis response abilities of cities in meteorological tragedies. The study addressed the increasing frequency and severity of meteorological crises and their impact on urban areas. Through model verification parameters and deviation evaluation, the researchers sought to ensure the accuracy and reliability of their approach. They employed the Analytic Hierarchy Procedure (AHP) to establish a weighting scheme and quantitative evaluation policy. The study identified key challenges in crisis response capabilities and proposed solutions to enhance urban resilience to meteorological disasters. The results highlighted the importance of proactive planning and investment in infrastructure and emergency response systems to mitigate the impact of meteorological crises on cities and communities.
Tong Peng et al. (2023) [30] introduced intelligent processing technology to address security issues urban populations face due to rapid urbanization and the proliferation of high-rise buildings, halls, and underground structures. The study focused on the overcrowding of buildings and assemblies, which posed significant safety risks to urban residents. Through quantitative analysis and data-driven approaches, the researchers identified multifaceted danger factors contributing to fire accidents and other security concerns in urban environments. The study proposed measures to address overcrowding and improve safety standards in urban areas, emphasizing the importance of effective urban planning and management strategies to ensure the well-being of urban populations.
Francesco Palmieri et al. (2016) [31] introduced a hybrid cloud architecture for coordinated emergency organization in smart cities, focusing on responder localization during crisis events. Through the use of positioning schemes and signal strength obtained from landmarks, the management system is developed to optimize responder localization and resource allocation during crises. The study demonstrated the effectiveness of smart technologies and data-driven approaches to enhance emergency response capabilities in urban areas. The results emphasized the importance of leveraging technological advancements to improve the efficiency and effectiveness of emergency management systems in smart cities, ultimately enhancing the resilience of urban communities to crisis events.
Irfan Ahmad Rana et al. (2021) [32] introduced a pragmatic approach to evaluating the efficiency of tragedy risk management cycles and stages in city flooding. The researchers sought to understand perspectives and responses at each flood risk management cycle stage. Utilizing thematic analysis, views were classified, and responses were identified for each stage. The study highlighted the reliance on reactive approaches by local institutions in managing flood risks, emphasizing the need for proactive and comprehensive strategies to enhance urban resilience to flooding. The 37 results provided insights into the limitations of current flood risk management practices and proposed solutions to improve the effectiveness and efficiency of flood risk management in urban areas.
An integrated approach was designed by Jaewook Lee et al. (2013) [33] to address the challenges associated with managing urban facilities and responding to emergencies in real time. The approach focused on the complexities and diversification of urban facilities in monitoring and managing emergencies effectively. The researchers designed a system for urban facility administration that incorporated facility-related information and management functions. They developed and tested an Integrated Urban Facility Management System (IUFMS) prototype, which aimed to identify abnormalities in advance and take appropriate measures to mitigate emergency events. The results demonstrated the effectiveness of IUFMS in improving real-time emergency response capabilities and enhancing urban facility management. The study concluded by emphasizing the importance of leveraging technology and integrated approaches to enhance the resilience of urban infrastructure and improve emergency response in urban areas.
J.A.B. Post et al. (2016) [34] developed a Generalized Linear Mixed Modeling (GLMM) approach to quantify solid accretion in gully pots. The study addressed the challenges associated with sediment accumulation in gully pots, which can lead to reduced retaining efficiency and potential drainage issues. By employing a GLMM approach, the researchers aimed to identify relevant physical and catchment properties that influence composite trapping processes within gully pots. The study sought to understand how sediment bed levels impact retaining efficiency and drainage performance. Through their analysis, the researchers provided insights into the factors contributing to solid accretion in gully pots and proposed solutions to mitigate sediment accumulation and improve drainage effectiveness. The results of the study offered valuable information for urban planners and infrastructure managers to optimize gully pot maintenance practices and ensure efficient store-water management in urban areas. The conclusion emphasized the importance of considering sediment trapping processes and sediment bed levels in gully pot design and maintenance to minimize drainage issues and enhance overall drainage performance.
Table 6 presents various methodologies aimed at improving urban resilience and disaster response, comparing their objectives, sensor types, network configurations, results, and limitations. These methods use seismic sensors, weather sensors, seismometers, environmental sensors, and hybrid cloud architectures within centralized or decentralized networks featuring tree, mesh, star, and cluster-based topologies. Objectives include investigating the historical emergence of disaster risk management (DRM) and disaster risk reduction (DRR), defining mitigation zones, assessing crisis response abilities, addressing overcrowding, managing computing resources, emphasizing proactive strategies, enhancing infrastructure resilience, and quantifying gully pot sediment. The results show improved EC, NL, E, Delay, R, T, and LR. However, limitations include inefficiencies in DRM and DRR, insufficient reliability in positioning approaches, unminimized delays in mathematical models, high computational costs, complexity in several approaches, and inadequately quantified gully pot sediments. Each methodology targets specific urban resilience challenges but faces unique implementation constraints. The Smartcities 08 00089 i001 in Table 6 shows that the method increases the performance of the particular metric, whereas the blank space indicates that the method does not consider the performance of the particular metric. The summary conclusions of the disaster, emergency, and security applications are listed below.
  • The studies emphasize the critical role of WSNs in enhancing urban resilience and managing disasters, addressing challenges like energy consumption, data management, scalability, security, and reliability.
  • Various network topologies and architectures, including tree, mesh, star, and cluster-based configurations, are implemented to optimize sensor deployment, data collection, and disaster response.
  • Mesh Network Topology offers reliability and comprehensive coverage for centralized networks. Star Network Topology is effective for addressing overcrowding and safety, while Cluster-Based Topology excels in urban facility administration and emergency response through hierarchical structures.
  • Centralized Architectures are preferred for structured data aggregation and resource management, while Decentralized Architectures provide flexibility and adaptability in disaster scenarios.
  • Each topology and architecture has specific benefits, making a combined approach ideal for enhancing urban resilience and safety in disaster management and security applications.

4.5. Healthcare Applications

The application of WSN in healthcare addresses challenges in urban areas, such as congested hospital crisis rooms and traffic delays. Tele-healthcare, successfully used in countries like China and India, leverages WSN technology to remotely monitor patients’ vital signs and transmit data to doctors, improving efficiency and reducing the need for physical visits. Key considerations include ensuring data security, reliable network connectivity, and accurate sensor measurements. Integrating WSN with telemedicine platforms and training healthcare professionals can further enhance healthcare access and reduce hospital congestion. Figure 4 illustrates the healthcare applications in WSN.
Wafa A. Alhazri et al. (2022) [35] employed a cross-sectional descriptive design in electronic healthcare applications to enhance healthcare quality and patient security. The study utilized video, acoustic, and RFID sensors within a decentralized network type and a star-connected network topology. The designed application facilitated safe and confidential access to health data, allowing individuals to monitor their health outcomes. By leveraging these sensors and network architecture, the study aimed to address challenges related to healthcare accessibility and patient data security. The results demonstrated the effectiveness of the electronic healthcare application in improving healthcare delivery and patient satisfaction, ultimately contributing to enhanced healthcare quality and patient security.
Oliver Faust et al. (2018) [36] conducted an initial bibliometric analysis focusing on an e-health electronic application and program in Riyadh. The study employed a cross-sectional descriptive design targeting healthcare professionals. Using Electromyogram (EMG), Electroencephalogram (EEG), Electrocardiogram (ECG), and Electrooculogram (EOG) sensors within a decentralized network type and a star-connected network topology, the study aimed to analyze data for healthcare applications efficiently. Deep learning techniques were utilized for classification purposes. The study addressed issues related to data analysis and classification in healthcare settings, aiming to improve diagnostic accuracy and treatment efficacy. The results highlighted the potential of deep learning and sensor technologies in enhancing healthcare outcomes and contributing to advancements in medical research and practice.
Kyuho Han et al. (2023) [37] explored the impact of sustainable healthcare systems on user satisfaction and intention, focusing on the use of environmental and physiological sensors within a centralized network and star-connected topology to implement energy-saving techniques. The technical approach involved integrating these sensors to monitor health data efficiently while conserving energy. The problem addressed was the challenge of enhancing user experience and satisfaction in mobile health (mHealth) platforms. The solution proposed involved analyzing the moderating effects of personal features on perceived value and user satisfaction, identifying key factors that influence user contentment. Advantages of this approach include improved healthcare outcomes, enhanced user satisfaction, and efficient energy usage in mHealth applications. However, limitations may include the complexity of accurately capturing and analyzing personal features, potential privacy concerns, and the need for robust infrastructure to support the centralized network system.
R. Priyadarshini et al. (2023) [38] introduced an energy-saving technique in a Very-Large-Scale Integration (VLSI) design to increase the battery capability of IoT devices. The study used battery sensors within a centralized network type and a cluster-based network topology for energy-saving methods. The designed power control computer toggled between two broadcast modes consistently, aiming to reduce energy consumption while maintaining minimum battery capacity. The research addressed challenges associated with energy efficiency and battery life in IoT devices, offering a solution to extend battery life and improve overall device performance. The results demonstrated the effectiveness of the proposed energy-saving technique in reducing energy consumption and increasing battery capability, ultimately enhancing the usability and sustainability of IoT devices in various applications.
Mohd Anjum et al. (2023) [39] proposed the non-delay-tolerant dissemination technique (NDTDT) to address issues related to overloaded dissemination and swift message delivery in healthcare systems. The study utilized accelerometer and gyroscope sensors within a centralized network type and a star-connected network topology for NDTDT. The dissemination method employed intelligent decision-making processes to prioritize and present accumulated details to healthcare centers efficiently. By leveraging these sensors and network architecture, the designed technique aimed to ensure reliable message delivery while minimizing errors due to discrete sensing intervals. The results demonstrated the effectiveness of NDTDT in increasing the delivery of vital healthcare information through efficient dissemination, ultimately improving healthcare outcomes and patient care.
Asma Pashazadeh et al. (2018) [40] conducted a systematic survey to study and evaluate methods related to big data in healthcare applications. The study utilized thermometer sensors within a centralized network type and a cluster-based network topology for data collection. Through a comprehensive and detailed analysis, the researchers aimed to identify modern mechanisms in big data analytics relevant to healthcare applications. The survey addressed challenges associated with the integration and analysis of large volumes of healthcare data, offering insights into emerging trends and technologies in big data analytics for healthcare. The results provided valuable information for researchers and practitioners to enhance data-driven decision-making processes and improve healthcare delivery and patient outcomes.
Table 7 compares various methodologies aimed at improving healthcare systems, focusing on objectives, sensor types, network configurations, results, and limitations. These methods use diverse sensors like video, acoustic, RFID, ECG, and environmental sensors in centralized or decentralized networks with star or cluster topologies. The objectives include enhancing e-health applications, healthcare data analysis, user satisfaction, IoT device battery life, message delivery reliability, and big data analysis. While the results show improvements in E, D, R, and NL, the limitations include delays in cross-sectional designs, inefficient data transmission, unimproved user satisfaction, and challenges in energy savings and reliability. Each method addresses specific healthcare challenges but has its own constraints. The Smartcities 08 00089 i001 
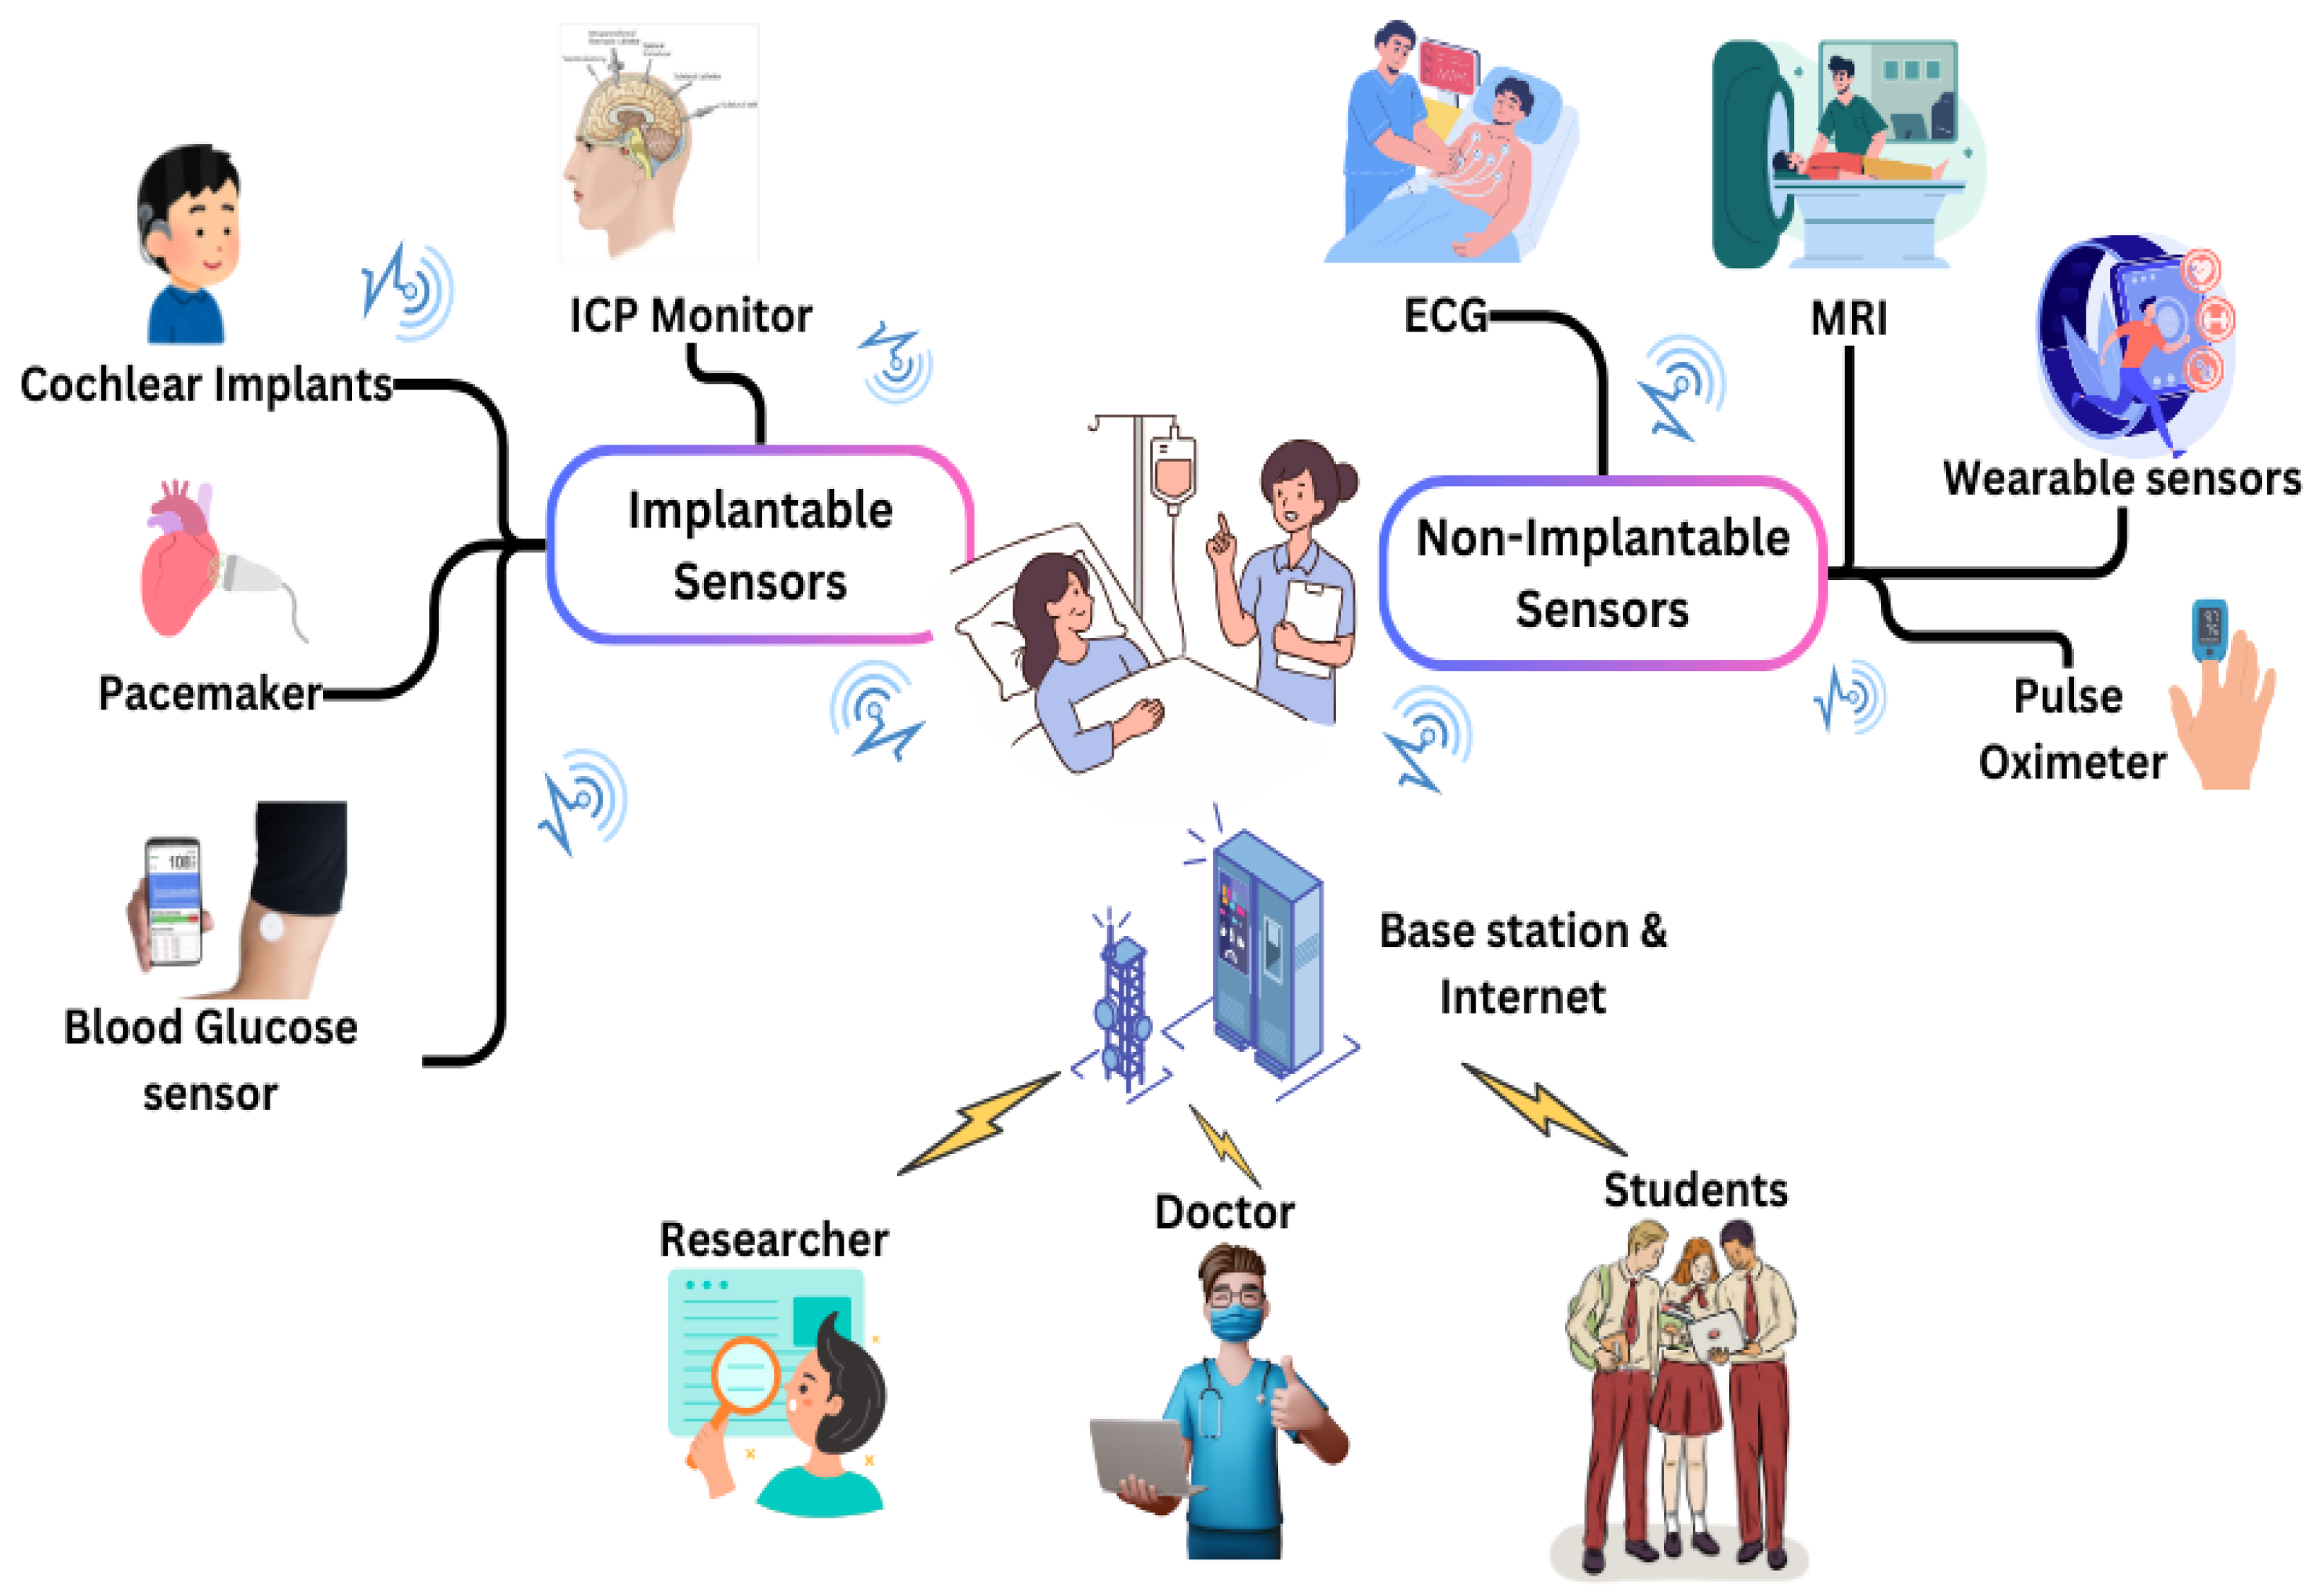
in Table 7 shows that the method increases the performance of the particular metric, whereas the blank space indicates that the method does not consider the performance of the particular metric. The summary conclusions of healthcare applications are listed below.
  • WSN technology improves healthcare delivery in urban crisis rooms by enhancing remote monitoring, healthcare access, and response times, reducing the need for physical presence.
  • Various sensor types and network topologies, including centralized and decentralized configurations, enhance healthcare delivery. Star-connected topologies are efficient in data collection and system reliability.
  • Centralized network topologies are preferred for robust resource and data management, focusing on energy-saving techniques and reliable message delivery. Cluster-based topologies effectively manage large data volumes and improve system performance.
  • Decentralized network topologies, such as star-connected configurations, offer flexibility and targeted monitoring, enhancing diagnostic accuracy and healthcare outcomes.
  • The methodologies emphasize the importance of appropriate network topologies and architectures. Centralized and star-connected topologies are reliable and efficient, while decentralized topologies offer insights into complex healthcare system challenges.

4.6. Gas Monitoring Applications

Gas monitoring in urban areas is a critical application of WSNs aimed at ensuring safety and environmental quality. In urban regions, the proliferation of industrial activities, vehicular emissions, and residential gas usage poses significant challenges to air quality and public health. WSNs facilitate real-time monitoring of gas emissions, allowing for early detection of leaks, pollutants, and hazardous concentrations. However, challenges such as sensor calibration, data accuracy, and network reliability need to be addressed to ensure effective gas monitoring. Precautions such as regular sensor calibration, redundant sensor deployment, and network optimization can enhance the accuracy and reliability of gas monitoring systems. Additionally, proactive maintenance and timely response protocols are essential to address any detected anomalies or gas leaks promptly, mitigating potential risks to public health and safety. Overall, leveraging WSNs for gas monitoring in urban areas offers a scalable and efficient solution to address environmental concerns and ensure the well-being of urban inhabitants.
Ke Guo et al. (2019) [41] proposed a real-time and early-warning gas leakage monitoring system for large-scale regions using mobile WSNs. The system utilized Zigbee-based antenna types along with Global Position System (GPS) sensors and employed a combination of centralized and hierarchical network topologies. The sensor terminal included Tunable Diode Laser Absorption Spectroscopy (TDLAS) gas sensors, known for their high accuracy and compact size, enhancing the efficiency of gas detection. A central server was responsible for gathering, processing, and storing information, while a real-time monitoring cloud platform displayed the data. The mobile WSN consisted of both mobile and stationary sensor terminals for comprehensive gas leakage monitoring. This work addressed the critical need for timely detection and warning of gas leaks in large-scale urban environments. By leveraging mobile WSNs and advanced sensor technology, the system aimed to mitigate potential hazards associated with gas leaks, ensuring the safety of residents and infrastructure. The results demonstrated the effectiveness of the proposed system in real-time gas monitoring and early warning, providing valuable insights for enhancing urban safety and environmental protection.
W. Jin et al. (2013) [42] discussed the gas detection method. The designed method focused on employing gas sensors for fiber detection, aiming to enhance the efficiency and accuracy of gas detection processes. The designed system utilized a decentralized network and cluster-based network topology, facilitating comprehensive coverage and data collection. The research addressed challenges associated with traditional gas detection methods, such as limited coverage and detection capabilities. By leveraging advanced sensor technologies and network architectures, the gas detection method is used in various applications, including industrial settings and environmental monitoring. The results demonstrated the effectiveness of the proposed gas detection method in enhancing detection capabilities and in providing valuable insights for improving safety and environmental protection measures.
Guoquan Chang et al. (2023) [43] introduced a deep learning feature engineering-based approach to establish the relationship between underground sensors for gas detection. The study utilized Zigbee-based antenna types and underground sensors and employed a combination of decentralized and star-connected network topologies. The research aimed to address challenges related to determining the link between underground sensors and analyzing gas concentration data effectively. By employing deep learning techniques and feature engineering approaches, the study proposed innovative solutions to enhance the accuracy and reliability of underground gas detection systems. The results demonstrated the effectiveness of the proposed approach in identifying sensor malfunctions and analyzing gas concentration data, providing valuable insights for improving underground gas detection systems’ performance and reliability in various applications, including mining and tunneling operations.
Siqi Lyu et al. (2022) [44] introduced a fast operando monitoring technique for fast gas evolution monitoring, addressing the need for efficient and accurate detection of gas emissions. The designed technique utilized Zigbee-based antenna types along with a non-dispersive infrared multi-gases sensor, enabling comprehensive gas detection capabilities. Employing a combination of centralized network and mesh network topology, the research aimed to overcome challenges associated with traditional gas monitoring methods, such as limited coverage and detection speed. By leveraging real commercial batteries and establishing correlations between gas concentrations, voltage, and temperature, the designed technique provides innovative solutions to enhance the efficiency and reliability of gas evolution monitoring. The results demonstrated the effectiveness of the proposed technique in rapidly detecting gas emissions and providing valuable insights for improving safety measures and environmental monitoring in various industrial and commercial settings.
Yingge Chen et al. (2022) [45] developed an optically powered and safe gas monitoring scheme aimed at detecting environmental gases in underground mines, addressing the critical need for reliable gas monitoring in hazardous environments. The system utilized Zigbee-based antenna types alongside liquid-crystal-based optical transducer sensors, allowing for accurate gas detection under ambient temperature and pressure conditions. By employing a combination of centralized network and mesh network topology, the research aimed to overcome challenges related to power supply and data transmission in underground environments. The system achieved reliable and efficient gas monitoring capabilities by leveraging key technologies, including power-over-fiber (PoF), for efficient power delivery and information transmission. Through an ultra-low power consumption design, the study proposed solutions to enhance the safety and effectiveness of gas monitoring systems in underground mining operations. The results demonstrated the feasibility and effectiveness of the optically powered gas monitoring scheme in detecting environmental gases and ensuring the safety of underground mine environments.
Zaheer Abbas et al. (2021) [46] investigated a gas distribution pipeline network model for addressing the critical need in efficient data transmission and monitoring. The study utilized Zigbee-based antenna types alongside pressure and temperature sensors, enabling accurate and real-time monitoring of gas pipelines. Employing a combination of centralized network and cluster-based network topology, the research aimed to optimize data transmission and network efficiency in pipeline monitoring applications. Key challenges such as estimated network lifetime, node deployment strategies, energy harvesting from the field, and optimal sink node placement were addressed by evaluating different routing protocols for WSNs in pipeline monitoring. By studying the performance of various routing protocols, the research provided valuable insights into system adaptability and efficiency in gas pipeline monitoring applications, ultimately contributing to the development of more robust and reliable monitoring systems for critical infrastructure networks.
Table 8 presents a comparison of methodologies for gas leakage and detection monitoring in various environments, detailing their objectives, sensor types, network configurations, results, and limitations. These methods utilize GPS sensors, gas sensors, underground sensors, non-dispersive infrared multi-gas sensors, liquid-crystal-based optical transducers, and pressure and temperature sensors within centralized or decentralized networks featuring hierarchical, cluster-based, star, and mesh topologies. The objectives include detecting gas leaks in urban areas, improving safety and environmental protection, identifying sensor relationships for gas detection, performing efficient gas emission detection, monitoring gases in underground mines, and efficiently monitoring gas distribution networks. The results show improved NL, E, Delay, R, T, and LR. However, limitations include reducing energy consumption, high complexity levels, unaddressed computational costs, and inefficiencies in time consumption for gas distribution monitoring. Each methodology addresses specific aspects of gas detection and monitoring but encounters distinct implementation challenges. The Smartcities 08 00089 i001 in Table 8 shows that the method increases the performance of the particular metric, whereas the blank space indicates that the method does not consider the performance of the particular metric. The summary conclusions of gas monitoring applications are listed below.
  • Advanced gas monitoring systems address challenges in detecting gas leaks, enhancing safety, and improving environmental protection in urban and hazardous environments.
  • Centralized Network topologies, including Hierarchical and Mesh, offer comprehensive data collection and real-time monitoring, especially in large-scale urban and underground settings. They are efficient in data aggregation but may have high energy consumption and complexity.
  • Decentralized Network topologies, such as Cluster-based and Star, provide effective coverage and flexibility. The Cluster-based topology handles complex environments with multiple sensors, while the Star topology simplifies network management and reduces computational costs.
  • Advanced techniques like Deep Learning and Optically Powered Sensors enhance gas detection accuracy and efficiency but may face computational and energy challenges.
  • Each network topology has unique strengths and limitations. Mesh Network Topology is reliable and comprehensive for dynamic, large-scale monitoring, while Cluster-based and Star topologies offer specific efficiency, cost, and coverage benefits.
  • These diverse approaches and network architectures enhance gas monitoring and detection, improving safety and environmental protection across various applications and environments.

4.7. Solid Waste Monitoring

In urban areas, solid waste management presents significant challenges due to the increasing population density and congestion. Municipalities expend considerable resources on waste collection to maintain cleanliness and odor control, with customer satisfaction being a crucial consideration. However, overfilled bins and inefficient garbage pickup schedules often lead to dissatisfaction among residents. The optimization of waste collection routes and schedules is essential to minimize costs, including fuel expenses for collection trucks. Currently, waste collection is often performed sporadically, without proper planning or optimization, resulting in inefficient use of resources. With population growth exacerbating waste generation, there is a pressing need for innovative solutions in solid waste management. WSNs can play a vital role in optimizing waste collection processes by providing real-time monitoring of bin fill levels, enabling municipalities to schedule pickups more efficiently. By deploying sensors in waste bins, authorities can receive timely alerts when bins are nearing capacity, allowing for proactive and optimized waste collection. This approach can lead to cost savings, reduced fuel consumption, and improved overall efficiency in solid waste management in urban areas.
Lalit Mohan Joshi et al. (2022) [47] proposed a Wireless Personal Area Network (WPAN) and cloud-assisted architecture for real-time monitoring of solid waste in remote locations. This methodology uses XBee communication and the Internet to enable remote monitoring of waste bins. Customized hardware was deployed within the bins to facilitate data collection, with customized sensor nodes and coordinator nodes employed in the architecture. The Laboratory Virtual Instrument Engineering Workbench (LabVIEW) data logger was used for real-time monitoring, capturing bin status, and representing it digitally. This solution addressed the challenge of inefficient waste management and lack of real-time monitoring in remote areas. By providing a system for real-time monitoring, authorities can optimize waste collection schedules, improve efficiency, and reduce operational costs associated with waste management. Additionally, the cloud-assisted architecture enables data storage and analysis, allowing for informed decision-making and proactive management of waste collection processes. Overall, this approach offers a promising solution for enhancing solid waste management practices in remote locations, contributing to cleaner and more sustainable urban environments.
Sunil Kumar et al. (2019) [48] discussed Solid Waste Management (SWM) techniques to address the challenges posed by the lack of appropriate facilities for the disposal of Municipal Solid Waste (MSW). SWM leads to open burning practices that negatively impact the surrounding environment. This methodology aimed to assess the ecological factors around dumpsites to understand the environmental impacts and propose technical solutions. Pollution metrics, including particulate matter concentration and hydrogen oxides, were measured to assess air quality in real-time monitoring processes. The results indicated elevated levels of fine suspended particulate matter concentration and nitrous oxide, highlighting the environmental pollution caused by inadequate SWM practices. This study shows the importance of implementing effective waste management strategies to mitigate environmental pollution and ensure the well-being of surrounding communities.
Dominic Abuga and N.S Raghava (2021) [49] proposed a real-time smart garbage bin apparatus for solid waste administration in urban areas. The designed mechanism incorporated weight sensors to facilitate efficient garbage collection. The study identified challenges such as inaccessibility to required data and delayed unloading in existing garbage collection and management systems. To address these issues, the proposed method utilized real-time data from smart garbage bins deployed across the city and tackled waste overflow problems. This methodology was implemented using NetLogo in multi-agent modeling environments, aiming to improve the efficiency and effectiveness of solid waste management in urban settings. Thus, this work aimed to enhance waste collection processes and optimize resource utilization in urban areas, ultimately contributing to cleaner and more sustainable cities.
Remi Cuingnet et al. (2022) [50] introduced PortiK, a system designed to help and optimize waste management operations. PortiK utilizes short-range monitoring combined with deep learning and statistical analysis to provide continuous, real-time, and non-intrusive measurements of waste streams. By employing image analysis and object detection techniques, this technique offers an end-to-end solution for waste management, covering every essential step from hardware requirements to data gathering and analysis. This methodology addresses waste management operations challenges, such as inefficient monitoring methods and a lack of real-time data insights. Through its innovative approach, PortiK offers a promising solution to optimize waste management processes and improve overall efficiency in handling waste streams.
Md. Wahidur Rahman et al. (2022) [51] introduced a solid waste management architecture using deep learning and IoT technologies. The architecture used Global System for Mobile Communications (GSM) tracking sensors and Bluetooth options for data tracking, while waste sorting was performed using Convolutional Neural Networks (CNNs). The system incorporated smart trash bins equipped with multiple sensors for efficient waste management. By employing IoT and Bluetooth connections for data monitoring, the system aimed to improve waste classification accuracy and overall efficiency. The evaluation metrics used, including waste label classification accuracy, sensor data evaluation, and System Usability Scale (SUS), contributed to enhancing the system’s performance and usability.
Xulong Lu et al. (2020) [52] introduced an ICT-based Solid Waste Collection and Classification System (SWCCS) to address waste gathering issues. This methodology used proximity sensors to improve waste collection efficiency. A multi-objective hybrid algorithm, combining whale optimization and genetic algorithm (MOGWOA), was designed to optimize waste collection routes. By employing fast, non-dominated sorting methods, the algorithm aimed to minimize costs and emissions associated with waste collection. The SWC route optimization model introduced by M.A. Hannan et al. (2020) [53] further enhanced collection efficiency by employing Fixed Route Optimization (FRO) and Variable Route Optimization (VRO). The model utilized Global System for Mobile Communication (GSM) tracking sensors in conjunction with FRO and VRO to optimize waste collection routes using mixed-integer linear programming methods. Through efficient optimization techniques, the SWC route optimization model aimed to improve waste collection efficiency and reduce associated costs and emissions, ultimately contributing to more sustainable waste management practices.
Table 9 compares various methodologies for solid waste management, detailing their objectives, sensor types, network configurations, results, and limitations. These methods utilize customized sensor nodes, matter concentration, oxides of nitrogen (NOx), sulfur dioxide sensors, weight sensors, short-range data monitoring, GSM tracking sensors, and proximity sensors within decentralized or centralized networks featuring tree, star, mesh, and cluster-based topologies. The objectives include real-time monitoring of waste, assessing ecological factors, efficient waste administration, optimizing waste management operations, performing data tracking, and addressing waste gathering issues. The results show improved NL, E, Delay, R, T, LR, and Cost. However, the limitations include unminimized energy consumption, failure to reduce energy consumption based on ecological factors, inefficient solid waste management with minimal energy consumption, incomplete waste management for data monitoring, failure to carry out data tracking with minimal computational overhead, and unaddressed waste gathering problems. Each methodology tackles specific aspects of waste management but encounters distinct challenges in implementation. The Smartcities 08 00089 i001 in Table 9 shows that the method increases the performance of the particular metric, whereas the blank space indicates that the method does not consider the performance of the particular metric.The summary conclusions of solid waste monitoring applications are listed below.
  • The studies address urban solid waste management challenges like inefficient collection schedules, high costs, and pollution through innovative technologies.
  • Different network topologies, including decentralized, centralized, and hybrid models, optimize waste collection and management. Decentralized networks enhance real-time monitoring, while centralized networks improve data tracking and route optimization.
  • The mesh network topology is valued for its reliability, scalability, and effective data collection in urban waste management.
  • Centralized architectures using tree or star topologies are efficient for data tracking and waste sorting but may require more setup resources.
  • Decentralized architectures, IoT, deep learning, and optimization algorithms improve waste management by enhancing efficiency, reducing costs, and minimizing environmental impact.

4.8. Water Pipeline Monitoring

Water pipelines are an essential design for transporting fresh water for utilization over long distances. The main issue with the water transportation pipeline is seeped out, causing a loss of water resources. Water pipeline observing is around 1.2 billion individuals who do not have access to drinking water worldwide. Water allocation schemes are constructed in all regions through pipelines to regions facing water shortages. A huge quantity of pipeline water is wasted due to water pipeline leakage. Additionally, pipelines relapse because of corrosion as well as water quality deterioration. WSNs are cost-efficient as well as extremely responsive to ecological variations. They employ an enviable resolution to address water pipeline seepage and health observation issues.
Aya Ayadi et al. (2022) [54] introduced a comprehensive framework for observing water pipeline systems and addressing the need for efficient monitoring and detection of pipeline leaks. This methodology used pressure, pH, and water leak sensors in centralized networks with a star-connected network topology. This study provided a comparative overview of key parameters relevant to monitoring water pipelines, highlighting the importance of accurate and timely detection of leaks. Additionally, the framework offered insights into optimizing monitoring processes to minimize energy consumption and increase the system’s efficiency. By using advanced sensor technologies and network architectures, this methodology aimed to improve the reliability and effectiveness of water pipeline monitoring systems, ultimately contributing to the conservation of water resources and the prevention of pipeline damage due to leaks.
Yang Liu et al. (2019) [55] proposed a leakage detection method based on Machine Learning (ML) and WSNs, aiming to enhance the accuracy and efficiency of leak detection in water pipelines. This method utilized pressure sensors and water leak sensors in decentralized networks with a star-connected network topology. This study aimed to minimize energy consumption while improving the system’s lifecycle efficiency by employing a leakage-triggered networking technique and leveraging ML algorithms. A leakage identification method was introduced, utilizing intrinsic mode functions and entropy to construct a signal aspect set for leakage detection. The results demonstrated the effectiveness of the proposed method in accurately detecting leaks in water pipelines, offering valuable insights for enhancing pipeline monitoring systems and preventing water loss due to leaks.
Manel Elleuchi et al. (2022) [56] introduced a heterogeneous two-tiered routing method to improve the network lifetime and efficiency of WSNs in water pipeline monitoring applications. This method uses pressure sensors in centralized networks with a Peer-to-Peer (P2P) connected network topology. By using two routing algorithms in a tiered model, the study aimed to optimize power consumption while enhancing the system’s performance capability. Through simulations and real-world prototype validation, the study demonstrated the effectiveness of the proposed routing method in improving the reliability and efficiency of water pipeline monitoring systems, offering promising solutions for sustainable water resource management.
Fatma Karray et al. (2018) [57] developed a WSN node prototype termed WiRoTip for water pipeline applications and addressed the need for robust and efficient sensor nodes for monitoring pipelines. WiRoTip utilized acoustic sensors in decentralized networks with a P2P connected network topology. The prototype was designed with different node components to ensure adequate design and functionality. By using acoustic sensors and decentralized network architectures, WiRoTip offered a reliable and efficient solution for monitoring water pipelines, contributing to improved leak detection and pipeline maintenance efforts.
Fatma Karray et al. (2017) [58] introduced a wireless sensor network testbed named EarnArdui for water pipeline monitoring. It aims to provide insights into the physical behavior of water distribution systems. The testbed utilized pressure and water level sensors in centralized networks with a star-connected network topology. This study facilitated data collection from sensors and transmission to the base station for analysis. By offering a comprehensive understanding of water distribution system behavior, the testbed provided valuable insights for optimizing pipeline monitoring and management strategies, ultimately contributing to more efficient and sustainable water resource management practices.
Table 10 compares water pipeline monitoring methods by objectives, sensors, network configurations, results, and limitations. It includes pressure, pH, water level, and acoustic sensors in star, distributed star, P2P, and heterogeneous topologies. The objectives focus on leakage detection, network efficiency, and physical monitoring. The results show improvements in NL, E, Delay, R, and EC, but the limitations include high energy consumption, delays, and inefficiencies in monitoring and lifetime optimization. Each method addresses specific challenges but has distinct implementation constraints. The Smartcities 08 00089 i001 in Table 10 shows that the method increases the performance of the particular metric, whereas the blank space indicates that the method does not consider the performance of the particular metric. The summary conclusions of water pipeline monitoring are listed below.
  • The studies offer innovative, cost-effective solutions for water pipeline monitoring, addressing challenges like leak detection, network efficiency, and sensor functionality, while tackling issues such as water loss, pipeline corrosion, and water quality maintenance.
  • These methodologies use different network topologies and sensor types to improve leak detection accuracy, optimize energy use, and enhance water pipeline monitoring systems. Advanced sensors and machine learning algorithms enable timely leak detection and prevention, aiding water conservation and infrastructure maintenance.
  • The Star Network Topology is ideal for centralized monitoring, providing easy implementation and efficient data collection. However, it can be less energy-efficient and may not minimize delays.
  • The Peer-to-Peer (P2P) Network Topology is efficient for decentralized monitoring, optimizing power consumption, and enhancing network reliability and lifetime, which is ideal for robust and sustainable applications.
  • Decentralized P2P architectures with advanced sensors enhance pipeline monitoring, improving reliability, efficiency, and sustainability. They support effective water resource management and reduce environmental impact.

4.9. Commercial Asset Tracking

In urban areas, commercial businesses rely heavily on efficient asset tracking during storage and transportation to ensure the timely delivery of products to customers. However, traditional tracking methods, such as manually recording identification numbers or barcodes, are time-consuming, prone to errors, and inefficient. These lead to delays, misplaced shipments, and customer dissatisfaction. WSNs offer a solution by providing real-time monitoring and tracking of assets throughout the supply chain. By deploying sensor nodes equipped with RFID technology, businesses can automatically track the movement and location of products as they pass through predefined entry points. However, challenges such as signal interference and fluctuating item coordinates may arise in urban environments with dense infrastructure. Precautions such as proper placement of sensor nodes, signal amplification, and regular maintenance can help mitigate these issues. Additionally, implementing backup tracking systems and data encryption measures can enhance the reliability and security of asset tracking in WSNs, ensuring seamless operations and customer satisfaction in commercial businesses.
Igor Bisio et al. (2016) [59] proposed a new asset tracking architecture for tracking assets in construction sites and addressing the challenges of efficiently monitoring equipment and materials in dynamic environments. The designed architecture utilized a hybrid RFID thermal sensor in distributed networks, enhancing asset tracking accuracy and reliability. The architecture facilitated seamless asset tracking and searching processes by incorporating radio frequency recognition, Bluetooth low-energy tags, and smartphones. Using an Android application further streamlined asset management tasks, improving overall operational efficiency at construction sites. This architecture also optimized battery life and distance estimation accuracy, enhancing asset identification in challenging construction environments.
L.Q. Zhuang et al. (2008) [60] introduced an optimization decomposition framework for industrial asset tracking applications in WSN, aiming to optimize energy consumption while maintaining estimation quality. The framework utilized pressure sensors in distributed networks to monitor industrial assets and track their movements. By using optimization decomposition techniques, the framework effectively managed sensor node energy consumption, ensuring prolonged network operation without compromising estimation accuracy. The results demonstrated the feasibility and effectiveness of the framework in enhancing industrial asset tracking capabilities while maximizing energy efficiency in WSN deployments.
Antonio Pietrabissa et al. (2013) [61] developed an optimization framework for tracking medical assets in hospital environments using wireless sensors, addressing the challenges of asset management and patient safety. This methodology used statistical simulation models to analyze asset movements and identify potentially hazardous positions within the hospital. By optimizing sensor placement based on coverage features, the framework ensured comprehensive asset tracking while minimizing deployment costs and energy consumption. The optimization algorithm determined the optimal placement of sensors to maximize coverage and enhance asset monitoring efficiency. Thus, the framework provided valuable insights into optimizing asset tracking systems in hospital environments, ultimately contributing to improved patient care and operational efficiency.
Table 11 compares asset tracking methods by objectives, sensors, network types, results, and limitations. It includes hybrid RFID, thermal, pressure, and wireless sensors in mesh and star topologies. Key goals are tracking in construction sites, medical asset tracking in hospitals, and reducing sensor energy use. The results show improvements in NL, E, EC, delay, and R, but the limitations include inaccurate tracking, high costs, and complexity. Each method addresses specific challenges but has unique implementation constraints. The Smartcities 08 00089 i001 in Table 11 shows that the method increases the performance of the particular metric, whereas the blank space indicates that the method does not consider the performance of the particular metric. The summary conclusions of commercial asset tracking studies are listed below.
  • The studies address challenges in commercial asset tracking, such as inefficiencies, delays, and inaccuracies, by improving tracking accuracy and energy consumption.
  • Various network topologies enhance asset tracking efficiency, using hybrid RFID, thermal, pressure, and wireless sensors in distributed networks.
  • Mesh topology excels in construction sites and industrial settings for reliable and energy-efficient asset tracking.
  • Star topology is effective in hospitals for optimizing sensor placement and managing deployment costs.
  • Decentralized architectures and advanced sensors improve operational efficiency and asset management in commercial environments.

5. Performance Analysis

Performance analysis in this work focused on WSNs in urban areas is vital for guiding the design and optimization of various applications, such as transportation, disaster, power quality monitoring, and healthcare. By evaluating key metrics like Packet Delivery Ratio P D R [62], Efficiency E [63], Network Lifetime N L [63], Energy Consumption E C [62], Error Rate E R [64], Execution Time E T [65], Cost C o s t [66], Accuracy A c c u r a c y [64], and Throughput T [62], researchers can inform decision-making, identify trade-offs, optimize resource utilization, benchmark solutions, and establish design guidelines. These metrics relate differently to various architectures—centralized, decentralized, and distributed—as well as to topologies like star and mesh. For example, centralized architectures may offer lower average delays but at the cost of higher energy consumption, while decentralized architectures can enhance network lifetime and reliability. Similarly, star topologies provide high throughput but can strain central nodes, whereas mesh topologies improve redundancy and reduce error rates at the expense of increased execution time. Overall, performance analysis is essential for understanding the operational characteristics of WSNs, ensuring that they meet the specific needs of urban applications. The different performance metrics are measured as given below.
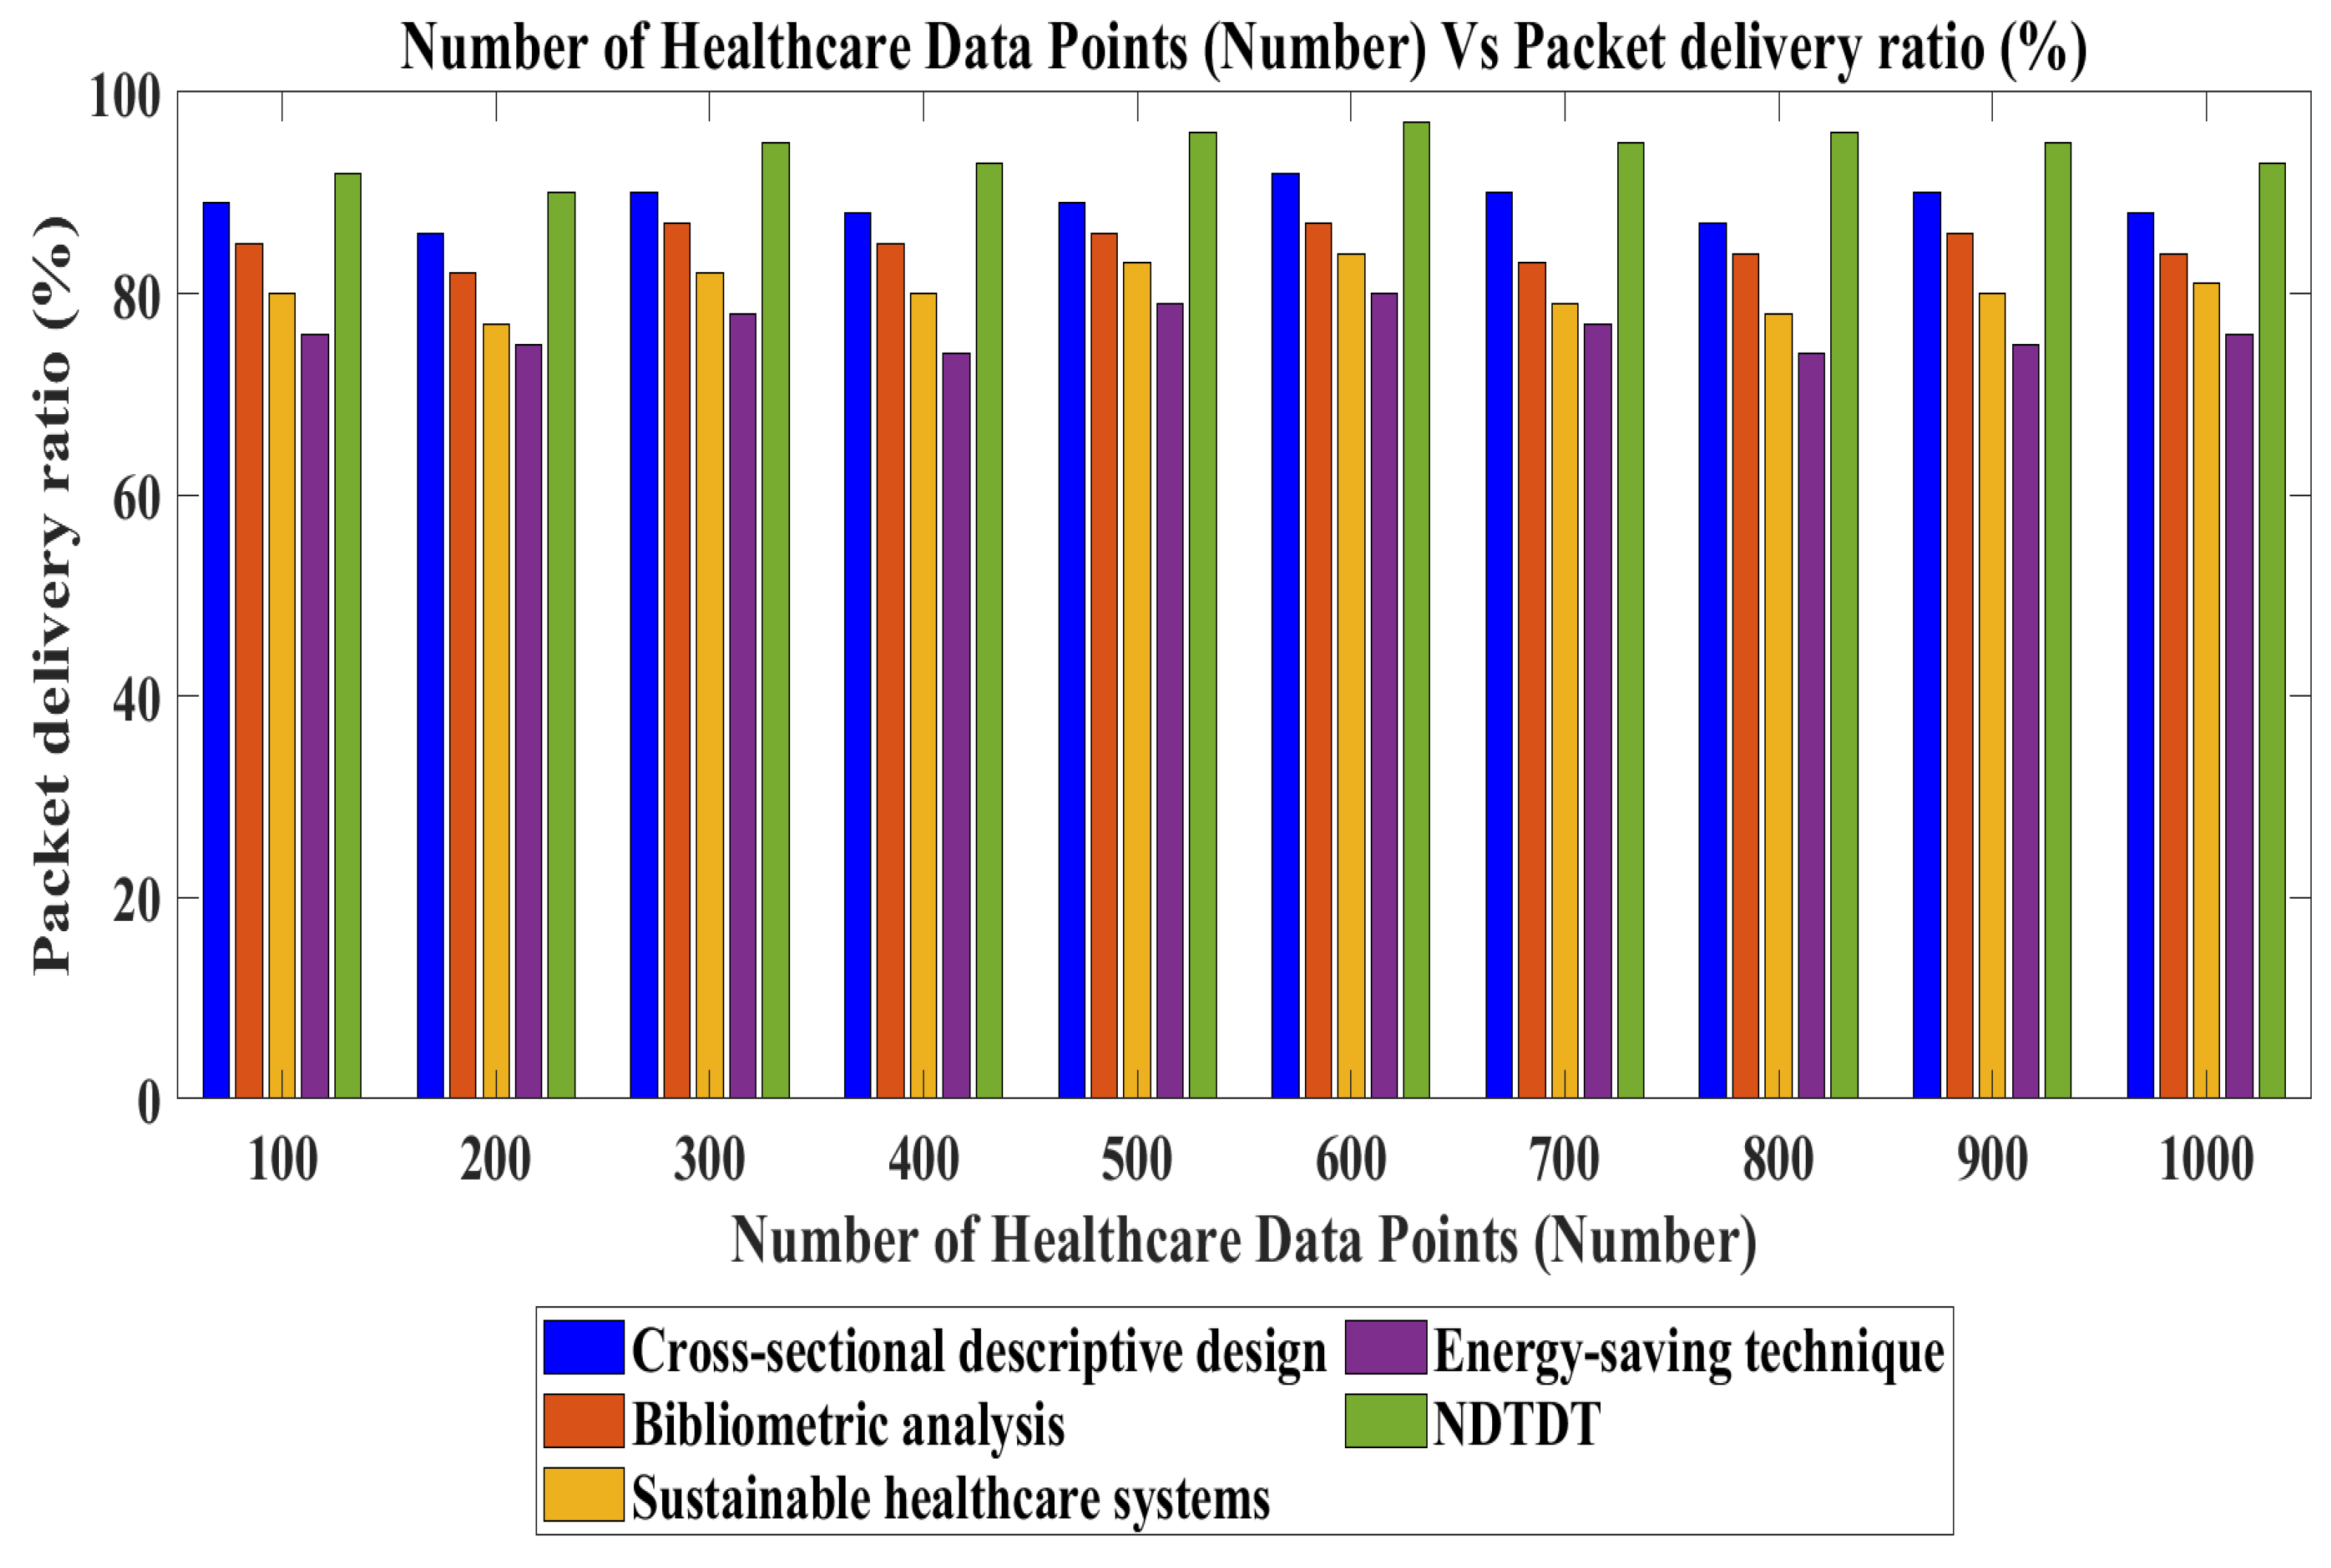
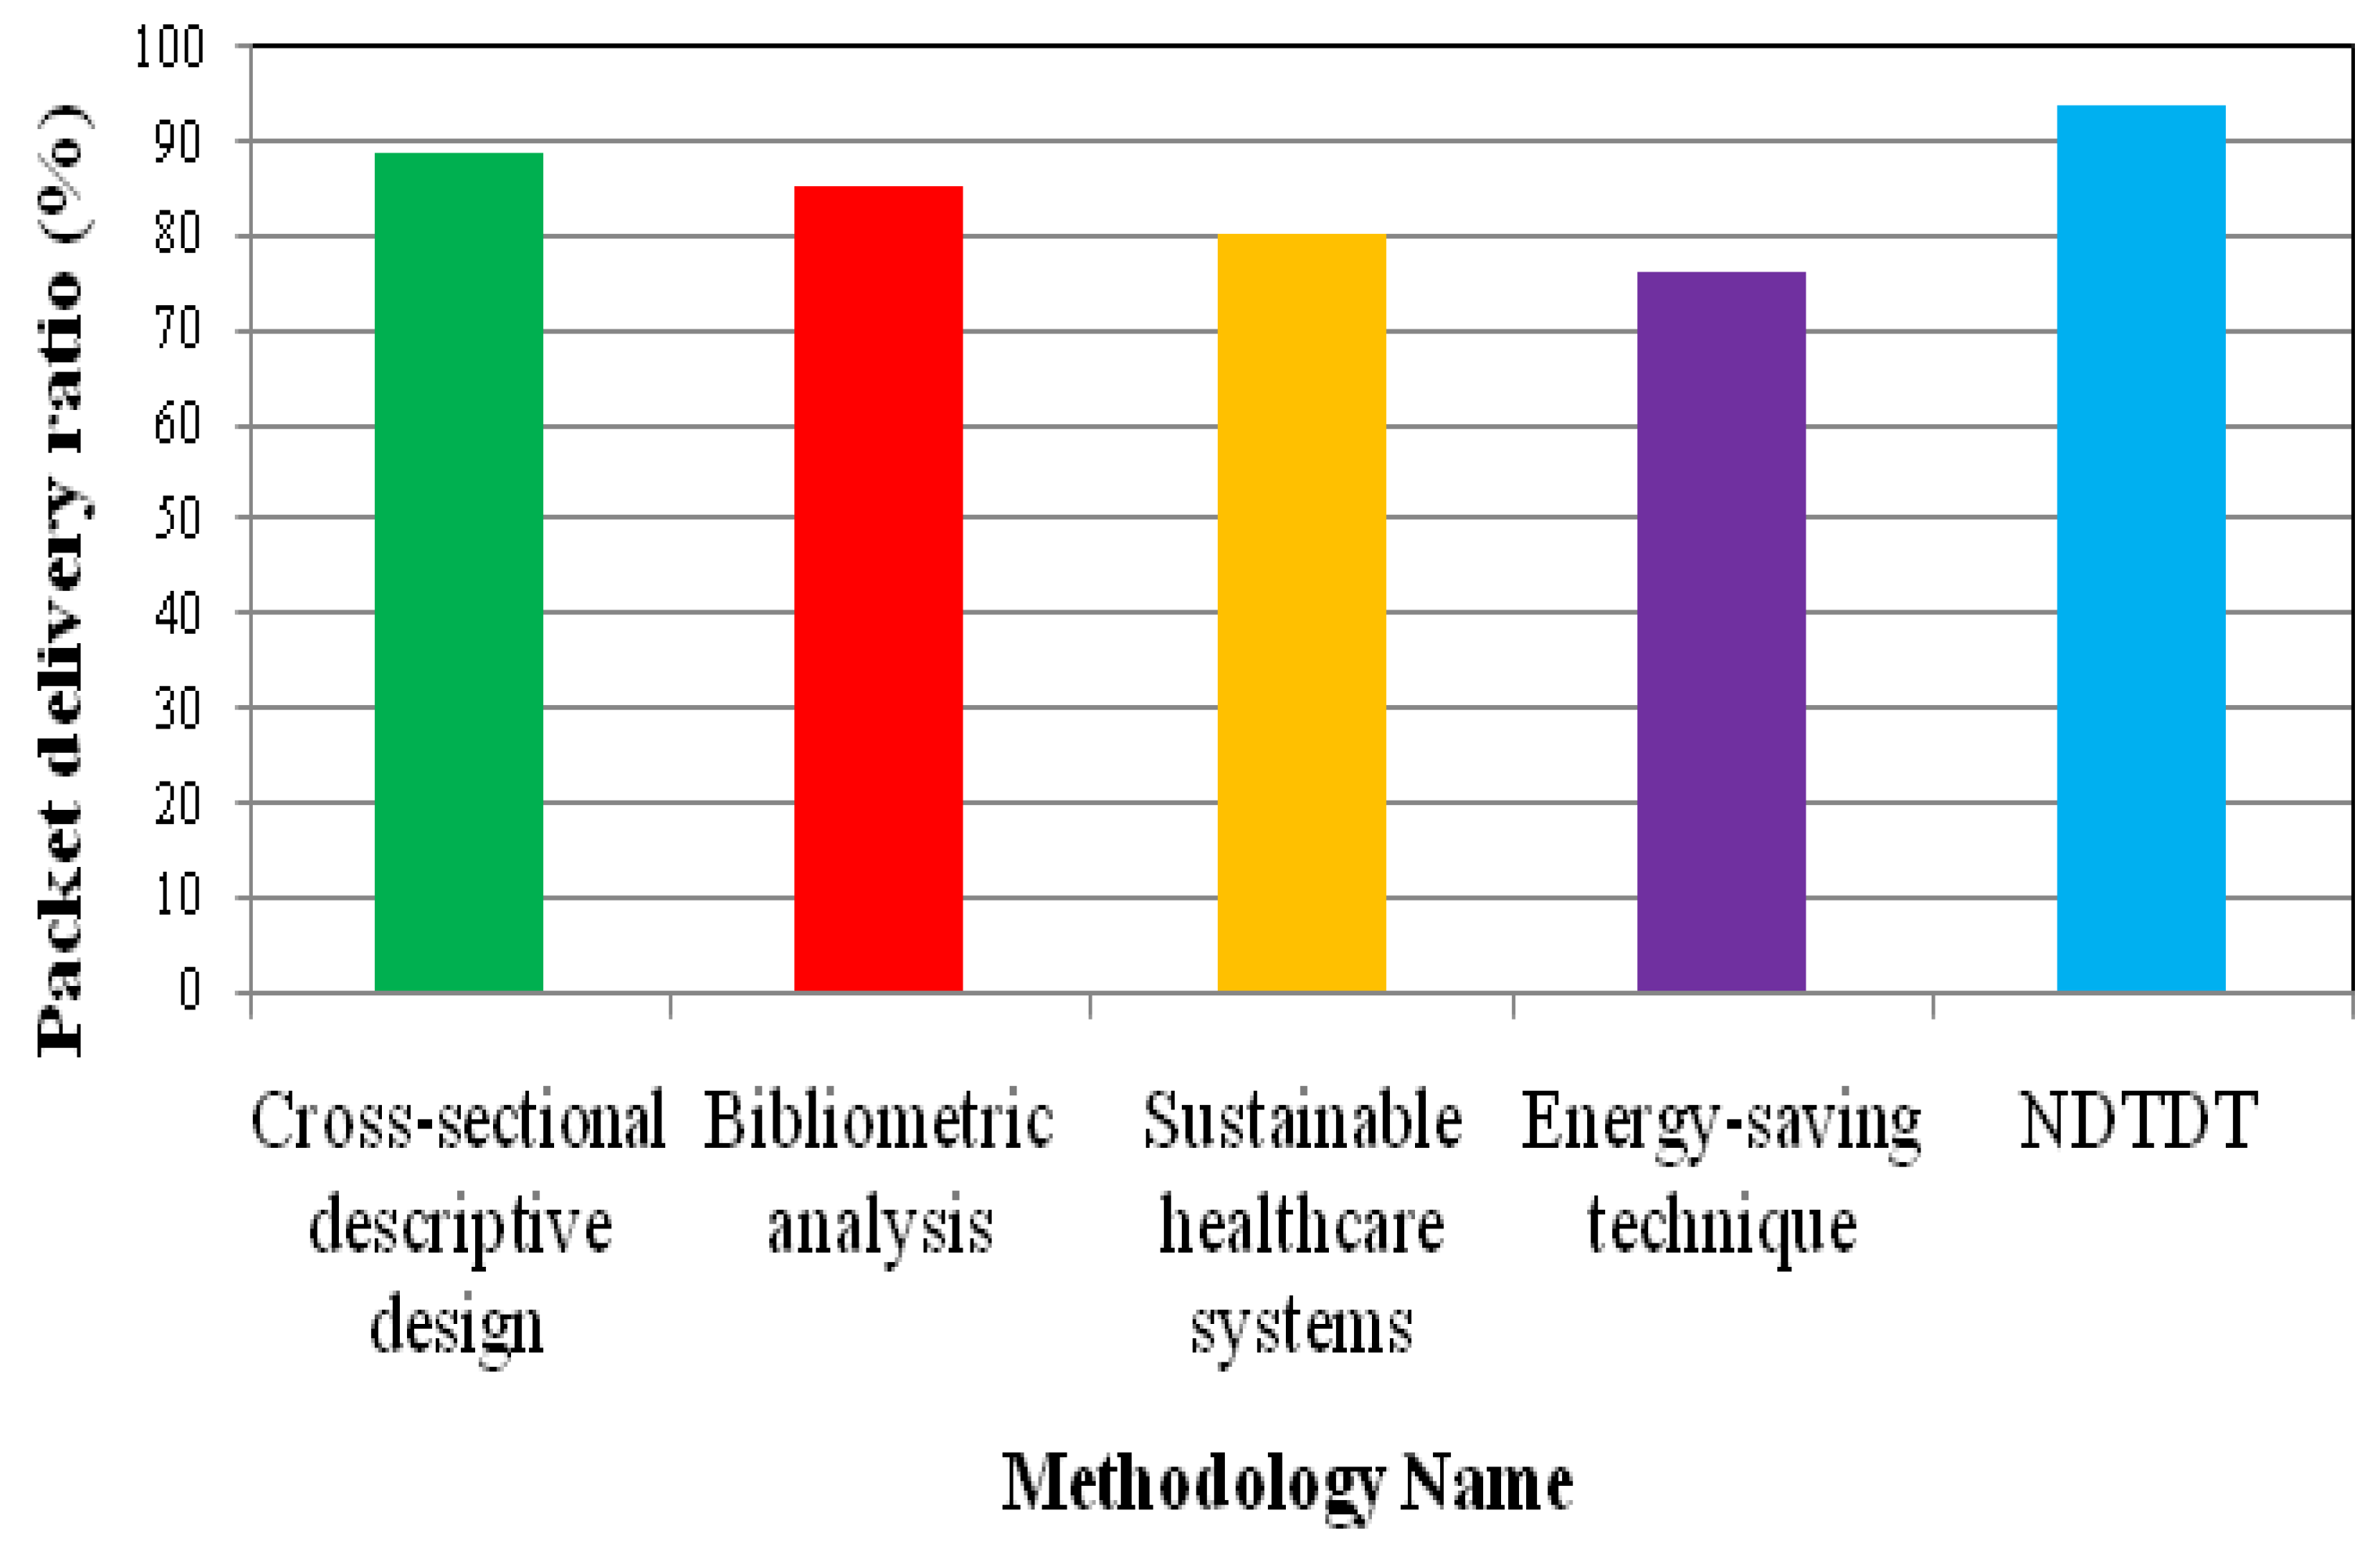
  • Impact on Packet Delivery Ratio:The Packet Delivery Ratio is the number of data packets properly received from the number of data packets sent. The formula for calculating the data security level is given below.
    P D R = Number of data packets correctly received Total number of data packets × 100
    From (1), P D R represents the Packet Delivery Ratio. It is measured in terms of milliseconds (%).
  • Impact on Efficiency: Efficiency is defined as the quality of being able to perform data transmission tasks successfully without wasting time or energy. Efficiency is described as the ratio of the number of data packets received to the number of data packets sent. It is measured in terms of percentage. It is formulated as
    E = Number of data packets received Number of data packets sent × 100
    From (2), the Efficiency E level of every method is computed. When the efficiency is higher, the method is said to be more efficient.
  • Impact on Energy Consumption: It is quantified as the amount of energy utilized by sensor nodes during operations such as sensing and data forwarding. This measurement is expressed in joules.
    E C = i = 1 n S n i × E C ( SSn )
    From (3), E C indicates the Energy Consumption, and S n i refers to each individual sensor node i in the network. n indicates the number of sensor nodes S n i . E C ( S S n ) represents the energy consumption for single sensor node S n i .
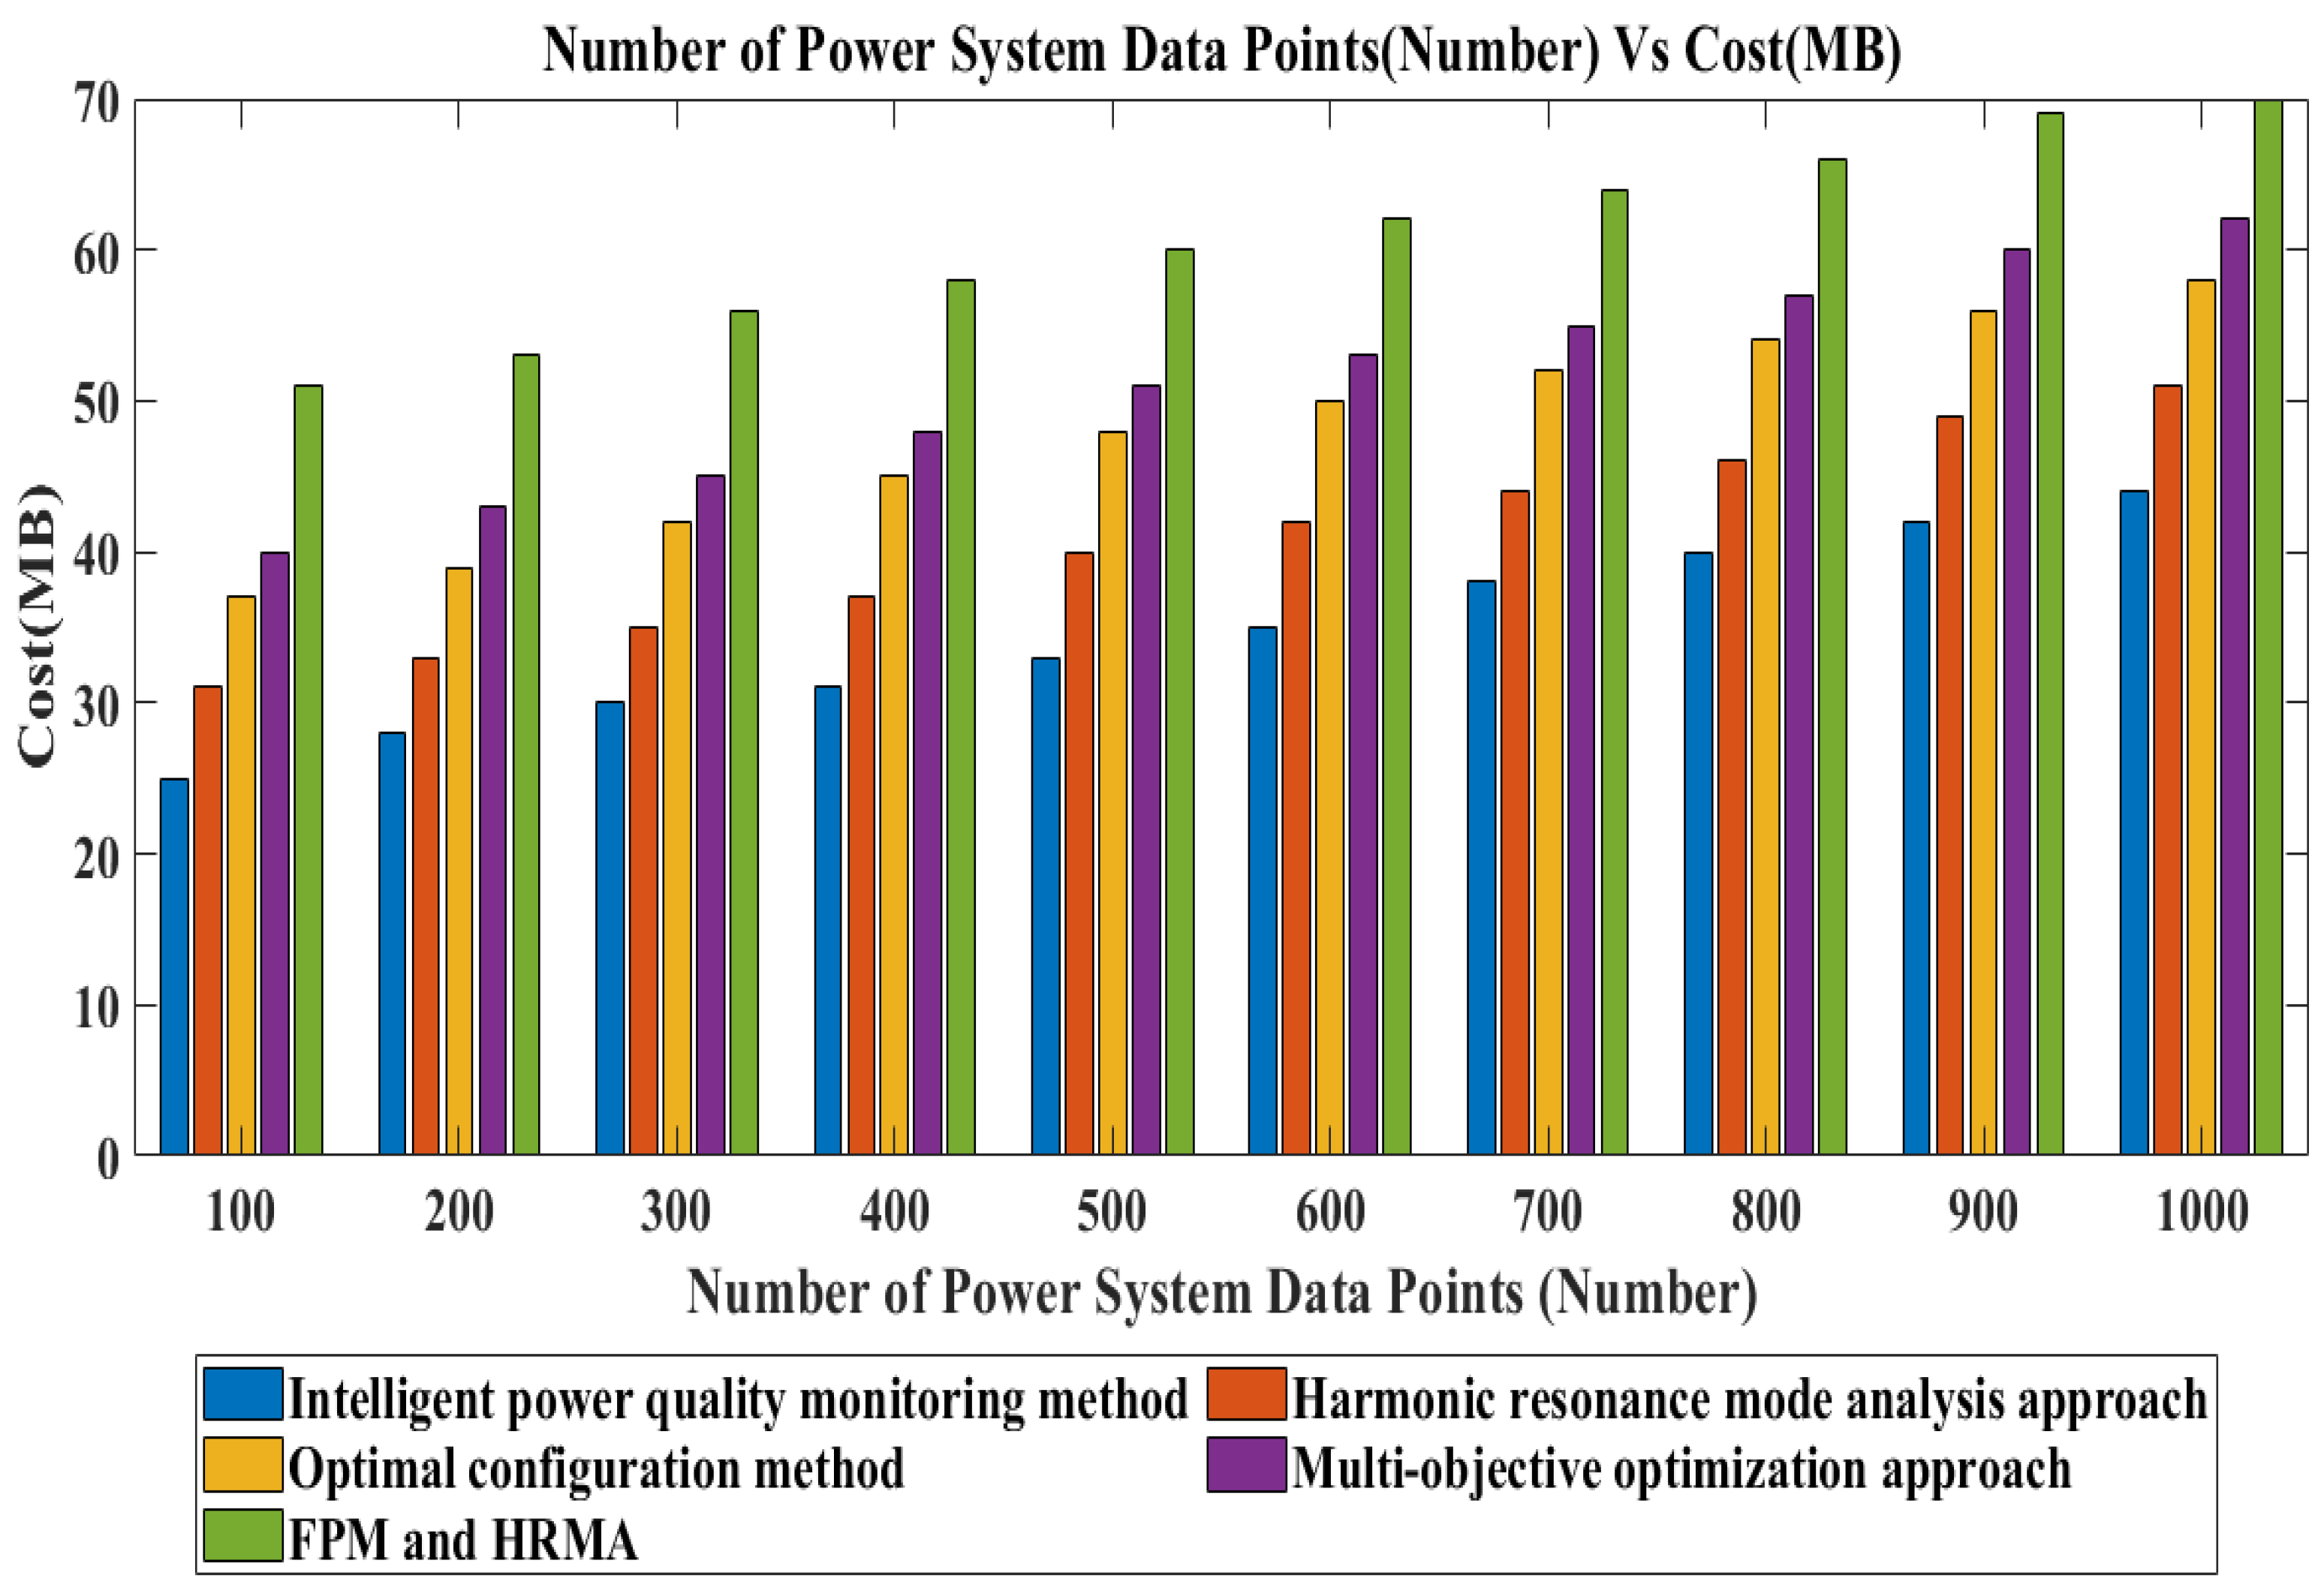
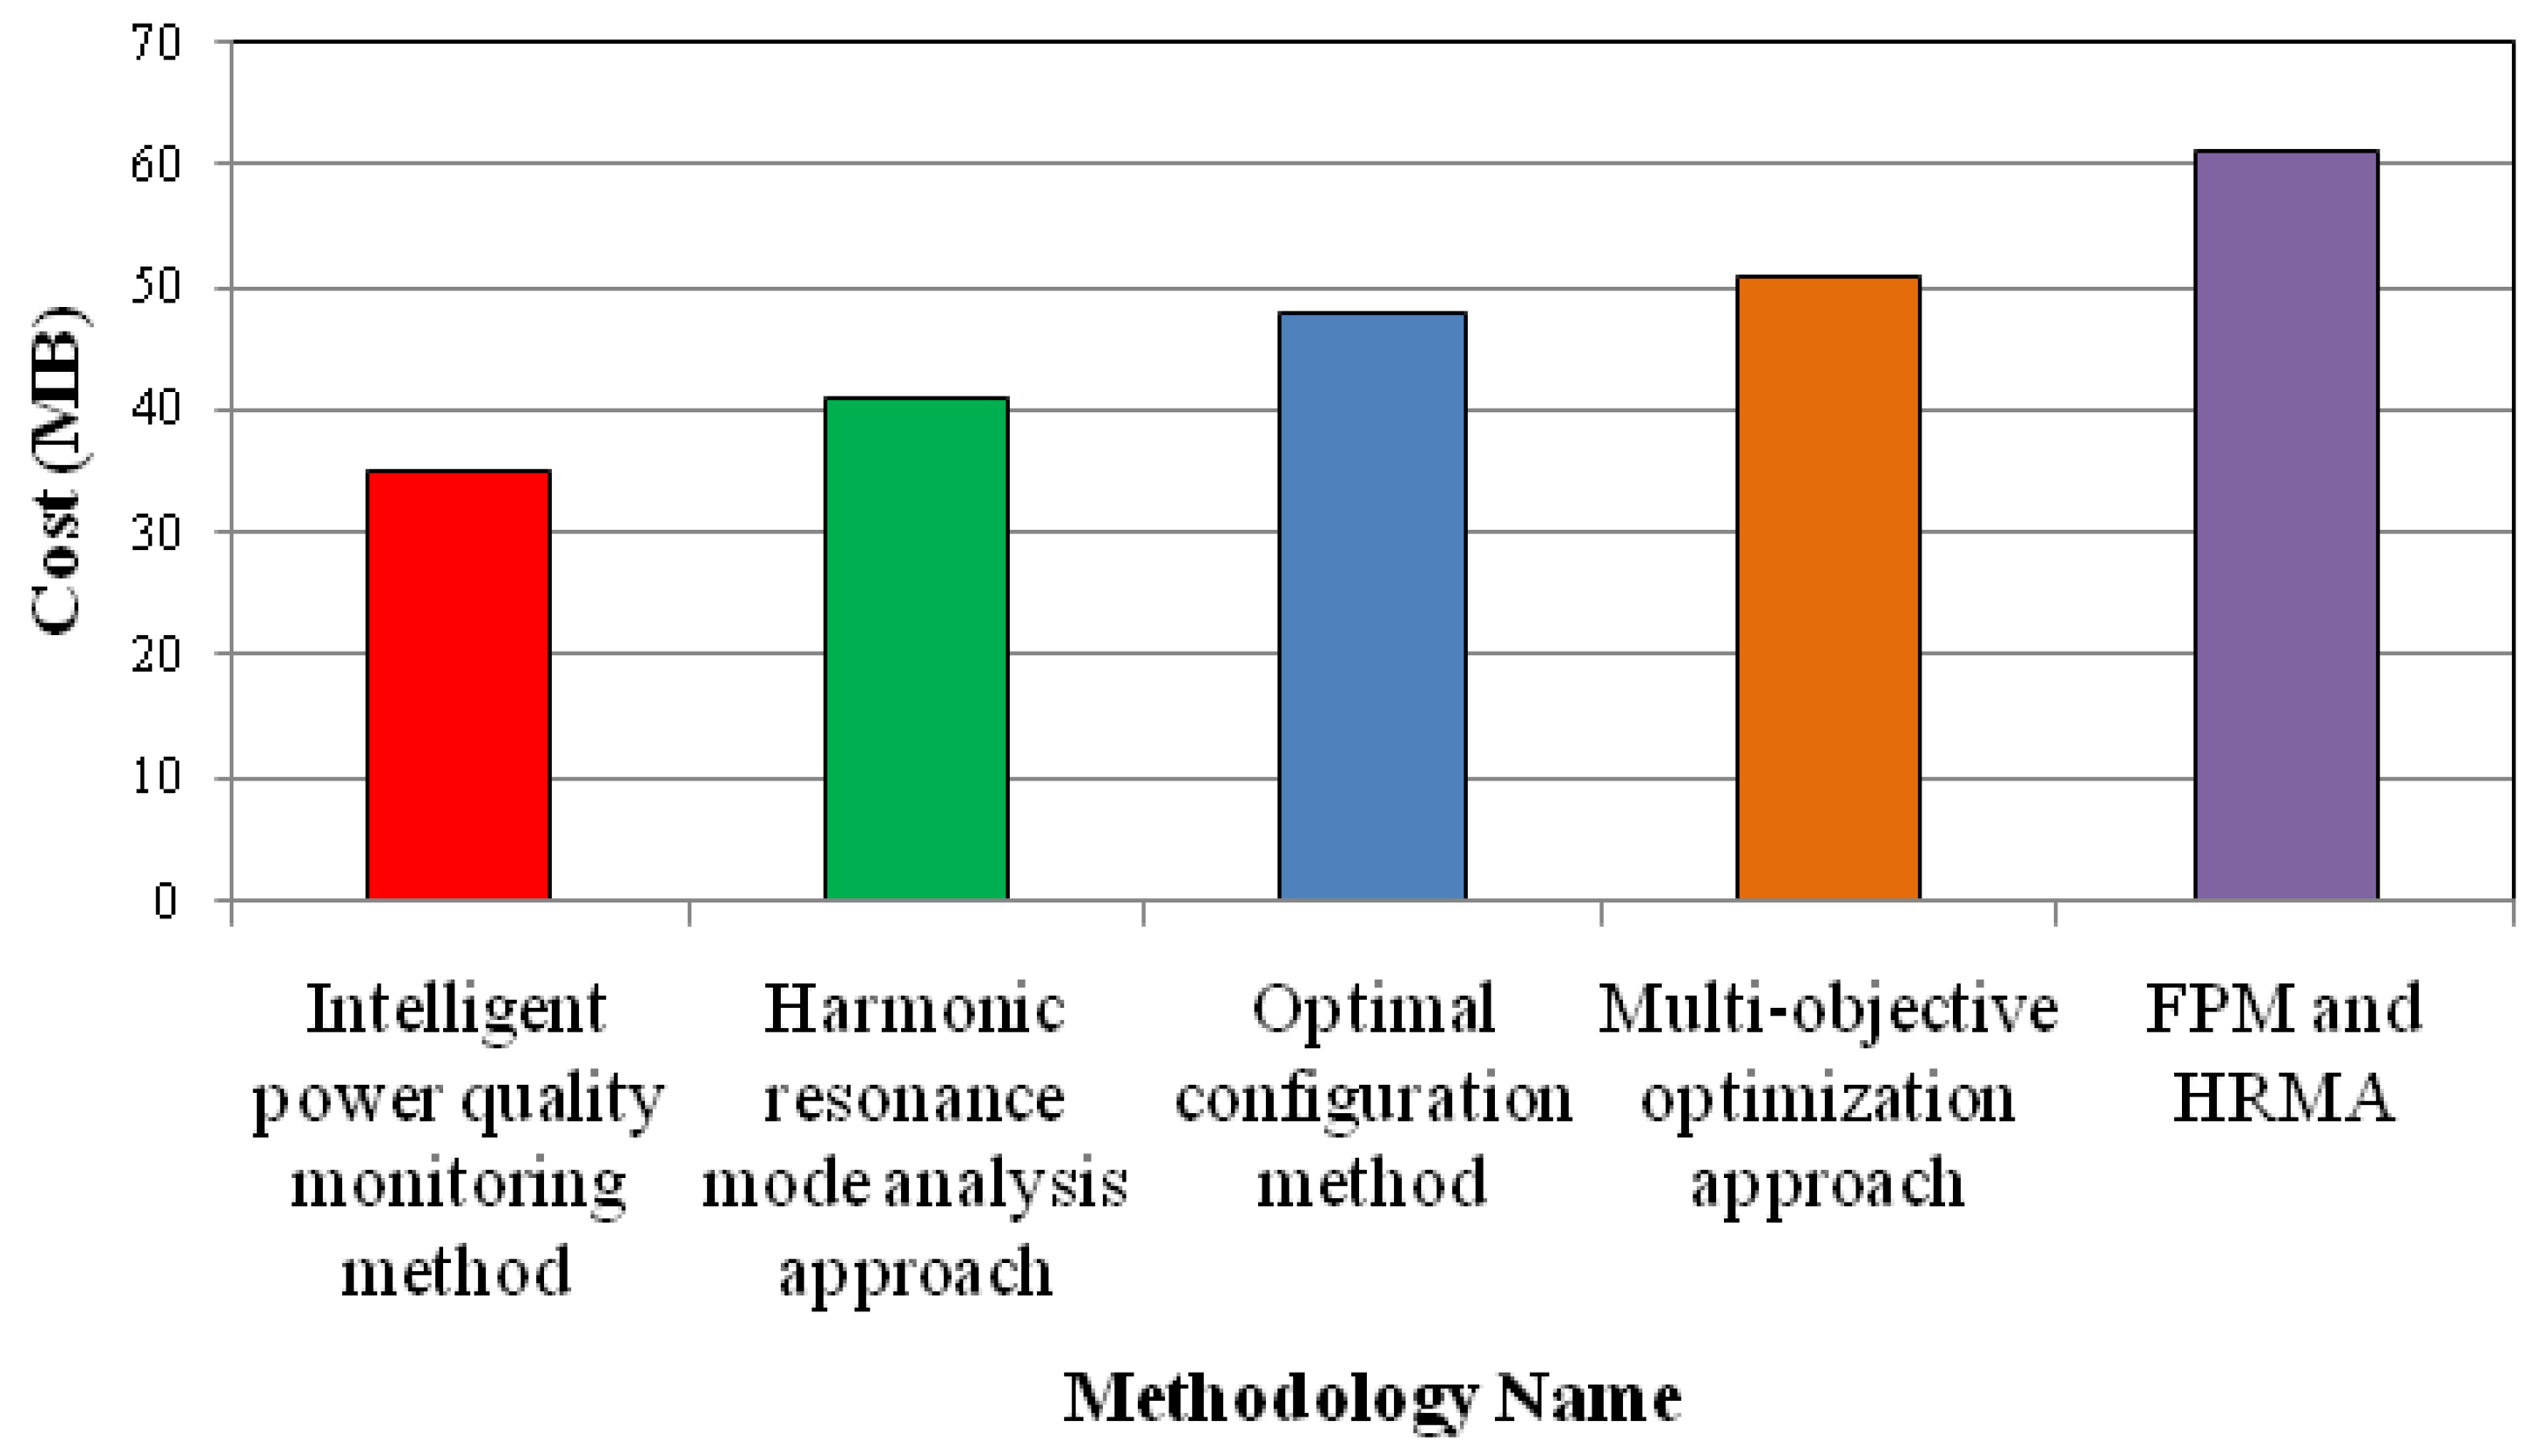
  • Impact on Cost: It is defined as the amount of memory consumed to perform efficient power system monitoring with the help of sensor nodes. It is measured in terms of megabytes. It is formulated as
    C o s t = i = 1 n S n i × Memory ( consumed by one sensor node )
    From (4), the Cost C o s t is determined. S n i refers to each individual sensor node i in the network. n indicates the number of sensor nodes S n i , and M e m o r y ( c o n s u m e d b y o n e s e n s o r n o d e ) indicates the memory used by a single sensor node. When the cost is lower, the method is said to be more efficient.
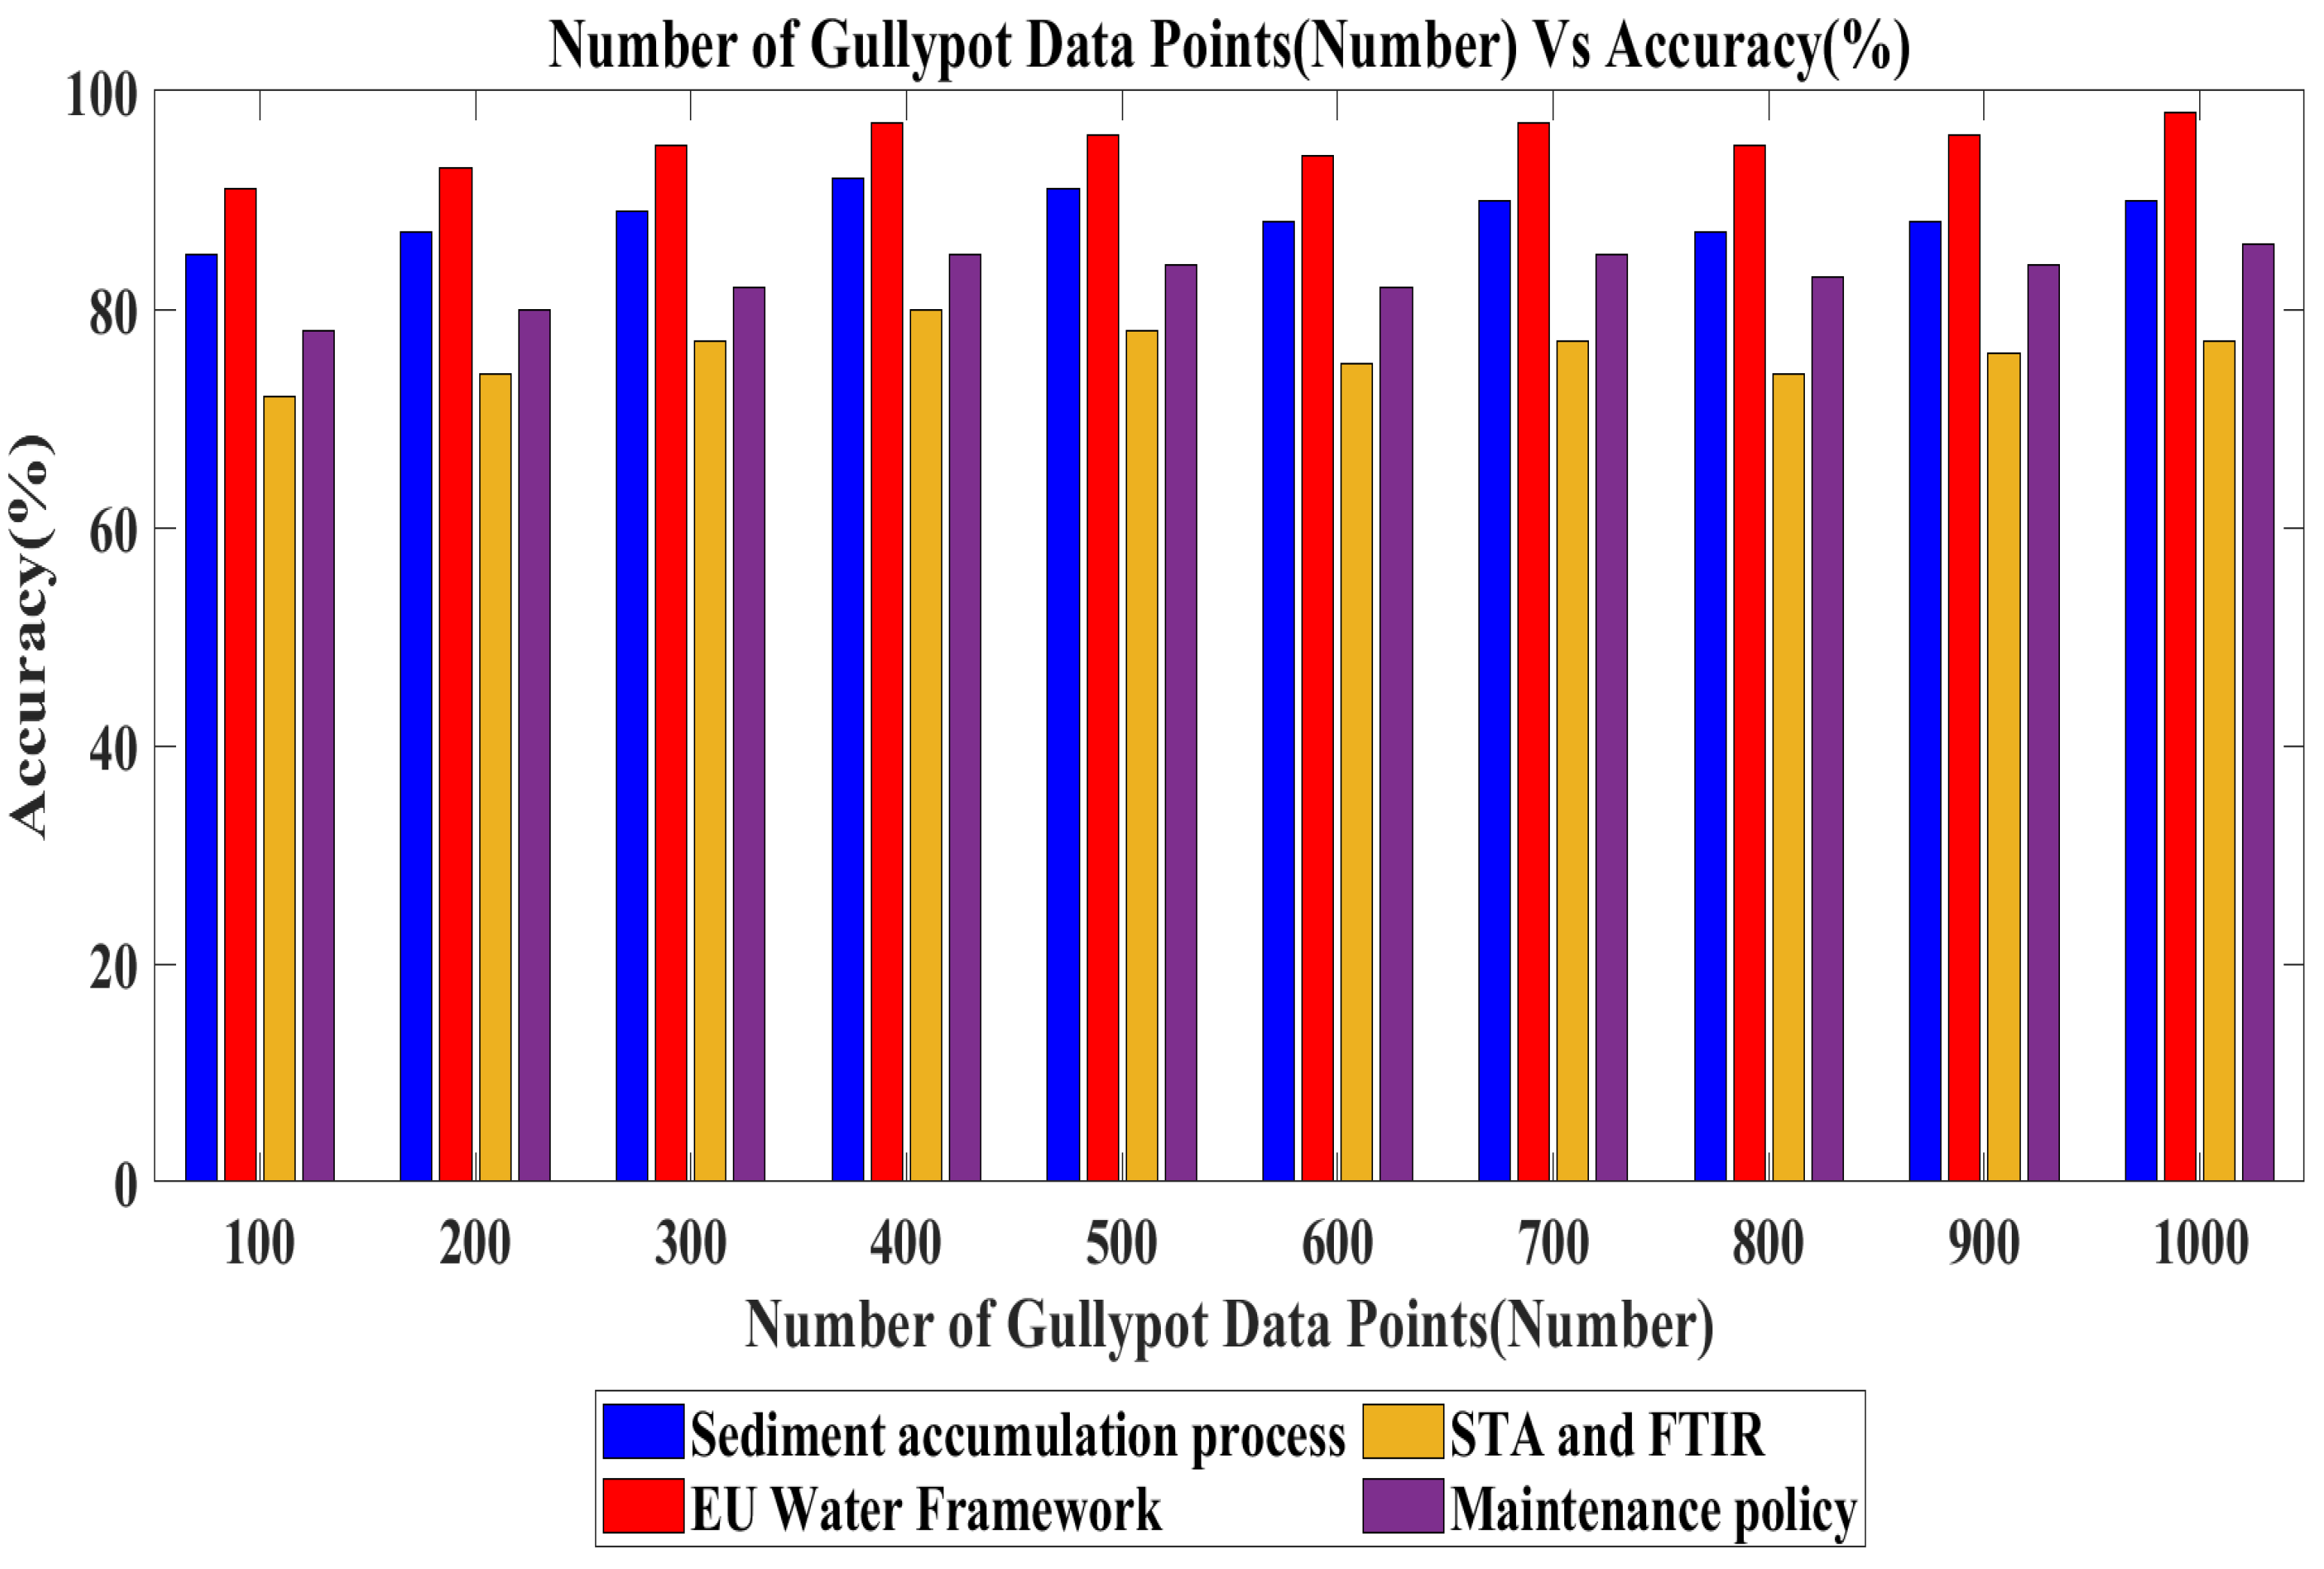
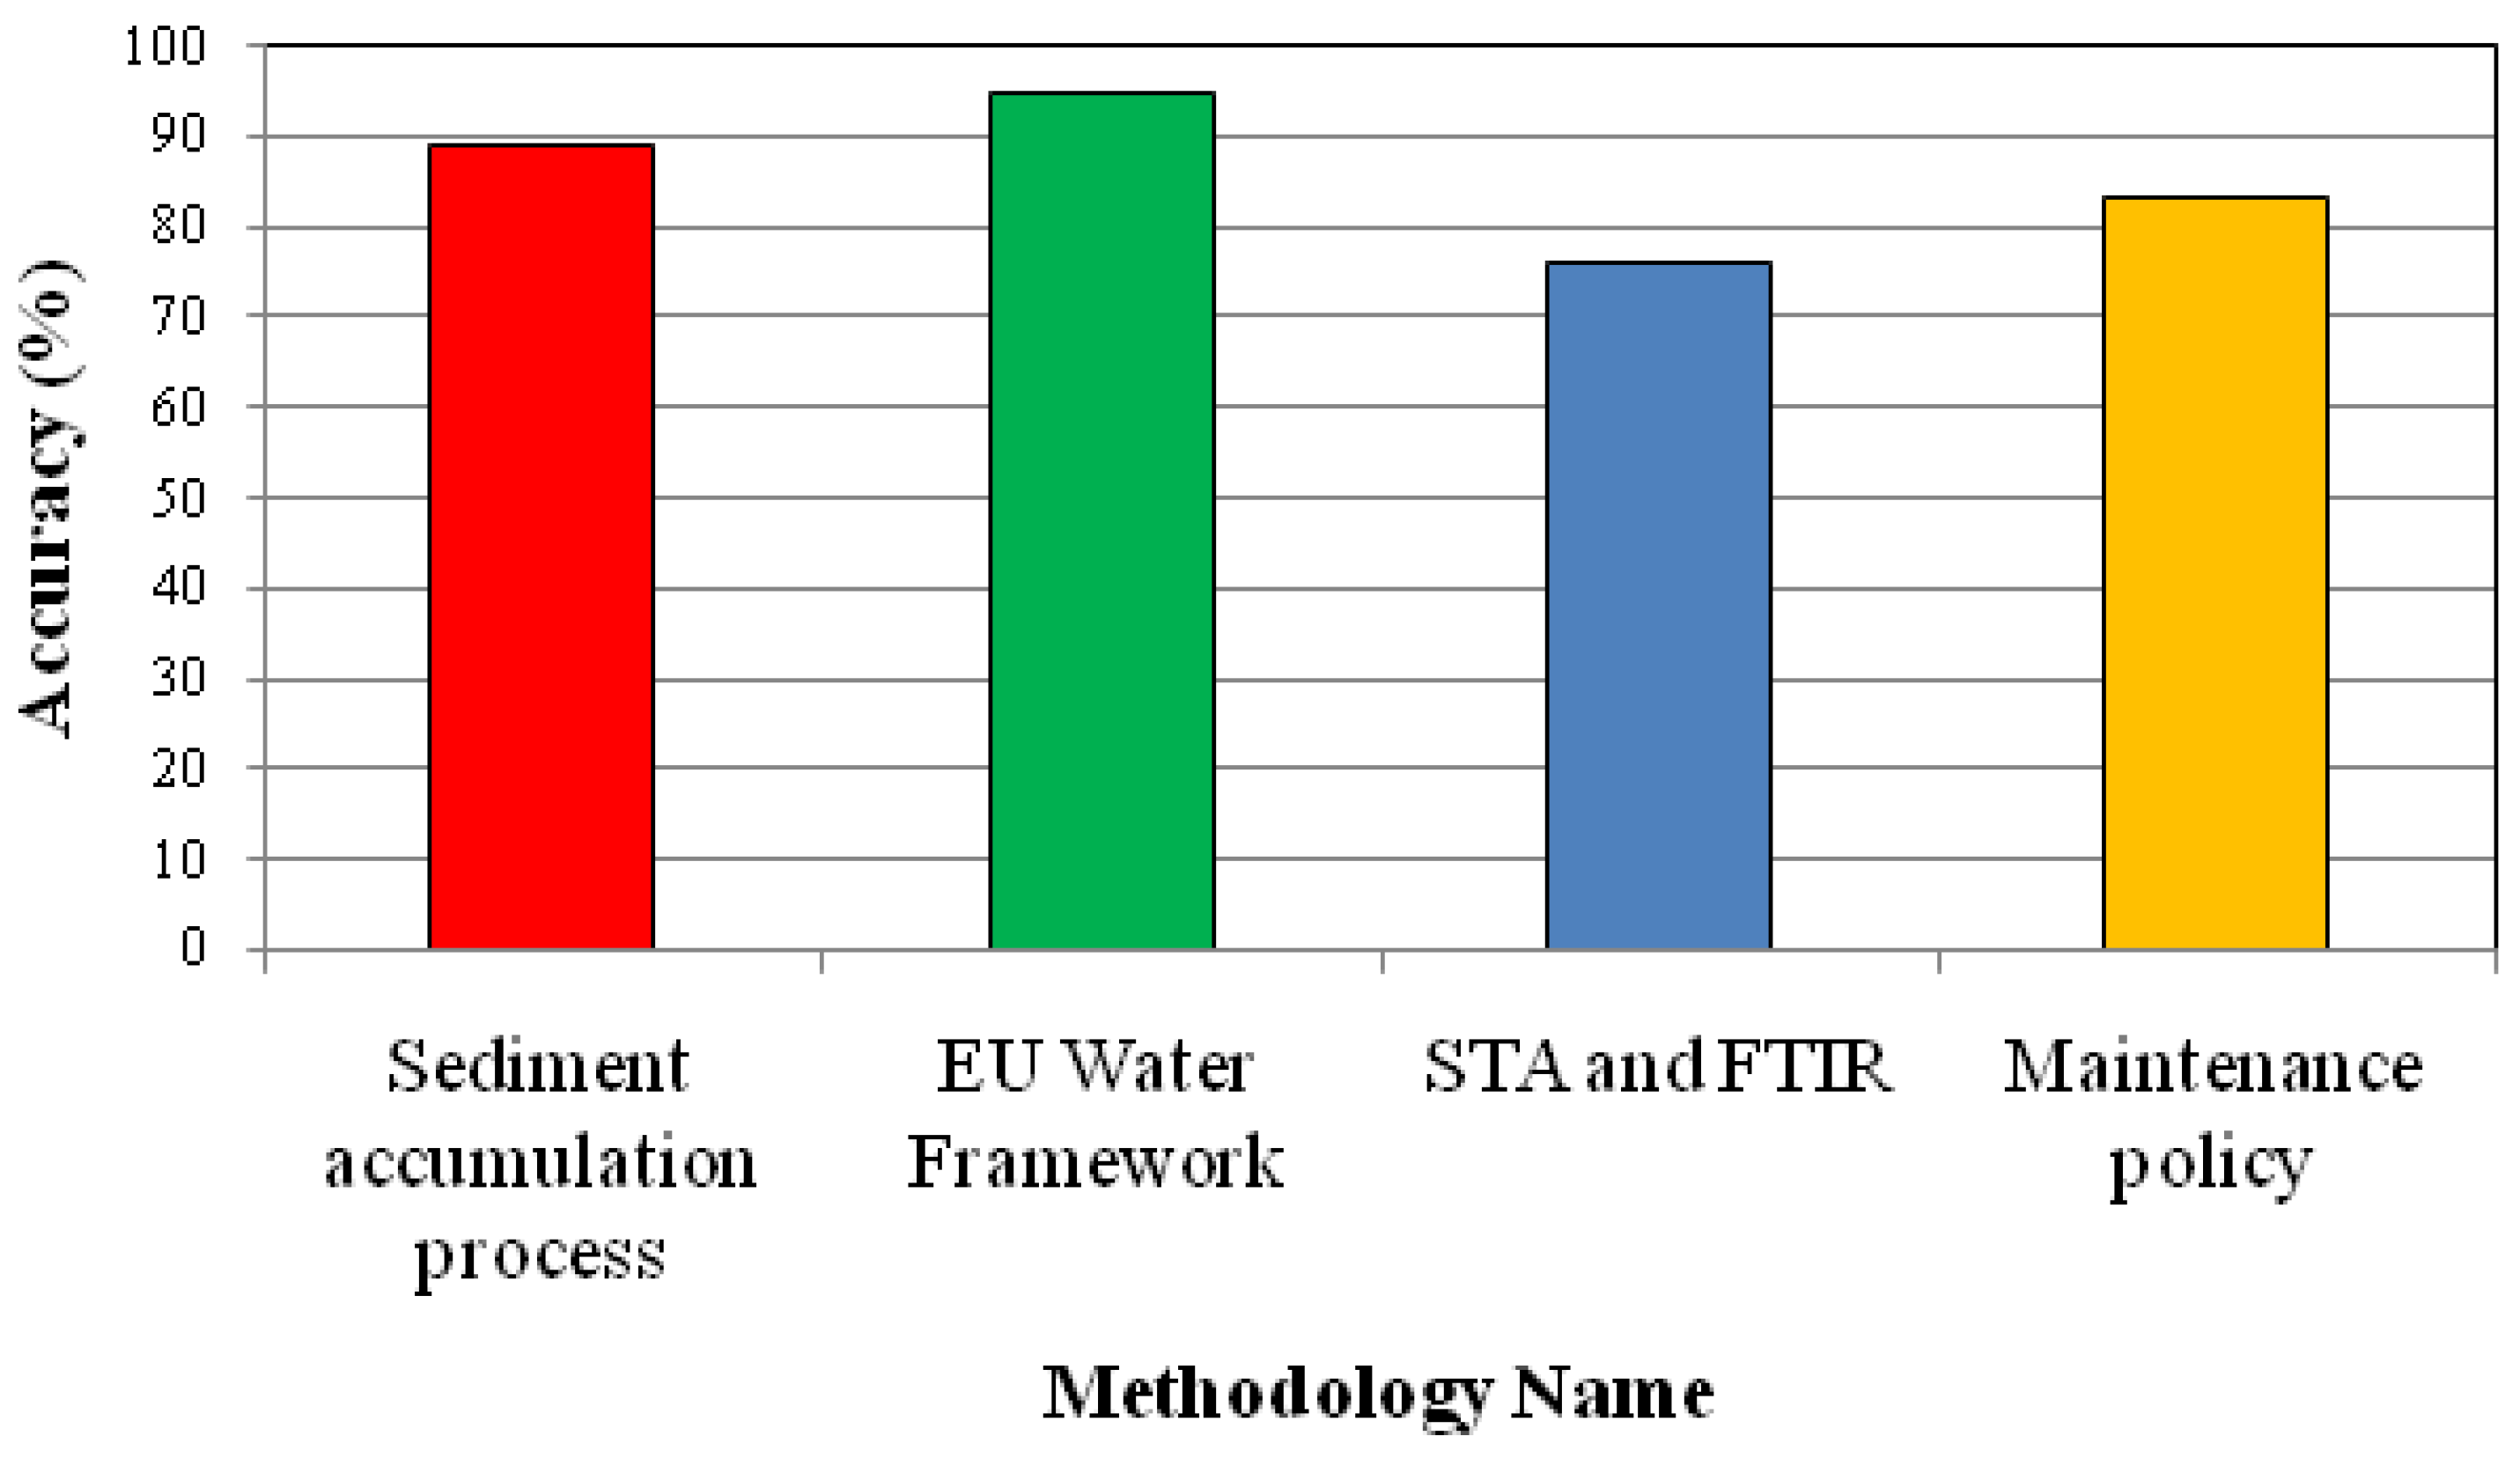
  • Impact on Accuracy: It is defined as the ratio of the number of data points that are accurately delivered to the base station. It is measured in terms of percentage (%). It is formulated as
    A c c u r a c y = Number of data points accurately delivered Number of data points sent × 100
    From (5), the Accuracy is determined. When the accuracy level is higher, the method is said to be more efficient.
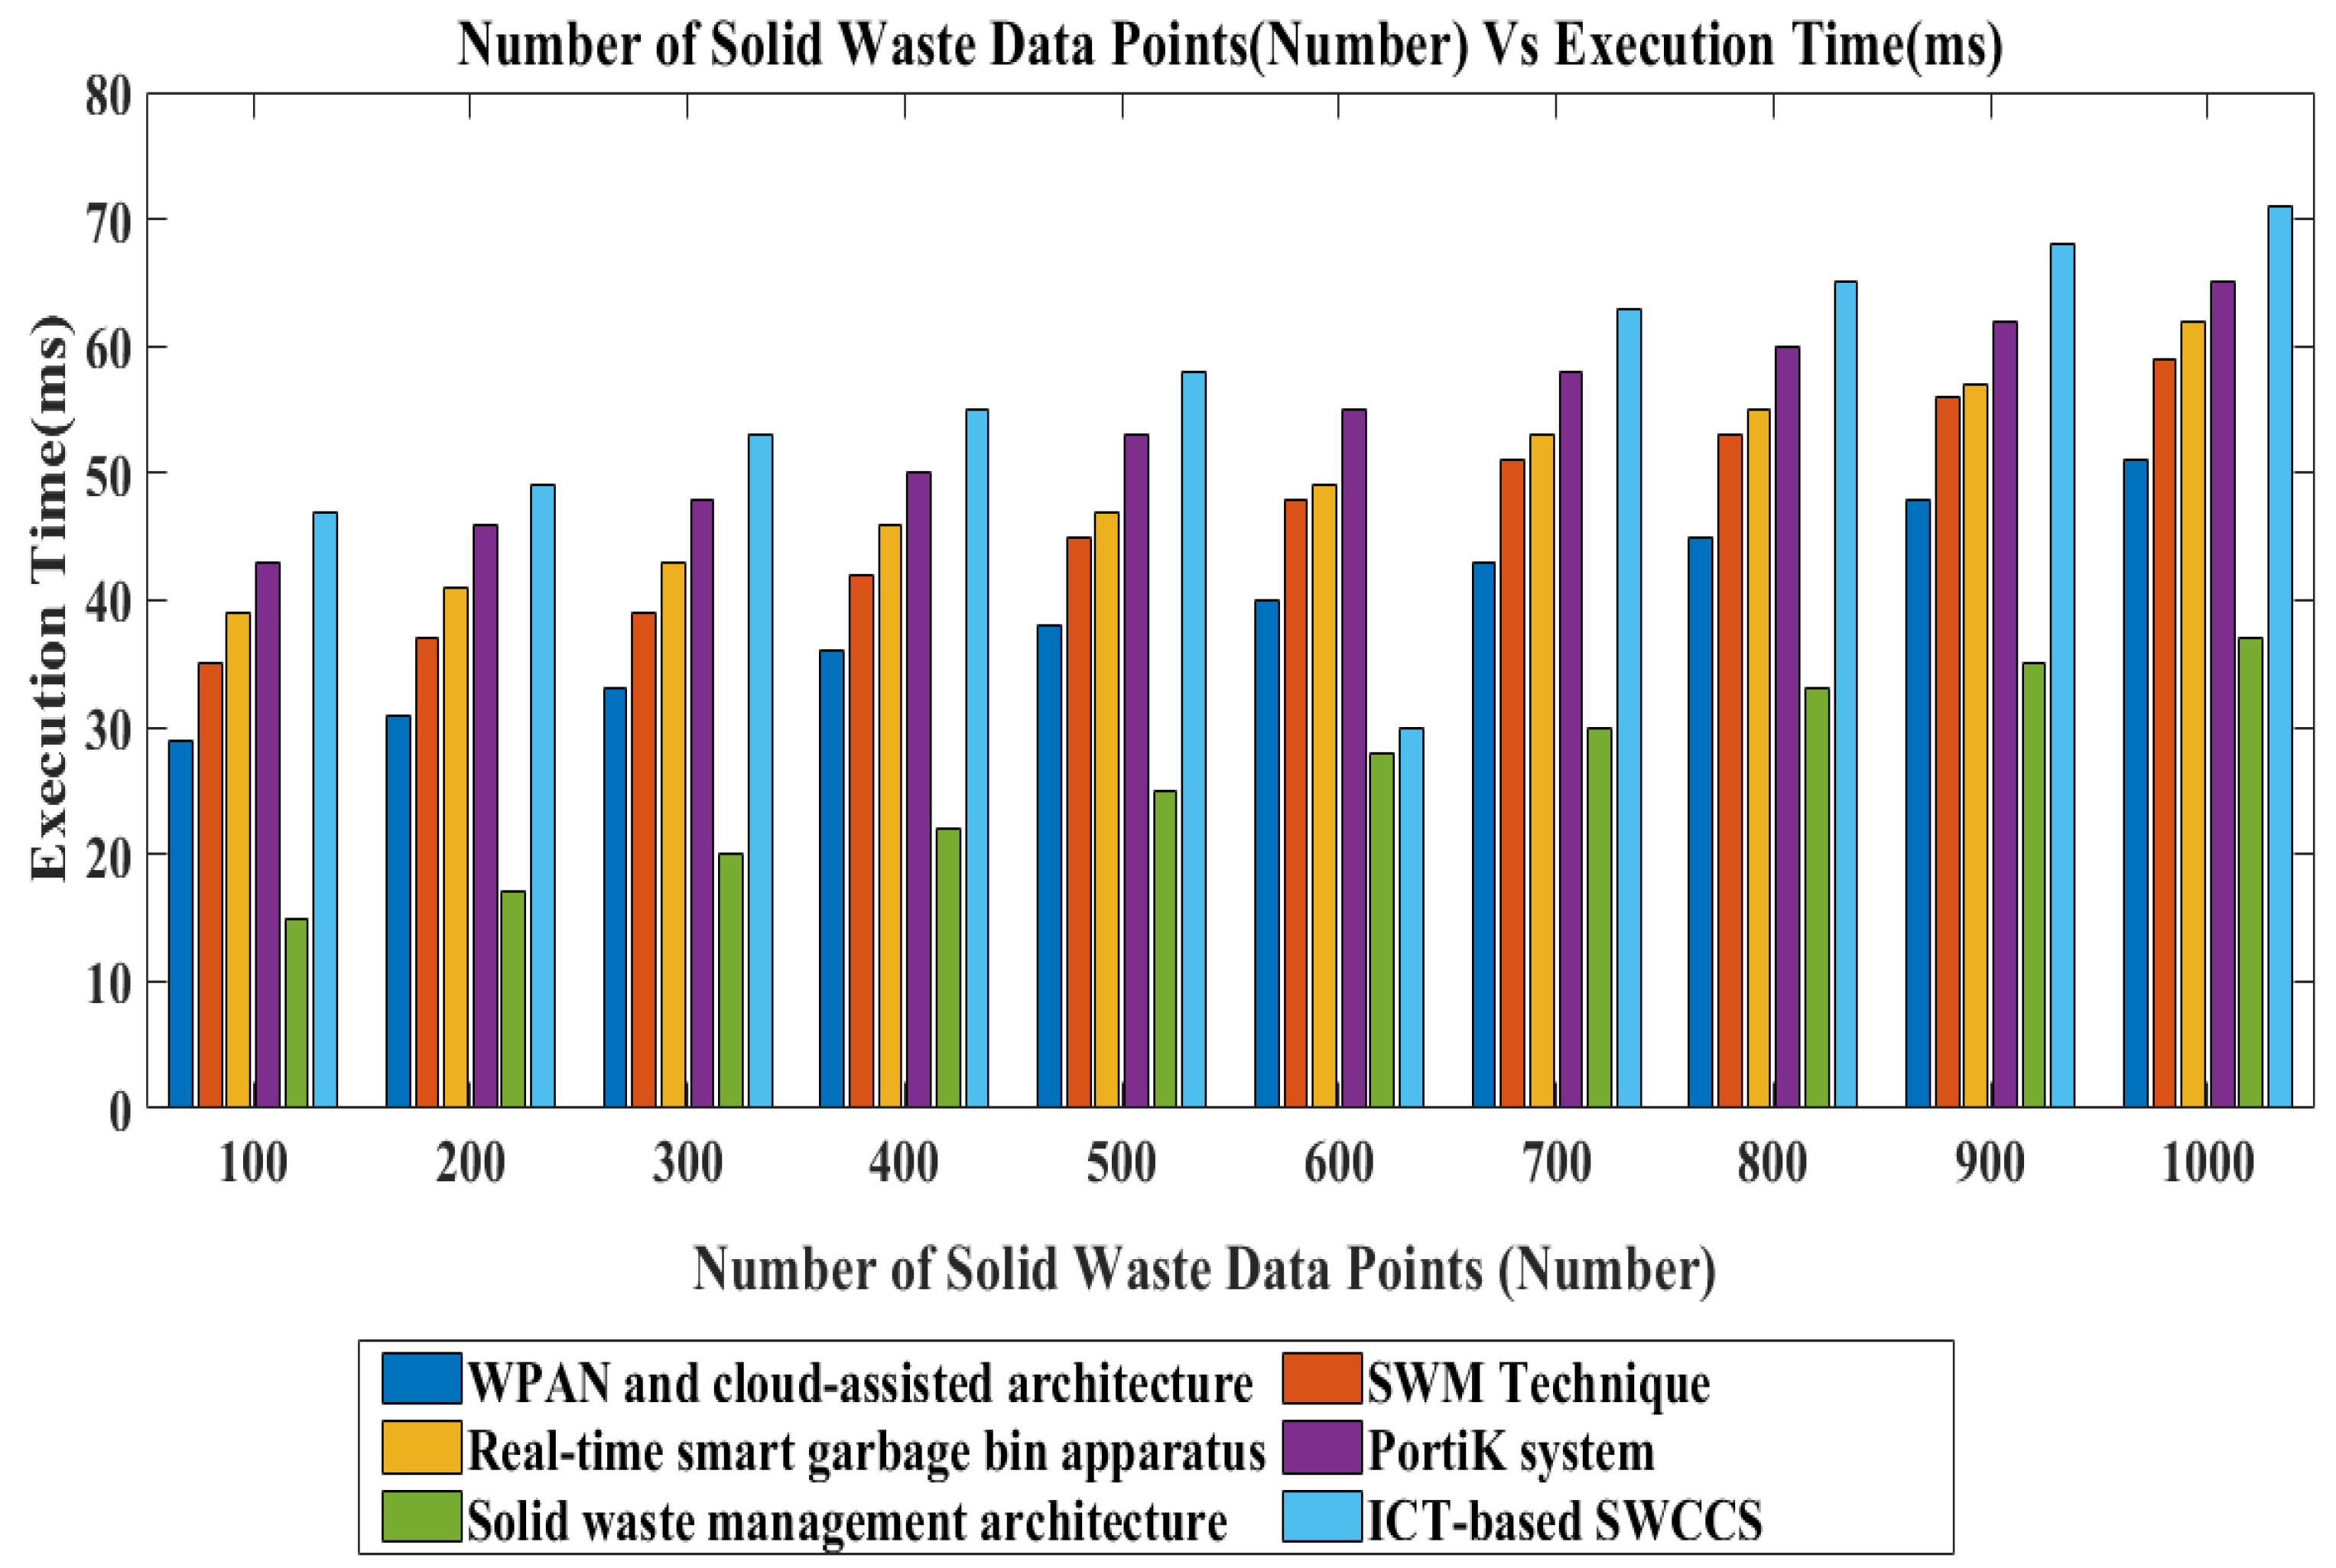
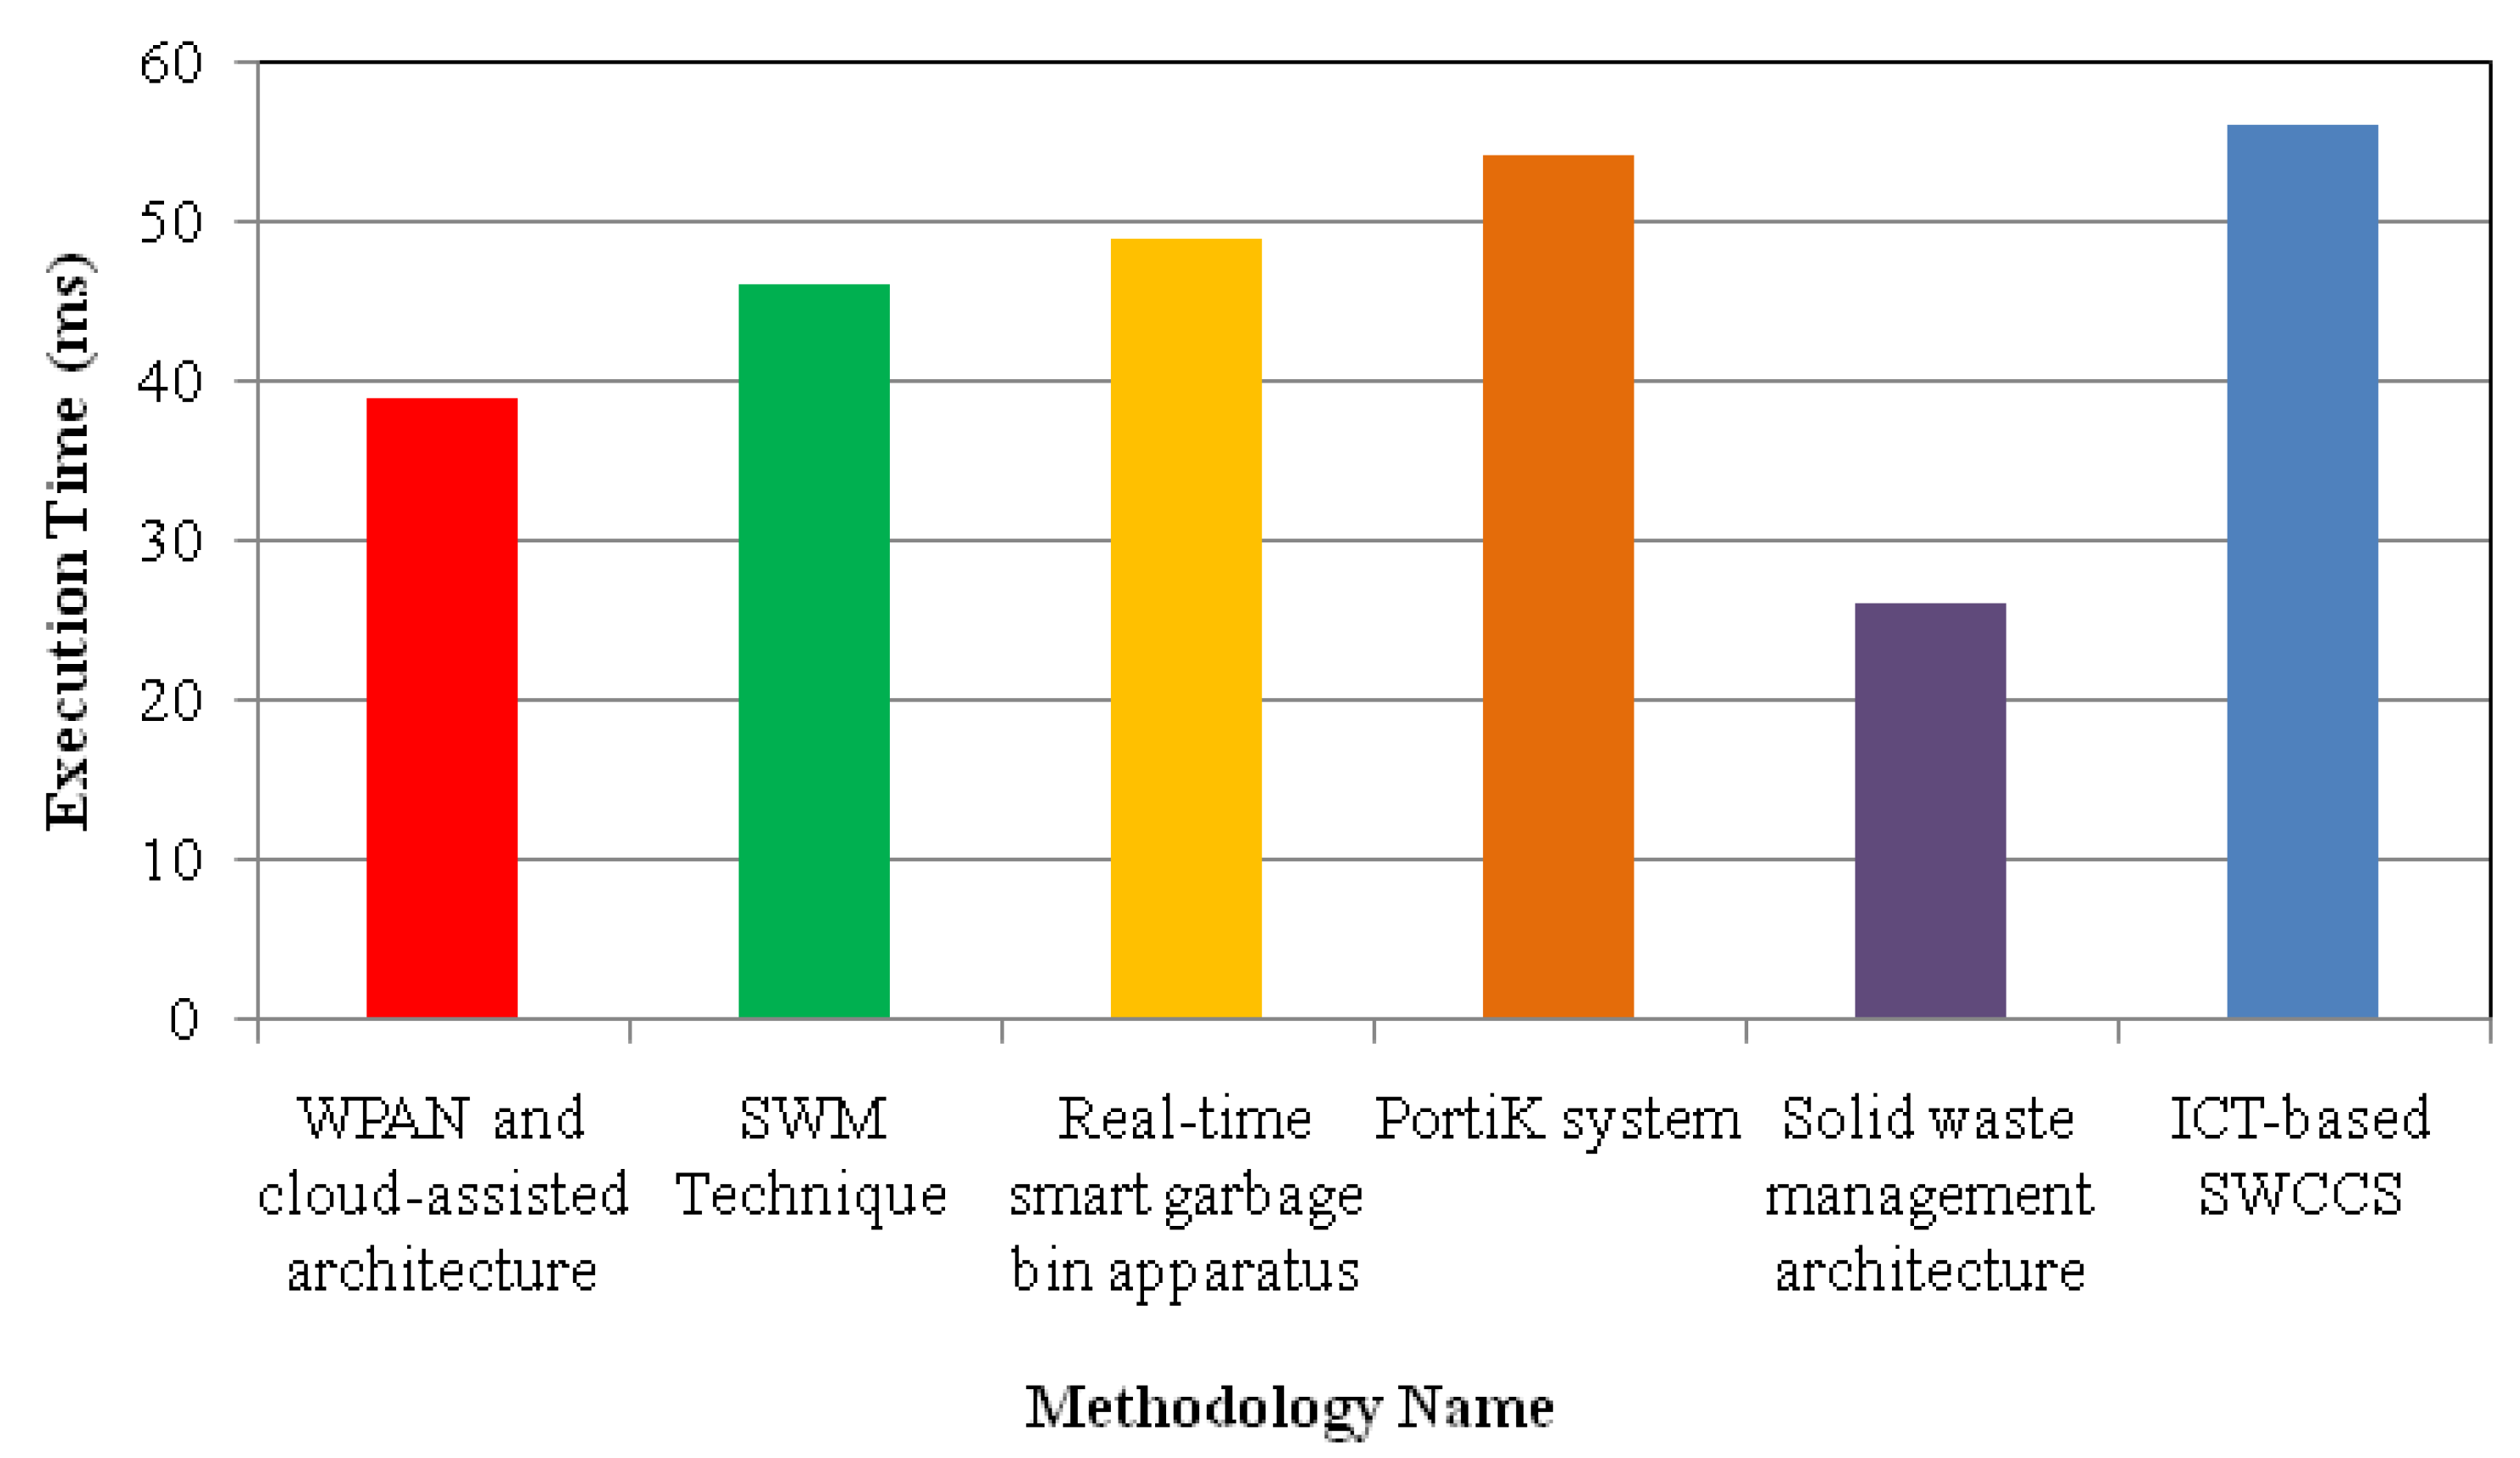
  • Impact on Execution Time: It is defined as the product of the number of sensor nodes and the time consumed by one sensor node. It is measured in terms of milliseconds (ms). It is calculated as
    E T = i = 1 n S n i × Time ( consumed by one sensor node )
    From (6), the Execution Time E T is determined. S n i refers to each individual sensor node i in the network. n indicates the number of sensor nodes S n i . T i m e ( c o n s u m e d b y o n e s e n s o r n o d e ) indicates the time taken by a single sensor node to complete its tasks. When the execution time is less, the method is said to be more efficient.
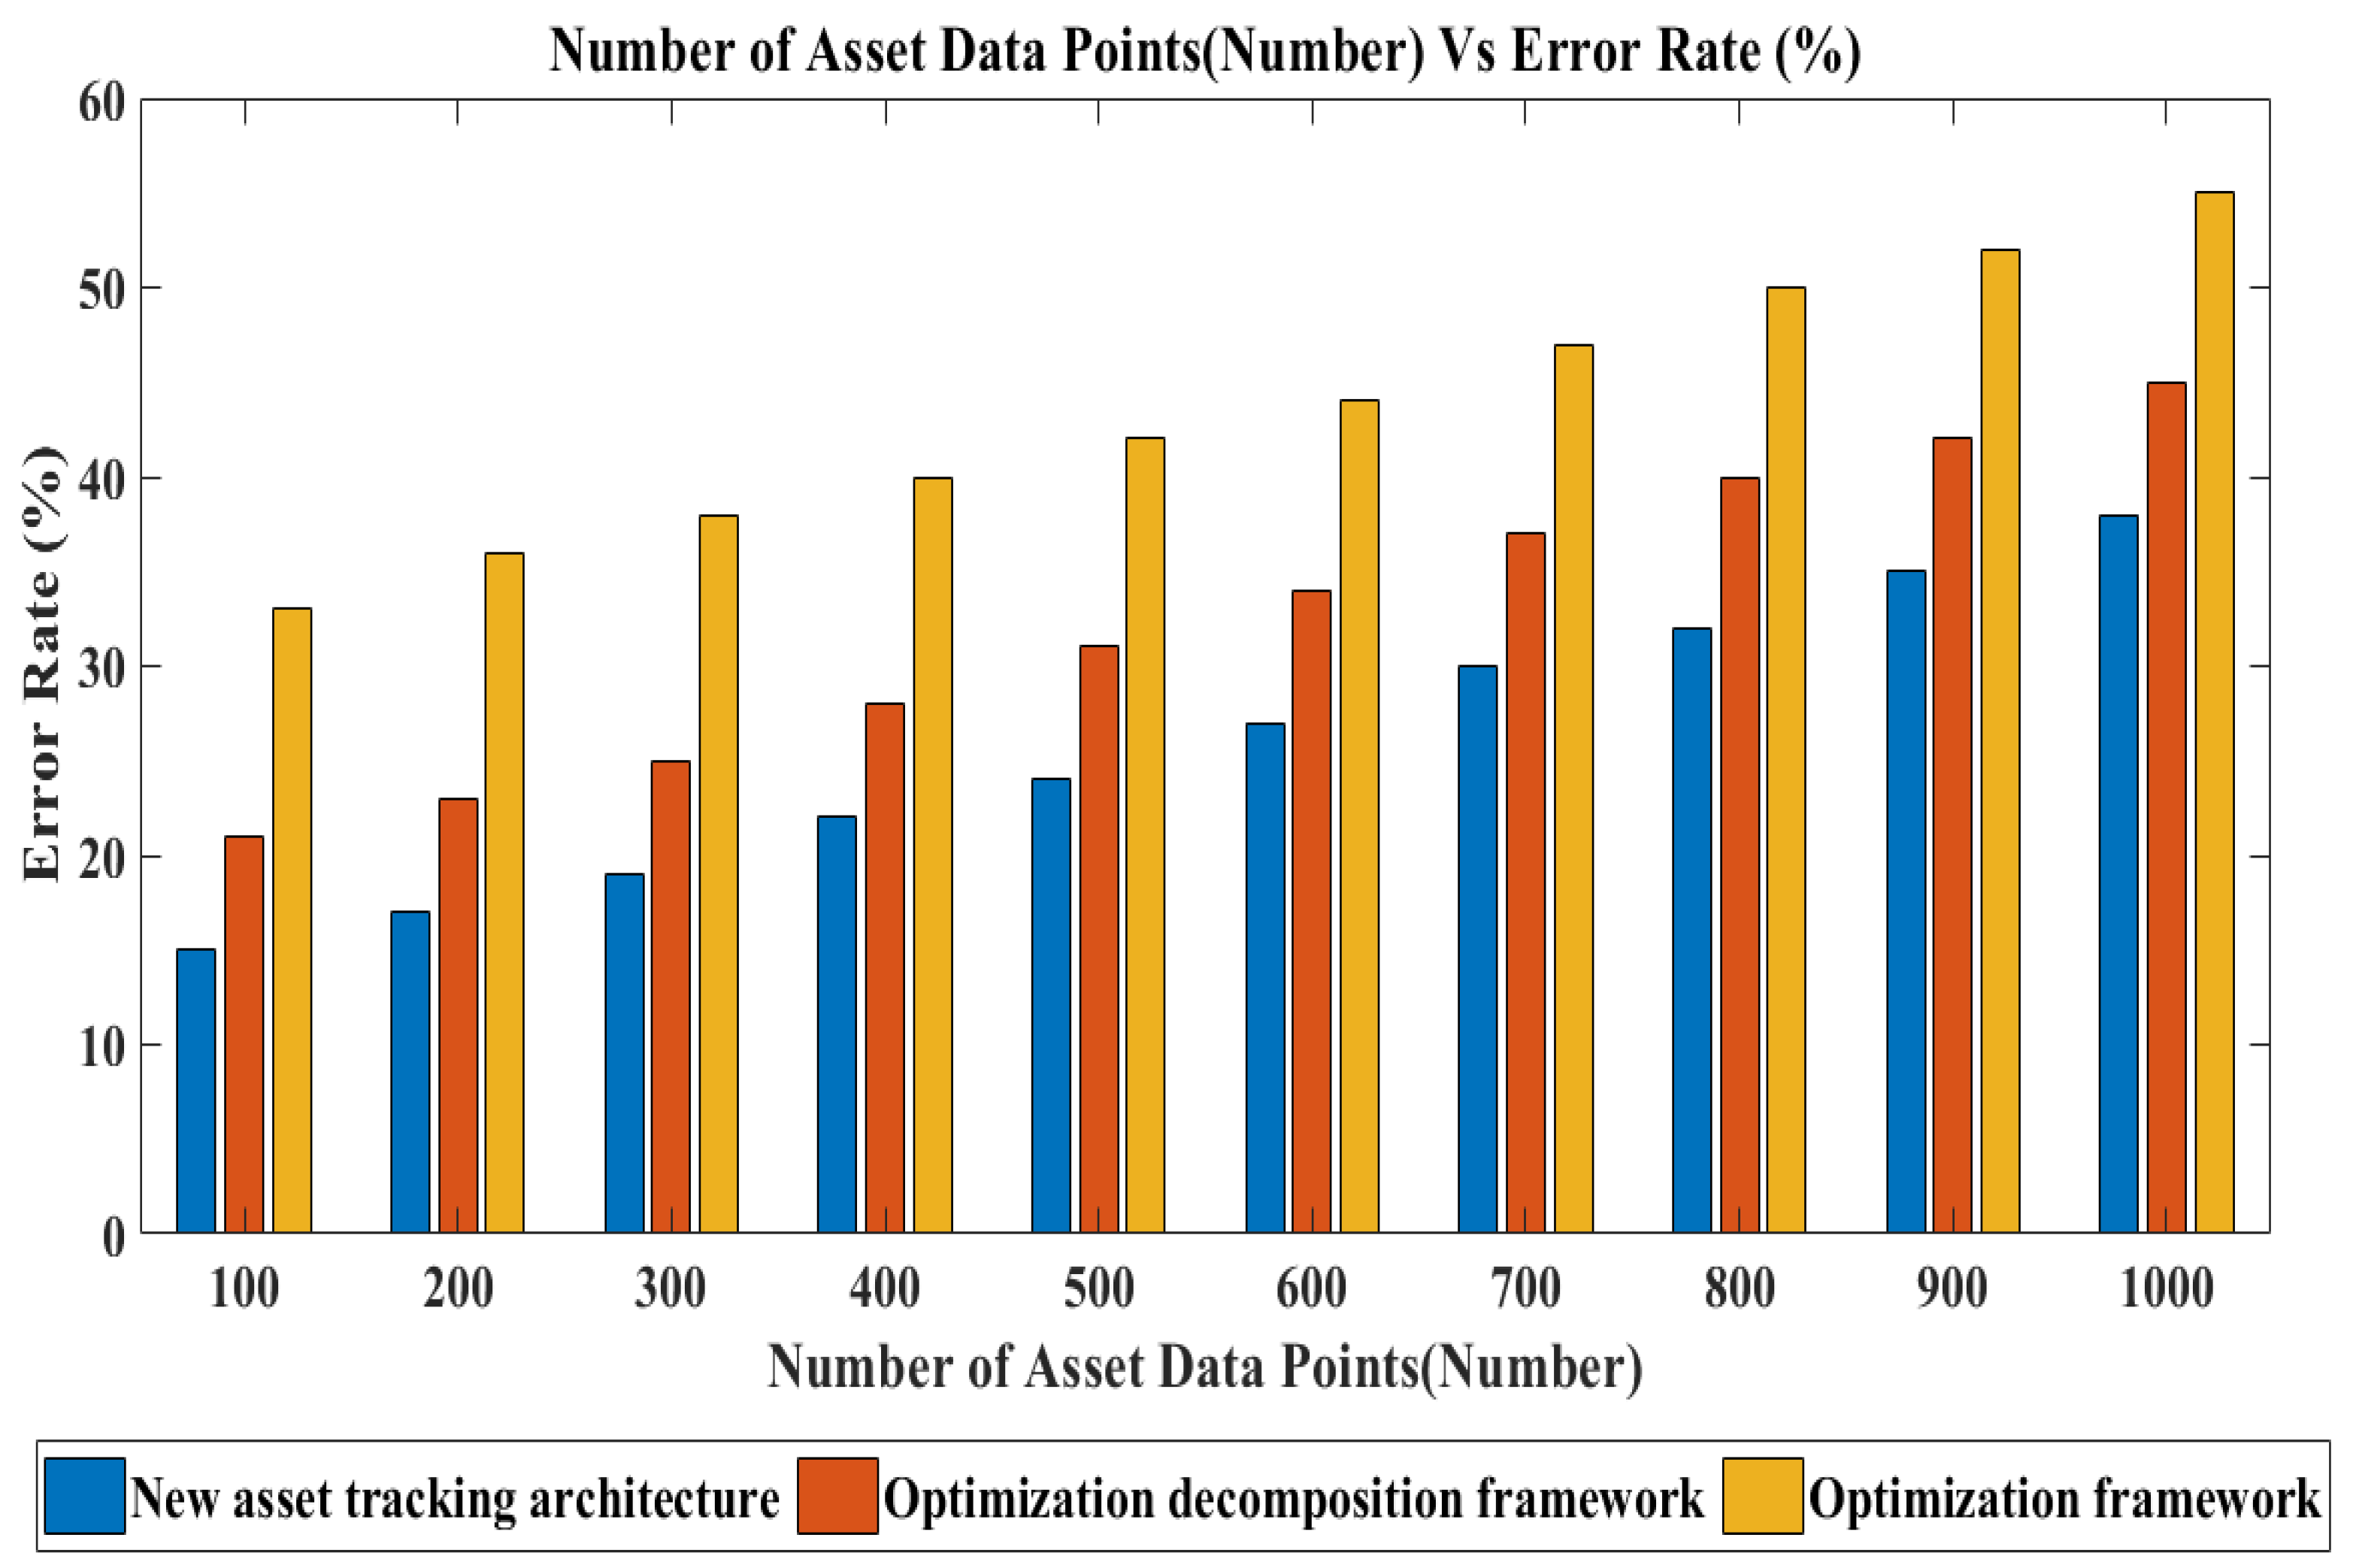
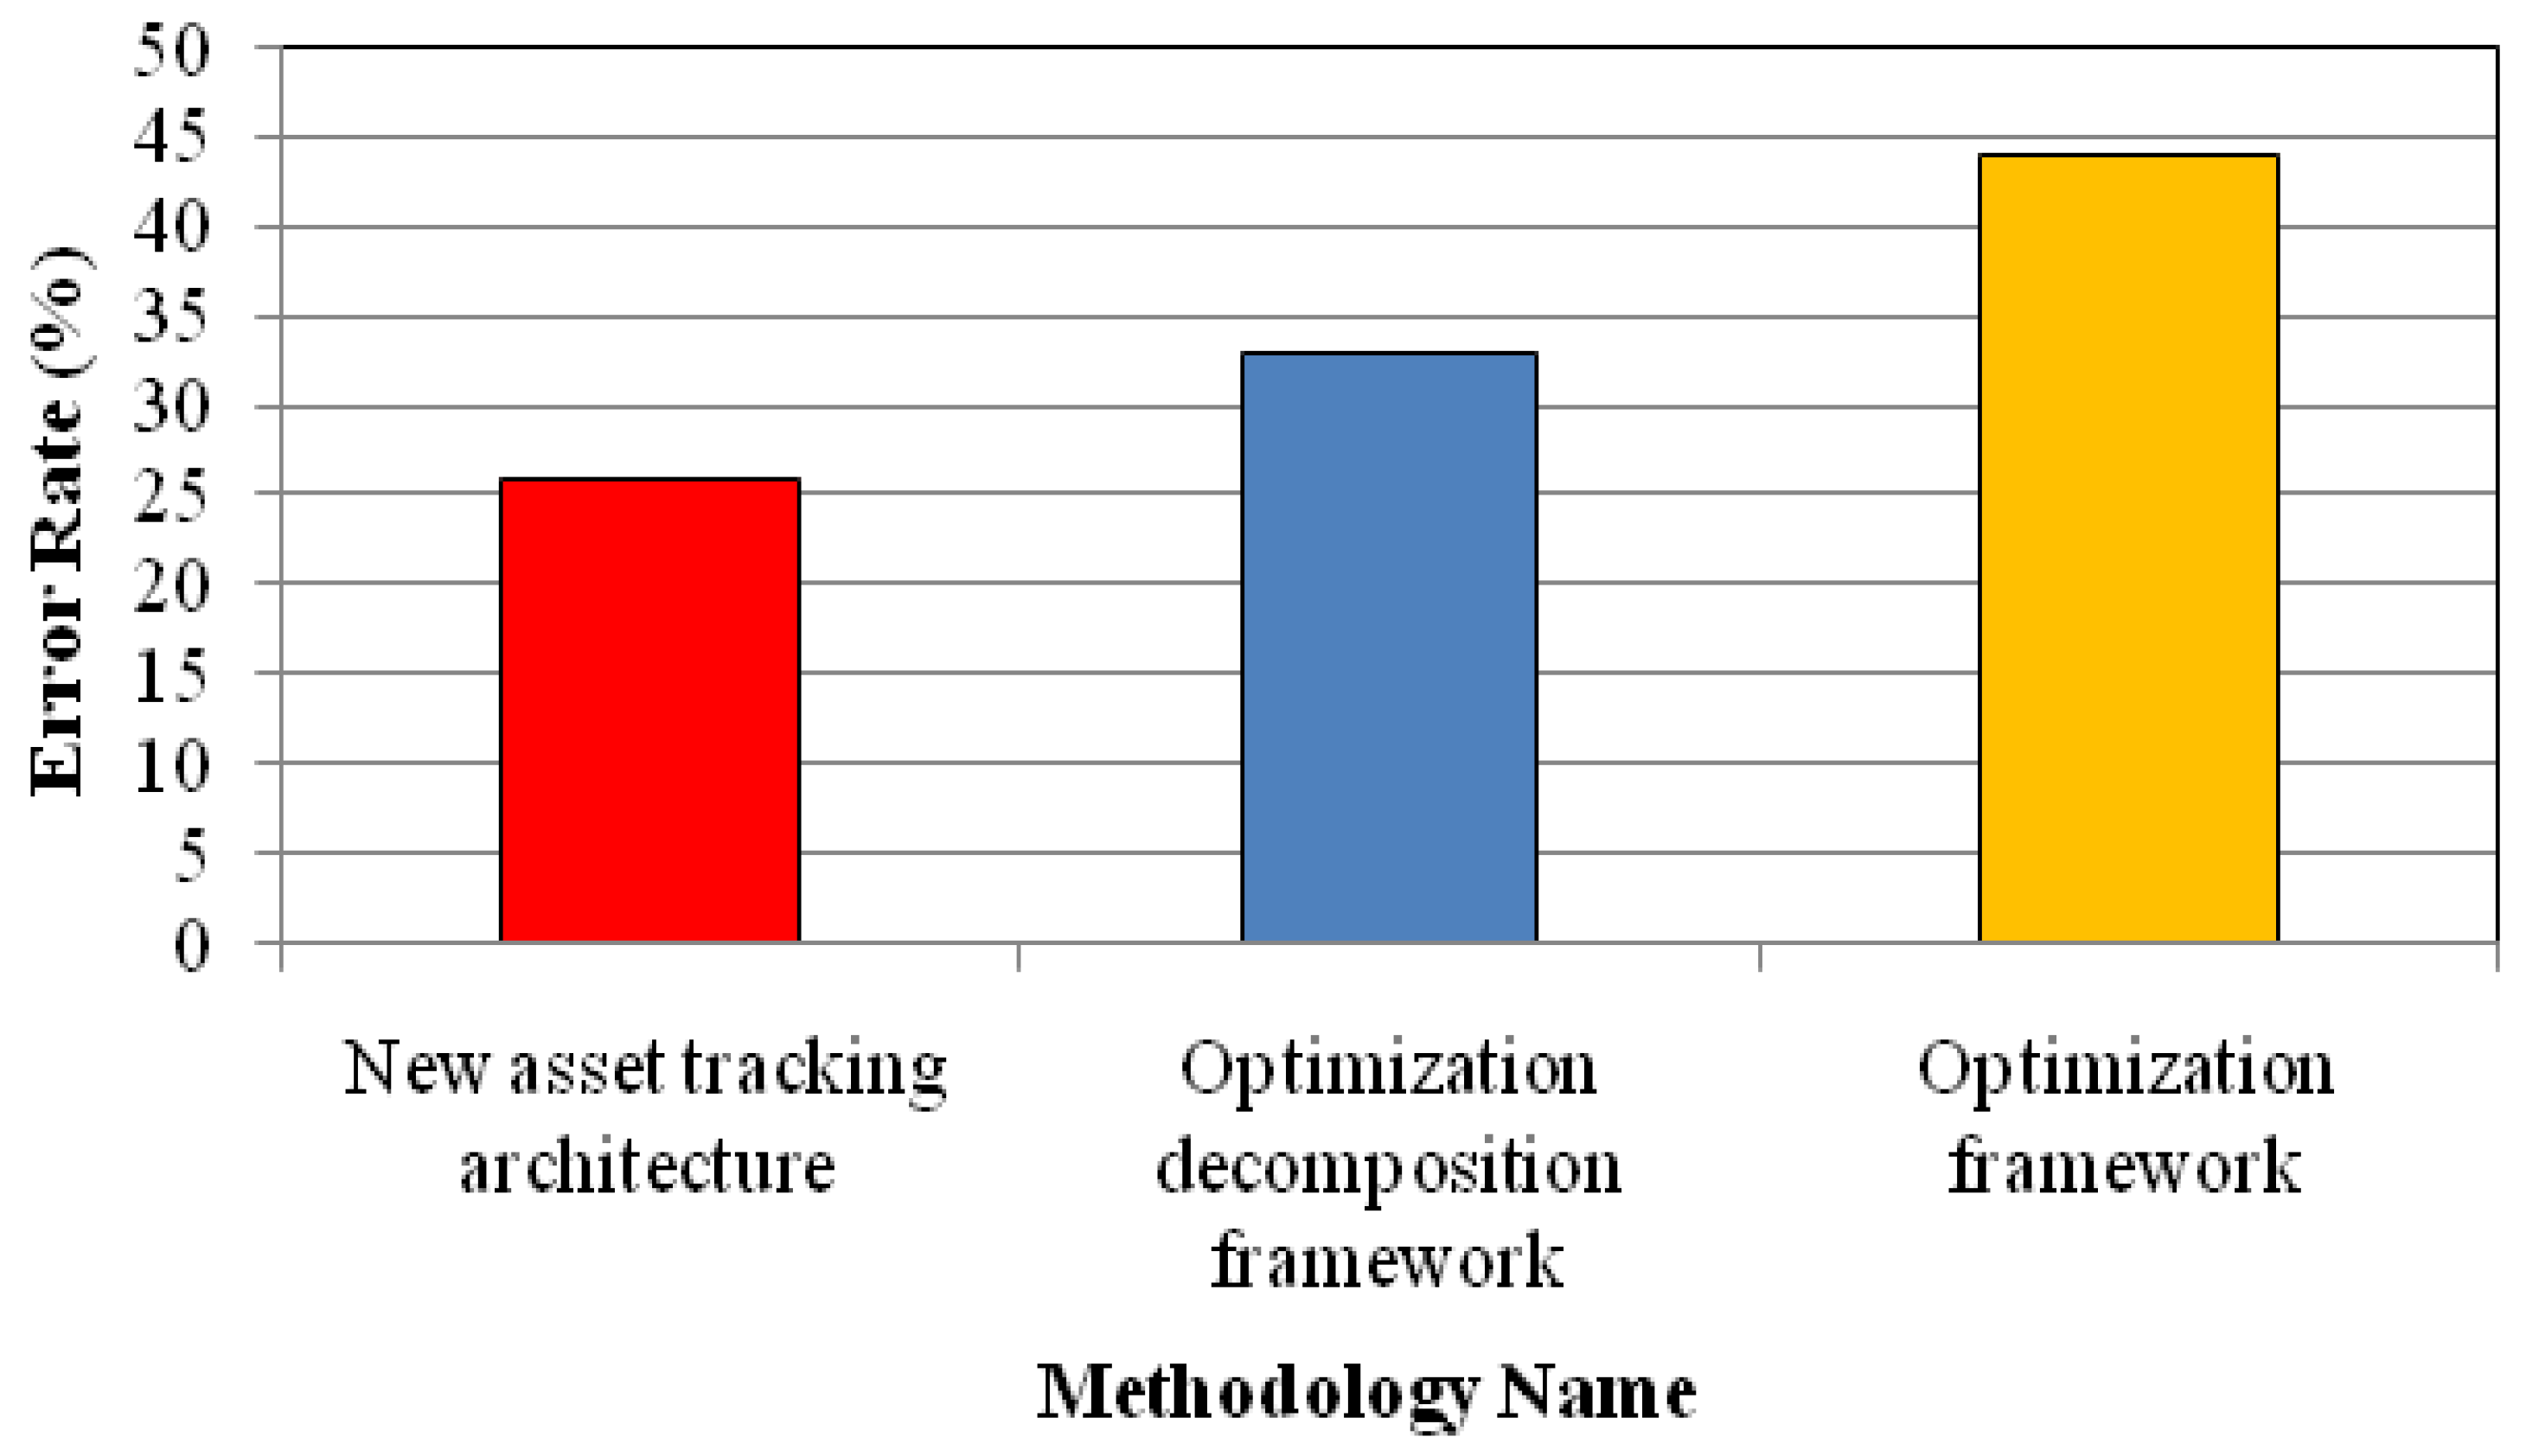
  • Impact on Error Rate: It is defined as the ratio of the number of data points that are inaccurately delivered to the total number of data points sent. It is measured in terms of percentage (%). It is calculated as
    E R = Number of data points inaccurately delivered Number of data points sent × 100
    From (7), the E R is the Error Rate computed. When the error rate is lower, the method is said to be more efficient.
  • Impact on Network Lifetime: It is measured as the ratio of the initial energy of the node to the energy consumption per transmission. It is mathematically computed as follows:
    N L = E I E t r
    From (8), N L denotes a Network Lifetime of sensor nodes. E I represents the initial energy of the sensor nodes, i.e., 0.5 Joule taken for our simulation. E t r indicates the energy consumption of a node per single transmission. It is measured in terms of seconds (S). When the network lifetime is shorter, the method is said to be more efficient.
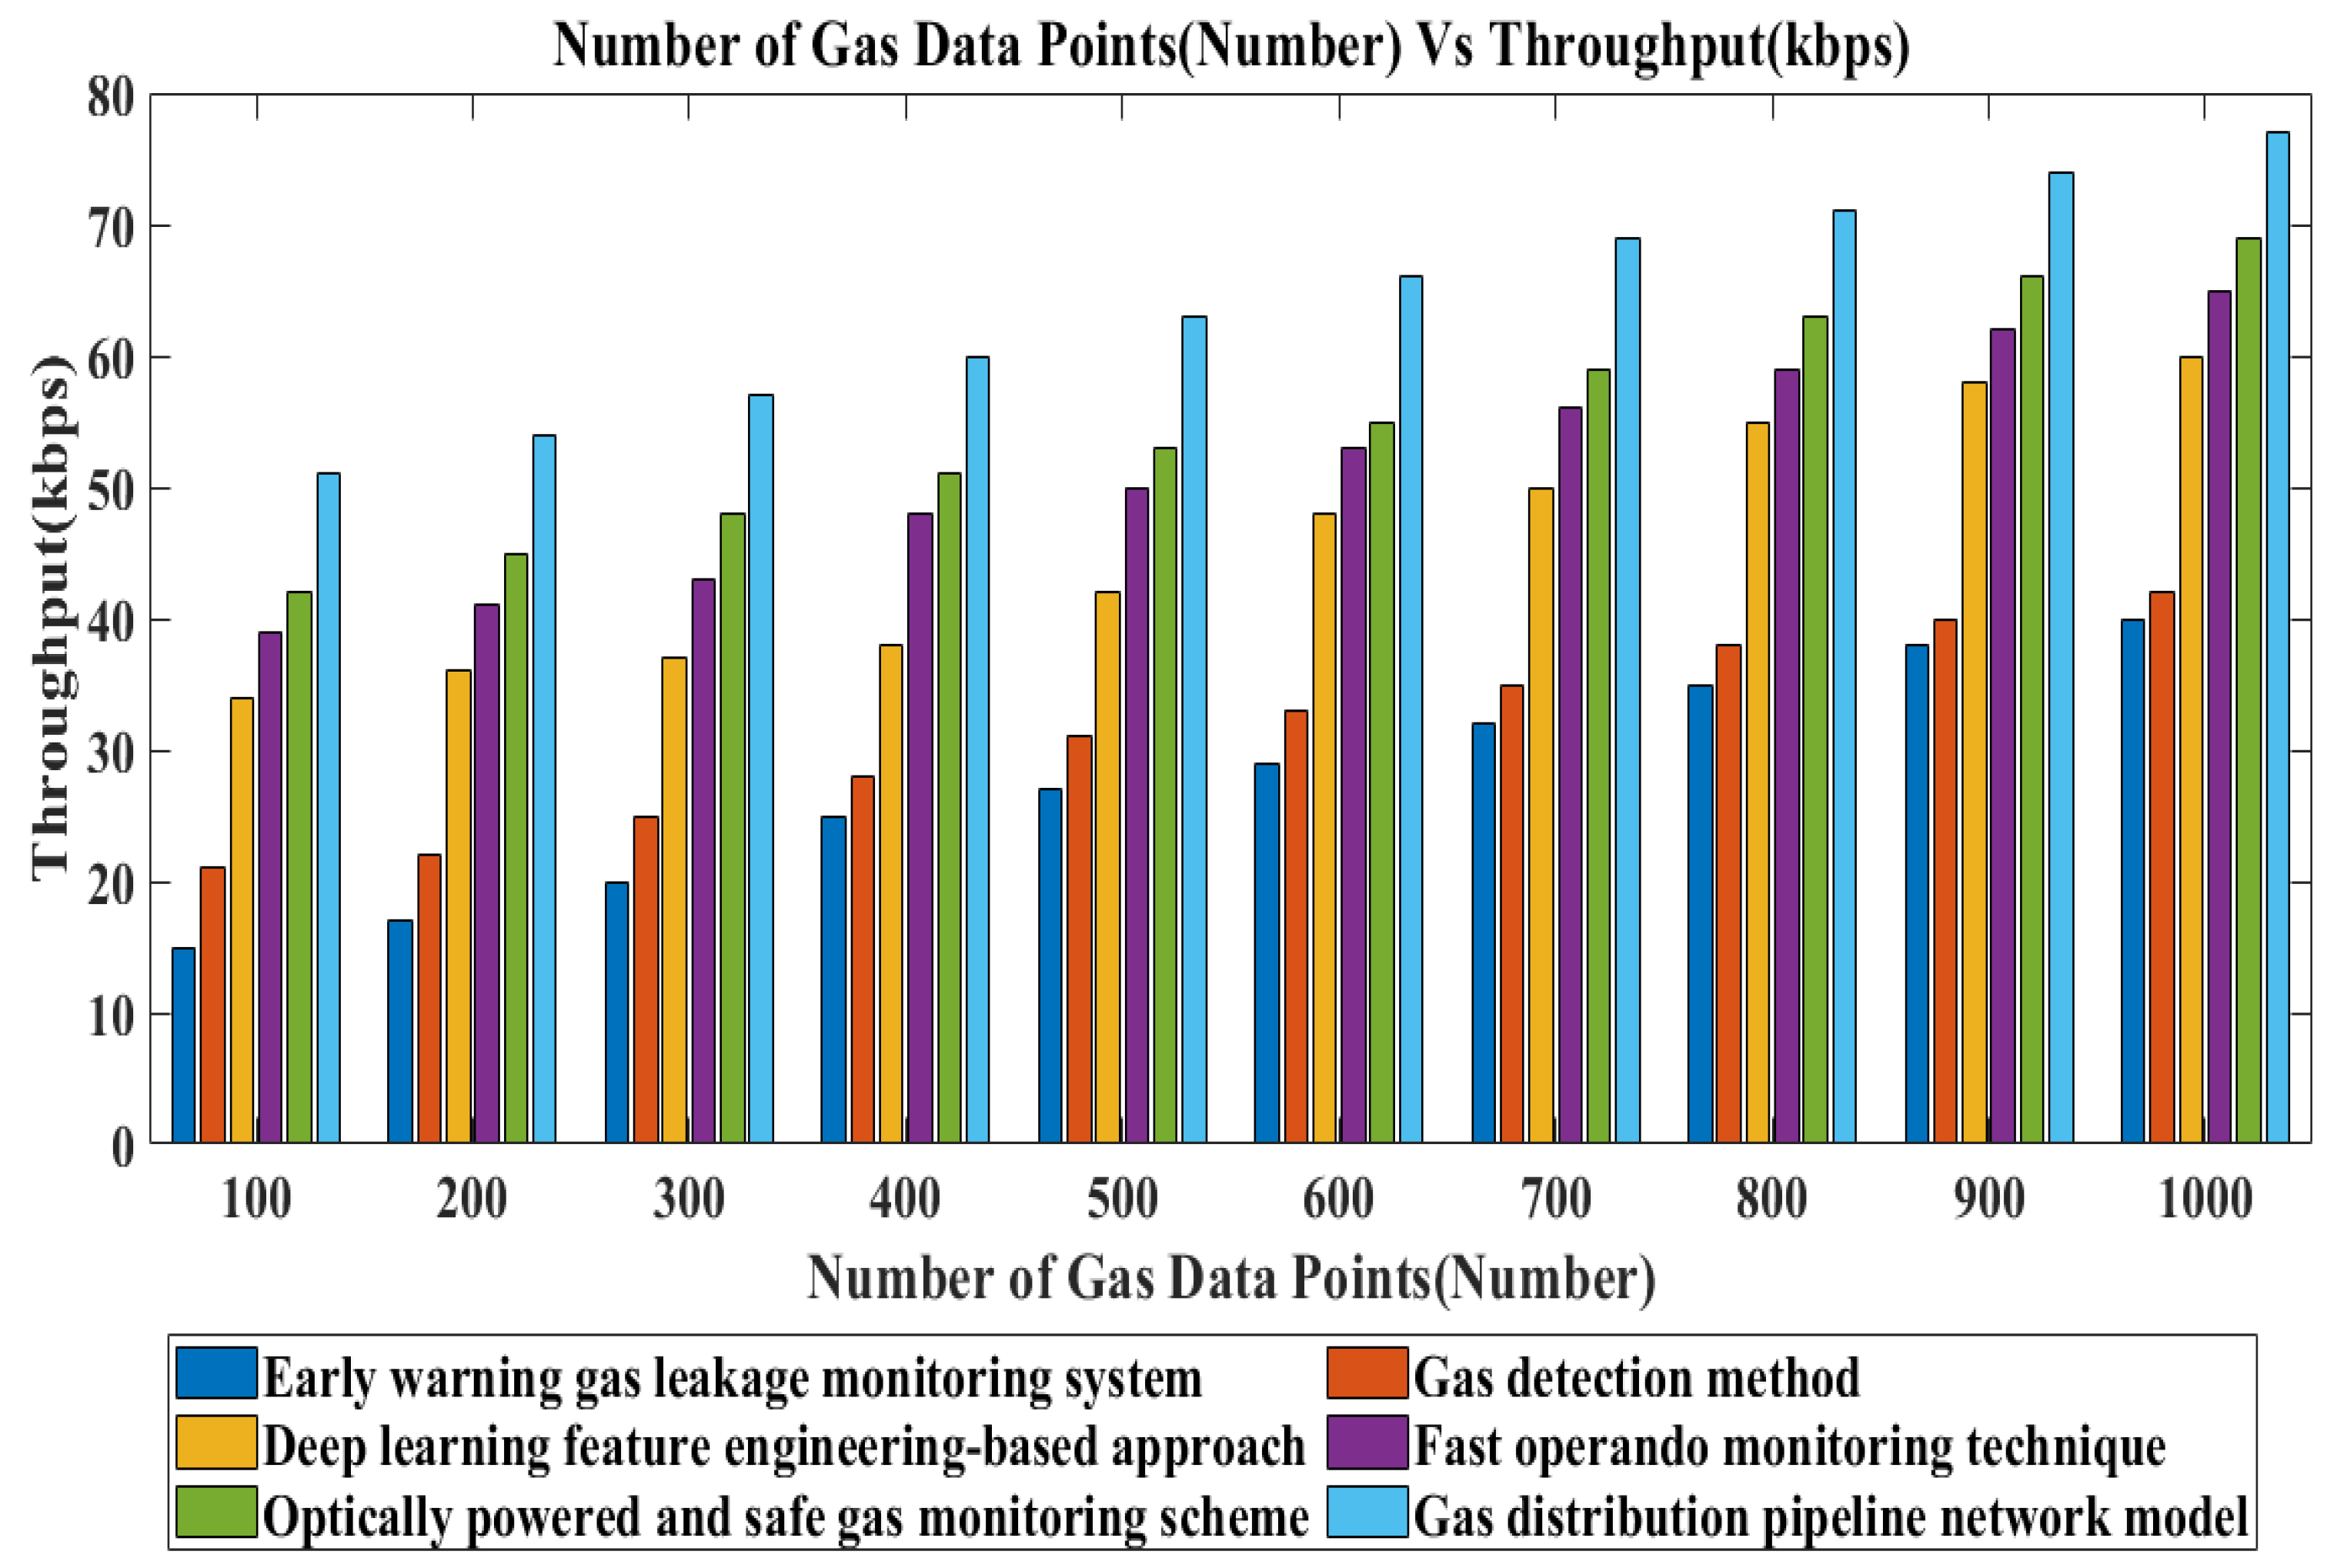
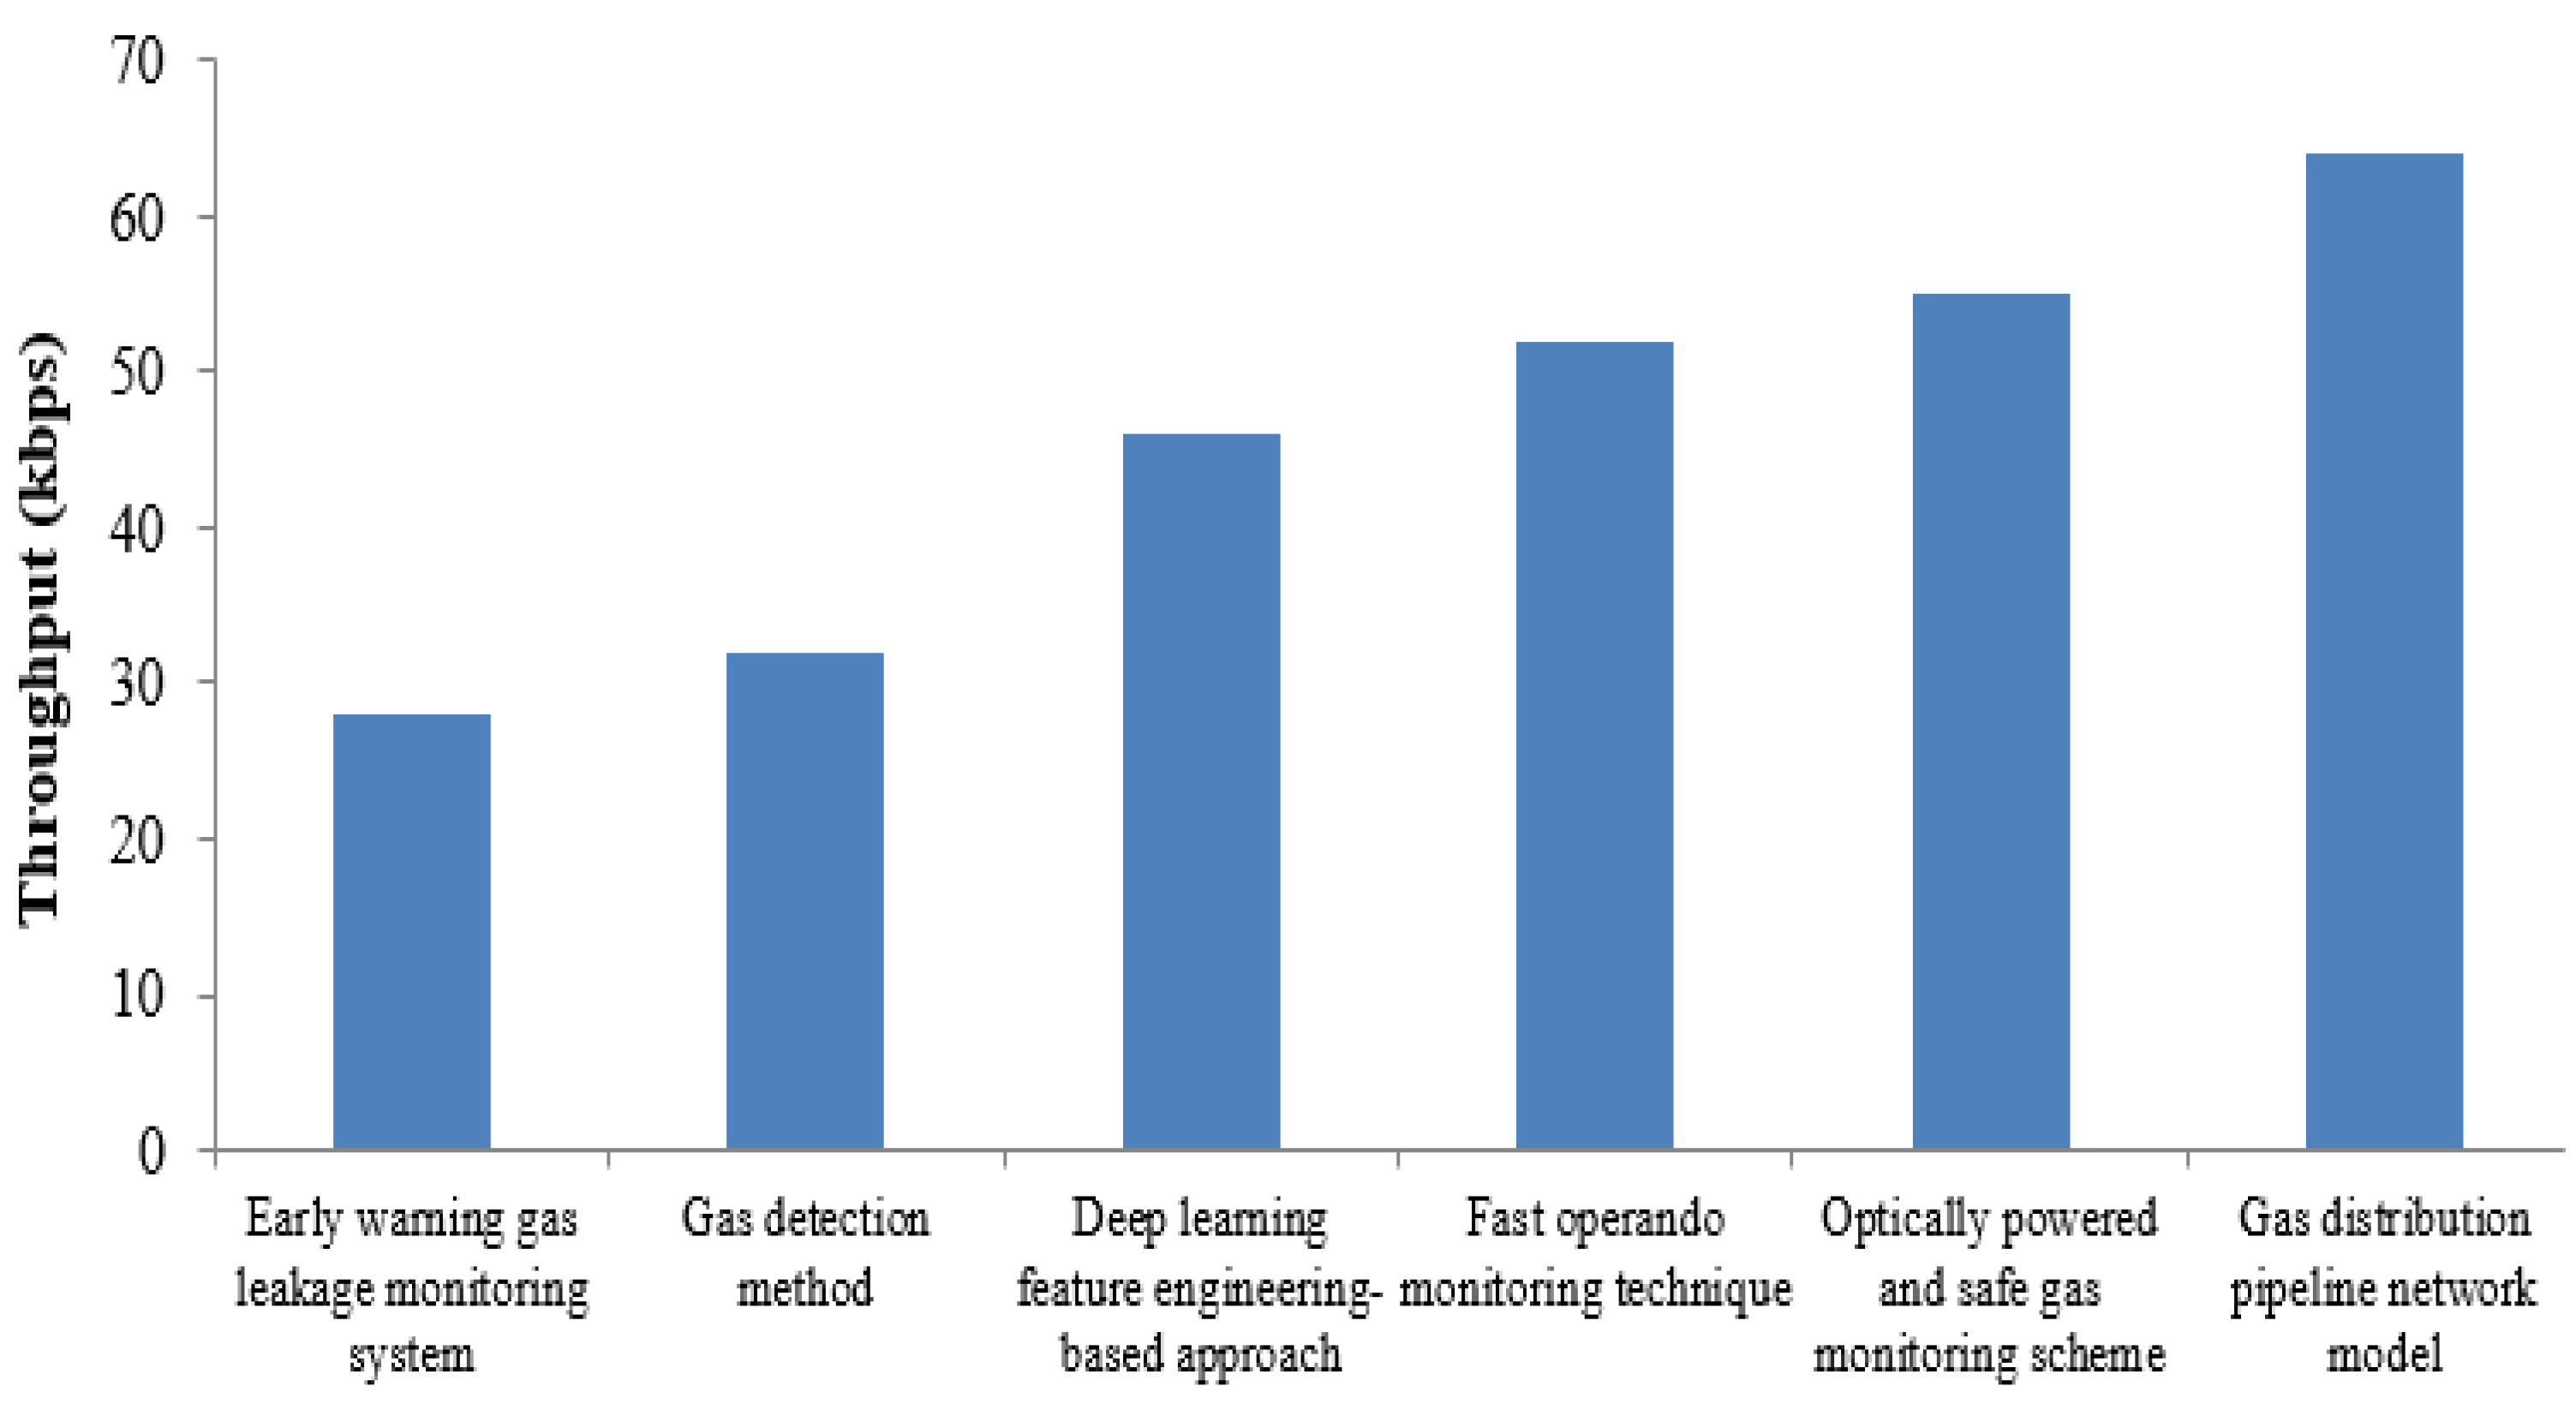
  • Impact on Throughput: It refers to the size of gas data (i.e., data packets that are successfully delivered) within a given timeframe. Throughput is measured as follows:
    T = SPT time ( sec )
    From (9), T symbolizes the Throughput. S P T denotes the size of the data packet successfully delivered in one second. The throughput is measured in kilobits per second (kbps).

5.1. Performance Analysis on Healthcare Application

The results of the cross-sectional descriptive design [35], bibliometric analysis [36], sustainable healthcare systems [37], energy-saving technique [38], and NDTDT [39] are discussed with healthcare dataset collected from kaggle. The dataset is published at [67]. In total, 500 sensor nodes are deployed to conduct the simulation. The DSR routing protocol is used to perform delay-efficient data transmission in WSN. The Random Waypoint model is considered a mobility model.
Figure 5 shows the Packet Delivery Ratio P D R presented in Equation (1) for existing methods. The number of healthcare data points is taken from the dataset. A number of data packets is taken from the range of 100 to 1000 for experimental purposes. The number of healthcare data points, 100, is considered in the sixth iteration. The P D R obtained for different approaches is 92%, 87%, 84%, 80%, and 97%, respectively. The P D R of NDTDT is higher than other techniques. This is owing to the application of intelligent decision-making processes in healthcare centers. The P D R of NDTDT is improved by 6%, 11%, 17%, and 23%, respectively, compared to other approaches.
The overall performance results of the P D R are described in Figure 6. NDTDT outperforms other methods in terms of achieving a higher P D R . When the experiment was conducted, the P D R was observed as 89%, 85%, 80%, 76%, and 94% for existing methods, respectively.

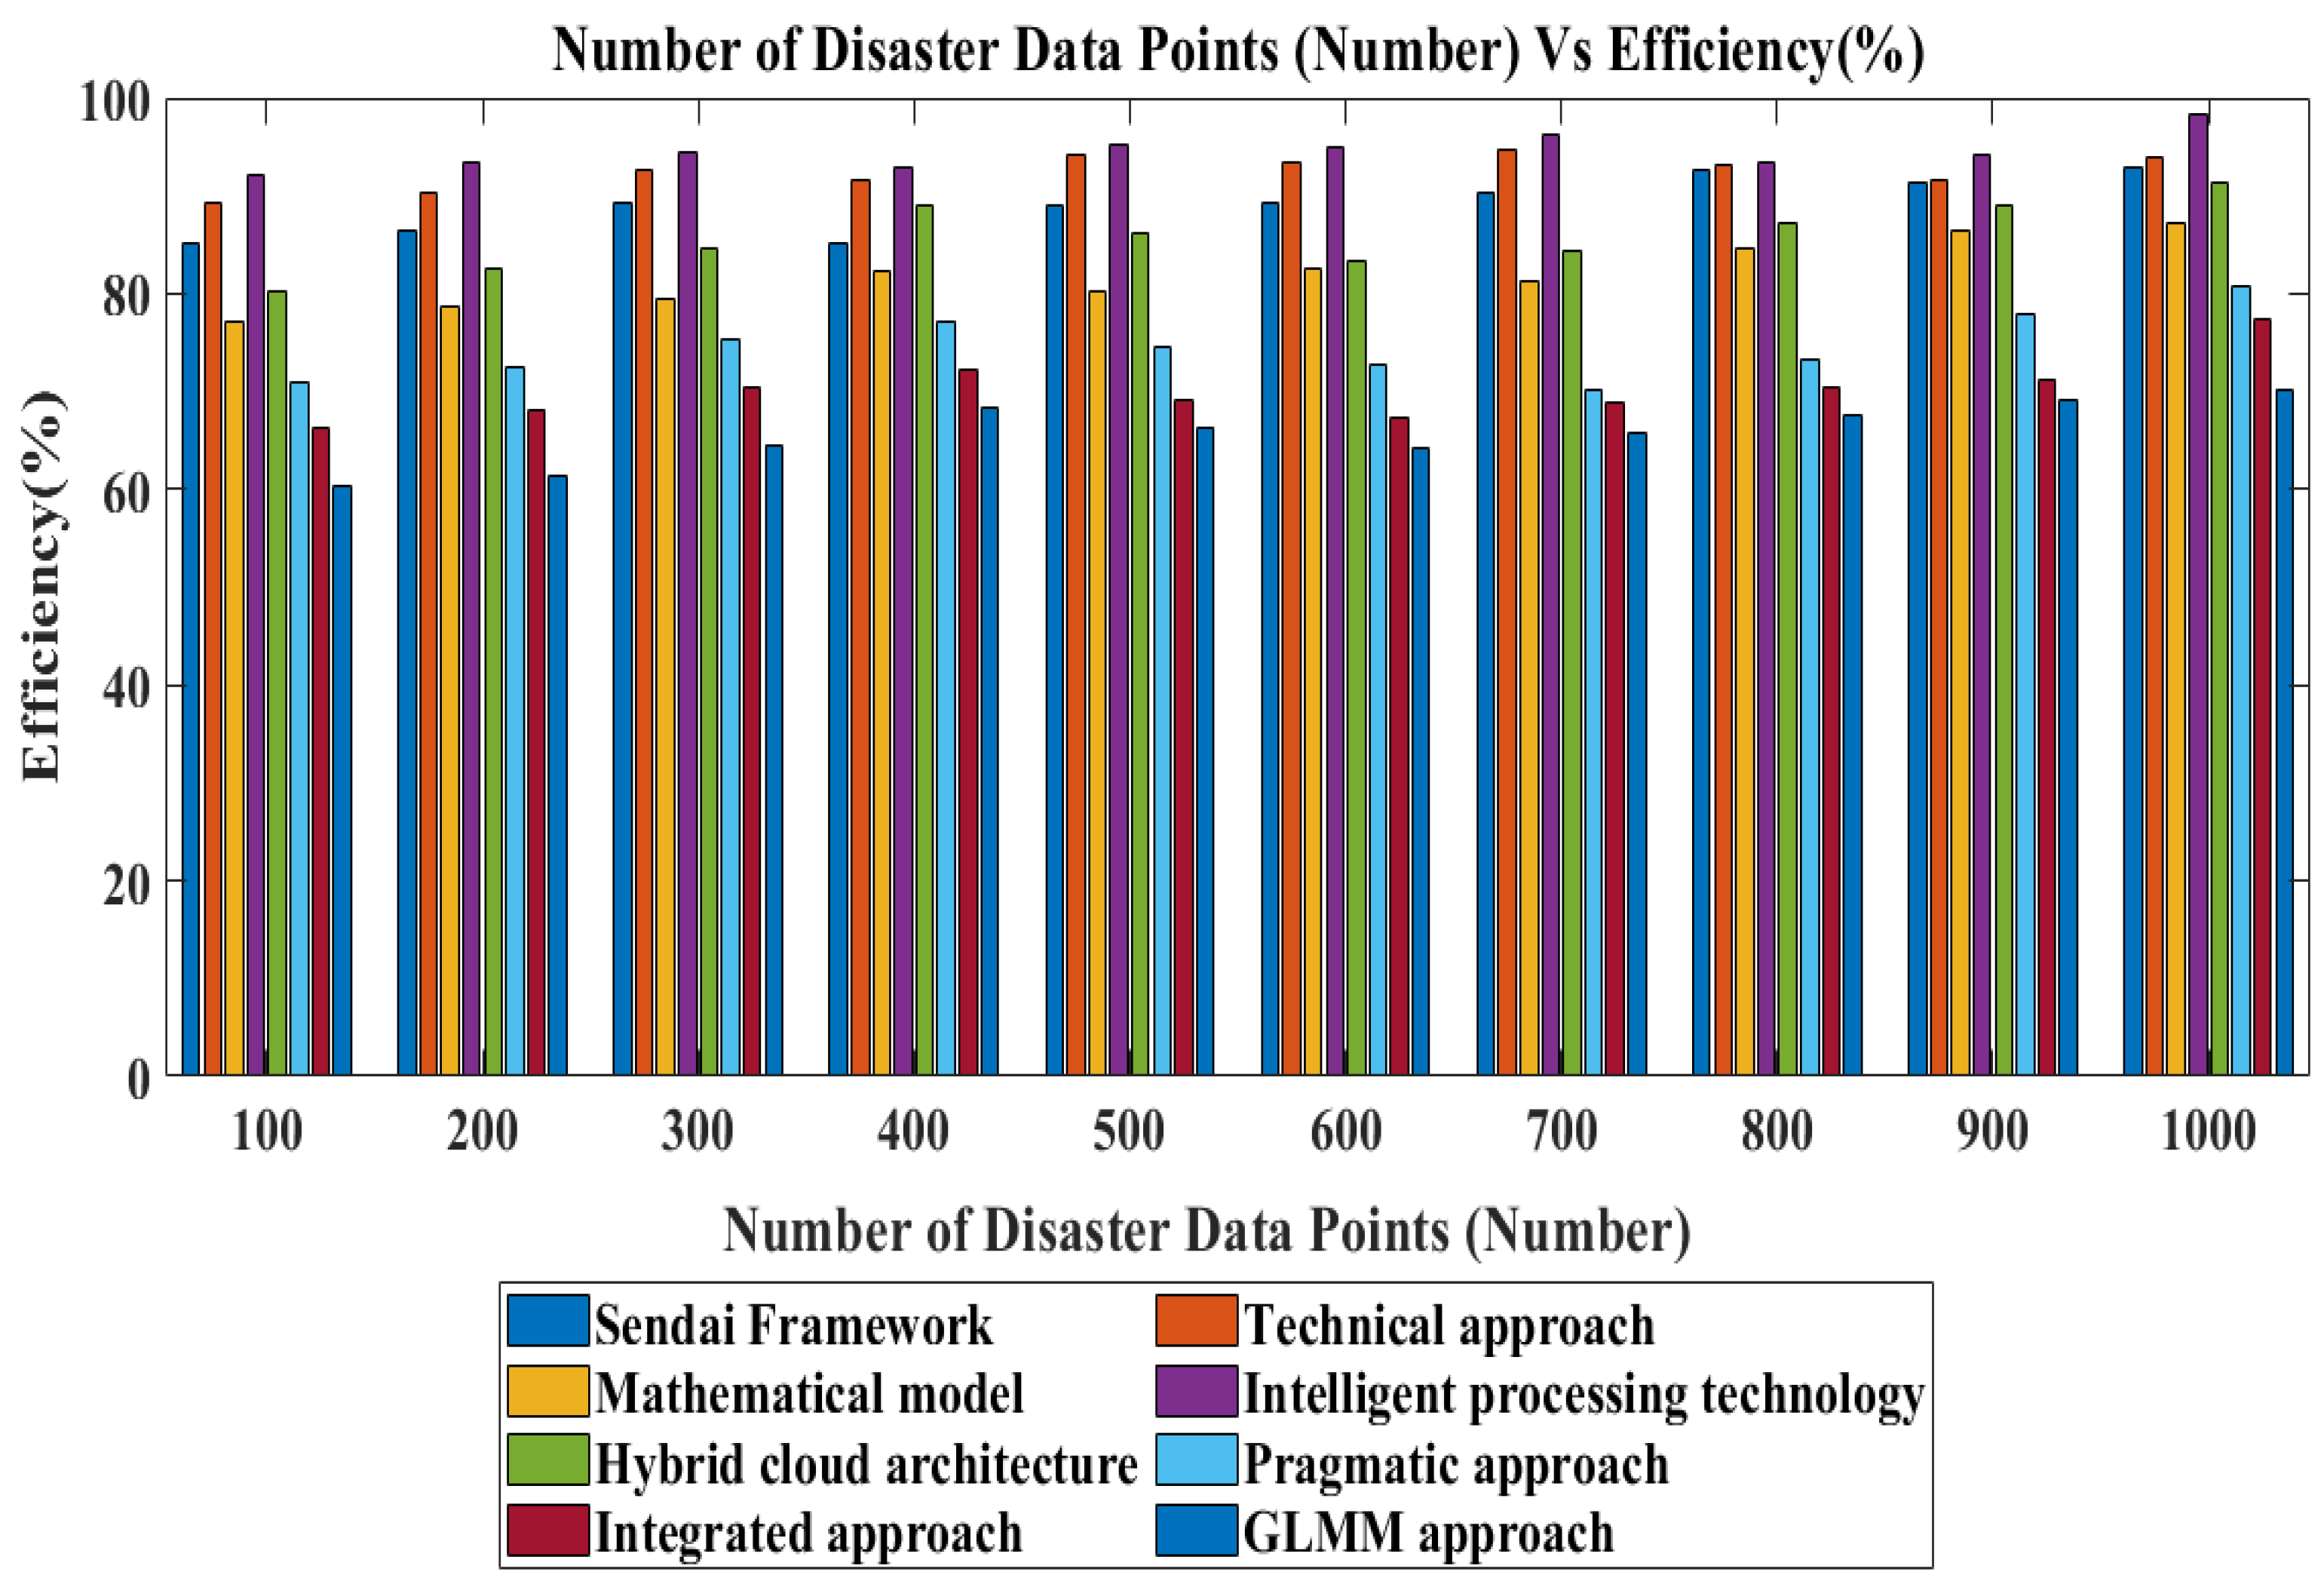
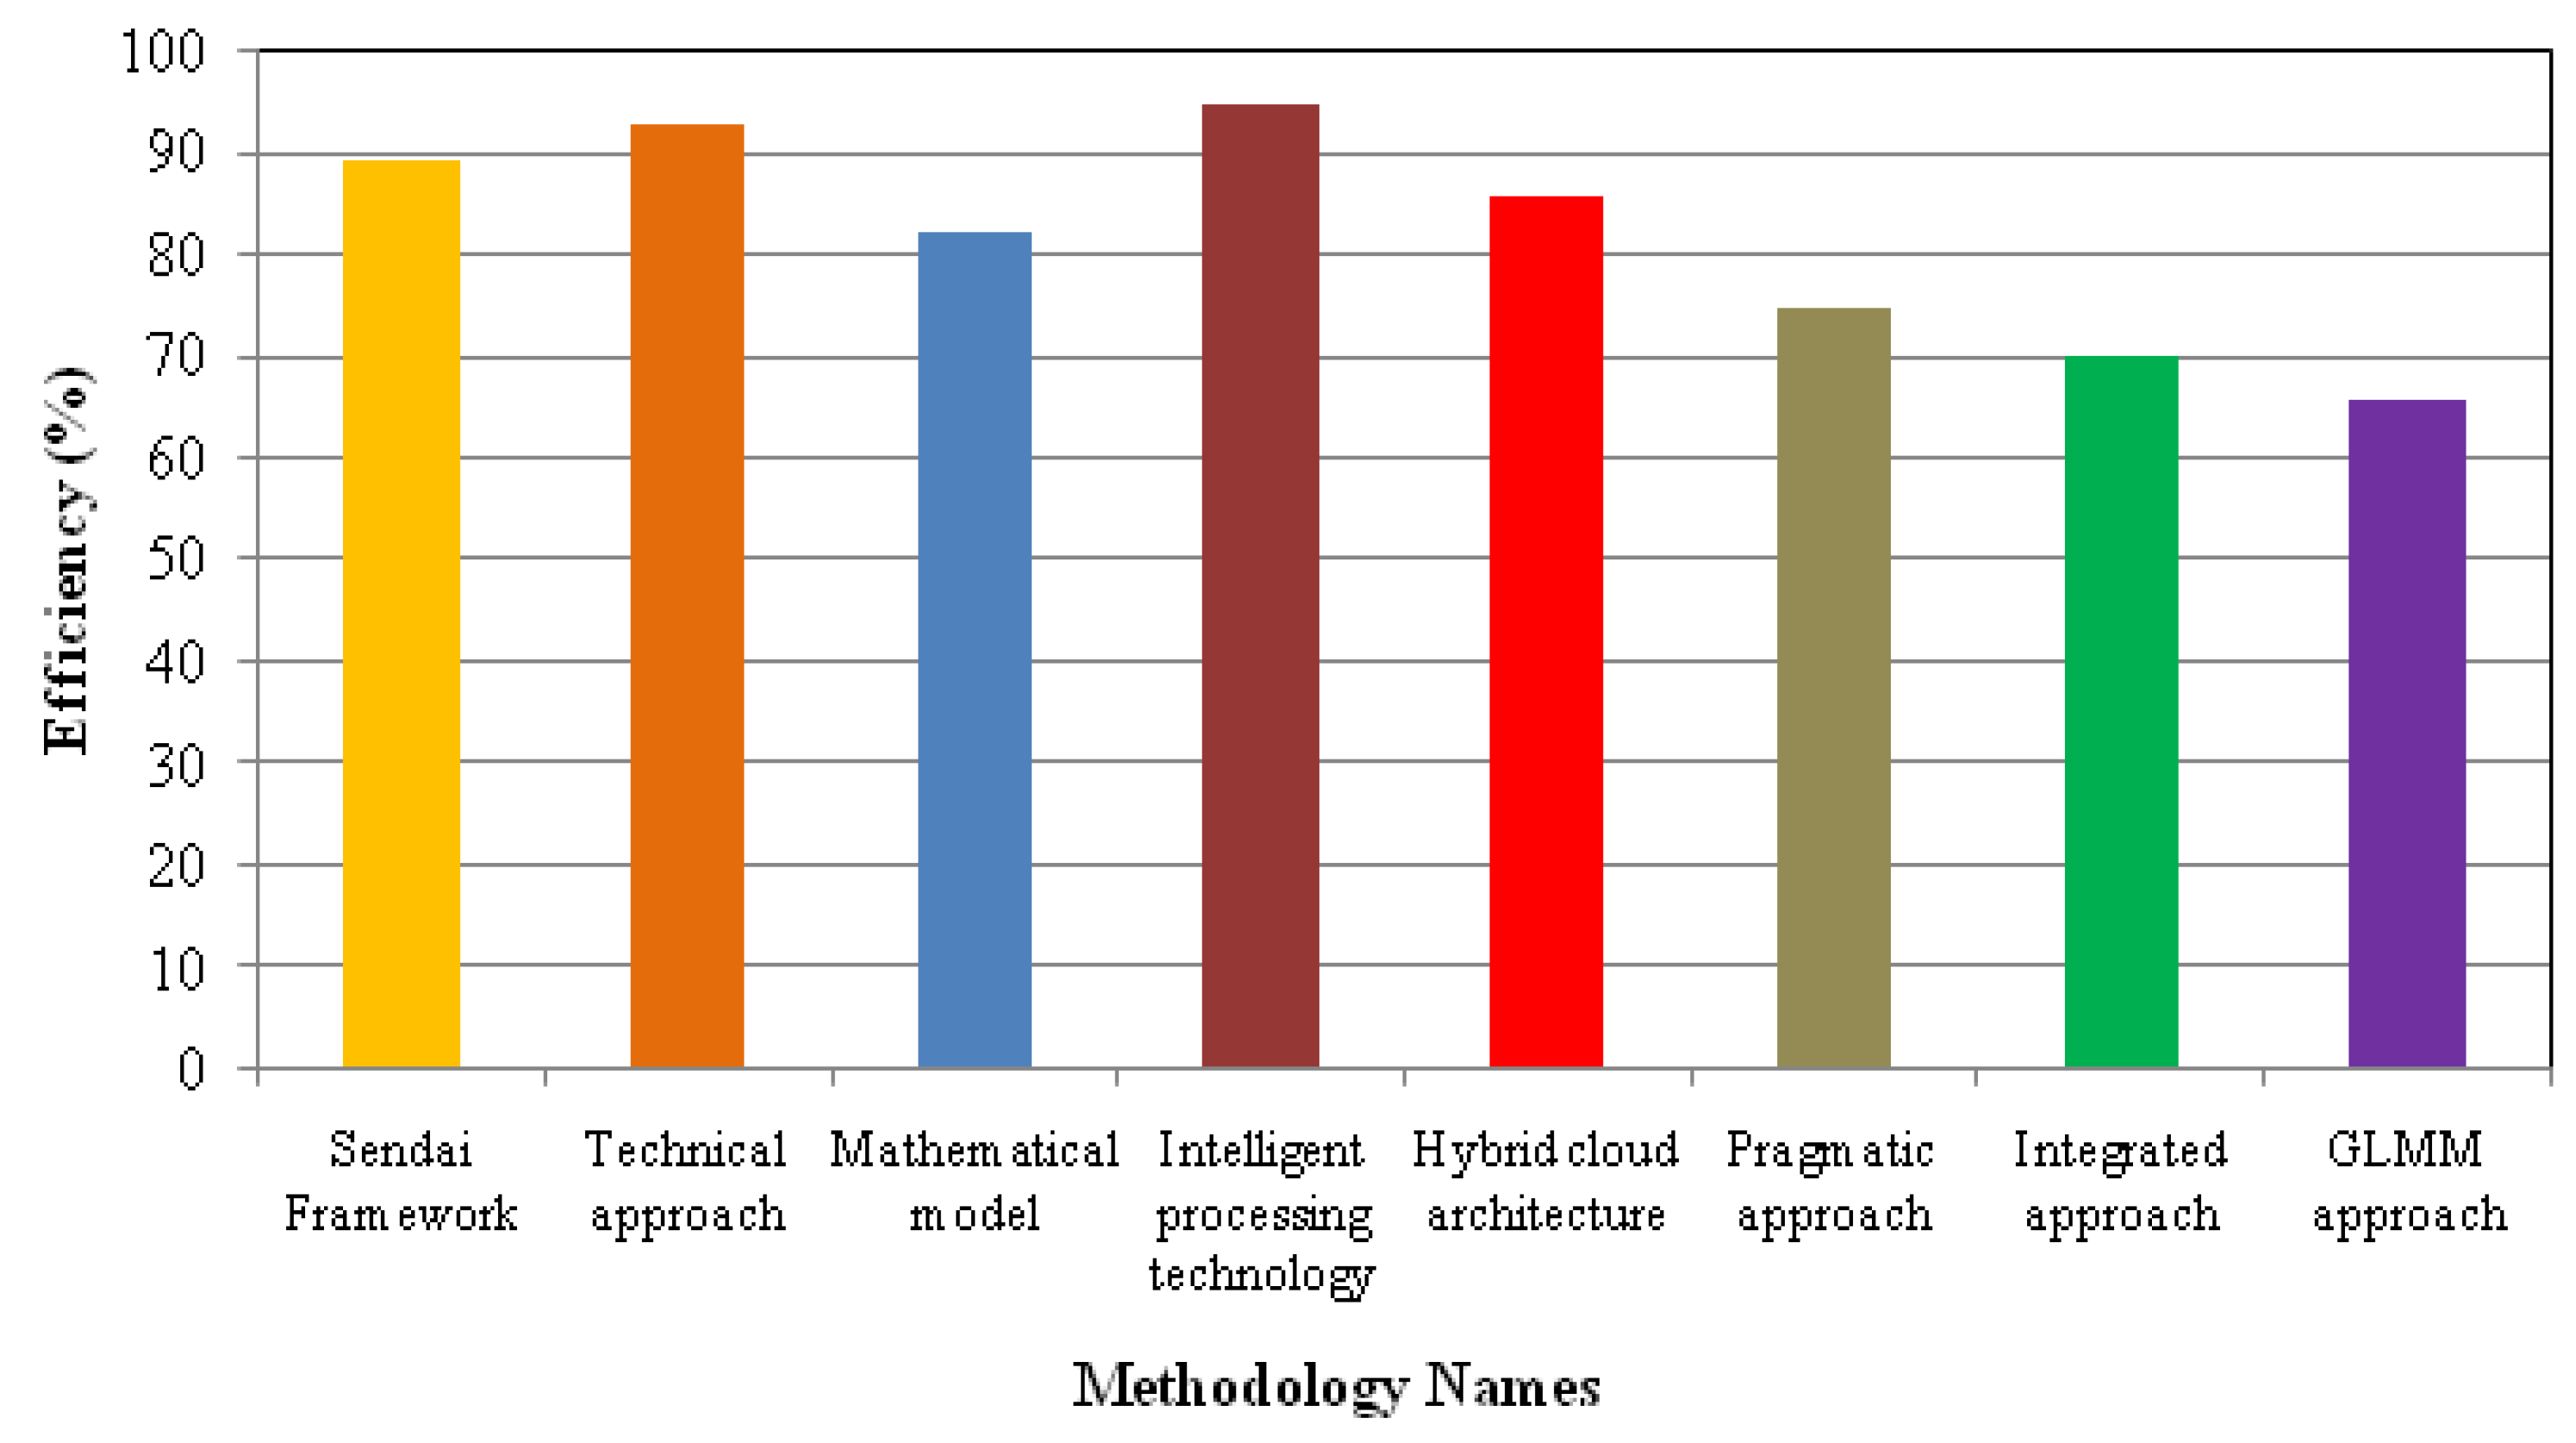
5.2. Performance Analysis on Natural Disaster

The results of the existing methods, namely, the Sendai Framework [27], rechnical approach [28], mathematical model [29], intelligent processing technology [30], hybrid cloud architecture [31], pragmatic approach [32], integrated approach [33], and GLMM approach [34] are discussed with disaster dataset collected from kaggle. The URL of the dataset is published as [68]. Totally, 500 sensor nodes are deployed in a disaster area to conduct the simulation.
Figure 7 illustrates the Efficiency E, as defined in Equation (2), to demonstrate the performance of eight existing methods analyzed using varying numbers of disaster data points, ranging from 100 to 1000. When considering 600 disaster data points, the E values obtained for each method are 89.29%, 93.53%, 82.59%, 94.89%, 83.33%, 72.68%, 67.22%, and 64.12%, respectively. The Intelligent Processing Technology demonstrates the highest E among the methods evaluated. This superior performance can be attributed to its data-driven approach, which accounts for various risk factors contributing to fire accidents and other security issues in urban settings. Consequently, the E of Intelligent Processing Technology surpasses that of the other methods by 6%, 2%, 15%, 10%, 27%, 35%, and 44% when compared to the other approaches.
Figure 8 demonstrates the overall performance results of E across eight different existing methods. Among these, the Intelligent Processing Technology exhibits the highest E. The E values recorded for each method are 89.17%, 92.48%, 81.98%, 94.5%, 85.77%, 74.54%, 70.14%, and 65.73%, respectively. These results indicate that the Intelligent Processing Technology significantly outperforms the other methods, highlighting its effectiveness in enhancing E in comparison to the alternatives.

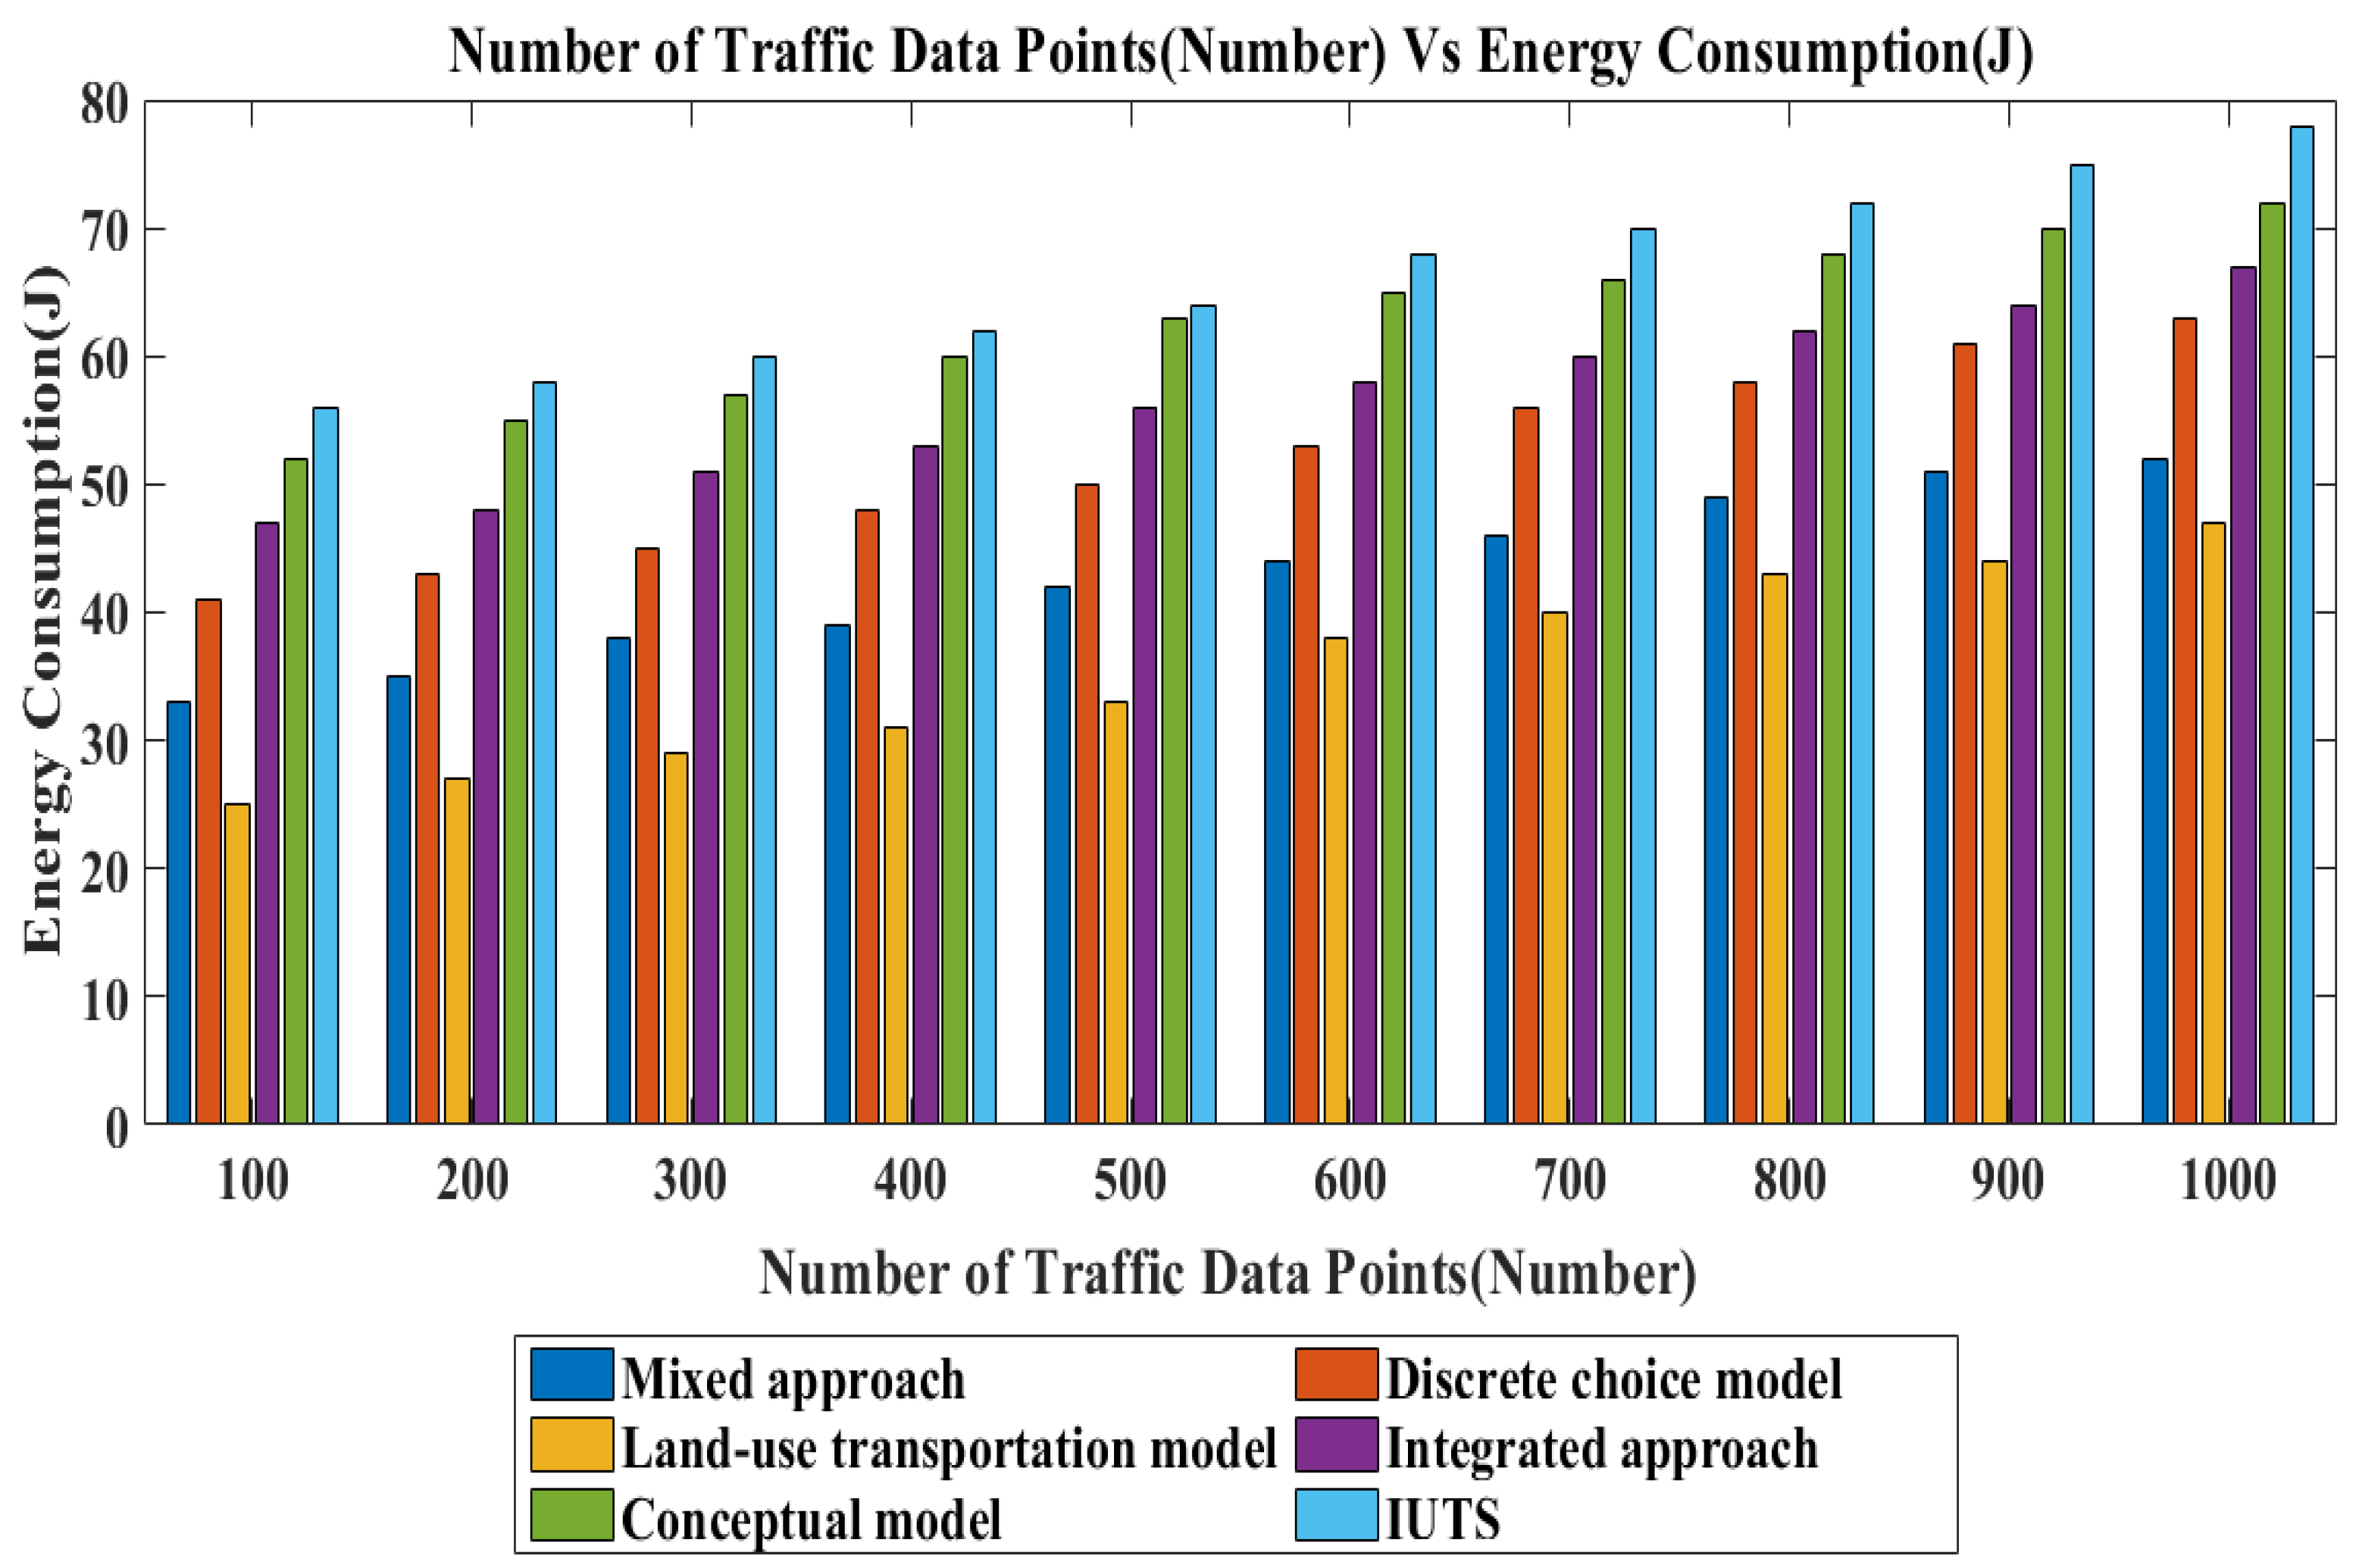
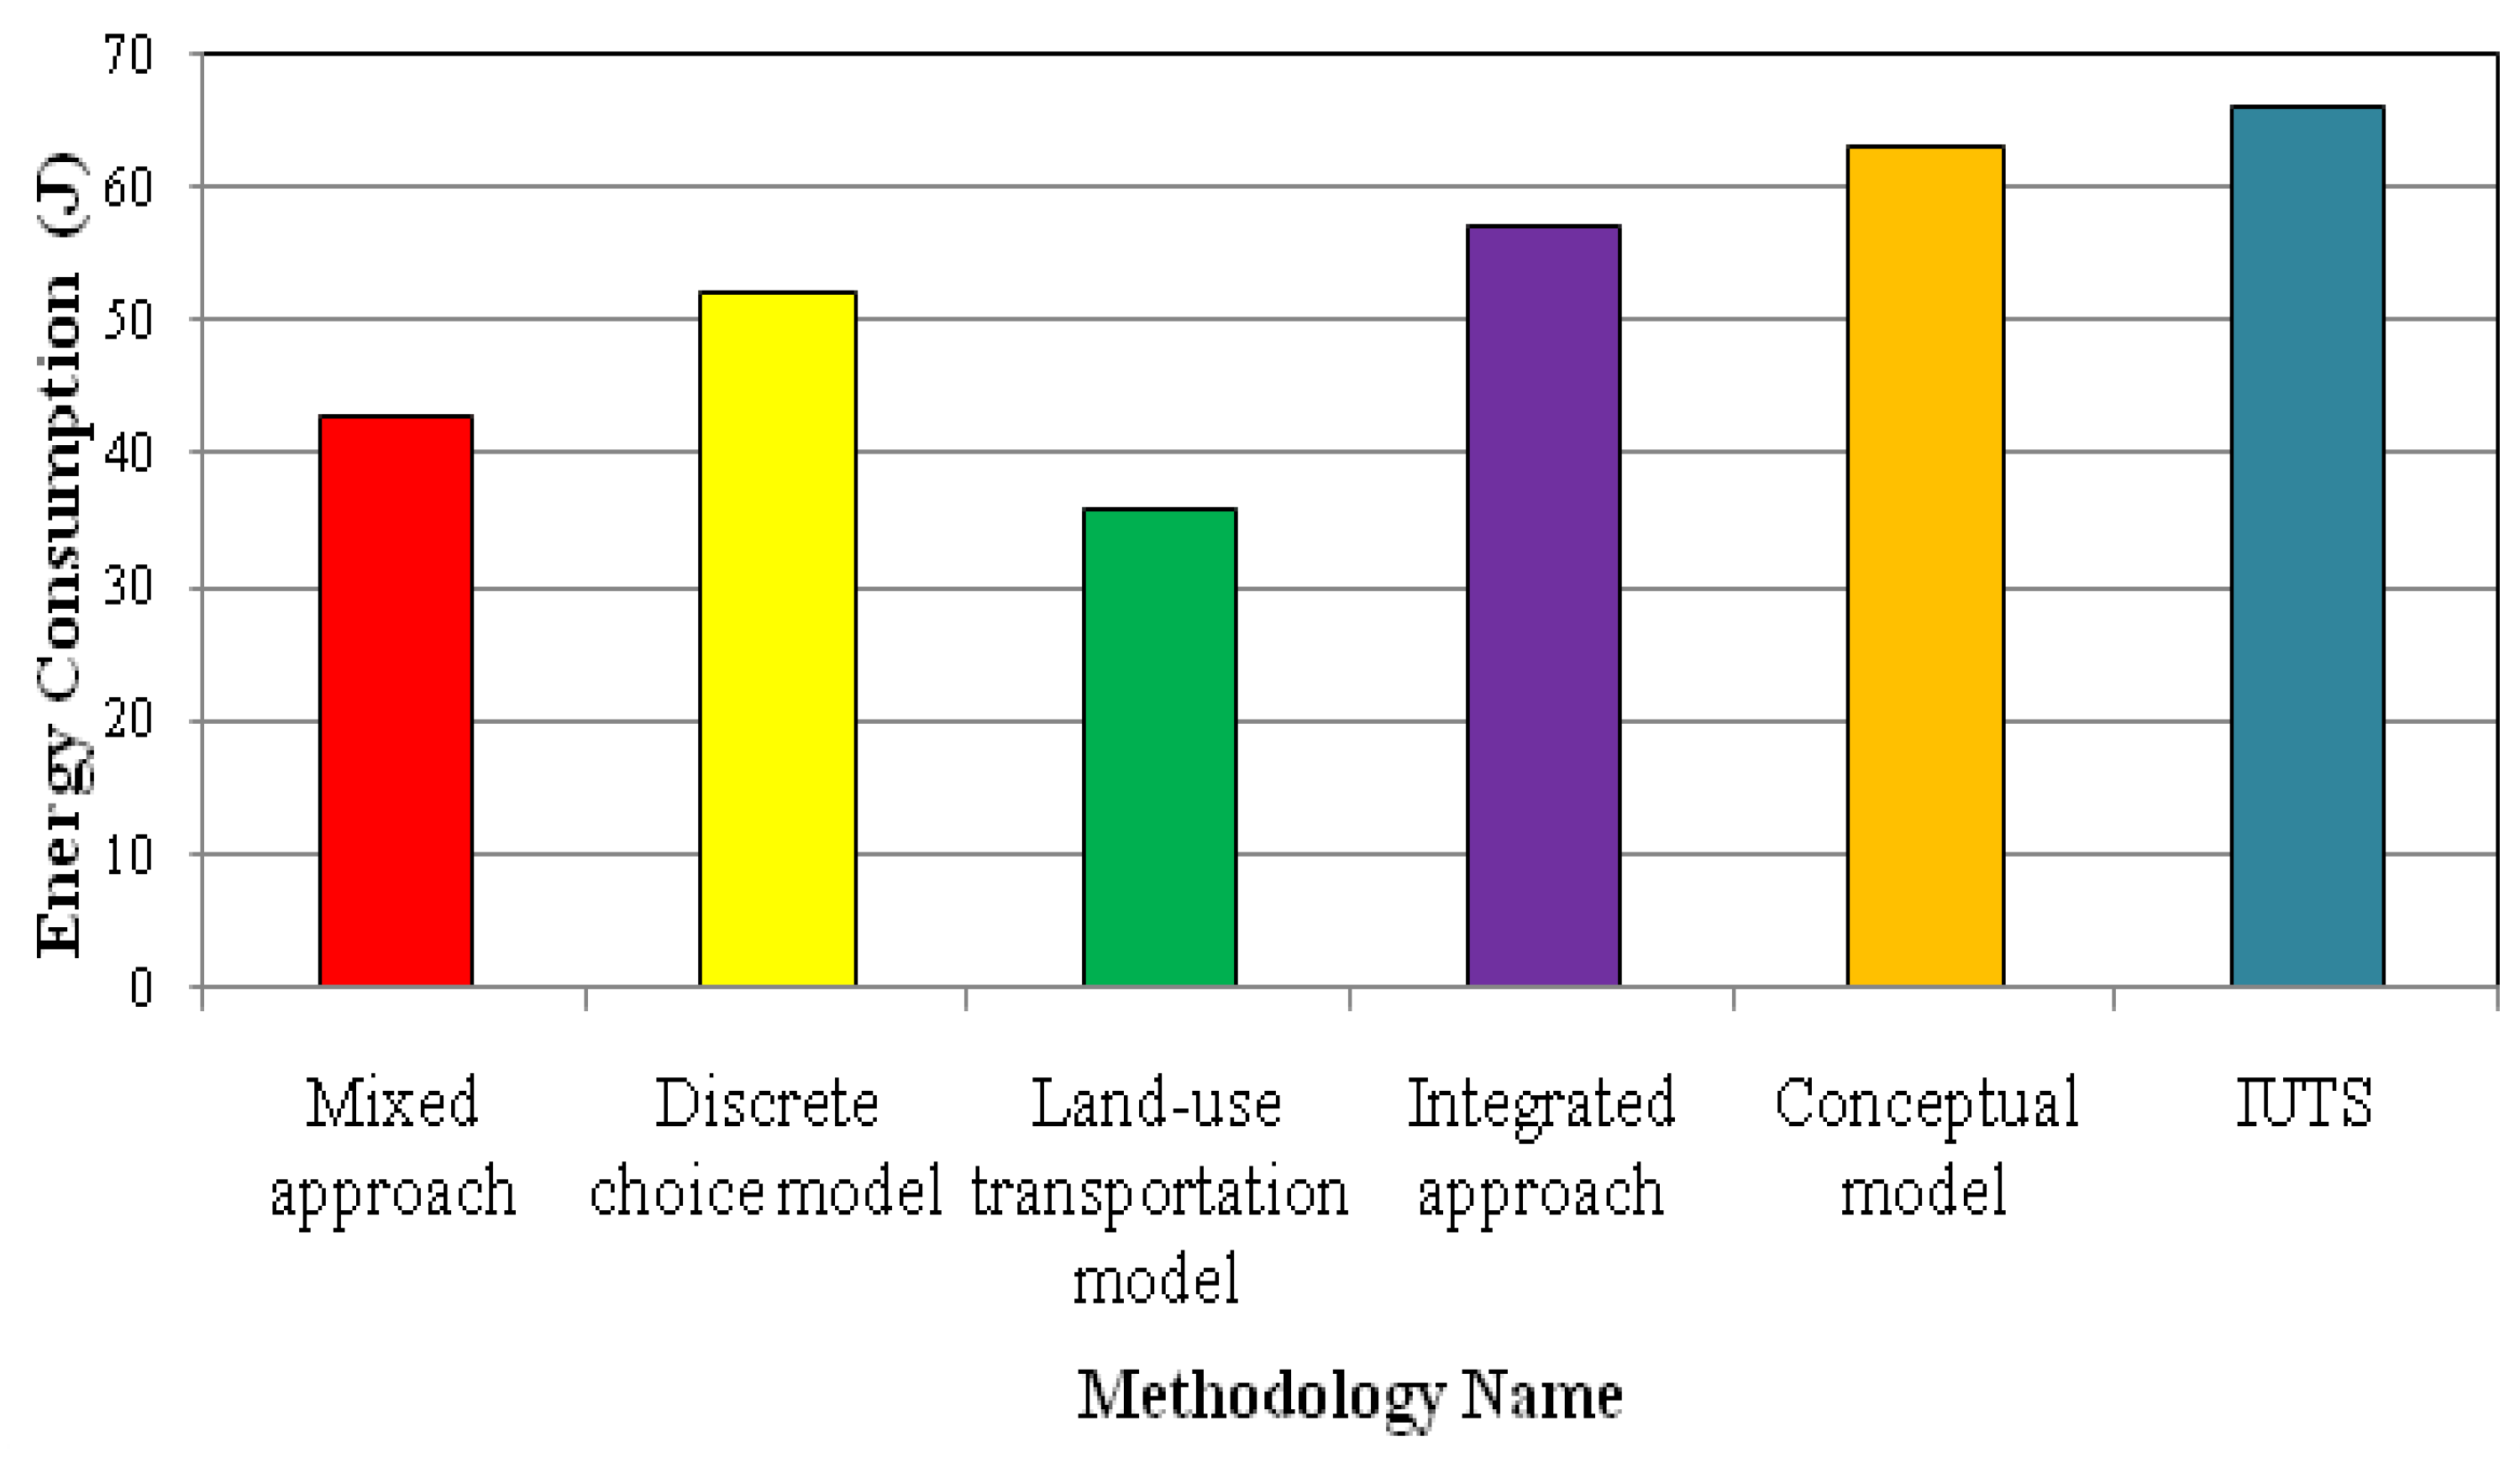
5.3. Performance Application on Transportation

The results of the mixed approach proposed in [21], the discrete choice model [22], the land-use transportation model [23], the integrated approach [24], the conceptual model [25], and the IUTS [26] are discussed with traffic prediction dataset collected from Kaggle. The URL of the dataset is given as [69]. In total, 500 sensor nodes are deployed to conduct the simulation.
Figure 9 illustrates the Energy Consumption ( E C ), as defined in Equation (3), for six different existing methods analyzed with varying numbers of traffic data points ranging from 100 to 1000. For 800 traffic data points, the E C recorded for these methods was 49 J, 58 J, 43 J, 62 J, 68 J, and 72 J, respectively. The data show that the land-use transportation model demonstrates the lowest E C compared to the other methods. This efficiency can be attributed to its centralized network type and mesh network topology, which effectively addresses E C assessment challenges. Additionally, the comprehensive framework of the land-use transportation Mmdel evaluates the impact of city policies on E C by integrating decisions related to actor location and travel behavior. As a result, the land-use transportation model reduces E C by 17%, 32%, 38%, 44%, and 47% compared to the other approaches.
The overall performance results for E C across five existing methods are depicted in Figure 10. The analysis reveals that the land-use transportation model achieved the lowest E C among the evaluated methods. Specifically, the E C values for the existing methods were measured at 43 J, 52 J, 36 J, 57 J, 63 J, and 66 J, respectively. These findings highlight the effectiveness of the land-use transportation model in optimizing energy efficiency compared to the other methods.

5.4. Performance Analysis on Power System Monitoring Application

The results of the existing intelligent power quality monitoring method [12], harmonic resonance mode analysis approach [13], optimal configuration method [14], multi-objective optimization approach [15], and FPM and HRMA [16] are discussed with the power system intrusion dataset collected from kaggle. The URL of the dataset is published as [70]. In total, 500 sensor nodes are deployed to conduct the simulation.
Figure 11 illustrates the C o s t , as defined in Equation (4), for the performance evaluation of five different methods in the context of power systems. For a dataset of 700 power system data points, the C o s t for these methods is recorded as 38 MB, 44 MB, 52 MB, 55 MB, and 64 MB, respectively. As the number of data points increases, the associated C o s t rises correspondingly. Notably, the intelligent power quality monitoring method consistently demonstrates the lowest C o s t among the evaluated methods. This advantage is attributed to its targeted monitoring capabilities, which require minimal resources while enhancing the efficiency of power quality assessments in electrical networks. Additionally, this method is faster, more economical, and easier to implement in real-time applications. Consequently, the intelligent power quality monitoring method reduces C o s t by 15%, 28%, 33%, and 44% compared to the other approaches.
Figure 12 presents the overall performance results regarding the C o s t associated with five existing methods. The analysis reveals that the C o s t for these methods is 35 MB, 41 MB, 38 MB, 51 MB, and 61 MB, respectively. Notably, the intelligent power quality monitoring method demonstrates the lowest C o s t among all methods evaluated. This indicates that it not only effectively addresses power quality issues but also does so in a more cost-efficient manner compared to its counterparts.

5.5. Performance Analysis on Gully Pot Monitoring Application

The results of the existing Sediment accumulation process [17], EU Water Framework [18], STA and FTIR [19], and Maintenance policy [20] are discussed with the gully pot monitoring dataset. The URL of the dataset is published as [71]. In total, 500 sensor nodes are deployed to conduct the simulation.
Figure 13 illustrates the A c c u r a c y , as defined in Equation (5), for the performance evaluation of four different existing methods using varying numbers of gully pot data points ranging from 100 to 1000. For 200 data points, the A c c u r a c y rates recorded are 87% for the Sediment Accumulation Process, 93% for the EU Water Framework, 74% for STA and FTIR, and 80% for the Maintenance Policy. As the number of data points increases, the A c c u r a c y may rise or fall accordingly. Notably, the EU Water Framework exhibits the highest accuracy among the methods, attributable to its utilization of a basal sediment scour deterministic model. This model effectively predicts sediment behavior at various sites by considering future rainfall predictions and sediment source determination, which enhances its A c c u r a c y . Specifically, the A c c u r a c y of the EU Water Framework surpasses that of the Sediment Accumulation Process, STA and FTIR, and Maintenance Policy by 7%, 25%, and 15%, respectively, underscoring its effectiveness in sediment management.
The overall performance Figure 14 outcomes related to A c c u r a c y for four distinct methods. Among these methods, the EU Water Framework demonstrates superior A c c u r a c y , achieving the highest performance in the experiment. The recorded accuracy rates are 89% for the Sediment Accumulation Process, 95% for the EU Water Framework, 76% for STA and FTIR, and 83% for the Maintenance Policy. These results indicate that the EU Water Framework not only outperforms the other methods but also highlights its effectiveness in ensuring accurate assessments in the context of water management.

5.6. Performance Analysis on Solid Waste Monitoring Application

The results of the existing WPAN and Cloud-Assisted Architecture [47], SWM Technique [48], Real-Time Smart Garbage Bin Apparatus [49], PortiK System [50], Solid Waste Management Architecture [51], and ICT-based SWCCS [52] are discussed with a Waste Global Dataset collected from Kaggle. The URL of the dataset is given as [72]. In total, 500 sensor nodes are deployed to conduct the simulation in solid waste monitoring.
Figure 15 illustrates the Execution Time ( E T ) in Equation (6) of six different methods evaluated with varying solid waste data points from 100 to 1000. For 300 data points, the E T s recorded are 33 ms for WPAN and Cloud-Assisted Architecture, 39 ms for SWM Technique, 43 ms for the Real-Time Smart Garbage Bin Apparatus, 48 ms for the PortiK System, 20 ms for Solid Waste Management Architecture, and 53 ms for ICT-based SWCCS. As the number of data points increases, the E T also tends to rise. Notably, the Solid Waste Management Architecture exhibits the shortest E T among the methods, largely due to its integration of Global System for Mobile Communications (GSM) tracking sensors and Bluetooth options for data tracking. Furthermore, waste sorting is enhanced through the use of Convolutional Neural Networks (CNNs) within smart trash bins and sensors, leading to efficient waste management with reduced time consumption. Specifically, the E T of the Solid Waste Management Architecture is decreased by 35%, 45%, 48%, 52%, and 53% compared to other approaches.
Figure 16 presents the E T performance outcomes for six existing methods in solid waste management. The experimental results indicate that the Solid Waste Management Architecture achieves the lowest E T among the methods analyzed. Specifically, the E T recorded for the existing methods are as follows: 39 ms for the WPAN and Cloud-Assisted Architecture, 46 ms for the SWM Technique, 49 ms for the Real-Time Smart Garbage Bin Apparatus, 54 ms for the PortiK System, 26 ms for the Solid Waste Management Architecture, and 56 ms for the ICT-based SWCCS. This performance analysis highlights the efficiency of the Solid Waste Management Architecture, demonstrating its effectiveness in reducing E T compared to the other frameworks.

5.7. Performance Analysis on Commercial Asset Tracking Application

The results of the existing new asset tracking architecture [59], optimization decomposition framework [60], and optimization framework [61] are discussed with the CATS (Consolidated Asset Tracking System) dataset collected from Kaggle. The URL of the dataset is given as [73]. In total, 500 sensor nodes are deployed to conduct the simulation in commercial asset tracking.
Figure 17 illustrates the Error Rate ( E R ) in Equation (7) performance of three different methods evaluated across various asset data points ranging from 100 to 1000. At 600 asset data points, the E R for these methods are recorded at 27%, 34%, and 44%, respectively. As the number of data points increases, the E R correspondingly rises. Notably, the New Asset Tracking Architecture exhibits a significantly lower E R compared to the other two frameworks. This improvement can be attributed to its use of a hybrid RFID thermal sensor in distributed networks, which enhances asset tracking accuracy and reliability. The architecture facilitates seamless asset tracking and searching through the integration of radio frequency recognition, Bluetooth low-energy tags, and smartphones. Additionally, it optimizes battery life and distance estimation accuracy, resulting in a minimal E R . Specifically, the New Asset Tracking Architecture reduces the E R by 21% and 42% compared to the other frameworks, underscoring its superior performance.
Figure 18 presents the E R performance of three different methods. The recorded E R s are 26%, 33%, and 44%, respectively. These results demonstrate that the New Asset Tracking Architecture achieves the lowest error rate, significantly reducing errors compared to the other two methods. This indicates its effectiveness in minimizing inaccuracies and improving overall performance in asset tracking compared to existing frameworks.

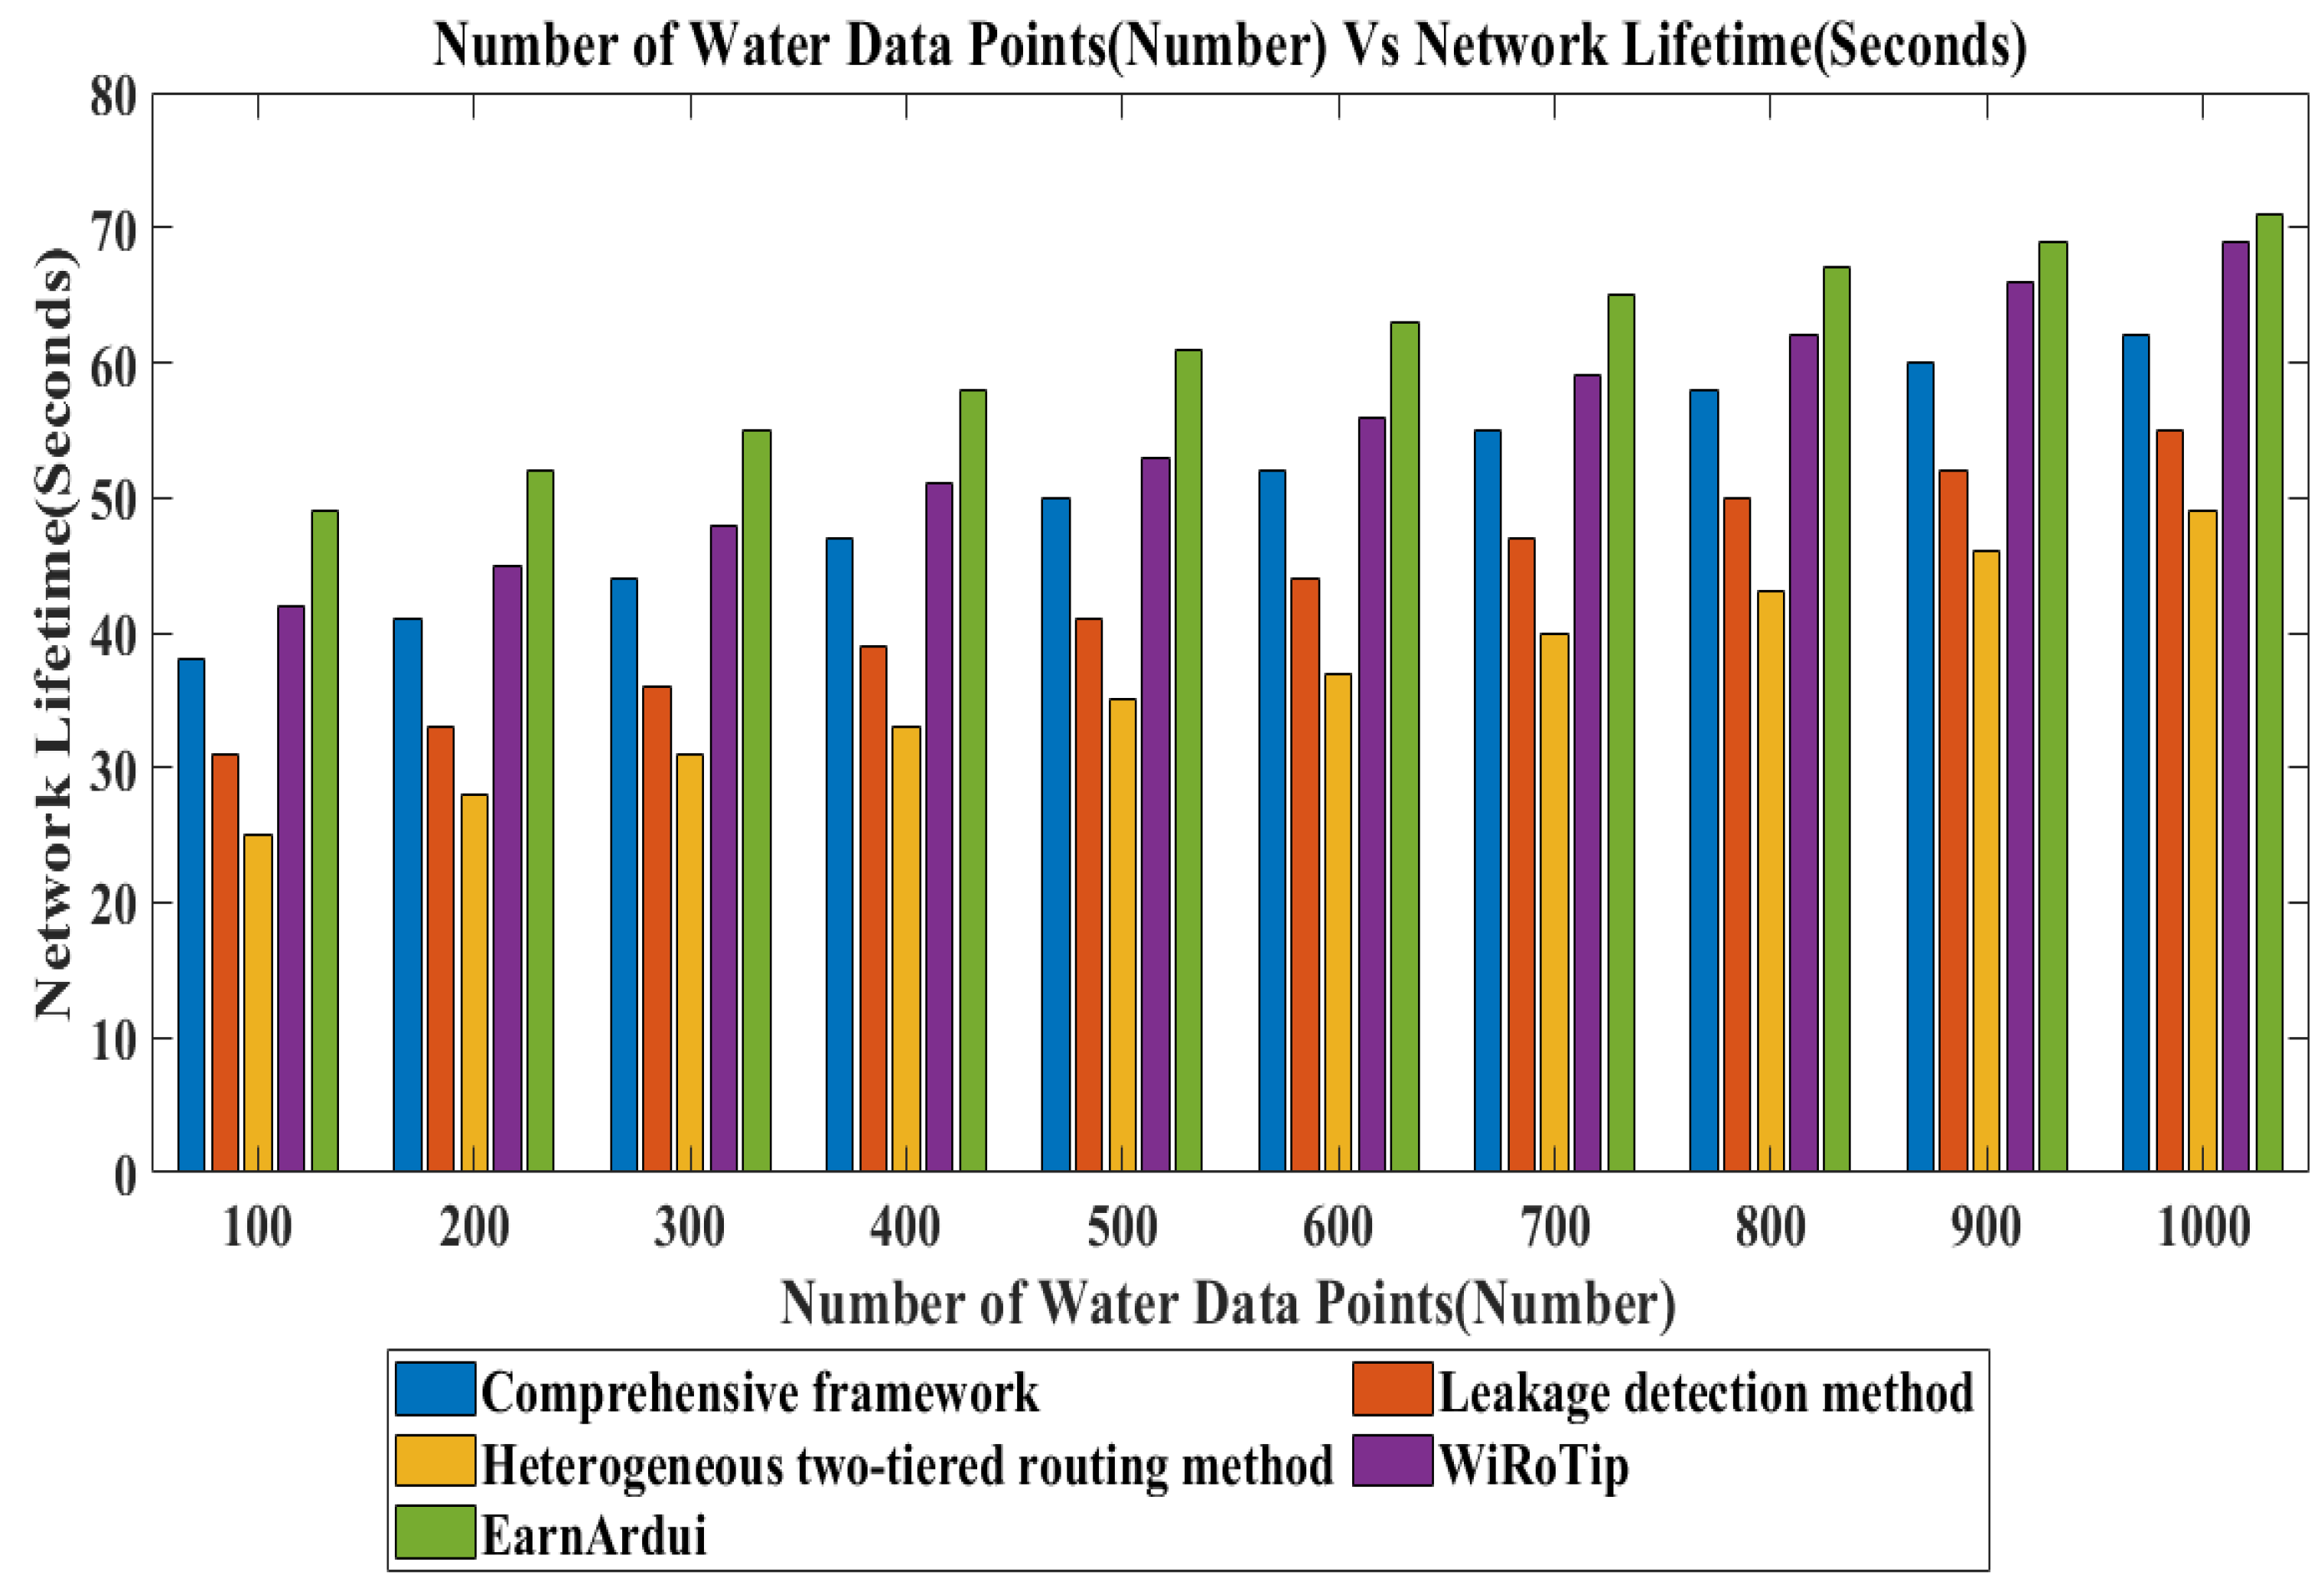
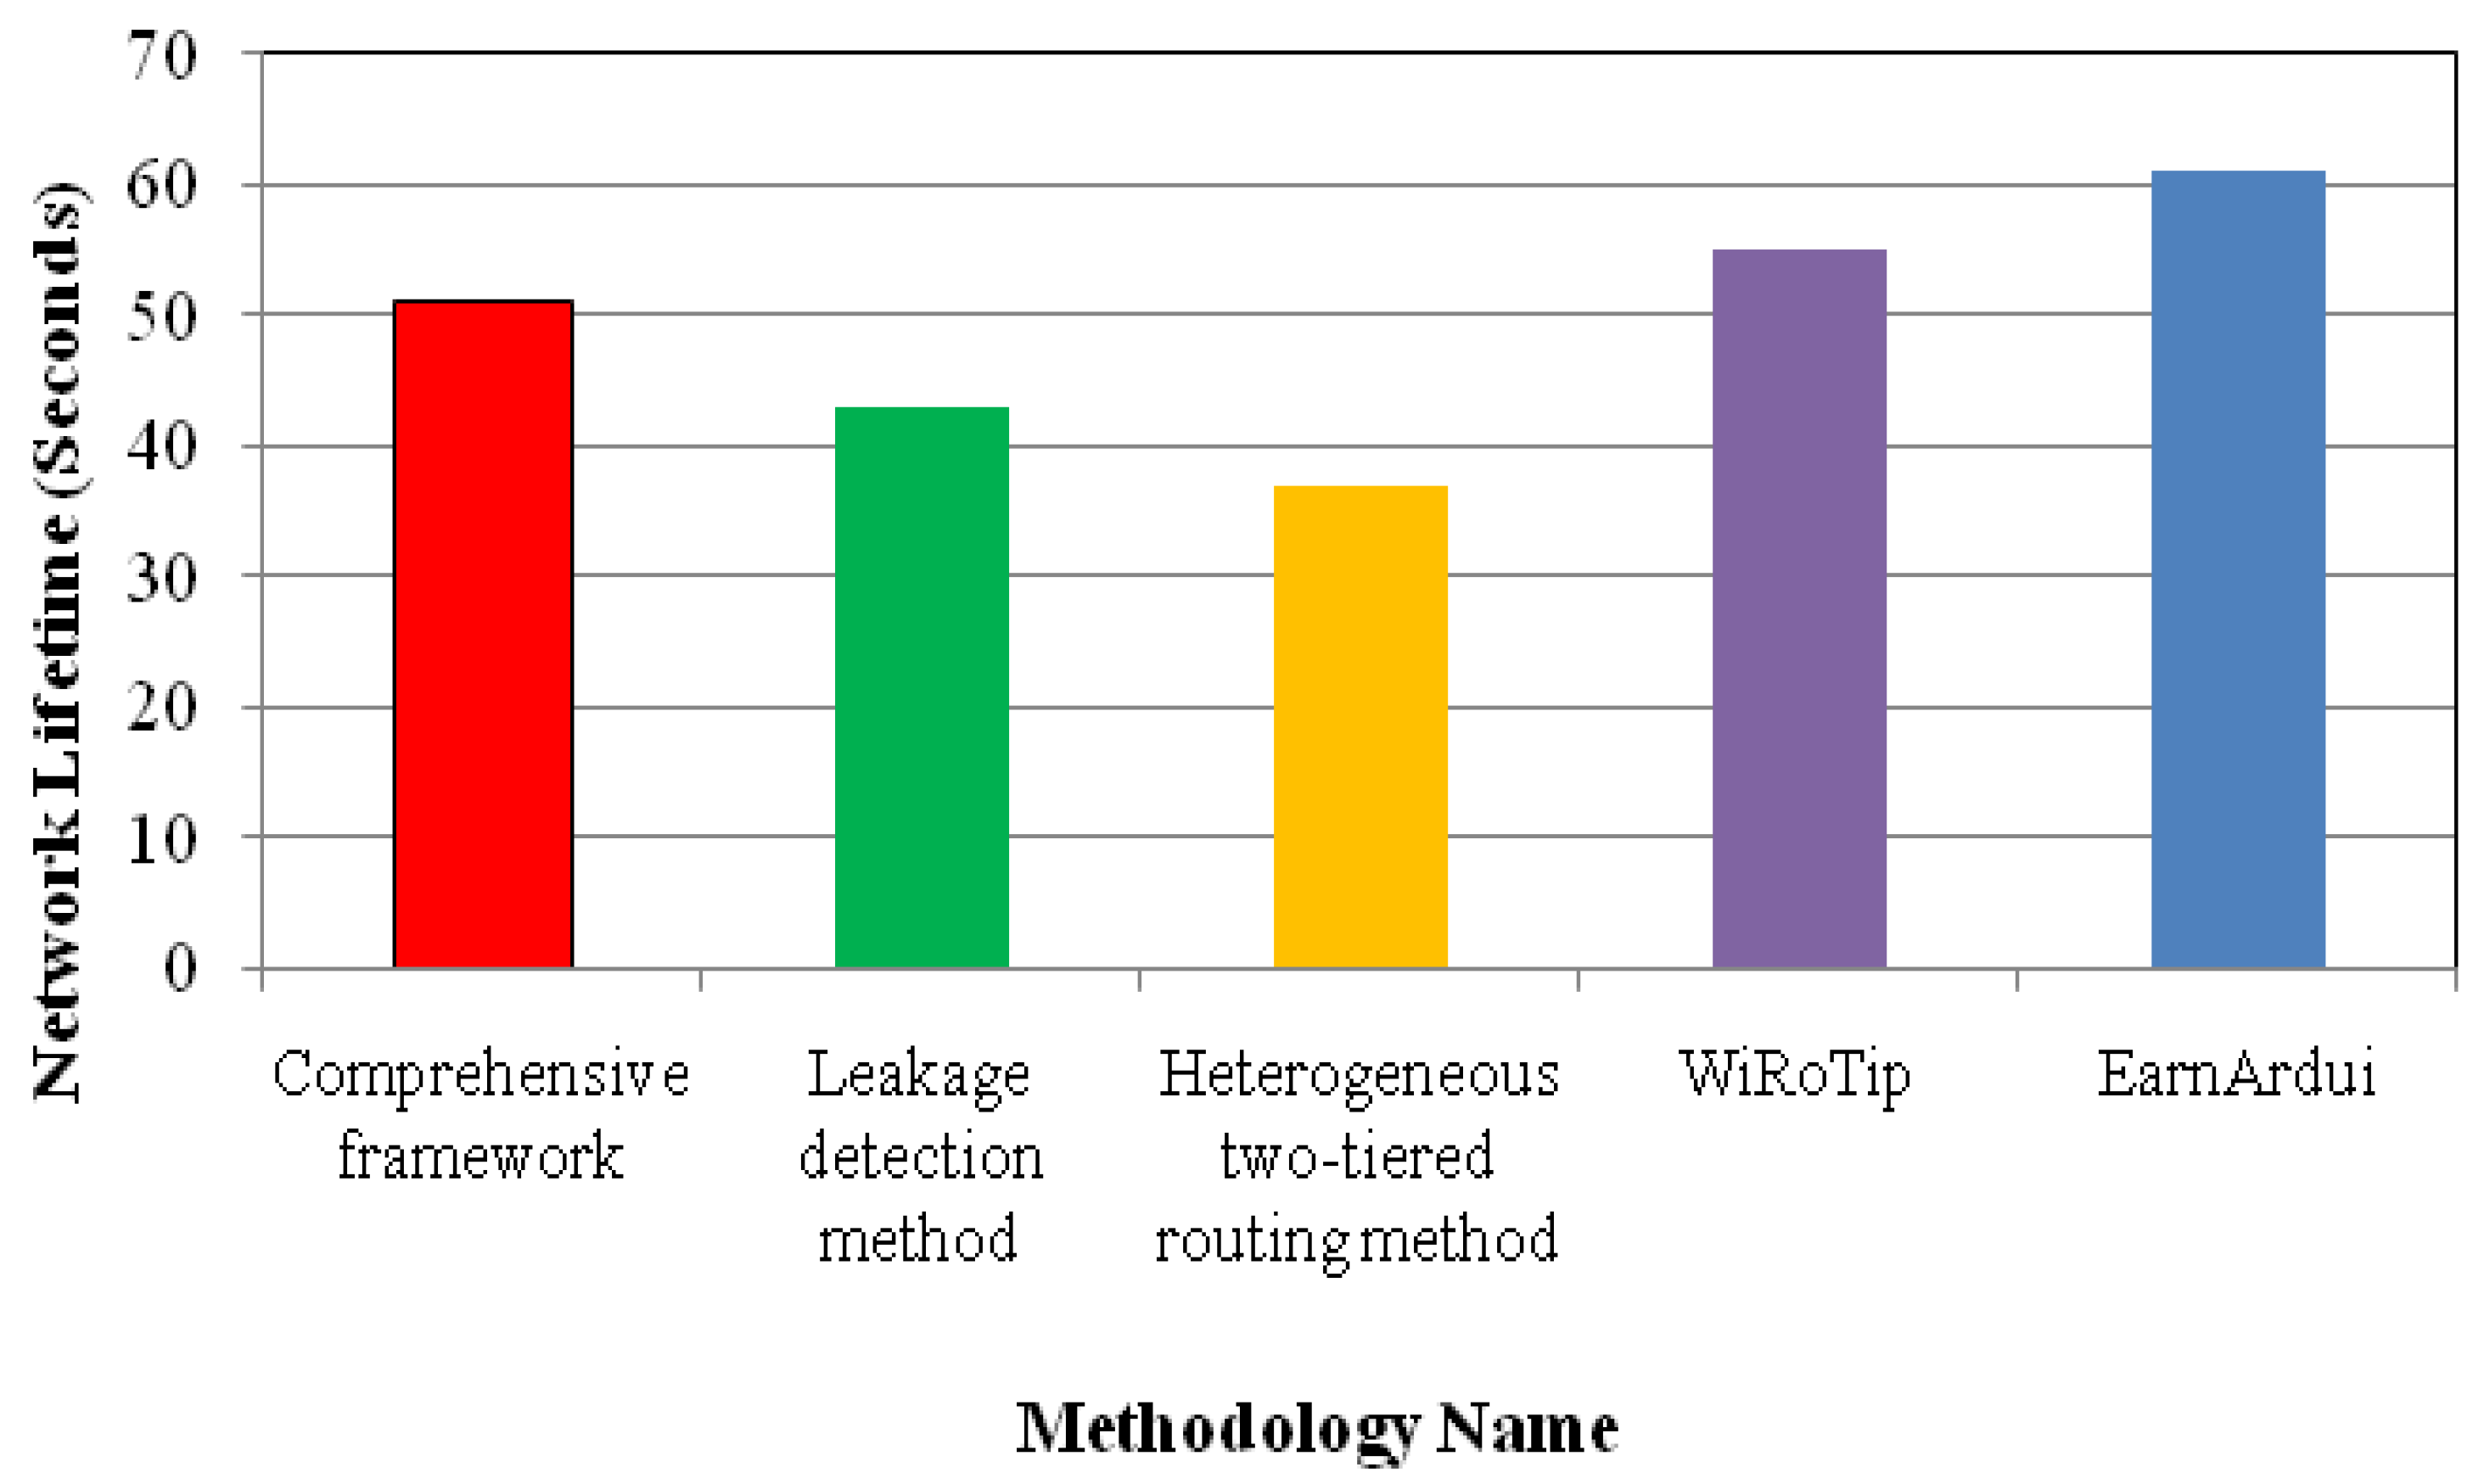
5.8. Performance Analysis on Water Pipeline Tracking Application

The results of the existing comprehensive framework [54], leakage detection method [55], heterogeneous two-tiered routing method [56], WiRoTip [57], and EarnArdui [58] are discussed with the LeakDB dataset collected from GitHub. The URL of the dataset is given as [74]. In total, 500 sensor nodes are deployed to conduct the simulation in water pipeline tracking.
Figure 19 illustrates the Network Lifetime ( N L ) in Equation (8) of five different methods—across varying asset data points, ranging from 100 to 1000. At 1000 data points, the N L s for these methods are 62 s, 55 s, 49 s, 69 s, and 71 s, respectively. As the number of data points increases, the N L also shows a corresponding rise. Notably, EarnArdui demonstrates the highest N L among the methods, attributed to its use of a wireless sensor network testbed for water pipeline monitoring. This setup enhances the efficiency of the water distribution system monitoring, leading to a longer network lifetime. Specifically, EarnArdui outperforms the other approaches by 21%, 44%, 69%, and 11%, respectively, highlighting its superior performance.
The overall measurement of the N L for five different existing methods is shown in Figure 20. The recorded N L are 51 s, 43 s, 37 s, 55 s, and 61 s, respectively. From this analysis, it is evident that the EarnArdui method achieves the longest N L , outperforming the other methods. This indicates a significant improvement in EarnArdui’s efficiency, making it more effective in extending network operation than the alternatives.

5.9. Performance Analysis on Gas Monitoring Application

The results of the existing early-warning gas leakage monitoring system [41], gas detection method [42], deep learning feature engineering-based approach [43], fast operando monitoring technique [44], optically powered and safe gas monitoring scheme [45], and gas distribution pipeline network model [46] are discussed with the fire, smoke, and gas leakage detection dataset. The URL of the dataset is given as [75]. In total, 500 sensor nodes are deployed to conduct the simulation in gas monitoring.
Figure 21 presents the Throughput (T) in Equation (9) of six gas monitoring methods across varying asset data points, ranging from 100 to 1000. Specifically, at 400 gas data points, the T values for the exiting approaches are 25 kbps, 28 kbps, 38 kbps, 48 kbps, 51 kbps, and 60 kbps, respectively. As the number of data points increases, T correspondingly rises. Notably, the early-warning gas leakage monitoring system demonstrates a higher T compared to the other methods. This is attributed to the use of Tunable Diode Laser Absorption Spectroscopy (TDLAS) gas sensors, which enhance detection efficiency due to their compact size and precision. Additionally, the system benefits from real-time data processing and storage on a cloud platform, further contributing to higher T. The early-warning system shows improvements in T by 13%, 40%, 47%, 51%, and 58% compared to other approaches.
Figure 22 illustrates the T performance of six distinct gas monitoring methods. The T values recorded are 28 kbps, 32 kbps, 46 kbps, 52 kbps, 55 kbps, and 64 kbps for existing approaches. These results show that while the early-warning gas leakage monitoring system achieves competitive performance, the Gas Distribution Pipeline Network Model delivers the highest T among the methods. Despite this, the early-warning gas leakage monitoring system demonstrates improved efficiency compared to several other approaches, indicating its effectiveness in enhancing gas leakage detection and real-time monitoring capabilities.

6. Conclusions and Future Work

This paper presented a comprehensive survey of WSN applications in urban environments. The survey highlights significant advancements and challenges across various domains, including disaster response, healthcare, gas monitoring, transportation, and solid waste management. These applications showcase the versatility of WSNs in enhancing urban operations by contributing to proactive risk management, efficient response coordination, and sustainable urban development through integrating geo-spatial data, IoT devices, and advanced sensor technologies. The survey analyzed performance metrics such as energy consumption, network lifetime, end-to-end delay, efficiency, routing overhead, throughput, computation cost (Cost), computational overhead, reliability, loss rate, and execution time. These are critical in evaluating the effectiveness and feasibility of WSN applications in urban environments. Reducing end-to-end delay is crucial for real-time applications such as disaster response and healthcare monitoring, where timely data transmission can save lives. Efficiency and routing overhead are also key considerations; high efficiency with minimal routing overhead ensures that data are transmitted effectively without over-burdening the network infrastructure. The results of the proposed method obtain a maximum of 16%, 36%, 20%, and 42%, accuracy, network lifetime, efficiency, and throughput. Also, the proposed method is to provide less than 36%, 30%, 46%, 35%, and 32% energy consumption, computation cost, execution time, error rate, and computational overhead than the existing methods.
The limitation of the work is the failure to combine IoT devices and sensor networks. Integrating IoT devices and sensor networks is crucial for proactive monitoring of critical urban systems, such as transportation, energy, and water management, enabling real-time detection and the resolution of issues. Also, the optimization method of the WSN application is not considered. In addition, the scalability is difficult to measure in the real world. Computation cost and computational overhead impact the processing capabilities of sensors, affecting their ability to analyze and transmit data without excessive delays or resource usage. Continued research and innovation in optimizing these performance aspects will enhance urban areas’ sustainability, resilience, and overall efficiency, leading to smarter, more responsive cities. Advanced data analytics provide valuable insights for decision-making, helping city officials optimize urban planning, reduce environmental impact, and enhance the quality of life for residents.
In future work, IoT devices and sensor networks will be combined. The optimization method of the WSN application will be focused on WSN. The embracing of these methodologies allows urban areas to become more resilient and responsive to the evolving needs of their inhabitants, fostering smarter and more livable cities. This survey’s performance analysis identifies the most efficient WSN methodologies for urban applications by evaluating key metrics like scalability, energy consumption, network lifetime, and delay, providing a valuable framework for future research and practical deployments in urban settings.

Author Contributions

All authors contributed equally to the work. All authors have read and agreed to the published version of the manuscript.

Funding

The work in this paper was supported, in part, by the Open Access Program from the American University of Sharjah. This paper represents the opinions of the author(s) and does not mean to represent the position or opinions of the American University of Sharjah.

Conflicts of Interest

The authors declare no conflicts of interest.

References

  1. Nguyen, H.A.; Le, T.H.; Azzi, M.; Ha, Q.P. Monitoring and estimation of urban emissions with low-cost sensor networks and deep learning. Ecol. Inform. 2024, 82, 102750. [Google Scholar] [CrossRef]
  2. Zhao, H.; Kam, K.A.; Kymissis, I.; Mailloux, B.J.; Culligan, P.J. A LoRaWAN-based environmental sensing network for urban green space monitoring with demonstrated application for stormwater management. Sustain. Cities Soc. 2024, 115, 105852. [Google Scholar] [CrossRef]
  3. Ragnoli, M.; Esposito, P.; Stornelli, V.; Barile, G.; De Santis, E.; Sciarra, N. A LoRa-based Wireless Sensor Network monitoring system for urban areas subjected to landslide. In Proceedings of the CCIOT ’23: Proceedings of the 2023 8th International Conference on Cloud Computing and Internet of Things, Okinawa, Japan, 22–24 September 2023; pp. 91–97. [Google Scholar] [CrossRef]
  4. Xu, T.; Guo, B.; Ruan, C. RETRACTED ARTICLE: Urban Green Space Planning Based on Remote Sensing Image Enhancement and Wireless Sensing Technology. Mob. Netw. Appl. 2024, 1572–8153. [Google Scholar] [CrossRef]
  5. Khalifeh, A.; Darabkh, K.A.; Khasawneh, A.M. Wireless Sensor Networks for Smart Cities: Network Design, Implementation and Performance Evaluation. Electronics 2024, 10, 218. [Google Scholar] [CrossRef]
  6. Nguyen, H.A.D.; Ha, Q.P. Wireless Sensor Network Dependable Monitoring for Urban Air Quality. IEEE Access 2024, 10, 40051–40062. [Google Scholar] [CrossRef]
  7. Bhaskar, D.R.S.; L, S.B.; Kusanur, D.V. Smart And Secure Urban Environment Monitoring Using Wireless Sensor Networks. Int. J. Creat. Res. Thought IJCRT 2023, 11, h497–h506. [Google Scholar]
  8. M, J.P.; Singh, K.; Chaudhary, H. Research advancements in ocean environmental monitoring systems using wireless sensor networks: A review. TELKOMNIKA Telecommun. Comput. Electron. Control 2023, 21, 513–527. [Google Scholar]
  9. Aldawsari, H. A blockchain-based approach for secure energy-efficient IoT-based Wireless Sensor Networks for smart cities. Alex. Eng. J. 2025, 126, 1–7. [Google Scholar] [CrossRef]
  10. Shakhov, V.; Materukhin, A.; Sokolova, O.; Koo, I. Optimizing Urban Air Pollution Detection Systems. Sensors 2022, 22, 4767. [Google Scholar] [CrossRef]
  11. Liu, Y.; Li, Q. Coverage Algorithm Based on Perceived Environment Around Nodes in Mobile Wireless Sensor Networks. Wirel. Pers. Commun. 2023, 128, 2725–2740. [Google Scholar] [CrossRef]
  12. Singh, R.R.; S.M., Y.; S.C., S.; V., I.; V., V.; P., S.; V., S. IoT embedded cloud-based intelligent power quality monitoring system for industrial drive application. Future Gener. Comput. Syst. 2020, 112, 884–898. [Google Scholar] [CrossRef]
  13. Shakeri, S.; Koochi, M.H.R.; Ansari, H.; Esmaeili, S. Optimal power quality monitor placement to ensure reliable monitoring of sensitive loads in the presence of voltage sags and harmonic resonances conditions. Electr. Power Syst. Res. 2022, 212, 108623. [Google Scholar] [CrossRef]
  14. Tan, M.G.; Zhang, C.; Chen, B. Configuration of power quality monitor considering voltage sag location. Electr. Power Syst. Res. 2023, 223, 109681. [Google Scholar] [CrossRef]
  15. Branco, H.M.G.C.; Oleskovicz, M.; Coury, D.V.; Delbem, A.C.B. Multiobjective optimization for power quality monitoring allocation considering voltage sags in distribution systems. Int. J. Electr. Power Energy Syst. 2018, 97, 1–10. [Google Scholar] [CrossRef]
  16. Bottura, F.B.; Oleskovicz, M. Optimal allocation of power quality monitors considering short-duration voltage variations and parallel harmonic resonance conditions in power distribution systems. Int. J. Electr. Power Energy Syst. 2023, 144, 108580. [Google Scholar] [CrossRef]
  17. Wei, H.; Flanagan, K.; Lundy, L.; Muthanna, T.M.; Viklander, M. A study of 101 organic substances in gully pot sediments accumulated over a one-year period in Stockholm, Sweden. Sci. Total Environ. 2023, 894, 165028. [Google Scholar] [CrossRef]
  18. Wei, H.; Muthanna, T.M.; Lundy, L.; Viklander, M. An assessment of gully pot sediment scour behaviour under current and potential future rainfall conditions. J. Environ. Manag. 2021, 282, 111911. [Google Scholar] [CrossRef]
  19. Mengistu, D.; Heistad, A.; Coutris, C. Tire wear particles concentrations in gully pot sediments. Sci. Total Environ. 2021, 769, 144785. [Google Scholar] [CrossRef]
  20. Chen, Y.; Cowling, P.; Polack, F.; Remde, S.; Mourdjis, P. Dynamic optimisation of preventative and corrective maintenance schedules for a large scale urban drainage system. Eur. J. Oper. Res. 2017, 257, 494–510. [Google Scholar] [CrossRef]
  21. Thondoo, M.; Marquet, O.; Márquez, S.; Nieuwenhuijsen, M.J. Small cities, big needs: Urban transport planning in cities of developing countries. J. Transp. Health 2020, 19, 100944. [Google Scholar] [CrossRef]
  22. Obregón-Biosca, S.A. Choice of transport in urban and periurban zones in metropolitan area. J. Transp. Geogr. 2022, 100, 103331. [Google Scholar] [CrossRef]
  23. Kii, M.; Akimoto, K.; Doi, K. Measuring the impact of urban policies on transportation energy saving using a land-use transport model. IATSS Res. 2014, 37, 98–109. [Google Scholar] [CrossRef]
  24. Adhvaryu, B.; Kumar, S. Public transport accessibility mapping and its policy applications: A case study of Lucknow, India. Case Stud. Transp. Policy 2021, 9, 1503–1517. [Google Scholar] [CrossRef]
  25. Glazener, A.; Sanchez, K.; Ramani, T.; Zietsman, J.; Nieuwenhuijsen, M.J.; Mindell, J.S.; Fox, M.; Khreis, H. Fourteen pathways between urban transportation and health: A conceptual model and literature review. J. Transp. Health 2021, 21, 101070. [Google Scholar] [CrossRef]
  26. Fierek, S.; Zak, J. Planning of an integrated urban transportation system based on macro-simulation and MCDM/A methods. Procedia-Soc. Behav. Sci. 2012, 54, 567–579. [Google Scholar] [CrossRef]
  27. Etinaya, N.; Egbua, C.; Murray, V. Building Urban Resilience for Disaster Risk Management and Disaster Risk Reduction. Procedia Eng. 2018, 212, 575–582. [Google Scholar] [CrossRef]
  28. Peixoto, J.P.J.; Costa, D.G.; de J. S. da Franca Rocha, W.; Portugal, P.; Vasques, F. On the positioning of emergencies detection units based on geospatial data of urban response centres. Sustain. Cities Soc. 2023, 97, 104713. [Google Scholar] [CrossRef]
  29. Zhou, S.Y.; Huang, A.C.; Wu, J.; Wang, Y.; Wang, L.S.; Zhai, J.; Xing, Z.X.; Jiang, J.C.; Huang, C.F. Establishment and assessment of urban meteorological disaster emergency response capability based on modeling methods. Int. J. Disaster Risk Reduct. 2022, 79, 103180. [Google Scholar] [CrossRef]
  30. Peng, T.; Ke, W. Urban fire emergency management based on big data intelligent processing system and Internet of Things. Optik 2023, 273, 170433. [Google Scholar] [CrossRef]
  31. Palmieri, F.; Ficco, M.; Pardi, S.; Castiglione, A. A cloud-based architecture for emergency management and first responders localization in smart city environments. Comput. Electr. Eng. 2016, 56, 810–830. [Google Scholar] [CrossRef]
  32. Rana, I.A.; Asim, M.; Aslam, A.B.; Jamshed, A. Disaster management cycle and its application for flood risk reduction in urban areas of Pakistan. Urban Clim. 2021, 38, 100893. [Google Scholar] [CrossRef]
  33. Lee, J.W.; Jeong, Y.; Oh, Y.S.; Lee, J.C.; Ahn, N.; Lee, J.; Yoon, S.H. An integrated approach to intelligent urban facilities management for real-time emergency response. Autom. Constr. 2013, 30, 256–264. [Google Scholar] [CrossRef]
  34. Post, J.A.B.; Pothof, I.W.M.; Dirksen, J.; Baars, E.J.; Langeveld, J.G.; Clemens, F.H.L.R. Monitoring and statistical modelling of sedimentation in gully pots. Water Res. 2016, 88, 245–256. [Google Scholar] [CrossRef]
  35. Alhazri, W.A.; Bugis, B.A. Electronic healthcare applications and programs among healthcare workers in Riyadh and conflict management. J. Taibah Univ. Med Sci. 2022, 17, 564–572. [Google Scholar] [CrossRef]
  36. Faust, O.; Hagiwara, Y.; Hong, T.J.; Lih, O.S.; Acharya, U.R. Deep learning for healthcare applications based on physiological signals: A review. Comput. Methods Programs Biomed. 2018, 161, 1–13. [Google Scholar] [CrossRef]
  37. Han, K.; Zo, H. Understanding the mobile healthcare applications continuance: The regulatory focus perspective. Int. J. Med. Inform. 2023, 177, 105161. [Google Scholar] [CrossRef] [PubMed]
  38. Priyadarshini, R.; Shaikh, N.; Godi, R.K.; Dhal, P.K.; Sharma, R.; Perwej, Y. IoT-based power control systems framework for healthcare applications. Meas. Sensors 2023, 25, 100660. [Google Scholar] [CrossRef]
  39. Anjum, M.; Shahab, S.; Whangbo, T.; Ahmad, S. Preventing overloaded dissemination in healthcare applications using NonDelay tolerant dissemination technique. Heliyon 2023, 9, e18783. [Google Scholar] [CrossRef]
  40. Pashazadeh, A.; Navimipour, N.J. Big data handling mechanisms in the healthcare applications: A comprehensive and systematic literature review. J. Biomed. Inform. 2018, 82, 47–62. [Google Scholar] [CrossRef]
  41. Guo, K.; Yang, P.; Guo, D.H.; Liu, Y. Gas leakage monitoring with mobile wireless sensor networks. Procedia Comput. Sci. 2019, 154, 430–438. [Google Scholar] [CrossRef]
  42. Jin, W.; Ho, H.L.; Cao, Y.C.; Ju, J.; Qi, L.F. Gas detection with micro- and nano-engineered optical fibers. Opt. Fiber Technol. 2013, 19, 741–759. [Google Scholar] [CrossRef]
  43. Chang, G.; Chang, H. Underground abnormal sensor condition detection based on gas monitoring data and deep learning image feature engineering. Heliyon 2023, 9, e22026. [Google Scholar] [CrossRef] [PubMed]
  44. Lyu, S.; Li, N.; Sun, L.; Jiao, S.; Chen, H.; Song, W.L. Rapid operando gas monitor for commercial lithium-ion batteries: Gas evolution and relation with electrode materials. J. Energy Chem. 2022, 72, 14–25. [Google Scholar] [CrossRef]
  45. Chen, Y.; Silvestri, L.; Lei, X.; Ladouceur, F. Optically powered gas monitoring system using single-mode fibre for underground coal mines. Int. J. Coal Sci. Technol. 2022, 9, 26. [Google Scholar] [CrossRef]
  46. Abbas, Z.; Anjum, M.R.; Younus, M.U.; Chowdhry, B.S. Monitoring of gas distribution pipelines network using wireless sensor networks. Wirel. Pers. Commun. 2021, 117, 2575–2594. [Google Scholar] [CrossRef]
  47. Joshi, L.M.; Bharti, R.K.; Singh, R.; Malik, P.K. Real-time monitoring of solid waste with customized hardware and Internet of Things. Comput. Electr. Eng. 2022, 102, 108262. [Google Scholar] [CrossRef]
  48. Kumar, S.; Dhar, H.; Nair, V.V.; Janki, R.; Govani, J.; Arya, S.; Bhattacharya, J.K.; Vaidya, A.N.; Akolkar, A.B. Environmental quality monitoring and impact assessment of solid waste dumpsites in high altitude sub-tropical regions. J. Environ. Manag. 2019, 252, 109681. [Google Scholar] [CrossRef]
  49. Abuga, D.; Raghava, N.S. Real-time smart garbage bin mechanism for solid waste management in smart cities. Sustain. Cities Soc. 2021, 75, 103347. [Google Scholar] [CrossRef]
  50. Cuingnet, R.; Ladegaillerie, Y.; Jossent, J.; Maitrot, A.; Chedal-Anglay, J.; Richard, W.; Bernard, M.; Woolfenden, J.; Birot, E.; Chenu, D. PortiK: A computer vision based solution for real-time automatic solid waste characterization—Application to an aluminium stream. Waste Manag. 2022, 150, 267–279. [Google Scholar] [CrossRef]
  51. Rahman, M.W.; Islam, R.; Hasan, A.; Bithi, N.I.; Hasan, M.M.; Rahman, M.M. Intelligent waste management system using deep learning with IoT. J. King Saud Univ.-Comput. Inf. Sci. 2022, 34, 2072–2087. [Google Scholar] [CrossRef]
  52. Lu, X.; Pu, X.; Han, X. Sustainable smart waste classification and collection system: A bi-objective modeling and optimization approach. J. Clean. Prod. 2020, 276, 124183. [Google Scholar] [CrossRef]
  53. Hannan, M.A.; Begum, R.A.; Al-Shetwi, A.Q.; Ker, P.J.; Mamun, M.A.A.; Hussain, A.; Basri, H.; Mahlia, T.M.I. Waste collection route optimization model for linking cost saving and emission reduction to achieve sustainable development goals. Sustain. Cities Soc. 2020, 62, 102393. [Google Scholar] [CrossRef]
  54. Ayadi, A.; Ghorbel, O.; Salah, M.S.B.; Abid, M. A framework of monitoring water pipeline techniques based on sensors technologies. J. King Saud Univ.-Comput. Inf. Sci. 2022, 34, 47–57. [Google Scholar] [CrossRef]
  55. Liu, Y.; Ma, X.; Li, Y.; Tie, Y.; Zhang, Y.; Gao, J. Water pipeline leakage detection based on machine learning and wireless sensor networks. Sensors 2019, 19, 5086. [Google Scholar] [CrossRef]
  56. Elleuchi, M.; Boujeleben, M.; Abid, M. Energy-efficient routing model for water pipeline monitoring based on wireless sensor networks. Int. J. Comput. Appl. 2022, 44, 3–11. [Google Scholar] [CrossRef]
  57. Karray, F.; Triki, M.; Jmal, M.W.; Abid, M.; Obeid, A.M. WiRoTip: An IoT-based Wireless Sensor Network for water pipeline monitoring. Int. J. Electr. Comput. Eng. 2018, 8, 3250–3258. [Google Scholar] [CrossRef]
  58. Karray, F.; Jmal, M.W.; Abid, M.; Obeid, A.M.; BenSaleh, M.S. Demo: EarnArdui—A Wireless Sensor Network Testbed for Water Pipeline Monitoring. In Proceedings of the International Conference on Embedded Wireless Systems and Networks, Uppsala, Sweden, 20–22 February 2017; pp. 244–245. [Google Scholar]
  59. Bisio, I.; Sciarrone, A.; Zappatore, S. A new asset tracking architecture integrating RFID, Bluetooth Low Energy tags and ad hoc smartphone applications. Pervasive Mob. Comput. 2016, 31, 79–93. [Google Scholar] [CrossRef]
  60. Zhuang, L.Q.; Liu, W.; Zhang, J.B.; Zhang, D.H.; Kamajaya, I. Distributed asset tracking using wireless sensor network. In Proceedings of the Emerging Technologies Factory Automation Conference, Hamburg, Germany, 15–18 September 2008; pp. 1–15. [Google Scholar]
  61. Pietrabissa, A.; Poli, C.; Ferriero, D.G.; Grigioni, M. Optimal planning of sensor networks for asset tracking in hospital environments. Decis. Support Syst. 2013, 55, 304–313. [Google Scholar] [CrossRef]
  62. Haseeb, K.; Almustafa, K.M.; Jan, Z.; Saba, T.; Tariq, U. Secure and Energy-Aware Heuristic Routing Protocol for Wireless Sensor Network. IEEE Access 2020, 8, 163962–163974. [Google Scholar] [CrossRef]
  63. Iftikhar, A.; Elmagzoub, M.A.; Munir, A.; Salem, H.A.A.; Hassan, M.; Alqahtani, J.; Shaikh, A. Efficient Energy and Delay Reduction Model for Wireless Sensor Networks. Comput. Syst. Sci. Eng. 2023, 46, 1153–1168. [Google Scholar] [CrossRef]
  64. Talukder, M.A.; Sharmin, S.; Uddin, M.A.; Islam, M.M.; Aryal, S. MLSTL-WSN: Machine learning-based intrusion detection using SMOTETomek in WSNs. Int. J. Inf. Secur. 2024, 23, 2139–2158. [Google Scholar] [CrossRef]
  65. Volnes, E.; Kristiansen, S.; Plagemann, T. Improving the accuracy of timing in scalable WSN simulations with communication software execution models. Comput. Netw. 2021, 188, 107855. [Google Scholar] [CrossRef]
  66. Omotayo, A.; Hammad, M.A.; Barker, K. A Cost Model for Storing and Retrieving Data in Wireless Sensor Networks. In Proceedings of the IEEE 23rd International Conference on Data Engineering Workshop, Istanbul, Turkey, 17–20 April 2007. [Google Scholar]
  67. D., P. Healthcare Dataset, 2021. Available online: https://www.kaggle.com/datasets/prasad22/healthcare-dataset (accessed on 23 September 2024).
  68. Seebs, J. Disaster Dataset, 2021. Available online: https://www.kaggle.com/datasets/jseebs/disaster-dataset (accessed on 23 September 2024).
  69. Aman, H. Traffic Prediction Dataset, 2021. Available online: https://www.kaggle.com/datasets/hasibullahaman/traffic-prediction-dataset (accessed on 23 September 2024).
  70. Cozes, S. Power System Intrusion Dataset, 2021. Available online: https://www.kaggle.com/datasets/sequincozes/power-system-intrusion-dataset/data (accessed on 23 September 2024).
  71. Council, D.C. Drainage Gully Cleaning Programme Dataset, 2022. Available online: https://data.gov.ie/dataset/drainage-gully-cleaning-programme (accessed on 23 September 2024).
  72. Mannmann2. What a Waste: Global Dataset; Kaggle, 2020. Available online: https://www.kaggle.com/datasets/mannmann2/what-a-waste-global-dataset?select=city-level-data-0-0.csv (accessed on 23 September 2024).
  73. Center, P. CATS: Consolidated Asset Tracking System Dataset, 2021. Available online: https://www.kaggle.com/datasets/pulitzercenter/cats-consolidated-asset-tracking-system (accessed on 23 September 2024).
  74. Research, K. LeakDB: A Benchmark Dataset for Water Distribution System Leakage Detection, 2020. Available online: https://github.com/KIOS-Research/LeakDB (accessed on 23 September 2024).
  75. Sajiya, H.; Harraz, O. Dataset from “Performance Comparison of Various Quantum-Based Models for Predicting the Ground State Energy of Helium Hydride Ion (HeH+)”, 2022. Available online: https://zenodo.org/record/6616632 (accessed on 23 September 2024).
Figure 1. WSN Applications, challenges, and evaluations.
Smartcities 08 00089 g001
Figure 2. WSN topologies and network types.
Smartcities 08 00089 g002
Figure 3. Disaster, emergency, and security applications.
Smartcities 08 00089 g003
Figure 4. Healthcare applications in WSN.
Smartcities 08 00089 g004
Figure 5. Measurement analysis of packet delivery ratio.
Smartcities 08 00089 g005
Figure 6. Overall performance analysis of packet delivery ratio.
Smartcities 08 00089 g006
Figure 7. Measurement analysis of efficiency.
Smartcities 08 00089 g007
Figure 8. Overall performance analysis of efficiency.
Smartcities 08 00089 g008
Figure 9. Measurement analysis of energy consumption.
Smartcities 08 00089 g009
Figure 10. Overall performance analysis of energy consumption.
Smartcities 08 00089 g010
Figure 11. Measurement analysis of cost.
Smartcities 08 00089 g011
Figure 12. Overall performance analysis of cost.
Smartcities 08 00089 g012
Figure 13. Performance analysis of accuracy.
Smartcities 08 00089 g013
Figure 14. Overall performance analysis of accuracy.
Smartcities 08 00089 g014
Figure 15. Measurement analysis of execution time.
Smartcities 08 00089 g015
Figure 16. Overall performance analysis of execution time.
Smartcities 08 00089 g016
Figure 17. Measurement analysis of error rate.
Smartcities 08 00089 g017
Figure 18. Overall performance analysis of error rate.
Smartcities 08 00089 g018
Figure 19. Measurement analysis of network lifetime.
Smartcities 08 00089 g019
Figure 20. Overall performance analysis of network lifetime.
Smartcities 08 00089 g020
Figure 21. Measurement analysis of throughput.
Smartcities 08 00089 g021
Figure 22. Overall performance analysis of throughput.
Smartcities 08 00089 g022
Table 1. Performance metrics and their descriptions.
Performance MetricAcronymBrief Description
Energy Consumption E C The amount of energy consumed by the network or system during operation.
Network Lifetime N L The duration a network can function effectively before the nodes lose their energy.
End-to-End Delay D e l a y The total time a data packet travels from the source to the destination.
EfficiencyEThe effectiveness of a system in utilizing resources to achieve its goals.
Routing Overhead R O The additional network resources required for maintaining and managing routing information.
ThroughputTThe rate at which data are successfully transmitted over the network.
Computation Cost C o s t The total cost associated with computational resources used in processing tasks.
Computational Overhead C O The extra computational resources required beyond the basic operation.
ReliabilityRThe ability of the system to perform consistently under specified conditions.
Loss Rate L R The percentage of data packets lost during transmission.
Execution Time E T The total time to complete a specific task or process.
Accuracy A c c u r a c y The number of data points delivered to the base station.
Error Rate E R The number of data points mistakenly delivered to the total number of data points sent.
Table 2. Summary of different methodologies and their required attributes.
Ref.MethodologyObjectivesApplicationsMeritsDemeritsMonitoring SchemeAttributesParameters
[12]Intelligent power quality monitoring methodTo handle the power quality eventIndustrial drive applicationEnergy consumption was minimized by 68 JComputational cost was not reducedIoT cloud-based power quality monitoringCurrent Angle, Voltage Angle, Three-Phase CMU4Energy consumption, Computational cost
[13]Harmonic resonance mode analysis approachTo determine the optimal locations of PQMsIndustrial applicationNetwork lifetime was higher by 60 sThe loss rate was not minimizedPower quality monitoringThree-Phase VMU1, Three-Phase CMU3Energy consumption, Network lifetime, Delay
[14]Optimal configuration methodTo ensure the observability of all state variablesPower system monitoringThe cost was minimized by 30 MBLesser reliabilityPower quality monitoringtime, sqNum, stnum, state cbEnergy consumption, Network lifetime, Efficiency
[15]Multiobjective optimization approachTo allocate power quality monitorsPower system monitoringReliability was improved by 90%Loss was not minimizedPower quality monitoringCurrent Angle, Voltage AngleEnergy consumption, Network lifetime, Efficiency
[16]FPM and HRMATo reduce power quality monitoringPower system monitoringEfficiency was increased by 80%Failed to minimize power quality disturbancePower quality monitoringThree-Phase VMU1Delay, Cost
[17]Sediment accumulation processTo provide a proactive solutionGully pot monitoring applicationCost was reduced by 50 MBThroughput was not increasedGully pot monitoringGully Omissions, Gully CleanedEfficiency, Cost
[18]EU Water FrameworkTo quantify sediment scourGully pot monitoring applicationEnergy consumption was minimized by 42 JLower reliabilityGully pot monitoringGully Repairs, Traffic-SensitiveEnergy consumption, Network lifetime, Efficiency
[19]STA and FTIRTo detect and quantify TWPGully pot monitoring applicationDelay was lower by 60 msComplexity was not minimizedGully pot sedimentsGully omissions, Gully CleanedEnergy consumption, Delay
[20]Maintenance policyTo determine a maintenance policyGully pot monitoring applicationThroughput was higher by 70 kbpsEnergy consumption was not minimizedGully pot monitoringTraffic Sensitive, Gully InspectedEfficiency, Delay
[21]Mixed approachTo assess the alignment of three urban transport planning measuresTransport applicationEnergy consumption was lower by 32 JComputational complexity was reducedTransport planning monitoringTime, Date, Day of the weekEnergy consumption, Delay, Cost
[22]Discrete choice modelTo determine the main user characteristicsTransport applicationHigher reliability by 80%Energy consumption was not minimizedUrban and periurban zonesTime, Date, Day of the week, Car Count, Bike Count,Energy consumption, Cost
[23]Land-use transportation modelTo assess energy and livability assessmentTransport applicationThroughput was higher by 65 kbpsDelay was not minimizedLand use-transport modelTime, Date, Total, Traffic SituationEfficiency, Throughput
[24]Integrated approachTo improve mobilityTransport applicationCost was decreased by 45 MBNetwork lifetime was enhancedTransport systemTime, Date, Total, Traffic SituationEfficiency, Throughput, Cost
[25]Conceptual modelTo explain the connections between transportation and healthTransport applicationNetwork lifetime was improved by 63 sThe complexity level was higherTransport systemTime, Date, Total, Truck CountEnergy consumption, Delay, Cost
[26]IUTSTo enhance the traveling standardsTransport applicationDelay was lower by 39 msEfficiency was not improvedTransport systemTime, Date, Total, Traffic SituationEnergy consumption, Network Lifetime
[27]Sendai FrameworkTo find DRM and DRRDisaster applicationCost was minimized by 34 MBReliability was not improvedDisaster Risk Monitor Location,Latitude, Longitude, Disaster No.Energy consumption, Network Lifetime
[28]Technical approachTo measure the risk levelDisaster applicationNetwork lifetime was enhanced by 70 sThe delay was not minimizedDisaster Risk MonitorDisaster Type, Disaster Subtype, Start Year, Start Month, Start DayEnergy consumption, Network Lifetime and Cost
[29]Mathematical modelTo measure disaster emergencyDisaster applicationMean squared error was minimized by 0.1074Computational cost was not decreasedDisaster Risk MonitorDisaster Group, Disaster SubgroupReliability and Network Lifetime
[30]Intelligent processing technologyTo maintain emergency management of urban firesEmergency management applicationEfficiency was higher by 87%Energy consumption was minimizedEmergency managementTotal Damage, CPI, Admin Units, Entry Date, Last UpdateCost, Delay
[31]Hybrid cloud architectureTo support coordinated emergency managementEmergency management applicationDelay was lower by 46 msThe cost was not minimizedEmergency management MonitoringAdmin Units, Entry Date, Last UpdateEfficiency, Reliability
[32]Pragmatic approachTo measure disaster emergencyDisaster applicationThe error rate was minimized by 15%Cost was higherDisaster Risk MonitorDisaster Group, Disaster SubgroupLatency and Network Lifetime
[33]Integrated approachTo handle emergency eventsEmergency management applicationEnergy efficiency was higher by 78%Computational complexity was not minimizedEmergency management MonitoringInjured No. Affected NoCost, Efficiency
[34]GLMMTo measure sediment bed levelsGully pot monitoring applicationError rate was minimized by 22%Reliability was not improvedGully pot monitoringApplication Gully omissions, Gully CleanedEnergy consumption
[35]Cross-sectional descriptive designTo improve healthcare qualityHealthcare applicationEnergy consumption was minimized by 67 JThe delay was not minimizedHealthcare monitoringAge, gender, duration of experience, department, and professionEnergy consumption, Efficiency
[36]Bibliometric analysisTo improve the quality of diagnosisHealthcare applicationDelay was lower by 30 msHealthcare data, Transmission analysis was not performedHealthcare monitoringMedical condition, Insurance provider, room numberEnergy consumption, reliability
[37]Sustainable healthcare systemsTo identify the moderating factorHealthcare applicationEnergy consumption was minimized by 70 JUser satisfaction was not enhancedHealthcare monitoringAge, gender, blood groupNetwork Lifetime, Delay
[38]Energy-saving techniqueTo assess of pulse rate, guaranteeing optimum energy consumptionHealthcare application98% reduction in transmission capacityEnergy saving was performedHealthcare monitoringAge, blood group, hospital,Energy consumption, Network Lifetime
[39]NDTDTTo prevent overloaded dissemination and augment immediate, swift message deliveryHealthcare applicationDelivery rate was increased by 0.91% and 0.932%Energy consumption was not reducedHealthcare monitoringDoctor, hospital, age, blood group,Network Lifetime, Delay
[40]Big data handling mechanismTo explain big data related to healthcare applicationsHealthcare applicationOverhead was minimized by 11.67 msEnergy consumption was not reducedHealthcare monitoringAge, gender, department, and professionCost, Throughput
[41]Early warning gas leakage monitoring systemTo achieve real-time monitoring and early warning reliablyGas monitoring applicationComputational cost was lower by 41 MBEnergy consumption was minimizedGas monitoring applicationSensor number, latitude, longitude, methane concentration, and suspected leakage pointCost
[42]Gas detection methodTo improve sensor response timeGas monitoring applicationDelay was lower by 42 msComplexity was not reducedGas monitoring applicationTime, Data typeEnergy consumption, Network Lifetime
[43]Deep learning feature engineering-based approachTo accurately identify the working status of gas sensorsGas monitoring applicationEnergy consumption was reduced by 62 JComplexity was not minimizedGas monitoring applicationTime, Data typeDelay, Cost
[44]Fast operando monitoring techniqueTo handle the issue of various gas sensors in commercial batteriesGas monitoring applicationNetwork lifetime was increased by 68 sEnergy consumption was higherGas monitoring applicationTime, Data typeEfficiency, throughput
[45]Optically powered and safe gas monitoring schemeTo achieve power delivery and information transmissionGas monitoring applicationTime was reduced by 120 msComputational cost was increasedGas monitoring applicationTime, Data typeNetwork Lifetime, Cost
[46]Gas distribution pipeline network modelTo visualize the status of the binsGas monitoring applicationDelay was minimized by 45 msTime consumption was not minimizedGas monitoring applicationTime, Data type, unit data typeCost, Efficiency
[47]WPAN and cloud-assisted architectureTo monitor solid wasteSolid waste monitoringComputational cost was lower by 30 MBReal-time monitoring was not performedSolid waste monitoringCity name, income-id, solid waste laws and regulationsNetwork Lifetime, Delay
[48]SWM TechniqueTo compute pollution parametersSolid waste monitoringReliability was improved by 88%Energy consumption was not minimizedSolid waste monitoringSolid waste country, Population number of peopleEfficiency, Cost
[49]Real-time smart garbage bin apparatusTo reduce traffic jamsSolid waste monitoringCost was lower by 48 MBEnergy consumption was higherSolid waste monitoringSpecial waste tons yearLatency, Delay
[50]PortiK systemTo provide real-time solid waste collectionSolid waste monitoringEnergy efficiency was improved by 88%Waste management was not performedSolid waste monitoringPopulation number of people, Solid waste countryNetwork Lifetime, Delay
[51]Solid waste management architectureTo ensure an efficient waste management processSolid waste monitoringAccuracy was improved by 95.3125%Data tracking was not performedSolid waste monitoringWaste collection coverage, total percent of geographic areaDelay, Cost
[52]ICT-based SWCCSTo address waste-gathering issuesSolid waste monitoringNetwork lifetime was higher by 66 sWaste gathering issues were not addressedSolid waste monitoringWaste treatment compost percentReliability
[53]SWC route optimization modelTo improve collection efficiencySolid waste monitoringEfficiency was improved by 26.08%Cost was not lowerSolid waste monitoringWaste collection coverage urban percent of householdsEfficiency, Cost
[54]Comprehensive FrameworkTo maintain a high-quality of serviceWater Pipeline MonitoringThroughput was higher by 52 kbpsFailed to perform water pipeline MonitoringWater Pipeline MonitoringTime, Month, YearThroughput, Time
[55]Leakage Detection MethodTo enhance the precisionWater Pipeline MonitoringAccuracy rate was improved by 92%Recall was not consideredWater Pipeline MonitoringTime, Month, YearEnergy Consumption, Latency
[56]Heterogeneous two-Tiered routing methodTo minimize power consumptionWater Pipeline MonitoringCost was minimal by 39 MBWater pipeline monitoring time was not minimizedWater Pipeline MonitoringTime, Month, YearEnergy Consumption, Network Latency, Delay
[57]WirotipTo reduce power consumptionWater Pipeline MonitoringComputational cost was lower by 42 MBEnergy consumption was not minimizedWater Pipeline MonitoringTime, Month, YearEfficiency, Throughput
[58]EarnarduiTo measure water pipelineWater Pipeline MonitoringEnergy efficiency was higher by 77%Energy consumption was minimizedWater Pipeline MonitoringTime, Month, YearEfficiency, Cost
[59]New asset tracking architectureTo maximize smart phone battery lifetimeCommercial Asset Tracking ApplicationTime was lower by 26 msTracking was not performedTracking MonitoringSz State, Sz Date, Sz Year, Sz MethEnergy Consumption, Network Latency
[60]Optimization decomposition frameworkTo minimize energy consumptionCommercial Asset TrackingApplication cost was lower by 47 MBCost tracking was not minimizedTracking MonitoringAsset Id, Asset ValueEnergy Consumption, Network Latency, Delay
[61]Optimization frameworkTo measure critical levels of the hospital locationsCommercial Asset Tracking ApplicationOverhead was lower by 33 msCost was increasedTracking MonitoringDist, Sz StateEnergy Consumption, Network Latency, Delay
Table 3. Summary of performance analysis of power system applications.
Ref.Method NameObjectiveSensor TypeNetwork TypeTopologyECNLEDelayTLRRETCostCOLimitations
[12]Intelligent power quality methodEfficient power quality event data logging managementPower meterCentralizedMeshSmartcities 08 00089 i001Smartcities 08 00089 i001Smartcities 08 00089 i001 Smartcities 08 00089 i001Smartcities 08 00089 i001 Computational cost not minimized
[13]Harmonic resonance mode analysisMonitoring in severe conditions via integer optimizationRMS Voltage and CurrentDecentralizedStarSmartcities 08 00089 i001Smartcities 08 00089 i001Smartcities 08 00089 i001Smartcities 08 00089 i001Smartcities 08 00089 i001 Smartcities 08 00089 i001 Loss rate not reduced
[14]Optimal configuration methodEnsures observability of state variablesLight and Motion sensorsDecentralizedP2PSmartcities 08 00089 i001Smartcities 08 00089 i001Smartcities 08 00089 i001 Smartcities 08 00089 i001Smartcities 08 00089 i001Reliability not increased
[15]Multi-objective optimization approachMin load monitoring, min ambiguity in PQ monitorsAmmeter, camerasCentralizedTreeSmartcities 08 00089 i001Smartcities 08 00089 i001Smartcities 08 00089 i001 Smartcities 08 00089 i001Smartcities 08 00089 i001 Loss rate not minimized
[16]FPM and HRMADetect PQ disturbances via best install nodesRMS Voltage and CurrentCentralizedMesh Smartcities 08 00089 i001Smartcities 08 00089 i001 Smartcities 08 00089 i001 Smartcities 08 00089 i001 PQ disturbance not reduced
Table 4. Summary of performance analysis of gully pot monitoring.
Ref. No.Method NameObjectiveSensor TypeNetwork TypeTopologyECNLEDelayROTCostLimitations
[17]Sediment accumulation processAssess net accumulation ratesAcousticDistributedMesh Smartcities 08 00089 i001 Smartcities 08 00089 i001Throughput level not improved
[18]EU Water FrameworkReduce sediment scour impactsAcousticCentralizedTreeSmartcities 08 00089 i001Smartcities 08 00089 i001Smartcities 08 00089 i001 Smartcities 08 00089 i001 Smartcities 08 00089 i001Reliability not improved
[19]STA, FTIR, PARAFACQuantify TWP in sedimentsTemperatureDistributedStarSmartcities 08 00089 i001 Smartcities 08 00089 i001 Smartcities 08 00089 i001No reduction in computation
[20]Maintenance policyAdaptive schedulingAcousticCentralizedTree Smartcities 08 00089 i001Smartcities 08 00089 i001 Smartcities 08 00089 i001Smartcities 08 00089 i001High energy during flooding
Table 5. Summary of performance analysis of transportation applications.
Ref.No.Method NameObjectiveSensor TypeNetwork TypeNetwork TopologyECNLEDelayTLRRCostLimitations
[21]Mixed-method approachAssess alignment between urban transport policies and citizen needsGPS DevicesCentralizedMeshSmartcities 08 00089 i001 Smartcities 08 00089 i001 Smartcities 08 00089 i001 Smartcities 08 00089 i001Mixed-method approach not reduced computational complexity
[22]Discrete choice modelAnalyze discrete choice model via user and transport attributesMultimedia mobile nodesDecentralizedCluster based Smartcities 08 00089 i001 Smartcities 08 00089 i001 Smartcities 08 00089 i001 Did not minimize energy consumption
[23]Land-use transport modelFactors’ location-related decisions and travel behaviorLight, Temp., Acoustic SensorsCentralizedCluster basedSmartcities 08 00089 i001 Smartcities 08 00089 i001 Smartcities 08 00089 i001 Smartcities 08 00089 i001 Delay was not minimized
[24]Integrated approachIntegrate urban plan-making with public transport using PTALRFID, Hall sensorsCentralizedMesh Smartcities 08 00089 i001 Smartcities 08 00089 i001 Smartcities 08 00089 i001Failed to improve network lifetime
[25]Conceptual modelClarify connection between transport and healthMultimedia sensorsCentralizedGrid basedSmartcities 08 00089 i001 Smartcities 08 00089 i001Smartcities 08 00089 i001 Smartcities 08 00089 i001Did not increase efficiency between transport and health
[26]IUTSEnhance travel standards and change travel behaviorMagneto-resistive sensorsDecentralizedStarSmartcities 08 00089 i001Smartcities 08 00089 i001 Smartcities 08 00089 i001 Smartcities 08 00089 i001 Smartcities 08 00089 i001Did not minimize complexity level
Table 6. Summary of performance analysis of disaster, emergency, and security applications.
Ref. No.Method NameObjectiveSensor TypeNetwork TypeTopologyECNLEDelayROTLRRCostLimitations
[27]SFDRRAdopt constructivist position to investigate historical emergence of DRM and DRRSeismic sensorsDecentralizedTreeSmartcities 08 00089 i001Smartcities 08 00089 i001 Smartcities 08 00089 i001 Smartcities 08 00089 i001 Smartcities 08 00089 i001Smartcities 08 00089 i001Efficiency not improved by DRM and DRR
[28]Positioning approachDefine mitigation zones to express perceived urban resilience in emergenciesWeather sensorCentralizedMeshSmartcities 08 00089 i001 Smartcities 08 00089 i001 Smartcities 08 00089 i001Smartcities 08 00089 i001 Smartcities 08 00089 i001Reliability not improved
[29]Mathematical modelAssess crisis response in meteorological tragediesSeismometerCentralizedTree Smartcities 08 00089 i001 Smartcities 08 00089 i001 Delay not minimized
[30]Intelligent processing technologyAddress overcrowding and improve urban safetyEnvironmental sensorDecentralizedStarSmartcities 08 00089 i001 Smartcities 08 00089 i001Smartcities 08 00089 i001 Smartcities 08 00089 i001 Smartcities 08 00089 i001Computational cost not reduced
[31]Hybrid cloud architectureManage computing/storage in emergency scenariosWeather sensorCentralizedMeshSmartcities 08 00089 i001 Smartcities 08 00089 i001 Smartcities 08 00089 i001 Smartcities 08 00089 i001Complexity not minimized
[32]Pragmatic approachNeed for proactive strategies for urban resilienceSeismometerDecentralizedStarSmartcities 08 00089 i001 Smartcities 08 00089 i001 Smartcities 08 00089 i001 Cost not minimized
[33]Integrated approachEnhance urban resilience and emergency responseWeather sensorCentralizedClusterSmartcities 08 00089 i001 Smartcities 08 00089 i001 Smartcities 08 00089 i001 Smartcities 08 00089 i001Complexity not reduced
[34]GLMMQuantify solid accretion in gully potsEnvironmental sensorCentralizedTreeSmartcities 08 00089 i001 Smartcities 08 00089 i001 Gully pots not reliably quantified
Table 7. Summary of performance analysis of healthcare applications.
Ref. No.Method NameObjectiveSensor TypeNetwork TypeTopologyECNLEDelayROTLRRETCostCOLimitations
[35]Cross-sectional descriptive designTarget all healthcare professionals who interact with e-health applications and programmesVideo, Acoustic, RFID sensorsCentralizedStarSmartcities 08 00089 i001 Smartcities 08 00089 i001 Smartcities 08 00089 i001 Smartcities 08 00089 i001 Delay using cross-sectional approach was not minimized
[36]Initial bibliometric analysisAnalyze data for healthcare applications in efficient wayEMG, EEG, ECG, EOG sensorsDecentralizedStarSmartcities 08 00089 i001 Smartcities 08 00089 i001 Smartcities 08 00089 i001Smartcities 08 00089 i001 Smartcities 08 00089 i001Smartcities 08 00089 i001 Smartcities 08 00089 i001Healthcare data transmission analysis was not efficient
[37]Sustainable healthcare systemUnderstand moderating effects of personal features on perceived value and user satisfactionEnvironmental, physiological sensorsCentralizedStar Smartcities 08 00089 i001 Smartcities 08 00089 i001 Smartcities 08 00089 i001 Smartcities 08 00089 i001 User satisfaction was not improved
[38]Energy-saving techniqueIncrease battery capability of IoT devicesBattery sensorCentralizedCluster-basedSmartcities 08 00089 i001Smartcities 08 00089 i001 Smartcities 08 00089 i001 Smartcities 08 00089 i001Smartcities 08 00089 i001 Smartcities 08 00089 i001 Smartcities 08 00089 i001Reliability was not improved
[39]NDTDTEnsure reliable message delivery to minimize errors due to discrete sensing intervalsAccelerometer, gyroscopeCentralizedStarSmartcities 08 00089 i001 Smartcities 08 00089 i001 Smartcities 08 00089 i001 Smartcities 08 00089 i001 Smartcities 08 00089 i001 Network lifetime was not improved
[40]Big data handling mechanismStudy big data related to healthcare applicationsThermometerCentralizedCluster-based Smartcities 08 00089 i001 Smartcities 08 00089 i001 Smartcities 08 00089 i001 Smartcities 08 00089 i001 Smartcities 08 00089 i001Energy consumption not reduced by big data mechanism
Table 8. Summary of performance analysis of gas monitoring applications.
Ref. No.Method NameObjectiveSensor TypeNetwork TypeTopologyECNLEDelayROTLRRETCostCOLimitations
[41]Real-time and early-warning gas leakage monitoring systemDetect gas leaks in large-scale urban environmentsGPS SensorCentralizedHierarchical Smartcities 08 00089 i001Gas leak was not identified with minimum energy consumption
[42]Gas detection development methodImprove safety and environmental protection measuresGas SensorDecentralizedCluster-basedSmartcities 08 00089 i001Smartcities 08 00089 i001Smartcities 08 00089 i001Smartcities 08 00089 i001 Smartcities 08 00089 i001 Smartcities 08 00089 i001 Complexity was not reduced by gas detection development method
[43]Deep learning feature engineering-based approachIdentify sensor relationships for gas detectionUnderground sensorsDecentralizedStarSmartcities 08 00089 i001 Smartcities 08 00089 i001 Smartcities 08 00089 i001 Computational cost and complexity not reduced
[44]Fast operando monitoring methodEfficient and accurate gas emission detectionNDIR multi-gas sensorsCentralizedMesh Smartcities 08 00089 i001Smartcities 08 00089 i001 Smartcities 08 00089 i001 Smartcities 08 00089 i001 Did not reduce energy consumption
[45]Optically powered safe gas monitoring schemeDetect gases in underground minesLC-based optical transducersCentralizedMesh Smartcities 08 00089 i001 Smartcities 08 00089 i001 Smartcities 08 00089 i001Smartcities 08 00089 i001 Smartcities 08 00089 i001Safe monitoring did not reduce computational cost
[46]Gas distribution pipeline network modelMonitor actual gas distribution networkPressure and temperature sensorsCentralizedCluster-basedSmartcities 08 00089 i001 Smartcities 08 00089 i001Smartcities 08 00089 i001Smartcities 08 00089 i001 Smartcities 08 00089 i001 Smartcities 08 00089 i001 Time consumption for real monitoring not reduced
Table 9. Summary of performance analysis of solid waste monitoring.
Ref. No.Method NameObjectiveSensor TypeNetwork TypeNetwork TopologyECNLEDelayROTLRRETCostCOLimitations
[47]WPAN and cloud-assisted architectureReal-time monitoring via Xbee and internetCustomized sensor and coordinatorDecentralizedTree Smartcities 08 00089 i001 Smartcities 08 00089 i001 Smartcities 08 00089 i001 Smartcities 08 00089 i001 Smartcities 08 00089 i001 Real-time monitoring not energy-efficient
[48]SWMAssess ecological factors at dumpsitesNOx, SO2 sensorsCentralizedStar Smartcities 08 00089 i001 Smartcities 08 00089 i001 Smartcities 08 00089 i001 Smartcities 08 00089 i001 Smartcities 08 00089 i001Energy not optimized for ecological factors
[49]Smart garbage bin apparatusUrban solid waste administrationWeight SensorDecentralizedMesh Smartcities 08 00089 i001 Smartcities 08 00089 i001 Smartcities 08 00089 i001 Smartcities 08 00089 i001 No minimal energy consumption
[50]PortiK systemOptimize waste operationsShort-range monitoringDecentralizedCluster-basedSmartcities 08 00089 i001 Smartcities 08 00089 i001 Smartcities 08 00089 i001 No real data monitoring integration
[51]Waste management architectureEfficient data trackingGSM tracking sensorsCentralizedTreeSmartcities 08 00089 i001 Smartcities 08 00089 i001Smartcities 08 00089 i001 Smartcities 08 00089 i001 Smartcities 08 00089 i001 High computational overhead
[52]ICT-based WCCSAddress waste gathering issuesProximity sensorDecentralizedMesh Smartcities 08 00089 i001 Smartcities 08 00089 i001 Smartcities 08 00089 i001 Waste gathering issues not solved
Table 10. Summary of performance analysis of water pipeline monitoring.
Ref. No.Method NameObjectiveSensor TypeNetwork TypeTopologyECNLEDelayROTLRRETCostCOLimitations
[54]Comprehensive frameworkDescribe monitoring water pipeline techniques based on wired and wireless networksPressure, pH, and water level sensorsCentralizedStar Smartcities 08 00089 i001Smartcities 08 00089 i001Smartcities 08 00089 i001 Smartcities 08 00089 i001 Pipeline monitoring was not performed with minimal energy consumption
[55]Leakage detection method based on MLEnhance accuracy and efficiency of leak detection in water pipelinesPressure and water leak sensorsDistributedStarSmartcities 08 00089 i001 Smartcities 08 00089 i001 Smartcities 08 00089 i001Smartcities 08 00089 i001 Smartcities 08 00089 i001Accuracy improved but delay was not minimized
[56]Heterogeneous two-tiered routing methodImprove network lifetime and efficiency of WSNs in pipeline monitoringPressure sensorCentralizedP2PSmartcities 08 00089 i001Smartcities 08 00089 i001Smartcities 08 00089 i001Smartcities 08 00089 i001Smartcities 08 00089 i001 Smartcities 08 00089 i001 Smartcities 08 00089 i001 Monitoring time was not minimized
[57]WSN node prototype termed WiRoTipEnsure adequate design and functionality for pipeline applicationsAcoustic sensorDistributedP2P Smartcities 08 00089 i001 Smartcities 08 00089 i001 Smartcities 08 00089 i001 Smartcities 08 00089 i001Energy consumption not reduced during monitoring
[58]EarnArduiPerform monitoring based on physical behaviorPressure sensor, water level sensorCentralizedStarSmartcities 08 00089 i001 Smartcities 08 00089 i001 Smartcities 08 00089 i001 Smartcities 08 00089 i001 Energy minimized but network lifetime was not
Table 11. Summary of performance analysis of commercial asset tracking.
Ref.No.Method NameObjectiveSensor TypeNetwork TypeNetwork TopologyECNLEDelayROTCostCOLimitations
[59]New asset tracking architectureTrack assets within construction sitesHybrid RFID thermal sensorsDistributedMeshSmartcities 08 00089 i001Smartcities 08 00089 i001 Smartcities 08 00089 i001 Smartcities 08 00089 i001Smartcities 08 00089 i001 Tracking was not carried out in accurate manner
[61]Optimization frameworkEfficient medical assets tracking in hospital environmentsPressure sensorDistributedStarSmartcities 08 00089 i001Smartcities 08 00089 i001Smartcities 08 00089 i001 Smartcities 08 00089 i001The cost of asset tracking was not reduced in hospital environment
[60]Optimization decomposition frameworkReduce energy consumption of sensor nodes with high estimation qualityWireless sensorDistributedMeshSmartcities 08 00089 i001Smartcities 08 00089 i001Smartcities 08 00089 i001 Smartcities 08 00089 i001 The complexity level during quality estimation was not minimized
Disclaimer/Publisher’s Note: The statements, opinions and data contained in all publications are solely those of the individual author(s) and contributor(s) and not of MDPI and/or the editor(s). MDPI and/or the editor(s) disclaim responsibility for any injury to people or property resulting from any ideas, methods, instructions or products referred to in the content.

