Highlights
What are the main findings?
- Three conventional and twelve new methods have been evaluated to improve the fair contribution of PV inverters in over-voltage control.
- The sensitivity of bus voltage to PVs’ active power is identified as the primary key in designing the volt–watt curves.
- A new scoring method is suggested to evaluate the performance of the studied and proposed methods regarding fairness, curtailment efficiency, and overvoltage control success.
What is the implication of the main finding?
- The proposed methods can be implemented in decentralized and centralized frameworks, depending on the capacity and sophistication of the communication infrastructure in smart cities.
- The vast majority of methods can prevent the possibility of overvoltage even in very rare low-load conditions.
- Customer satisfaction is reflected in the performance metrics, while grid stability is also considered. This approach is helpful for smart city planners and utility operators, encouraging them to adopt the proposed methods for integrating high PV penetration.
Abstract
The higher integration of photovoltaic (PV) units is an inevitable component of smart city development. Thanks to smart meter devices that can record the exchange of power between the grid and customers, it is expected that homeowners and businesses will tend to install PV arrays on their rooftops and parking lots to benefit from selling power back to the grid. However, the overvoltage issue resulting from high PV penetration is a major challenge that necessitates the active power curtailment of PV units to ensure power grid stability. Fairness-oriented methods aim to minimize the active power of PV units as much as possible, adopting a fairer approach, and then address the PV owner’s satisfaction with fair profit and loss. Maintaining voltage within a limited standard range under very low load conditions while prioritizing PV inverters’ participation in reactive power contribution and attempting to ensure fairer curtailment of active power presents challenges to existing control design approaches. This paper presents twelve new volt–watt curve design methods to achieve these goals and address the challenges. The methods yield polynomial curves, piecewise linear curves, and single linear curves. A unique voltage sensitivity value for each PV inverter is used to determine the control region area and the slope of the curve at the starting point in certain instances. The effectiveness of the proposed methods is discussed by evaluating their capabilities on the 37-bus IEEE system.
1. Introduction
The tendency to install a large number of distributed generation (DG) systems, driven by their stability and compatibility with smart cities’ applications, has increased. This trend is expected to continue for the next decades [,]. Renewable energy sources will undoubtedly play a critical role in developing smart cities, as they do not require customers to pay bills for fuel and carbon tax [,,]. Among renewable energy sources, PVs have the most potential for integration into smart cities, as they are easy to install, widely available, and require only rooftop or parking lot space []. The statistics provided by the International Energy Agency (IEA) confirm the high likelihood of PV units being integrated into smart cities. They reported that the share of distributed PV will increase twofold before 2029 []. The intermittent nature of PV units injecting active power and the dynamic nature of users’ power profile demand could result in voltage drops or overvoltage at the point of common coupling (PCC) []. This may lead to the risk of voltage instability and malfunctions in user devices.
With the high penetration of PVs, the voltage of the buses seems to be in violation. They are likely to exceed the allowable limits due to a lack of a proper control strategy []. Traditionally, tap changers and switched capacitors are equipped to adjust the voltages. Still, they are not applicable for setting the voltage in the face of highly dynamic load changes, which result in sudden voltage rises or drops []. The literature review suggests that regulating reactive power at the output of distributed power sources, including renewable energy sources, can result in controlled voltage []. Additionally, regulating both active and reactive power can further enhance the effectiveness of voltage control methods, allowing for a greater integration of PV units into power grids [,]. Setting the active and reactive power of PV units is typically achieved by utilizing techniques also employed in other technologies. The performance of the loop controller is relatively straightforward, as two variables are interrelated and one is adjusted in response to changes in the other. The benefits of droop curves, known as Q-f or P-V curves, have been demonstrated multiple times for voltage adjustment and frequency support []. Regarding volt–var, PV inverters can either absorb or inject reactive power to regulate voltage, potentially increasing the PV hosting capacity of the unit by 50–130%, depending on the feeder size [].
While PV-enriched grids are beneficial, they present overvoltage challenges that require the contribution of PV inverters to regulate voltage []. The IEEE 1547 standard [] introduced the capability of PV inverters to exchange reactive power with power grids. However, the active power curtailment (APC) technique becomes necessary if this strategy does not resolve the issue. Due to various reasons, such as a higher level of PV generation, reactive power support from PV inverters may not be sufficient. Therefore, the voltage needs to be controlled by APC approaches. The radial nature of distribution networks results in a higher degree of APC being applied to PV units located on end feeders, and consequently, fairness issues arise. Different methods are suggested in the literature to comply with the standard that can effectively control voltage []. The DC-link of inverters in PV units, combined with active control of the output, provides the ability to take action to address voltage quality issues. To achieve this, smart inverters, according to IEEE standards, should absorb reactive power with a volt–var control (VVC) curve and potentially curtail a portion of the output active power following a volt–watt control (VWC) curve []. A VWC in a distributed framework was proposed in [], and it dynamically adjusts curve parameters by using voltage sensitivity values to achieve fair APC. Volt–watt curves designed for certain PVS mandate full curtailment when the voltage exceeds 1.05 p.u. The main disadvantage of such a curve is that it forces some PVs to shut down while others continue to operate under low-load conditions. Optimizing both VWC and VVC curves is undertaken in [] to reduce total active power curtailment and address uncertainties in the voltage control problem. However, this method does not apply to low-load conditions, as it does not prioritize reactive power, resulting in higher expected curtailment. The authors of [] employed an iterative approach to adjust the setting points of the volt–watt curves in smart inverters, enabling them to dynamically respond to real-time voltage overvoltage issues and ensure fair active power curtailment. However, the potential of reactive power from PV inverters is not discussed. The authors of [] proposed a proportional-integral-derivative (PID) closed-loop control mechanism for regulating the output of PV smart inverters. Their work has the advantages of relying less on communication infrastructure and improving the accuracy of voltage control. However, it does not address fairness.
Data-driven methods as part of cutting-edge work in PV unit control have been recently introduced, as seen in [,]. The application of machine learning methods can address the high online computational demands by employing offline training processes. Thus, data-driven methods [] can set the VWC and VVC curve setting points by observing the latest voltage situation in just a few milliseconds. Ref. [] attempted to train a machine learning technique-based prediction and regulation system to control the active and reactive power of PV inverters for voltage stability purposes. This paper proposes a multi-mode control structure for minimizing contributions and taking precautionary actions to prevent overvoltage issues from occurring. The merits of both methods depend on the availability of high-quality and comprehensive training data.
Effective centralized controllers are the primary solution to overcoming the issues of fairness []. However, the need for centralized decision-making and optimization solvers, along with robust communication links, has led to the development of distributed schema control methods [,]. A complex design process to set VVC and VWC curve points is an inevitable part of these works. Hybrid VV controls are conducted in the literature [] to achieve different optimization goals simultaneously. These methods still rely on communication infrastructure and high-speed, efficient solvers. Another approach is suggested by Haque et al., who introduced a consensus algorithm to determine volt–watt control curves for smart inverters []. Failure to communicate with each feeder will lead to significant unfairness in APC, as the results indicate.
2. The Overall Schema of Convention and Proposed Methods
2.1. General Shape and Control Region of Volt–Watt Curves
Curtailing the active power of PV units leads to economic losses. Therefore, prioritizing reactive power support is essential. If it is not sufficient, APC can be recommended. This approach is adopted in this work. Each VWC has one start and one endpoint. The shape of the curve can be linear, piecewise, or polynomial, as shown in Figure 1. In smart cities with a high penetration of local PV units, where PV units supply a significant portion of the energy at each bus during high irradiation conditions, the voltage levels at the nodes tend to be very close together. Therefore, designing volt–watt curves requires more caution.
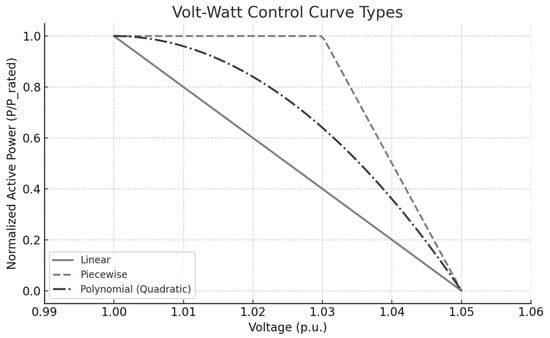
Figure 1.
Different types of volt–watt control for PV inverters.
If the designer intends to be cautious, the curve’s end point should intersect the voltage axis at 1.05 pu, the maximum allowable voltage at buses. One approach to optimizing the overall merit of VWC curves is to select different end-set points for the curves, with values higher than 1.05 pu. However, this method may not account for the risk of voltage violations under low-load conditions. Additionally, a subset of PV units may reduce their total active power while others continue to supply the grid, leading to unfairness among all PV units. To address these concerns, the end set points for all VWC curves should be limited to a standard value of less than 1.05 or approximately 1.05, while the start point is selected based on precautionary measures.
Determining the starting points of the VWC curves or finding the curve’s optimum slope is crucial to ensure fairness during the initial curtailment stages. If the starting points for PV units with higher voltage sensitivity coefficients (VSCs), particularly those farther from the source, are set differently, there is a risk of unfairness. This is because some PV units would begin curtailing first, while others remain in the non-curtailed zone.
Due to the close voltage levels of the power grid buses when the load demand decreases, the endpoint of the designed curves is set the same among PV inverters to reduce the possibility of an early shutdown of some PV systems and ensure fairness in the inverters’ shutdown regions.
2.2. Mathematical Expressions of Linear Methods Concepts
The proposed linear curves for volt–watt controls involve designing the curves using sensitivity matrices. Equation (1) [] gives the correlation between the voltage of buses and the active/reactive power variation of PV inverters. The curves here are responsible for APC, and the second statement of Equation (1) can be assumed to be zero.
, : resistance and reactance terms from the sensitivity matrix.
, : active and reactive power of an inverter j.
: voltage change at node i.
The APC must be employed if some bus voltages exceed the maximum limit. Then, can be defined as a difference between the PV active power before () and after () curtailment. Let us assume that the voltage of buses before curtailments ([]) resulted from PV units’ active power injection ([]) violating the overvoltage limit. Then, the curtailment method is applied, and a new voltage ([]) and the power profile ([]) is obtained. The correlation between the changes in the voltage profile and the power profile needs to employ a resistance matrix and a new variable ( is defined to show the share of inverter i in curtailing power). Then the voltage change against the active power change can be expressed as Equation (2):
The most important point is that all voltage values must be lower than 1.05 after curtailment has occurred. Then, the formula for showing this requirement can be presented as:
Considering the upper limit of voltage:
N inequality can be achieved for determining to . One of the goals is to apply less curtailment to each PV inverter output. Therefore, [] can be easily obtained as:
To make sure all PV inverters curtailed with a fair share, the minimum value of [] is selected and considered the same for all PV inverters.
The voltage matrix before curtailment must be constructed, and the curtailment factor can be obtained after applying a simple mathematical calculation. Two set points must be identified for designing linear curves. One of the points for the inverter i volt–watt curve can be []. The second point can be selected based on other assumptions or identified by the proposed method’s concept.
3. Methods
This part of the paper discusses three conventional and twelve new methods for designing volt–watt curves. The PV inverters produce maximum reactive power in all methods, and APC is activated for further voltage regulation. For all the methods, the maximum value of the slope is maintained as .
3.1. Conventional Fixed Slope Method (M1)
In this method, the volt–watt control initiates when the bus voltage crosses the lower control voltage, Vcl = 1.04 pu, and 100% curtailment occurs at the upper control voltage, Vcu = 1.05 pu, as shown in Figure 2. All PV inverters have the same control curve, which remains unchanged over time. The Vcu value should be determined to prevent overvoltage problems in very low load conditions, while the start point should meet a 0.01 margin [].
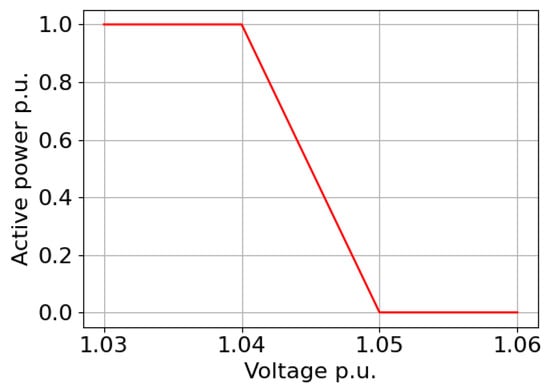
Figure 2.
Method M1’s concept.
3.2. Volt–Watt Control Using a Second-Degree Polynomial (M2)
This method is introduced in []. As discussed in method M1, the APC is constrained between two fixed values. The only factor that can differentiate the curves is the application of VSC values, which define the slopes of the VWC curves. Figure 3 illustrates the concept discussed in this section. The lower and higher set points are Vcl and Vcu, respectively. The slope of DVWC at V = Vcl is equal to cot(α) = −1/Rcof. This type of designed curve is called M2.
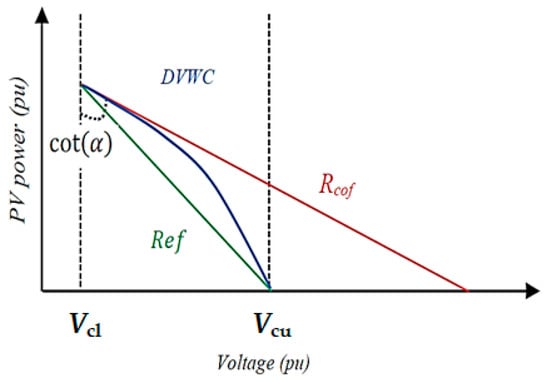
Figure 3.
Method M2’s concept.
The Second-Degree Polynomial curtailment profile can be described by Equation 1. The coefficients, a, b, and c, can be set for a specific node by knowing that the , , and . In this paper, we considered Vcl and Vcu.
Therefore, the coefficients a, b, and c can be determined in terms of the slope, which are given as:
3.3. Piecewise Slope-Based Method (M3)
This method is discussed in []. In this method, two slopes are calculated, as presented in Figure 4. One is Mcof, which can be found from, and the other is Mmax, which is the maximum slope allowed due to stability reasons and is calculated as . The control curve starts from Vcl with slope Mcof until it intersects the curve with slope Mmax, which starts 0.005 pu volt before the upper control voltage Vcu (1.05 − 0.005 = 1.045 pu). After the intersection, the control curve follows slope Mmax till it reaches Vcu.
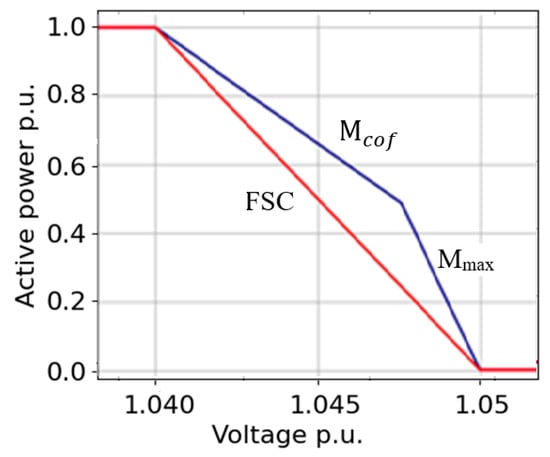
Figure 4.
Method M3’s concept.
3.4. Linear Curve with Fixed Vcl (M4)
The main core of this method is discussed in the previous section. This design method can, to some extent, achieve a fairly balanced contribution of PV units with the targeted predefined load factor. In our work, we determine the fair contribution (α) at a load factor of 20%, and we record the corresponding voltage values. The volt–watt curve is designed by selecting the starting point of curtailment as Vcl = 1.04 pu. By connecting Vcl and the voltage value at ‘α’ curtailment and then extending the curve until it reaches P = 0, we can determine different Vcu for the control curves, as seen in Figure 5.
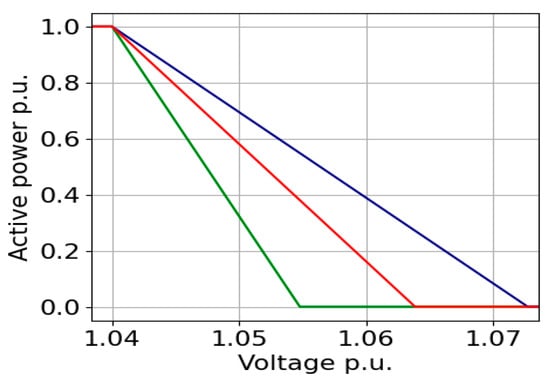
Figure 5.
Method M4’s concept.
3.5. Linear Curve with Fixed Vcu (M5)
This method is similar to M4, with Vcu fixed at 1.05 while Vcl must be determined. The voltage and power at the target load factor for implementing the same share provide information for the second point on the curve. Thus, the linear curve equation can be derived. The value of Vcl is then obtained by extending the curve until it reaches P = 1 as seen in Figure 6.
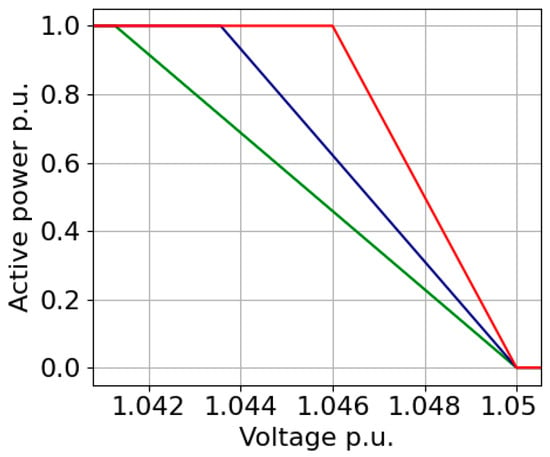
Figure 6.
Method M5’s Concept.
3.6. Linear Curve with Different Vcl and Vcu (M6)
In this method, we detect the first bus that reaches a lower control voltage of 1.04 pu. For that instance, we determine all the other bus voltages and set those voltages as Vcl for the respective PVs connected to those buses. The second point of the curve is calculated based on the voltage value at ‘α’ curtailment, similar to M4 and M5. Then, the curve (See Figure 7) is extended until it reaches the zero active power axis, and the value of Vcu is determined.
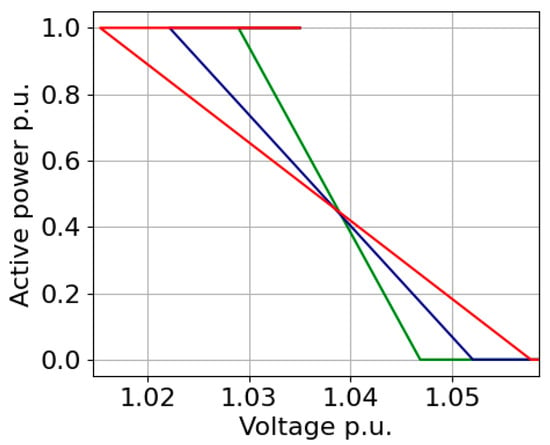
Figure 7.
Method M6’s concept.
3.7. Bus Voltage-Trigged Vcl and Fixed Vcu (M7)
In this method, Vcl is determined similarly to M6, and Vch is selected as 1.05 pu as seen in Figure 8.
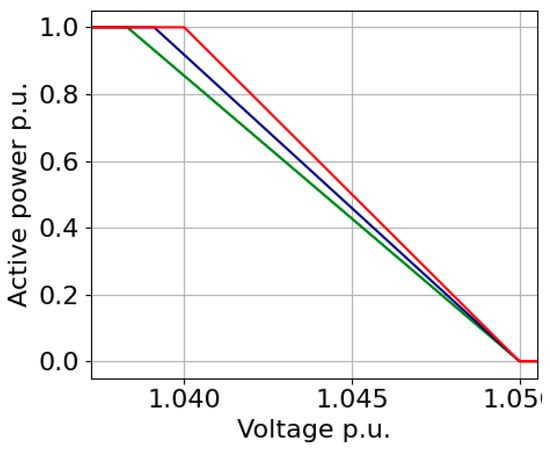
Figure 8.
Method M7’s Concept.
3.8. Bus Voltage-Trigged Vcu and Fixed Vcl (M8)
In this method, Vch is determined in a similar manner to M6 when the first bus reaches a 1.05 pu voltage, and Vcl is selected as 1.04 pu as seen in Figure 9.
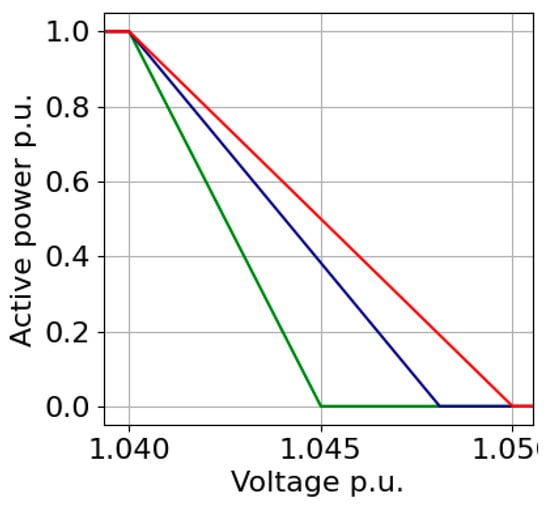
Figure 9.
Method M8’s Concept.
3.9. Bus Voltage-Trigged Vcu and Vcl (M9)
In this method, Vcl is determined similarly to M7, and Vcu is defined similarly to M8. The concept is shown in Figure 10.
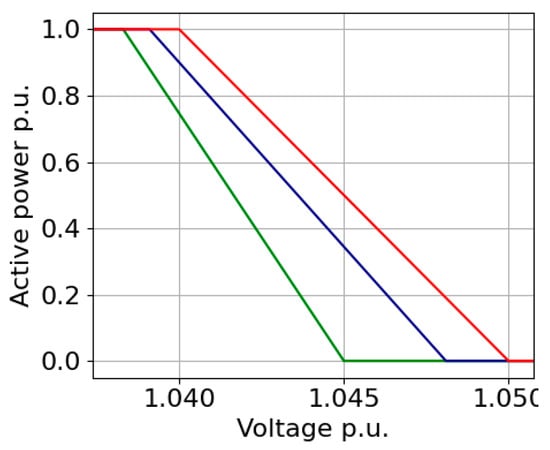
Figure 10.
Method M9’s concept.
3.10. Hybrid Methods (M10–M15)
In this part, five methods are presented, which are a combination of previous methods. To avoid redundant description, those methods are listed here:
M10 (Figure 11a): This combines M2 (Second-Degree Polynomial) and M7 (fixed Vch).


Figure 11.
Methods (a–f): M10–M15’s concepts.
M11 (Figure 11b): This combines M3 (piecewise) and M7 (fixed Vch).
M12 (Figure 11c): This combines M2 (Second-Degree Polynomial) and M8 (fixed Vcl).
M13 (Figure 11d): This combines M3 (piecewise) and M8 (fixed Vcl).
M14 (Figure 11e): This represents the combination of (Second-Degree Polynomial) and M9 (different Vcl and Vch).
4. Materials
4.1. Case Study
To test the effectiveness of the conventional and proposed methods, a balanced IEEE-37 node system (Figure 12) is selected to derive the results. In this system, the grid voltage is 230 kV, and the distribution side voltage is 4.8 kV. The transformer connection is delta-wye, and loads are wye-connected and balanced. PVs are connected to all load buses except bus 701, assuming all the loads are primarily supported by PV power. All the PVs’ apparent power (kVA) is rated at 90% of the load kW (Figure 13) connected to their respective buses. PMPP is set to 90% of the rated KVA (Figure 14) to allow maximum VAR support for each inverter, up to 44% of the KVA.
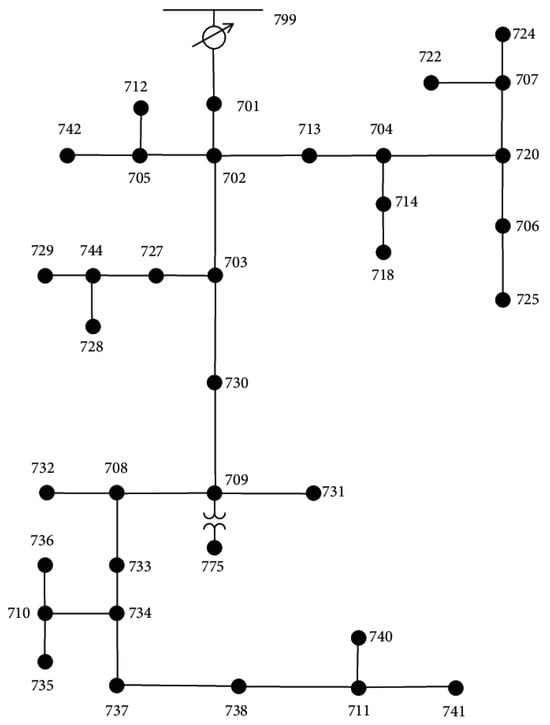
Figure 12.
Line diagram of the IEEE-37 node system.
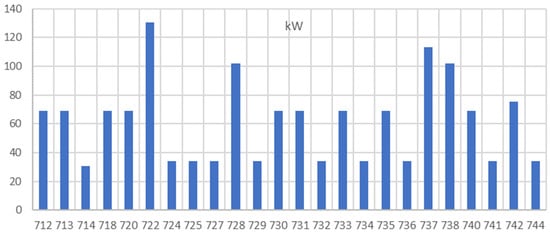
Figure 13.
Active power profile of loads.
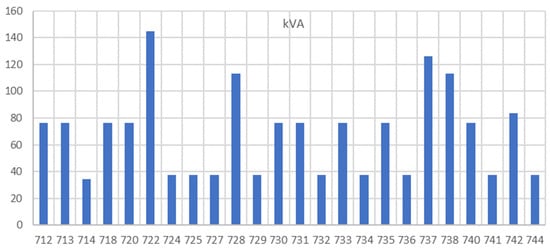
Figure 14.
Reactive power profile of loads.
For non-linear methods, the sensitivity coefficients can be derived based on the grid topology or through local calculations performed by smart inverters, as illustrated in Figure 15. Linear methods, on the other hand, need to be aware of the grid topology.
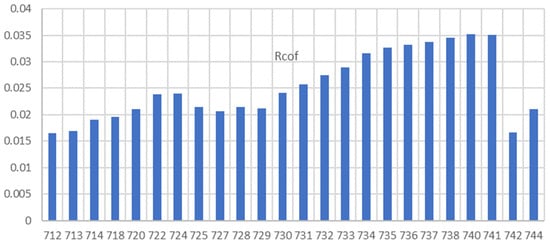
Figure 15.
Voltage sensitivity coefficients.
4.2. Communication Infrastructure Requirements
The proposed methods feature a noncentralized data exchange architecture, eliminating the need for real-time or frequent data exchange. These curves are designed once and remain in place for a long time. Hence, the designed curve characteristics are not changed until the power grid topology or the PV inverters’ rated apparent power changes. A significant change in topology or PV inverter capacity can be easily detected, thanks to the incorporation of smart inverters and smart meters. Local centers collect data and share them to redesign the curves (Figure 16), aiming to achieve greater fairness among PV inverters in terms of their contributions to voltage support. Experimental observations confirm that the network configuration stayed relatively unchanged throughout the decision-making period in central and local centers, indicating that the noncentralized approach is highly effective.
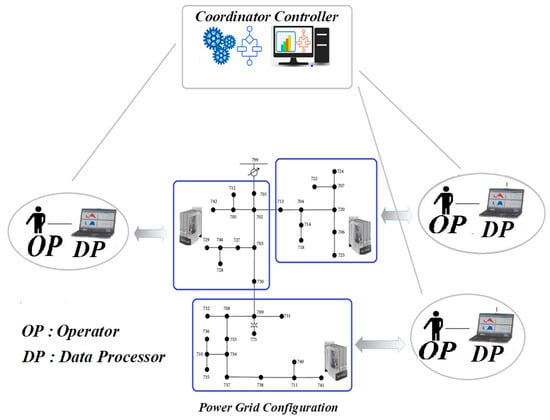
Figure 16.
The role of local and central controllers in smart cities’ power grids.
5. Results
This section of the paper examines the application of the studied algorithms to adjust PV power in the case study, taking into account the previously presented assumptions. OpenDSS 10.2.0.1 and Python 3.11 are utilized to conduct power flow analyses and implement the designed Variable Voltage Controllers (VVCs). Initially, the effectiveness of all types of designed VWCs was evaluated at a load factor of 40%, as the first voltage violation typically occurs at this load level. The active power profile of all PV inverters, as illustrated in Figure 17, is achieved by applying designed volt–watt curves using methods M1–M15.
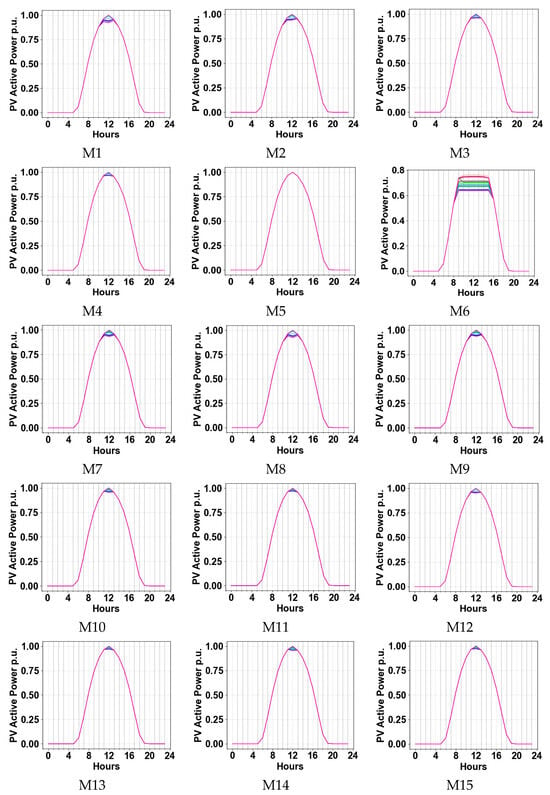
Figure 17.
All PV unit generations’ profiles with methods M1–M15 for a 40% load.
It should be noted that the reactive power of each PV inverter is saturated before the controller begins to curtail active power. Voltage violations of 1.04 occurred in all cases except when M5 was applied. No curtailment occurs in this case since the curtailment start points in M5 are higher than 1.04. Figure 17 illustrates that some PV units curtail their active power around noon. To clearly distinguish differences in the level of curtailment, this paper aims to calculate the variance of the generation profiles of all PV units. Figure 18 illustrates the estimated variance of APC levels across all PV inverters, indicating that Methods 15, 13, and 4 perform better as the curves converge at the starting point. Method 6 exhibits the poorest performance at the starting point, with the curves being widely spread. For other test conditions, only variance results are provided. Methods 11, 14, and 9 achieved lower variance amplitudes, while Methods 15, 13, and 6 performed reasonably. In order of lower variance, Methods M15, M11, M13, M4, M3, M14, M10, M12, M7, M2, M9 show reasonable variance. Figure 19 shows the maximum voltage of buses after applying the 15 methods. Critical bus voltages exceed 1.04 pi, except in M6, due to the higher curtailment of PV power.
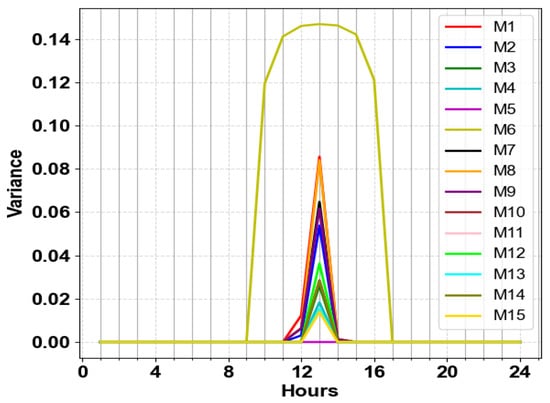
Figure 18.
Comparison of 24-h PV power variance across methods M1–M15 with a load factor of 40%.
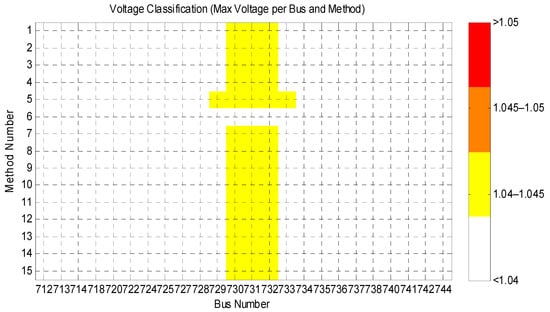
Figure 19.
Maximum voltage of buses comparison across methods M1–M15 with a load factor of 40%.
Linear-based curve design methods and hybrid methods based on achieving a fair share at a load factor of 20% are developed to ensure the optimal contribution of PV inverters in APC. The power profile of the PVs and the variance curves when the load factor is set to 20% are shown in Figure 20 and Figure 21, respectively. M6 demonstrates significantly better fairness, while M4, M6, M8, M9, M12, and M14 perform well in ensuring fair distribution. M7, M10, M111, and M13 provide a moderate share, which is acceptable among PV inverters. For the methods with fixed start or fixed endpoints, the high slope limitation of the VWC hindered their ability to realize their full potential in providing fairness. M7 and M10 achieved a moderately fair share. As can be seen in Figure 22, the maximum voltages of buses in all cases do not exceed 1.05. As M6 imposed a higher level of curtailment, buses 727–735 experienced a maximum voltage of less than 1.04. The maximum voltage with M1, M7, M8, and M9 never reaches values near 1.05. Achieving a fair share is not always optimal, as the total active power after curtailment has not been discussed. Despite M6 providing a fair share, this method resulted in the highest curtailment among other methods, as shown in Figure 23, making it unacceptable. M4, M5, M3, M11, and M2 curtailed less than the others. Considering the ability to provide a fair share and low curtailment, M4 is the best method at this load factor.
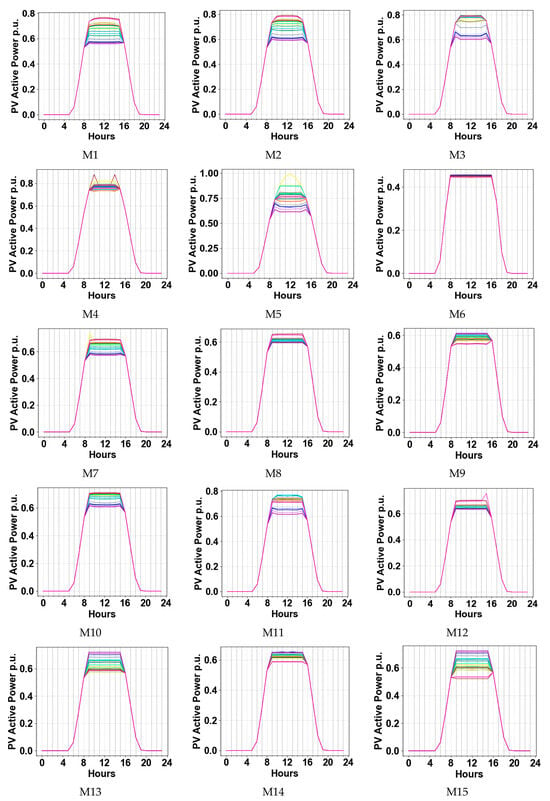
Figure 20.
All PV unit generations’ profiles with methods M1–M15 for a 20% load.
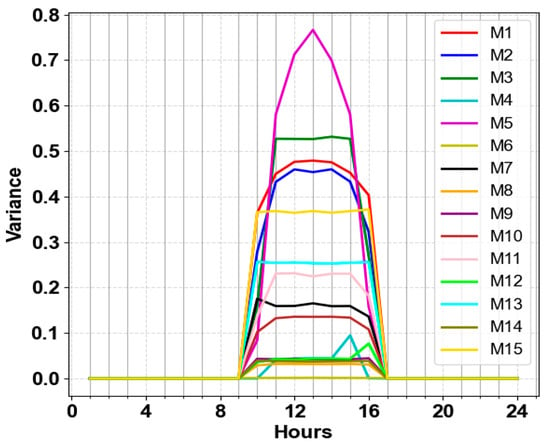
Figure 21.
Comparison of 24-h PV power variance across methods M1–M15 with a load factor of 20%.
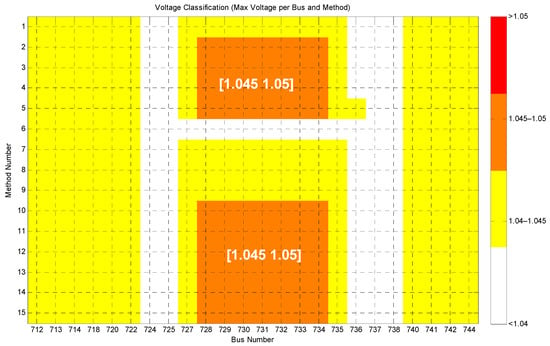
Figure 22.
Maximum voltage of buses comparison across methods M1–M15 with a load factor of 20%.
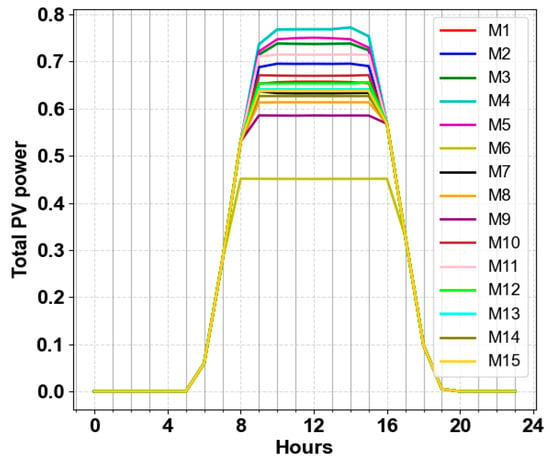
Figure 23.
Comparison of 24-h total PV power variance across methods M1–M15 with a load factor of 20%.
Low load conditions are one of the areas this paper aimed to analyze. Figure 24 and Figure 25 present the variance profile and the total active power generated by PVs after curtailment when the load level decreases to 10%. M6, M12, M8, M7, M10, and M4 provided better fairness, while M4, M3, M11, M5, M2, and M10 curtailed less. Thus, M4 seems to be the best approach. However, this conclusion is contradicted when the voltage profile is examined. By decreasing the load factor, overvoltage issues can arise. The results, shown in Figure 26, indicate that the voltage of some buses violated 1.05 when M4 is applied because the endpoints of curves with M4 are distributed around 1,05. This analysis showed the importance of selecting endpoints close to 1,05.
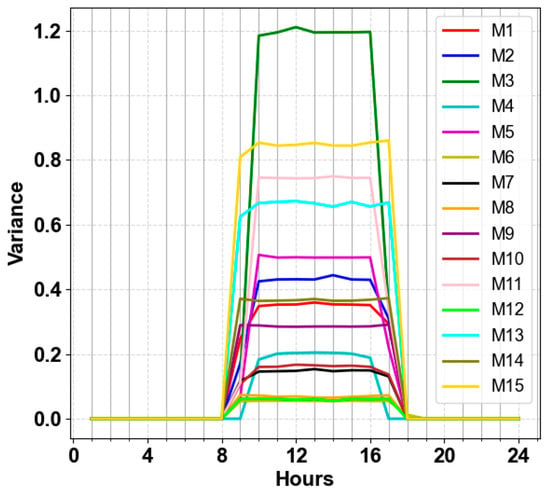
Figure 24.
Comparison of 24-h PV power variance across methods M1–M15 with a load factor of 10%.
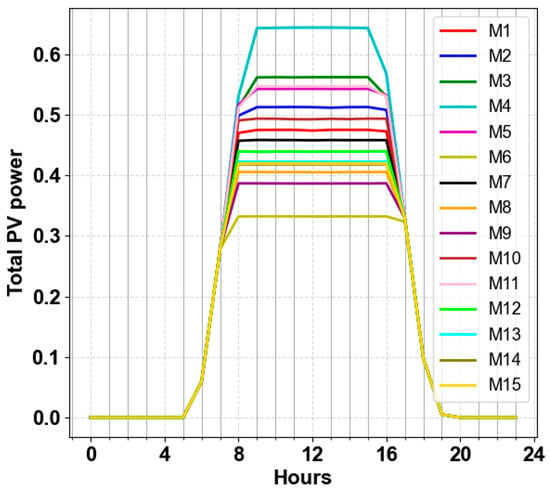
Figure 25.
Comparison of 24-h total PV power variance across methods M1–M15 with a load factor of 10%.
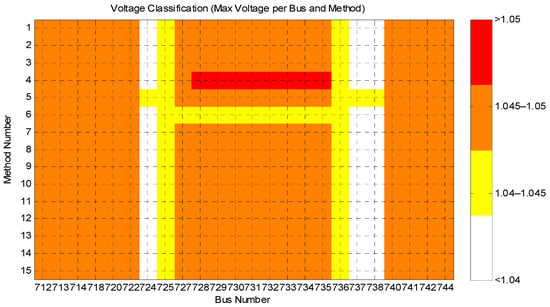
Figure 26.
Maximum voltage of buses comparison across methods M1–M15 with a load factor of 10%.
This section presents a table scoring the methods based on three factors: FF (Fairness Factor), CF (Curtailment Factor), and VF (Voltage Factor). According to the total scores, M10 is the best method, as it consistently achieves high scores in all load conditions. M12, M11, M7, and M14 are alternatives that can meet all expectations. If extreme low-load conditions are ignored, the M4’s total score in SC2 is the highest, and consequently, M4 is the best. Overall, lower curtailment while providing sufficient fairness in the curtailment of PV inverter power results in M4 gaining the highest score. Overall, M3 performed worse than the other methods in all load conditions.
6. Discussion
It is worthwhile to discuss the explanation of the mechanisms behind the observed differences. Here are some noticeable differences and their discussion:
Less curtailment efficiency of M6: The methods designed based on the linear curve design concept (e.g., M6) aim to provide complete fairness at a load of 20%. Except for M4 and M6, the others suffer from slope limitation issues that are a barrier to implementing the ideal fair share among PV inverters. Therefore, both M4 and M6 could provide better fairness regarding the 20% load. However, referring to Figure 7, it is clear that the curtailment level for PV is very high. For instance, the curtailed level at a voltage of 1.04 is around 60%. Thus, M6’s curtailment efficiency is the lowest.
Drawback of M4 in voltage control: Only in M4 are the endpoints allowed to exceed 1.05. This exception enables PV inverters to inject power into the grid even when the voltage of some buses reaches 1.05. As the overvoltage issue arises from PV injection, other methods force PV output power to zero, eliminating the chance of causing overvoltage problems during extremely low-load conditions.
No curtailment with M5 at 40% load: Starting points of curves in M5 are equal to or greater than 1.04. Therefore, even though all other methods curtail active power when the load is at 40%, M does not curtail at all.
Polynomial vs. Linear and Piecewise Models: According to Table 1, considering all load factors, polynomial curves can outperform linear and piecewise-based models, particularly M10 and M12 (polynomial curves with greater freedom in selecting the control region band), which achieved the highest scores. Voltage sensitivity-based slope design at the starting point, converging to the same endpoint or to points based on the first voltage violation (violation of 1.05 p.u.), could give these types of methods higher preference.

Table 1.
Evaluation of methods using FF, CF, and VF metrics for volt–watt curve design.
Table 1 and the conducted comprehensive analyses resulted in interesting findings. A fair reduction in PV power generation can create a sense of loss due to decreased electricity sales to the grid. Reducing curtailment can satisfy PV owners by enhancing their contribution to voltage support and maximizing the usability of PV power, benefiting both the power grid owner and the PV owners. However, a fair share and less curtailment alone cannot guarantee the successful merit of these methods. Overvoltage issues can undermine all apparent benefits, as many customer devices may be damaged, jeopardizing grid stability. Considering the three points discussed, this paper could address these challenges by proposing suitable methods and ranking their effectiveness.
7. Conclusions
This paper studies three conventional approaches and presents twelve strategies for designing VWCs in power grids impacted by a high number of local PV inverters. Higher distributed integration of PV inverters is a phenomenon that can happen regularly in smart cities. This paper investigates IEEE 37 as a typical radial power system model that includes distributed PV units among nearly all buses and features communication capabilities. This paper aims to examine the capabilities of smart inverters in regulating voltage at low-voltage distribution feeders through active power support while assuming that reactive power support has reached saturation beforehand. Simple yet effective procedures are introduced to determine the critical setpoint values for VWCs. The ideal strategy focuses on improving fairness in power curtailment while eliminating the risk of voltage violations.
To find the best methods, complex trade-offs among three performance metrics—Fairness Factor (FF), Curtailment Factor (CF), and Voltage Factor (VF)—are conducted. These metrics are crucial for smart distribution networks, particularly for future grids applicable in smart cities. By evaluating fifteen volt–watt control methods (M1–M15) using three performance metrics, this study highlighted the need for strategies that reduce curtailment and ensure voltage stability and equitable participation among PV owners. The best methods, which perform well under all conditions, are identified and discussed. M10, M12, M11, M7, and M14 are the most effective solutions for designing VWCs.
Author Contributions
All authors contributed equally. All authors have read and agreed to the published version of the manuscript.
Funding
This research was supported by Mitacs through the Mitacs Accelerate Program and the Atlantic Canada Opportunities Agency (ACOA) under the Atlantic Policy Research Initiative. The authors gratefully acknowledge the support of Emera Inc. and NB Power for their valuable contributions to this research.
Data Availability Statement
All necessary data are provided in the paper.
Conflicts of Interest
There is no conflict of interests.
References
- Prempeh, I.; Awopone, A.K.; Ayambire, P.N.; El-Sehiemy, R.A. Optimal Allocation of Distributed Generation Units and Fast Electric Vehicle Charging Stations for Sustainable Cities. Green Energy Intell. Transp. 2025, 100281. [Google Scholar] [CrossRef]
- Fathi, M.; Ghiasi, M. Optimal DG Placement to Find Optimal Voltage Profile Considering Minimum DG Investment Cost in Smart Neighborhood. Smart Cities 2019, 2, 20. [Google Scholar] [CrossRef]
- Jokar, H.; Niknam, T.; Dehghani, M.; Siano, P.; Ouahada, K.; Aly, M. Integrated Energy Management in Small-Scale Smart Grids Considering the Emergency Load Conditions: A Combined Battery Energy Storage, Solar PV, and Pow-er-to-Hydrogen System. Smart Cities 2024, 7, 3764–3797. [Google Scholar] [CrossRef]
- Kumar, M.; Sharma, H.; Diwania, S. Fundamentals of Renewable Energy Resources for Smart Cities. In Smart Cities: Power Electronics, Renewable Energy, and Internet of Things; CRC Press: Boca Raton, FL, USA, 2024; pp. 25–49. [Google Scholar]
- Kurokawa, S. Low-Carbon Transition and Energy Poverty in a Smart City. In The Energy Transition in Japan: Smart Cities and Smart Solutions; Routledge: London, UK, 2025; p. 170. [Google Scholar]
- Yao, H.; Zhou, Q. Research Status and Application of Rooftop Photovoltaic Generation Systems. Clean. Energy Syst. 2023, 5, 100065. [Google Scholar] [CrossRef]
- International Energy Agency. Renewable Energy Progress Tracker. 2024. Available online: https://www.iea.org/data-and-statistics/data-tools/renewable-energy-progress-tracker (accessed on 19 May 2025).
- Fayek, H.H.; Abdalla, O.H. Operation of the Egyptian Power Grid with Maximum Penetration Level of Renewable Energies Using Corona Virus Optimization Algorithm. Smart Cities 2022, 5, 34–53. [Google Scholar] [CrossRef]
- Heidari Yazdi, S.S.; Rahimi, T.; Khadem Haghighian, S.; Bagheri, M.; Gharehpetian, G.B. Over-Voltage Regulation of Distribution Networks by Coordinated Operation of PV Inverters and Demand Side Management Program. Front. Energy Res. 2022, 10, 920654. [Google Scholar] [CrossRef]
- Diahovchenko, I.; Morva, G.; Chuprun, A.; Keane, A. Comparison of voltage rise mitigation strategies for distribution networks with high photovoltaic penetration. Renew. Sustain. Energy Rev. 2025, 212, 115399. [Google Scholar] [CrossRef]
- Su, X.; Fang, L.; Yang, J.; Shahnia, F.; Fu, Y.; Dong, Z.Y. Spatial–Temporal Coordinated Volt/Var Control for Active Distribution Systems. IEEE Trans. Power Syst. 2024, 39, 7077–7088. [Google Scholar] [CrossRef]
- Hou, Q.; Dai, N.; Huang, Y. Voltage Regulation Enhanced Hierarchical Coordinated Volt/Var and Volt/Watt Control for Active Distribution Networks with Soft Open Points. IEEE Trans. Sustain. Energy 2024, 15, 2021–2037. [Google Scholar] [CrossRef]
- Khan, Z.A.; Rahimi, T.; Cardenas-Barrera, J.L.; Ahmed, S.; Diduch, C. Optimal Smart Inverter Volt-Watt and Volt-Var Settings to Maximize Fair Contribution in Voltage Regulation. In Proceedings of the 2024 IEEE 12th International Conference on Smart Energy Grid Engineering (SEGE), Oshawa, ON, Canada, 18–20 August 2024; pp. 31–36. [Google Scholar]
- De Brabandere, K.; Bolsens, B.; Van den Keybus, J.; Woyte, A.; Driesen, J.; Belmans, R. A voltage and frequency droop control method for parallel inverters. IEEE Trans. Power Electron. 2007, 22, 1107–1115. [Google Scholar] [CrossRef]
- Rashid, M.; Knight, A.M. Combining Volt/Var and Volt/Watt Modes to Increase PV Hosting Capacity in LV Distribution Networks. In Proceedings of the IEEE Electric Power and Energy Conference (EPEC), Edmonton, AB, Canada, 9–10 November 2020; Volume 19, pp. 1–5. [Google Scholar]
- Yin, C.; Wu, X.; Wang, X. Two-Stage Resilient Recovery of Unbalanced Distribution System Considering Intelligent Zoning and Merging of Microgrids. IEEE Trans. Smart Grid 2024, 15, 4705–4718. [Google Scholar] [CrossRef]
- Basso, T.S.; DeBlasio, R. IEEE 1547 series of standards: Interconnection issues. IEEE Trans. Power Electron. 2004, 19, 1159–1162. [Google Scholar] [CrossRef]
- Gui, Y.; Nainar, K.; Bendtsen, J.D.; Diewald, N.; Iov, F.; Yang, Y.; Blaabjerg, F.; Xue, Y.; Liu, J.; Hong, T.; et al. Voltage Support With PV Inverters in Low-Voltage Distribution Networks: An Overview. IEEE J. Emerg. Sel. Top. Power Electron. 2024, 12, 1503–1522. [Google Scholar] [CrossRef]
- Kashani, M.G.; Mobarrez, M.; Bhattacharya, S. Smart Inverter Volt-Watt Control Design in High PV-Penetrated Distribution Systems. IEEE Trans. Ind. Appl. 2018, 55, 1147–1156. [Google Scholar] [CrossRef]
- Zhang, C.; Xu, R.; Yang, L. Optimization of Local Voltage Control with Coordinating Droop Functions under High PV Penetration. IEEE Trans. Power Syst. 2024, 39, 5. [Google Scholar] [CrossRef]
- Balogun, O.A.; Sun, Y.; Gbadega, P.A. Optimal PV Active Power Curtailment in a PV-Penetrated Distribution Network Using Optimal Smart Inverter Volt–Watt Control Settings. Energy Rep. 2024, 12, 5396–5419. [Google Scholar] [CrossRef]
- Xie, S.; Kaneko, A.; Hayashi, Y. A Decentralized Voltage Regulation Scheme Using Improved Volt–Var Function of PV Smart Inverter. IEEJ Trans. Electr. Electron. Eng. 2024, 19, 1300–1310. [Google Scholar] [CrossRef]
- Sun, X.; Qiu, J.; Tao, Y.; Zhao, J. Data-Driven Combined Central and Distributed Volt/Var Control in Active Distribution Networks. IEEE Trans. Smart Grid 2022, 14, 1855–1867. [Google Scholar] [CrossRef]
- Wei, X.; Zhang, X.; Wang, G.; Hu, Z.; Zhu, Z.; Chan, K.W. Online Voltage Control Strategy: Multi-Mode Based Data-Driven Approach for Active Distribution Networks. IEEE Trans. Ind. Appl. 2025, 61, 1569–1580. [Google Scholar] [CrossRef]
- Ahmed, E.E.; Demirci, A.; Poyrazoglu, G.; Manshadi, S.D. An Equitable Active Power Curtailment Framework for Overvoltage Mitigation in PV-Rich Active Distribution Networks. IEEE Trans. Sustain. Energy 2024, 15, 2745–2757. [Google Scholar] [CrossRef]
- Nazir, F.U.; Pal, B.C.; Jabr, R.A. Affinely Adjustable Robust Volt/Var Control without Centralized Computations. IEEE Trans. Power Syst. 2022, 38, 656–667. [Google Scholar] [CrossRef]
- Peng, H.; Huang, S.; Wei, J.; Wei, C.; Wu, Q.; Shen, F.; Zhang, W.; Wang, P. Two-Stage Decentralized Optimal Voltage Control in Wind Farms with Hybrid ESSs. IEEE Trans. Power Syst. 2024, 39, 6552–6565. [Google Scholar] [CrossRef]
- Yan, R.; Xing, Q.; Xu, Y. Multi-Agent Safe Graph Reinforcement Learning for PV Inverters-Based Real-Time Decentralized Volt/Var Control in Zoned Distribution Networks. IEEE Trans. Smart Grid 2024, 15, 299–311. [Google Scholar] [CrossRef]
- Haque, A.N.M.M.; Xiong, M.; Nguyen, P.H. Consensus Algorithm for Fair Power Curtailment of PV Systems in LV Networks. In Proceedings of the 2019 IEEE PES GTD Grand International Conference and Exposition Asia (GTD Asia), Bangkok, Thailand, 19–23 March 2019; pp. 813–818. [Google Scholar]
- Ahmed, S.; Rahimi, T.; Cardenas-Barrera, J.L.; Khan, Z.A.; Diduch, C. Quadratic-Equation Based Volt-Watt Control Rules Design Strategy to Mitigate Overvoltage in Power Grids with High Penetration of Solar Sources. In Proceedings of the 2024 IEEE 12th International Conference on Smart Energy Grid Engineering (SEGE), Oshawa, ON, Canada, 18–20 August 2024; pp. 200–205. [Google Scholar]
- Ahmed, S. Dynamic Volt-Watt Control Strategy to Improve Fairness While Mitigating Overvoltage in Distribution System Due to High Penetration of PV. Ph.D. Thesis, University of New Brunswick, Fredericton, NB, Canada, 2024. Available online: https://unbscholar.lib.unb.ca/items/950c5232-2aff-4cf2-802d-814652b7c7f6 (accessed on 19 May 2025).
Disclaimer/Publisher’s Note: The statements, opinions and data contained in all publications are solely those of the individual author(s) and contributor(s) and not of MDPI and/or the editor(s). MDPI and/or the editor(s) disclaim responsibility for any injury to people or property resulting from any ideas, methods, instructions or products referred to in the content. |
© 2025 by the authors. Licensee MDPI, Basel, Switzerland. This article is an open access article distributed under the terms and conditions of the Creative Commons Attribution (CC BY) license (https://creativecommons.org/licenses/by/4.0/).