Article

Transforming Energy Management with IoT: The Norwegian Smart Metering Experience

1
School of Economics, Innovation and Technology, Kristiania University of Applied Sciences, 0153 Oslo, Norway
2
SP Jain School of Global Management, Singapore 119579, Singapore
*
Author to whom correspondence should be addressed.
Smart Cities 2025, 8(3), 84; https://doi.org/10.3390/smartcities8030084
Submission received: 14 March 2025 / Revised: 30 April 2025 / Accepted: 6 May 2025 / Published: 21 May 2025
(This article belongs to the Special Issue Energy Strategies of Smart Cities)

Abstract

:

Highlights

What are the main findings?
  • Through mixed methods, this study identifies familiarity, cost-saving concerns, social influence, and perceived usefulness as significant factors influencing Norwegian consumers’ behavioral intentions to utilize SMT.
  • Despite mandatory smart meter installations, many Norwegian consumers demonstrate limited familiarity and low utilization of advanced features, such as accessing detailed consumption data through additional connected equipment.
What is the implication of the main findings?
  • The findings highlight the need for targeted informational campaigns and financial incentives to enhance user familiarity, reduce barriers to accessing smart meter functionalities, and promote active consumer engagement.
  • Policymakers and energy providers should consider strategies emphasizing practical guidance and clear communication about SMT benefits to increase technology utilization and realize sustainability goals.

Abstract

The rapid adoption of smart technologies is increasingly evident in both personal and business contexts. The ‘post-pandemic’ economic recovery of 2022 and 2023 coincided with a global energy supply shortage driven by heightened energy demand and supply chain disruptions stemming from the ongoing Russian-Ukrainian conflict. The implementation of smart metering systems is a central component of European policies aimed at enhancing the competitiveness and environmental sustainability of energy markets. However, limited research exists on the acceptance of Smart Meter Technology (SMT) in general, specifically in Norway, as compared to other nations. SMT devices offer the potential for real-time energy consumption monitoring, enabling users to track and modify their usage patterns for optimized consumption. This study employs a mixed-methods research design to gather insights from both SMT consumers and vendors. Findings underscore the pivotal roles of familiarity, cost, social influence, and perceived usefulness in shaping consumer adoption of SMT. This article provides critical insights and implications for researchers, network operators, electricity companies, and government agencies.

1. Introduction

The COVID-19 pandemic and subsequent economic recovery created substantial pressure on global energy supply chains, leading to volatility in electricity prices worldwide [1]. Although Norway relies predominantly on hydropower, accounting for approximately 90% of its electricity production [2], it remains exposed to market dynamics in Europe due to its deep integration with Nordic and continental electricity markets. This interconnectivity causes Norwegian electricity prices to fluctuate in response to external shocks despite domestic renewable abundance [3]. For instance, the 2022 European energy crisis, amplified by the war in Ukraine and reduced Russian gas exports, resulted in unprecedented price spikes even in renewable-rich regions like Southern Norway [4,5]. This paradox demonstrates the vulnerability and significant volatility of market-integrated energy systems, even in countries with sustainable generation portfolios like Norway, and stresses the importance of understanding how Norwegian consumers perceive and utilize Smart Meter Technology (SMT) in a volatile energy environment.
The emergence of the Internet of Things (IoT) has introduced a new paradigm of techno-physical networks and applications that can significantly enhance the quality of life [6]. Smart technologies are increasingly integrated into daily life, business, health, and manufacturing [7]. The rapid advancement of IoT and smart technologies enables industries to evolve their systems and introduce innovative applications. One such IoT-based application, SMT, is rapidly spreading in the energy sector [8]. In the European Union (EU) law, SMT is defined as an electronic system capable of measuring energy consumption, offering more information than a traditional meter, and capable of transmitting and receiving data via electronic communication [9]. A typical SMT platform would enable households to monitor their consumption in real time, and some vendor platforms provide access to consumption history and data analysis/visualization capabilities. For energy providers and governments, SMTs (when combined with data analytics) enable them to accurately predict energy consumption, which has become a critical cornerstone for effective resource management and sustainable development [10]. Precise energy forecasting empowers organizations and governments to make informed decisions, optimize resource allocation, reduce operational costs, and minimize environmental impact [10]. Smart meters are also broadly recognized as a critical technology for advancing the digitalization of the energy sector and accelerating the transition to sustainable energy systems [11]. Therefore, consumer acceptance and utilization of SMT are crucial to fully realizing its potential benefits despite previous research projecting an energy consumption reduction of 5 to 15% through the utilization of SMT [12]. However, SMT has encountered low acceptance and utilization in several countries [8,13,14,15]. To utilize this technology, the system’s Home Area Network (HAN) port needs to be accessed, which allows users to gather detailed, real-time information about their electricity consumption via smartphones or in-home displays [16]. The Norwegian government mandated that all households must have smart meters installed by 1 January 2019, following the Measurement and Settlement Regulations Act [16]. Compared to other European countries, Norway ranks well above average in digital skills and internet use and is seen as an early adopter of new technologies and innovations [17].
While there are existing studies on SMT and its benefits, there remains a gap in the literature and industrial reports regarding the use and utilization of IoT-based smart meters in general [15] and in Norway specifically. Hence, this study seeks to collect data from stakeholders within the Norwegian SMT environment to examine how consumers engage with these systems beyond their default configurations. By incorporating perspectives from consumers, industry professionals, and SMT vendors, the research aims to explore how these technologies are utilized for purposes such as optimizing energy consumption, reducing costs, and supporting sustainability efforts. In addition, future researchers can leverage these insights for comparative studies with other countries or previous research. Based on these considerations, the research question for this study is defined as follows:

What Are the Factors Affecting the Consumers’ Use and Utilization of Smart Meter Technology in Norway?

This study attempts to establish an enhanced understanding of SMT utilization among Norwegian households and identify factors affecting behavioral intention to use and utilize the technology through the lens of the Technology Acceptance Model (TAM) [18,19]. In the context of SMT, “use” usually refers to the basic operation of these devices, such as measuring and recording electricity consumption. In contrast, “utilization” involves more strategic applications, including analyzing the data collected by smart meters to optimize consumption patterns, reduce costs, and enhance energy efficiency [15]. This distinction is crucial for effective energy management, as merely deploying smart meters (“use”) does not automatically lead to improved energy and sustainable practices. It is the proactive analysis and application of the data (“utilization”) that drive significant benefits and enhance decision-making. For instance, the findings by [20,21] suggest that providing consumers with real-time feedback on their energy consumption through smart meters leads to a reduction in electricity use and consumption, highlighting the importance of active data utilization. On the other hand, a recent study in Austria reports a significant gap between the existing smart meter infrastructure and its actual utilization among households in Vienna [15], which calls for research on the motivations and barriers to active SMT utilization. Hence, it is of paramount importance to investigate international experiences related to smart meters, considering the users’ perspectives and experiences [22].
The rest of this paper is structured as follows: Section 2 provides a review of the existing literature. In Section 3 and Section 4, the theoretical framework, hypothesis development, and research methodology are discussed, respectively. Section 5 summarizes the data analysis and findings. Section 6 includes a discussion of these findings, followed by the study’s implications in Section 7. Lastly, Section 8 presents the conclusion, limitations, and suggestions for future research.

2. Literature Review

This section offers an overview of the existing literature on smart meter technology, focusing on its market, adoption, use, underlying factors, and implications in various contexts, including Norway.

2.1. Smart Meter Technology

The rapid growth of IoT devices has enabled seamless integration of the physical world with sensors and computational elements, maintaining network connectivity [23]. Digitalization has made “smart” technology central to ongoing development, with smart objects featuring autonomous networking, sensing, storing, and processing capabilities [21,24]. The primary goal of IoT technologies is to enhance efficiency and data-driven decision-making [21]. Traditional electrical grids deliver electricity through a network of transmission lines, substations, and transformers [25]. A smart grid integrates intelligent information processing to coordinate the actions of all stakeholders, aiming to deliver sustainable, economical, and secure electricity [26]. The shift to smart grids addresses climate change and reduces dependence on fossil fuels [27,28] with components connected via communication networks utilizing IoT sensors. SMT is a key element of smart grids and smart home energy management systems [29].
Traditional electricity meters have limitations such as labor-intensive data reading, errors, lack of real-time updates, and potential theft [30]. Smart meters, an IoT-based solution, automate, control, and monitor energy consumption accurately [8] by providing real-time monitoring, user interaction, and automatic data collection and transmission [7,30]. Smart meters record detailed electricity usage and send data back to the supplier [12,16]. The HAN-port in smart meters allows customers to access real-time consumption data with additional equipment [31]. The benefits of SMT include easy bill processing, energy loss detection, automated reading, early blackout warnings, real-time pricing, and efficient energy use [8,30]. Smart meters enable more automated and accurate billing, enhancing consumer and supplier information flow [32] and allowing electricity providers to improve customer experiences through better engagement and trust, which is crucial in the competitive energy sector [33]. Eco-friendly advantages include reduced diesel and gas consumption [27]. Despite these benefits, SMT faces low acceptance in several countries and regions [8,12,13,28]. For example, 75% of homes use smart meters in the U.S., compared to 40% in the UK and less than 25% in Australia [34].

2.2. Background of the Norwegian Electricity Sector and SMT in Norway

Norwegian electricity history goes back to the 1870s [35]. In Norway, hydropower accounts for most of the power supply, and the resource base for production, therefore, depends on the precipitation. This differs from the rest of Europe, where supply security is mainly secured through thermal power plants [2]. The roll-out of smart meters in Norway is expected to unleash new opportunities for electricity consumers. However, there are debates on the use of SMT, and some energy consumers in Norway refuse to install SMTs because of privacy and health concerns [36,37]. To access, control, and utilize the detailed information about electricity consumption obtained from the smart meter, opening the HAN-port is necessary, as Apps or display monitors need to be connected to access and view the consumption data. Existing international studies show that when displays are used, electricity consumption is seen to decrease in varying degrees in households while examining how electricity consumers behave when they receive detailed information about their consumption [20,38], which is also considered as nudging. Hence, it is important to focus on the awareness and utilization of SMT amongst Norwegian electricity consumers.

2.3. Smart Metering Technology Adoption

To gain knowledge and understanding of the utilization of SMT in this study, prior studies on the adoption and acceptance of SMT in various countries were reviewed. An overview of the prior and related studies is presented in Table 1. To the researchers’ knowledge, two studies have been conducted on the Norwegian smart meter market, as shown in the table. However, both studies were conducted before the Measurement and Settlement Regulations Act in 2019, when the Norwegian Water Resources and Energy Directorate (NVE) decided that all Norwegian electricity consumers shall have smart electricity meters installed in their homes. Despite these contributions of past studies on SMT and user intentions, there is still a gap in the literature regarding Norwegian smart meter use and utilization, especially after 2019.

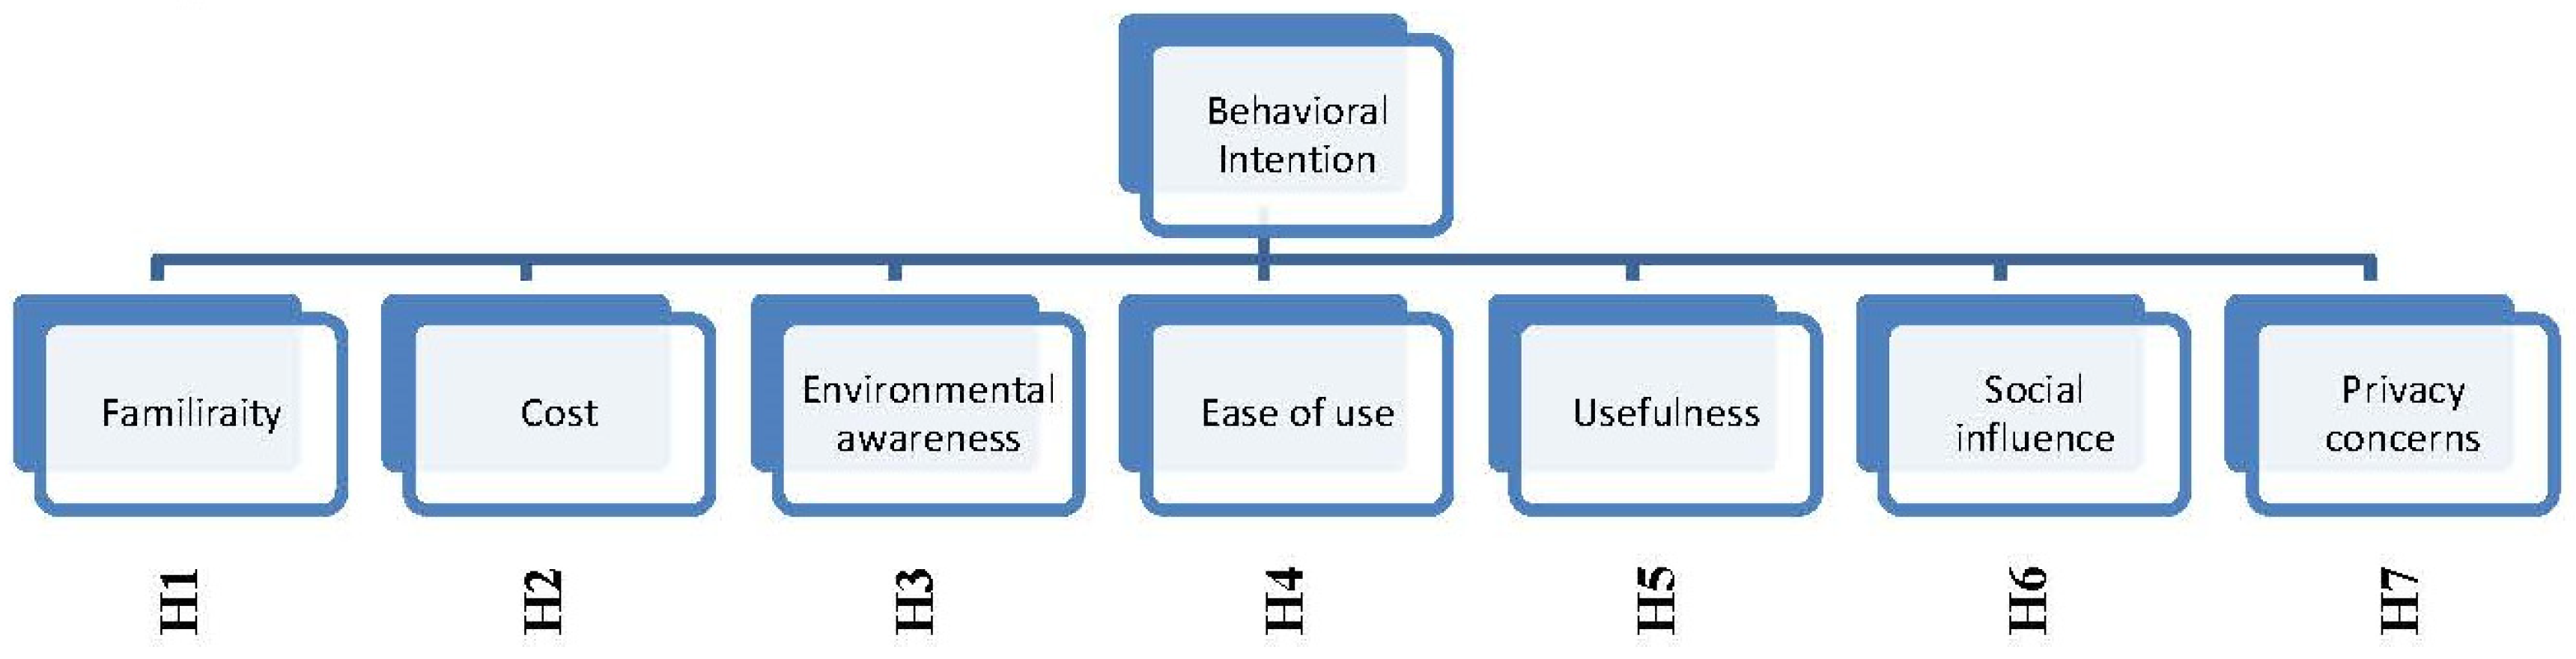
3. Technology Adoption Frameworks and Hypothesis Development

To answer the proposed research question, various adoption frameworks were initially considered and assessed for their relevance. In the Information System (IS) literature, a variety of models have been used to explore the usage and adoption of technology [48]. Past studies on SMT adoption used theories such as TAM and the Unified Theory of Acceptance and Use of Technology (UTAUT) (e.g., [8,12,28,44,48]). Given that smart meters are technological devices that help individuals manage their energy use and behaviors through in-home displays or applications, TAM seems to be an appropriate model [12].
The initial versions of TAM focused on analyzing two factors, namely, Perceived Ease of Use (PEOU) and Perceived Usefulness (PU), as significant determinants of behavioral intentions to use a system or technology [18,48]. According to Davis [18], PEOU is defined as the extent to which an individual believes that using a particular system would be effort-free, and PU is defined as the extent to which an individual perceives that utilizing a specific system will improve their performance. The two factors can further influence the attitude toward using an information system, which can lead to Behavioral Intention (BI) to use and accept the system [49]. TAM serves as a useful foundation for investigating users’ acceptance and utilization of IoT technologies like smart meters, with SMT being a type of IS system. TAM has been widely applied in research related to information technology and has been deemed a suitable model for explaining and predicting the use and acceptance of new technology by many researchers [50]. Despite this, the model only employs two user beliefs (PEOU and PU) to explain acceptance or use and BI. However, a user’s acceptance of the utilization and adoption of smart meters can also be affected by other factors. The original variables may not accurately and adequately explain the acceptance of IoT technology. The model does not highlight situational factors like access and money, which can affect the utilization and acceptance of a system [51]. Several researchers have tried to expand the model by including more factors [19,48,51,52]. TAM2 incorporated factors such as social influence and cognitive processes [52]. Some years later, TAM3 was proposed. TAM3 highlights, amongst other factors, four different types of determinants of PU and PEOU; individual differences, system characteristics, social influence, and facilitating conditions [19]. Individual differences include personality and/or demographics (traits, gender, and age), while social influence captures various social mechanisms and processes that guide individuals to formulate perceptions of various aspects of an IS [19].
Based on the previous literature’s findings, this study integrates Familiarity, Cost and Electricity-Saving Concerns, Environmental Awareness, Social Influence, and Privacy Concerns into the original TAM. In addition, different demographic characteristics like age, education, location, and income are also reviewed. Collectively, this information will be assessed to determine which factors affect Norwegian users’ use and utilization of SMT. In the following subsections, an overview of the relevant factors from the existing literature is presented along with the hypotheses.

3.1. Familiarity with SMT

The extant literature argues that consumer familiarity (F) with SMT is an important factor that increases the consumer’s intention to use the technology [8,41]. This is supported by other similar studies that found familiarity with smart meters and climate change has a strong effect on the potential acceptance (e.g., [20,22,43]) and utilization [15] of SMT. Hence, we hypothesize that familiarity has a significant effect on the behavioral intention to utilize SMT.
H1:
Familiarity has a significant effect on behavioral intention to utilize SMT.

3.2. Cost and Electricity-Saving Concerns

Prior research has used extended versions of TAM, including perceived cost or price value, which is conceptualized as the perception that benefits exceed the monetary cost of the technology [12]. A study on willingness to use SMT in Germany reviewed the users’ expected savings as a factor influencing intention to use [42], and price consciousness was found to have a positive relationship with the acceptance of SMT, which confirms recent research conducted in Austria that emphasized the importance of cost concerns [15]. Another study from the United States found that affordability affects the likelihood of adoption [13]. The post-pandemic recovery from late 2021 has led to greater energy demand and, thereby, a global energy supply shortage [53,54]. There are several other reasons for the increased electricity prices, such as the Russian invasion of Ukraine, shifting weather, and increased CO2 prices [55,56]. Considering this, it is therefore interesting to review the aspect of cost concerns in relation to acceptance.
H2:
Concerns with cost and electricity saving concerns (CEC) have a significant effect on behavioral intention to utilize SMT.

3.3. Environmental Awareness

Prior studies have explored the connection between consumer attitudes toward the environment and energy consumption behavior, driven by the growing global focus on environmental conservation [57]. Hence, in recent years, sustainability has become a key issue for society [21]. Individuals, organizations, governments, and international bodies across the world are focusing on sustainability [58]. This makes it an interesting factor to explore, thereby introducing the factor of environmental awareness (EA). EA is defined as the capability of a person to understand the relationship between human actions and the status of environmental quality [44]. SMT enables several environmental benefits. For example, one benefit is that smart meters allow consumers to participate in the energy system and make more environmentally friendly choices [21]. A study on willingness to use SMT in Germany found that the higher a customer’s EA, the higher the willingness to pay [42]. It is found that people who are concerned with the environment are more likely to adopt SMT [40]. Based on their findings, Bugden and Stedman [43] proposed that linking smart meters to climate change and renewable energy could produce more positive attitudes for consumers who believe in climate change. Their study found climate change perception to have the strongest effect on acceptance, in addition to familiarity. This was supported by Toft et al. [28], who found responsibility toward the environment a significant driver of acceptance in different European countries. The impact of EA was also supported in a study from Malaysia on behavioral intention to use SMT [44]. Thus, the study will investigate the role of EA concerning acceptance.
H3:
Environmental awareness has a significant effect on behavioral intention to utilize smart meter technology.

3.4. Perceived Ease of Use (PEOU) and Perceived Usefulness (PU)

In the context of SMT and user acceptance, several studies have highlighted the importance of perceived ease of use and perceived usefulness as critical determinants. A study from Korea identified PEOU as a significant factor in the acceptance of smart grids and technologies [41]. This finding aligns with results from studies conducted in various other countries within the SMT and smart grids ‘contexts (e.g., [39,44,48,59]). PEOU is akin to effort expectancy, a factor proposed in the UTAUT. Prior studies have corroborated the significance of effort expectancy in the acceptance of SMT [44,48]. PU is consistently regarded as the most influential determinant of BI among PU and PEOU [49]. Specifically, in the context of consumer acceptance of SMT, PU emerges as a robust predictor of BI [28,48]. PU in the SMT context is conceptualized as users’ perceptions of the system’s ability to enhance energy management tasks, generate cost savings, improve efficiency, and provide real-time information about energy consumption [12]. This concept is analogous to performance expectancy in UTAUT [44,48]. Performance expectancy has been shown to positively impact the behavioral intention to use IoT technologies [44,48]. Earlier studies have demonstrated that smart grid technology is more likely to be adopted if potential users perceive it as useful [28,48]. For example, in the United States, PU has been found to have a direct effect on support for smart meter installation and the intention to adopt these technologies [12]. Therefore, we hypothesize that both PEOU and PU significantly influence the behavioral intention to utilize SMT. This hypothesis is supported by a substantial body of literature, underscoring the pivotal role of these factors in technology acceptance models across different contexts and cultures.
H4:
Perceived ease of use has a significant effect on behavioral intention to utilize SMT.
H5:
Perceived usefulness has a significant effect on behavioral intention to utilize SMT.

3.5. Social Influence

Social influence (SI) has received considerable attention in the information systems field as an important factor under TAM [19]. When reviewing the acceptance and utilization of technology, the social context should not be neglected [48]. The social influence of friends and relatives already having installed smart meters in their households was found in the literature to have a strong impact on consumers’ decisions to install the smart meter (e.g., [32,45]). Friends and relatives who planned to install, on the other hand, had a smaller impact on the acceptance of SMT [32]. Influence from family, peers, and media might influence users’ intention to adopt IoT technologies. Similarly, Gao and Bai [48] found SI to have the second largest effect on BI to accept SMT in their study. On the other hand, Alkawsi, Ali [44] found SI to have no significant influence on the behavioral intention to accept. Accordingly, modern users had a greater tendency to be independent in their decisions, and they were not easily swayed, even by those who were important to them [44]. This is in line with Oraedu et al.’s [14] study on households in Nigeria, which revealed that external or societal pressures do not contribute to the decision to use the smart meter system. Considering these conflicting findings in the extant literature, it is then crucial to examine how the impact of family, friends, and media influence Norwegian consumers’ utilization and use of SMT, and the below hypothesis is proposed in line with the literature on TAM, which is used as the theoretical foundation, as described earlier.
H6:
Social influence has a significant effect on behavioral intention to utilize smart meter technology.

3.6. Privacy Concerns

The electricity consumption of a specific smart meter is linked to a particular address through the unique identifier associated with each smart meter. Consequently, electricity consumption data can be traced back to an individual via the property owner at that specific address [60]. This association raises significant privacy concerns (PC), which may influence Norwegian consumers’ adoption and utilization of smart meter technology. Thus, it is essential to delve deeper into these concerns.
Despite the vast potential of IoT applications, privacy and security remain paramount concerns [61]. Park, Kim [41] identified cybersecurity concerns as a major factor influencing consumers’ perceptions of smart grids. Further, Chen, Xu [12] found that perceived privacy risk had a direct impact on support for smart meter installation and the intention to use these devices. Their study highlighted that consumer privacy concerns revolve around private household activities, lifestyle, and power consumption patterns inferred from smart meter data [12]. Similarly, another study found that factors such as privacy and security significantly influenced the likelihood of adopting SMT [13]. Hackers could potentially exploit the detailed user profiles recorded by smart meters to invade individuals’ privacy. Previous research indicates that perceived privacy risk is negatively correlated with support for smart meter technology and the intention to use it [12,41,62]. Consequently, users are concerned that the installation of smart meters may lead to the misuse of their data [41,62].
While SMT offers numerous benefits, privacy and security concerns play a crucial role in consumer acceptance and utilization. Thus, understanding these concerns is vital for the effective implementation and widespread adoption of smart meters.
H7:
Privacy concerns have a significant effect on behavioral intention to utilize smart meter technology.

3.7. Demographics

Bugden and Stedman [43] found that age and income may have an important effect on the intention to adopt SMT. There may be individual differences that can impact household energy behaviors [12]. For example, Gao and Bai [48] argue that respondents between the ages of 20 and 34 are more vulnerable to SI than other age groups. Chawla, Kowalska-Pyzalska [32] found that consumers who are in the process of SMT installation are mainly those who live in urban areas or the city center rather than in villages. Individual differences include personality and/or demographics, like traits, gender, and age [19]. Westskog, Winther [20] found differences between various types of households in their interaction with technology, thereby highlighting increased differences across socioeconomic groups.
Figure 1 below depicts the proposed research hypotheses based on the literature surveyed and drawing on the theoretical framework of TAM.
While there is no proposed hypothesis on demographics, related data will be collected and analyzed as elaborated in the subsequent sections. The following section presents the employed research methodology and overall research design.

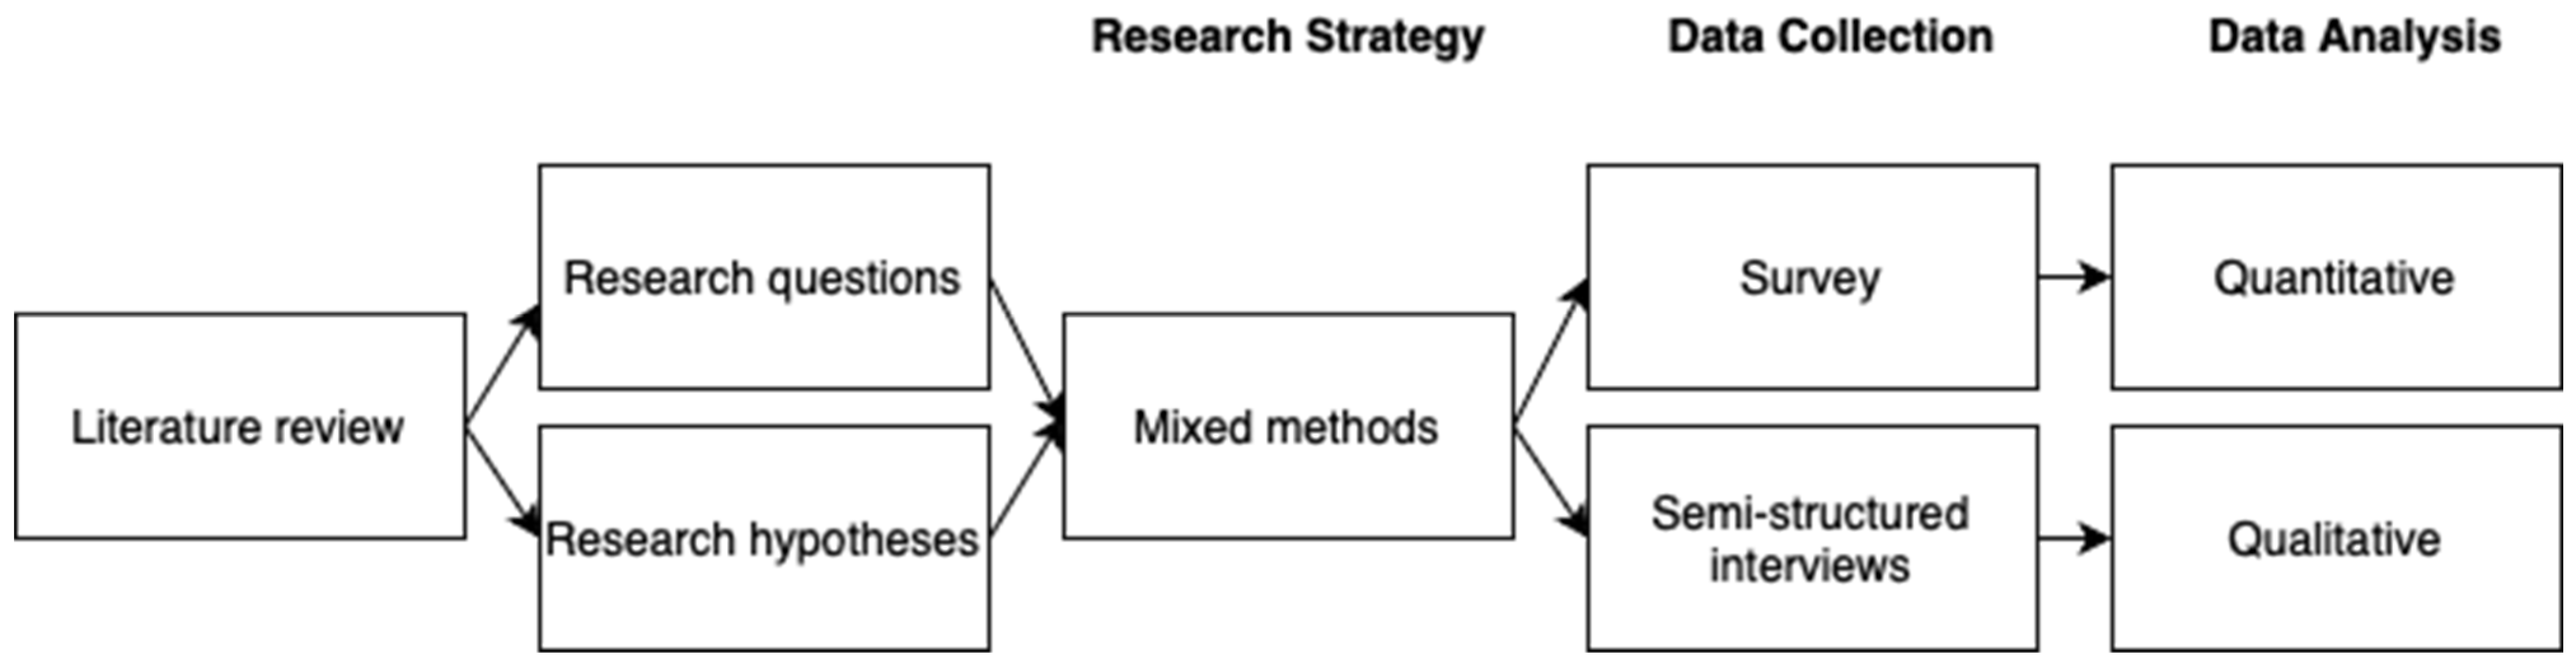
4. Research Methodology

The study adopts a deductive approach [63] to examine the application of IoT-based smart meter technology. By leveraging established theories, it formulates hypotheses that are tested through structured data collection and analysis. This approach aims to ground the research in existing knowledge while contributing empirical insights to support or refine the proposed hypotheses [63].

4.1. Research Process

This study utilizes a sequential quantitative-qualitative mixed-method research process [64], as described by Oates [63] and illustrated in Figure 2. By integrating both quantitative and qualitative data, the study attempts to achieve a broader understanding of the area under investigation. This dual perspective, encompassing both stakeholders, electricity users, and vendors, provides a foundation for discussion by facilitating a better understanding of the issues from multiple views. By collecting data from electricity users, researchers can gain insights into consumer behavior, preferences, and challenges regarding SMT. This user-centered information is crucial for identifying areas where improvements can be made to enhance user experience and satisfaction. On the other hand, gathering data from vendors, including energy providers and SMT suppliers, offers a perspective on the operational and technical aspects of electricity supply and smart meter implementation. Vendors can provide valuable information about the feasibility, cost, and technical challenges of deploying new technologies, as well as their impact on the grid and overall energy efficiency. Combining these perspectives allows for a balanced discussion that considers findings from both the consumer and provider viewpoints, facilitating the development of solutions that are practical, sustainable, and user-friendly.
The following sections elaborate on the approaches and processes employed for quantitative and qualitative data collection and analysis.

4.2. Quantitative Method

For exploring Norwegian electricity users’ utilization of SMT, collecting data from a large sample using an online survey is advantageous. Surveys allow for standardized and systematic data collection from a broad group [63] to identify patterns in responses from the selected population. The target group for this study included Norwegian citizens of diverse ages, occupations, locations, and income levels. Given the time and resource constraints, a survey questionnaire was deemed appropriate for this research project. The survey was designed to be explanatory and deductive, aiming to test the extended TAM presented in Section 3. A survey can be conducted in various ways. For this study, a questionnaire format was chosen with a pre-defined set of questions presented in a specific order [63], allowing for efficient and structured data collection that supports the research objectives.

4.2.1. Data Collection—Survey

To develop a well-designed questionnaire aligned with the study’s aims, constructs were drawn from the relevant literature on the use, adoption, and acceptance of SMT (see Table 2). An internet-based survey was employed to attempt to gather representative data through a diverse and inclusive range of responses. The online survey comprised closed-ended questions to facilitate pre-coded data for easier analysis [63].
Initially, a pilot study was conducted with 22 representative respondents to test the questionnaire. External validity was assessed to ensure the findings would be representative of the target population [65]. Feedback from the pilot study was reviewed, and necessary adjustments were made to the survey. One significant suggestion from the pilot study was to change the survey’s language from English to Norwegian. Additionally, the question of income level was modified to better accommodate respondents. The sequence of questions was adjusted for accuracy, with “Privacy Concerns” questions moved to the bottom to prevent biasing earlier responses. The final survey, refined based on pilot feedback and the literature, consisted of three parts and 36 questions.
The first part included general demographic questions about age, location, education, occupation, and income. These responses enabled us to create clusters and gain deeper insights into the respondents. Questions related to our hypotheses and research model were constructed using a Likert scale [65], ranging from 1 (strongly disagree) to 5 (strongly agree). Table 2 presents an overview and a sample of the questions related to the model. The final question allowed participants to rate the importance of various factors concerning the potential utilization of the technology.
Table 2. Overview of Questionnaire Constructs.
ConstructQuestions in the Online QuestionnaireReference
Familiarity (F)
F1
F2
F3
F4
F5
“I am familiar with smart meters and their case of use”
“I know the functions of the smart meter system, its advantages, and possibilities”
“I am aware of additional equipment that can be connected to my electricity meter”
“I have received information about the smart metering system and its potential benefits from my electricity company (either in person, on their website, or through apps)”
“I have received guidance/training about the smart metering system and potential benefits from my electricity company”
[8,20,41,43,47]
Cost and Electricity-Saving concern (CEC)
CEC1
CEC2
CEC3
“I would like to save money on my electricity consumption”
“I am well acquainted with various energy-saving methods”
“I would like to save money on my electricity consumption by using new technology”
[12,15,28,40,42,43,55,66]
Environmental awareness (EA)
EA1
EA2
EA3
“My concern about climate change affects my energy consumption”
“Because of my concern about climate change, I want to use the smart meter system at home”
“I want to contribute more to my own energy system to reduce my energy consumption”
[14,15,21,40,42,43,44,58]
Perceived ease of use (PEOU)
PEOUI
PEOU2
PEOU3
“Learning to use new technology is easy for me”
“I would be more likely to use a system that I perceive to be easy to use”
“I (would) master the use of the smart meter system”
[18,28,40,41,44,48,49,52,59];
Perceived usefulness (PU)
PU1
PU2
PU3
“I will be more likely to use and exploit new technology if I perceive it to be useful”
“I will be more likely to use and utilize the smart meter system if I perceive it to be useful’
“I think that a smart meter system could be useful for me”
[12,13,18,28,40,41,44,48,49,52,59]

4.2.2. Data Analysis

A quantitative method utilizing a mathematical approach was employed to interpret the collected data. Descriptive statistics, including frequency calculations and comparisons of means, were conducted to gain deeper insights into the survey respondents. To evaluate the research model and test the hypothesized relationships between constructs, a Partial Least Square Structural Equation Modeling (PLS-SEM) confirmatory factor analysis was performed using SmartPLS 4 version 29. SEM is a robust multivariate technique used to assess and evaluate causal relationships among multiple variables in scientific research [67]. The PLS-SEM method was chosen for this study due to its suitability for small sample sizes, its non-requirement of normality in the dataset, and its effectiveness in theory building, prediction, and construct development [67,68]. The assessment model was tested in two stages: evaluating the measurement model and the structural model. The measurement model assessed the latent or composite variables by examining loadings, internal consistency, convergent validity, and discriminant validity of the constructs [68]. The structural model tested the hypothesized dependencies among constructs, assessing collinearity issues, the significance and relevance of relationships, and the model’s predictive and explanatory power [68]. This methodological approach enabled a detailed analysis of the data, providing useful insights into the factors influencing the adoption and use of smart meter technology in Norway.

4.3. Qualitative Method

Qualitative research usually looks for categories and themes within the words people use, in comparison with quantitative research, which analyzes numeric data [63]. The approach is more exploratory and can be used to answer different questions related to a participant’s meaning and experience [63]. The research approach often consists of individual interviews, focus groups, observation, or a combination of methods [69], which allows researchers to gain a deeper understanding of the topics that were not revealed through the online survey.

4.3.1. Data Collection—Semi-Structured Interviews

The qualitative data collection consisted of three interviews with various Norwegian companies that work within the SMT industry (Table 3). The companies included were an electricity company that works with the end-user market, an electricity consulting company, and a network company in Norway. Our goal was to gather qualitative data to better understand the quantitative data on Norwegian SMT and gain suppliers’ perceptions of the use and their customers, which in turn can assist in answering the research question [63,65]. The sample size in the study was initially aimed to be 4–5 industry professionals. Due to difficulties in getting in contact and answers from potential interviewees, we were only able to interview three experts. Ideally, a higher number of participants would create an even better understanding of SMT technology in Norway [63].
The interviews were semi-structured. A semi-structured interview is a data collection instrument that relies on posing open-ended interview questions within a predetermined thematic framework [63,69]. Based on this, the questions could be changed depending on the progress of the interviews. Hence, an interview guide was outlined in advance to ensure that relevant topics were covered [63]. The interview guide included various questions covering issues related to the informants’ customers and their SMT utilization and concerns (e.g., privacy issues, integration, cost) in general, as well as questions related to the specific vendor and the overall Norwegian SMT industry.
The qualitative phase of this study involved interviews with three industry experts. Although deliberate efforts were made to capture diverse perspectives by selecting informants from different sectors, specifically, an electricity provider, a consulting firm, and a network operator, recruiting individuals with the requisite background and role proved challenging. Consequently, the limited number of interviews with industry experts is a limitation of this study. To mitigate potential interviewer bias, semi-structured interviews were employed, offering a balance between flexibility and adherence to a consistent thematic framework.
With the variations in the informants companies’ involvement with SMT, some questions were excluded or modified depending on the company’s role in the market. In total, three different interview guides were presented, mainly standard common questions and company-specific questions. The collection of data using an online survey and interview was approved by the Norwegian Centre for Research Data (NSD) and the Norwegian Agency for Shared Services in Education and Research (SIKT). The respondents were also introduced to an information section before starting the question part of our survey. The section contained short and general information about the technology, research information, anonymity, and contact information. Participants were anonymized, so their names will be referred to as “COMP1, COMP2, and COMP3” instead of their personal and company names (See Table 3). As a final step, we checked the qualitative data we obtained against other sources to ensure its credibility [63].

4.3.2. Data Analysis

To identify underlying connections, patterns, and sub-themes beyond the research model’s topics, a thematic analysis was conducted on the collected qualitative data. This methodology aims to demonstrate the process of thematically analyzing qualitative data to generate interpretations [70,71]. The analysis was carried out using a deductive approach, focusing primarily on the topics outlined in the research model [63]. While deductive analysis provides detailed insights into specific aspects of the data, it may not offer a comprehensive view of the entire dataset [63,71]. Additionally, the thematic analysis identified themes and subtopics beyond those predefined in the interview guide [63]. The following section presents the study’s quantitative and qualitative findings. To minimize the risk of interviewer bias, a semi-structured approach was adopted and administered by two interviewers, and participant anonymity was strictly maintained during coding and analysis, as recommended by [63]. In addition, to ensure the reliability of the coding process, inter-rater reliability guidelines, as proposed by Anastasi and Urbina [72], were followed. Two authors independently coded the interview data, and any discrepancies in thematic interpretation and coding were systematically discussed among all authors until a consensus was reached.

5. Findings

The quantitative and qualitative findings are presented separately, starting with the quantitative data from the survey. The initial data exploration involved a descriptive analysis to assess external validity and respondent distribution. Subsequently, an evaluation of the measurement and structural models was conducted. The measurement model, which assesses latent variables, was evaluated for loadings, internal consistency, convergent validity, and discriminant validity of the constructs [68,73]. The structural model was then tested for the hypothetical dependencies [73].
Following the quantitative analysis, the qualitative findings derived from interview data were presented. These qualitative insights provided a deeper understanding of the topics explored in the quantitative section [63].

5.1. Quantitative Findings

The following sections outline the findings obtained through the quantitative data collection method, specifically the online survey. These findings are then evaluated against the study’s hypotheses to determine whether they are supported or not.

5.1.1. Descriptive Statistics

The first analysis performed on the quantitative data was descriptive. Descriptive statistics provide an overview of the distribution of respondents from our survey and ensure external validity. The survey included six questions on socio-demographic characteristics (gender, age, location, education, occupation, and income) and three questions on respondents’ behavior and use of smart meter technology. A total of 114 responses were received from the online questionnaire. After cleaning the data for missing responses, 9 respondents were removed, resulting in 105 valid responses.
The demographic factors of the respondents are summarized in Table 4, using frequency calculations in descriptive statistics. This analysis offers an overview of the distribution of respondents by gender, age, location, education level, occupation, and pre-tax income. Table 4 indicates that certain demographic factors had skewed distributions. For instance, respondents aged 66 years or older (4.8%), residents of Central Norway (1.9%) and Northern Norway (2.9%), retirees (5.7%), and individuals earning 150,000 NOK or less (6.7%) were underrepresented. Additionally, unemployed individuals were not represented in the study at all. Of the 105 respondents, 76.2% were employed, indicating a significant overrepresentation. The sample had a balanced gender distribution, with 50.5% male and 49.5% female respondents. Respondents were also asked about their use of smart home technology, including smart meters. Out of the 105 respondents, 41 reported using some type of smart home technology, while 60 did not. According to the NVE, all Norwegian electricity consumers were required to have smart meters installed by 1 January 2019 [16]. It was noteworthy to assess the general awareness of this law among participants. Of the 105 respondents, 53 (50.5%) were aware of the requirement, 38 (36.2%) were unaware, and 14 (13.3%) were uncertain.
Despite aligning with Norway’s national gender distribution (males at 50.5% and females at 49.5%), the sample exhibits demographic disparities compared to the 2023 national data [74,75]. The age groups of 18–25 and 46–55 are overrepresented at 24.8% and 30.5%, respectively, versus national proportions of approximately 14% and 13%. In contrast, individuals aged 66 and older are underrepresented at 4.8% compared to 17% nationally. Geographically, the sample is skewed towards Eastern Norway and Southern Norway, comprising 60% and 27.6% of participants, exceeding their national shares of about 50% and 6%, respectively, while Western, Central, and Northern Norway are underrepresented. The respondent sample was characterized by an overrepresentation of individuals with higher education and income levels compared to the national averages. In the study, 74.3% of participants held at least a bachelor’s degree, whereas only ca. 34% of Norway’s adult population attained this level of education [76]. Additionally, 69.6% of respondents reported annual pre-tax incomes exceeding 551,000 NOK, compared to the national median income of approximately 635,000 NOK [77].
As mentioned earlier, the HAN port must be activated, and additional equipment, such as apps or displays, must be connected to fully utilize SMT. Therefore, the survey included a question on the use of such additional equipment. Findings revealed that 31 of the 105 respondents (29.5%) utilized SMT through additional equipment, while 66 respondents (62.9%) did not. These findings are detailed in Table 5.
Table 5 illustrates the respondents’ use of their smart meter technology with additional connected equipment. Further analysis of the behavior concerning income levels indicates that individuals with an income of 551,000 NOK or higher are more likely to utilize additional connected equipment with their SMT compared to those earning 550,000 NOK or less. To better understand the distribution of smart meter technology use and awareness across different demographic groups, we conducted a comparative analysis of means. The means and standard deviations (Std. Dev.) for the survey questions were based on a 5-point Likert scale, where one indicates “strongly disagree” and five indicates “strongly agree” with the presented statements. The standard deviation measures the dispersion of responses around the mean. When examining respondents’ familiarity with smart meters by location, the results indicate that individuals nationwide are generally not familiar with smart meters and their usage. The overall awareness of additional equipment required for connection scored an average of 2.55, suggesting limited awareness among participants. Furthermore, responses to item F5 revealed that many participants disagreed with the statement that they had received guidance and information about potential benefits from their electricity company. These findings are virtually consistent across different regions.
When analyzing the Cost and Electricity-Saving Concern construct about income, the findings indicate that individuals are uniformly motivated to save money on their electricity consumption, regardless of their income levels. However, it was observed that individuals in the lower income brackets (“150,000 NOK or less” and “151,000–351,000 NOK”) are less familiar with electricity-saving methods compared to those in higher income brackets. The findings reveal that, across all income groups, there is a strong willingness to adopt new technology for reducing electricity costs, with this tendency being particularly pronounced among higher income groups. Another notable observation is that respondents aged 18–25 are significantly more influenced by social media, family, and peers in their decision to use SMT. The data reveals a clear disparity, with the 18–25 age group showing a markedly higher susceptibility to social media influence compared to other age groups. Interestingly, respondents aged 36–45 scored the lowest in this dimension. In addition, our findings indicate that individuals in the 18–25 and 26–35 age brackets are more inclined to adopt SMT if their immediate social circles also utilize the technology. Moreover, privacy concerns were generally rated low compared to other factors, with average scores all below 3.00. An interesting finding was the big difference in the importance of privacy concerns between the “66 and older” age group and all other age groups. The “66 or older” group agreed more with the statements about privacy and security concerns than any other age group. Therefore, this group is more likely not to use SMT because of these concerns. Compared to the responses in the social influence category, privacy concerns seem to be a bigger issue for this specific age group.
The final question in the survey asked respondents to share what they thought was most important if they were planning to use or were already using SMT. Respondents rated each factor from 1 to 5, with one representing “not important” and five representing “very important.” The average scores, mean, and standard deviations were then calculated using SPSS v28. The results indicate that knowing how to use the system, high electricity costs, energy saving, ease of use, and usefulness were very important to respondents. Social influence was considered less important by the respondents.

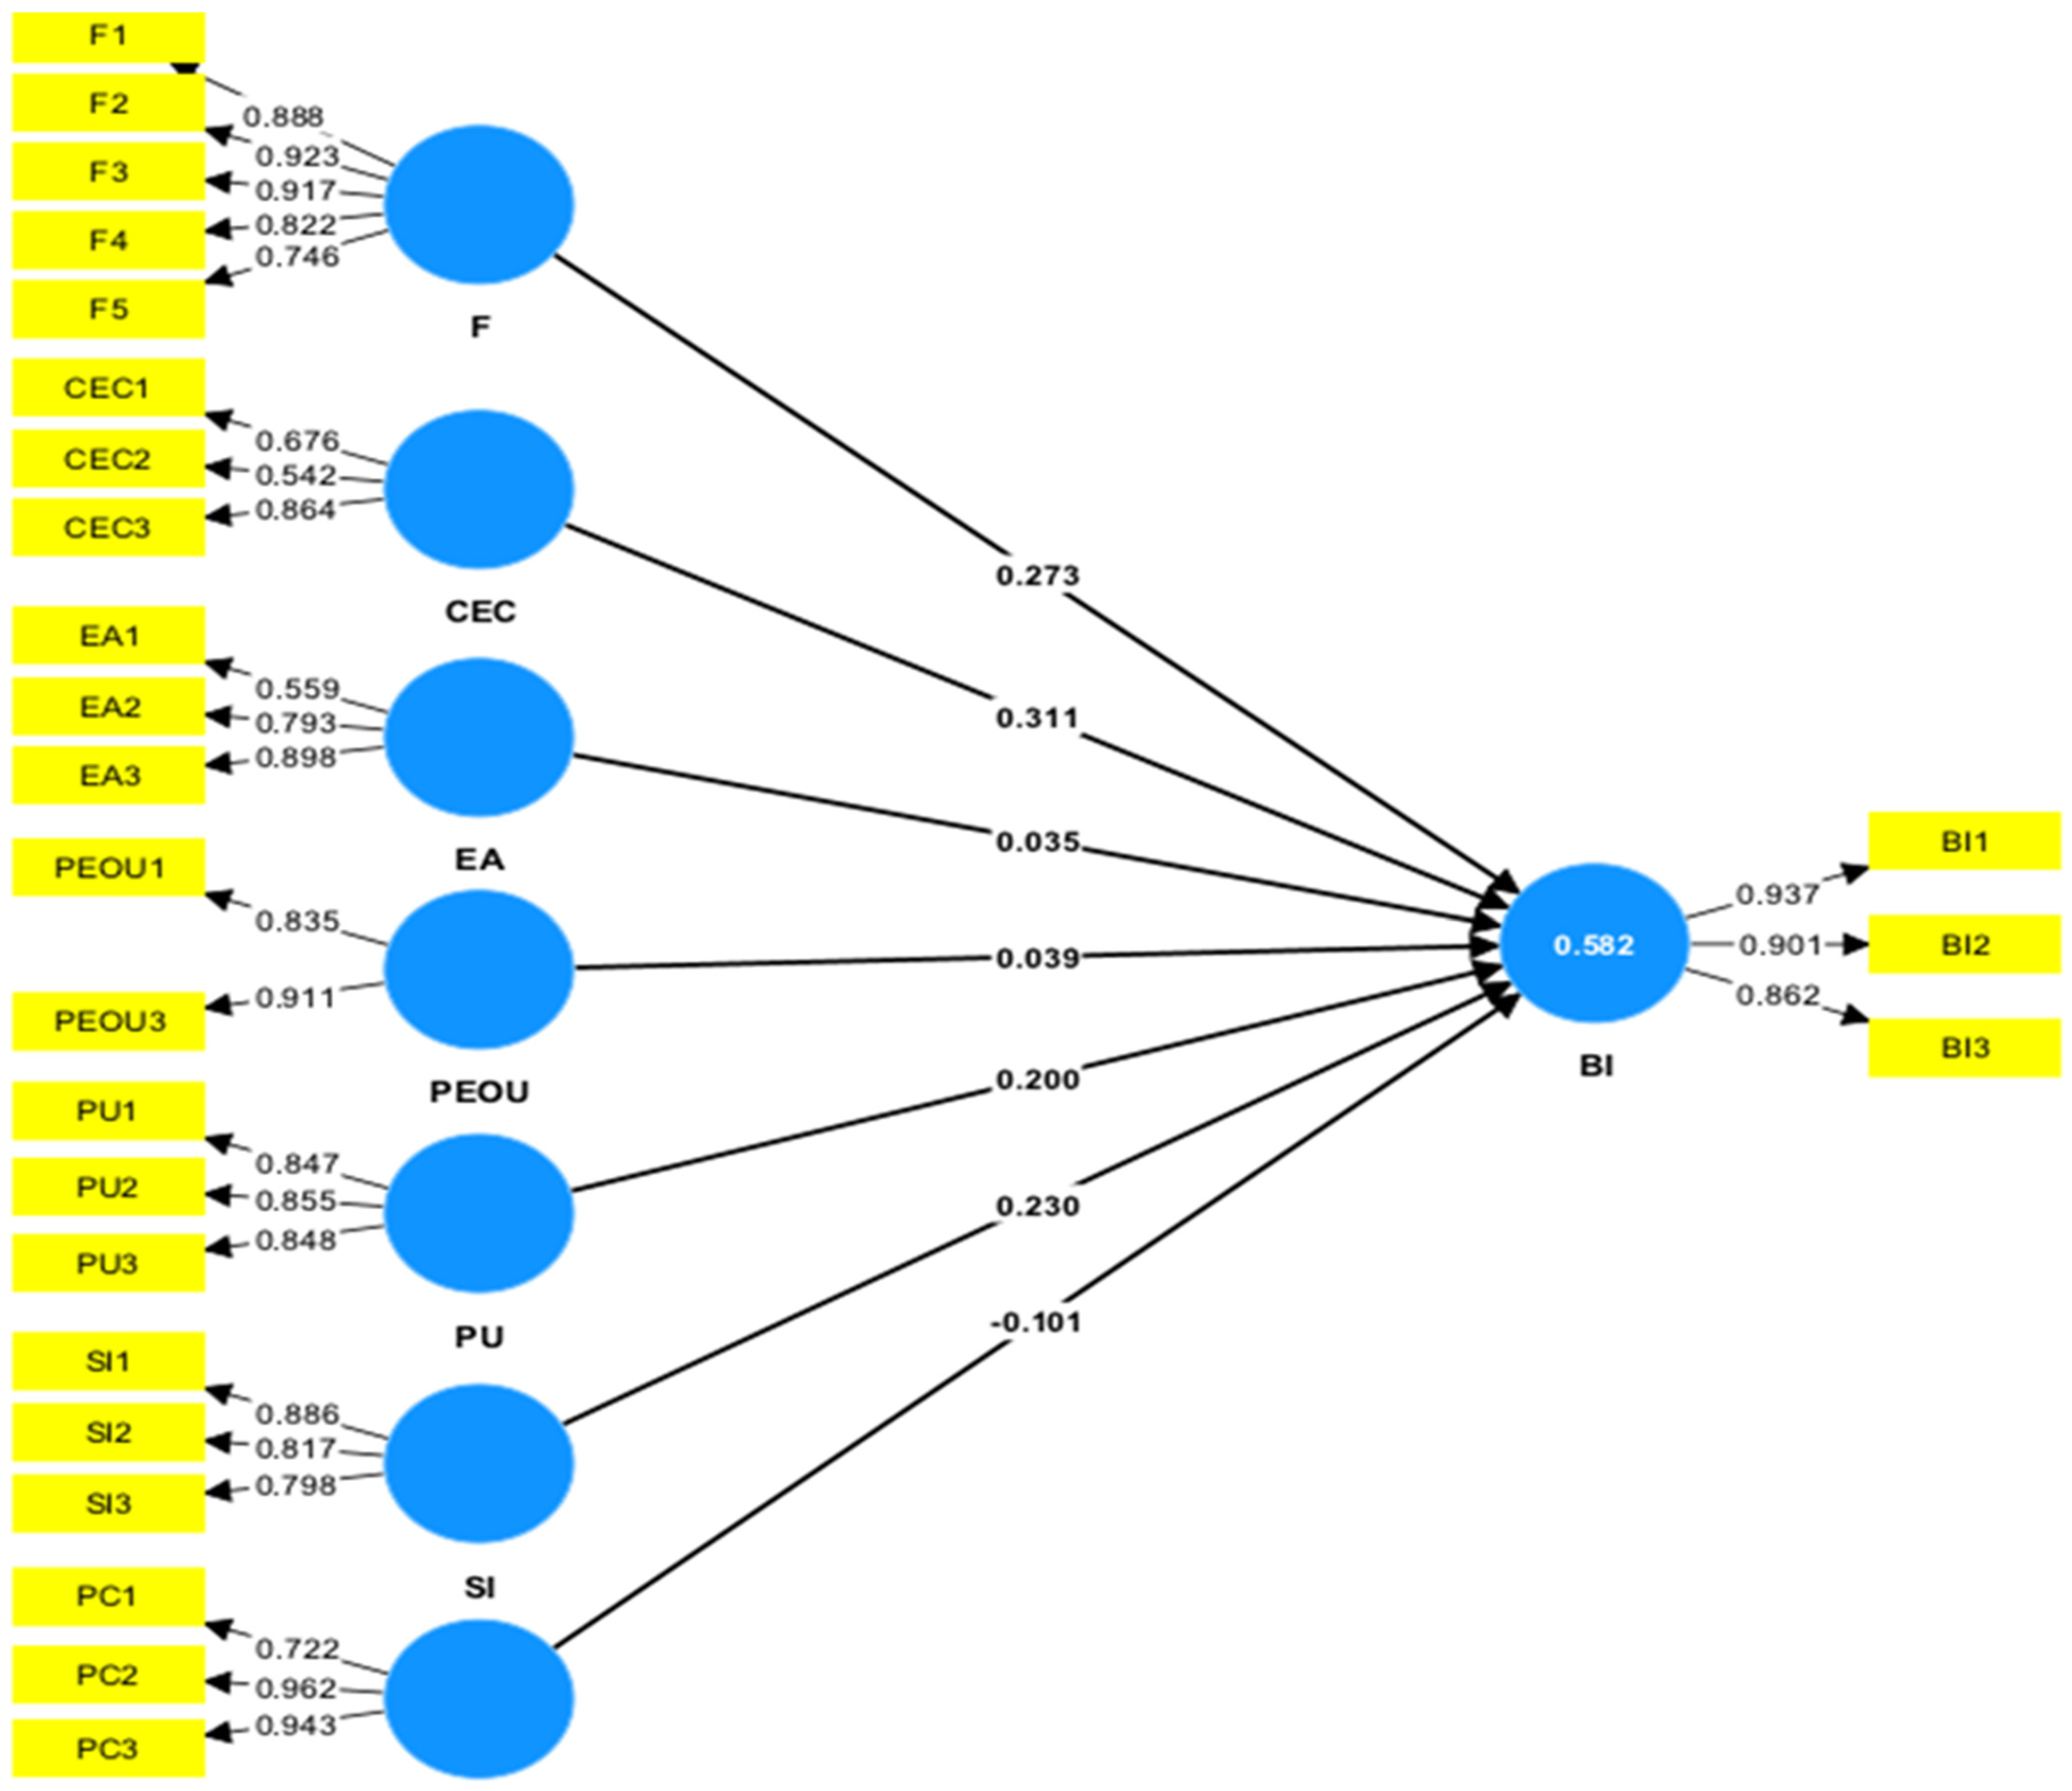
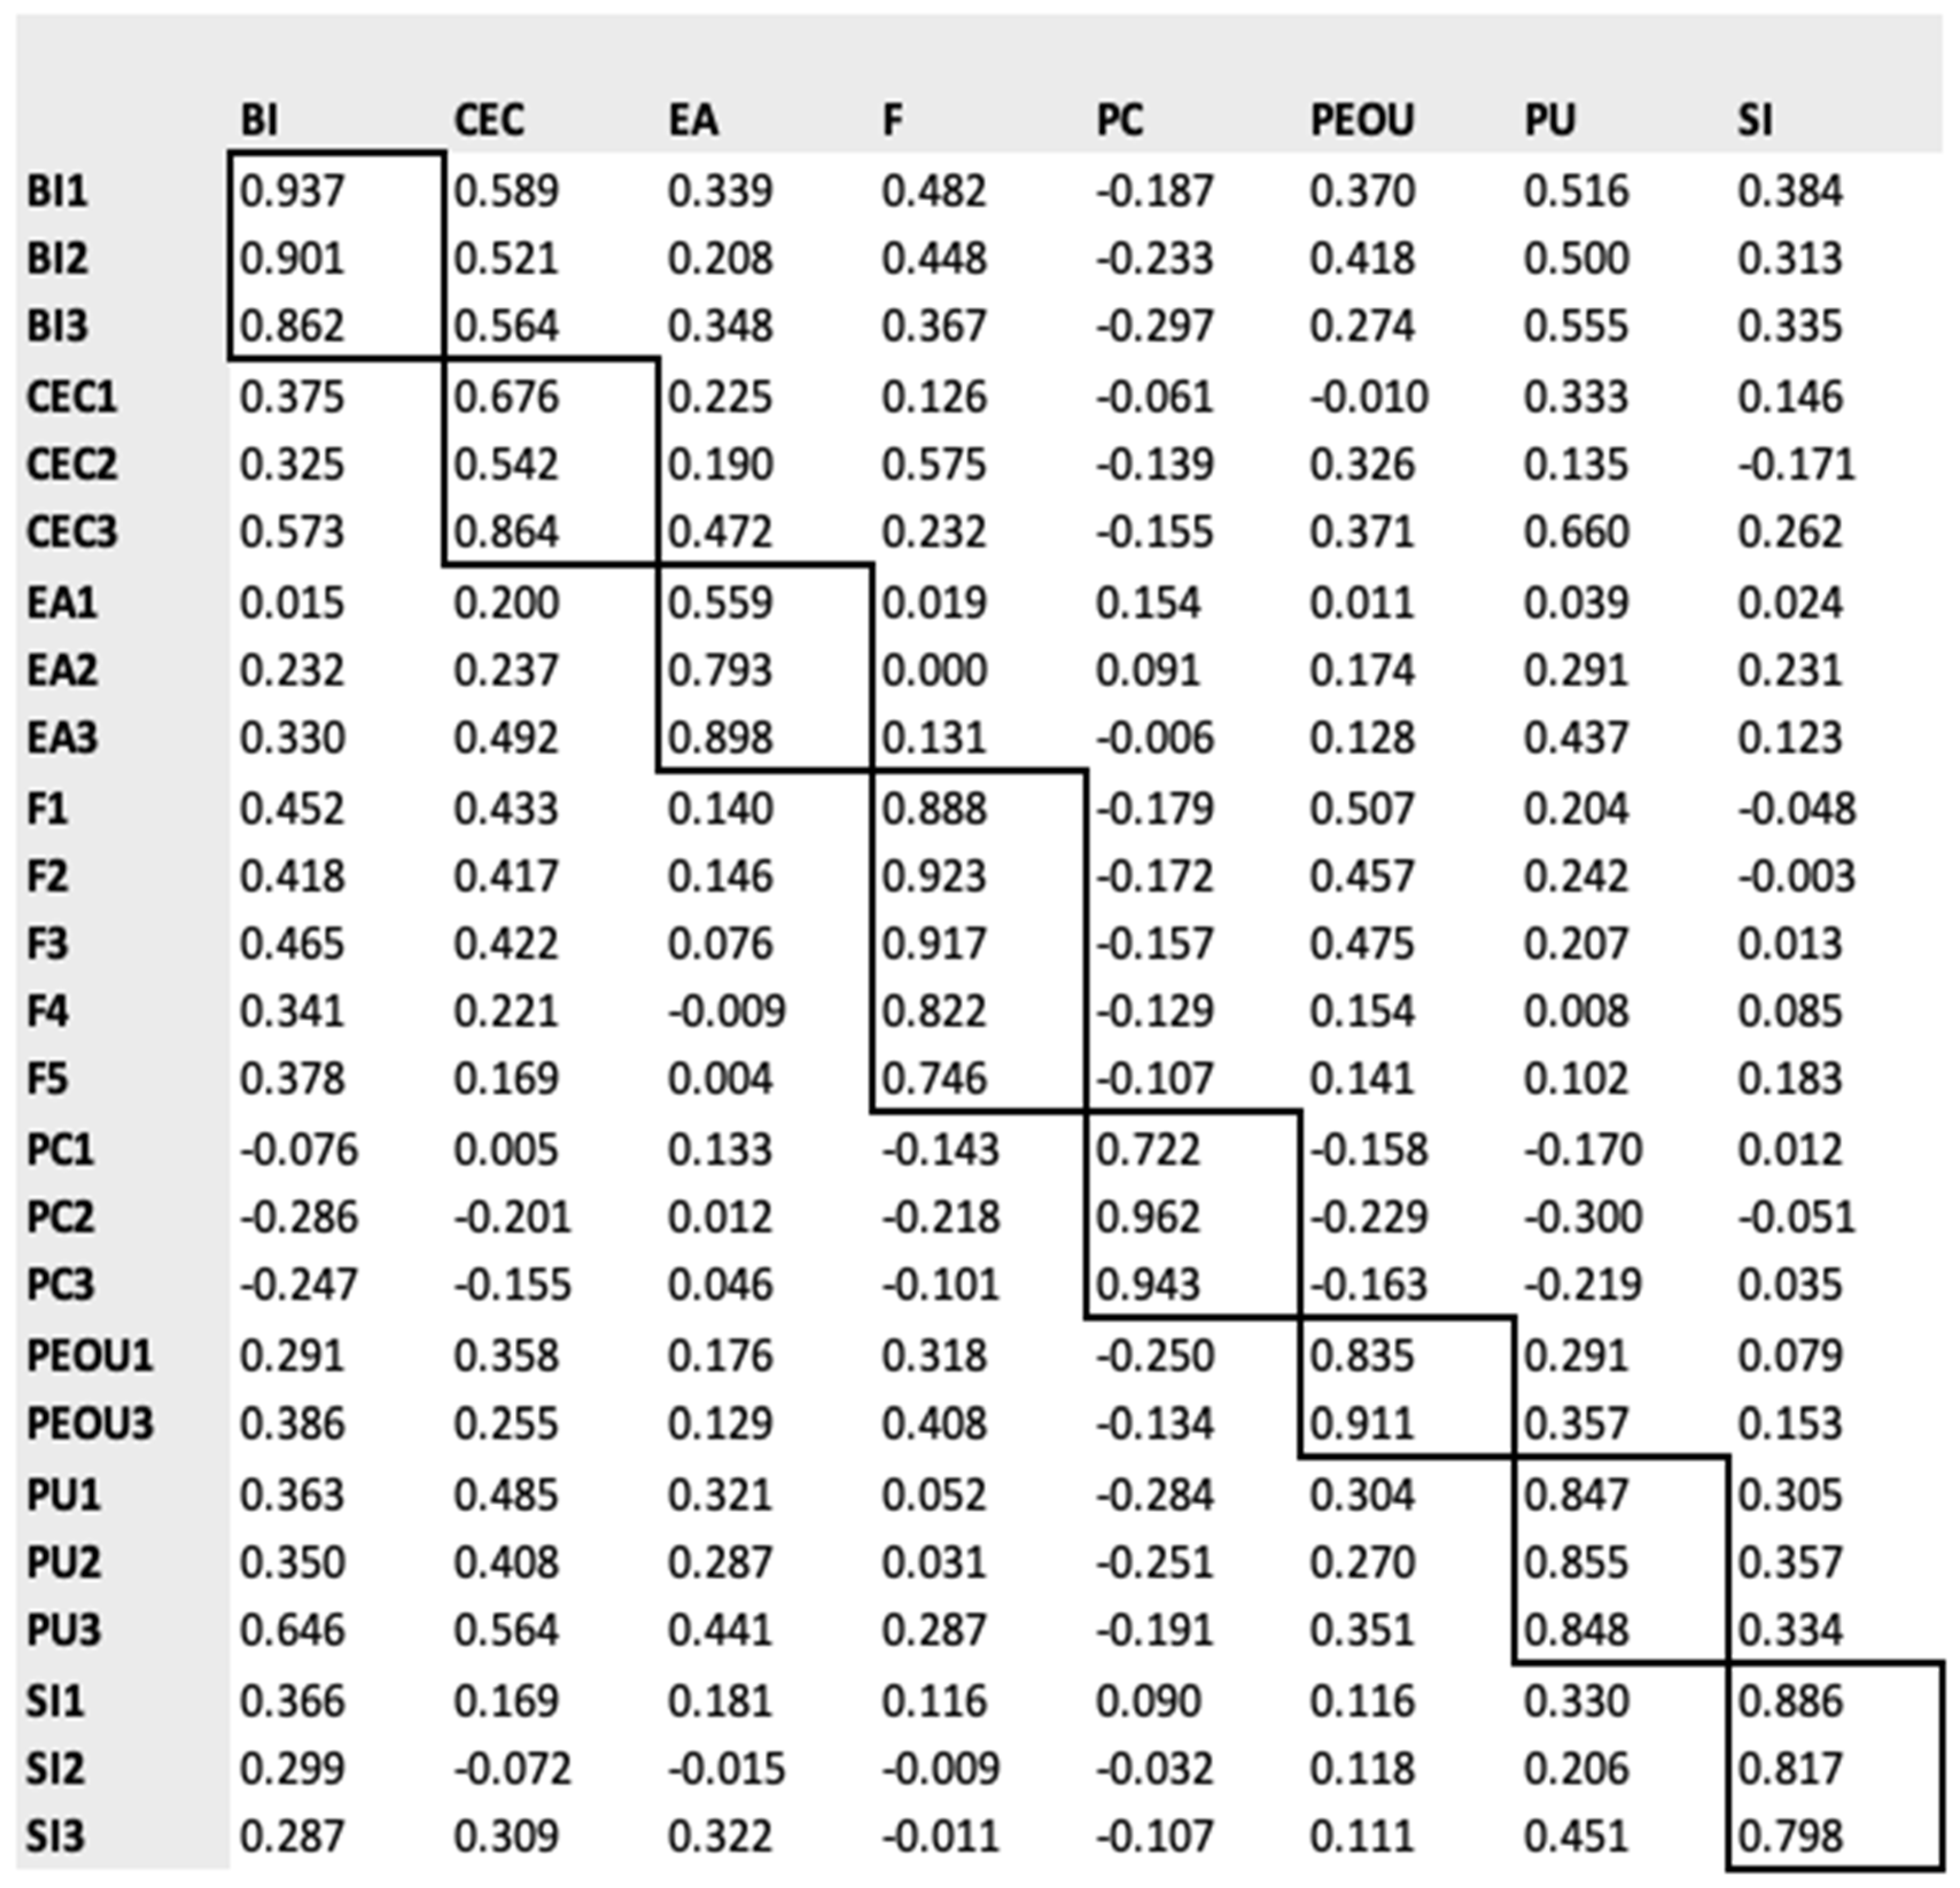
5.1.2. Model Assessment

SPSS and SmartPLS 4 were used to conduct the necessary tests to assess the model. The assessment consisted of two stages: first, conducting the assessment of the measurement model, which involved evaluating the reliability and validity. Second, an assessment of the structural model [68]. The assessment of the structural model involved testing the hypotheses.
As previously mentioned, PLS-SEM is an excellent choice for small sample sizes as it does not require the data to be normally distributed, which is often the case in survey data [67,68]. The dataset used in SmartPLS for this study had a sample size of 105 respondents. This fulfills the “10-fold rule” followed for sample size determination using the PLS-SEM technique [78]. The rule states that the minimum sample size for PLS-SEM should be at least ten times the independent variables in the model, which in this study involved seven independent variables [78]. Even so, several researchers suggest that more representation will lead to more acceptable results. It is, therefore, important to note that a larger sample size can increase the performance of SEM [78].

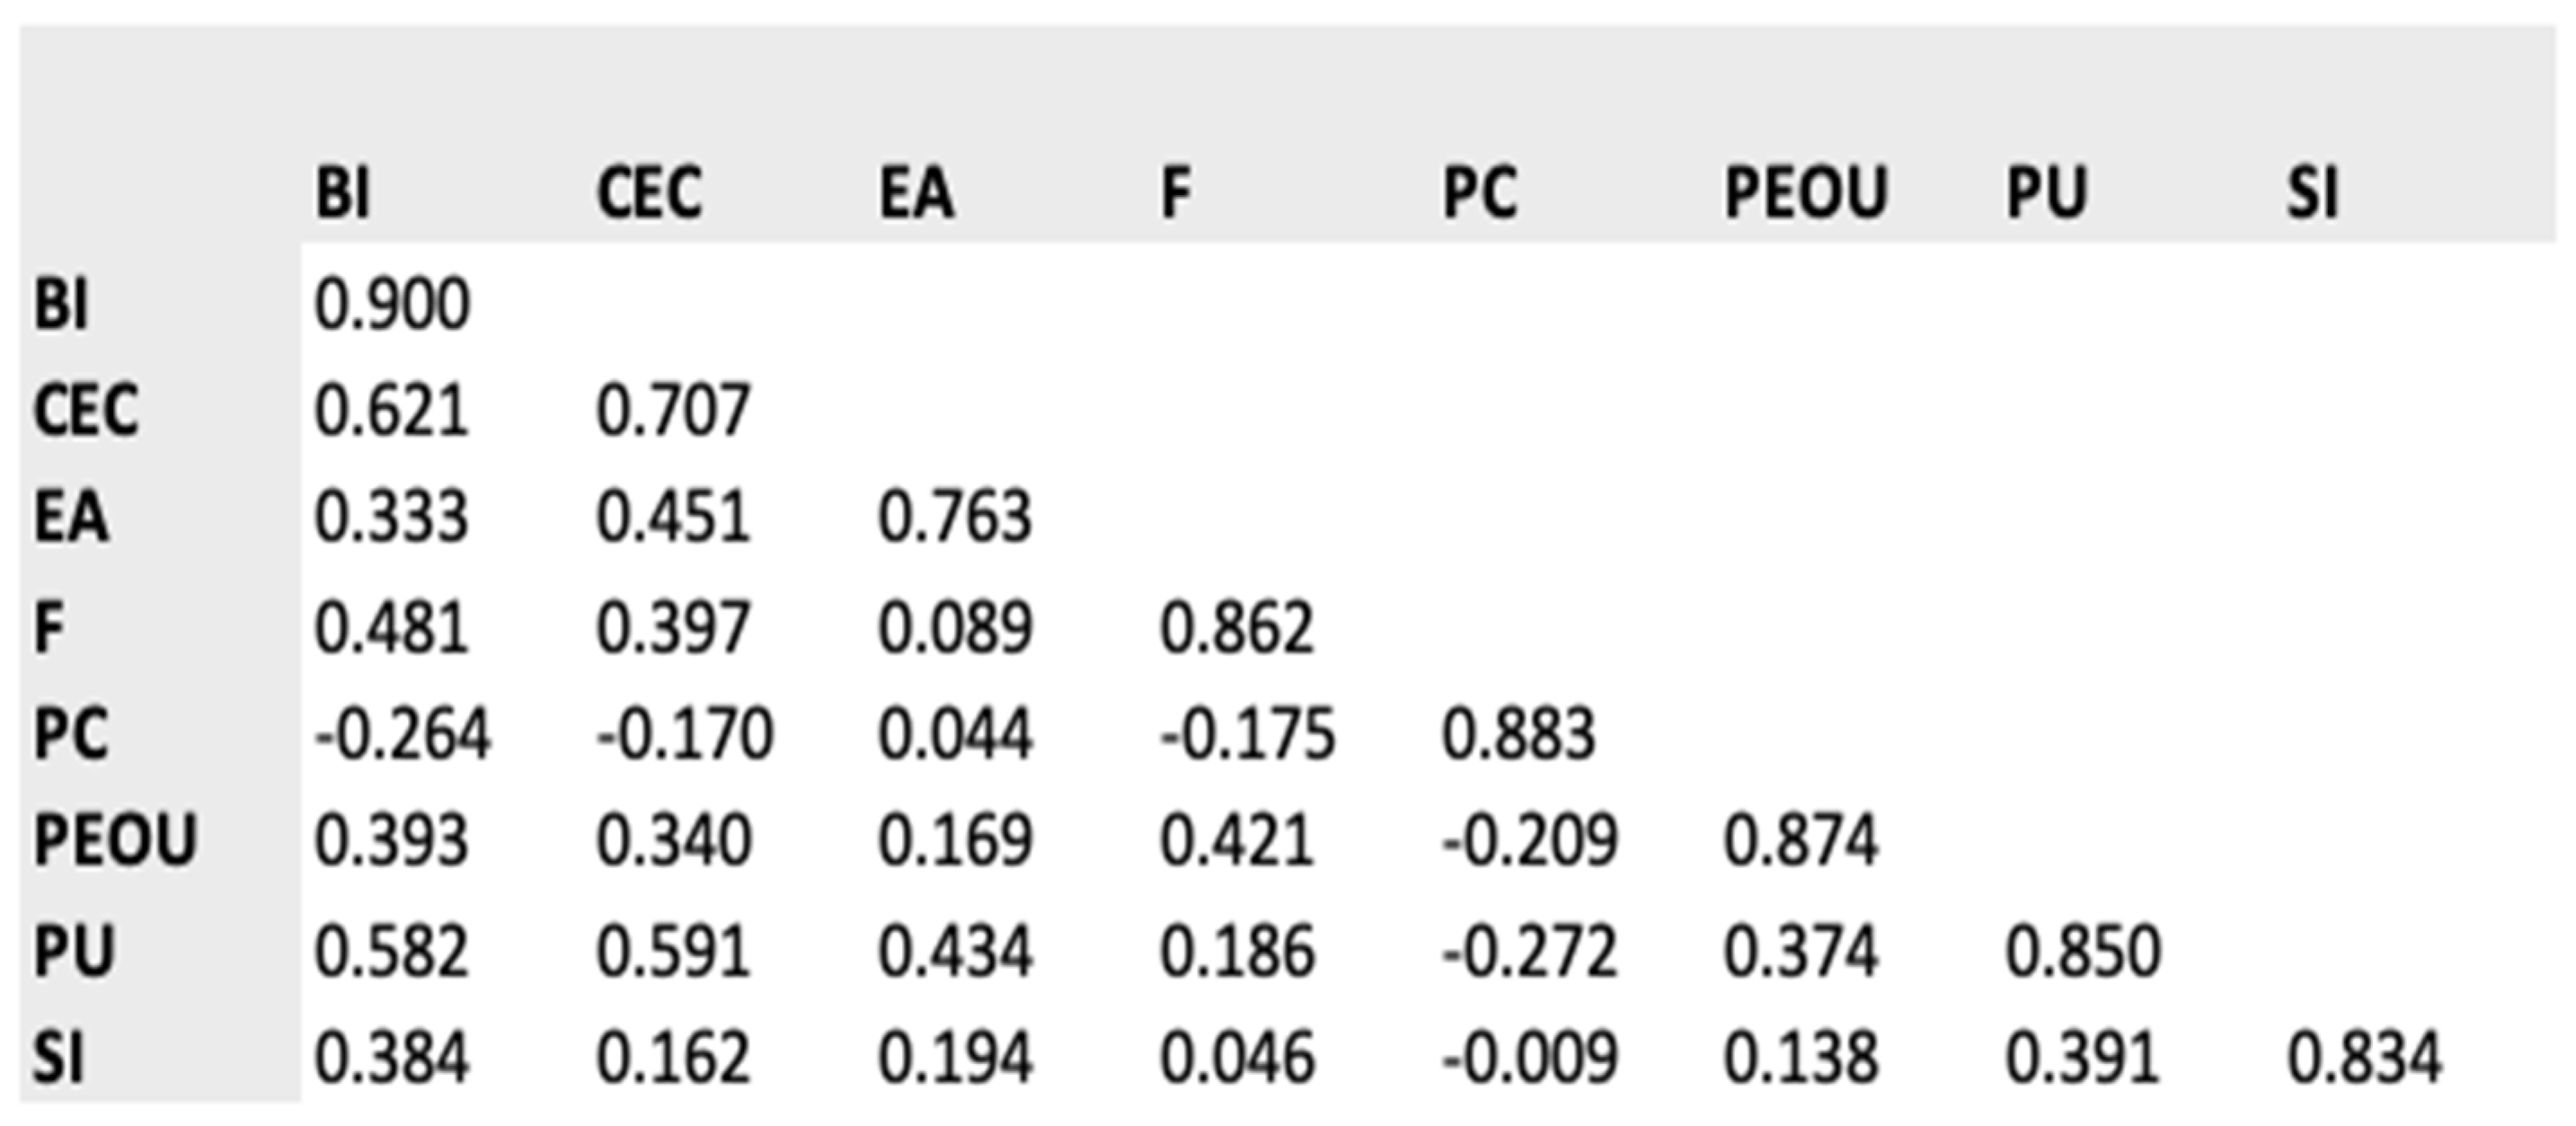
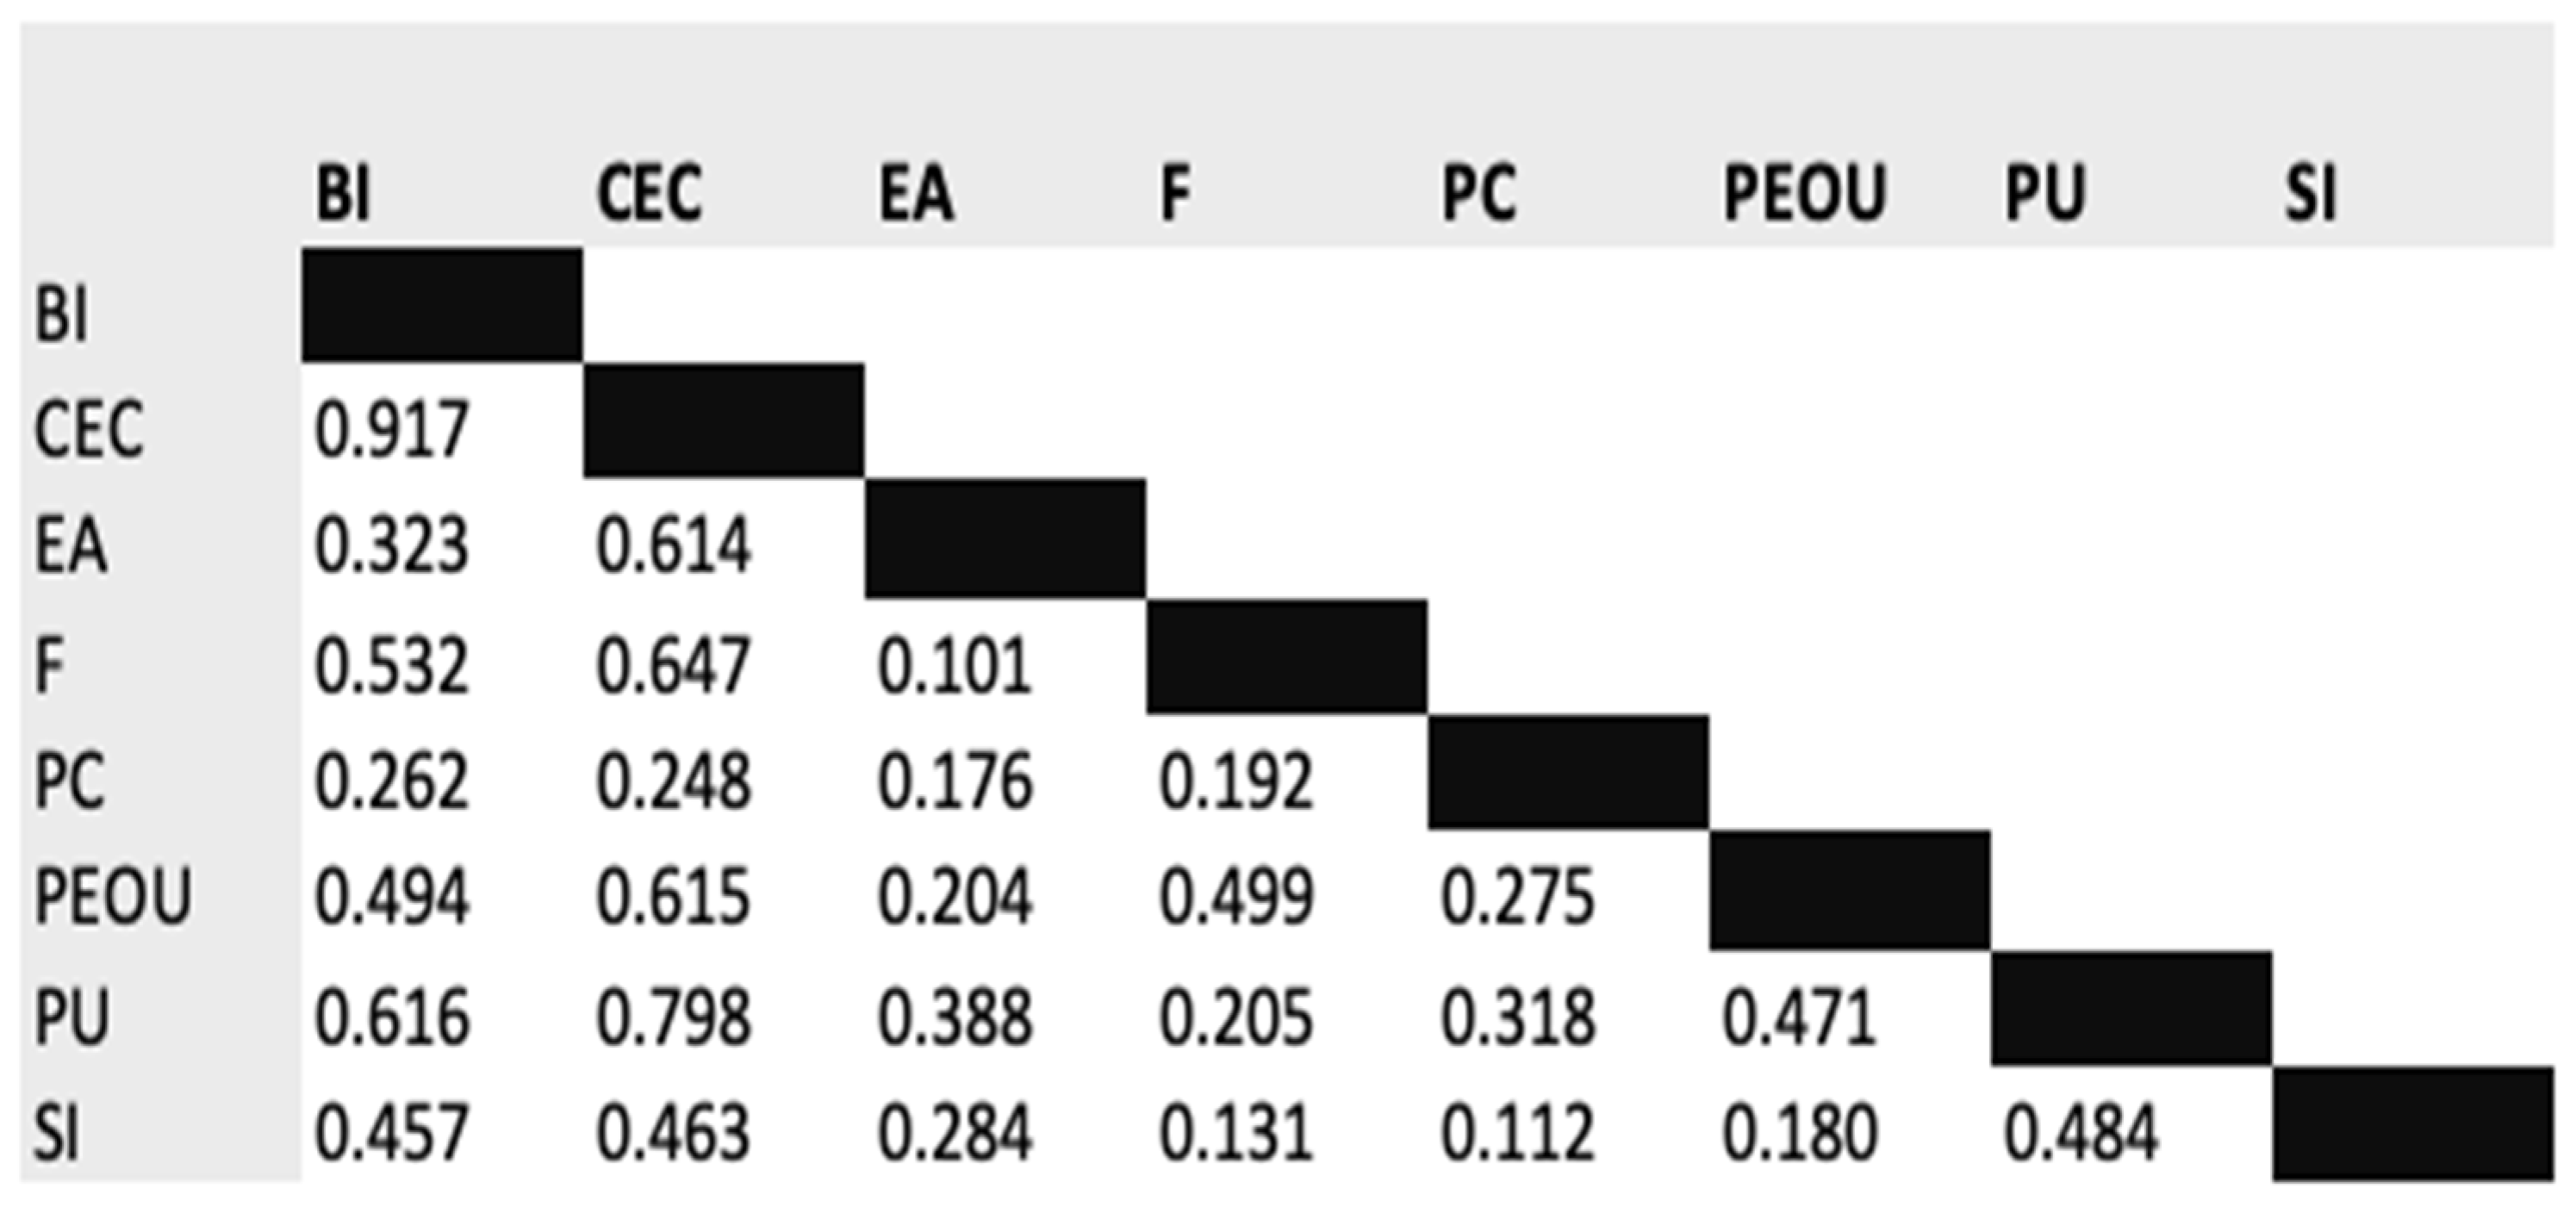
Assessment of Measurement Model

The analysis begins with an assessment of the measurement model. The data from the study was saved and uploaded to SmartPLS. The path diagram illustrated in Figure 3 was constructed by marking each question and dragging it onto the canvas to create the respective constructions. Additionally, the constructs were placed to adapt to the research model. F, CEC, EA, PEOU, PU, SI, and PC as independent variables were coupled with Behavioral Intention as the dependent variable in the model. The PLS-SEM algorithm run in SmartPLS 4 showed the model’s inner and outer loadings. The inner loadings represent the path coefficient, which shows the weight of impact each construct had on BI. The outer loadings represented the item loadings [68].
Further in the process, the model’s validity, reliability, internal consistency, convergent validity, and discriminant validity were checked [68]. According to Hair Jr, Hult [68], indicator reliability measures how accurately the items measure the latent construct. This can be assessed by factor loadings for each element [79]. For the elements to be considered good, the latent construct should be at least 0.5 but preferably above 0.7 [68,80]. Field [81] suggests that a factor is reliable if it has 0.4 or more loadings of at least 0.6, regardless of the sample size. During the assessment of the measurement model, we observed that the factor loading for CEC2 was 0.542, which falls below the commonly recommended threshold of 0.7 (as illustrated in Figure 3 and Table 6). However, as this value exceeds 0.5 and given CEC2’s theoretical importance to the Cost and Electricity-Saving Concerns construct, reflecting consumers’ awareness of energy-saving methods, we opted to retain it. Removing CEC2 did not significantly enhance model fit or construct reliability. Thus, retaining CEC2 preserved the construct’s content validity without compromising psychometric properties. Additionally, PEOU2 was initially included but removed due to its low factor loading of 0.45, below the acceptable threshold. These adjustments ensured a more reliable measurement model while maintaining theoretical coherence.
To further assess the measurement model, the internal consistency was tested with Composite Reliability (CR), rho_A, and Cronbach’s Alpha. According to Hair, Risher [82], CR entails how well the items measured the latent construct they were meant to measure through values between 0 and 1 [68]. Values between 0.6 and 0.7 are considered acceptable, values between 0.7 and 0.9 range from satisfactory to good, while values of 0.95 or higher are seen as problematic [68,82]. Table 6 shows acceptable, satisfactory, and good CR values. Other measures for assessing internal consistency are the rho_A or Cronbach’s alpha [65]. Cronbach’s Alpha is suggested to be too conservative; therefore, the rho_A measure is seen to be a more acceptable measure for internal consistency [68]. The satisfactory value for Cronbach’s Alpha and rho_A is above 0.7 [68,83]. As seen in Table 6, the rho_A shows acceptable values across the items, except for the CEC construct, with a value of 0.566. Items with acceptable values are considered positively related. Further, the convergent validity is addressed for each construct measure. This measure is the extent to which the construct converges to explain the variance of its items [65,82]. The metric used is the AVE for all items on each of the constructs. The items should be 0.5 or higher to be accepted. As seen in Table 6, seven of the items were above 0.5. This implies that at least 50% of the item’s variance was explained by the constructs [68]. CEC had an AVE value of 0.499. Table 6 below provides an overview of the findings mentioned above.
The last stage in evaluating the measurement model is to assess the discriminant validity. This measures the extent to which a construct is empirically distinct from other constructs in the structural model [68,82]. The discriminant validity can be measured through Cross Loadings (Figure 4), Fornell-Larcker (Figure 5), and Heterotrait-Monotrait Ratio (HTMT) as illustrated in Figure 6.
An evaluation of Fornell–Larcker was also performed to determine if the constructs and their items shared the highest variance (Figure 5) [68]. HTMT is the average of the item correlations for the constructs, and high HTMT values can give indications of problematic discriminant validity [68,82]. According to Hair Jr, Hult [68], the HTMT has been claimed to be a better measure in terms of discriminant validity. Our findings show that the HTMT values were below the threshold of 0.85, except CEC with 0.917, which indicated that the findings were satisfactory and, therefore, had discriminant validity (Figure 6). Thus, the findings of the analysis indicate that the questions were able to measure the latent constructs that they were intended to measure [68].

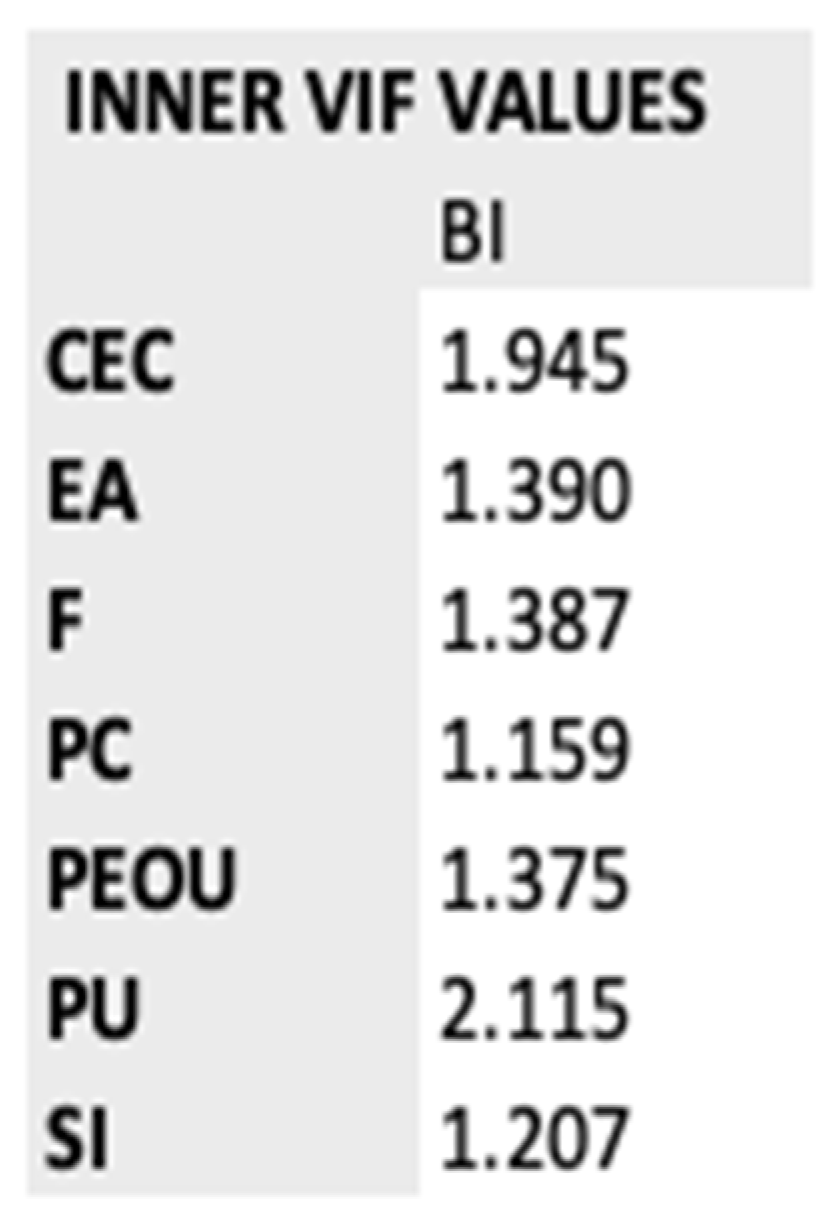
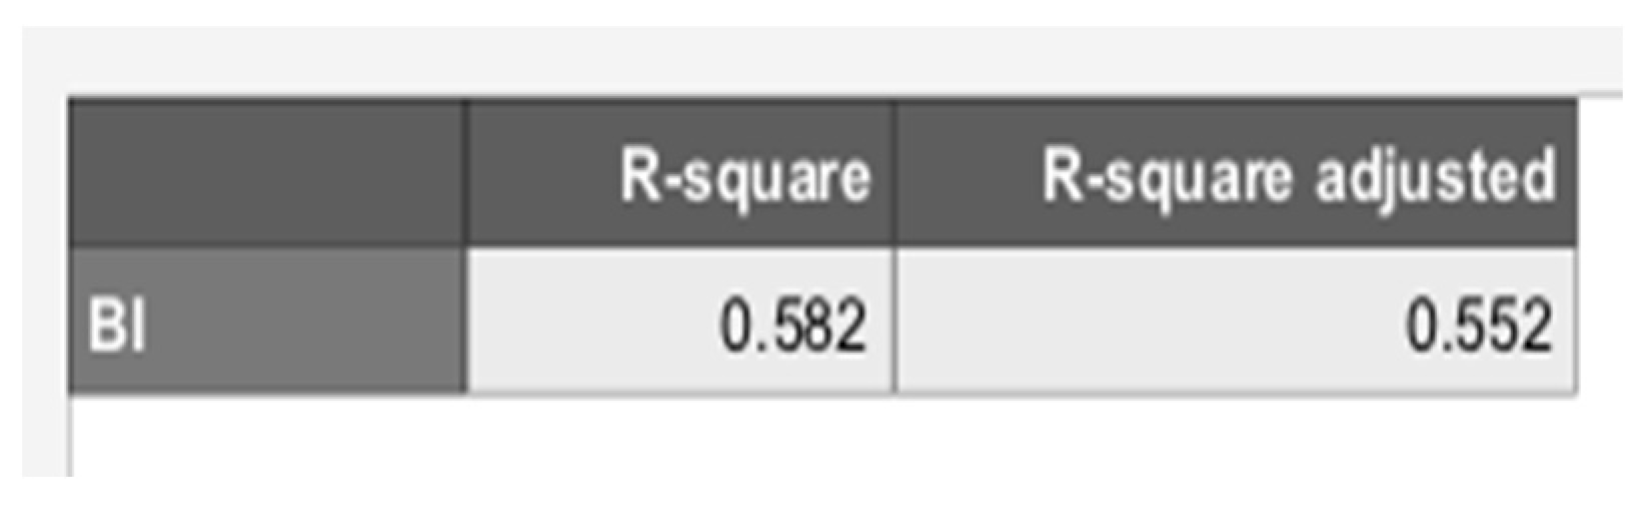
Assessment of Structural Model

With the measurement model assessment being determined to be satisfactory, the next step is to assess the structural model. The model will be assessed by calculating collinearity issues, the significance and relationships, and predictive and explanatory power in SmartPLS [68,82,83]. First, the collinearity was examined to make sure it does not bias further assessment of the structural model. This was performed by analyzing the Variance Inflation Factor (VIF) values that were calculated in SmartPLS through a PLS-SEM. Values above five can indicate collinearity; this means that the construct correlates with other variables [68]. Values of 3.3 or lower are acceptable [84,85]. The findings illustrated in Figure 7 show that inner VIF values were acceptable and, therefore, showed no strong signs of collinearity.
With collinearity not being an issue, the next step is to examine some standard assessment criteria using PLS-SEM calculation. The quality criteria to consider include coefficient determination (r2), predictive relevance of the path model, also known as cross-validated redundancy (q2), and effect size (f2) [68,82]. r2 is referred to as an in-sample predictive power and measures the variance, which is explained in each of the endogenous constructs, in this case, BI. It is, therefore, a measure of the model’s explanatory power [65,82]. The measure ranges from 0 to 1. Higher r2 values indicate a greater explanatory power, and values of 0.75, 0.50, and 0.25 can be considered substantial, weak, and moderate [82]. Findings from PLS-SEM calculation resulted in an r2 of 0.582 and an r2 adjusted of 0.552, which is considered a moderate explanatory power (Figure 8). The measurement model for cross-loadings and HTMT for all constructs, except CEC and BI, did not exceed the prescribed threshold of 0.85 [84]. Since the results show that all VIF values in our model are below the recommended threshold of 3.3 [84,85], no major issues of collinearity were observed among the constructs. One of the potential reasons for the high HTMT for the CEC construct could include a conceptual overlap with other constructs, such as perceived usefulness, familiarity, or environmental awareness. The constructs might not have been distinctly operationalized, resulting in measurement items that capture similar underlying perceptions or attitudes. Additionally, external factors like recent energy price volatility and heightened media coverage about energy savings in Norway could have amplified respondents’ sensitivity to cost concerns, thereby inflating correlations between these constructs. This suggests a need for clearer differentiation between constructs in future measurements, possibly through refining or adding survey items to capture unique aspects of each construct more effectively.
A blindfolding procedure was conducted in Smart-PLS to calculate the predictive relevance of the path model (q2). The omission distance was set to the default of 6 [79,86]. In addition, the findings from the blindfolding showed a q2 of 0.418, which was an acceptable value. According to Hair, Ringle [79], the resulting q2 values larger than zero are accepted. Further, Cohen’s f2 was measured to assess how big an effect each construct or path had on the endogenous construct [82,86]. Values higher than 0.02 are considered a small effect size, 0.15 is considered a moderate effect size, and 0.35 is a large effect size [82]. The findings, as illustrated in Table 7, showed that F, CEC, PU, SI, and PC had 0.02 or above, implying a small effect size. Additionally, the results show that EA and PEOU had below 0.02, implying no effect. Furthermore, bootstrapping was used to test the hypotheses. The concept of bootstrapping refers to evaluating the direct effects of hypothesized relationships in a research model [68]. Bootstrapping is a non-parametric method that involves performing a large number of repetitive calculations to empirically estimate the shape of a statistic’s sampling distribution [87]. The SmartPLS bootstrapping tool was used to calculate. The significance level was set to 0.1 for a two-tailed test type. For the path coefficients to be statistically significant, the t-value should be above 1.645 [68]. The t-value and p-value signify the level of relationships [78]. The findings from p-values and t-values showed that four of the relationships had significance with a p < 0.01, while the others did not. This resulted in H1, H2, H5, and H6 being supported, as seen in the figure below. Moreover, the path coefficients are referred to as standardized beta coefficients in the structural model (labeled “Std. Beta”). The confidence interval measures the uncertainty around the effect estimate and is defined as an interval that is likely to contain the true population mean [65,88]. The interval is composed of an upper level (UL) and a lower level (LL) based on the significant size. The levels indicate that the true effect may be somewhere within this interval [88].
To prevent biased interpretations of the data analyses, Common Method Bias (CMB) was tested using SPSS. When used in Structural Equation Modeling via PLS-SEM, CMB can be described as a phenomenon resulting from the measurement method used in a study rather than from the network of causes and effects linking the latent variables within the study [89]. Harman’s single-factor test was conducted to determine if there was CMB in the data. SPSS was used to perform dimension reduction, and the single factor that was extracted from the analysis was 27.125% (Table 8). Based on these measurements, it was concluded that there was no sign of common method bias, as this result was considerably lower than 50 [89].
The results of the model fit and error assessments indicate that the structural model demonstrates moderate explanatory and predictive power. The coefficient of determination r2 for BI was 0.582, explaining 58.2% of the variance, with an adjusted r value of 0.552, accounting for model complexity. The model’s predictive relevance was confirmed by a q2 value of 0.418, derived through the blindfolding procedure. Effect size analysis revealed that F, CEC, PU, SI, and PC had small but meaningful effects (f2 > 0.02), whereas EA and PEOU had negligible contributions (f2 < 0.02). Discriminant validity was largely supported, as the HTMT values were below the threshold of 0.85 for all constructs except CEC, which slightly exceeded this limit. As mentioned, the model’s measurement error was assessed using AVE, with values ranging from 0.499 CEC to 0.81 BI. Constructs with AVE below 0.5, such as CEC, indicate potential measurement issues where more variance is attributed to error than to the construct itself. VIF for all constructs was below 3, demonstrating the absence of multicollinearity.

5.2. Qualitative Findings

The following section presents an analysis of the qualitative data collected from the interviews. Based on the literature, some key areas were emphasized throughout the interviews: “Familiarity,” Cost and Electricity-Saving Concerns,” “Environmental Awareness,” “Perceived Ease of Use,” “Perceived Usefulness,” “Social Influence,” and “Privacy Concerns.” The interview objects are referred to as “COMP1”, “COMP2”, and “COMP3”. In the following section, findings and insights from the interviews are presented by the key themes that were identified.

5.2.1. Familiarity

All households in Norway have a Smart Meter Technology installed at their home, following the law regulation from 2019 [16]. It is interesting to review the companies’ perception of the Familiarity aspect among their consumers. The interviewees had different views regarding their consumers’ knowledge and familiarity with SMT. In general, COMP1 believed that their customers were aware of the smart meter system installed in their homes. The interview object emphasizes that whether people are aware of how to use and utilize the system is another matter. COMP2 expressed that very few users think about technology in their everyday lives. Regarding familiarity and awareness about the HAN port and additional equipment necessary to fully utilize the SMT, both COMP1 and COMP2 emphasize the need for more information. The network company, COMP3, is the one who works with the actual rollout of smart meters and the potential opening of the HAN port. According to the numbers from their customer group, 6% have opened the HAN port. Further, the company has no insight into whether the percentage of those who have opened the portal utilizes the technology through additional equipment. When asked whether the network company thought their customers were aware of having an SMT installed in their home, COMP3 answered: “Yes, I think so. I think they are familiar with it, but I do not think everyone is familiar with how to use the data that comes out.” This is an interesting finding to further discuss. All the informants agree that the underlying responsibility for getting information out, and thereby possibly increasing familiarity, is the network companies. COMP3 emphasizes that they are responsible, but they are not focusing on pushing out information or offering guidance and training. COMP1 believes there is an increased degree of awareness related to electricity consumption and that it has escalated in the last year due to the high prices. The interviewees, therefore, believed that this could lead to increased familiarity with the SMT.

5.2.2. Cost and Electricity-Saving Concerns

Regarding the aspect of Cost and Electricity-Saving Concerns, COMP1 emphasized an increased awareness linked to electricity consumption due to increased electricity costs. Accordingly, their customers seem to be more interested in knowing what they can do to save money on their electricity. We asked if the high electricity bills have influenced COMP1 customers to be more aware of their electricity consumption. The interview participant stated: “Yes, absolutely, I think that if you look at it a bit far into the future, the year we have been through now is sustainable in the long term.” COMP2 highlights SMT as a solution for Norwegian customers to potentially reduce electricity consumption, as you shed light on your consumption through using the technology. Accordingly, it is easier to obtain information about when it is very expensive to use electricity and when it is more appropriate. According to COMP3, more consumers are using smart meters because of the high electricity costs. When asked about the main reasons that motivate consumers to use and utilize the system, COMP3 responded, “The high electricity costs.”
The informants were asked what they perceived to be the most challenging and biggest barriers to the utilization of SMT. COMP3 answered the cost of buying extra equipment: “The cost in itself is a barrier. The cost of buying and adding extra equipment to utilize the SMT, in sum, can be so expensive that it is not certain that the customer will profit from it in the long run”. COMP3 says that the prices should potentially be lower to increase the spread of utilization.

5.2.3. Environmental Awareness

COMP2 agrees that the general increase in Environmental Awareness has affected their customers. Their customers seem to be more aware of their electricity consumption, which in turn can lead to a change in behavior. COMP3 supports this finding but emphasizes that it is difficult to find out how much the environmental concern concretely affects the consumers and their potential utilization or change in behavior. COMP3 explains the demand response as a lead to a change in customer behavior and calls it the environmental effect; “If you are using less energy, then, in turn, it will be better for the environment”.

5.2.4. Perceived Ease of Use

COMP2 mentioned that SMT may be confusing for customers when talking about the Perceived Ease of Use. When asked what could be perceived as the biggest barriers or most challenges with SMT, COMP2 stated: “So I think it is that they do not have anything concrete to deal with. That there is no step by step, because if you google all this, you can end up with 15 different answers”. The acceptance is there already, as the 2019 regulation decided that all households shall have a smart meter installed [16]. To increase the spread of the utilization, COMP2 mentioned the importance of making people aware of how to use it. COMP2 states that for many people, it is a comprehensive topic. This is also supported by COMP1, which mentioned that there are a lot of misunderstandings out there regarding SMT. All the informants emphasized that one of the misunderstandings was where consumers could get information and help.
COMP1 pointed out that there is an increased interest in that type of technology. Further, we asked the electricity company about their perception of their customers’ use and utilization of SMT through adding extra equipment, and if it is too advanced in terms of technology. COMP2 pointed out: “Yes, I would assume, it is a threshold to get into, and a lot to get used to. Until now, electricity has been of such low interest because we have been so spoiled that it is so cheap that you have not bothered to care, but now it is significant, and you can save a lot on it”.

5.2.5. Perceived Usefulness

When asked about their perception of the Usefulness of SMT, all interviewees emphasized the amount of usefulness for the customers. All interviewees expressed an increased awareness of their electricity consumption by utilizing SMT. The users need more information about how to use it. According to COMP2, there is a lot of equipment to connect to perceive the usefulness. COMP1 also highlights the need for more information to increase the perceived usefulness of the technology for the users. COMP3 pointed out the need for users to understand the usefulness. We asked what the company thought was necessary to increase the spread of SMT utilization in Norway. “As a network company, we are very interested in that happening, but we think that it should happen because the customer benefits from it. On our side, we try to get the customer to see its usefulness because you can monitor consumption” (COMP3).

5.2.6. Social Influence

COMP3 had a survey about the effect of Social Influence on consumption in 2022, where they reviewed the media and its effect on consumption. They found no systematic correlation. “We had a survey about this last year, where we tried to find out about media coverage and how much it can affect consumption, but we could not find any systematic connection. But it was a hint that something is happening when there is a lot about it in the media”.
The company has not put any significant emphasis on the commercial and marketing of the technology and says, “This is the task of electricity companies and not the network companies”. When asking COMP1, the interview object found there to be a lack of communication in different media with the public from the network companies. COMP2 has not reviewed the influence of peers, family, and friends on the utilization of SMT.

5.2.7. Privacy Concerns

When asking COMP3 about their perception of consumer Privacy Concerns regarding the technology, the informant responded, “Yes, there may be detailed information about consumption. The HAN-port sends out data every 10 s”. In addition, COMP1 emphasized that there are a lot of misunderstandings out there connected to privacy concerns connected to monitoring, how it sends signals out of the house, and radiation hazards. COMP3 emphasizes that despite the system sending out data, it will be handled safely, following “if someone gets hold of the information they should not have, they can probably use it to find out when you turned on the oven, etc.”.

6. Discussion

As previously mentioned, although all households in Norway have Smart Meter Technology installed, only 53 out of 105 respondents were aware of having a smart meter at home, while 38 were unaware, and 14 were uncertain (Table 5). This study aims to explore the utilization of IoT-based SMT in Norway. The discussion focuses on answering the research question: “Which factors affect consumers’ utilization of smart meter technology in Norway?” The research model used in this study extends Davis’s [18] TAM by incorporating additional factors such as Familiarity, Cost and Electricity Savings, Environmental Awareness, Social Influence, and Privacy Concerns, as suggested by the literature. The following section will present and discuss these seven constructs in detail.
The quantitative findings showed that Familiarity, Cost, and Electricity savings had the strongest effect on Behavioral Intention toward utilizing SMT, followed by Social Influence and Perceived Usefulness. As presented in Table 7, the H2, H3, H4, and H6 were significantly different from 0, thus affecting BI, and are therefore considered supported. On the other hand, the H1, H5, and H7 were not supported. The subsequent sections synthesize insights from both the quantitative results and qualitative analysis.

6.1. Familiarity

The literature consistently highlights the positive impact of Familiarity on the adoption of SMT, corroborated by quantitative findings showing a significant effect of Familiarity on BI [8,20,41,43,47]. This study found that Familiarity, along with Cost and Electricity-saving Concerns, have the strongest effect on BI, aligning with Bugden and Stedman’s [43] findings. SMTs are equipped with a HAN port that must be activated to fully utilize the technology. Accessing this port allows users and service electricians to extract their electricity and diagnostic data using additional equipment [90]. Our study reviewed general familiarity with the HAN-port and extra equipment, revealing that 31 out of 105 respondents utilized SMT through additional equipment, while 66 did not, and eight were uncertain (Table 5). This may help explain COMP3’s report that only 6% of their users have opened the HAN portal. Additional insights were gained by examining the perspectives of companies working with SMT. Interviewees from COMP1 and COMP2 emphasized the need for more information to increase user familiarity with the system, its benefits, and the process of utilizing additional equipment. COMP1 and COMP3 both noted the distinction between familiarity with the system and its actual use. Gupta, Mauzerall [47] and Alkawsi, Ali [8] found that increased experience with SMT and related technologies enhances consumers’ intention to adopt and use the technology. Our findings suggest that most respondents disagreed with having received adequate guidance and information about SMT’s use and benefits. Informants agreed that network companies bear the primary responsibility for providing this information and guidance. COMP3 acknowledged that their company does not actively push out information or offer guidance on smart meters, which may explain the varying levels of familiarity across the country.
Despite the widespread installation of SMT in Norway, only 50.5% of respondents were aware of its presence in their homes. Thus, familiarity with SMT is a crucial driving factor for its utilization, as supported by both primary and secondary findings. Increasing user familiarity through targeted information and guidance is essential for enhancing the adoption and effective use of SMT.

6.2. Cost and Electricity-Saving Concerns

The literature consistently highlights the positive impact of Cost and Electricity-Saving Concerns on the adoption of SMT (e.g., [12,28,40,42,46]). The quantitative results from this study indicate that Cost-saving motivation was strong across all income groups due to rising electricity prices. The findings exhibit that concerns about cost and electricity savings can significantly influence behavioral intentions toward SMT. Secondary findings further suggest that CEC motivates Norwegian households to adopt and use SMT [42]. Analysis of CEC constructs relative to the income of Norwegian consumers reveals that the desire to save money on electricity consumption transcends income levels. Previous research has documented rising energy prices in many countries, particularly following the pandemic and the Russian invasion of Ukraine [55]. This trend may explain why consumers, irrespective of income, are motivated to reduce their electricity expenses. Kranz and Picot [40] support this argument, showing that high awareness of energy prices significantly impacts the intention to use smart electricity meters. On the other hand, the results show that low-income groups were less familiar with energy-saving methods and additional equipment. Our qualitative data corroborate this argument, indicating an increased consumer awareness of electricity consumption due to higher costs in recent years. However, barriers related to the cost of purchasing additional equipment for SMT must also be considered. The findings indicate that while there is a broad concern about electricity consumption due to rising prices, the high cost of additional equipment remains a significant barrier. According to COMP3, the overall expense of the necessary equipment might outweigh the cost benefits for users. Consequently, while Cost and Electricity-Saving Concerns are driving factors for SMT adoption, the associated costs of equipment pose a substantial obstacle.

6.3. Environmental Awareness

In the extant literature, concerns about EA have frequently been discussed about Behavioral Intention to SMT [14,21,28,42]. Consistent with these discussions, the informants highlighted the potential of smart electricity meters to provide consumers with a comprehensive overview of their home energy consumption, which can subsequently aid in reducing usage [21]. This observation aligns with qualitative findings from the study. For instance, COMP2 acknowledges that the general rise in environmental awareness has influenced its customers, potentially altering user behavior. Similarly, COMP3 corroborates this but notes the challenge in quantifying the direct impact of environmental considerations on user behavior and utilization patterns.
This sentiment is echoed in previous research, in which Bugden and Stedman [43] suggest that associating smart meters with climate change and renewable energy can foster more positive attitudes toward their adoption. The qualitative findings further indicate that EA is a crucial factor in generating consumer interest in smart electricity meters in Norway. The recent increase and volatility in energy prices in Norway have heightened consumers’ desire to monitor their energy consumption closely. It can be posited that the development of IoT technologies, such as smart electricity meters, will enhance consumers’ awareness of their energy usage [21]. A study by Gerpott and Paukert [42] found that environmentally conscious customers are more willing to pay for such technologies. However, the quantitative findings of this study do not demonstrate a significant relationship between EA and BI. The lack of significance observed for Environmental Awareness (H3) was unexpected, given prior studies indicating its relevance. First, this could be attributed to the population and Norway’s environmental consciousness [91]. Norway is a global frontrunner in environmental sustainability, with significant investments in technological development and innovation to drive its green transition [92]. The country has established ambitious environmental targets across all sectors, including climate mitigation, and aims to achieve climate neutrality by 2030 [92]. Given this high baseline, potential variations in environmental concern among Norwegian consumers may be minimal, reducing their impact on discriminating between adopters and non-adopters of SMT. Second, the mandatory installation of smart meters in Norway could have minimized the effect of voluntary environmental motivations, as consumers are already compelled by regulation rather than personal environmental concerns. Lastly, the specific framing of the survey questions relating to environmental awareness might not have sufficiently captured the variations of environmental motivations specific to energy consumption behaviors.

6.4. Perceived Ease of Use

Our findings suggest that PEOU did not affect intention to use, a somewhat counterintuitive finding. Gao and Bai [48] assumed that for the use and acceptance of an IoT, the potential user needs to feel that it is easy to use. This is also supported by studies directly performed on the use and acceptance of SMT (e.g., [28,40,41,44,48]). In contrast to the results of some similar studies, our findings indicate a different perspective. For example, COMP1 and COMP2 stated that SMT may be confusing for the customers, which can explain our findings. On the other hand, to increase the spread of SMT utilization in Norway, COMP2 stressed the importance of making people aware of how to use it, thereby emphasizing the importance of PEOU.

6.5. Perceived Usefulness

PU has often been discussed as a strong driver of acceptance, adoption, and utilization, in addition to a strong predictor of BI [28,41,48,49]. Alkawsi et al.‘s study [44] conducted in Malaysia found perceived usefulness to be the most influential factor. Additionally, our literature review findings showed that in a study from the United States, PU had a direct effect on support for smart meter installation and intention to adopt [12]. The interviews emphasized the amount of usefulness SMT utilization brings to the customers. According to COMP2, the customers need more information about how to use it. There is a lot of equipment to connect; therefore, more information is important to perceive the usefulness. Findings from our online survey suggested the importance of PU for behavioral intention to utilize. When asking the respondents to rate the importance of each factor, the findings showed that PU was of high importance. Consistent with the reviewed literature regarding the effect of perceived usefulness on SMT use and acceptance, the quantitative findings showed that PU had a significant effect on behavioral intention to use and utilize SMT among the respondents. As a result of this, Perceived Usefulness was perceived as a driving factor for utilizing Smart Meter Technology.

6.6. Social Influence

Consistent with some of the reviewed literature regarding the effect of SI on SMT use and acceptance, the quantitative findings showed that SI had a significant effect on BI to use and utilize SMT (e.g., [19,32,47,48]). In contrast to the qualitative findings, which did not place any significant emphasis on the effect of social influence from friends, family, social media, or mass media, according to COMP3. According to Gao and Bai [48], the social context should not be overlooked when reviewing acceptance or utilization. On the other hand, Alkawsi et al.’s [44] study from Malaysia and Oraedu et al.’s [14] study on households in Nigeria found SI to have no significant effect. Social/community influence was argued to increase the adoption of SMT when “neighbors” were supportive of the technology [47]. However, community influence could also have the opposite effect under certain conditions, as recent research [47] reported instances where misinformation within neighborhoods, such as incorrect claims that smart meters required prepaid billing rather than the standard postpaid approach, had negatively impacted acceptance levels of SMT in India.
As mentioned previously, understanding individual differences such as traits, gender, and age is essential for investigating social influence and technology adoption [19]. For example, Gao and Bai [48] found respondents between the ages of 20 and 34 to be more easily vulnerable to SI than those of other ages. This was supported by our findings. Our findings showed that respondents aged 18–25 are more likely to be influenced by social media, family, and peers to use SMT. According to our findings, people aged 18–25 and 26–35 are more likely to utilize the system themselves if people around them are using SMT. Another interesting finding was when asking the survey respondents to rate what they perceived as most important if they either plan to utilize SMT or already are utilizing it. The findings showed that SI was viewed as the least important in this rating order amongst the respondents.

6.7. Privacy Concerns

In Norway, some people refused to install SMT following the regulation due to privacy concerns [36]. In the literature, privacy concerns have often been discussed with the behavioral intention to use SMT [12,13,41,61,62]. Chen, Xu [12] found that perceived privacy had a direct effect on support for SMT intentions to use. However, as the quantitative findings revealed, privacy concerns did not have a significant effect on behavioral intention to use and utilize SMT. Despite this, COMP1 and COMP3 acknowledged the privacy aspect of the technology but emphasized that there are misunderstandings out there. Chen et al.’s [12] study shows that consumers’ perspective on privacy concerns revolves around private household activities, lifestyle, and power consumption patterns derived from SMT data. COMP3 expresses that SMT produces detailed information about individual consumption, as the HAN-port sends out data every ten seconds. Accordingly, users are concerned that the installation of SMT will lead to their data being misused against them [41,62]. The quantitative findings did not support the different findings related to the effect of privacy concerns on use from the literature review. Furthermore, it was evident that privacy concerns were, in general, measured low in comparison with other constructs. An interesting observation was the significant difference in importance between the age group “66 and older” and all other age groups. Based on the findings, it can be assumed that this group is, therefore, more likely not to use SMT because of their concern, while other age groups are not affected by this concern. This corresponds with Venkatesh and Bala [19], who emphasize the importance of individual differences.

7. Study Implications

This study provides insights and recommendations for researchers, policymakers, and service providers. By taking these implications into account and implementing them, stakeholders can enhance their understanding, strategies, and practices related to the adoption of SMT, thereby promoting its widespread acceptance and usage. The sections below discuss the research’s implications for the existing body of knowledge and practice.

7.1. Implications for Research

This research provides insights into the adoption and utilization of IoT-based smart metering technologies in the Norwegian context, offering several implications for the research community. Our study fills this gap by exploring how the mandatory installation of SMTs, driven by national policy changes, interacts with consumer perceptions. The integration of both quantitative survey data and qualitative insights from industry experts not only confirms the established significance of perceived usefulness and social influence (cf. Davis [18] and subsequent extensions [19]) but also sheds light on the less explored role of cost-related factors and environmental consciousness in shaping utilization behavior. For example, the findings suggest that understanding the socio-technical dimensions of technology adoption could be crucial. By incorporating variables such as familiarity, cost concerns, and environmental awareness into the TAM framework, this study indicates the potential value of a multidisciplinary approach in analyzing consumer behavior toward smart technologies. These insights may help refine technology acceptance models and their relevance to emerging IoT solutions.
This research also highlights the possible role of demographic factors in shaping consumer attitudes and behaviors toward smart meter technology. For example, social media and peer influence are key for younger users, while elderly groups need more privacy reassurance. These disparities observed in familiarity and privacy concerns across age groups suggest that technology adoption may not be uniform and that more inclusive frameworks could be needed to address diverse user groups. These findings contribute to the growing body of literature by providing a focused analysis of demographic influences on the adoption of IoT-based technologies. In addition, this research explored the relevance of behavioral constructs such as perceived usefulness, ease of use, and social influence within the energy sector. While these constructs are traditionally applied in broader technology contexts, their specific application here suggests their potential significance in understanding the adoption of smart energy solutions. This alignment could help strengthen the theoretical foundations of technology adoption research, particularly in the context of sustainable energy systems. Moreover, the research highlights the importance of privacy and security concerns in IoT technology adoption. While privacy was identified as a less significant factor for many users, it appeared to be a critical concern for specific demographics. This finding offers a more nuanced perspective on user apprehensions in the digital era, which may enrich the theoretical exploration of trust and risk perceptions in IoT-based systems.
While there are several international studies on SMT acceptance and adoption, research on SMT focusing on utilization in Norway remains limited. As mandated by the Measurement and Settlement Regulations Act, all Norwegian electricity consumers were required to have smart electricity meters installed by January 2019. Despite the mandatory installation of SMTs across Norwegian households, only 29.5% of respondents actively utilize their SMTs through additional equipment. This means that while the hardware is in place, most consumers are not engaging with the system beyond its basic function of tracking electricity consumption. The majority, 62.9%, reported that they do not use SMT beyond what is required, while 7.6% were unsure about their utilization. The findings suggest that technical complexity, lack of guidance, or the additional cost of necessary equipment might be preventing users from fully integrating SMT into their daily energy management routines. Consequently, user acceptance studies may be less relevant for current SMT research in Norway, necessitating a focus on utilization. The extended TAM lens provided valuable insights into SMT utilization within the Norwegian context. This extension also contributes new theoretical knowledge on SMT utilization. Using a mixed-method research design, this study empirically supports the significance of Familiarity, Cost and Electricity-savings Concern, Perceived Usefulness, and Social Influence in the utilization of SMT in Norway. However, factors like Effort Expectancy, Perceived Ease of Use, and Perceived Compatibility, identified as important in previous literature (e.g., [13,14,28,40,41,42,43,44,59,61], did not significantly affect behavioral intention to use SMT in this study. Cost and Electricity-savings Concerns emerged as strong indicators of behavioral intention to use SMT, likely correlated with increased electricity prices due to the post-COVID economic recovery, the ongoing Russian-Ukrainian conflict, and environmental changes [55]. This potential link warrants further scholarly investigation.

7.2. Implications for Practice

This study has many important implications and recommendations for service providers, policymakers, and industry professionals for driving SMT utilization. The key factors identified, such as Familiarity, Cost and Electricity-savings Concern, Perceived Usefulness, and Social Influence, will help leaders and policymakers develop and implement strategies to drive energy conservation, reduce costs, and enhance customer experience.
The quantitative and qualitative data suggest that network and electricity companies must provide clear information about SMT to customers. A significant factor identified was familiarity with the technology. The interviews also revealed that companies did not prioritize disseminating information or offering guidance and training on smart meter utilization. Given the importance of social influence, leveraging mass and social media could enhance awareness and utilization of SMT. Increased familiarity with SMT could lead to greater consumer awareness of energy consumption, subsequently promoting environmental consciousness. The data also suggest that the respondents valued ease of use and usefulness but reported limited guidance from electricity companies. Thus, companies need to offer clearer instructions on SMT use, particularly when integrating additional equipment.
From a practical standpoint, the findings also underline the importance of targeted awareness campaigns and user education. Energy companies and network operators must proactively address the significant knowledge gaps regarding the functionality and potential benefits of smart meter technology. Providing step-by-step guides, interactive workshops, and user-friendly interfaces could significantly enhance consumer engagement. Second, cost-saving motivation exists across income levels but requires tailored strategies. Reducing the cost barriers associated with auxiliary equipment required for smart meter utilization is crucial. Hence, subsidized pricing models, bundled offerings, or incentives for additional equipment installation can help increase accessibility, particularly for lower-income groups. The integration of smart meters with advanced analytics tools and mobile applications offers another practical avenue. By enabling real-time insights into energy consumption and personalized recommendations for energy savings, these tools can make the technology more appealing and practical for users. Additionally, implementing gamification strategies, such as rewarding energy-efficient behaviors, could foster a more engaging consumer experience. Since low-income groups were less familiar with energy-saving methods and additional equipment, as shown in our data, energy providers and governments should offer targeted financial incentives or educational campaigns for lower-income groups to improve engagement. Moreover, the findings suggest that leveraging social influence through customer testimonials, community engagement, and targeted social media outreach can significantly amplify consumers’ adoption and utilization of SMT.
For policymakers, the focus should be on creating a supportive environment for the broader adoption and utilization of SMT. First, developing targeted educational campaigns is essential to enhance consumer understanding of SMT functionalities, benefits, and practical usage instructions. Introducing financial incentives, such as subsidies or grants specifically aimed at lower-income households, would significantly reduce the financial barriers associated with acquiring and utilizing supplementary SMT equipment. Policymakers should also implement clear and transparent privacy regulations and robust security standards to mitigate privacy concerns, particularly among older demographics. Additionally, demographic-specific policies and initiatives targeting older age groups through specialized training and demonstration projects are necessary to boost their engagement and familiarity with the technology. Lastly, policymakers could emphasize the long-term environmental benefits of SMT, reinforcing its relevance within broader sustainability goals

8. Conclusions, Limitations, and Future Research

This study aimed to gain insights into the adoption and utilization of SMT in Norway, identifying the factors that influence their acceptance among Norwegian consumers and emphasizing the unique context of mandated installations under the Measurement and Settlement Regulations Act of 2019.
The main findings identified familiarity with SMT functionalities and cost-saving concerns as the strongest predictors of consumer intention to engage with the technology. Additionally, perceived usefulness and social influence were significant but less influential drivers, while privacy concerns exhibited minimal impact. Demographically, younger and middle-aged individuals (18–25 and 46–55 years) showed the highest levels of engagement, driven by tech-savviness and greater sensitivity to energy costs. In contrast, older age groups (66 years and above) exhibited lower engagement, highlighting a need for targeted educational initiatives. Additionally, income levels significantly impacted SMT utilization, with higher-income households more actively engaging due to the costs associated with additional equipment.
Although this study makes contributions in terms of a better understanding of the factors influencing SMT utilization, there are a few limitations that need to be addressed. At the same time, the survey garnered 105 valid responses, which was deemed acceptable. However, a larger and more generalized sample size would be preferable for future research. In addition, the limited qualitative findings primarily served as supplementary data/information to the quantitative results. For example, this research included interviews with only three industry representatives. Although they offered insights from different sectors (energy supply, consulting, and network operations), the limited number of participants constrains the generalizability of qualitative findings. Future studies should then aim for a larger and more representative sample to enhance the generalizability of the results. The discrepancies between this research’s survey demographics and the national figures indicate an overrepresentation of certain age groups, regions, higher education levels, and income brackets, which may affect the generalizability of the study’s findings. For example, the overrepresentation of highly educated and high-income respondents, compared to Norway’s national averages (e.g., 37% with higher education [93]), may restrict generalizability to the broader population. Earlier research suggests that higher socioeconomic status, like education or income levels, may be associated with increased technology adoption (e.g., [94]), potentially overestimating and skewing SMT utilization rates. Future studies should then, for example, apply a stratified sampling method to include diverse socioeconomic groups/sub-groups that are closer to the national averages, ensuring a potentially enhanced population representation and potential generalizability from their results. In addition, younger generations, such as Millennials and Generation Z, are generally more tech-savvy due to their lifelong exposure to digital technologies [95,96]. Their inherent familiarity with smartphones, apps, and digital interfaces makes them more adept at adopting and utilizing new technological innovations, including SMT. Specifically, existing research (e.g., [97]) indicates that younger consumers are more likely to engage with energy consumption data provided by smart meters, using apps and online platforms to monitor and manage their energy use. Hence, studying this demographic can provide valuable insights into the actual utilization of smart meters in Norway and aid in better understanding how SMT is being integrated into daily life, which can inform strategies to enhance user engagement across all age groups. Conducting more interviews with diverse stakeholders, including government officials, network companies, and other relevant firms, would enrich the qualitative data and provide a more comprehensive understanding of the factors influencing SMT utilization. Exploring the perspectives of both active SMT users and those who do not fully utilize the technology could yield valuable information on barriers to adoption and potential strategies for increasing acceptance. In addition, future research could investigate the long-term impacts of SMT on energy consumption behavior and overall energy efficiency. Assessing the effectiveness of educational and promotional campaigns aimed at increasing SMT adoption could also provide practical insights for policymakers and industry stakeholders. Finally, comparative studies across different countries with varying levels of SMT acceptance could identify best practices and inform global strategies for enhancing the adoption of smart metering technologies.

Author Contributions

Conceptualization, M.H., I.J. and J.L.; methodology, M.H., I.J. and J.L.; software, I.J. and J.L.; validation, M.H., I.J. and J.L.; formal analysis, I.J. and J.L.; investigation, M.H., I.J. and J.L.; resources, I.J. and J.L.; data curation, I.J. and J.L.; writing—original draft preparation, I.J. and J.L.; writing—review and editing, M.H., K.N.K., I.J. and J.L.; visualization, M.H., K.N.K., I.J. and J.L.; supervision, M.H.; project administration, M.H., I.J. and J.L. All authors have read and agreed to the published version of the manuscript.

Funding

This research received no external funding.

Data Availability Statement

The data that support the findings of this study are available from the authors, upon reasonable request.

Acknowledgments

We thank Kristiania University of Applied Sciences for the APC.

Conflicts of Interest

The authors declare no conflict of interest.

References

  1. IEA. Tracking SDG7: The Energy Progress Report; IEA: Paris, France, 2022; Available online: https://www.iea.org/reports/tracking-sdg7-the-energy-progress-report-2022 (accessed on 24 September 2024).
  2. Norge, E.; Electricity Production. Norwegian Ministry of Energy. 2025. Available online: https://energifaktanorge.no/en/norsk-energiforsyning/kraftproduksjon/ (accessed on 7 May 2025).
  3. Statnett. Strømprisen—Hvorfor Varierer den. 2023. Available online: https://www.statnett.no/om-statnett/bli-bedre-kjent-med-statnett/om-strompriser/ (accessed on 20 June 2024).
  4. IEA. Global Energy Crisis. 2023. Available online: https://www.iea.org/topics/global-energy-crisis (accessed on 5 May 2025).
  5. Ecowater Economics. Norway’s Electricity Market 2023. 2024. Available online: https://ecowater-economics.com/norways-electricity-market-2023/ (accessed on 13 April 2025).
  6. Cleveland, S.M.; Haddara, M. Internet of Things for Diabetics: Identifying Adoption Issues. Internet of Things 2023, 22, 100798. [Google Scholar] [CrossRef]
  7. Gøthesen, S.; Haddara, M.; Kumar, K.N. Empowering homes with intelligence: An investigation of smart home technology adoption and usage. Internet Things 2023, 24, 100944. [Google Scholar] [CrossRef]
  8. Alkawsi, G.; Ali, N.; Baashar, Y. The moderating role of personal innovativeness and users experience in accepting the smart meter technology. Appl. Sci. 2021, 11, 3297. [Google Scholar] [CrossRef]
  9. Rajaguru, S. Consumers‘ perspective on smartness compliance of electricity meters in Sweden. In Proceedings of the BIR 2022 Workshops and Doctoral Consortium, 21st International Conference on Perspectives in Business Informatics Research (BIR 2022), Rostock, Germany, 20–23 September 2022. [Google Scholar]
  10. Lu, Y.; Vijayananth, V.; Perumal, T. Smart home energy prediction framework using temporal Kolmogorov—Arnold transformer. Energy Build. 2025, 335, 115529. [Google Scholar] [CrossRef]
  11. Paustian, S.; Köhlke, J.; Mattes, J.; Lehnhoff, S. Ready, set, …rollout?—The role of heterogeneous actors and proximities in the delayed smart meter rollout in Germany. Clean. Eng. Technol. 2025, 26, 100930. [Google Scholar] [CrossRef]
  12. Chen, C.-F.; Xu, X.; Arpan, L. Between the technology acceptance model and sustainable energy technology acceptance model: Investigating smart meter acceptance in the United States. Energy Res. Soc. Sci. 2017, 25, 93–104. [Google Scholar] [CrossRef]
  13. Raimi, K.T.; Carrico, A.R. Understanding and beliefs about smart energy technology. Energy Res. Soc. Sci. 2016, 12, 68–74. [Google Scholar] [CrossRef]
  14. Oraedu, C.; Idoko, E.C.; Ugwuanyi, C.C.; Nwanmuoh, E.E.; Onyishi, I.E. Does smart meter really stimulate households’ sustainable electricity consumption behaviour? An attitudinal-behavioural study. Energy Effic. 2022, 15, 21. [Google Scholar] [CrossRef]
  15. Thunshirn, P.; Mlinaric, I.; Berg, J. A qualitative analysis of consumer motivations and barriers towards active smart meter utilization. Energy Policy 2025, 203, 114623. [Google Scholar] [CrossRef]
  16. NVE. Smart Metering (AMS). The Norwegian Energy Regulatory Authority. 2022. Available online: https://www.nve.no/norwegian-energy-regulatory-authority/retail-market/smart-metering-ams/ (accessed on 3 January 2025).
  17. Næringslivets Hovedorganisasjon. Verden og oss—Næringslivets Perspektivmelding 2018. 2018. Available online: https://www.nho.no/siteassets/publikasjoner/naringslivets-perspektivmelding/pdf-er/nho_perspektivmeldingen_hele_web_lowres.pdf (accessed on 10 February 2025).
  18. Davis, F.D. A Technology Acceptance Model for Empirically Testing New End-User Information Systems: Theory and Results. Ph.D. Thesis, Sloan School of Management M.I.T, Cambridge, MA, USA, 1986. [Google Scholar]
  19. Venkatesh, V.; Bala, H. Technology acceptance model 3 and a research agenda on interventions. Decis. Sci. 2008, 39, 273–315. [Google Scholar] [CrossRef]
  20. Westskog, H.; Winther, T.; Sæle, H. The effects of in-home displays—Revisiting the context. Sustainability 2015, 7, 5431–5451. [Google Scholar] [CrossRef]
  21. Nižetić, S.; Šolić, P.; González-de-Artaza, D.L.-d.I.; Patrono, L. Internet of Things (IoT): Opportunities, issues and challenges towards a smart and sustainable future. J. Clean. Prod. 2020, 274, 122877. [Google Scholar] [CrossRef] [PubMed]
  22. Gumz, J.; Fettermann, D.C. User’s perspective in smart meter research: State-of-the-art and future trends. Energy Build. 2024, 308, 114025. [Google Scholar] [CrossRef]
  23. Friess, P.; Vermesan, O. Internet of things strategic research roadmap. In Internet of Things-Global Technological and Societal Trends from Smart Environments and Spaces to Green ICT; River Publishers: Aalborg, Denmark, 2022; pp. 9–52. [Google Scholar]
  24. Longva, A.M.; Haddara, M. How Can IoT Improve the Life-quality of Diabetes Patients? In Proceedings of the MATEC Web of Conferences, 23rd International Conference on Circuits, Systems, Communications and Computers (CSCC 2019), Athens, Greece, 14–17 July 2019; EDP Sciences: Les Ulis, France, 2019. [Google Scholar]
  25. Agarwala, A.; Tahsin, T.; Ali, F.; Sarker, S.K.; Abhi, S.H.; Das, S.K.; Das, P.; Hasan, M.; Tasneem, Z.; Islam, M.; et al. Towards next generation power grid transformer for renewables: Technology review. Eng. Rep. 2024, 6, e12848. [Google Scholar] [CrossRef]
  26. Zheng, Z.; Shafique, M.; Luo, X.; Wang, S. A systematic review towards integrative energy management of smart grids and urban energy systems. Renew. Sustain. Energy Rev. 2024, 189, 114023. [Google Scholar] [CrossRef]
  27. Khalid, M. Smart grids and renewable energy systems: Perspectives and grid integration challenges. Energy Strategy Rev. 2024, 51, 101299. [Google Scholar] [CrossRef]
  28. Toft, M.B.; Schuitema, G.; Thøgersen, J. Responsible technology acceptance: Model development and application to consumer acceptance of Smart Grid technology. Appl. Energy 2014, 134, 392–400. [Google Scholar] [CrossRef]
  29. Mishra, D.P.; Gaur, A.P.; Rai, Y.K.; Salkuti, S.R. Smart Grid and Energy Management Systems: A Global Perspective. In Energy and Environmental Aspects of Emerging Technologies for Smart Grid; Springer: Berlin/Heidelberg, Germany, 2024; pp. 629–649. [Google Scholar]
  30. Barman, B.K.; Yadav, S.N.; Kumar, S.; Gope, S. IOT based smart energy meter for efficient energy utilization in smart grid. In Proceedings of the 2018 2nd international conference on power, energy and environment: Towards smart technology (ICEPE), Shillong, India, 1–2 June 2018; IEEE: New York, NY, USA, 2018. [Google Scholar]
  31. Lien, E.; Bergh, K.; Katsikas, S. Perceptions of Cyber Security Risk of the Norwegian Advanced Metering Infrastructure. In Proceedings of the ICISSP 2024—10th International Conference on Information Systems Security and Privacy, Rome, Italy, 26–28 February 2024. [Google Scholar]
  32. Chawla, Y.; Kowalska-Pyzalska, A.; Skowrońska-Szmer, A. Perspectives of smart meters‘ roll-out in India: An empirical analysis of consumers‘ awareness and preferences. Energy Policy 2020, 146, 111798. [Google Scholar] [CrossRef]
  33. Rahman, T.; Othman, M.L.; Noor, S.B.M.; Ahmad, W.F.B.W.; Sulaima, M.F. Methods and attributes for customer-centric dynamic electricity tariff design: A review. Renew. Sustain. Energy Rev. 2024, 192, 114228. [Google Scholar] [CrossRef]
  34. SAP. Smart Metering: Helping Customers Reduce Consumption. 2023. Available online: https://www.sap.com/hungary/resources/smart-metering-helping-customers-reduce-consumption (accessed on 5 May 2025).
  35. NVE. Overview of Norway’s Electricity History. Norwegian Water Resources and Energy Directorate. 2017. Available online: https://publikasjoner.nve.no/rapport/2017/rapport2017_15.pdf (accessed on 6 October 2024).
  36. Vigsnæs, M.K. Nye Smartmålere Skaper Debatt—Vi vil Ikke bli Overvåket. 2018. Available online: https://www.nrk.no/norge/nye-smartmalere-skaper-debatt_-_-vi-vil-ikke-bli-overvaket-1.13951968 (accessed on 10 October 2024).
  37. Kjellevold, K. Nettkunder Tapte Kamp om Smarte Strømmålere. E24. 2022. Available online: https://e24.no/naeringsliv/i/4oV1ze/nettkunder-tapte-kamp-om-smarte-stroemmaalere (accessed on 21 November 2024).
  38. Buckley, P. Prices, information and nudges for residential electricity conservation: A meta-analysis. Ecol. Econ. 2020, 172, 106635. [Google Scholar] [CrossRef]
  39. Kranz, L.; Gallenkamp, J.; Picot, A.O. Exploring the role of control–smart meter acceptance of residential consumers. In Proceedings of the Sixteenth Americas Conference on Information Systems, Lima, Peru, 12–15 August 2010; AIS: Atlanta, GA, USA, 2010. [Google Scholar]
  40. Kranz, J.; Picot, A. Is it money or the environment? An empirical analysis of factors influencing consumers’ intention to adopt the smart metering technology. In Proceedings of the 18th Americas Conference on Information Systems, AMCIS 2012, Seattle, WA, USA, 9–11 August 2012. [Google Scholar]
  41. Park, C.-K.; Kim, H.-J.; Kim, Y.-S. A study of factors enhancing smart grid consumer engagement. Energy Policy 2014, 72, 211–218. [Google Scholar] [CrossRef]
  42. Gerpott, T.J.; Paukert, M. Determinants of willingness to pay for smart meters: An empirical analysis of household customers in Germany. Energy Policy 2013, 61, 483–495. [Google Scholar] [CrossRef]
  43. Bugden, D.; Stedman, R. A synthetic view of acceptance and engagement with smart meters in the United States. Energy Res. Soc. Sci. 2019, 47, 137–145. [Google Scholar] [CrossRef]
  44. Alkawsi, G.A.; Ali, N.; Baashar, Y. An Empirical Study of the Acceptance of IoT-Based Smart Meter in Malaysia: The Effect of Electricity-Saving Knowledge and Environmental Awareness. IEEE Access 2020, 8, 42794–42804. [Google Scholar] [CrossRef]
  45. Gumz, J.; Fettermann, D.C.; Sant’anna, Â.M.O.; Tortorella, G.L. Social influence as a major factor in smart meters’ acceptance: Findings from Brazil. Results Eng. 2022, 15, 100510. [Google Scholar] [CrossRef]
  46. Sim, J.; Lee, J.; Cho, D. On the effectiveness of smart metering technology adoption: Evidence from the national rollout in the United Kingdom. J. Assoc. Inf. Syst. 2023, 24, 555–591. [Google Scholar] [CrossRef]
  47. Gupta, R.; Mauzerall, D.L.; Constantino, S.; Sparkman, G.; Nambiar, M.; Weber, E. Overcoming barriers and seizing opportunities for smart meters in developing countries: Insights from a large-scale field study in India. Energy Res. Soc. Sci. 2025, 122, 103996. [Google Scholar] [CrossRef]
  48. Gao, L.; Bai, X. A unified perspective on the factors influencing consumer acceptance of internet of things technology. Asia Pac. J. Mark. Logist. 2014, 26, 211–231. [Google Scholar] [CrossRef]
  49. Davis, F.D. Perceived usefulness, perceived ease of use, and user acceptance of information technology. MIS Q. 1989, 13, 319–340. [Google Scholar] [CrossRef]
  50. Park, J.; Yang, B. GIS-Enabled Digital Twin System for Sustainable Evaluation of Carbon Emissions: A Case Study of Jeonju City, South Korea. Sustainability 2020, 12, 9186. [Google Scholar] [CrossRef]
  51. Mathieson, K.; Peacock, E.; Chin, W.W. Extending the technology acceptance model: The influence of perceived user resources. ACM SIGMIS Database: DATABASE Adv. Inf. Syst. 2001, 32, 86–112. [Google Scholar] [CrossRef]
  52. Venkatesh, V.; Davis, F.D. A theoretical extension of the technology acceptance model: Four longitudinal field studies. Manag. Sci. 2000, 46, 186–204. [Google Scholar] [CrossRef]
  53. Columbia University, Center on Global Energy Policy. Market, Policy, and Political Implications of the Global Natural Gas Crisis: Forum Report. 2021. Available online: https://www.energypolicy.columbia.edu/publications/market-policy-and-political-implications-global-natural-gas-crisis-forum-report/ (accessed on 1 December 2024).
  54. Sæther, B.; Neumann, A. The effect of the 2022 energy crisis on electricity markets ashore the North Sea. Energy Econ. 2024, 131, 107380. [Google Scholar] [CrossRef]
  55. Zakeri, B.; Staffell, I.; Dodds, P.; Grubb, M.; Ekins, P.; Jääskeläinen, J.; Cross, S.; Helin, K.; Castagneto-Gissey, G. Energy Transitions in Europe—Role of Natural Gas in Electricity Prices. SSRN 4170906. 2022. Available online: https://ssrn.com/abstract=4170906 (accessed on 4 March 2025).
  56. Alam, M.K.; Tabash, M.I.; Billah, M.; Kumar, S.; Anagreh, S. The impacts of the Russia–Ukraine invasion on global markets and commodities: A dynamic connectedness among G7 and BRIC markets. J. Risk Financ. Manag. 2022, 15, 352. [Google Scholar] [CrossRef]
  57. Emrouznejad, A.; Panchmatia, V.; Gholami, R.; Rigsbee, C.; Kartal, H.B. Analysis of Smart Meter Data With Machine Learning for Implications Targeted Towards Residents. Int. J. Urban Plan. Smart Cities (IJUPSC) 2023, 4, 1–22. [Google Scholar] [CrossRef]
  58. Malhotra, A.; Melville, N.P.; Watson, R.T. Spurring impactful research on information systems for environmental sustainability. MIS Q. 2013, 37, 1265–1274. [Google Scholar] [CrossRef]
  59. Kranz, L.; Gallenkamp, J.; Picot, A. Power control to the people? Private consumers’ acceptance of smart meters. In Proceedings of the 18th European Conference on Information Systems (ECIS), Pretoria, South Africa, 7–9 June 2010; AIS: Atlanta, GA, USA, 2010. [Google Scholar]
  60. Datatilsynet. Automatisk Strømmåling. 2018. Available online: https://www.datatilsynet.no/personvern-pa-ulike-omrader/overvaking-og-sporing/strommaling/ (accessed on 16 January 2025).
  61. Ahmed, E.; Yaqoob, I.; Gani, A.; Imran, M.; Guizani, M. Internet-of-Things-based smart environments: State of the art, taxonomy, and open research challenges. IEEE Wirel. Commun. 2016, 23, 10–16. [Google Scholar] [CrossRef]
  62. Schallehn, F.; Valogianni, K. Sustainability awareness and smart meter privacy concerns: The cases of US and Germany. Energy Policy 2022, 161, 112756. [Google Scholar] [CrossRef]
  63. Oates, B.J. Researching Information Systems and Computing; SAGE Publications: London, UK, 2006. [Google Scholar]
  64. Cameron, R. A sequential mixed model research design: Design, analytical and display issues. Int. J. Mult. Res. Approaches 2009, 3, 140–152. [Google Scholar] [CrossRef]
  65. Gripsrud, G.; Olsson, U.H.; Silkoset, R. Metode og Dataanalyse Beslutningsstotte for Bedrifter ved Bruk av JMP, Excel og SPSS; Cappelen Damm akademisk: Oslo, Norway, 2016. [Google Scholar]
  66. Jaganmohan, M. Global Energy Prices—Statistics & Facts. Statista. 2024. Available online: https://www.statista.com/topics/1323/energy-prices/ (accessed on 3 May 2025).
  67. Fan, Y.; Chen, J.; Shirkey, G.; John, R.; Wu, S.R.; Park, H.; Shao, C. Applications of structural equation modeling (SEM) in ecological studies: An updated review. Ecol. Process. 2016, 5, 19. [Google Scholar] [CrossRef]
  68. Hair, J.F., Jr. Partial Least Squares Structural Equation Modeling (PLS-SEM) Using R: A Workbook; Springer: Berlin/Heidelberg, Germany, 2021. [Google Scholar]
  69. Yin, R.K. Case Study Research and Applications: Design and Methods, 6th ed.; SAGE Publications: Los Angeles, CA, USA, 2018; p. 319. [Google Scholar]
  70. Castleberry, A.; Nolen, A. Thematic analysis of qualitative research data: Is it as easy as it sounds? Curr. Pharm. Teach. Learn. 2018, 10, 807–815. [Google Scholar] [CrossRef] [PubMed]
  71. Nowell, L.S.; Norris, J.M.; White, D.E.; Moules, N.J. Thematic analysis: Striving to meet the trustworthiness criteria. Int. J. Qual. Methods 2017, 16, 1609406917733847. [Google Scholar] [CrossRef]
  72. Anastasi, A.; Urbina, S. Psychological Testing, 7th ed.; Prentice Hall: Upper Saddle River, NJ, USA, 1997. [Google Scholar]
  73. Kline, R.B. Principles and Practice of Structural Equation Modeling; Guilford Publications: New York, NY, USA, 2023. [Google Scholar]
  74. SSB. Population. 2024, SSB. Available online: https://www.ssb.no/en/befolkning/folketall/statistikk/befolkning (accessed on 21 April 2025).
  75. Wikipedia. Demographics of Norway. 2024. Available online: https://en.wikipedia.org/wiki/Demographics_of_Norway (accessed on 30 September 2024).
  76. SSB. Educational Attainment of the Population. 2024. Available online: https://www.ssb.no/en/utdanning/utdanningsniva/statistikk/befolkningens-utdanningsniva (accessed on 14 January 2025).
  77. SSB. Income and Wealth for Households 2025. Available online: https://www.ssb.no/en/inntekt-og-forbruk/inntekt-og-formue/statistikk/inntekts-og-formuesstatistikk-for-husholdninger (accessed on 7 May 2025).
  78. Ahmed, S.; Ahmad, F.B.; Jaaffar, A.R. Influence of Employee Engagement on Employee Promotion Opportunity and Performance Relationships in Developing Context: Critical Evaluation with PLS-SEM Analysis Technique. Transylv. Rev. 2017, 17, 4327–4340. [Google Scholar]
  79. Hair, J.F.; Ringle, C.M.; Sarstedt, M. PLS-SEM: Indeed a silver bullet. J. Mark. Theory Pract. 2011, 19, 139–152. [Google Scholar] [CrossRef]
  80. Hair, J.F.; Black, W.C.; Babin, B.J.; Anderson, R.E.; Tatham, R. Multivariate Data Analysis, 6th ed.; Pearson Prentice Hall: Uppersaddle River, NJ, USA, 2006. [Google Scholar]
  81. Field, A. Discovering Statistics Using SPSS, 2nd ed.; SAGE Publications: London, UK, 2005. [Google Scholar]
  82. Hair, J.F.; Risher, J.J.; Sarstedt, M.; Ringle, C.M. When to use and how to report the results of PLS-SEM. Eur. Bus. Rev. 2019, 31, 2–24. [Google Scholar] [CrossRef]
  83. Shmueli, G.; Sarstedt, M.; Hair, J.F.; Cheah, J.-H.; Ting, H.; Vaithilingam, S.; Ringle, C.M. Predictive model assessment in PLS-SEM: Guidelines for using PLSpredict. Eur. J. Mark. 2019, 53, 2322–2347. [Google Scholar] [CrossRef]
  84. Ringle, C.M.; Sarstedt, M.; Sinkovics, N.; Sinkovics, R.R. A perspective on using partial least squares structural equation modelling in data articles. Data Brief 2023, 48, 109074. [Google Scholar] [CrossRef]
  85. Kock, N. Common method bias in PLS-SEM: A full collinearity assessment approach. Int. J. e-Collab. (IJEC) 2015, 11, 1–10. [Google Scholar] [CrossRef]
  86. Hair, J., Jr.; Sarstedt, M.; Hopkins, L.; GKuppelwieser, V. Partial least squares structural equation modeling (PLS-SEM) An emerging tool in business research. Eur. Bus. Rev. 2014, 26, 106–121. [Google Scholar] [CrossRef]
  87. Campbell, M.K.; Torgerson, D.J. Bootstrapping: Estimating confidence intervals for cost-effectiveness ratios. QJM Int. J. Med. 1999, 92, 177–182. [Google Scholar] [CrossRef]
  88. Hespanhol, L.; Vallio, C.S.; Costa, L.M.; Saragiotto, B.T. Understanding and interpreting confidence and credible intervals around effect estimates. Braz. J. Phys. Ther. 2019, 23, 290–301. [Google Scholar] [CrossRef] [PubMed]
  89. Kock, N. Harman’s single factor test in PLS-SEM: Checking for common method bias. Data Anal. Perspect. J. 2020, 2, 1–6. [Google Scholar]
  90. Kroener, N.; Förderer, K.; Lösch, M.; Schmeck, H. State-of-the-art integration of decentralized energy management systems into the German smart meter gateway infrastructure. Appl. Sci. 2020, 10, 3665. [Google Scholar] [CrossRef]
  91. Aasen, M.; Klemesten, M.; Vatn, A. Folk og klima: Utvikling i Nordmenns Oppfatninger om Klimaendringer, Klimapolitikk og eget Ansvar 2018–2021; C.S.f. klimaforskning, Ed.; CICERO Senter for klimaforskning: Oslo, Norway, 2022. [Google Scholar]
  92. OECD. OECD Environmental Performance Reviews: Norway 2022. In OECD Environmental Performance Reviews; OECD: Paris, France, 2022. [Google Scholar]
  93. Einar, H.D. Highest education completed among the population in Norway in 2023. In Education & Science; Statista: Hamburg, Germany, 2024. [Google Scholar]
  94. Venkatesh, V.; Morris, M.G.; Davis, G.B.; Davis, F.D. User acceptance of information technology: Toward a unified view. MIS Q. 2003, 27, 425–478. [Google Scholar] [CrossRef]
  95. Helsper, E.J.; Eynon, R. Digital natives: Where is the evidence? Br. Educ. Res. J. 2010, 36, 503–520. [Google Scholar] [CrossRef]
  96. Giray, L. Meet the centennials: Understanding the generation Z students. Int. J. Sociol. Anthropol. Sci. Rev. 2022, 2, 9–18. [Google Scholar]
  97. Chawla, Y.; Kowalska-Pyzalska, A. Public awareness and consumer acceptance of smart meters among Polish social media users. Energies 2019, 12, 2759. [Google Scholar] [CrossRef]
Figure 1. Proposed Research Hypotheses.
Smartcities 08 00084 g001
Figure 2. Research Process. Adapted from [63].
Smartcities 08 00084 g002
Figure 3. Outer Loadings and Path Coefficient.
Smartcities 08 00084 g003
Figure 4. Discriminant Validity: Cross Loadings.
Smartcities 08 00084 g004
Figure 5. Discriminant validity: Fornell-Larcker.
Smartcities 08 00084 g005
Figure 6. Discriminant Validity: HTMT.
Smartcities 08 00084 g006
Figure 7. Inner VIF Values (Collinearity issues).
Smartcities 08 00084 g007
Figure 8. r2 Findings.
Smartcities 08 00084 g008
Table 1. Related Studies on Smart Meter Adoption and Utilization.
StudyTargetObserved BehaviorFrameworkMethodLocationSummary of the Findings
[39]Factors that influence potential adoptersIntention to adoptTAM, TPBInternet surveyNot specifiedIn this study, attitude proved to be the most influential determinant. Perceived ease of use was found to impact attitude significantly. Energy price-consciousness and environmental concerns significantly impact the intention to adopt the technology. Additionally, the study found normative beliefs to be an important adoption driver. People with concerns regarding the economy and nature’s vulnerability are found to be more likely to adopt SMT.
[40]Customers with smart meter awarenessIntention to useTAMInternet surveyGermanyPerceived usefulness, perceived ease of use, and subjective control were seen to affect attitudes toward SMT. The attitude was seen to affect the intention to use SMT.
[41]Electricity consumersIntention to useTAM, PRTInterviewsSouth KoreaThe significant factors in this study were perceived usefulness, perceived risk, and perceived ease of use.
[28]Electricity consumersAcceptanceTAM, NAMInternet surveyNorway, Switzerland, and DenmarkAttitude and personal norms were observed to be affected by perceived ease of use and perceived usefulness. Attitude and personal norms affect acceptance of SMT.
[42]Residential customers of power suppliersIntention to useGeneral ConceptsInternet surveyGermanyIntention to change usage behaviors, expected savings, trust in data protection, the usefulness of consumption feedback, and environmental awareness were seen to affect willingness to pay for SMT.
[20]Electricity consumersDifferences in households with various levels of affluence and previous experience.General ConceptsPilot projectNorwayThe study found differences between diverse types of households in their interactions with SMT and in-home displays. Less advantageous groups without previous monitoring experience found that the display can offer social benefits and reduce energy consumption.
[13]Online usersEstimated likelihood of adoptionGeneral ConceptsInternet surveyUSAThe likelihood of adoption in this study was affected by factors like privacy, security, global warming, health, and affordability.
[12]People who have not installed smart metersSmart meter adoption and support intentionSETA and TAMInternet surveyUSAAdoption and support of SMT were affected by privacy issues, usefulness, and perceptions of problems.
[43]Expected users of smart meterBehavioral and Acceptance IntentionGeneral ConceptsMail surveyUSAFamiliarity with smart meters and climate change risk had the strongest effect on acceptance in this study. Age and income had the strongest effect on engagement towards SMT.
[44]Electricity consumers/ Households with smart meters installedIntention to use and actual use behaviorUTAUT2Online and Paper-Based surveyMalaysiaIncreased experience in using smart meters was seen to increase consumers’ intention to use the technology. The relationship between effort expectancy and behavior intention was weaker amongst experienced users. Consumers with more SMT experience perceived privacy as a bigger concern.
[8]Factors that influence residential consumers’ acceptance of smart metersBehavioral intention to useUTAUT2Internet surveyMalaysiaEnvironmental awareness, electricity-saving knowledge, habit, performance expectancy, and effort expectancy had an impact on behavioral intention to use SMT. Social influence and facilitating conditions had no significant influence on the intention to use SMT in this study.
[14]Households are potentially motivated to use smart meter technologyFactors that motivate households to consume energy sustainably using smart meter technologyTBAAn attitudinal-behavioral study using a surveyNigeriaAttitude, subjective norms, and perceived behavioral control significantly influence the intention to use SMT. The direct influence of perceived behavioral control on the behavior of sustainable energy consumption was not supported. Sustainable energy consumption behavior was found to correlate significantly with the behavioral intention to use.
[45]Households are potentially motivated to use smart meter technologyBehavioral intention to useUTAUT2Internet surveyBrazilSocial influence, hedonic motivation, environmental Awareness, and effort expectancy have shown significant influence on smart meters’ acceptance.
[46]Households are potentially motivated to use smart meter technologyUsage of SMT and energy-saving behaviorsCognitive dissonance theoryYearly survey dataUKSmart meter adoption significantly facilitates energy-saving behaviors for nationally representative residents.
[15]Factors that influence active smart meter utilizationSmart meter utilizationGeneral ConceptsInterviewsAustriaSelf-determination is a critical factor for effective utilization. Conversely, information deficits, cognitive overload, and risk aversion were identified as major obstacles to smart meter utilization.
[47]Factors that influence potential adoptersDifferences in households’ adoption with various levels of affluence and previous experienceGeneral ConceptsMixed methodsIndiaConsumer concerns primarily revolve around the accuracy of SMT and their impact on electricity billing rather than issues related to data privacy or security. Additionally, socio-economic factors, community mobilization, and the local political context significantly influence consumer decision-making regarding smart meter acceptance.
Table 3. Overview of Informants.
CodeTitleCompanyKnowledgeGenderDuration
COMP1Marketing and Communication ManagerElectricity CompanyGood knowledge of marketing and electricity/electricity vendor Male26 min
COMP2Business advisor for an electricity companyElectricity Consultancy CompanyEnergy optimization of companies/housing associationsMale24 min
COMP3Analytics in an electricity companyElectricity Network CompanyRollout of smart electricity meters/electricity vendorMale49 min
Table 4. Descriptive Statistics (total number and percentage).
Demographicsn%
GenderMale5350.5%
Female5249.5%
Other00%
Age18–252624.8%
26–351716.2%
36–451211.4%
46–553230.5%
56–651312.4%
66 or older54.8%
LocationSouthern Norway2927.6%
Eastern Norway6360%
Western Norway87.6%
Central Norway21.9%
Northern Norway32.9%
OccupationStudent1918.1%
Working8076.2%
Retired65.7%
Unemployed00%
Other00%
Highest educational degreeUpper secondary school19181%
Bachelor’s degree4643.8%
Master’s degree or higher3230.5%
No education21.9%
Other65.7%
Income (Before taxes)150,000 NOK or less76.7%
151,000–350,000 NOK98.6%
351,000–550,000 NOK1615.2%
551,000–750,000 NOK3432.4%
751,000–1,000,000 NOK2221%
1,000,000 NOK or more1716.2%
Table 5. General Behavior and Awareness Statistics.
Behaviorsn%
Do you use any Smart Home Technology?Yes
No
I do not know
41
60
4
39%
57.1%
3.8%
I am aware of having installed a Smart Meter systemYes
No
I do not know
53
38
14
50.5%
36.2%
13.3%
I utilize my Smart Meter system through additional equipmentYes
No
I do not know
31
66
8
29.5%
62.9%
7.6%
Table 6. Reliability and Validity: Loadings, AVE, rho_A, CR, and Cronbach’s alpha.
FactorItemsLoadingsCronbach’s AlphaAVECRrho_A
FamiliarityF10.8880.9120.7430.9350.922
F20.923
F30.917
F40.822
F50.746
Cost and Electricity-Saving ConcernsCEC10.6760.4890.4990.7430.566
CEC20.542
CEC30.864
Environmental awarenessEA10.5590.7230.5830.8020.716
EA20.793
EA30.898
Perceived ease of usePEOU10.8350.6960.7630.8660.734
PEOU30.911
Perceived usefulnessPU10.8470.8270.7230.8870.916
PU20.855
PU30.848
Social influenceSI10.8860.7820.6960.8730.799
SI20.817
SI30.798
Privacy concernPC10.7220.870.7790.9121.009
PC20.962
PC30.943
Behavioral intentionBI10.9370.8820.810.9270.885
BI20.901
BI30.862
Table 7. Direct Relationships for Hypothesis Testing.
HypothesisRelationshipStd BetaStd. DevT Statisticsp ValuesDecision5% CI LL95% CI UL
H1F → BI0.2730.0783.4920Supported0.1280.1520.41
H2CEC → BI0.3110.0843.7150Supported0.1190.1590.433
H3EA → BI0.0350.0790.4430.658Not supported0.002-0.0690.19
H4PEOU → BI0.0390.070.5620.574Not supported0.003-0.0830.148
H5PU → BI0.20.082.4940.013Supported0.0450.0570.32
H6SI → BI0.230.0792.8980.004Supported0.1050.1010.32
H7PC → BI-0.1010.071.4290.154Not supported0.021-0.2160.005
Table 8. Common Method Bias Calculation.
Initial EigenvaluesExtraction Sums of Squared Loadings
ComponentTotal% of VarianceCumulative %Total% of VarianceCumulative %
17.05227.12527.1257.05227.12527.125
23.62013.92341.048
32.62110.08151.129
42.1268.17859.307
51.4265.48564.792
61.3265.09969.891
71.2694.87974.770
80.8383.22477.994
90.7492.88180.875
100.6132.35783.233
110.5492.11185.344
120.4991.91887.262
130.4361.67688.938
140.4141.59390.531
150.3751.44291.973
160.3141.20993.181
170.3001.15494.335
180.2731.04895.383
190.2500.96096.343
200.2080.79897.141
210.1850.71097.851
220.1590.61098.462
230.1330.51198.972
240.1170.44999.421
250.0830.31999.739
260.0680.261100.000
Disclaimer/Publisher’s Note: The statements, opinions and data contained in all publications are solely those of the individual author(s) and contributor(s) and not of MDPI and/or the editor(s). MDPI and/or the editor(s) disclaim responsibility for any injury to people or property resulting from any ideas, methods, instructions or products referred to in the content.

