Article

Linking Dynamic Building Simulation with Long-Term Energy System Planning to Improve Buildings Urban Energy Planning Strategies

by
Lidia Stermieri
*,
Chiara Delmastro
,
Cristina Becchio
and
Stefano Paolo Corgnati
Department of Energy (DENERG), Politecnico di Torino, 10129 Torino, Italy
*
Author to whom correspondence should be addressed.
Smart Cities 2020, 3(4), 1242-1265; https://doi.org/10.3390/smartcities3040061
Submission received: 21 September 2020 / Revised: 16 October 2020 / Accepted: 19 October 2020 / Published: 22 October 2020
(This article belongs to the Special Issue Economy and Finance in Smart-Cities)

Abstract

:
The building sector is currently responsible of 40% of global final energy consumption, influencing the broader energy system in terms of new electricity and heat capacity additions, as well as distribution infrastructure reinforcement. Current building energy efficiency potential is largely untapped, especially at the local level where retrofit interventions are typically enforced, neglecting their potential synergies with the entire energy system. To improve the understanding of these potential interactions, this paper proposes a methodology that links dynamic building simulation and energy planning tools at the urban scale. At first, a detailed bottom-up analysis was conducted to estimate the current and post-retrofit energy demand of the building stock. The stock analysis is further linked to a broader energy system simulation model to understand the impact of building renovation on the whole urban energy system in terms of cost, greenhouse gas emission, and primary energy consumption up to 2050. The methodology is suited to analyze the relationship between building energy demand reduction potential and clean energy sources’ deployment to shift buildings away from fossil fuels, the key priority for decarbonizing buildings. The methodology was applied to the case study city of Torino, Italy, highlighting the critical role of coupling proper building retrofit intervention with district-level heat generation strategies, such as modern district heating able to exploit low-grade heat. Being able to simulate both demand and supply future alternatives, the methodology provides a robust reference for municipalities and energy suppliers aiming at promoting efficient energy policies and targeted investments.

Graphical Abstract

1. Introduction

In the last decade, several actions were deployed to contrast climate change. According to the IEA [1], addressing climate change it is necessary to limit global warming well below 2 °C beyond preindustrial levels in 2050. The European Union, in 2009, decided to plan a reduction of greenhouse gas (GHG) emissions to at least 80% below 1990 levels by 2050. To achieve this goal, the European Climatic Foundation redacted a study analyzing the feasibility of this target [2]. With the new European Green Deal [3], ambitions to reduce CO2 emission are growing, setting the reduction target for 2030 to 55% and aiming to achieve a net zero emission in 2050. For a future decarbonized energy system, the first step will be improved energy efficiency, especially in building patrimony. Energy consumption of the building sector is 40% of total European energy use, accounting for 36% of associated energy related CO2 emission [4]. In some areas, space heating accounts for a larger quota of building energy consumption, up to 80% in colder climates [5]. The low energy performance of existing long life building envelopes are among the major causes of this consumption. A total of 67% of buildings in Europe were built before energy efficiency regulation, and 50% of individual heating systems are fossil fuel boilers with energy efficiency even lower than 60%. For this reason, energy efficiency measures cover a fundamental role in buildings, starting from the renovation and insulation of building envelopes to the improvement of energy systems’ efficiency. To strengthen the commitment to building energy saving, in 2017 each European nation delivered a national energy action plan for the 2017–2020 period, using the Directive 2010/31/EU on the energy performance of buildings as a guideline to state new policies and targets for the building’s retrofit and the energy efficiency [6].
Energy planning actions on the building sector require, first, the assessment of current energy consumption of the stock and its potential cost-effective energy savings. Many planning approaches consider the energy demand at an aggregated level, where the energy savings potential can be estimated as a percentage reduction of total consumption derived by a gradual achievement of compliance to current regulation as in [7,8].
Detailed analyses to disaggregate the residential stock into different building archetypes or down to the single building level have been developed by several approaches in the last year. The initial approaches were based on census data for statistically distributing buildings consumption according to primary energy use for heating, as proposed by Fracastoro et al. [9]. More recently, heat atlas methodology was used to quantify and locate heat demand in buildings according to climate and building footprint ([10,11]) However, as underlined by Petrović et al. in [12], this approach considered a predefined heat demand reduction and did not analyze heat saving in detail. A solution to this lack of details was proposed in [13] by applying a spatial approach, in which geometrical data coupled with statistical analysis were used to identify building archetypes to which an energy demand is associated through real energy consumption data or by using energy simulation software. The same approach was followed in [14,15], with further calibrating of the bottom-up approach with top-down data. A higher level of disaggregation was reached in the work of Monsalvete et al. [16], in which a modular physical building model was developed in INSEL8 (Integrated Simulation Environment Language) and it was connected with the CityGML urban geometry data model.
These methodologies assessed the energy demand and savings potential of the building sectors with different level of disaggregation, however their application for energy planning purposes is limited, often neglecting heat supply options. The importance of finding a balance between heat savings and heat supply was stressed by Hansen et al. [17], who showed that energy saving measures are less efficient without a related change on the energy production.
Energy interventions planned with a systematic approach can lead to enhanced synergies and flexibility throughout the energy system, in particular in urban areas, which are relevant consumption hubs. In Europe, heat is usually supplied by individual boilers, mostly fossil fuel burning, which in future are expected to progressively shift to electricity (e.g., heat pump) [2], increasing the need for coordination between heat generation and heat networks and the electricity grid. District heating (DH) provides 9% of the EU’s heating [5] and presents several advantages thanks to the possibility of integrating different heating technologies and sources [4], including geothermal heat pumps [18], solar energy, and waste heat, as well as conventional sources. Connolly et al. [19] analyzed the advantage of connecting individual heating systems within a heating network in a potential 100% renewable scenario for the European Union. The study found that district heating networks are generally more energy efficient in urban areas, reducing gas emission without relevant additional cost. The penetration of DH networks in energy systems provided evidence to achieve energy savings goals thanks to the utilization of different energy sources, reducing the emphasis on deep heat-saving measures that are often cost prohibitive [20].
Integrated demand–supply analyses are often supported by energy system tools. Connolly et al. [21] provided a review of major energy system tools and their applications. As one of the more widespread, EnergyPLAN can be used to analyze an entire energy system, dividing demand and supply into sectors [19,22]. In the new digital era, with digital technologies taking over the management of energy sectors, due to its intuitive interface and simple data requirement, this tool can be used for urban application, with it being more understandable to urban stakeholders compared to other energy planning tools (e.g., IMEAS project [23]).
A complete overview of the overall energy system allows municipalities to handle future urban energy planning policies, developing a central role as mediator between different stakeholders from different sectors, being able to lead the construction of a common pathway for achieving future decarbonization goals.
At regional level, this tool was applied in Hong Kong [24], while at the city level, it was applied by [8], underlining that the tool considers only aggregate heat demand and also aggregate supply, with it not being detailed enough to describe alone an urban energy system. To meet the need of a better demand description in urban areas for reflecting the real status of the building stock and to integrate demand–supply analyses, this paper’s goals were threefold:
(1)
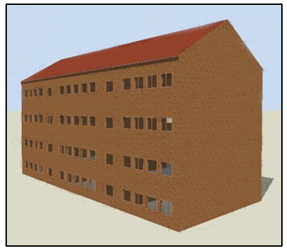
Develop a spatial-based methodology to represent the urban building demand;
(2)
Link the results of the urban stock analysis with an energy planning tool to analyze both demand and supply decarbonization measures and their economic impact;
(3)
Apply the integrated tool to develop scenarios to support integrated energy planning strategies of an urban municipality.
While urban building stock studies focused on building renovation scenarios are common in literature [25,26], the implications and synergies of demand measures on the supply side are often neglected in urban analyses [27]. The main innovation of the methodology described in this paper is indeed related to its integrated structure, targeting urban analyses and providing an in depth analysis of the energy consumption of entire building stocks and potential energy refurbishment measures, including an additional analysis about the implication that a change in the demand side could have on the supply sector over the long term.
The integrated analysis was performed over a medium–long term period to help urban energy planners in defining technically feasible and economically affordable future energy efficiency scenarios in terms of CO2 emissions, primary energy supply, and total annual cost. The integrated demand–supply analysis proposed was applied to a case study, the city of Turin. Future scenarios to achieve energy savings goal include the expansion of the existing district heating network of the city and the introduction of renewable energy technologies in the supply.
This paper is structured in four sections: the first one analyzes the case study, the second one explains the methodology, and the third one presents and analyses the results. The applicability of the methodology, the necessary conditions, and its limits are further discussed in the last section.

2. Case Study

The methodology was applied to the case study city of Turin. Turin is a city situated in northern Italy, with 2706 heating degree days (HDDs) at 18 °C. According to previous literature, heating volume of residential building is almost 139 Mm3 [28]. Almost half of the heating volume is satisfied by individual natural gas boilers, while the remaining volume is connected to district heating. The district heating (DH) in the city is the largest in Italy, with 550 km of pipes line and a building volume of 60.3 Mm3 connected to it. The heat production is satisfied for 98% by three different cogenerating thermal plants administrated by IREN Energia [29], with a total of 1200 MW electrical power installed and 740 MW thermal power. The remaining heat need is satisfied by natural gas boilers, with a thermal power installed of 1000 MW. Three thermal storages are distributed in the city, with a total capacity of 430 MW. The expansion of district heating allows for a reduction in energy consumption and the integration of renewable energy sources, without a relevant impact in the total cost, as explained in the introduction. For this reason, the following study was concentrated on the heating volume connected to DH. Real data of heat consumption of district heating were provided by IREN, manager of district heating, for year 2014, with a total annual heat consumption of 1.99 TWh/year (in 2014 district heating supplied heat to 57 Mm3). To evaluate a possible network expansion, another 19.5 Mm3 were analyzed considering previous literature, as explained in the Section 3.1. The total volume considered in the case study was equal to 76.5 Mm3, of which 57 Mm3 were attributed to the DH (as in the real case) and 19.5 Mm3 were considered in the base scenario as individual heating, while in future scenarios they will be connected to DH. The assumptions of current and future expansion of the district heating are supported by literature [27,28].

3. Methodology

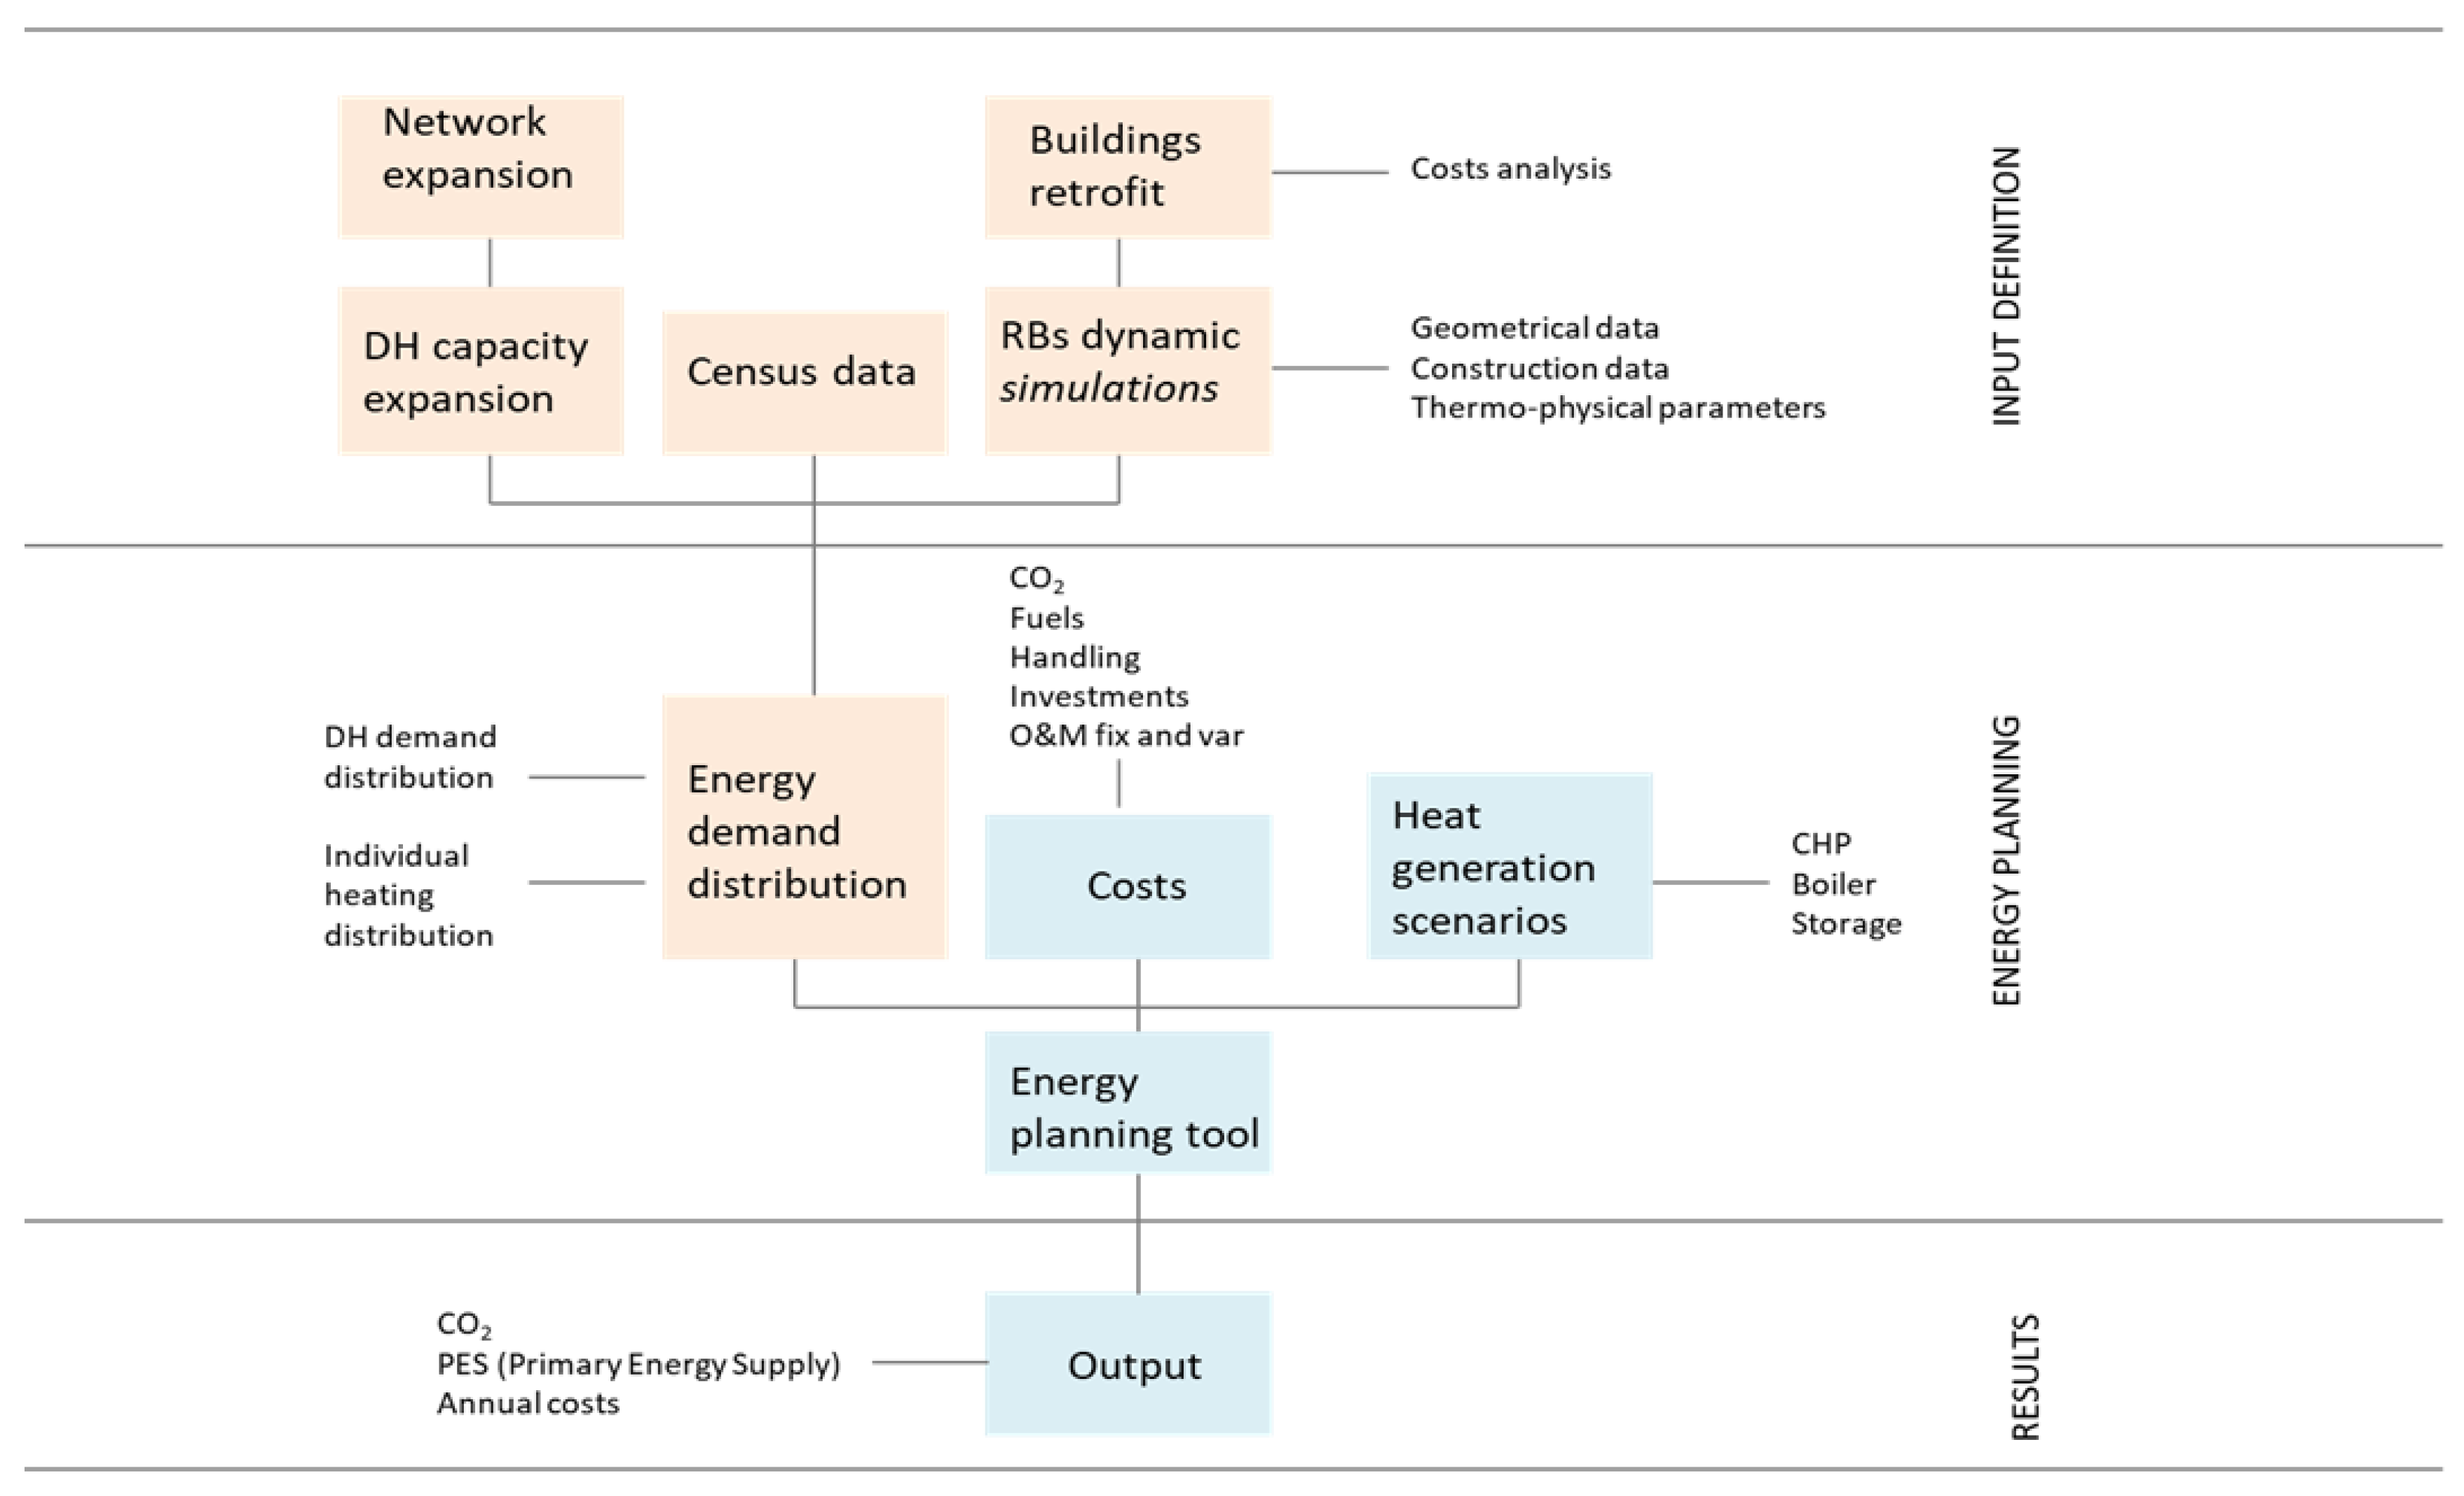
The presented methodology was composed of three key phases. The first one consisted of analyzing the energy consumption for space and water heating of identified residential reference building typologies and the potential for energy retrofit interventions, through dynamic simulation (Section 3.1). As a second step, a spatial analysis based on census data allowed researchers to quantify the distribution of reference buildings within the urban area and consequently to estimate the total energy requirement of the residential stock (Section 3.2). In the last step, the whole energy system was analyzed with an energy system simulation tool [30], allowing researchers to extend the analysis to the supply side and to develop multiple scenarios (Figure 1) (Section 3.3, Section 3.4, Section 3.5).
During the first phase, the objective was to understand where buildings’ energy-saving interventions are a priority (high-energy/high-density areas) and which level of the retrofit intervention can be reasonably pursued. Achieving this type of detail required the use of a dynamic simulation software to analyze the impact of different energy saving measures on heat consumptions. To analyze the built environment, the authors introduced the widely adopted concept of a “reference building” (RB). RBs are ‘‘buildings characterized by and representative of their functionality and geographic location, including in- door and outdoor climate conditions” [6]. Simulating a RB requires a lot of data, especially when referring to dynamic simulation [31], usually difficult to find at an urban scale. The international project Typology Approach for Building Stock Energy Assessment (TABULA), 2009–2012, aimed to define European building typologies [32], providing a robust dataset of reference buildings in European countries, including the ones diffused in North Italy. The data from the TABULA project represented a valid support for this analysis.
The spatial distribution of buildings within the urban area was determined thanks to available census data of the city. This allowed us both to estimate the current consumptions of the building stock, but also their variations under different energy retrofit options. The impact of thermal demand variation on district heat generation plants, as well as new individual solutions, can be further studied thanks to the energy planning tool EnergyPLAN [30]. This allows users to analyze how to coordinate the introduction of new heat supply technologies with building energy retrofit, both from a technical and economic perspective. The presented methodology was shaped to represent a resource for urban planners to analyze in depth buildings energy savings and their effects on the urban energy system.

3.1. Dynamic Building Simulation and Total Heat Consumption

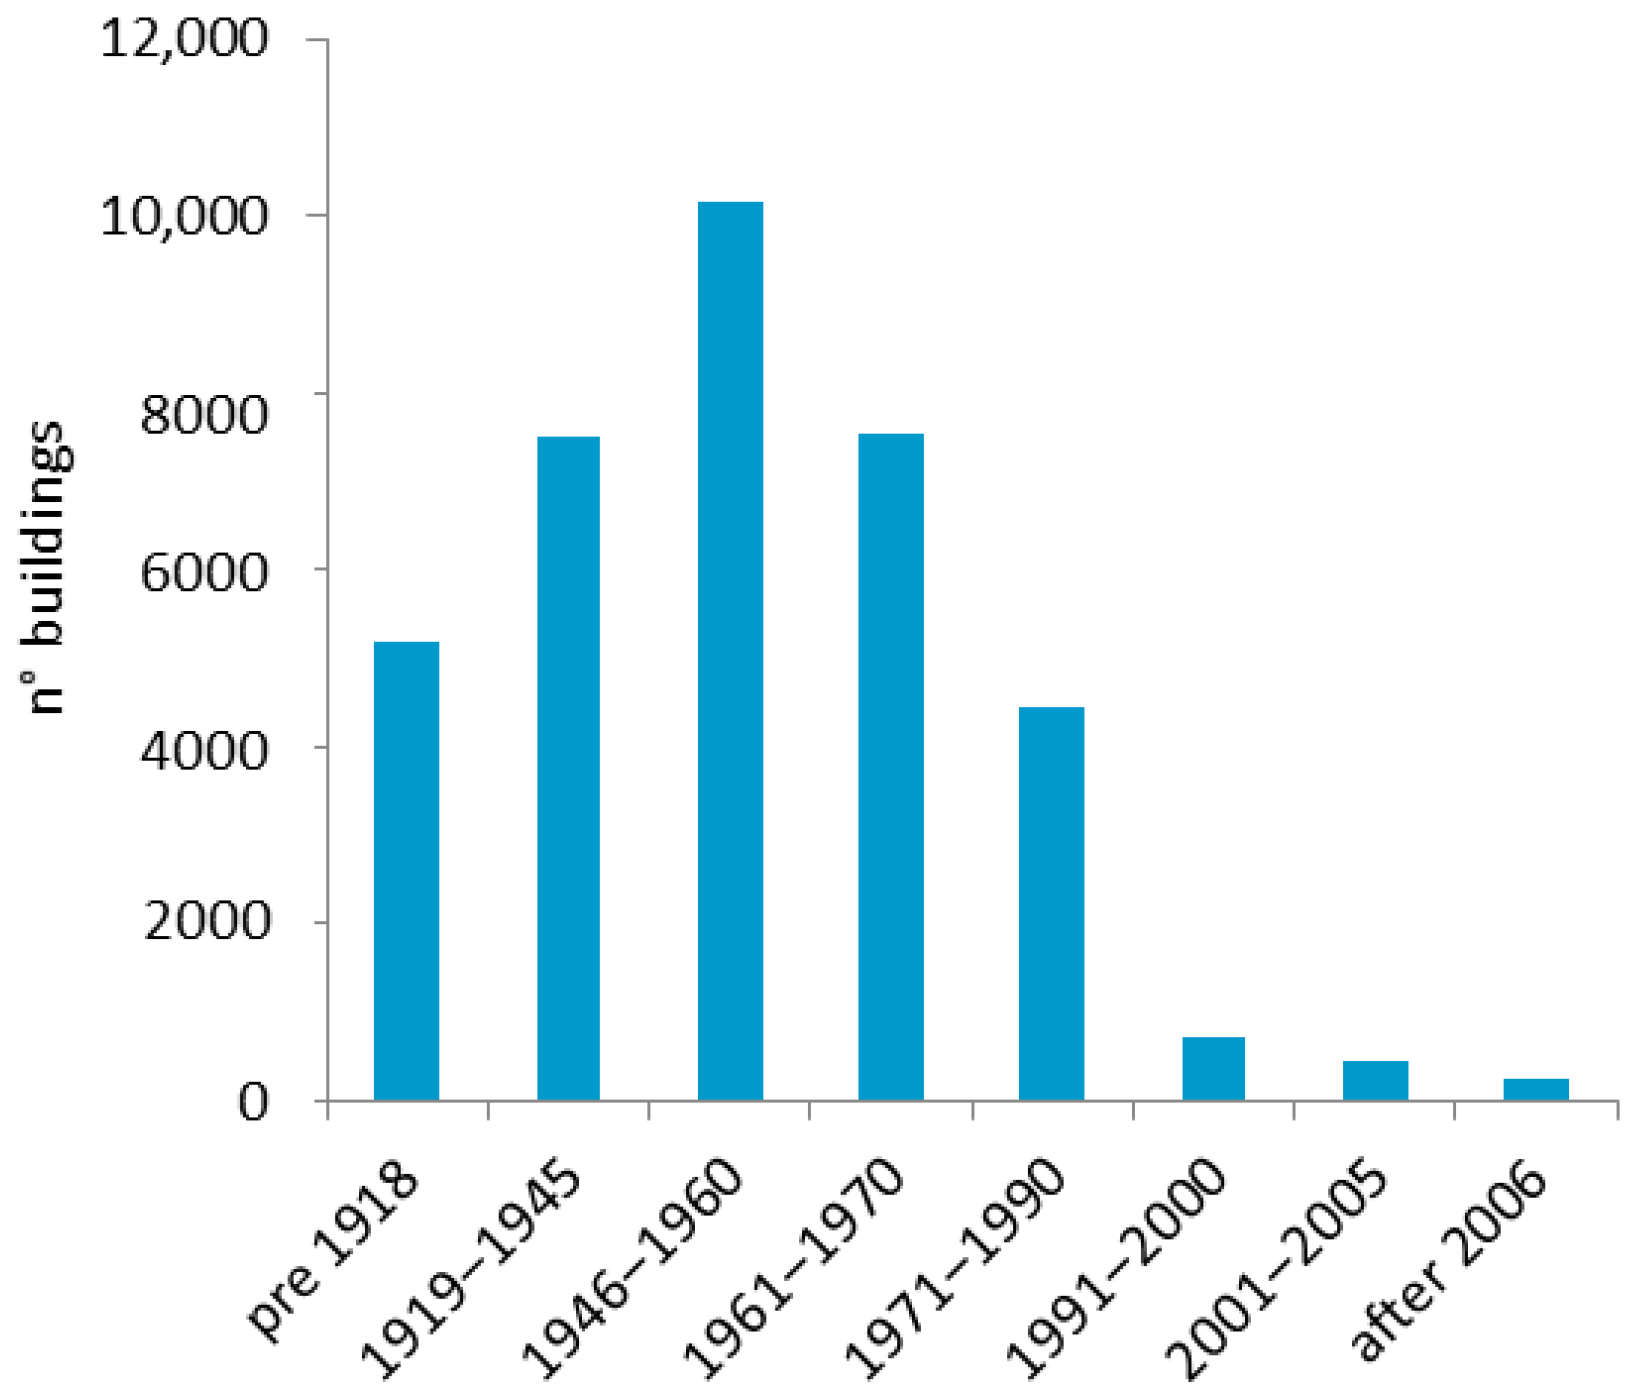
Turin has 36,158 residential and occupied buildings according to census data, which are subdivided into eight construction classes and four building types (Figure 2).
In Turin, almost 96% of buildings were built before 1980, 40% of them are apartment blocks (ABs) and 28% are multifamily houses (MF) (Figure 3). District heating is connected to buildings with a heated volume higher than 2500 m3 [33], so mostly to AB and MF. For this reason, in this study the chosen reference buildings were apartment blocks belonging to the three most frequent construction periods: ABs built from 1945 to 1960, ABs from 1961 to 1975, and ABs from 1976 to 1990.
For each census section, census data provided information about the number of buildings, in turn separated into four building typologies (AB: apartment block; MF: multi-family; TH: terraced house; SF: single family) and in three age classes (pre-1980, post-1980, post-2005). Also, information about gross heated volume and net surface area were connected to these data.
With the support of GEOPORTALE of Turin [34] it was possible to consult the map with census sections of the city; in this way it was possible to connect territorial distribution of buildings with information about building typologies and construction periods. Considering, for each construction period, a uniform distribution in the city, it was possible to further subdivide census data, and for each section, the number of buildings comparable to the three reference buildings was calculated. Volumes connected to DH were identified, and 30.7 Mm3 of them could be represented with RBs, in particular: 14.1 Mm3 belonged to AB 1945–1960, 10.5 Mm3 to AB 1961–1975, and 6.1 Mm3 to AB 1976–1990. This subdivision demonstrates the correct choice of reference buildings, because 54% of volumes connected to DH were associable with analyzed buildings.
To evaluate a possible network expansion in relation with energy savings measures, another 43 Mm3 were analyzed, considering previous literature and assuming that zones near the river were considered not connectable [33]. Of these, 19.5 Mm3 connectable were represented by RBs: 9 Mm3 to AB 1945–1960, 6.5 Mm3 to AB 1961–1975, and 4 Mm3 to 1975–1990 (Table 1). These 19.5 Mm3, considered as individual heating buildings in the base scenario, will be gradually connected to DH in future scenarios.
The TABULA project supported the association of thermal characteristics to every RB. The project presented a matrix with 32 different types of building [35,36], and a schedule for each of them containing the heated volume, the floor area, the number of apartments, the number of floors, the surface to volume ratio (S/V), the construction materials with total U-values, energy systems with their energy efficiency, and heat consumption result from steady-state calculation. Other information, such as building shape or number of windows, were derived by author assumptions and set the basis for the following reference building dynamic simulations.
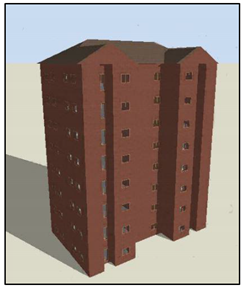
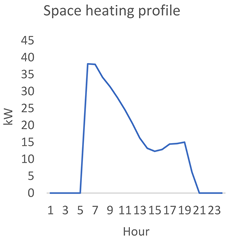
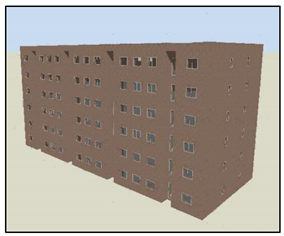
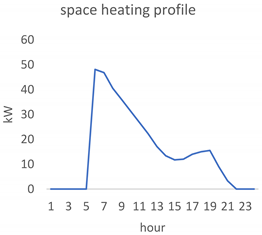
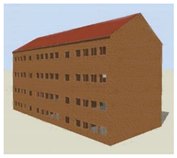
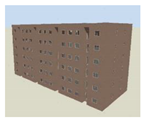
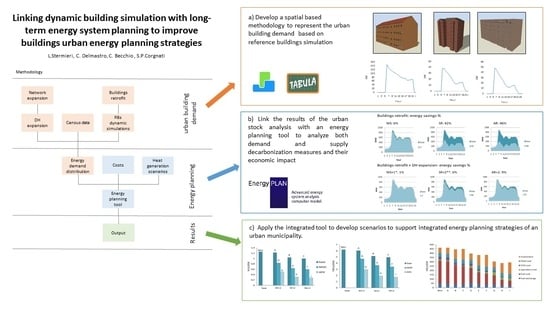
Stratigraphies were hypothesized for roof, floor, and walls (two types of wall were simulated for each RB). A lower insulation was performed, as requested in TABULA (U ≈ 0.8 W/m2K), and material data and thermo-physical properties were taken from the Italian National Unification (UNI) standards UNI 10355 and UNI 10351 [37], while for resistances the reference norm was UNI 6946 [38]. All structures neighboring with nonheated zones, as suggested in UNI 6946, provided a superficial resistance equal to the internal superficial resistance for each side. A building layout was created starting from available data of floor area, gross volume of building, and compactness (S/V). RB simulations were performed by DesignBuilder software, a graphic interface based on EnergyPlus™, a building energy simulation program used to model both energy consumption and water used in buildings [39]. Heat energy requirement was calculated following TABULA indications and procedures reported in UNI part one [40], in this way, simulations results could be compared to TABULA results (Table 2), where the difference in energy requirement between the two models was in the order of 1% for each RBs.
These simulations calculated only the space heat requirements, the “useful energy”, while information about energy system typologies and the relative energy efficiencies were further inserted as input data in the energy planning tool.
The energy analysis performed under the previous assumptions is called “standard” evaluation, but to take in care occupant behavior, the intermittency of heating and the operating schedules of electrical equipment, it was necessary to relax the assumption made following the normative in previous simulation. In literature, several studies have considered the influence of occupant behavior on heat consumption [41,42]. In this paper this argument is not stressed, since the aim was to use reference building to simulate the entire built environment of the city, therefore taking into account a representative occupant behavior pattern. Internal gains as internal light, electrical equipment, and people were aggregated with a single operating schedule, called “internal gain schedule”. Hourly profile of the schedule was extrapolated from UNI 11300 part 1 [40], this was done in order to have a reliable hourly profile.
The simulation results showed a heat requirement of 160 kWh/m2/y for AB 1945–1960, 136 kWh/m2/y for AB 1961–1975, and 66 kWh/m2/y for AB 1976–1990.
The hourly simulation provided for each RB (Appendix B) has been normalized with gross heated volume of RB, as done in [43], and then multiplied for respective volumes (Table 1), creating the total heat profile 60% of the total DH heat demand.
To identify necessary retrofit interventions to comply with new energy efficiency requirements, the authors referred to the environmental energy appendix of building regulation of Turin [44]. In the Appendix A, two restriction levels to thermal insulation are described: the first level is about prescriptive limits, while the second one concerns incentive requirements (an economic incentive is settled for the buildings that satisfy a higher thermal insulation to further minimize the energy consumption). Heat loads can be reduced using materials with a low thermal transmittance; it is important to define a global strategy for building thermal insulation choosing a correct insulation material and relative thickness (insulation materials chosen related to prospect 2 in UNI:2015 [37], for hygrometric properties the reference was UNI:2008 prospect 4 [45]). It was assumed also that thermal bridges were corrected by retrofit measures.
Three scenarios were created to analyze the energy savings potential in buildings (Table 3):
-
Scenario WS: substitution of windows (U = 1.20 W/W, g,gl = 0.30)
-
Scenario SR (standard renovation): all building envelopes are insulated according to transmittance limits in Level 1 [39]
-
Scenario AR (advance renovation): all building envelopes are insulated according to transmittance limits in Level 2 [39]
The WS scenario allows the possibility of reaching a 10% of energy savings with respect to base scenario, 80% with the SR, and 88% with AR, considering the application of the energy saving interventions to all the volume connected to DH represented by the RBs (30.7 Mm3).

3.2. Modeling District Heat Hourly Profiles

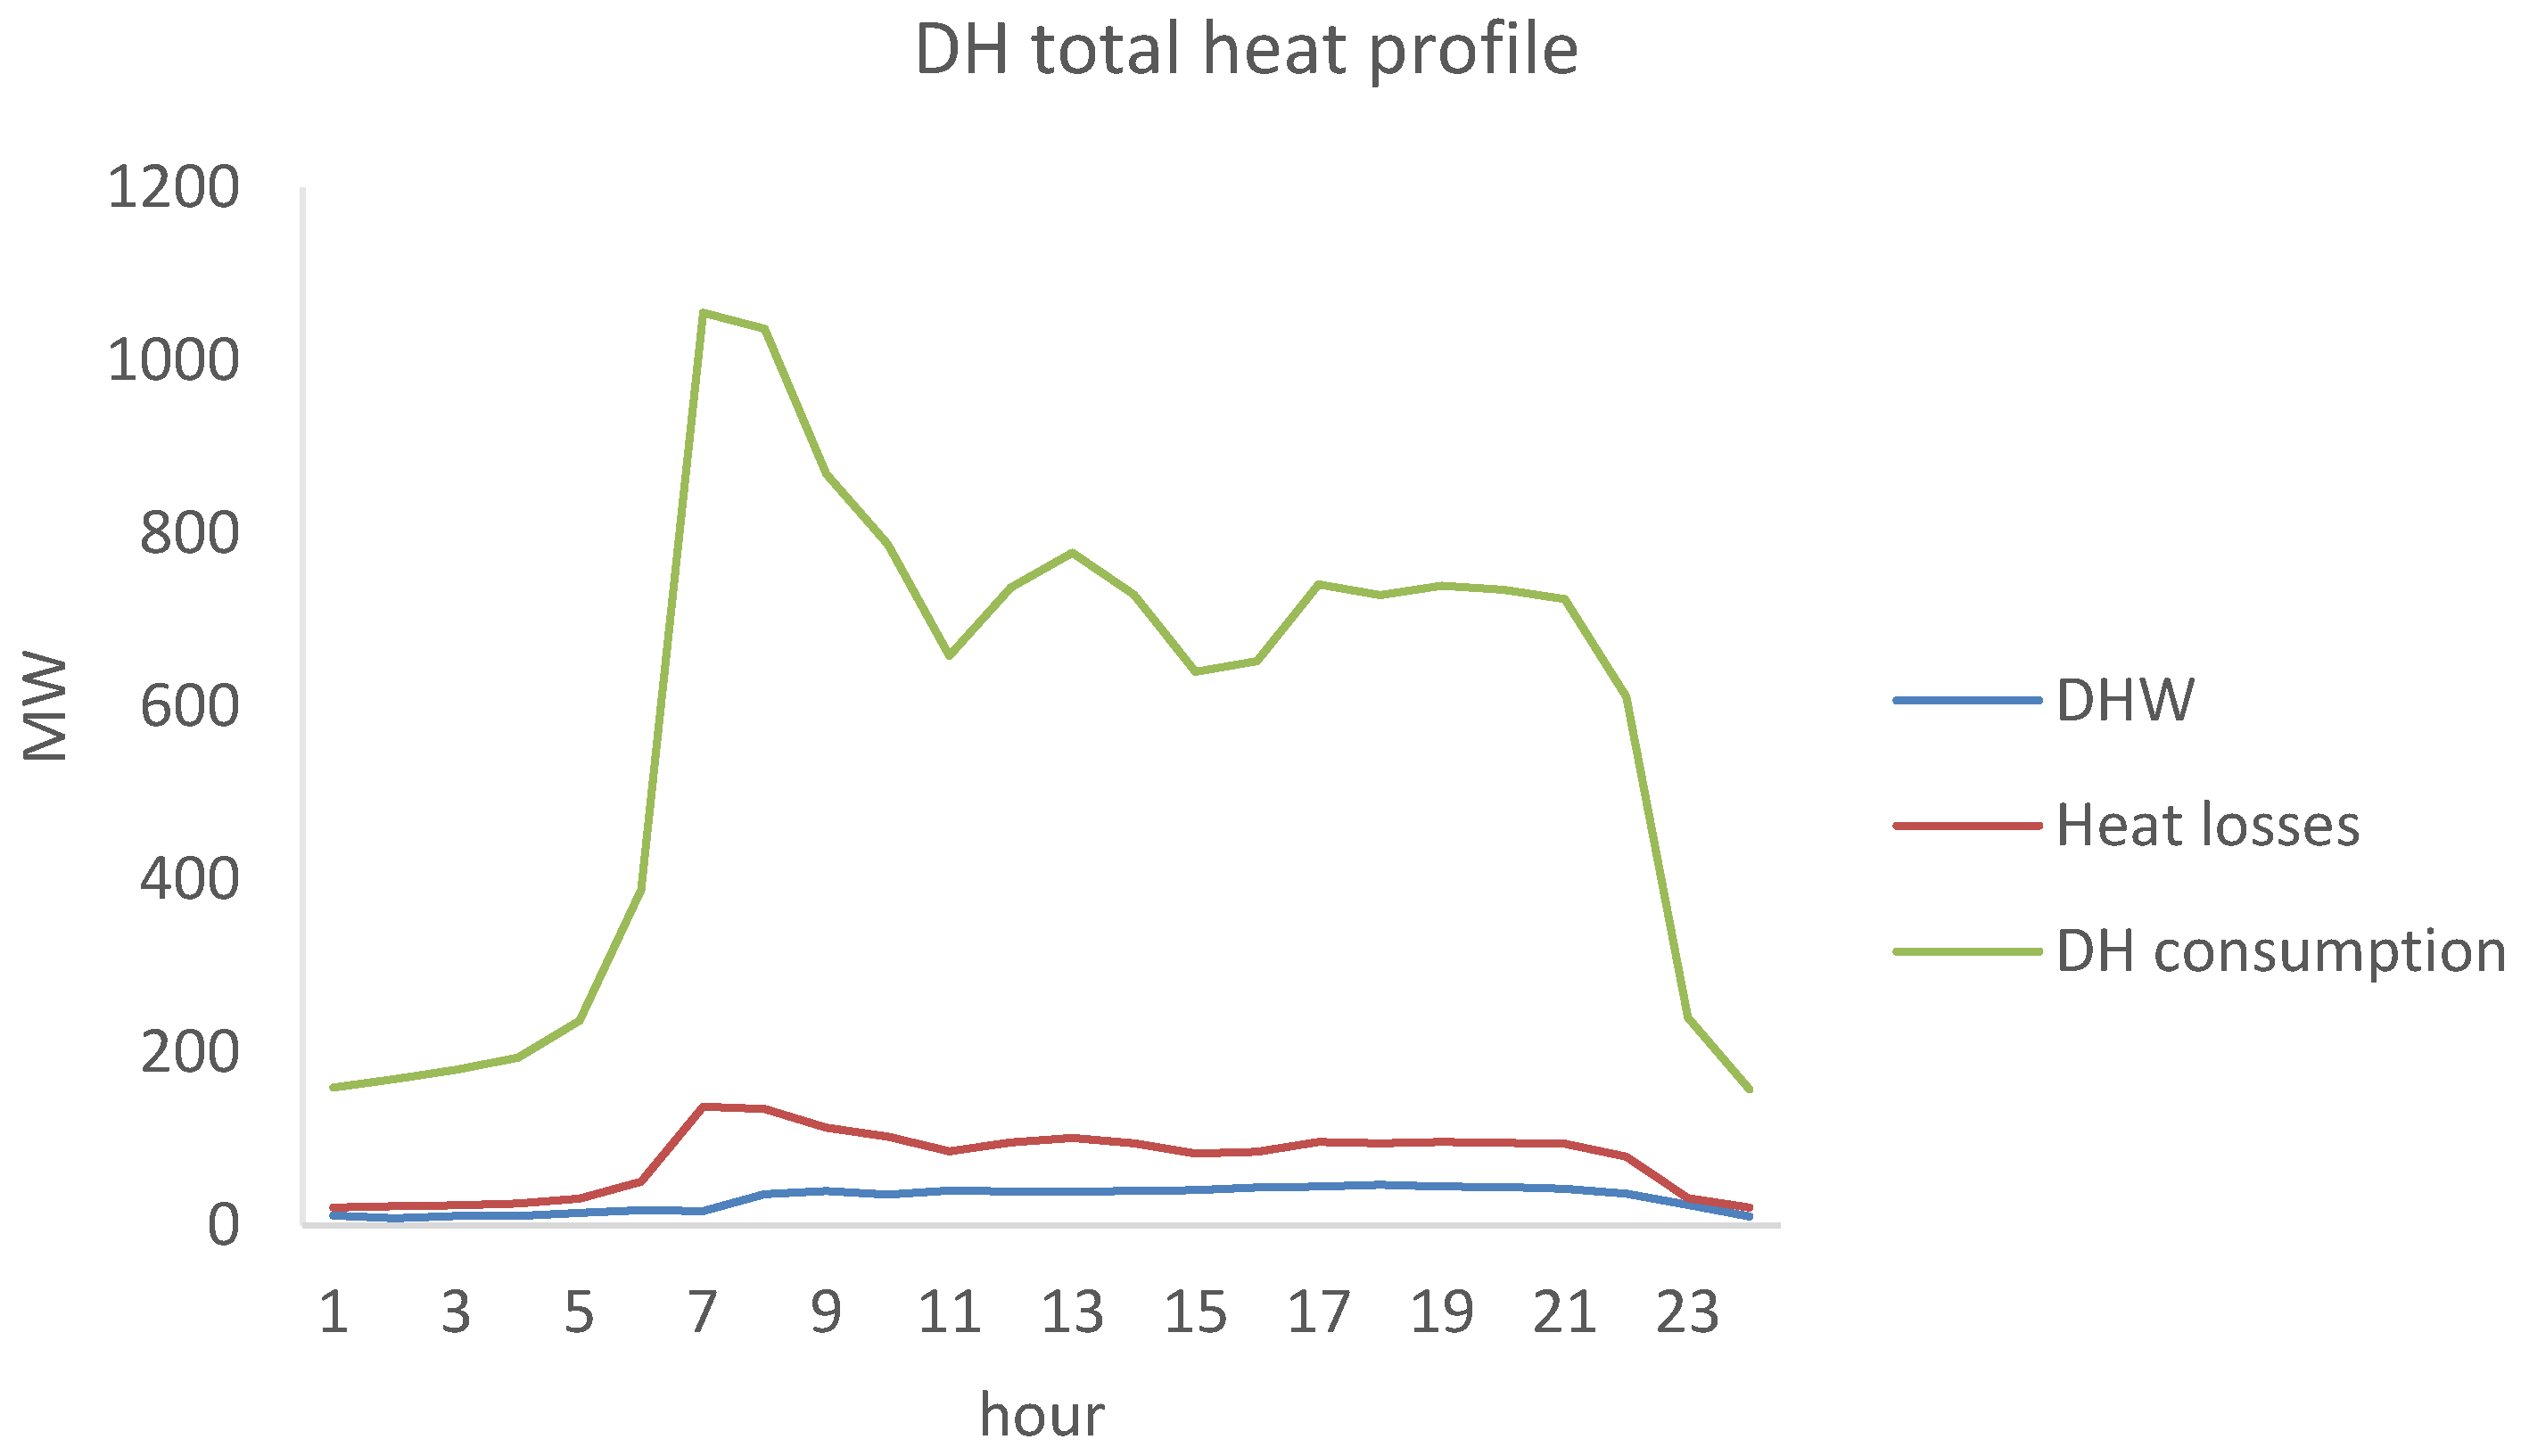
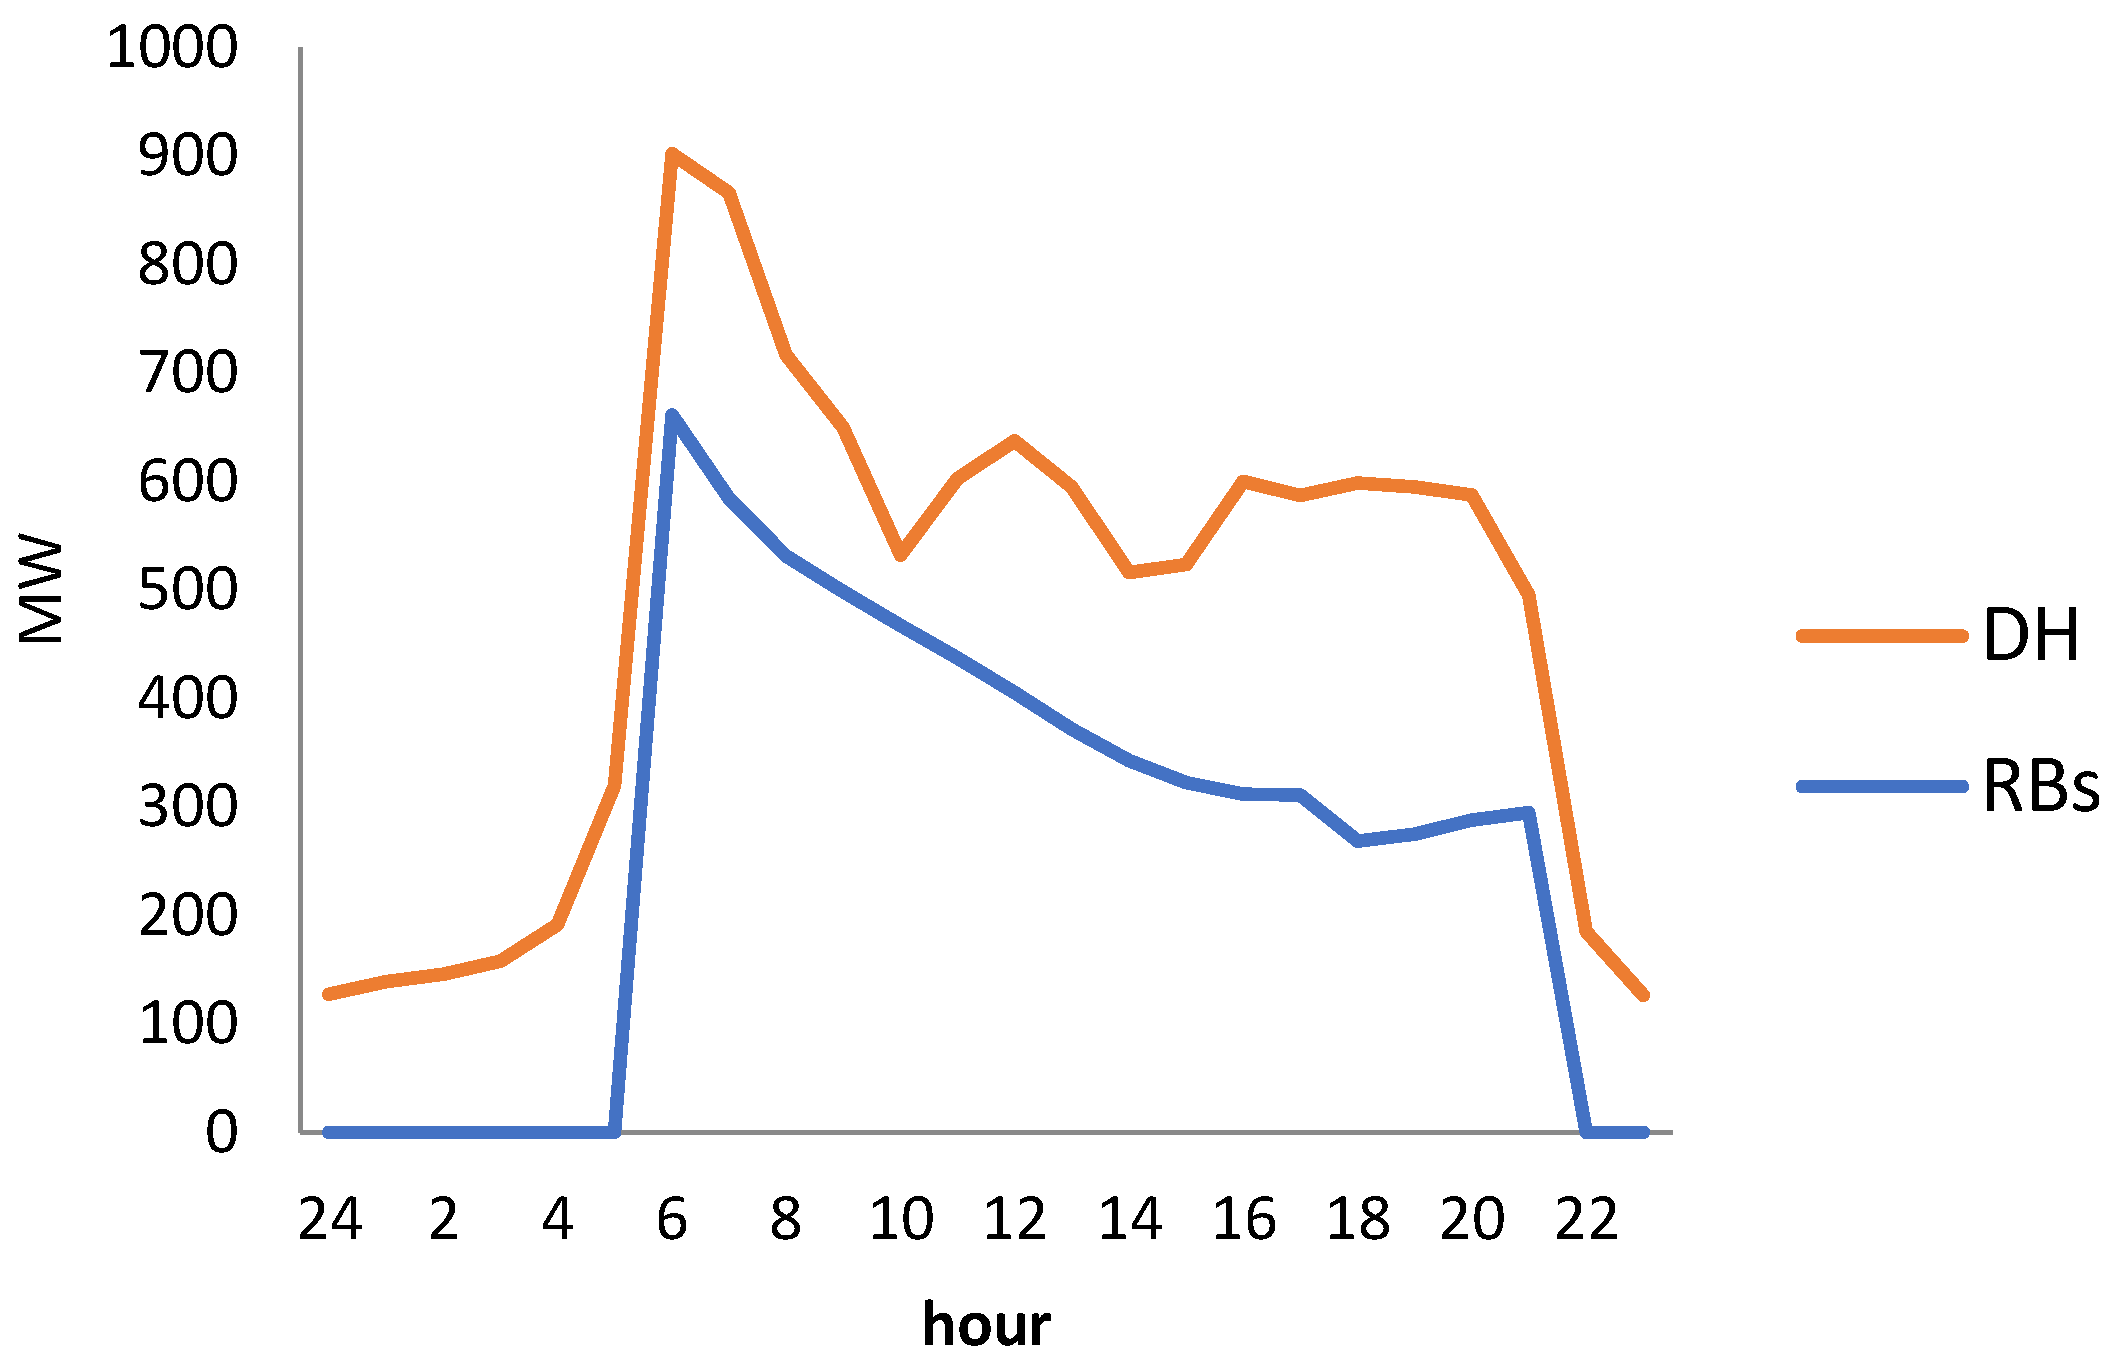
As a second step, the estimated total heat consumption needed to be calibrated to match the urban energy balance allocated to space heating and district heat production. At first, local district heat production was characterized. By analyzing DH real operational data for the years 2012, 2013, and 2014, average heat losses in the network resulted equal to 10% of total heat production. For district heated buildings, the DH quota dedicated to domestic hot water (DHW) was derived by analyzing the summer load; in particular, the average profile of a summer day (in which the heating systems are off according to the Italian normative) was extrapolated from DH real data and chosen as reference for DHW needs and assumed equal for every day of the year. The calculated DHW demand and the losses were subtracted from the total DH demand. By doing this, the remaining DH heat consumption could be compared to the heat profile created through RB simulations (Figure 4).
Although considering standard values comports uncertainties because both internal loads and infiltration rates are largely influenced by the occupant’s behavior (they can vary from building to building, but also from floors of the same building), as analyzed in [46], using a dynamic simulation tool is the best solution for taking into consideration occupant’s behavior. Figure 4 validates the results from the reference building simulation, with the simulated heat profile (blue line) being almost 60% of the total DH profile (red line).
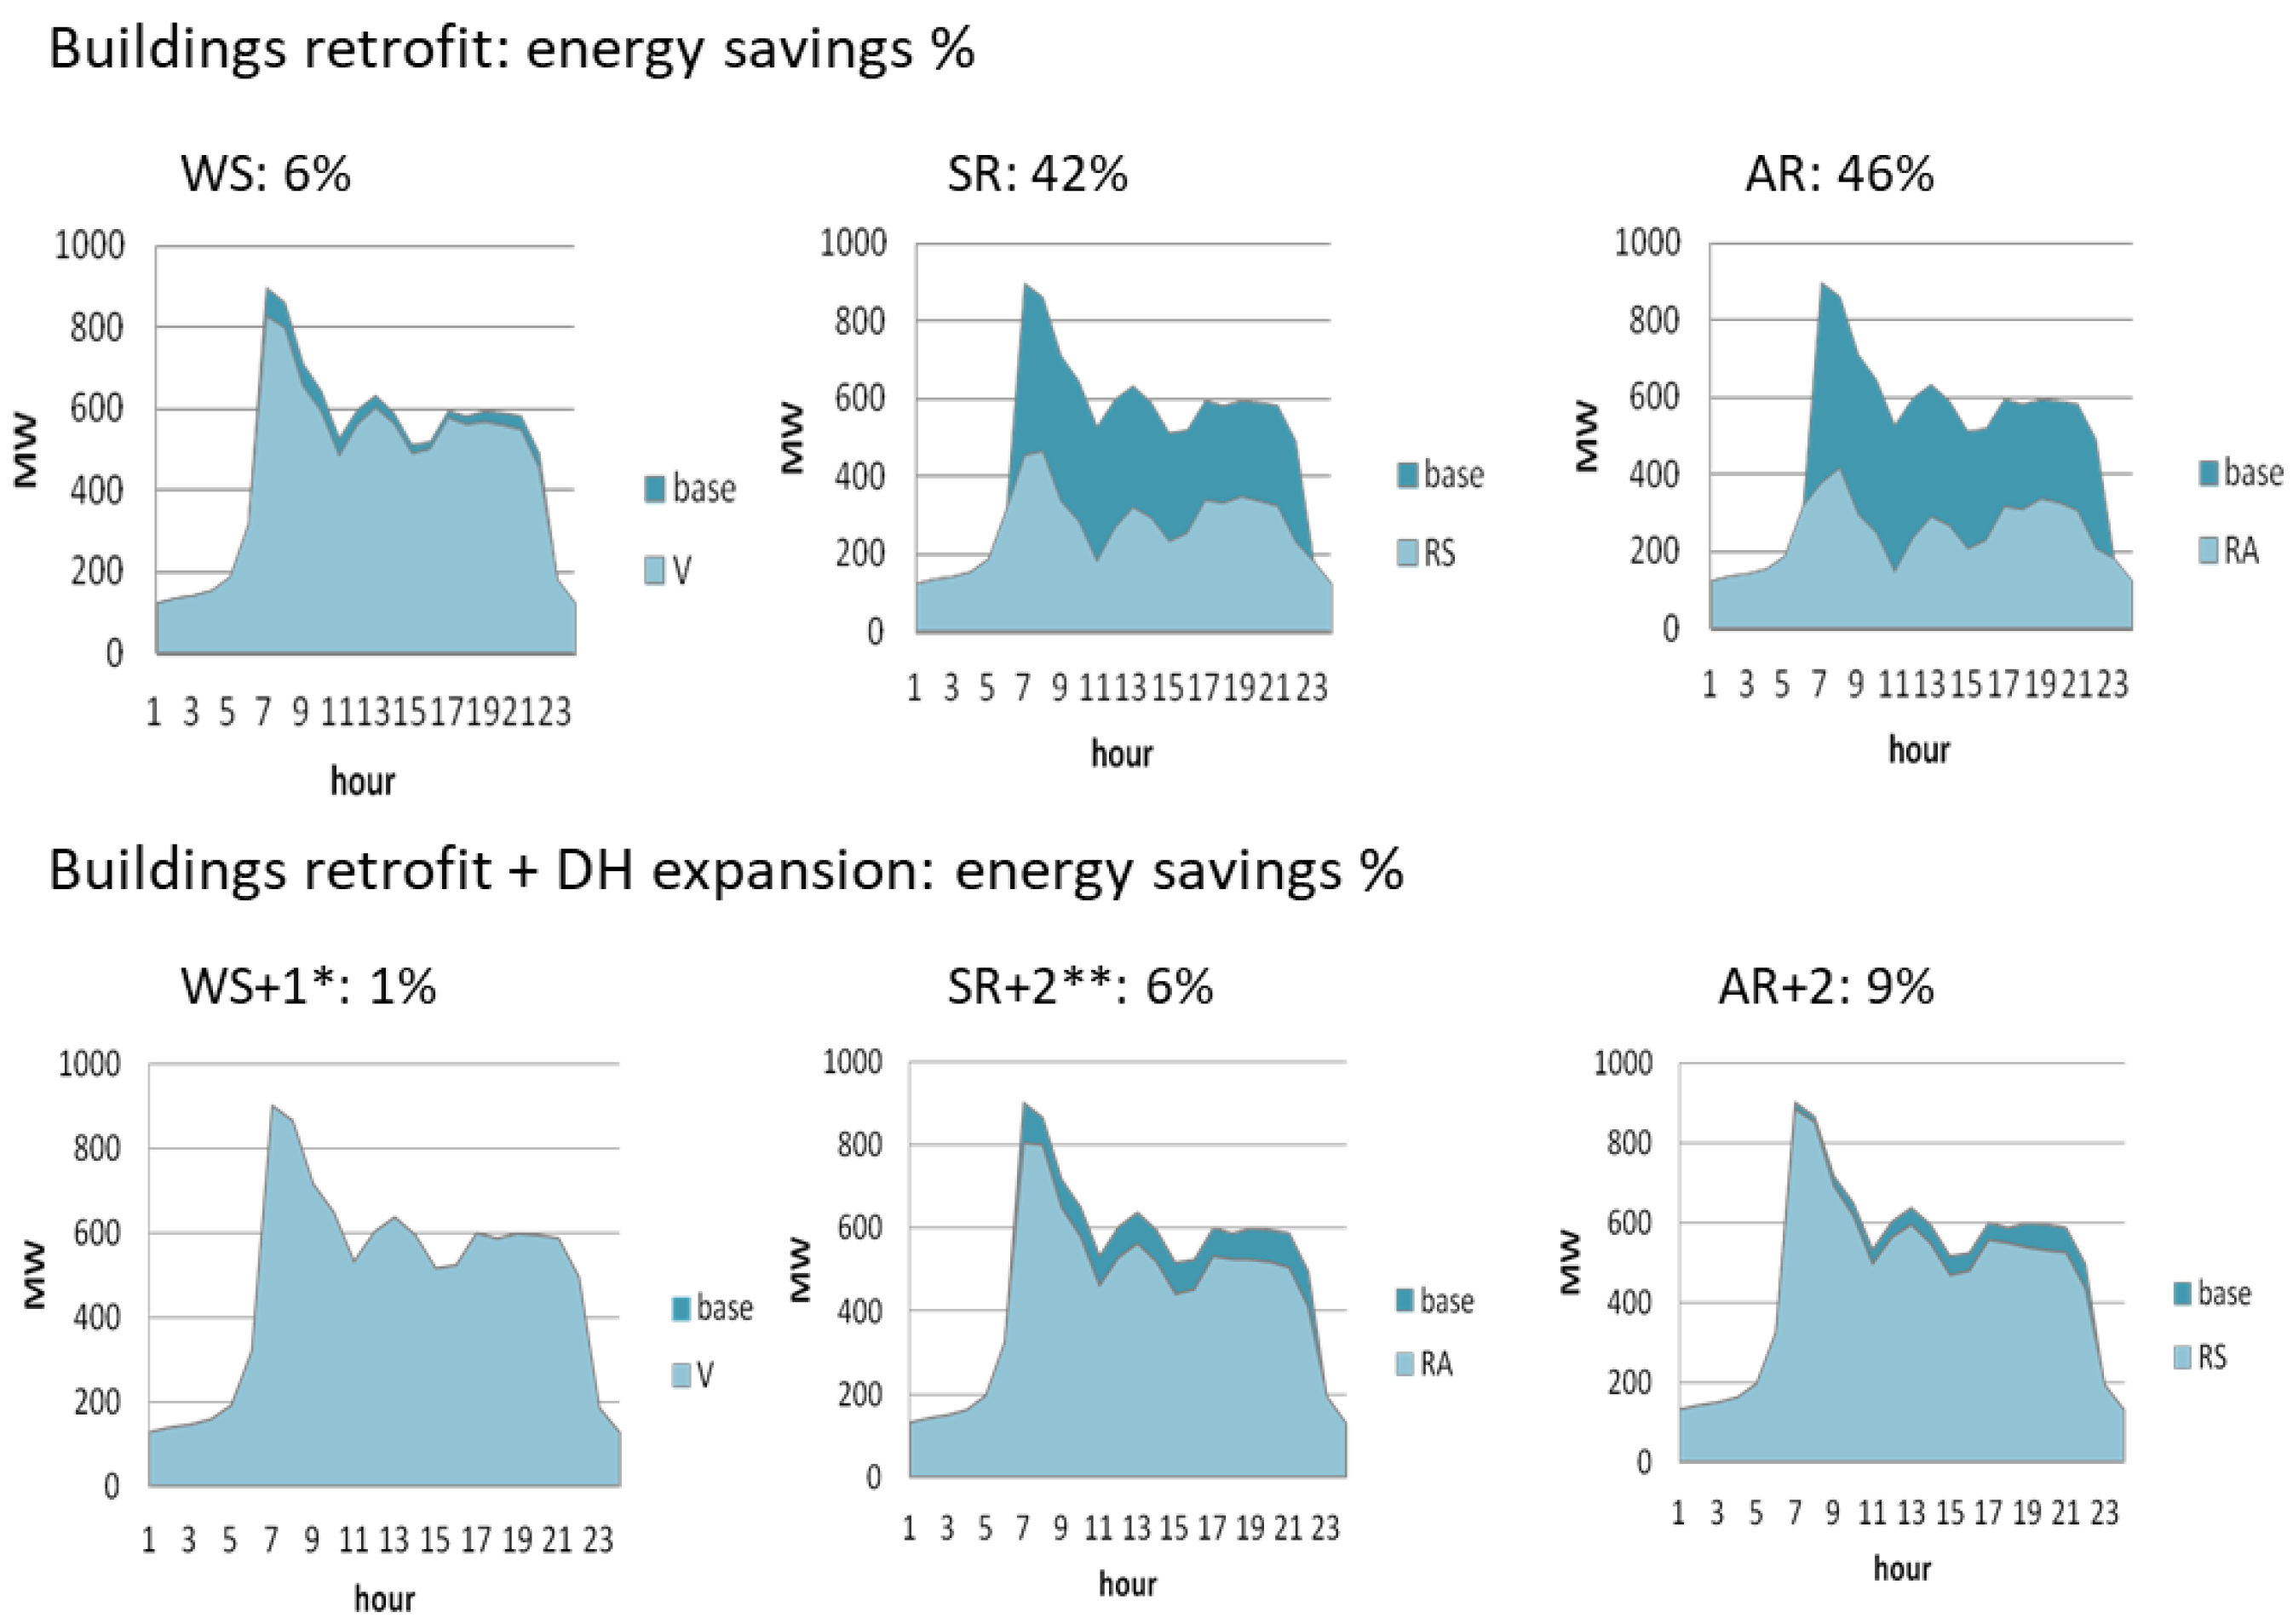
Building volumes not connected to DH were considered heated by individual boilers, and with the same method heat profiles were created. Retrofit actions (WS, SR, AR) were gradually analyzed in the same way, and different heat load profiles were compared to DH real data (Figure 5).
The decrease of heat consumption comporting an increase in heat loss was determined according to Equation (1) [47]. This equation for the estimation of heat losses was previously applied to the same network as in [26,28,48].
y = 0.7321 − 1.221x + 0.6462x2 if x < 1
y = 0.1773 − 0.014x if x > 1
in which y = loss (%) and x = linear heat density in MWh/m.
Considering 500 km of pipelines, linear density and the correlated heat losses were calculated for each building’s energy saving scenario. In the year 2017, the linear density was equal to 3.5 MWh/m, and it decreased in each scenario. With a line density lower than 2 MWh/m, heat losses were considered too high and the DH network became not convenient. SR and AR scenarios provided a linear density lower than 2 MWh/m, which means 15% of heat loss—to increase the linear density up to 2 MWh/m, network expansions scenarios were associated with retrofit measures for each scenario. For the WS scenario, a lower network expansion was considered, equal to 2.9 Mm3, and for SR and AR a higher expansion was supposed, equal to 19.5 Mm3 (the remaining volume of all buildings with individual heating). This kept the linear density higher than 3 MWh/m in each scenario, and maximum heat losses were in the order of 13%. The heat losses were added to the heat profile consumption of DH and individual buildings and, together with DHW consumption, the heat load profile as input for thermal plant was created (Figure 5).

3.3. Energy Savings Costs

Costs associated to energy savings measures were derived from “Prezzario Regione Piemonte 2016” [49]. For each RB, 3 different costs analyses were done, one for each type of building retrofit option (WS, SR, AR). Cost included: construction material/technology cost, installation, and manpower costs.
Analyses with EnergyPLAN also required energy prices and investment cost data as input (investment, operations, fixed and variable maintenance, and manpower costs). Fuels cost, handling costs, and variable operations and maintenance (O&M) costs were also required for each type of technology, together with the eventual CO2 price and the discount rate (this was assumed equal to 3%). The additional costs, as energy savings measures and network expansion, were inserted in EnergyPLAN in terms of total annual cost (Appendix A).

3.4. Global Cost Analysis

The total annual cost provided by EnergyPLAN (according to Equation (2), as reported in [50]) related to a single year in which all investments were supposed to be applied. In this way, it was possible to compare different annual costs provided from different energy efficiency investments, to understand which is the most profitable solution among the considered options.
Ainves = (Cinvest * i)/(1 − (1/(1 + i)n))
with Cinvest = investment costs; i = interest; n = lifetime.
Each investment with a different lifetime could therefore be compared as an equivalent annual cost. Total annual costs (M€/yref) were therefore derived by summing Ainves with fixed and variable annual costs.
To analyze the global cost of each scenario, according to a more realistic distribution of the investment along the timeline, the methodology in [28] and in [14] was followed: a time period horizon was defined (2017–2050) and divided into 3 period steps (2017–2025, 2025–2035, 2035–2050).
The renovation rate of buildings was set equal to 3% for each year starting from 2018, while DH expansion was planned with a year rate of 4% starting in 2025 (Table 4). Investments in thermal plants were planned according to the end-life of each system based on starting year [51,52], as explained in Table 5.
Building renovation rate and DH expansion rate were used to create a heat distribution demand for DH and individual buildings for each time step. Time periods were simulated considering a linear CO2 cost and natural gas cost evolution, as explained in Section 3.5.
Variable annual costs and fixed annual costs for the three periods were assumed considering a discount rate of 3%; a present value factor (Ri) was calculated for each mid-year of the rime periods (4, 13, 25.5), and the total discounted cost at 2017 was calculated according to Equation (3).
Ctot = ∑(i = 1) ^ (n = 3) [(Cinv(RB,i) + Cinv(dh,i) + (Cfix(i) + Cvar(i)) * t) * R(i)]
with Ctot = total cost discounted at 2017 level, Cinv(RB,i) = investment cost for building retrofit on period i, Cinv(dh,i) = investment cost on DH expansion and heat supply on period i, Cfix and Cvar = fixed and variable costs (€/y) on period i provide from EnergyPLAN, t = years in period I, R(i)= present value factor for mid-year of each time step.

3.5. Heat Supply Scenario

The existing synergy between district heating expansion and buildings’ energy retrofit interventions has been demonstrated in several studies [19,20,28]. The production of heat in the DH system is possible through several options: renewable energies (e.g., solar and geothermal), heat pumps, conventional fossil fuels, or even by exploiting waste heat from industrial processes. Taking into account the current heat generation mix of the Turin DH system (more than 90% heat production based on gas cogeneration plants), this study focused its attention on combined heat and power (CHP) technologies and on the integration of large-scale heat pumps and storage. Two scenarios were analyzed, according to [28], considering already planned power plant installation (biomass CHP) and commercial available capacities. In future scenarios, CHP plants could operate to balance the electricity needs of heat pump.
-
MOD: moderate scenario, decommission of 260 MWth of natural gas CHP in 2030, replaced by 105 MWth of heat pump, 106 MWth of biomass CHP, and 150 MW of natural gas CHP.
-
ADV: advanced scenario, decommission of 260 MW of natural gas CHP, replaced by 250 MWth of heat pump, 106 MWth of biomass CHP, and 530 MW of daily thermal storage.
Biomass CHP was chosen considering the huge availability of biomass, given that the city of Turin is close to the mountain communities, though an analysis on local emissions should be explored.
To compare the proposed demand–supply options with a scenario reflecting current trends, a business as usual (BAU) scenario was considered (any change in heat consumption and production). This scenario was used as a reference to be compared with the other simulations in terms of energy savings, total primary energy supply (TPES), CO2 emissions, and total annual cost for year 2050. In the BAU scenario, costs for maintenance and replacement of current power plants after the end of their technical lifetime and power plant investment costs were considered, while change in fuel prices and CO2 price were considered following the same assumptions as the ones made in the Stratego project [22], assumed equally suitable for an Italian context. A linear growth was considered for the carbon price in the scenario timeline, starting with the assumption of a carbon price equal to 6 €/tCO2 in 2017, as reported in [53], and an optimistic carbon price of 25 €/tCO2 for 2050, following the hypothesis made on Heat Roadmap 2050, in which a price of 20–30 €/tCO2 is expected. By combining scenarios on retrofit measures with scenarios on heat generation, different integrated scenarios were created up to 2050 (Table 6).
Hourly consumption profiles obtained for individual buildings in the previous section were used as input in EnergyPLAN for describing the future evolution of the heat demand, starting from the current DH real profile provided by the local utility assumed as reference for the scenario BAU. Individual heating systems were considered as supplied by natural gas boilers with an average efficiency of 0.85. Each cost was introduced in the base year simulation for 2017, and a technical optimization (optimizing capacity sizing and energy use) was performed.
The final heat demand (district heated buildings plus individual heating) was 2.65 TWh/y, 1.99 TWh/y for DH and 0.66 TWh/y for individual heating (19.5 Mm3). DH demand was supplied by natural gas CHP (1.93 TWh/y) and natural gas boilers (0.06 TWh/y). Total primary energy supply (TPES) was equal to 6.19 TWh/y, disaggregated into 5.41 TWh/y for CHP + boilers and 0.78 TWh/y for individual heating. The primary energy supply was calculated as the fuel consumptions needed from the energy technologies to satisfy the energy demand of the system. The fuel consumption of the plants was calculated by the model considering technologies’ efficiencies. CO2 emissions were 1.250 Mt, and total annual cost (including investment cost, fixed and variable cost, fuel cost, and carbon price) was 295 M€/y.
Three different buildings retrofit scenarios with two different levels of DH expansion options were compared for three different heat supply mixes (Table 7).
The scenarios A, B, and C consider the same supply configuration as the BAU scenario, integrating 3 different level of building retrofit. The introduction of a biomass CHP and heat pump (HP) of the MOD heat supply scenario correlated with the building retrofits in scenarios D (windows substitution), E (standard renovation), and F (advanced renovation). The same retrofits were considered for scenarios G, H, and I, together with ADV heat supply scenarios.
As first analysis, the total annual cost of these scenarios was analyzed for the timeline 2017–2050 according to Equation (3).
4. Results

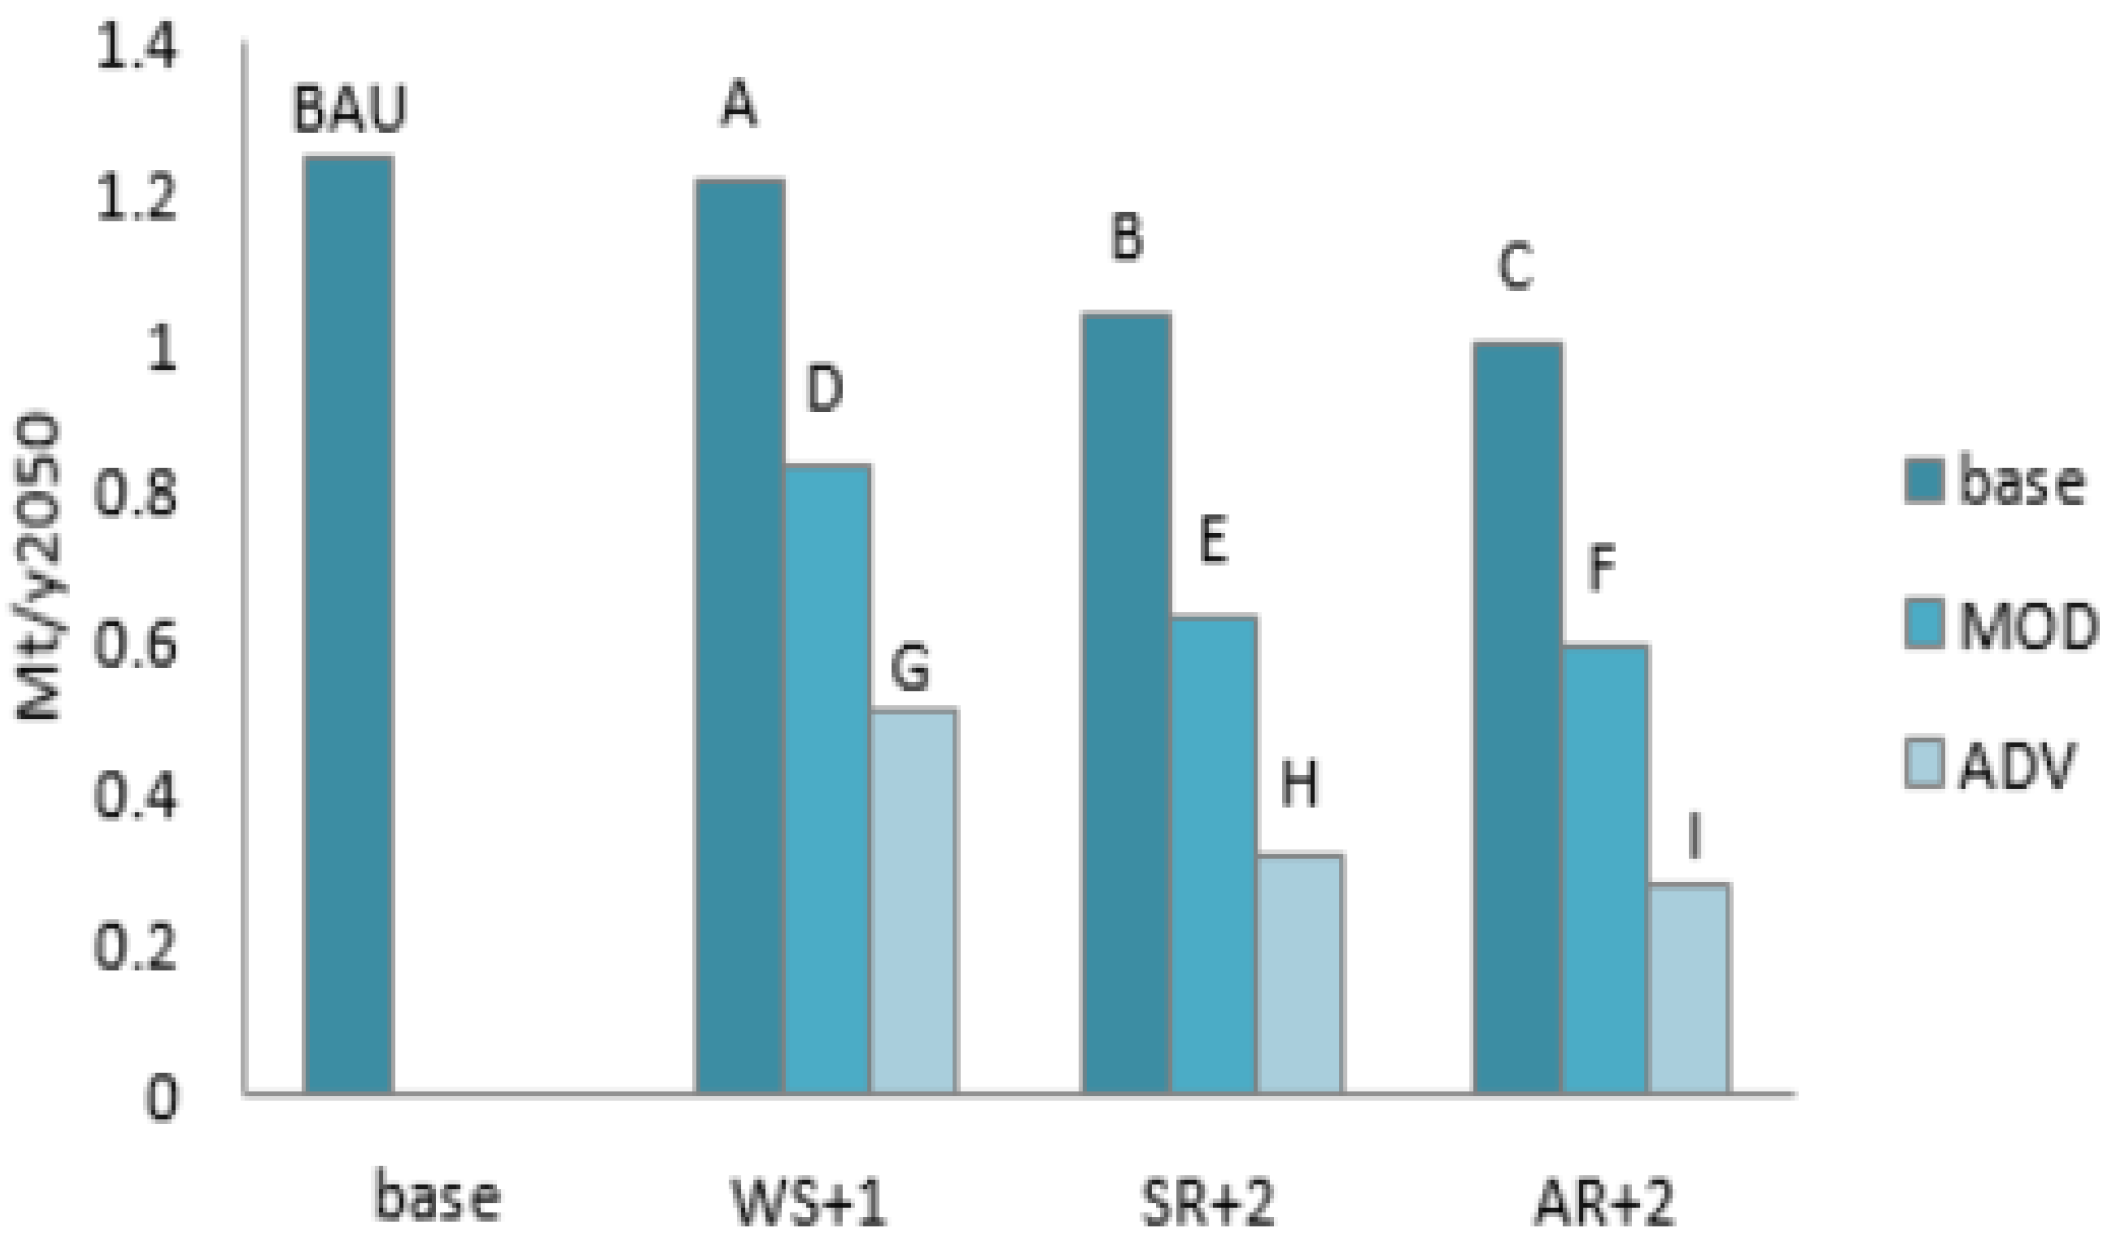
At first, the achievable CO2 emission reduction considering buildings retrofit together with DH expansion without changing in heat supply was analyzed (A, B, C). Compared to the BAU scenario, this reduction is equivalent to 2% for A, 15%, for B and 18% for C (Figure 6). However, demand side measures alone are not enough to achieve 40% emission reductions to 2030, as requested by [54].
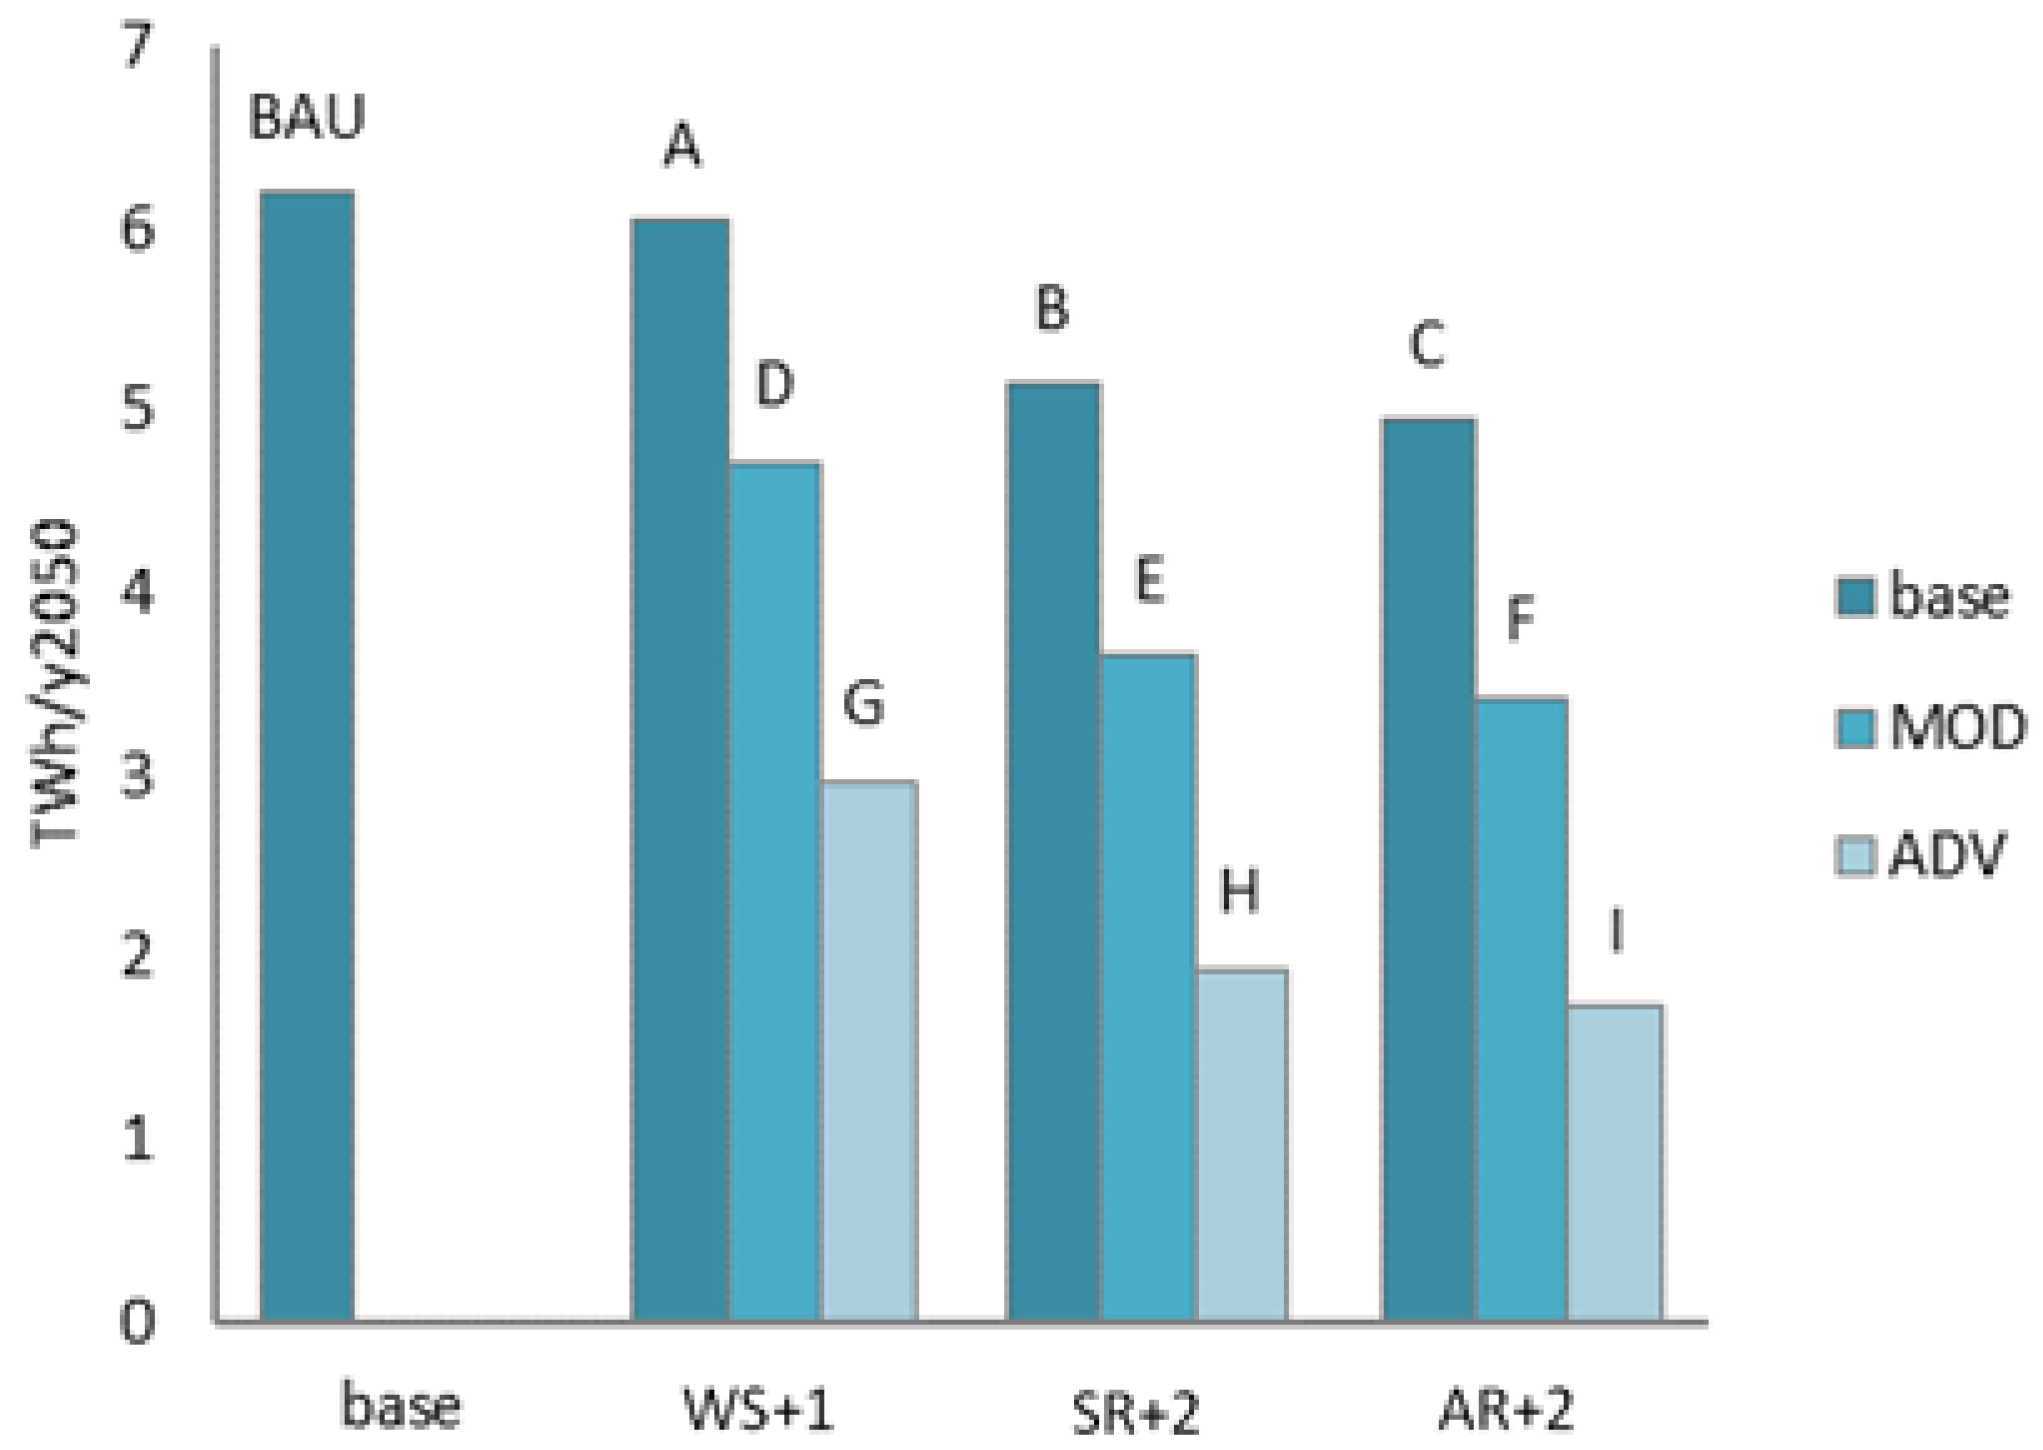
Assuming a “moderate change” in the heat generation mix (MOD scenario) can allow a higher reduction in CO2 emissions (42%) and TPES (40%), thanks to the integration of heat pumps (HP) and the biomass CHP, relying on low carbon electricity (2050 carbon intensity equal to 0.66 Mt/y), maintaining a natural gas CHP working for 57% of the time in cogeneration mode for heat production. The annual operating time of CHP higher than 4000 h can assure a positive profit for the investment. The optimization algorithm coordinates electricity production by CHP units to heat pumps’ heat generation—CHP operation follows the electricity need of HP and heat storages are used to store CHP heat production excess. This optimization is related to the decision of balancing only the heat consumption, in future studies it might be interesting to study the impact on the electricity market as well. Furthermore, CHP production is primarily satisfied by biomass CHP to reduce the CO2 emissions. Natural gas consumption and related carbon emissions decrease further with a higher integration of heat pumps in the ADV scenario. Together with the energy savings due to building retrofit measures, the integration of heat pump in MOD scenario guarantees 21% of TPES reduction, while ADV scenario with 250 MW of heat pumps allows a TPES reduction of 49% (Figure 7).
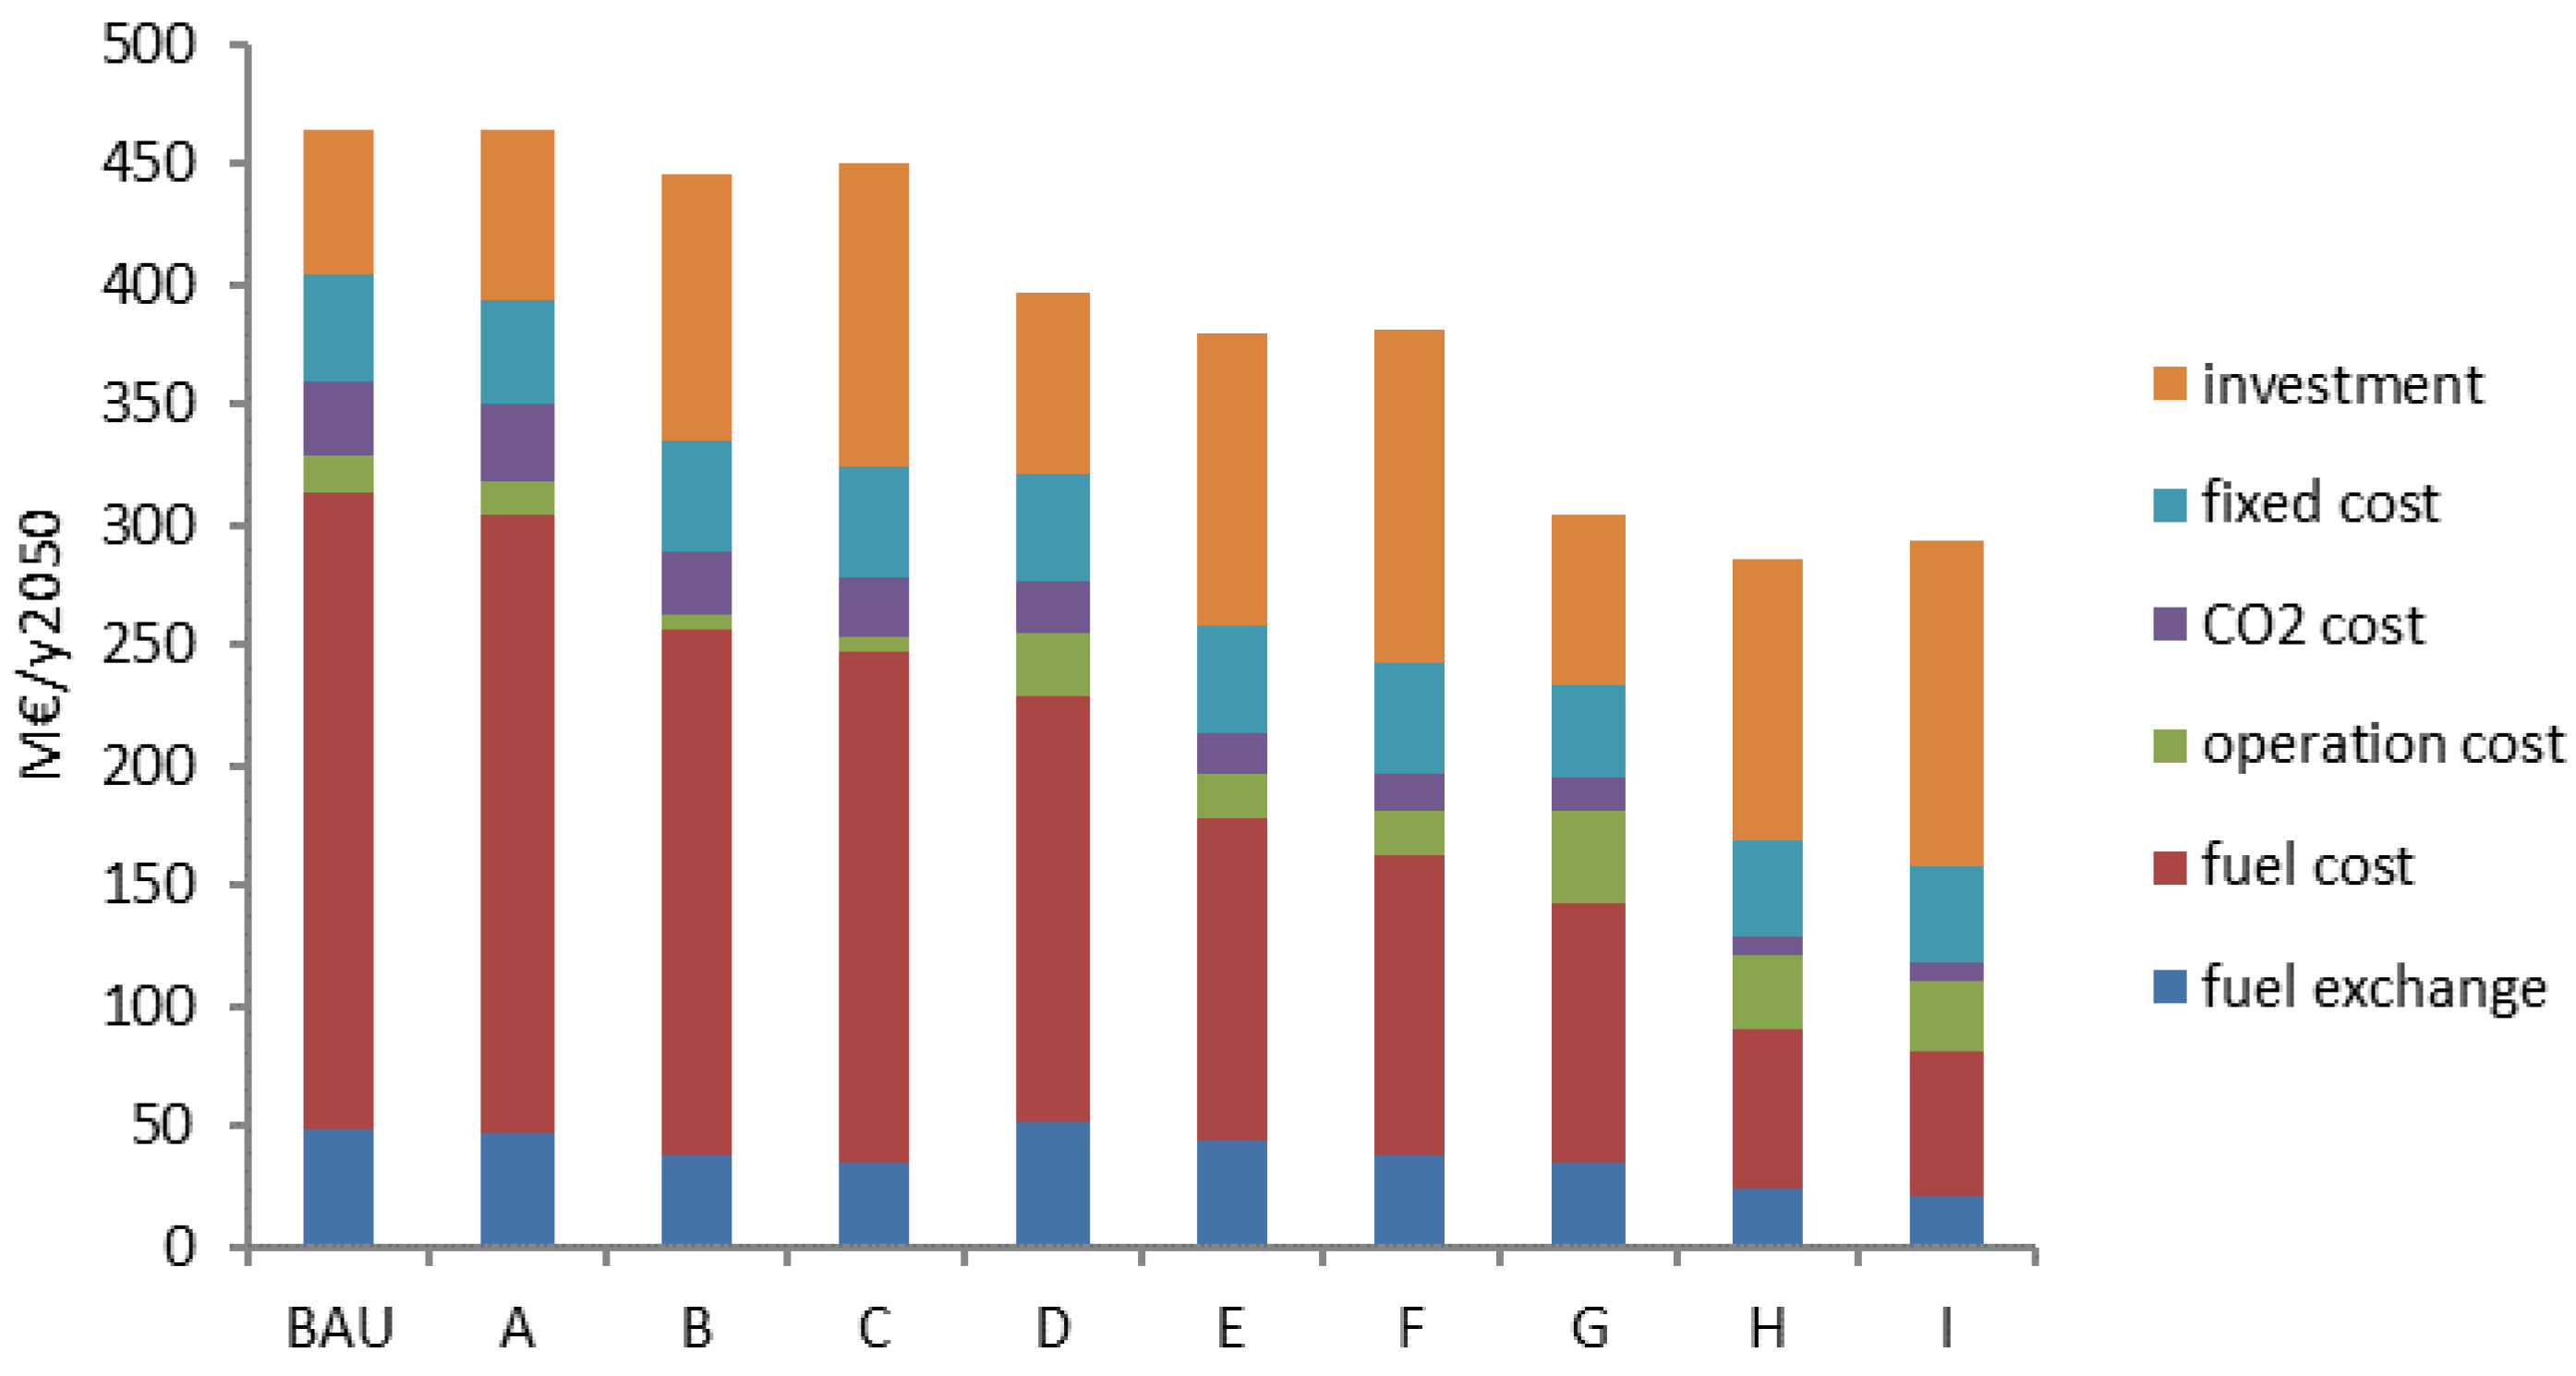
Cost outputs were further analyzed (Figure 8) in order to understand to what extent each intervention influences the global cost. In the BAU scenario, total annual costs would be around 460 M€/y in 2050. Fuel cost is the prevalent cost item, covering 58% of total annual costs for BAU.
Compared to the BAU scenario, each intervention regarding change in heat production (D, E, F, G, H, I) connected with a reduction in heat demand provides a cost decrease. In the scenarios without changes in heat production (A, B, C), fuel costs represent 51% of total costs. In MOD scenarios (D, E, F), this cost voice decreases to 39% and it reaches a minimum value of 27% in ADV scenarios (G, H, I). Lower fuel costs due to fuel shifting in heat production mitigate investment costs for buildings retrofit and for heat generation interventions.
The ADV scenario with standard renovation in buildings, together with DH expansions, provides lower costs with respect to all the other scenarios simulated. Compared to a standard renovation, an advanced renovation on buildings comports a higher reduction in heat consumption, but also higher investment costs. These investment costs are not offset by the savings, highlighting the critical role of defining correct retrofit measures for existing buildings. Meanwhile, considering the very old building stock and the presence of a district heat network, a standard retrofit scenario (H) can provide a better balancing between new investment costs and decreasing costs as a consequence of energy savings measures.
Results from energy system simulations show the synergy between buildings’ retrofit interventions and changes in district heating, in terms of network expansion and heat production configuration. From a planning perspective, combining buildings’ energy savings with DH expansion strategies, together with the integration of cleaner heat generation technologies as heat pumps, allows significant reductions in terms of CO2 emission, total costs, and primary energy supply. Larger interventions compared to baseline, as the one proposed in the H scenario, could allow reaching reductions of 78% in CO2 emission (corresponding to a reduction of 970 MtCO2/y) and of 72% in TPES, with benefits in terms of annual costs equivalent to 150 M€/y.
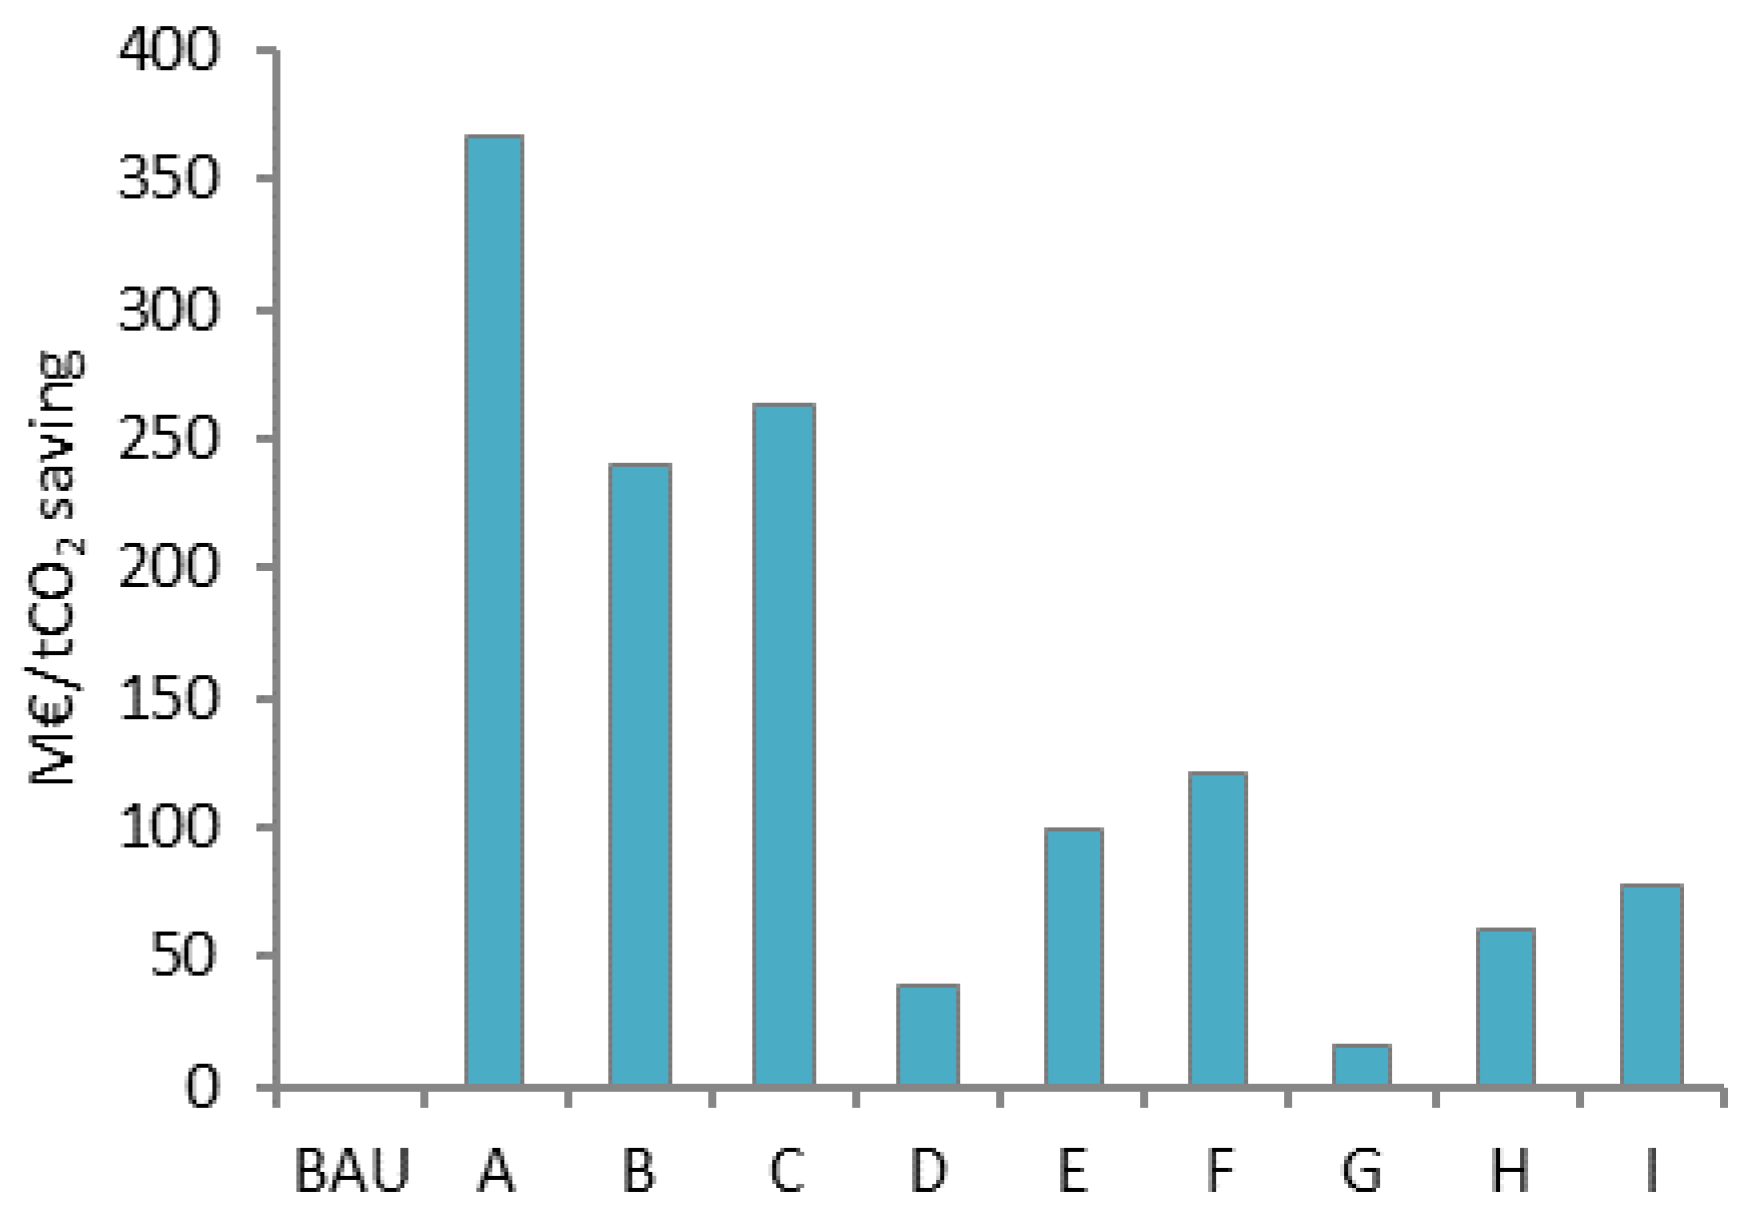
To understand which is the overall marginal cost for the energy system decarbonization in the different scenarios, a “decarbonization cost” Cdec (€/tCO2) was calculated, as in Equation (4).
Cdec (i) = (Cin (i) − Cin(BAU))/(CO2(BAU) − CO2 (i))
With Cin(i) = investments costs for scenario i, Cin(BAU) = investment costs in the BAU scenario, CO2(i)= CO2 emission in scenario i, CO2(BAU)= CO2 emission in BAU scenario.
The decarbonization cost is the rate between the increasing in investment cost and the CO2 reduction due to low-carbon measures. It can be used as an index to identify cost-effective decarbonization investments.
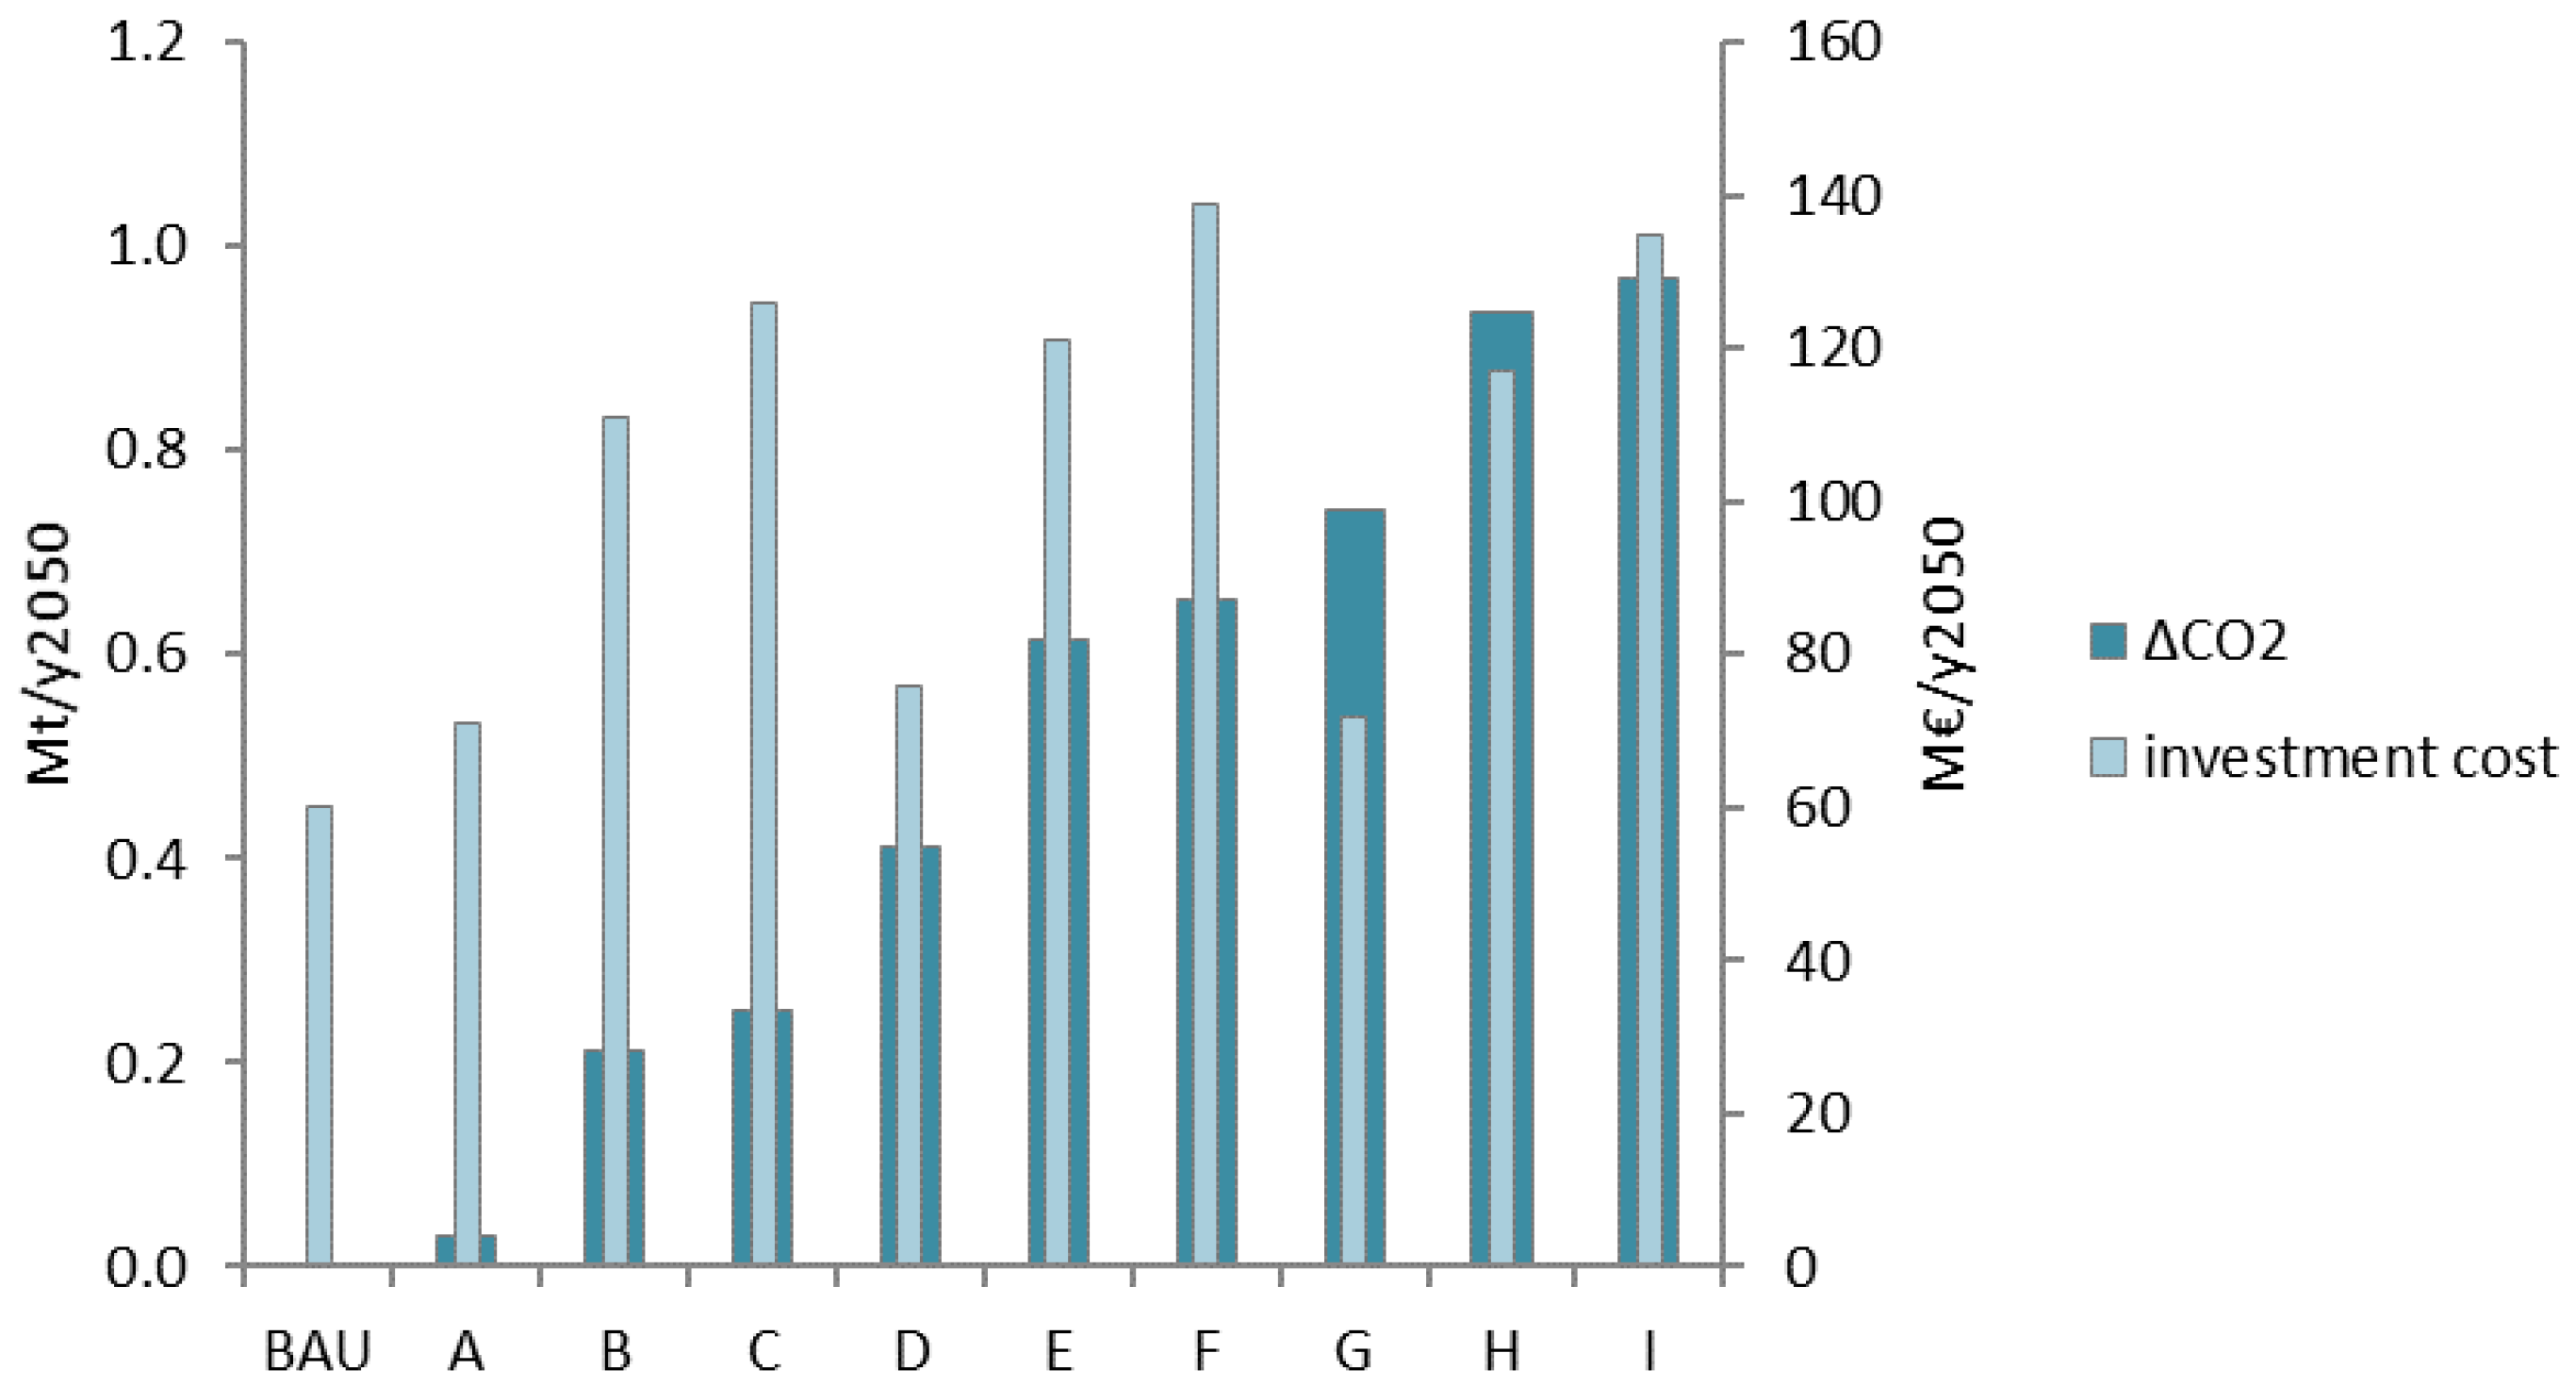
From the results, it is possible to affirm that for scenarios with change in the heat Supply (D–I) the decarbonization cost is lower than 100 €/tCO2 saving, while for scenarios A, B, and C (no change in the heat production mix, but progressive demand reduction thanks to building renovation) the decarbonization cost is almost triple compared to integrated solutions involving the MOD and ADV scenarios (Figure 9 and Figure 10). In scenarios A, B, and C, investment costs are higher than in BAU due to building retrofits, but CO2 reduction is not enough to justify investments. This consideration is key for building stock retrofits, where the potential for deep retrofit intervention is often limited by technical feasibility or affordability, which needs to be properly defined.
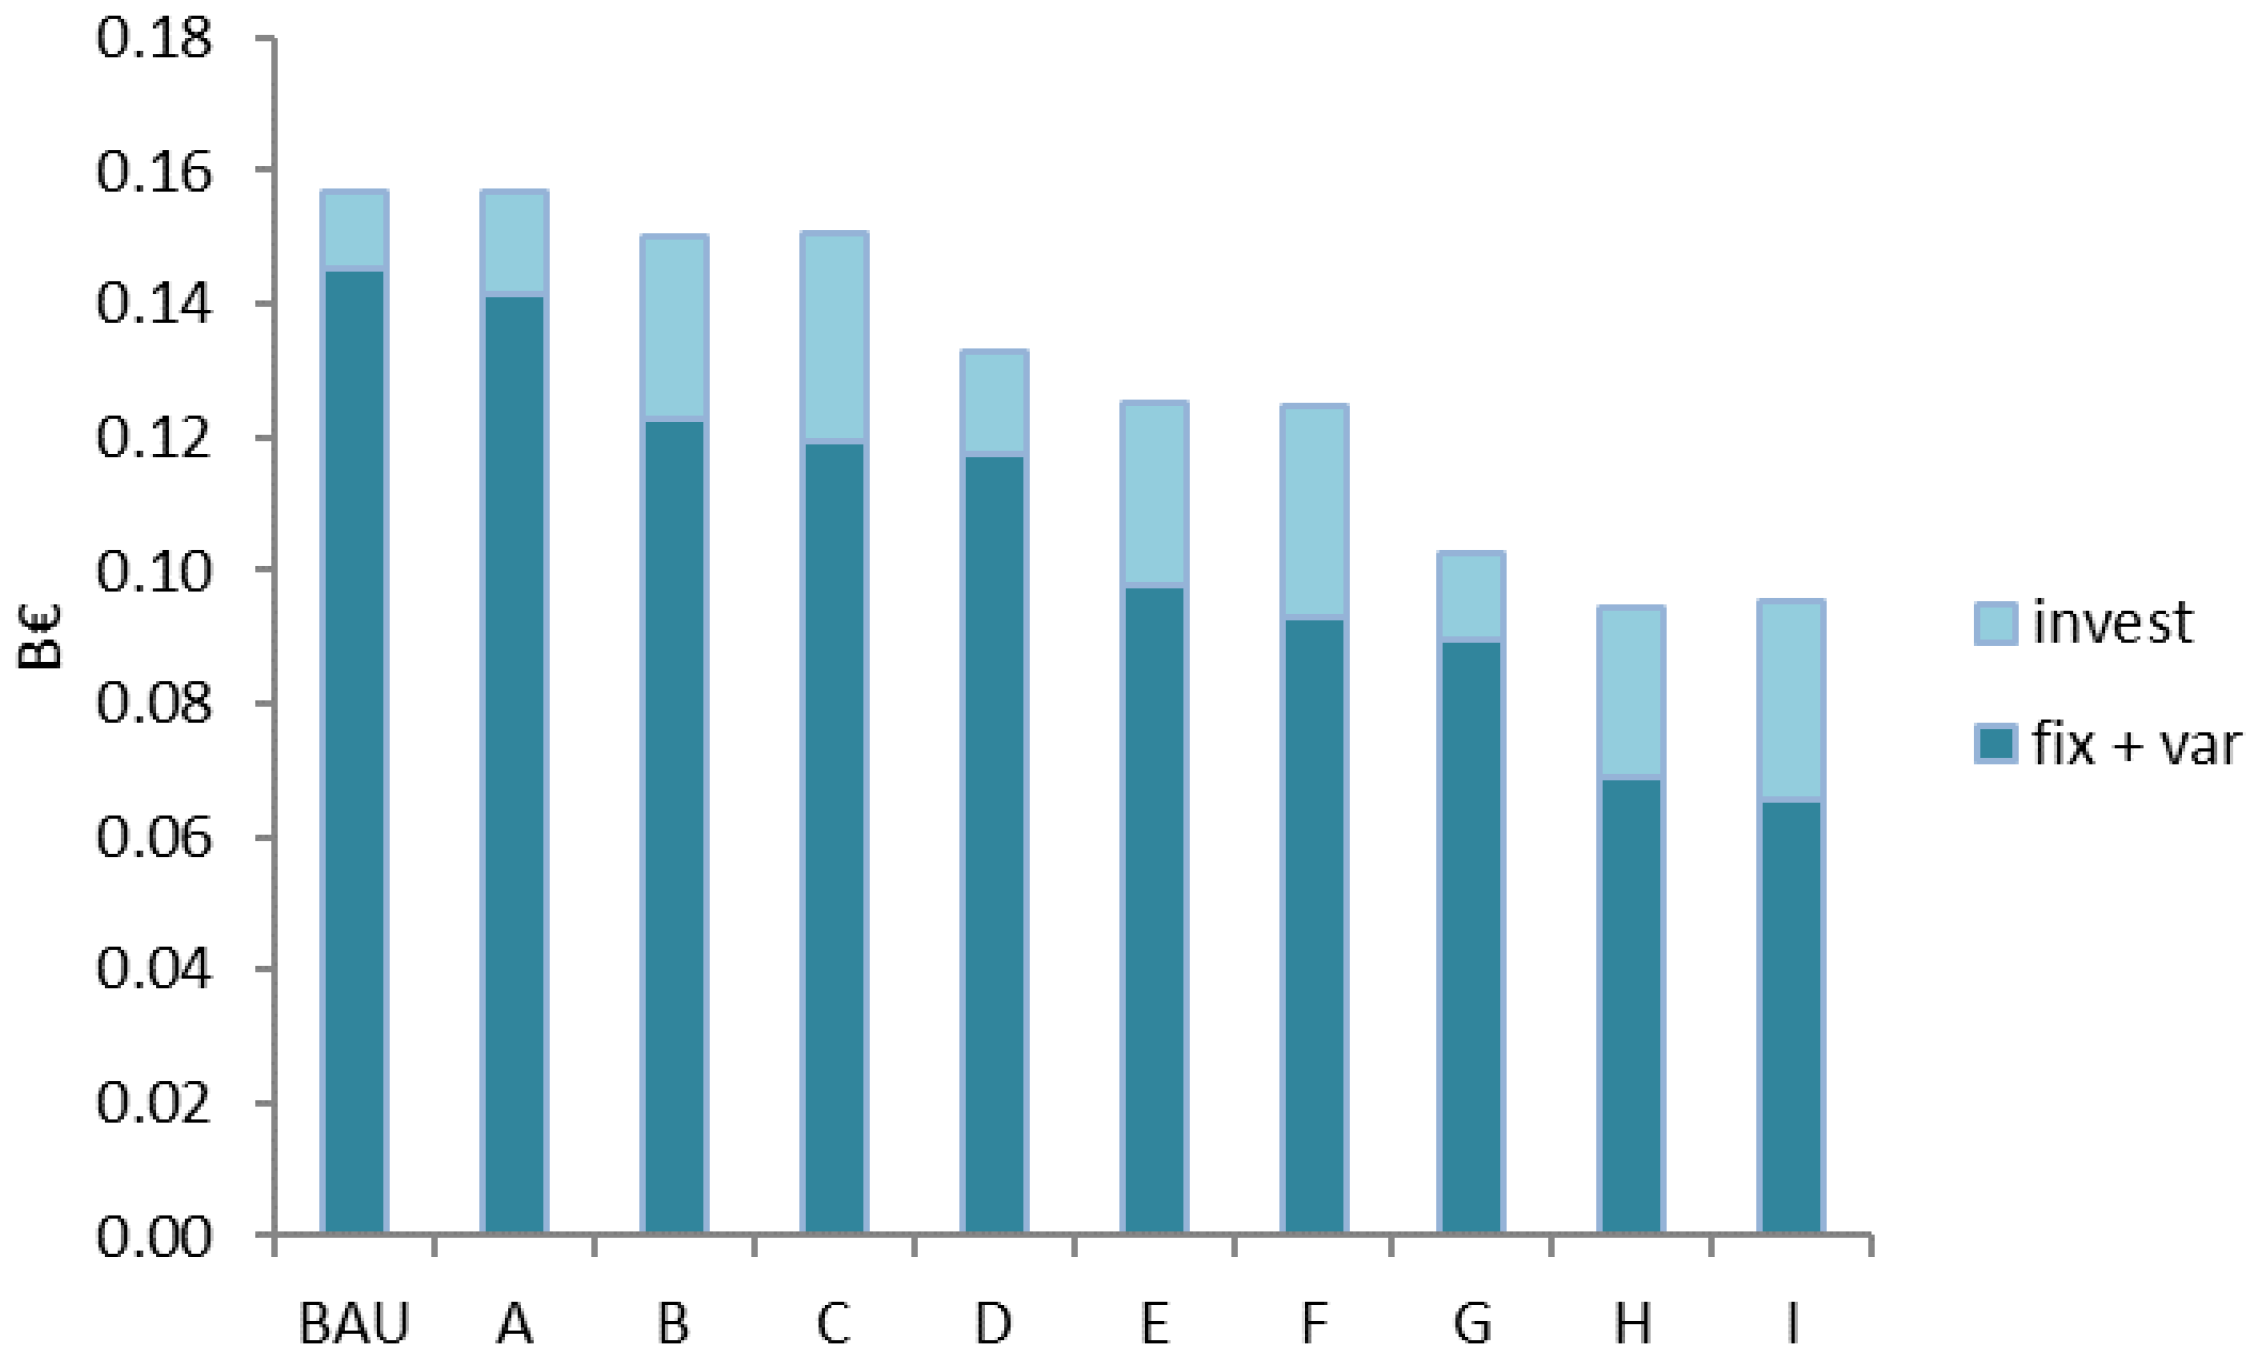
Despite the fact that the cost of decarbonization can already represent a good economic indicator, greater insights can be derived from a more detailed economic analysis that considers the cost distribution over the whole time horizon. As shown by Figure 11, compared with the annual cost analysis performed with EnergyPLAN, a more detailed global cost analysis shows that scenarios with improved heat supply (MOD and ADV) can deliver bigger cost reductions. On the other hand, by applying this methodology, the longer term benefits of advanced building retrofit (C, F, I) can be observed more precisely [55]. This might help to deliver improved energy retrofit considerations.
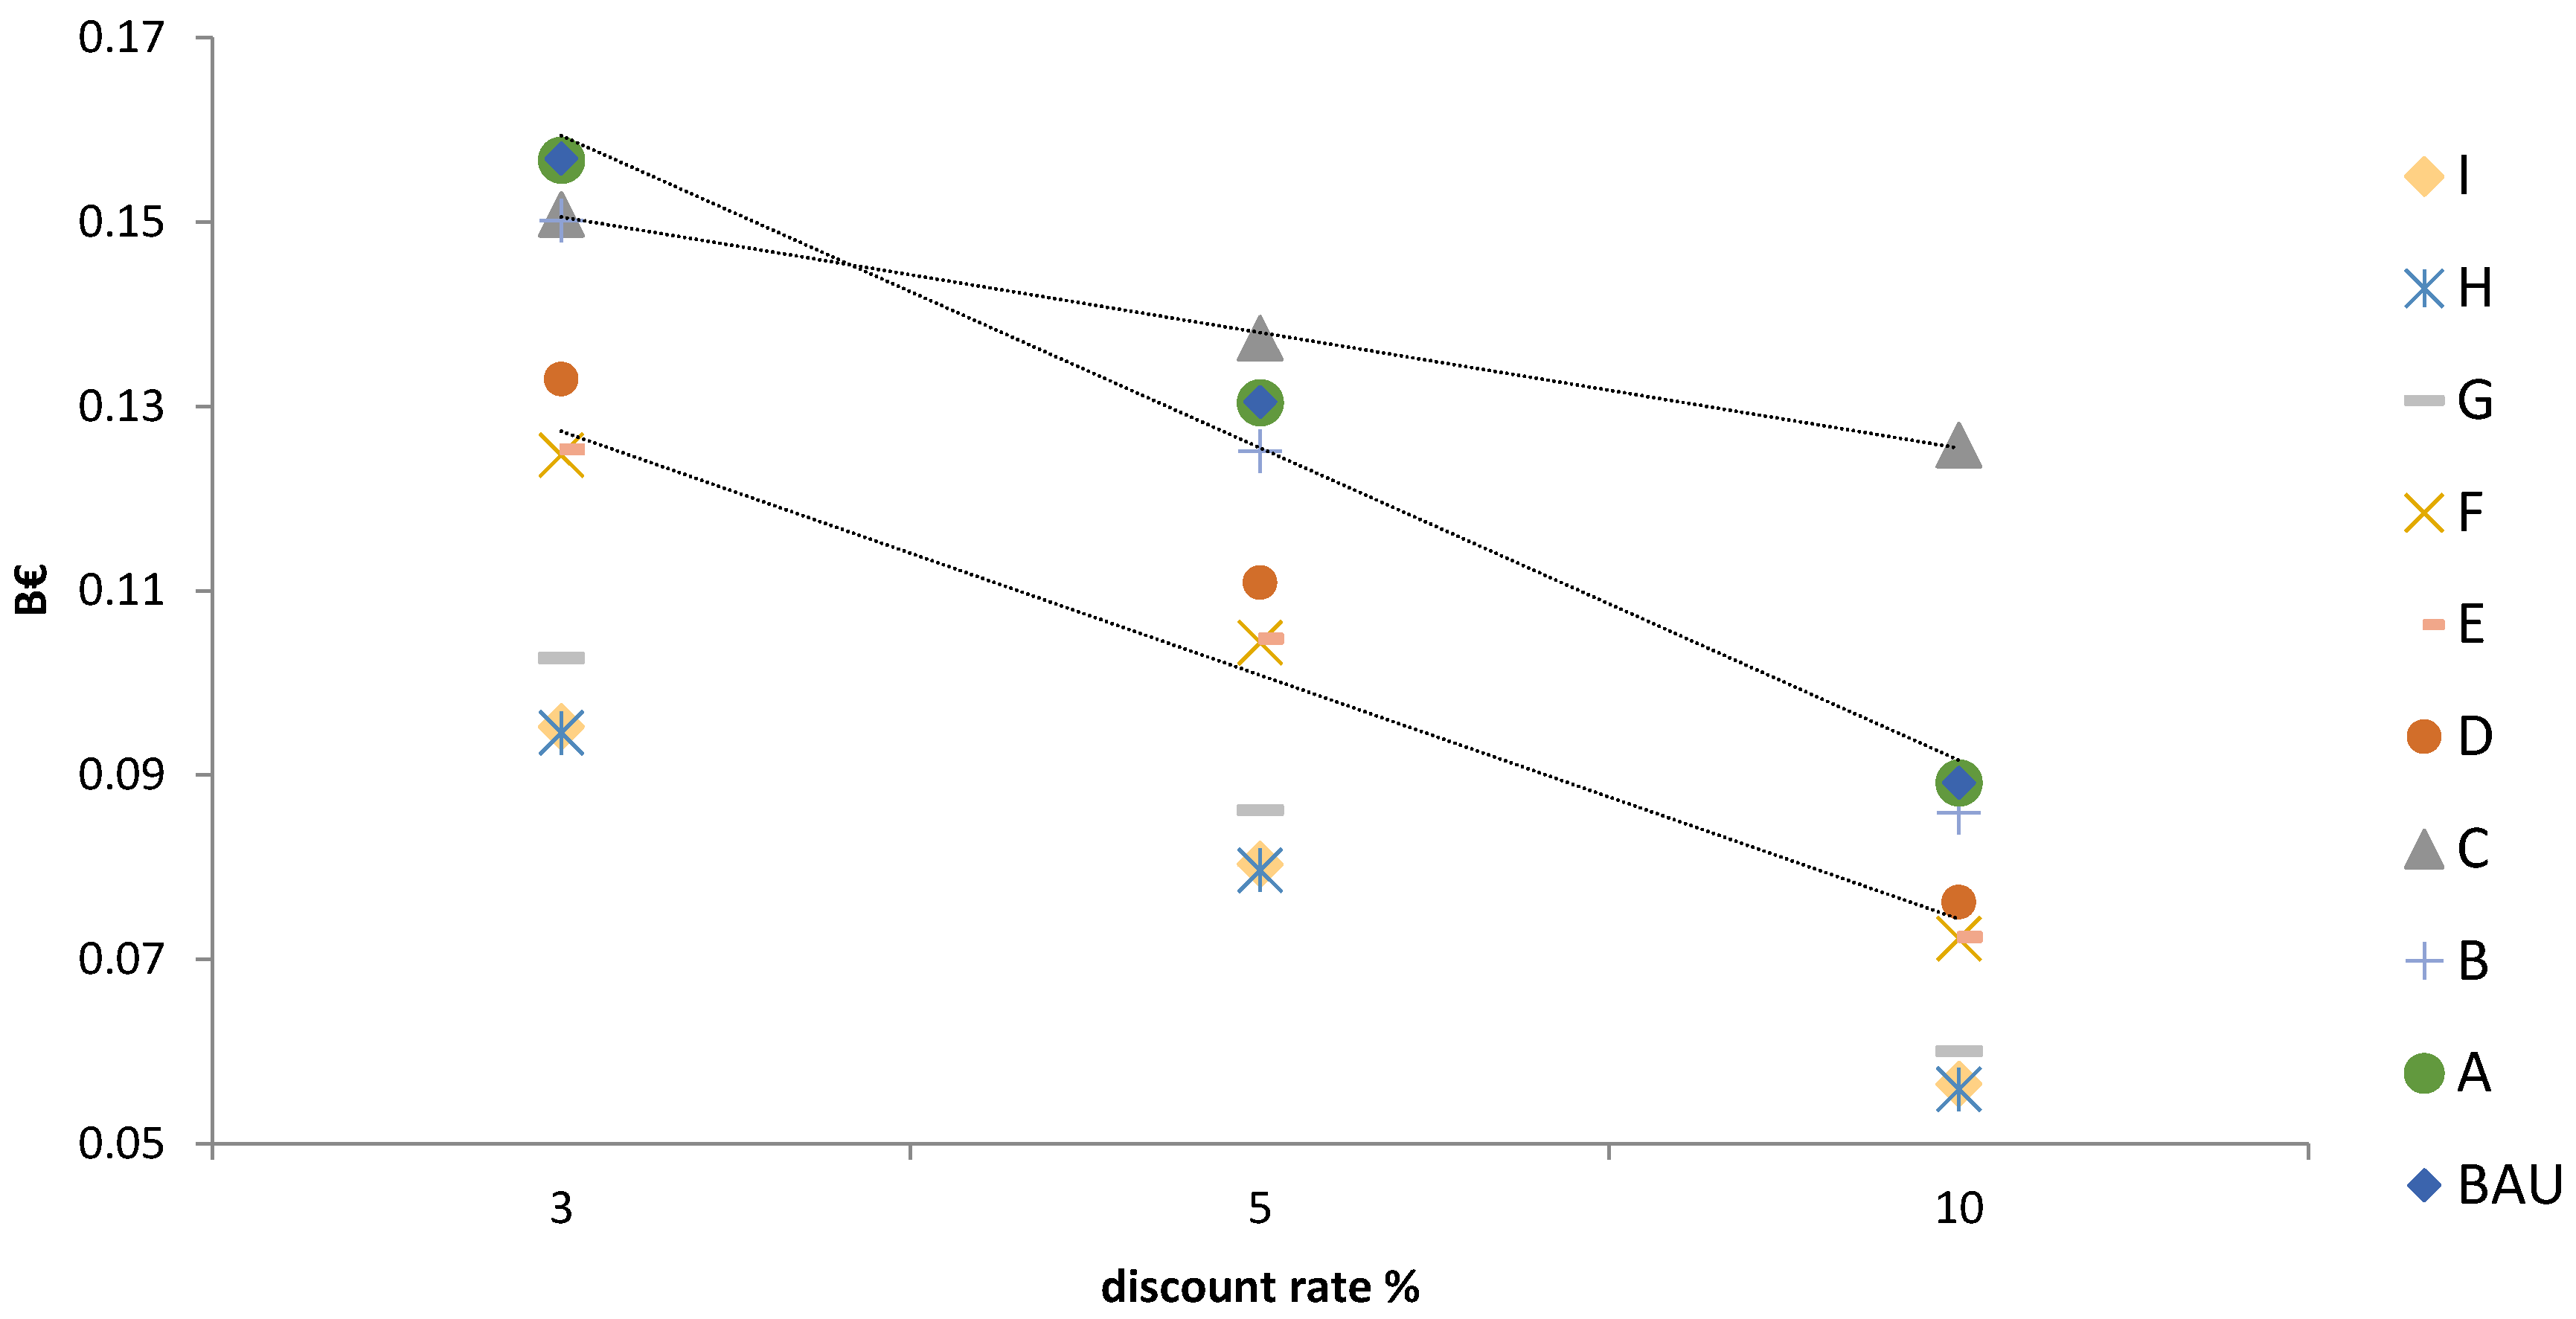
A sensitivity analysis variating discount rates might improve the understanding of which retrofit measures may have reasonable payback times—a lower discount rate presents higher influence of future energy costs, while a higher discount rate presents lower influence on future costs and higher influence of investment costs. In Figure 12, total costs for each scenario were analyzed with different discount rates. Comparing BAU scenario with a moderate scenario (for example E), a higher discount rate comports a lower costs difference between BAU and E, this means that a BAU scenario with few energy efficiency investments can be more convenient with respect to a scenario with bigger energy investments (e.g., E,C) if discount rate increases (or equivalently, without proper policies). Targeted tax policies can represent a useful instrument to push the energy efficiency measures and unlock the necessary fiscal resources for driving a clean energy transition.

5. Discussion

Linking energy system analyses to dynamic building simulations to analyze different urban energy patterns connects a data-driven robust building-level analysis with a technology-rich supply-side understanding, allowing researchers catch their interactions. The opportunity to study together the demand side and the supply side allows a better understanding of the decarbonization potential of a city, especially if characterized by an ancient building stock, as in many European cities. A complete overview of the overall energy system allows municipalities to handle future urban energy planning policies, developing a central role as mediator between different stakeholders from different sectors, being able to lead the construction of a common pathway for achieving future decarbonization goals. The application of EnergyPLAN for national-level studies is well known in literature, but the proposed methodology allows us to expand its use to an urban level without renouncing the level of detail required from the urban environment. The methodology can be further improved considering the increasing data availability in the residential sector (cadaster, smart meters, energy certifications), allowing the calibration of building simulations with real data.
EnergyPLAN was chosen because it provides several advantages: it’s a free download tool; on the web page is possible find documentations, guides, and tutorials to help users; input data are easily to find; and it has a user-friendly interface. On the other hand, as previously identified, EnergyPLAN shows some limits in the analyses of the supply side. The technical simulation to balance the heat demands applied by the tool relies on a predefined hierarchy of technologies (solar thermal, industrial CHP, heat production from waste fuel, heat plant CHP, heat pumps, peak load boilers), limiting the possibility of choosing other technology combinations or different parameters to optimize the energy system. Although, this limitation can be overcome by utilizing the MATLAB Toolbox for EnergyPLAN [56]. Furthermore, it requires aggregated input data for production that do not allow users to analyze each thermal plant singularly. and this means that the introduction of a new thermal plant (e.g., biomass CHP in this case study) cannot be analyzed individually. Usually power plants are projected to satisfy different cities, while an aggregated simulation requires a sort of close control volume, in which entry flows and exit flows are well known. However, these uncertainties are limited for the previous case study because the studied power plants were designed to satisfy mainly the energy demand of Turin. To extend the methodology to other municipalities, a collaboration with the utilities is suggested to increase the representation of the supply side, as done with this paper for the demand side.
As shown by this paper, a discretization of the urban demand through the identification and simulation of reference buildings is a valuable contribution to improving the understanding of building retrofit potential, the reference buildings approach being useful to identify an average behavior for the residential sector. Despite this, in the future, with growing data availability thanks to the spread of digitalization technologies, data-driven approaches might be more suitable for this purpose, overcoming barriers related to RBs applied to large-scale analyses, such as catching shading profiles of closed buildings, internal loads, and infiltration rates, as explained in [43].
Further improvements in the methodology can be related to improving the representation of the influence that the DH network itself has on the heat demand. Delay effect and heat loss, together with mixing effects due to return flows of each building, comport a heat load profile of thermal plants different from that of buildings, especially from the peak load, which is different for magnitude (lower than user peak) and for duration (peak of thermal plant lasts for hours, for buildings lasts for few minutes). For a better demand and supply relationship evaluation, a future development of the methodology could integrate a tool to simulate the network to analyze load profile of thermal plant and to apply regulation efficiency intervention in building (as the anticipation of the thermal request of buildings to reduce morning peak analyzed in [57]).
Additional improvements in future analysis can be done by integrating the effectiveness of buildings savings related to the increase of temperatures (e.g., lower heating degree days might reduce the costs benefits related to energy retrofit, reducing its profitability) [46].

6. Conclusions

The aim of the proposed approach was to investigate the relation between buildings’ energy savings and low-carbon heat generation strategies at an urban scale, to help municipalities to lead the transition towards a decarbonized energy society through a targeted planning of future investment and energy policies. For the achievement of the European goals in terms of CO2 emission reduction and primary energy consumption reduction, it is important correlate a demand reduction with a low-carbon supply strategy. The correlation of these two aspects is evident in the residential sector, especially in the historical buildings and general old buildings that represent the highest share of the residential sector in European cities. For these buildings, where the installation of new technologies, such as decentralized heat pumps, is difficult (due to either social, economic, and technical reasons), the role of the district heating, thanks to its easy integration with several low carbon technologies, is very relevant to pursue the goals of the energy transition. The proposed methodology allows an in-depth analysis on effective measures applicable for heat saving at the building level, integrated with an analysis of the energy system supply performed with the EnergyPLAN tool. The integration and expansion of DH in the city was analyzed through different hypothesis of future energy system configurations. The results underline the correlation between the demand side and the supply side, showing that a joint effect of both demand reduction at building level and change in the heat supply is needed to achieve the energy savings goals. Scenarios with changes in heat production provide a big reduction on CO2 and TPES, due to the integration of heat pumps, and on biomass CHP. In particular ADV scenarios, with the integration of 250 MW heat pumps, 560 MW of heat storage, and 106 MW of biomass CHP comport a CO2 reduction from a minimum of 56% (without considering buildings savings and DH expansion) to a maximum of 76% considering advanced renovation level for building retrofit together with DH expansion. The integration of large-scale heat pumps in district heating provides a strong reduction in natural gas consumption, and a lower dependence on natural gas assures a safe energy system. New investments in district heating and in building stock are supported by the strong decrease of fuel consumption and its relative costs. However, the cost reduction of these scenarios is supported by a presumed increase in the cost of fossil fuel and in the carbon taxes on 2050. The cost-effectiveness of the energy savings investment is strongly related to the trend of future energy policy decisions that can provide a strong push for embrace a low carbon energy system.

Author Contributions

Conceptualization, methodology, formal analysis, writing-original draft preparation: L.S. Writing—review and editing, supervision: C.D. Supervision, project administration: C.B. and S.P.C. All authors have read and agreed to the published version of the manuscript.

Funding

This research received no external funding.

Acknowledgments

The authors would like to thank Roberta Roberto from ENEA (Italian National Agency for New Technologies, Energy, and Sustainable Economic Development) working for the project IMEAS.

Conflicts of Interest

The authors declare no conflict of interest.

Appendix A

Table A1. Average costs of building retrofit.
AB 1945–1960AB 1961–1975AB 1976–1990Average
WS (€/m3)10.689.965.128.59
SR (€/m3)34.2334.3525.6131.40
AR (€/m3)46.2746.0135.0942.46
Table A2. Total cost of energy savings measures for volumes connected to DH.
Average (€/m3)Volumes DHMm3Total Cost (M€)
WS 8.5930.7263.62
SR 31.4030.7963.6
AR 42.4630.71303.38
Table A3. Investment and fixed operations and maintenance (O&M) [24].
Investment Cost (M€)Period (Years)Fixed O&M (%)
Small CHP units0.85253.75
Heat storage CHP3200.7
Large-scale heat pump1.7250.9
Boilers (CHP)0.12203.8
Boilers (residential)/1000 units12253.8
Table A4. Fuel costs in the year 2017 [21].
Natural Gas (€/GJ)Biomass (€/GJ)
Fuel price65.65
Fuel handling costs (distribution and refinery):
To dec CHP, DH, and industry2.051186
To individual house holds3146-
Table A5. Additional costs [24].
Period (Years)O&M (%)Investment (€/KW)Total Investment (M€)
Existing DH pipes + heat exchanger4010010.205.92
New DH pipes + heat exchanger4011018.40WS: 30.54
SR: 292.45
AR:292.45
Heat saving retrofit30--WS: 263.62
SR: 963.6
AR: 1303.38
Table A6. Fuel costs 2017–2050 [21].
20172050
Fuel price (€/GJ)
Natural gas611.83
Biomass5.658.1
CO2 (€/tCO2)625

Appendix B

Table A7. Geometric and construction data, apartment building 1945–1960 [36].
AB, 1945–1960
Geometric Data
ParameterSymbolUnit Smartcities 03 00061 i001
Gross heated volumeVm35949
Net floor areaAnm21763
Shape factorS/Vm−10.46
N° apartments--24
N° floors--4
Gross heated surfaceSm22746
Gross heated floorAlm21595
Windows areaWm2217
Reference floor areaArefm21478
Construction Data
RoofUW/m2K1.8 Smartcities 03 00061 i002
WallsU1W/m2K1.15
U2W/m2K2.6
Lower floorUW/m2K1.65
Upper floorUW/m2K1.3
WindowUW/m2K4.9
g,gl-0.85
Table A8. Geometric and construction data, apartment building 1961–1975 [36].
AB, 1961–1975
Geometric Data
ParameterSymbolUnit Smartcities 03 00061 i003
Gross heated volumeVm39438
Net floor areaAnm22869
Shape factorS/Vm−10.46
N° apartments--40
N° floors--8
Gross heated surfaceSm24346
Gross heated floorAlm22483
Windows areaWm2321
Reference floor areaArefm22159
Construction Data
RoofUW/m2K2.2 Smartcities 03 00061 i004
WallsU1W/m2K1.1
U2W/m2K1.13
Lower floorUW/m2K1.65
Upper floorUW/m2K1.56
WindowUW/m2K4.9
g,gl-0.85
Table A9. Geometric and construction data, apartment building 1976–1990 [36].
AB, 1976–1990
Geometric Data
ParameterSymbolUnit Smartcities 03 00061 i005
Gross heated volumeVm3
Net floor areaAnm24123
Shape factorS/Vm−10.37
N° apartments--48
N° floors--6
Gross heated surfaceSm24734
Gross heated floorAlm23803
Windows areaWm2361
Reference floor areaArefm23474
Construction Data
RoofUW/m2K1.85 Smartcities 03 00061 i006
WallsU1W/m2K0.76
U2W/m2K0.76
Lower floorUW/m2K0.97
Upper floorUW/m2K0.98
WindowUW/m2K3.7
g,gl-0.75
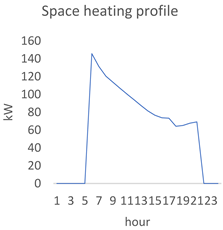
Figure A1. Heat load profile: losses, domestic hot water (DHW), and heat consumption demand for district heating.
Smartcities 03 00061 g0a1

References

  1. International Energy Agency Energy. Climate Change and Enviroment 2016 Insights; Internal Energy Agency: Paris, France, 2016; p. 133. [Google Scholar] [CrossRef]
  2. European Commission. Roadmap 2050. Policy 2012, 1–9. [Google Scholar] [CrossRef]
  3. European Commission. The European Green Deal. Eur. Comm. 2019, 53, 24. [Google Scholar] [CrossRef]
  4. Sayegh, M.A.; Danielewicz, J.; Nannou, T.; Miniewicz, M.; Jadwiszczak, P.; Piekarska, K.; Jouhara, H. Trends of European research and development in district heating technologies. Renew. Sustain. Energy Rev. 2017, 68, 1183–1192. [Google Scholar] [CrossRef] [Green Version]
  5. EC. An EU strategy on heating and cooling 2016. J. Chem. Inf. Model. 2016, 53, 1689–1699. [Google Scholar] [CrossRef]
  6. EU. Directive 2010/31/EU of the European Parliament and of the Council of 19 May 2010 on the energy performance of buildings (recast). Off. J. Eur. Union 2010, 13–35. [Google Scholar] [CrossRef]
  7. Lund, H.; Möller, B.; Mathiesen, B.V.; Dyrelund, A. The role of district heating in future renewable energy systems. Energy 2010, 35, 1381–1390. [Google Scholar] [CrossRef]
  8. Brandoni, C.; Arteconi, A.; Ciriachi, G.; Polonara, F. Assessing the impact of micro-generation technologies on local sustainability. Energy Convers. Manag. 2014, 87, 1281–1290. [Google Scholar] [CrossRef]
  9. Fracastoro, G.V.; Serraino, M. A methodology for assessing the energy performance of large scale building stocks and possible applications. Energy Build. 2011, 43, 844–852. [Google Scholar] [CrossRef]
  10. Möller, B.; Lund, H. Conversion of individual natural gas to district heating: Geographical studies of supply costs and consequences for the Danish energy system. Appl. Energy 2010, 87, 1846–1857. [Google Scholar] [CrossRef]
  11. Sperling, K.; Möller, B. End-use energy savings and district heating expansion in a local renewable energy system—A short-term perspective. Appl. Energy 2012, 92, 831–842. [Google Scholar] [CrossRef]
  12. Petrović, S.; Karlsson, K. Ringkøbing-Skjern energy atlas for analysis of heat saving potentials in building stock. Energy 2016, 110, 166–177. [Google Scholar] [CrossRef] [Green Version]
  13. Delmastro, C.; Mutani, G.; Corgnati, S.P. A supporting method for selecting cost-optimal energy retrofit policies for residential buildings at the urban scale. Energy Policy 2016, 99, 42–56. [Google Scholar] [CrossRef]
  14. Mutani, G.; Delmastro, C.; Gargiulo, M.; Corgnati, S.P. Characterization of Building Thermal Energy Consumption at the Urban Scale. Energy Procedia 2016, 101, 384–391. [Google Scholar] [CrossRef] [Green Version]
  15. Caputo, P.; Costa, G.; Ferrari, S. A supporting method for defining energy strategies in the building sector at urban scale. Energy Policy 2013, 55, 261–270. [Google Scholar] [CrossRef]
  16. Monsalvete, P.; Robinson, D.; Eicker, U. Dynamic simulation methodologies for urban energy demand. Energy Procedia 2015, 78, 3360–3365. [Google Scholar] [CrossRef] [Green Version]
  17. Hansen, K.; Connolly, D.; Lund, H.; Drysdale, D.; Thellufsen, J.Z. Heat Roadmap Europe: Identifying the balance between saving heat and supplying heat. Energy 2016, 115, 1663–1671. [Google Scholar] [CrossRef]
  18. Østergaard, P.A.; Lund, H. A renewable energy system in Frederikshavn using low-temperature geothermal energy for district heating. Appl. Energy 2011, 88, 479–487. [Google Scholar] [CrossRef]
  19. Connolly, D.; Lund, H.; Mathiesen, B.V. Smart Energy Europe: The technical and economic impact of one potential 100% renewable energy scenario for the European Union. Renew. Sustain. Energy Rev. 2016, 60, 1634–1653. [Google Scholar] [CrossRef]
  20. Connolly, D.; Lund, H.; Mathiesen, B.V.; Werner, S.; Möller, B.; Persson, U.; Boermans, T.; Trier, D.; Østergaard, P.A.; Nielsen, S. Heat roadmap Europe: Combining district heating with heat savings to decarbonise the EU energy system. Energy Policy 2014, 65, 475–489. [Google Scholar] [CrossRef]
  21. Connolly, D.; Lund, H.; Mathiesen, B.V.; Leahy, M. A review of computer tools for analysing the integration of renewable energy into various energy systems. Appl. Energy 2010, 87, 1059–1082. [Google Scholar] [CrossRef]
  22. Advanced Heating and Cooling Plans to Determine the Effects of Greater Energy Efficiency in EU Member States, STRATEGO project, Main report. Available online: https://www.euroheat.org/our-projects/stratego-multi-level-actions-enhanced-heating-cooling-plans/ (accessed on 15 April 2018).
  23. IMEAS Project. Available online: https://www.alpine-space.eu/projects/imeas/en/home (accessed on 21 October 2020).
  24. Ma, T.; Ostergaard, P.A.; Lund, H.; Yang, H.; Lu, L. An energy system model for Hong Kong in 2020. Energy 2014, 68, 301–310. [Google Scholar] [CrossRef]
  25. Gupta, R.; Gregg, M. Targeting and modelling urban energy retrofits using a city-scale energy mapping approach. J. Clean. Prod. 2018, 174, 401–412. [Google Scholar] [CrossRef] [Green Version]
  26. Torabi Moghadam, S.; Lombardi, P. An interactive multi-criteria spatial decision support system for energy retrofitting of building stocks using CommuntiyVIZ to support urban energy planning. Build. Environ. 2019, 163, 106233. [Google Scholar] [CrossRef]
  27. Delmastro, C.; Gargiulo, M. Capturing the long-term interdependencies between building thermal energy supply and demand in urban planning strategies. Appl. Energy 2020, 268, 114774. [Google Scholar] [CrossRef]
  28. Delmastro, C.; Martinsson, F.; Dulac, J.; Corgnati, S.P. Sustainable urban heat strategies: Perspectives from integrated district energy choices and energy conservation in buildings. Case studies in Torino and Stockholm. Energy 2017, 138, 1209–1220. [Google Scholar] [CrossRef]
  29. IREN Energia. The Cogeneration and District Heating Plants in Turin. Available online: https://www.irenenergia.it/ChiSiamo/Attivita/EnergiaElettrica/ImpCogenerazione.html (accessed on 15 April 2018). (In Italian).
  30. Østergaard, P.A. Reviewing EnergyPLAN simulations and performance indicator applications in EnergyPLAN simulations. Appl. Energy 2015, 154, 921–933. [Google Scholar] [CrossRef]
  31. Corgnati, S.P.; Fabrizio, E.; Filippi, M.; Monetti, V. Reference buildings for cost optimal analysis: Method of definition and application. Appl. Energy 2013, 102, 983–993. [Google Scholar] [CrossRef]
  32. Ballarini, I.; Corgnati, S.P.; Corrado, V. Use of reference buildings to assess the energy saving potentials of the residential building stock: The experience of TABULA project. Energy Policy 2014, 68, 273–284. [Google Scholar] [CrossRef]
  33. Guelpa, E.; Mutani, G.; Todeschi, V.; Verda, V. A feasibility study on the potential expansion of the district heating network of Turin. Energy Procedia 2017, 122, 847–852. [Google Scholar] [CrossRef] [Green Version]
  34. Città di Torino GEOPORTALE. 2017. Available online: http://www.comune.torino.it/geoportale/ (accessed on 4 March 2018).
  35. Corrado, V.; Ballarini, I.; Corgnati, S.P. Typology Approach for Building Stock National Scientific Report on the TABULA Activities in Italy; Politecnico di Torino: Torino, Italy, 2012; Available online: https://episcope.eu/communication/download/ (accessed on 10 January 2018).
  36. Tabula WebTool. Available online: http://webtool.building-typology.eu/#bm (accessed on 10 January 2018).
  37. UNI 10351:2015. Materiali e Prodotti per Edilizia-Proprietà Termoigrometriche-Procedura per la Scelta dei Valori di Progetto. Available online: https://www.uni.com/ (accessed on 4 December 2017).
  38. UNI EN ISO 6946:2008. Componenti ed Elementi per Edilizia-Resistenza Termica e Trasmittanza Termica-Metodi di Calcolo. Available online: https://www.uni.com/ (accessed on 4 December 2017).
  39. Berkeley, L.; Ridge, O.A.K.; Ut-battelle, M.B.Y.; For, A.; Energy, S.; Or, D.; In, T.; Form, A.N.Y.; By, O.R.; Means, A.N.Y.; et al. EnergyPlus Essentials. 2019. Available online: https://energyplus.net/documentation (accessed on 14 October 2020).
  40. UNI/TS 11300-1:2014. Prestazioni Energetiche Degli Edifici—Parte 1: Determinazione del Fabbisogno di Energia Termica Dell’edificio per la Climatizzazione Estiva ed Invernale. Available online: https://www.uni.com/ (accessed on 4 December 2017).
  41. Corrado, V.; Ballarini, I.; Paduos, S.; Primo, E.; Madonna, F. Application of Dynamic Numerical Simulation to Investigate the Effects of Occupant Behaviour Changes in Retrofitted Buildings. Proc. Build. Simul. 2017, 2017, 678–685. [Google Scholar]
  42. Barthelmes, V.M.; Becchio, C.; Fabi, V.; Corgnati, S.P. Occupant behaviour lifestyles and effects on building energy use: Investigation on high and low performing building features. Energy Procedia 2017, 140, 93–101. [Google Scholar] [CrossRef] [Green Version]
  43. Kazas, G.; Fabrizio, E.; Perino, M. Energy demand profile generation with detailed time resolution at an urban district scale: A reference building approach and case study. Appl. Energy 2017, 193, 243–262. [Google Scholar] [CrossRef]
  44. Città di Torino. Energy-environmental annex. Regolam. Edil. Torino 2011. Available online: http://www.comune.torino.it/ (accessed on 15 December 2017). (In Italian).
  45. UNI EN ISO 10456:2008. Materiali e Prodotti per Edilizia-Proprietà igrometriche-Valori Tabulati di Progetto e Procedimenti per la Determinazione dei Valori Termici Dichiarati e di Progetto. Available online: https://www.uni.com/ (accessed on 4 December 2017).
  46. Andrić, I.; Gomes, N.; Pina, A.; Ferrão, P.; Fournier, J.; Lacarrière, B.; Le Corre, O. Modeling the long-term effect of climate change on building heat demand: Case study on a district level. Energy Build. 2016, 126, 77–93. [Google Scholar] [CrossRef]
  47. Fjärrvärme, S. Kulvertkostnadskatalog. 2007. Available online: https://www.energiforetagen.se/ (accessed on 8 October 2017). (In Swedish).
  48. IEA. Energy Technology Perspective 2016. Available online: https://www.iea.org/reports/energy-technology-perspectives-2016 (accessed on 5 October 2017).
  49. Città di Torino. Prezzario Regione Piemonte. 2016. Available online: http://www.regione.piemonte.it/oopp/prezzario/index16.htm (accessed on 10 November 2017).
  50. Lund, H.; Connolly, D.; Thellufsen, J.Z.; Van Mathiesen, B.; Østergaard, P.A.; Lund, R.S.; Ridjan, I.; Hansen, K.; Drysdale, D. EnergyPLAN documentation. Available online: https://www.energyplan.eu/ (accessed on 10 September 2017).
  51. Moncalieri Cogeneration Thermoelectric Plant—Environmental Declaration 2015. 2015. Available online: https://www.irenenergia.it/ (accessed on 15 February 2018). (In Italian).
  52. Torino Nord Cogeneration Thermoelectric Plant—Environmental Declaration 2015. 2015. Available online: https://www.irenenergia.it/ (accessed on 15 February 2018). (In Italian).
  53. Rapporto Sulle Aste di Quote Europee di Emissione 2017. 2017. Available online: https://www.gse.it/ (accessed on 19 January 2018).
  54. Ministero dello Sviluppo Economico; Ministero dell’Ambiente e della Tutela del Territorio e del Mare; Ministero delle Infrastrutture e dei Trasporti. Integrated National Energy and Climate Plan. 2019. Available online: https://www.mise.gov.it/ (accessed on 12 October 2020).
  55. Corrado, V.; Ballarini, I.; Paduos, S.; Fabrizio, E.; Filippi, M.; Monetti, V. Development of the Cost-Optimal Comparative Methodology According to Directive 2010/31/UE; Report RdS/2013/144; ENEA: Roma, Italy, 2013. (In Italian) [Google Scholar]
  56. Cabrera, P.; Lund, H.; Thellufsen, J.Z.; Sorknæs, P. The MATLAB Toolbox for EnergyPLAN: A tool to extend energy planning studies. Sci. Comput. Program. 2020, 191, 102405. [Google Scholar] [CrossRef]
  57. Guelpa, E.; Barbero, G.; Sciacovelli, A.; Verda, V. Peak-shaving in district heating systems through optimal management of the thermal request of buildings. Energy 2017, 137, 706–714. [Google Scholar] [CrossRef] [Green Version]
Figure 1. Scheme of the methodology.
Smartcities 03 00061 g001
Figure 2. Turin buildings distribution for construction period.
Smartcities 03 00061 g002
Figure 3. Pre-1980 building distribution for building type (AB: apartment block; MF: multifamily; TH: terraced house; SF: single family).
Smartcities 03 00061 g003
Figure 4. DH total real heat profile (red line) compared to RBs total heat profile (blue line) for a day in January. The blue line includes only the heat quote of buildings related to the RBs simulated (covering almost the 54% of the total number of buildings), without the DHW contribution.
Smartcities 03 00061 g004
Figure 5. Energy savings percentage according to building retrofits for different scenarios. * Scenario 1: DH network expansion (19 Mm3). ** Scenario 2: DH network expansion 31 Mm3.
Smartcities 03 00061 g005
Figure 6. CO2 emissions for different scenarios from EnergyPLAN simulation.
Smartcities 03 00061 g006
Figure 7. Total primary energy supply (TPES) outputs from EnergyPLAN simulations.
Smartcities 03 00061 g007
Figure 8. Total annual cost subdivision for each scenario from EnergyPLAN outputs.
Smartcities 03 00061 g008
Figure 9. Decarbonization costs in different scenarios.
Smartcities 03 00061 g009
Figure 10. Investment costs and related CO2 emissions for each scenario.
Smartcities 03 00061 g010
Figure 11. Total costs discounted at 2017 level for different scenarios, divided into investment costs and fix + var costs.
Smartcities 03 00061 g011
Figure 12. Discount rate impact on total costs for different scenarios.
Smartcities 03 00061 g012
Table 1. Volumes connected to district heating (DH) subject to study and future network expansion.
RB TypologyConnect to DHPossible Expansion
AB 1945–196014.1 Mm39 Mm3
AB 1961–197510.5 Mm36.5 Mm3
AB 1975–19806.1 Mm34 Mm3
tot30.7 Mm319.5 Mm3
Table 2. Reference buildings simulation data.
Reference Building SimulationAB 1945–1960AB 1961–1975AB 1976–1990
Smartcities 03 00061 i007 Smartcities 03 00061 i008 Smartcities 03 00061 i009
Geometric data
ParameterSymbolUnit
Gross heated volumeVm359499438
Net floor areaAnm2176328694123
Shape factorS/Vm−10.460.460.37
N° apartments--244048
N° floors--486
Construction data
ParameterSymbolUnit
RoofUW/m2K1.82.201.85
WallsUW/m2K2.61.100.76
Lower floorUW/m2K1.651.650.97
Upper floorUW/m2K1.31.560.98
WindowsUW/m2K4.9 (g,gl 0.85)4.9 (g,gl 0.85)3.70 (g,gl 0.75)
Heat need
Reference building standard kWh/m2y15913666.3
Reference building results kWh/m2y13912461.3
Table 3. Heat consumption of reference buildings (RBs) in different scenarios of building retrofit.
TypologyBase (kWh/m2y)WS (kWh/m2y)SR (kWh/m2y)AR (kWh/m2y)
AB 1945–1960158.814229.519
AB 1961–1975135.6123.427.516.2
AB 1976–199066.358.217.511.3
Table 4. Building retrofit and DH expansion rate for time period. * Starting from 2018.
2017–20252025–20352035–2050
Building retrofit3% renovation volume for year *3% renovation volume for year3% renovation volume for year
DH expansion 4% connected volume for year4% connected volume for year
Table 5. Thermal plant investments for time period.
2017–20252025–20352035–2050
BAUNo investmentNew natural gas CHP (662 MWel), new industrial boiler (1000 MW), new heat storage (430 MW)New natural gas CHP (360 MWel)
MODNo investmentNew natural gas CHP (662 MWel), new industrial boiler (1000 MW), new heat storage (430 MW), heat pump (35 MWel)New natural gas and biomass CHP (338 MWel)
ADVNo investmentNew natural gas CHP (662 MWel), new industrial boiler (1000 MW), new heat storage (1000 MW), heat pump (85 MWel)New biomass CHP (134 MWel)
Table 6. Scenario descriptions.
Building RetrofitWSWindows Substitution
SRStandard renovation
ARAdvanced renovation
Network expansion12.9 Mm3
219.5 Mm3
Heat production changeMOD105 MW HP
106 MW CHP biomass
ADV250 MW HP
106 MW CHP biomass
560 MW heat storage
Table 7. Different combinations of building retrofit, network expansion, and heat production mix. * Network expansion: 1. expansion of 2.9 Mm3; 2. expansion of 19.5 Mm3. ** HP: heat pump; CHPB: biomass combined heat and power (CHP); HS: heat storage.
Building Retrofit (WS,SR, AR) and Network Expansion (1,2) * Scenarios
BaseWS + 1SR + 2AR + 2
(WS: Windows substitution)(SR: standard renovation)(AR: advanced renovation)
Supply side scenariosBaseBAUABC
MOD
(105 MW HP **, 106 MW CHPB)
DEF
ADV
(250 MW HP,106 MW CHPB
560 MW HS)
GHI
Publisher’s Note: MDPI stays neutral with regard to jurisdictional claims in published maps and institutional affiliations.