Article

Non-Contact Heart Rate Estimation via Higher Harmonic Analysis Using 24-GHz Doppler Radar: Validation in Humans and Anesthetized Cat


1
Department of Computer and Network Engineering, The University of Electro-Communications (UEC), Tokyo 182-8585, Japan
2
Faculty of Agriculture, Tokyo University of Agriculture and Technology, Tokyo 183-8590, Japan
*
Authors to whom correspondence should be addressed.
Signals 2026, 7(2), 24; https://doi.org/10.3390/signals7020024
Submission received: 19 January 2026 / Revised: 14 February 2026 / Accepted: 25 February 2026 / Published: 4 March 2026

Abstract

This study presents a harmonic-based method for non-contact heart rate (HR) estimation from continuous-wave (CW) Doppler radar signals, validated across multiple species including humans and small animals (cat). Traditional frequency-domain methods struggle when the HR fundamental frequency is weak or overlaps with respiratory components. The proposed approach addresses this by identifying three higher-order HR harmonics (2nd, 3rd, and 4th) then reconstructing the HR fundamental frequency from their integer ratios (3/2, 4/3, 2/1). The algorithm processes 20-s sliding windows (1-s overlap) using bandpass filtering to remove respiratory components and HR fundamental while preserving higher harmonics, followed by Power Spectral Density (PSD) analysis. When a complete harmonic set cannot be found, the proposed algorithm switches to harmonic pair detection, enhancing robustness when one harmonic is absent or attenuated. Besides, an adaptive tolerance mechanism enables detection under non-ideal conditions. The method was validated using a public human dataset and an experimental cat dataset with varied positions (supine/prone) and anesthesia levels (1–3% isoflurane). For humans, the algorithm achieved HR Accuracy consistently above 98% with an average RMSE of 1.33 bpm (MAPE: 1.29%, MAE: 0.86 bpm) and Bland-Altman bias below 0.9 bpm. For the cat dataset, performance was even better with HR Accuracy remaining above 99%, an average RMSE of 0.39 bpm (MAPE: 0.22%, MAE: 0.30 bpm), and bias below 0.14 bpm.

1. Introduction

Cardiovascular diseases (CVDs) are the leading cause of mortality worldwide, accounting for approximately 19.41 million deaths in 2021 [1]. Therefore, monitoring of vital signs and heart rate (HR) plays a crucial role in modern healthcare. Effective monitoring provides essential data for diagnosing cardiovascular conditions, tracking disease progression, and supporting real-time clinical decision making [2,3,4,5]. Furthermore, precise HR monitoring enables early detection of cardiovascular complications [6,7]. It also supports post-surgical care and facilitates remote health management. HR monitoring has gained particular significance in the post-COVID-19 era, where continuous patient monitoring has become increasingly important [8].
Despite the critical importance of HR monitoring, current measurement techniques face significant practical limitations. Traditional contact-based HR monitoring methods, such as electrocardiography (ECG) and photoplethysmography (PPG) offer high accuracy but have several limitations in clinical and daily environments. These devices require direct skin contact, which causes discomfort, restricts mobility, and can cause skin irritation from adhesives and conductive gels [9]. Moreover, motion artifacts, clothing interference, and the requirement of high technical expertise further complicate continuous monitoring. Additionally, bulky designs and wired connections make these methods unsuitable for long-term practical applications. To address these limitations, non-contact monitoring methods, particularly Doppler radar, have emerged as promising alternatives. These approaches allow continuous and long-term monitoring of vital signs without the need for body-attached devices. Non-contact solutions particularly benefit vulnerable populations such as the elderly, burn victims, and premature infants by enhancing comfort, reducing infection risks, and preserving privacy, while allowing integration into smart healthcare environments. Given the increasing demand for home-based and remote patient monitoring, radar-based heart rate detection offers a practical and scalable solution, with the potential to replace traditional manual measurement methods in hospitals and everyday healthcare settings.
Different radar technologies offer various approaches to non-contact monitoring; for radar-based heart-rate monitoring, the three most widely used radar types are frequency-modulated continuous-wave (FMCW), ultra-wideband (UWB), and continuous-wave (CW). These radar techniques use different transmission and processing techniques, each with unique strengths and limitations. FMCW radars transmit frequency-modulated signals, enabling the simultaneous measurement of range and velocity. These radars provide accurate distance information, chest displacement detection, phase tracking, and multi-target discrimination [10,11,12]. However, achieving high range resolution in FMCW systems requires large bandwidth [13], demanding high-bandwidth millimeter-wave frequencies that increase power consumption and system complexity [14]. Another common radar technology, UWB radar, transmits short pulses across a wide frequency range, providing excellent resolution and detecting heart rates through obstacles such as clothing or furniture [15,16]. UWB systems consume less power than FMCW radars [14], which is beneficial for long-term monitoring. However, UWB technology experiences higher noise and lower signal-to-noise ratio, and requires high-speed analog-to-digital converters (ADCs), leading to increased power demands and complex signal processing [17].
While FMCW and UWB radars offer advanced capabilities, their complexity and power requirements may not be necessary for all applications. CW Doppler radars provide a simpler and more practical solution for non-contact heart rate monitoring than FMCW and UWB systems. CW radars utilize un-modulated continuous-wave signals generated at a single frequency, making them especially sensitive to subtle phase variations caused by chest wall movements. This characteristic allows precise real-time tracking of vital signs while maintaining low power consumption [18], significantly reduced hardware complexity, and cost-effectiveness [19]. Additionally, CW radars use minimal transmission bandwidth and require only low-speed ADCs for vital sign monitoring, making them well-suited for low-cost, power-efficient implementations. Although CW radars cannot directly measure range or distinguish multiple targets without modulation, they are highly advantageous in scenarios where tracking relative displacement is sufficient, such as non-contact vital sign monitoring and sleep pattern analysis [20,21]. Therefore, when considering affordability, portability, low power consumption, and sensitivity to relative displacement, CW Doppler radars are particularly suitable for controlled biomedical environments, which justifies the selection for this study.
Several CW radar-based HR estimation methods have been proposed in the literature. Ye and Ohtsuki [22] introduced a spectral Viterbi algorithm combined with deep clustering to handle wide-range HR variations and motion artifacts, achieving MAE of 2.88–4.82 bpm under stationary conditions. Lee et al. [23] employed the MUSIC algorithm for in-vehicle driver HR monitoring, demonstrating an MAE of 0.87 bpm when the vehicle was stationary. For small animal applications, Huang et al. [24] exploited demodulation-generated harmonics from 60 GHz CW radar to measure laboratory rat cardiorespiratory movements with an average HR error of 0.33%.
The choice of radar hardware addresses the sensor requirements, but effective signal processing is equally critical for extracting reliable HR appications. In the field of signal processing for non-contact radar-based HR extraction, many techniques have been proposed [25] and are categorized into four main groups: spectrum-based, periodicity-based, blind source separation, and deep-learning methods.
Among these approaches, frequency-domain spectrum-based techniques, particularly those utilizing Fast Fourier Transform (FFT), are the most direct method for extracting heart rate from non-contact radar signals. Despite its simplicity and computational efficiency, traditional FFT implementations face significant challenges in real-world signal processing scenarios. Specifically, conventional FFT combined with fixed passband filters is not effective when extracting HR frequencies that vary across wide ranges [26,27] or when heart rate frequency components are affected by high-order RR harmonics and noise [28]. Besides, the long observation windows required to obtain enough frequency resolution mean that conventional FFT-based pipelines do not support real-time HR estimation.
To address these limitations, several enhancement strategies have been proposed. Filter-based approaches include adaptive bandpass filter banks [29] and noise cancellation filters [30,31,32] for improved HR extraction. Differentiator-based methods exploit the higher chest wall acceleration from heartbeat compared to breathing [33], using FFT-differentiator combinations to suppress RR harmonics while enhancing HR components [34,35]. For real-time processing, short-time Fourier transform (STFT) enables time-related spectrum analysis through sliding windows [36,37,38]. Alternative transform methods include Discrete Cosine Transform (DCT), which achieves ultra-short 1.5 s windows [39,40], and Wavelet Transform (WT), which provides superior time-frequency resolution for transient signal analysis and noise reduction [41,42]. While these methods improve HR extraction accuracy, they generally operate in the low-frequency spectral region where respiratory harmonics are dominant, making them susceptible to RR harmonic interference.
More recently, harmonic-based approaches have been proposed to specifically address respiratory harmonic interference. Yao et al. [43] provided a maximum likelihood estimator that jointly models the first three harmonics of both respiration and heartbeat using FMCW radar, achieving accurate separation through Newton-based optimization at the cost of higher computational complexity. Gharamohammadi et al. [44] employed Variational Mode Decomposition (VMD) to decompose FMCW radar signals into intrinsic mode functions (IMFs), selecting the strongest component not associated with breathing rate as the cardiac fundamental for waveform reconstruction. Li and Lin [42] proposed a wavelet-based data-length-variation technique that distinguishes cardiac components from respiratory harmonics by exploiting their different frequency stability across varying window lengths. These methods represent important advances, but they generally follow a traditional strategy that first identifies the cardiac fundamental frequency in the spectrally low-frequency region.
Previous studies reveal two major challenges when processing radar signals using spectrum-based methods: (1) heart rate frequency components overlap with or are obscured by higher-order respiratory harmonics, and (2) weak heartbeat vibrations are easily overwhelmed by respiratory components and environmental noise. This second challenge is particularly important for specialized applications, such as radar-based heart rate measurements in small animals like cats, where heartbeat-induced chest vibrations are typically very small compared to human heartbeat amplitudes (0.2–0.5 mm [45]). This small amplitude in cardiac vibration makes it more difficult to distinguish heartbeat from respiratory interference in small animal subjects. While previous studies have addressed these issues, their solutions generally involve complex signal processing techniques for heart rate extraction, which complicates the overall signal processing framework and may limit real-time application performance.
In this study, a harmonic-based approach is proposed to accurately estimate HR from CW Doppler radar signals. Instead of directly identifying the fundamental heart rate frequency, the algorithm uses bandpass filtering to remove low-frequency components (including respiratory frequency components and HR fundamental frequency) while preserving higher-order HR harmonics. The method then combines a sliding-window approach (20-s window, 1-s overlap) with a harmonic-detection algorithm to estimate the fundamental HR frequency. In each data window, the proposed algorithm accurately identifies either a consecutive harmonic set (2nd, 3rd, and 4th) or the corresponding harmonic pairs (2nd and 3rd, 3rd and 4th, or 2nd and 4th), then uses these harmonics to reliably reconstruct the HR fundamental frequency. The proposed method is evaluated using a publicly available human dataset [27] and an experimental dataset from an anesthetized cat. The inclusion of cat data allowed testing the robustness of the proposed approach under different physiological variations, such as smaller chest displacements than humans, confirming the adaptability of the algorithm to diverse biomedical applications.

2. Methods

2.1. Basic Working Principle of CW Doppler Radars in HR Monitoring

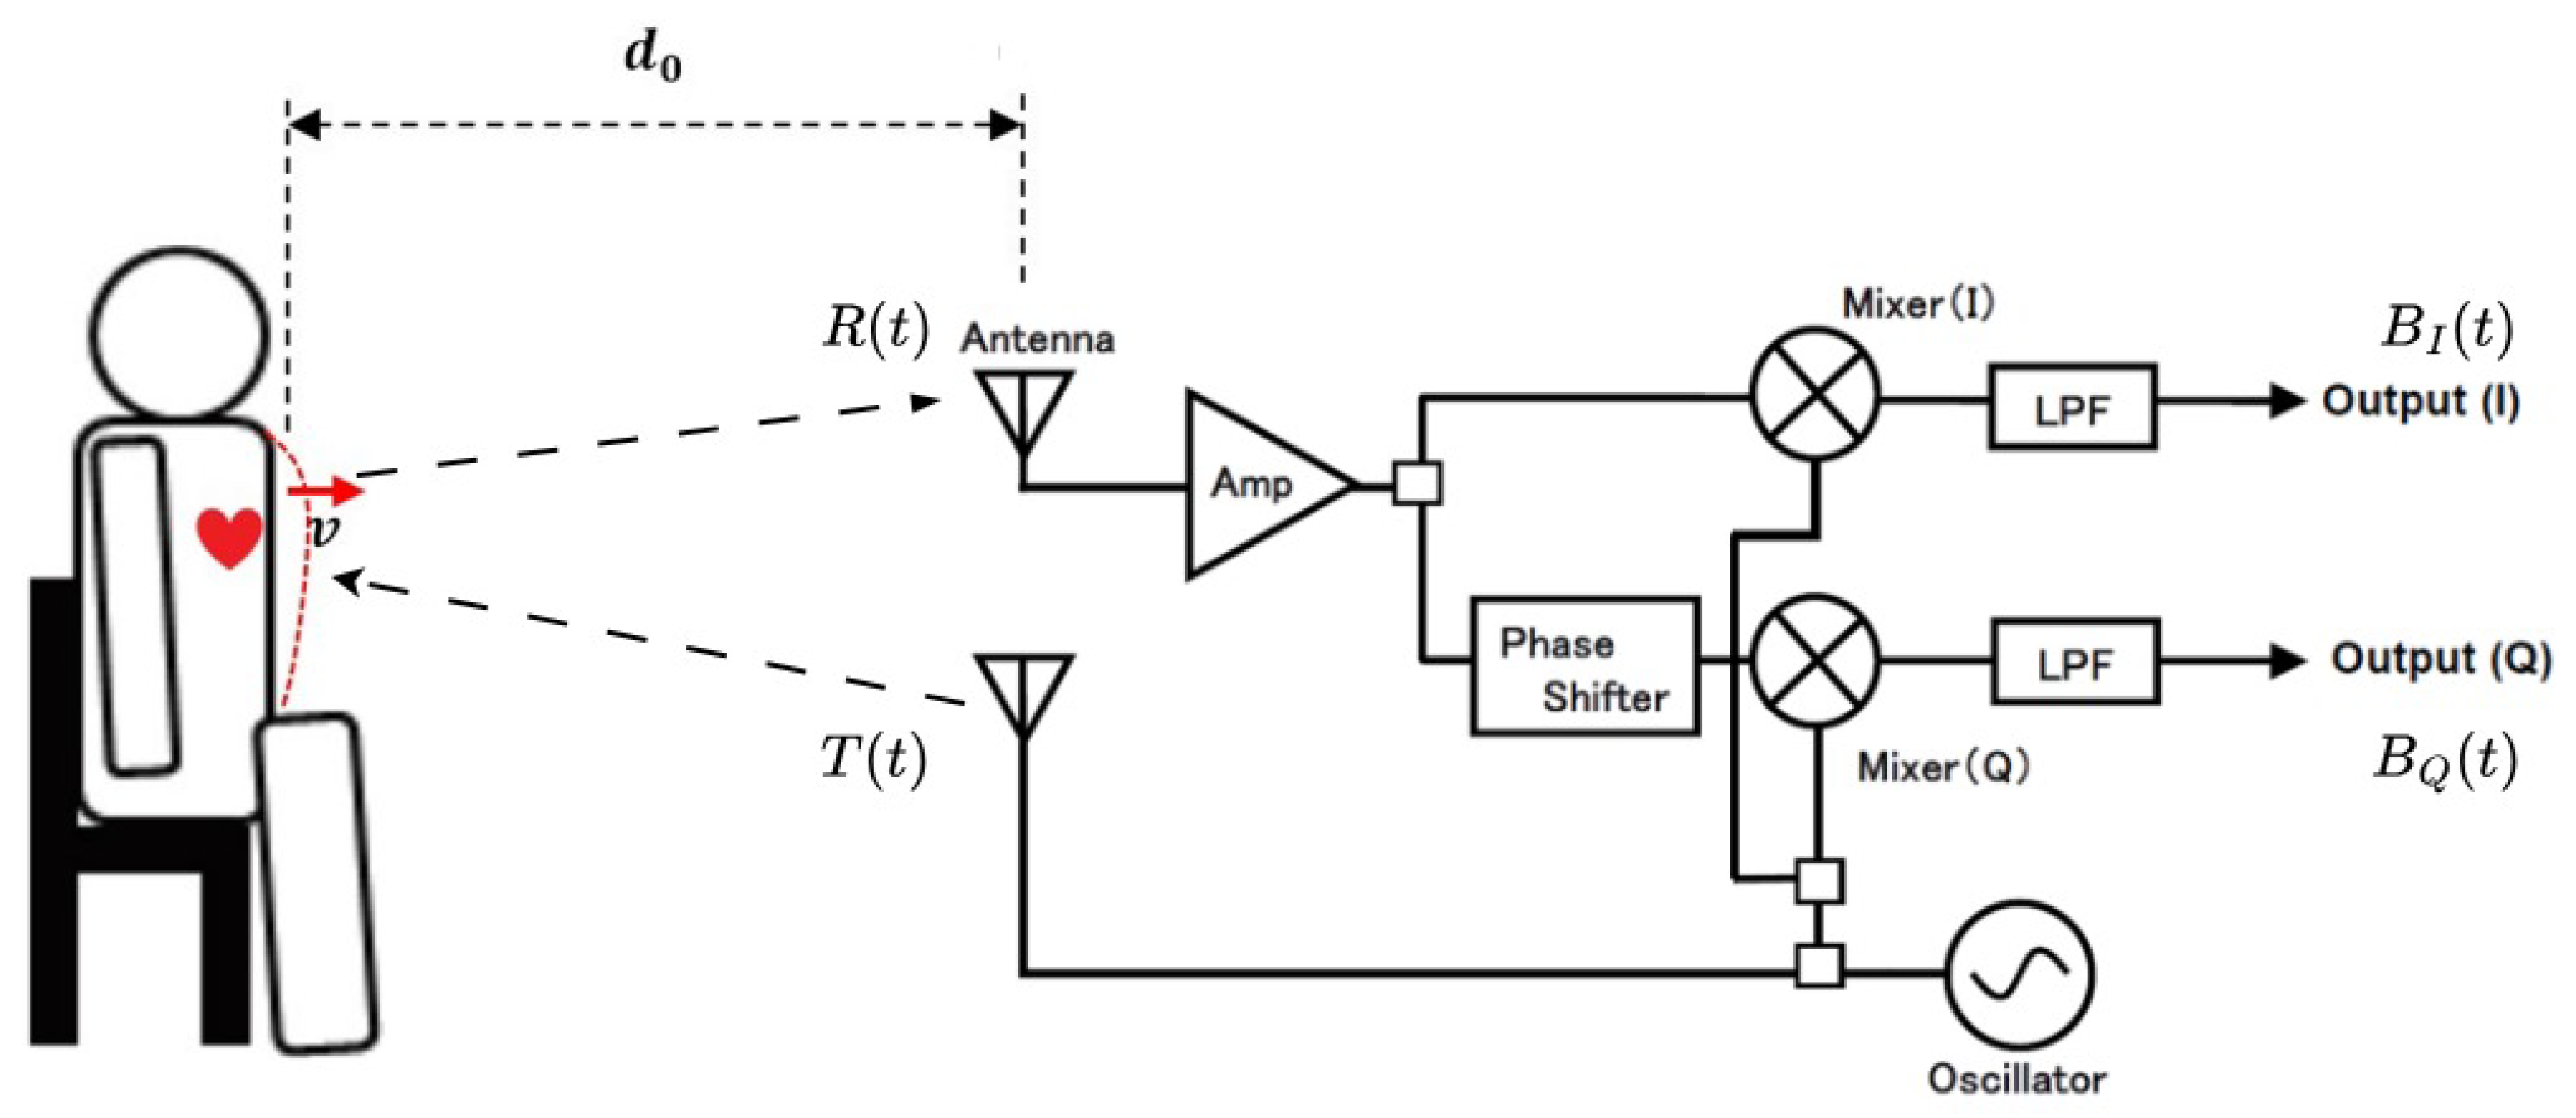
Figure 1 shows the basic principle of using a CW Doppler radar to monitor non-contact vital signs. When using this technology to monitor vital signs, such as HR and RR, it is assumed that the subject remains stationary and free of random body movements. Under this condition, the radar detects only the chest wall displacements induced by cardiopulmonary activities such as respiration and heartbeat. During respiration cycle, inhalation causes the chest wall to move toward the radar (approaching), whereas exhalation causes it to move away (receding). Heartbeat produces similar but smaller motions that differ primarily in magnitude. Respiratory displacements range from 4 to 12 mm with a frequency of 5 to 25 breaths per minute, whereas cardiac displacements are approximately 0.2 to 0.5 mm with a frequency of 45 to 150 beats per minute (bpm) [45]. The CW Doppler radar leverages these periodic motions to extract vital sign information non-invasively, relying on the Doppler effect to detect changes in the reflected signal.
The radar operates by transmitting a continuous sinusoidal wave toward the chest wall of the subject. The transmitted signal T ( t ) is expressed as:
T ( t ) = A cos ( 2 π f t )
where A is the amplitude and f is the operating frequency of the radar. The wave reflects off the moving chest wall and returns to the radar, embedding information regarding the cardiopulmonary-induced displacements in its phase.
To describe the received signal R ( t ) , the analysis starts with the distance d 0 from the radar module to the measured object at the initial time t 0 and the velocity of the chest wall displacement v; then, the distance from the radar to the chest wall at any time t is:
d ( t ) = d 0 v ( t t 0 )
From Equations (1) and (2), the received signal R ( t ) is:
R ( t ) = A cos 2 π f t φ ( t )
where φ ( t ) is the round-trip time delay (from transmitting to receiving), given by: φ ( t ) = 2 d ( t ) c = 2 c d 0 v t + v t 0 . Substituting φ ( t ) into R ( t ) and using λ = c / f (the wavelength), the derivation expands as:
R ( t ) = A cos 2 π f t 2 c d 0 v t + v t 0 = A cos 2 π f t + 4 π x ( t ) λ + θ
Here, x ( t ) = v t and θ = 4 π d 0 λ 4 π v t 0 λ . x ( t ) is a function of movement due to vital sign caused by heartbeat and breathing effect displacement and can be depicted as: x ( t ) = x r e s p + x h e a r t . The term 4 π x ( t ) λ encapsulates the Doppler shift due to chest wall motion, which varies with vital sign activity. The CW Doppler radar system used in this study is illustrated in Figure 1. This system extracts displacement information by mixing the received signal R ( t ) with the transmitted signal T ( t ) to extract the displacement information. The mixing operation yields the following:
T ( t ) R ( t ) = A cos ( 2 π f t ) × A cos 2 π f t + 4 π x ( t ) λ + θ = A 2 2 cos 4 π x ( t ) λ θ + cos 2 π ( 2 f ) t + 4 π x ( t ) λ + θ
A low-pass filter removes the high-frequency component (the second term in 2 f ), leaving the in-phase base band signal ( B I ( t ) ) and the quadrature base band signal ( B Q ( t ) ) shown below. To generate the quadrature channel, the received signal R ( t ) is phase-shifted by π / 2 before mixing, producing:
B I ( t ) = LPF { A 2 2 [ cos ( 4 π x ( t ) λ θ ) + cos ( 4 π f t + 4 π x ( t ) λ + θ ) ] } B Q ( t ) = LPF { A 2 2 [ cos ( 4 π x ( t ) λ θ + π 2 ) + cos ( 4 π f t + 4 π x ( t ) λ + θ π 2 ) ] }
where A r = A 2 2 . Thus, the radar outputs two baseband signals:
B I ( t ) = A r cos 4 π x ( t ) λ + θ B Q ( t ) = A r sin 4 π x ( t ) λ + θ
These signals contain the chest wall displacement x ( t ) in their phase, enabling the extraction of the HR and RR through subsequent signal processing.

2.2. Higher-Order Harmonics in CW Doppler Vital-Sign Signals

Define the complex baseband from the I/Q channels:
s ( t ) = B I ( t ) + j B Q ( t ) = A r e j ( β x ( t ) + θ ) , β = 4 π λ .
Let x ( t ) = a r cos ( ω r t + ϕ r ) + a h cos ( ω h t + ϕ h ) . Using the Jacobi–Anger expansion
e j z cos α = k = j k J k ( z ) e j k α ,
we obtain:
s ( t ) = A r e j θ n = m = c n , m e j ( n ω r + m ω h ) t ,
where c n , m = j n + m J n ( β a r ) J m ( β a h ) e j ( n ϕ r + m ϕ h ) . Hence, s ( t ) contains spectral at
ω n , m = n ω r + m ω h ,
including heartbeat harmonics at ω = m ω h (e.g., 2 ω h , 3 ω h , 4 ω h ).
Although the above derivation is expressed using the complex baseband for compactness, the same harmonic frequencies are also present in each channel B I ( t ) and B Q ( t ) . Define c n , m A r e j θ j n + m J n ( β a r ) J m ( β a h ) e j ( n ϕ r + m ϕ h ) , ω n , m n ω r + m ω h , so the complex signal can be shown as s ( t ) = n = m = c n , m e j ω n , m t .
Writing c n , m = | c n , m | e j ψ n , m yields
B I ( t ) = { s ( t ) } = n , m | C n , m | cos ω n , m t + ψ n , m , B Q ( t ) = { s ( t ) } = n , m | C n , m | sin ω n , m t + ψ n , m ,
Therefore, HR higher harmonics present in s ( t ) also appear in B I ( t ) and B Q ( t ) , which justifies detecting harmonics from either channel as used in the proposed algorithm.

2.3. Hardware and Experiment Setup

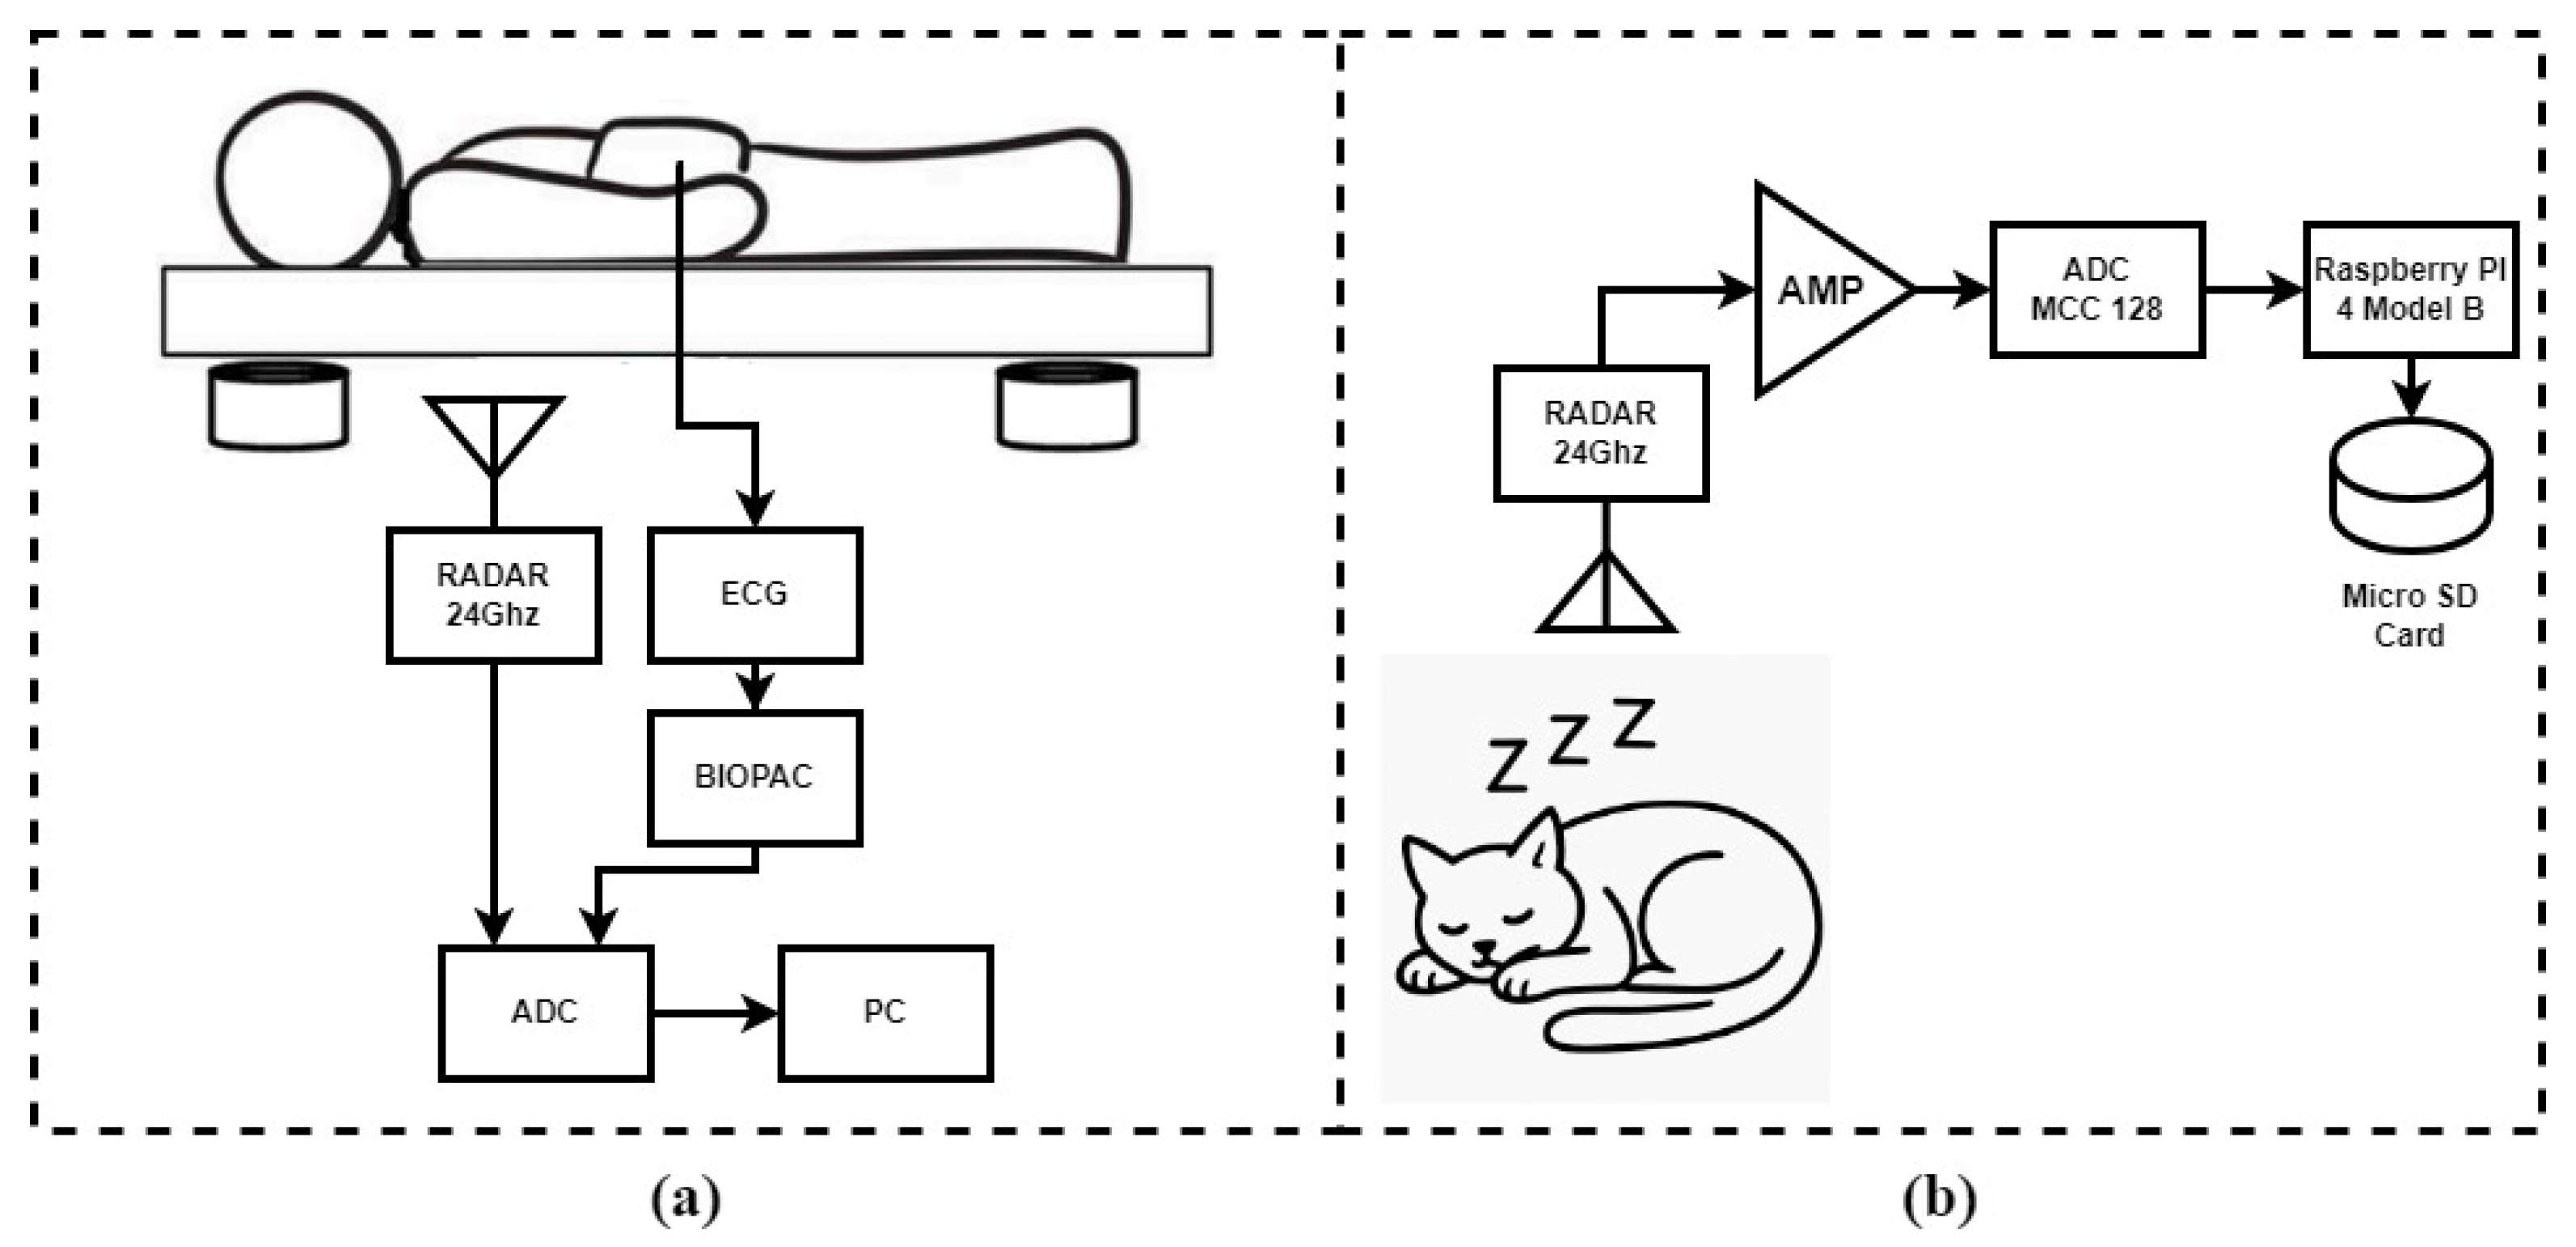
The configuration of the non-contact vital-sign monitoring system in this study was applied to two different datasets, as shown in Figure 2: (a) experimental setup from a published dataset for human subject data collection and (b) experimental setup for data collection from anesthetized cat.
The first dataset is a published collection of nine healthy human subjects (five males and four females). Each participant was recorded for 10 minutes while resting in a supine position on a bed. New Japan Radio, NJR4262 CW Doppler radars operating at 24.25 GHz were positioned under the bed, approximately 15 cm from the subject, facing the subject’s heart position. At the same time, an ECG was recorded using a contact instrument (BIOPAC, Goleta, CA, USA) with electrodes placed according to the V5 guidance. Both the radar and ECG signals were sampled at 1000 Hz, digitized, and synchronized using an ADC (USB-6003, National Instruments, Austin, TX, USA), and recorded using LabVIEW (2018 sp1) data acquisition software [27].
The second dataset was collected from an isoflurane-anesthetized cat under controlled experimental conditions. Cardiopulmonary signals were recorded using NJR4262 CW Doppler radars under different conditions. Three anesthesia concentrations (1%, 2%, and 3%) and two positions (supine and prone) were tested. This resulted in six recordings (two positions × three concentrations). Each recording lasted 5 min, and an ECG was simultaneously acquired as a reference. For ECG acquisition we used module GMS AC-301A (sensitivity 1 mV/512; 0.1–20 Hz ± 3 dB). The acquisition system was managed using a Raspberry Pi 4 Model B (Raspberry Pi Foundation, Cambridge, UK), featuring a 64-bit quad-core Cortex-A72 processor and 8 GB of RAM, ensuring efficient real-time data handling. Both the radar signal and the ECG signal were collected and synchronized by the Raspberry Pi. Consistent with the published human dataset, all signals were sampled at 1000 Hz. All proposed signal processing analysis was performed offline in MATLAB R2023b on a general-purpose computer.

2.4. Signal Processing Algorithm

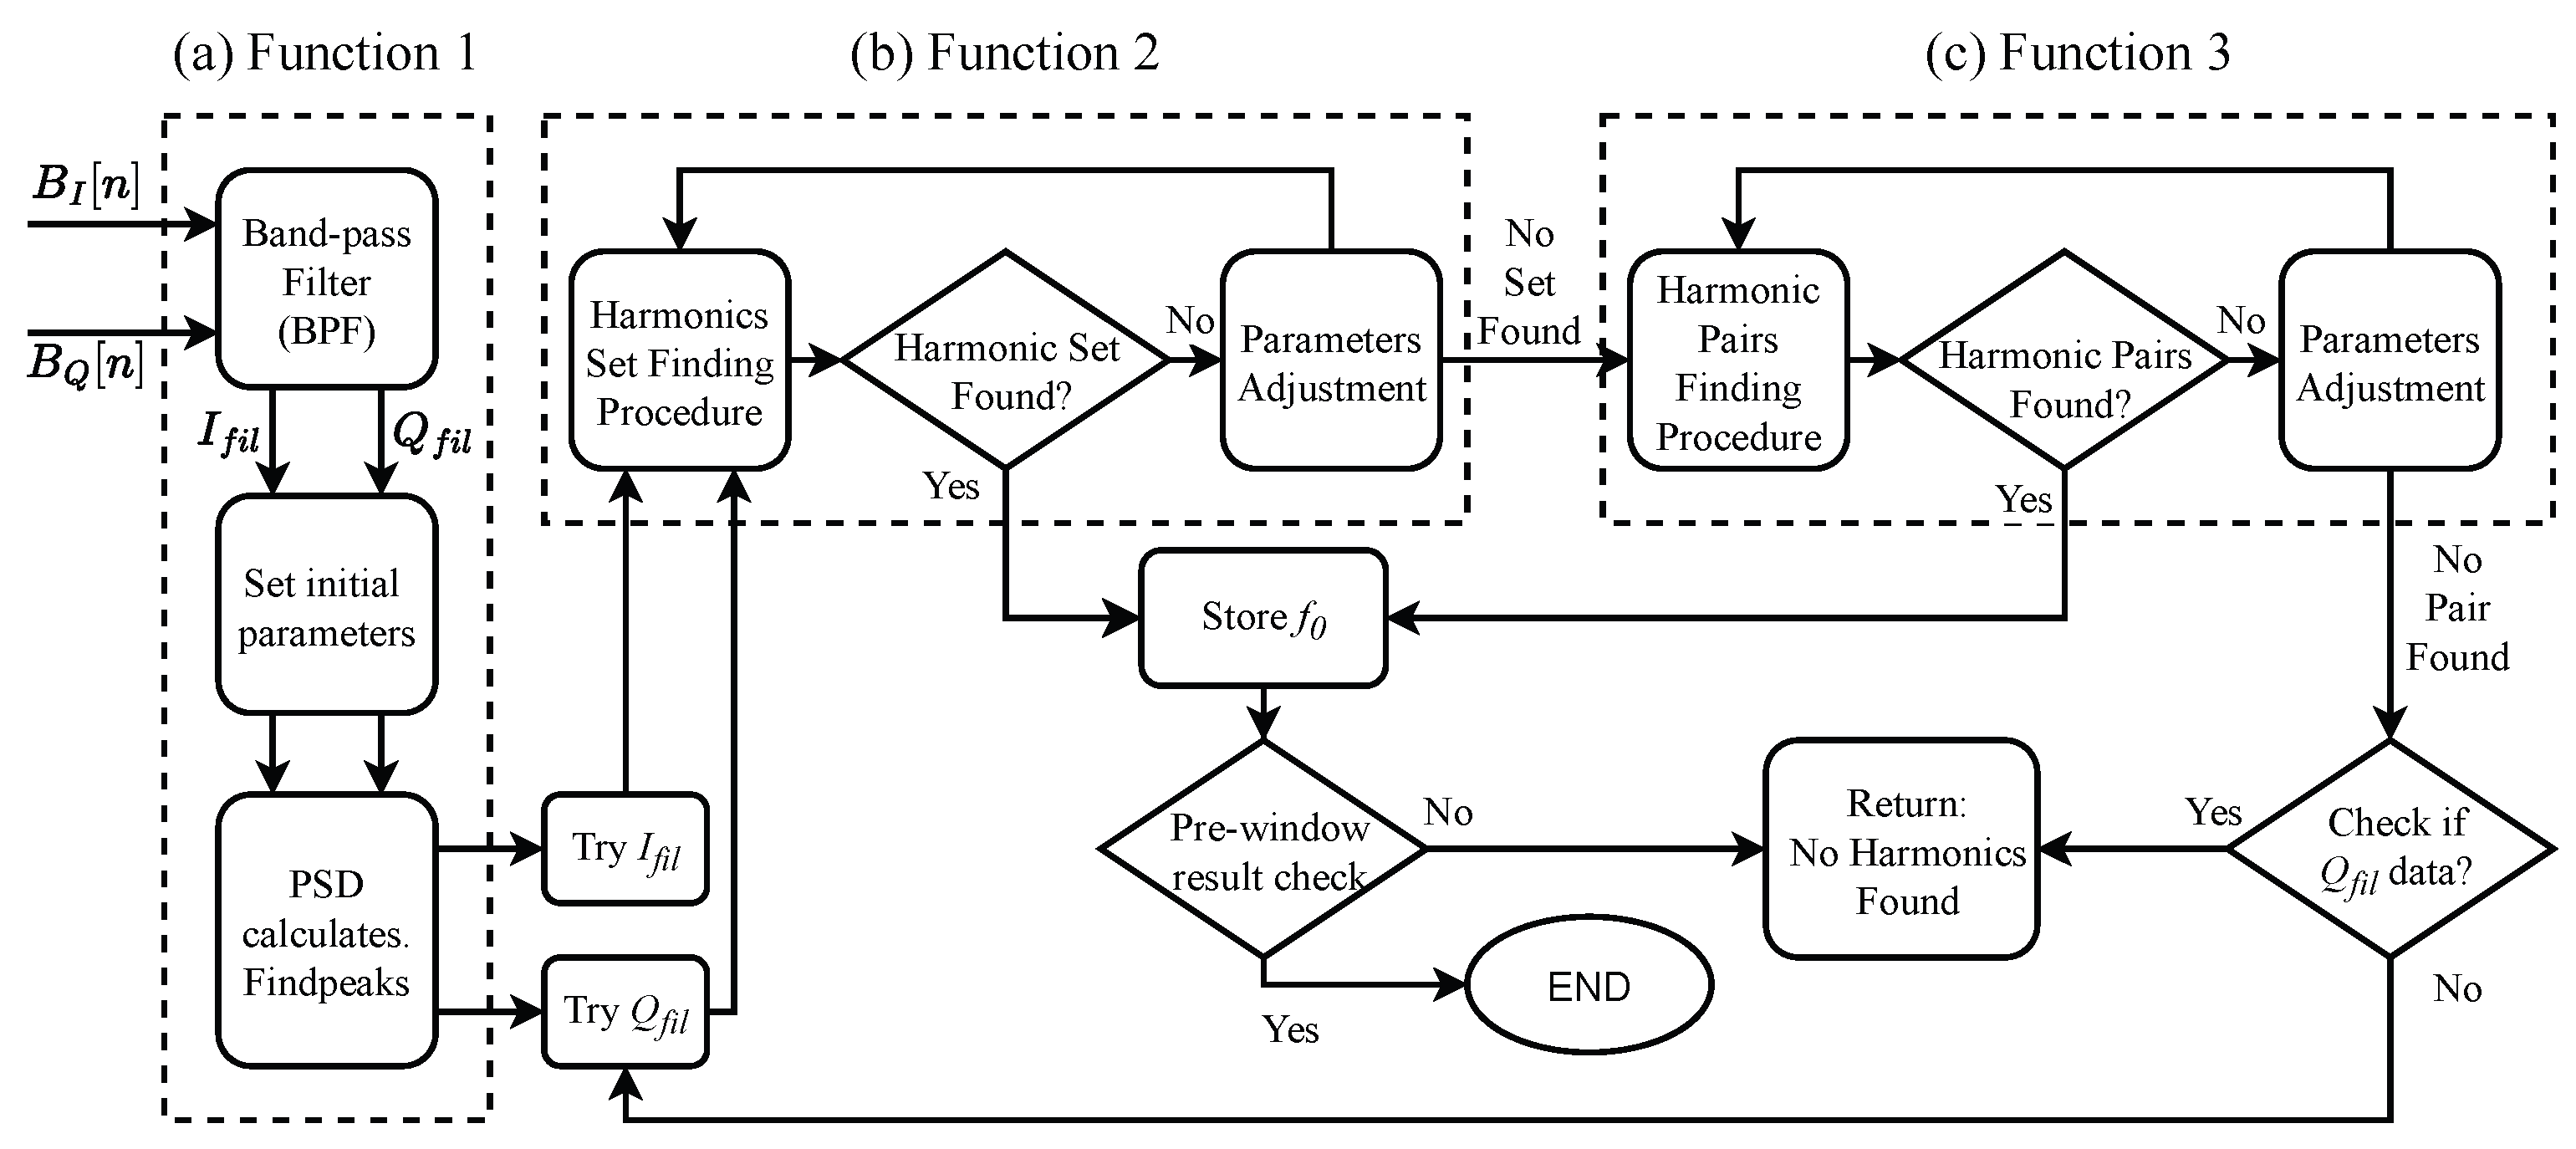
This section provides a detailed analysis of the proposed algorithm. As illustrated in Figure 3. This figure outlines the general process of estimating the fundamental heart rate frequency by using its higher harmonics. To achieve this goal, the proposed algorithm include 3 main functions: (a) function 1: preprocessing, (b) function 2: harmonic set detection, and (c) function 3: harmonics pair detection. These detection functions share a common harmonic detect strategy and tolerance mechanism, which is described before detailing each Harmonic detect function through step-by-step pseudocode.

2.4.1. Function 1: Preprocessing

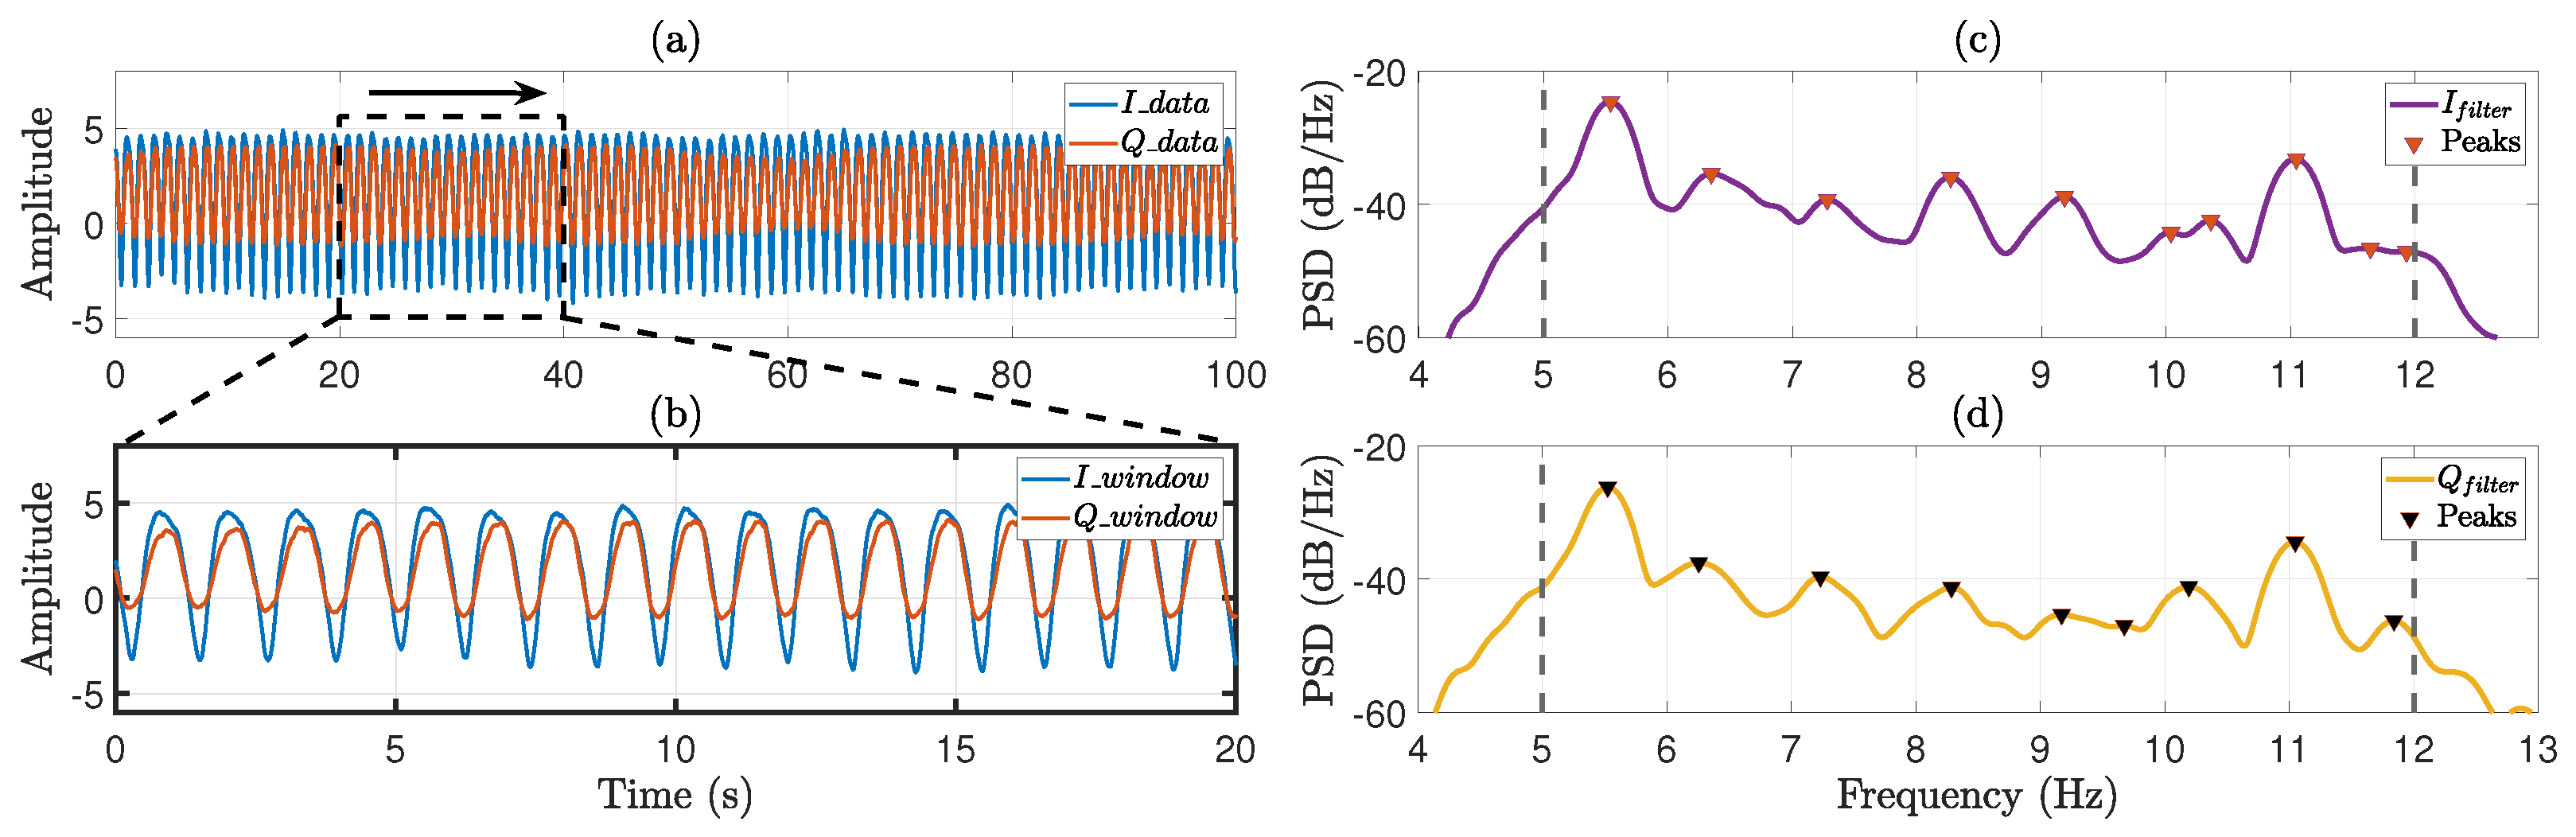
First, the baseband ( I , Q ) signals (and ECG) are segmented into 20 s windows with 1 s overlap, as illustrated in Figure 4a,b. This segmentation allows near–real-time processing (updates every 1 s). Within each window, Function 1 applies a band-pass filter (BPF) and computes the power spectral density (PSD) to reveal cardiac harmonics while suppressing respiratory components. Specifically, passbands of 2–6 Hz for humans and 5–12 Hz for cat remove the respiratory fundamental and its harmonics and even the heart-rate (HR) fundamental frequency (if present), while preserving only the frequency range where HR harmonics are expected. Building on this preprocessing, the fundamental HR frequency f 0 is later estimated from HR’s harmonic relationships in the frequency domain.
After band-pass filtering and tolerance initialization, the Algorithm 1 computes the PSD of the filtered signal—either I fil or Q fil —over the current window. Welch’s method is used instead of a single-segment FFT because averaging overlapped, windowed periodograms reduces variance and improves the visibility of weak HR harmonics that may lie below the respiratory frequency components. In addition, Hamming windowing reduces spectral leakage that can mask closely spaced harmonic peaks, producing cleaner and more reliable peak detection. Formally, P x x ( f ) = Welch ( x w [ n ] ) , where x w [ n ] denotes windowed segments of I fil or Q fil . For each 20 s window, the Welch-PSD is computed as:
  • Convert x w ( n ) into K = 8 overlap segments of L = 4444 samples, 50% overlap.
  • Apply Hamming-window to each segment.
  • Compute the FFT and Zero-pad each windowed segment to n f f t = 65,536 points.
  • Convert to power | F F T | 2 then normalizes to density.
  • Average all the modified periodograms to obtain P x x ( f ) .
From the resulting P x x ( f ) , spectral peaks are identified using a peak-finding algorithm (e.g., the MATLAB function findpeaks) within the passband [ f L , f H ] . The set of peak frequencies F pks = { f 1 , f 2 , , f n } is sorted in ascending order ( f 1 < f 2 < < f n ) . As illustrated in Figure 4c,d, these peaks serve as candidates in subsequent functions to form harmonic sets or pairs. The algorithm then tests ratios of adjacent peaks for near-integer relationships (e.g., 3 / 2 , 4 / 3 , 2 / 1 ) to infer the fundamental f 0 .
Algorithm 1 Higher harmonics detection
Function 1: Preprocessing
Require: 
B I [ n ] , B Q [ n ] , [ f L , f H ] , f s
Ensure: 
F pks , I fil , Q fil , ϵ 0 , ϵ max , ϵ f _ c m p
  1:
I fil BPF ( B I [ n ] ; f L , f H , f s )
  2:
Q fil BPF ( B Q [ n ] ; f L , f H , f s )
  3:
ϵ 0 0.01 ;    ϵ max 0.025 ;    ϵ f _ c m p 0.05
  4:
[ p x x , f ] pwelch ( I fil , f s )
  5:
F pks find_ peaks ( p x x , f ; f L , f H )

2.4.2. Harmonic Detection Strategy

The core of the proposed approach lies in testing whether spectral peaks exhibit harmonic relationships. After preprocessing, Functions 2 and 3 test spectral peaks for either a three-frequency harmonic set ( 2 nd , 3 rd , 4 th ) or a harmonic pair ( 2 nd / 3 rd , 3 rd / 4 th , 2 nd / 4 th ) by comparing peak-frequency ratios with the ideal set R ideal = { 3 / 2 , 4 / 3 , 2 / 1 } . Because exact integer ratios are rarely observed, comparisons use a tolerance ϵ > 0 to account for differences between the model and real data.
The harmonic detector first operates on I fil ; if no valid set is found, the proposed procedure is repeated on Q fil . This channel selection strategy increases detection robustness when one channel is affected by noise or DC offset, while reducing computational cost when harmonics are successfully detected in the first channel. To ensure temporal consistency, the final estimate f 0 must be within 5% of the value from the previous window ( | f 0 f prev | 0.05 f prev ), which helps eliminate outliers caused by noise. When both functions fail to identify HR-related harmonics, the window is labeled as ‘No Harmonic found’ ( ) and skipped. Missing HR values are subsequently imputed using a two-point average of neighboring windows: f recover = ( f prev + f next ) / 2 . In practice, approximately 10.9% of analysis windows across human subjects required this interpolation step, indicating that the detection pipeline successfully identified valid harmonics in the majority of windows.
Pseudocode below details the tolerance settings and the set/pair search. ECG-derived HR, acquired synchronously, serves solely as a reference for accuracy assessment.

Tolerance Mechanism

To account for real-world signal imperfections, the proposed method uses an adaptive tolerance criterion to control the detection of harmonic frequency sets. Initially, the base tolerance threshold was set to ϵ 0 = 0.01 , representing a 1% deviation from the ideal integer ratio (e.g., 3/2, 4/3 or 2/1), ensuring precise harmonic alignment and reducing false detections. This criterion is represented by:
f j f i R ideal ϵ 0 , with ϵ 0 = 0.01 ( 1 % )
If this condition is not met, the algorithm progressively increases the tolerance by incrementing ϵ 0 by 0.001 (0.1%) at a time until either the ratio is sufficiently close to the integer fraction or the maximum allowable tolerance ϵ m a x = 0.025 is reached. In addition to the adaptive tolerance mechanism described above, after identifying higher harmonics and calculating the fundamental frequency, the algorithm also checked the consistency of the estimated fundamental frequency by cross-checking this frequency with the results from the previous data window. This frequency consistency check ensured the following.
f 0 f prev ϵ f _ c m p × f prev
where ϵ f _ c m p = 0.05 (5%), which constrains the updated estimate f 0 to lie within ± 5 % of the previously accepted fundamental frequency. This 5% threshold is established by the windowing scheme: adjacent 20-s windows (1-s step) share 19 of 20 s, creating 95% overlap. Consequently, HR changes exceeding 5% between consecutive estimates are unlikely for stationary subjects. This tolerance mechanism effectively balances two objectives: capturing mildly noisy estimates while rejecting false detections from harmonic misidentifications or sudden outliers.

2.4.3. Harmonic Sets Detection Function

This function searches for harmonic sets by setting the current tolerance ϵ c u r r = 0.01 . After receiving a set of frequency peaks f 1 , f 2 , , f n from the previous calculation, the proposed Algorithm 2 searches to locate harmonic sets f i , f j , f k that satisfy the approximate integer ratio constraints for the second, third, and fourth harmonics.
Algorithm 2 Higher harmonics detection
Function 2: Harmonic sets detection
Require: 
F pks , ϵ 0 , ϵ max , ϵ f _ cmp , f prev
Ensure: 
( harmonics ,   orders ,   f 0 )  or Ø
  1:
ϵ curr ϵ 0
  2:
while  ϵ curr ϵ max  do
  3:
    for all sets ( f i , f j , f k ) in F pks with f i < f j < f k  do
  4:
        if  f j f i 3 2 < ϵ curr  and  f k f i 2 < ϵ curr  and  f k f j 4 3 < ϵ curr  then
  5:
            orders [ 2 , 3 , 4 ] ;     f 0 f i / 2
  6:
           if  f 0 f prev ϵ f _ cmp · f prev  then
  7:
                f prev f 0
  8:
               return  ( [ f i , f j , f k ] , [ 2 , 3 , 4 ] , f 0 )
  9:
           end if
10:
        end if
11:
    end for
12:
     ϵ curr ϵ curr + 0.001
13:
end while
14:
return Ø
The detection process assumes that f j f i 3 2 , f k f j 4 3 , f k f i 4 2 . To accomplish this, the algorithm uses nested loops with conditional checks show in Function 2. Within each iteration (the while loop), the function scans every possible set f i , f j , f k in ascending order. For each triplet, the relevant frequency ratios are computed and compared with the expected values (3/2, 2, and 4/3) to verify the following three conditions:
{ f i , f j , f k } F pks , f i < f j < f k , f j f i 3 2 < ϵ c u r r , f k f j 4 3 < ϵ c u r r , f k f i 4 2 < ϵ c u r r
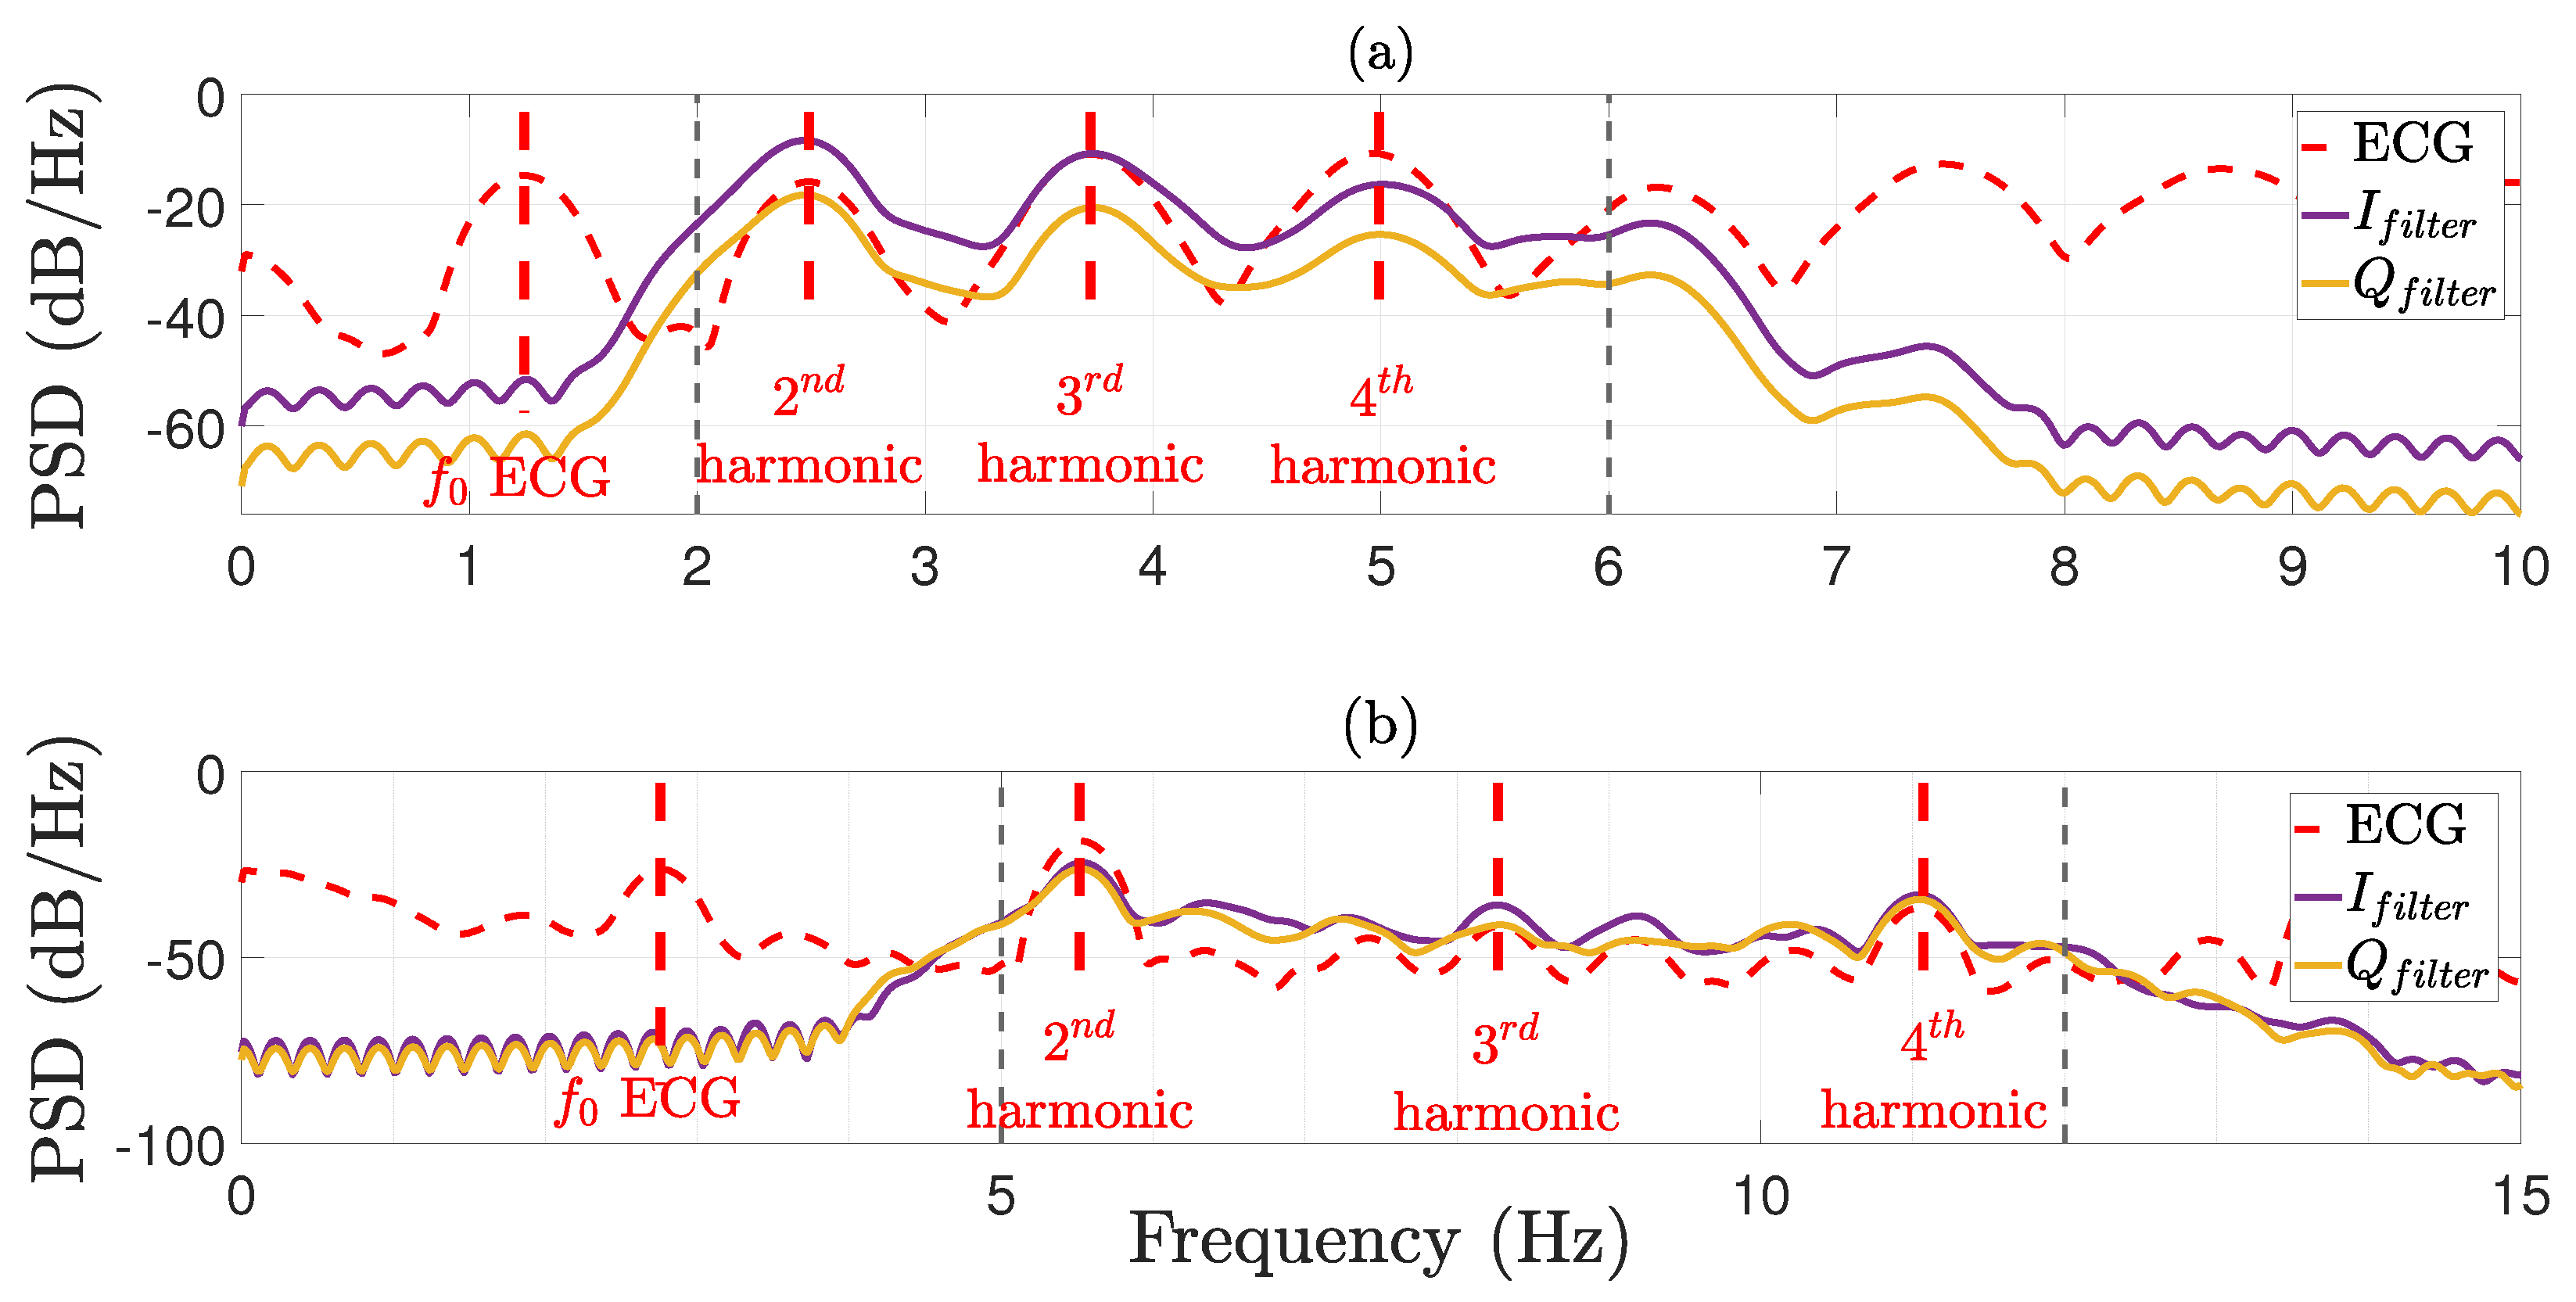
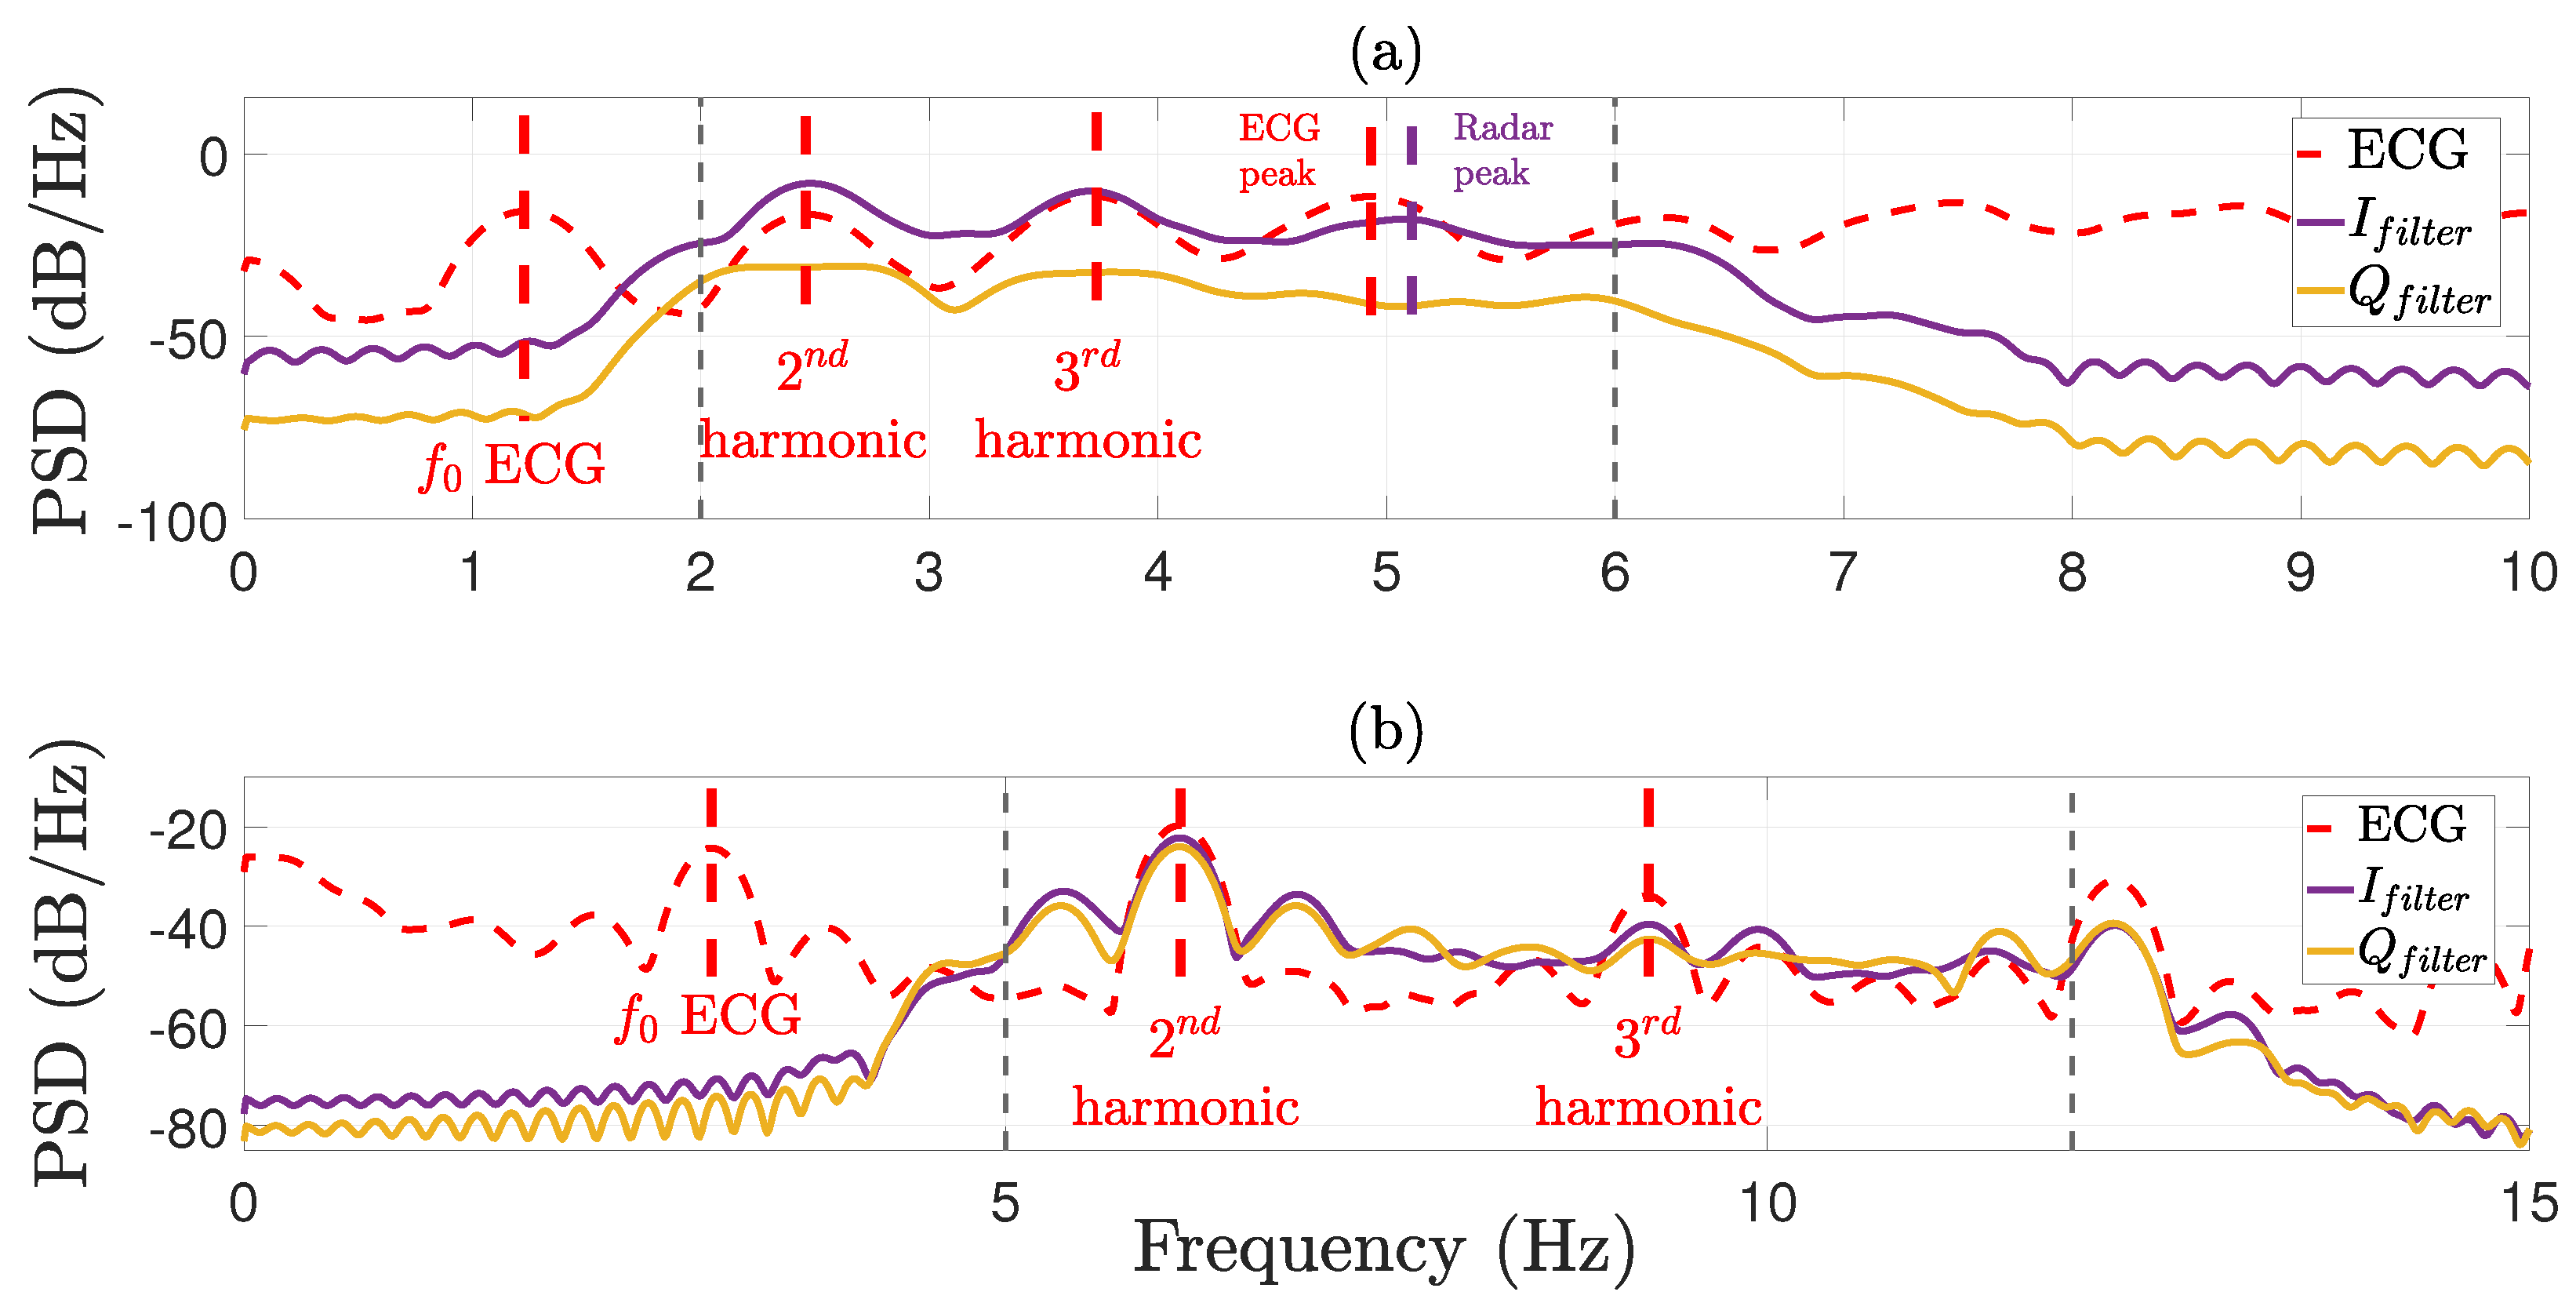
If all three conditions above are satisfied, the corresponding fundamental frequency is computed as f 0 = f i / 2 , since f i is interpreted as the 2nd harmonic. Subsequently, this estimated f 0 value is checked for consistency with the results from the previous data window, and if satisfied, the proposed algorithm accepts the estimated fundamental frequency ( f 0 ) and exits the loop. An example of a three-frequency harmonic set is shown in Figure 5.
If no valid harmonic set is found under the current tolerance, the loops complete and the algorithm increases ϵ c u r r by 0.001. This process repeats until either a set of three harmonic is found or ϵ c u r r exceeded ϵ m a x . If the tolerance reaches the maximum value ϵ m a x = 0.025 and still cannot find a valid harmonic set, the algorithm continues to the next function (harmonic pair detection).

2.4.4. Harmonic Pairs Detection Function

The pseudo code describes the method applied in this function in detail, while Figure 6 illustrates an example where the harmonic pairs are determined using this method. If no valid three-frequency harmonic set is found in the previous detection procedure, the Algorithm 3 proceeds to pair-detection procedure to handle cases where one harmonic peak is too weak or missing. Rather than searching for f i , f j , f k , this function examines every pair ( f i , f j ) of the detected peaks under the assumption that they may represent the second and third, third and fourth, or second and fourth harmonics. These pairs were mapped to:
( 2 , 3 ) f j f i 3 2 , ( 3 , 4 ) f j f i 4 3 , ( 2 , 4 ) f j f i 4 2
Similar to the previous procedure, the tolerance parameter ϵ c u r r starts from ϵ 0 and increases incrementally until it reaches ϵ m a x . At each tolerance level, the algorithm checks whether any two peaks f i < f j exhibited one of the aforementioned integer-like ratios within ϵ c u r r . Formally, for pair ( m , n ) in ( 2 , 3 ) , ( 3 , 4 ) , ( 2 , 4 ) , the algorithm checks the following condition:
f j f i n m < ϵ c u r r
Algorithm 3 Higher harmonics detection
Function 3: Harmonic pairs detection
Require: 
F pks , ϵ 0 , ϵ max , ϵ f _ cmp , f prev
Ensure: 
( harmonics , orders , f 0 )  or Ø
  1:
HarmonicPairs { [ 2 , 3 ] , [ 3 , 4 ] , [ 2 , 4 ] }
  2:
ϵ curr ϵ 0
  3:
while  ϵ curr ϵ max  do
  4:
    for all ordered pairs ( f i , f j ) in F pks with f i < f j  do
  5:
         ratio f j / f i
  6:
        for all  ( m , n ) HarmonicPairs  do
  7:
           if  ratio n m < ϵ curr  then
  8:
                f 0 f i / m
  9:
               if  f 0 f prev ϵ f _ cmp · f prev  then
10:
                    f prev f 0
11:
                   return  [ f i , f j ] , [ m , n ] , f 0
12:
               end if
13:
           end if
14:
        end for
15:
    end for
16:
     ϵ curr ϵ curr + 0.001
17:
end while
18:
return Ø
If this condition is satisfied, the pair is marked as a harmonic pair. Once a ratio match is detected, the fundamental frequency is estimated by dividing the smaller harmonic frequency f i by its corresponding order m. For example, if the pair is (2, 3) ( r a t i o 3 / 2 ) , then f 0 = f i / 2 . Similarly, if the pair is (3, 4), then f 0 = f i / 3 , and for (2, 4), the potential fundamental frequency is f 0 = f i / 2 . Same as function 2, before considering the estimated frequency, it is ensured that the newly computed f 0 remains close to the previously detected fundamental frequency using a consistency check.

3. Results

3.1. Statistical Analysis

The accuracy of the HRs estimated by the proposed algorithm was evaluated by comparing their agreement with the reference ECG signal using the measurement metrics and statistics detailed below. As described in Section 2.4, the proposed algorithm estimates HR from 20 s segments of radar signals with a 1s overlap. This approach provides HR estimates at 1-s intervals following an initial 20-s data acquisition period. All statistical analyses were performed using MATLAB (R2023b) software (MathWorks).
To evaluate agreement between the two measurement methods, we use both visual and quantitative assessment techniques. The Bland-Altman method is used to assess the agreement between the radar-estimated HR and reference ECG-derived HR. Let H R E C G ( t ) represent the reference HR at time t, derived from ECG, and H R R a d a r ( t ) denote the radar-estimated HR at the same time point. The Bland-Altman analysis focuses on two core parameters:
  • Bias is defined as the mean difference between two methods and provides a measure of the systematic difference.
  • The LoA defines the range within which 95% of the differences between two methods lie, assuming a normal distribution.
These parameters are calculated as follows:
Bias d ¯ = 1 N t = 1 N HR Radar ( t ) HR ECG ( t )
LoA = d ¯ ± 1.96 × 1 N 1 t = 1 N HR Radar ( t ) HR ECG ( t ) d ¯ 2
To complement the Bland-Altman analysis, the performance of the proposed algorithm is also evaluated using three standard error metrics: the root-mean-squared error (RMSE), mean absolute error (MAE), and mean absolute percentage error (MAPE). These metrics quantify the size of differences between radar-estimated and ECG-reference HR values:
  • The root-mean-squared error (RMSE):
    RMSE = 1 N t = 1 N HR Radar ( t ) HR ECG ( t ) 2
  • The mean absolute error (MAE) is expressed as:
    MAE = 1 N t = 1 N HR Radar ( t ) HR ECG ( t )
  • The mean absolute percentage error (MAPE) is shown as:
    MAPE = 1 N t = 1 N HR Radar ( t ) HR ECG ( t ) HR ECG ( t ) × 100 %

3.2. Heart Rate Estimation Results

Following the methodology described in Section 2.4, the statistical metrics (Bland-Altman, RMSE, MAPE, and MAE) were applied to both human and cat datasets. The tables below summarize these results and provide comparisions with previously published studies. For each subject, the mean ECG’s HR and mean radar HR estimated using the proposed algorithm were calculated in bpm, plus error metrics including RMSE, MAPE, MAE, and standard deviation. Finally, the Bland-Altman bias and LoA are provided to further evaluate the HR estimation accuracy of the proposed algorithm.
Table 1 presents the average HR estimation using the proposed method and compares it with the results obtained from the reference signal. The average HR accuracy ranged from 98.35% to 99.93%, with errors of 0.07% to 1.65%. The error metrics confirmed these findings, with an average RMSE of 1.33 bpm. The MAE and MAPE closely followed this trend, with calculated mean values of 0.86 bpm and 1.29%, respectively, which confirmed the reliability of the proposed algorithm.
The Bland-Altman analysis shows small biases, with the smallest bias of 0.07 bpm, indicating almost negligible error. The LoA were narrow, with the best case in subject 01 ranging from −1.518 bpm to 1.617 bpm, indicating strong agreement and low variability. Conversely, Subject 07 showed a broader LoA from −3.307 to 5 bpm, indicating higher variability, yet still within acceptable clinical limits according to ANSI/AAMI EC13 [46]. Subjects 02 and 09 presented more challenging conditions where the algorithm could not reliably detect harmonic sets or pairs across most analysis windows. Potential factors that may be contributed to this situation could include random body movement, respiratory interference, environmental noise, or weak cardiac signal strength. These two subjects are excluded from the average performance metrics reported above.
The algorithm demonstrated similarly high performance in feline subjects. The performance in cat subjects (Table 2) was excellent, with accuracy ranging from 99.90% to nearly 99.99% while the error percentages were significantly small, ranging from near zero to 0.31%. This indicates high precision and reliability of the radar approach for monitoring feline HR. Error metrics also confirmed proposed method accuracy, with average values for the RMSE, MAE, and MAPE of 0.393 bpm, 0.299 bpm, and 0.217%, respectively, indicating minimal deviation from the ECG reference. The Bland-Altman analysis showed an exceptionally low bias across all conditions. The smallest bias observed was −0.008 bpm, and the largest bias was only −0.13 bpm. Additionally, the LoA were significantly narrow, indicating minimal random variability in the HR estimation.
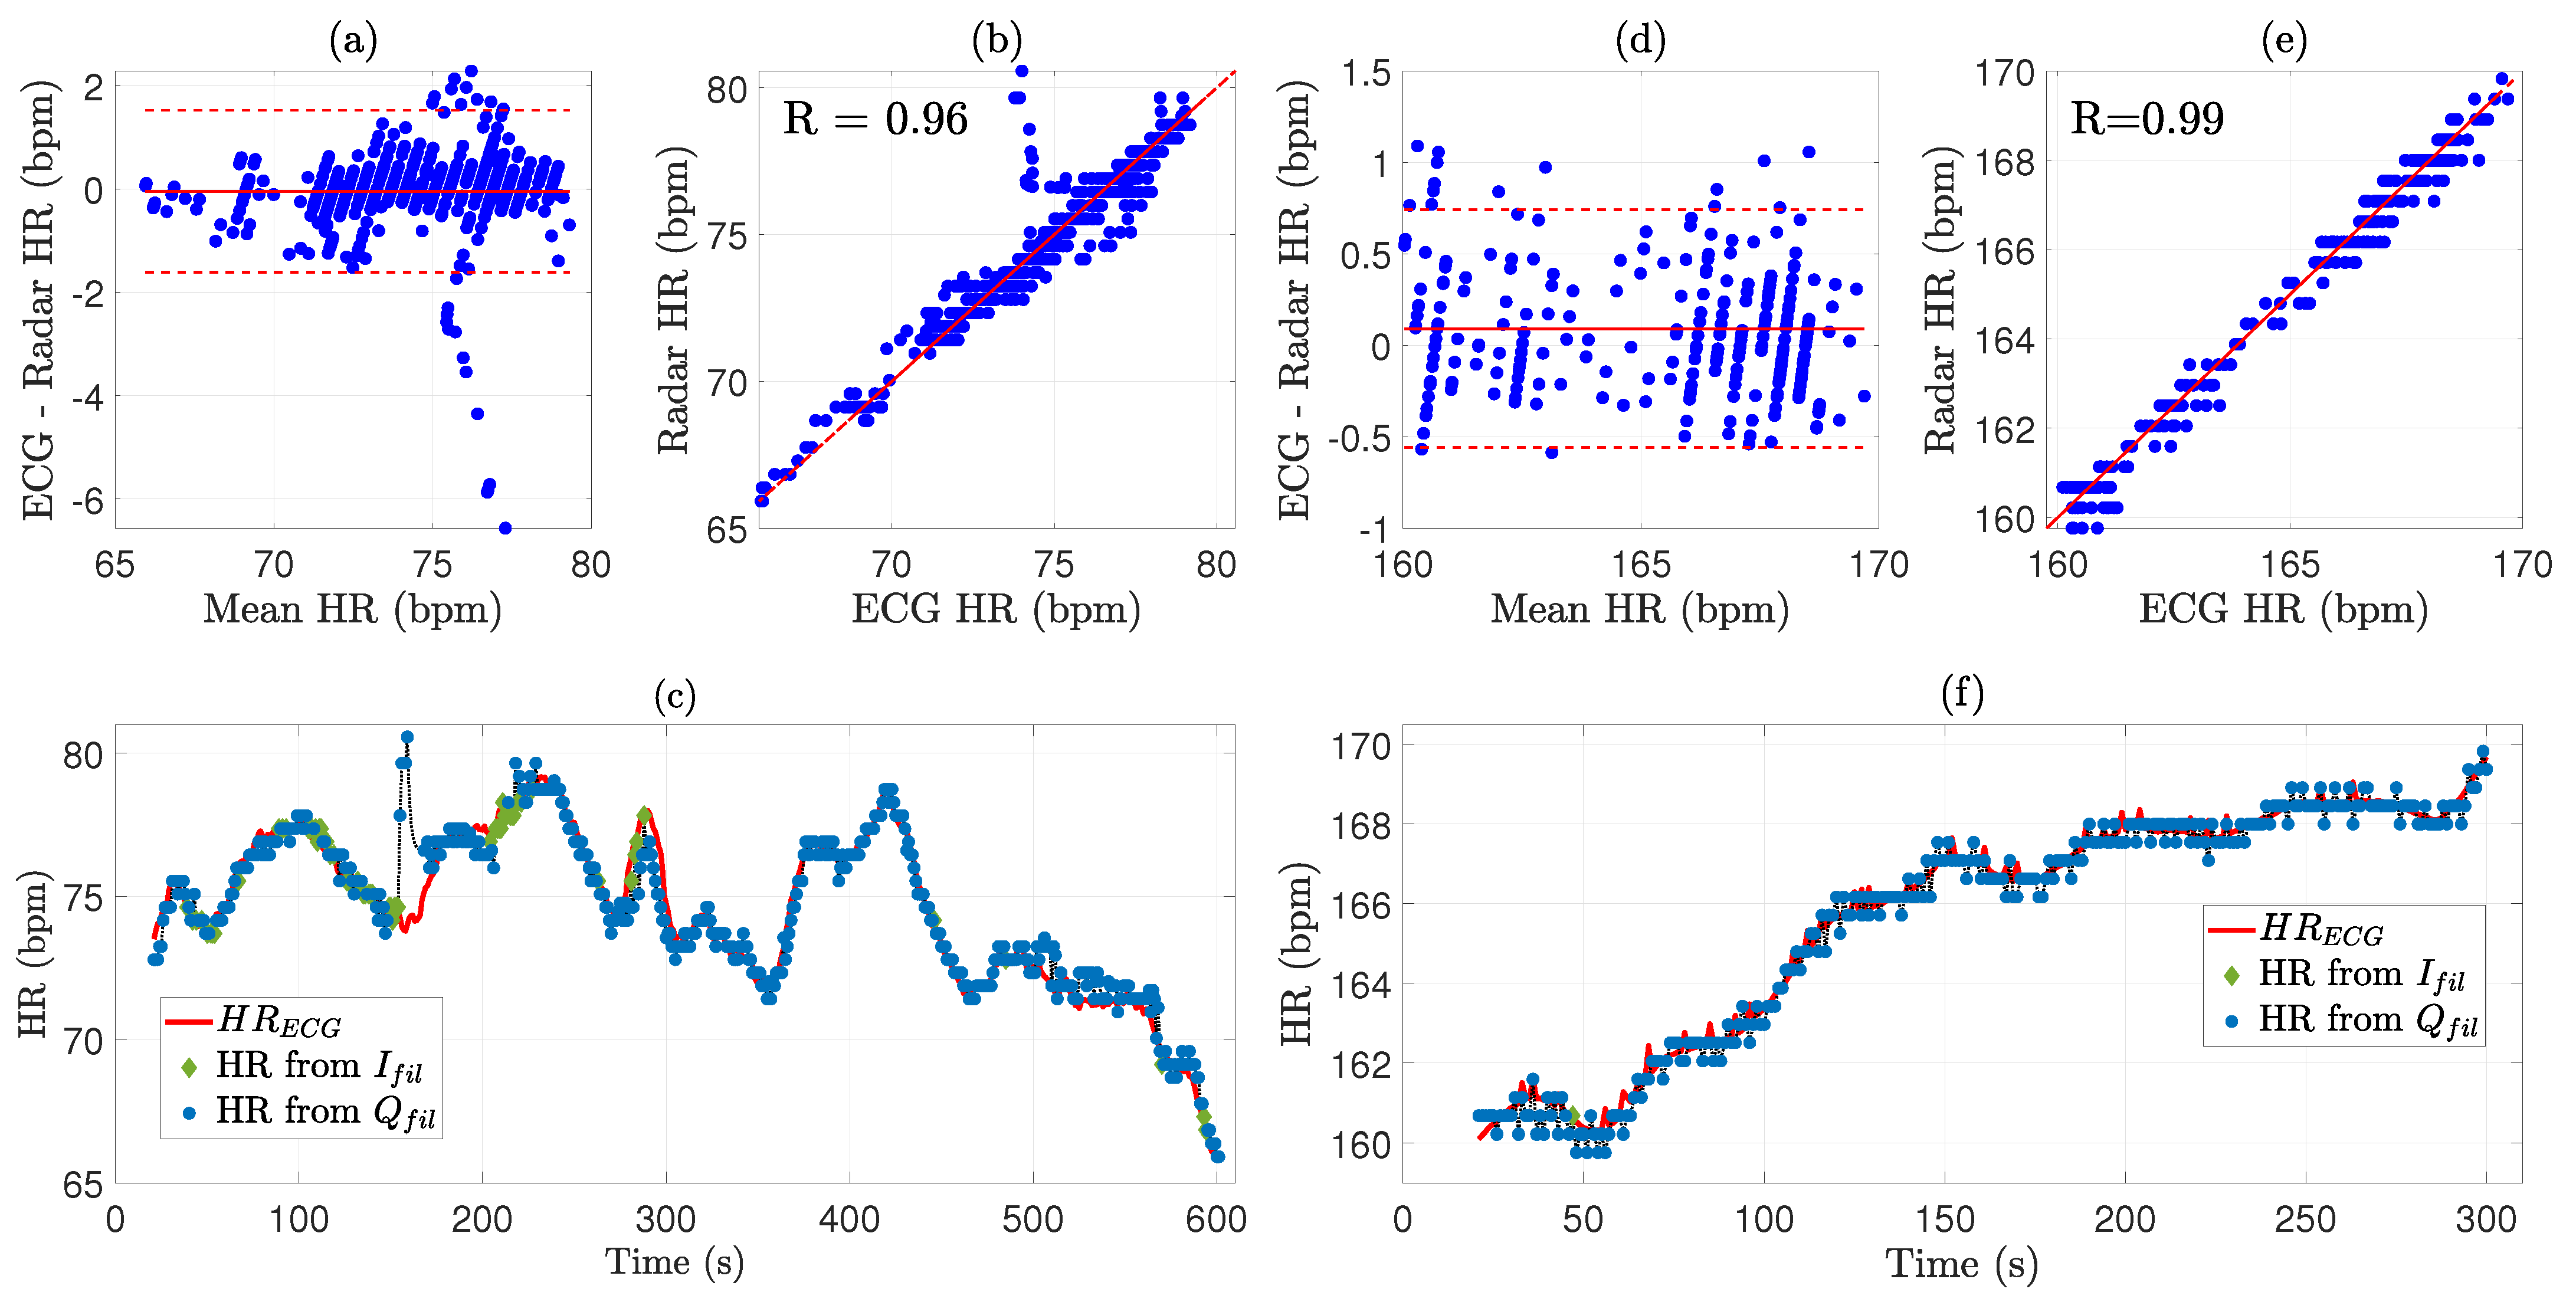
Figure 7 illustrates representative examples from both datasets through three complementary analyses. The Bland-Altman plots (Figure 7a,d) show that most data points fall within the limits of agreement, with the cat dataset exhibiting tighter clustering around the bias line (bias as low as −0.008 bpm) due to reduced motion artifacts under anesthesia. The correlation plots (Figure 7b,e) demonstrate strong linear agreement between radar-estimated and ECG-derived HR values for both species. The second-by-second tracking (Figure 7c,f) confirms the algorithm’s ability to follow real-time HR variations. Additionally, Figure 7c demonstrates the effectiveness of the channel selection processing strategy: when HR estimation from the I-channel fails or produces unreliable results, the Q-channel can still provide accurate HR values, thereby improving overall detection robustness.
To contextualize these results within the existing literature, the proposed method is compared with other recent radar-based approaches. Table 3 compares the results of the proposed method with those of other recent approaches used for human and animal HR estimation.
For human subjects, the achieved RMSE of 1.33 bpm compares favorably to FMCW radar studies including [47] (2.388 bpm), [48] (MAPE: 1.735%, MAE: 1.281 bpm), and Yao et al.’s MLE approach [43], which achieved 1.13 bpm on a private FMCW dataset but 2.056 bpm on a public radar dataset. Among CW radar methods, the achieved MAE of 0.86 bpm is comparable to Lee et al. [23] (0.87 bpm) and better than Ye and Ohtsuki [22] (2.88–4.82 bpm).
For small animal subjects, the results on cat (RMSE: 0.39 bpm, MAPE: 0.22%, MAE: 0.30 bpm) show improvement over [49] (MAPE: 2.00%, MAE: 4.03 bpm) and [50] (MAE: 3.7 bpm on dogs). The achieved MAPE of 0.22% is also comparable to Huang et al. [24], who reported average HR error of 0.33% on laboratory rats.

4. Conclusions and Discussion

This study presents a harmonic-based method for non-contact HR extraction from CW Doppler radar signals. Instead of identifying the fundamental HR frequency, which is often obscured by respiratory components, the method detects higher-order HR harmonics (2nd, 3rd, and 4th) or their pairs whose integer ratios (3/2, 4/3, 2/1) provide robust constraints for distinguishing cardiac harmonics from noise peaks. An adaptive tolerance mechanism relaxes the matching criterion from 1% to 2.5% to handle non-ideal conditions while maintaining validation through temporal consistency checks.
The proposed method was evaluated using a publicly available human dataset and an experimental cat dataset. To rigorously assess the algorithm’s robustness across different physiological conditions, the cat dataset included measurements in both supine and prone positions under varying anesthesia levels (1%, 2%, and 3% isoflurane). For human subjects, the algorithm achieved an average RMSE of 1.33 bpm (MAPE: 1.29%, MAE: 0.86 bpm), with Bland-Altman analysis showing a bias below 0.9 bpm and narrow limits of agreement (Figure 7a). For cat, performance was higher, with RMSE of 0.39 bpm (MAPE: 0.22%, MAE: 0.30 bpm) and bias below 0.14 bpm (Figure 7b). This better performance is due to anesthesia procedure, which reduced random body movements and caused more regular respiratory patterns, thereby reducing both motion artifacts and respiratory harmonic interference.
These results are competitive with recent radar-based HR monitoring studies. Compared to FMCW radar approaches [43,47,48], the proposed CW radar-based method achieves comparable or better accuracy with simpler hardware. Among CW radar methods [22,23], the proposed algorithm provides similar or improved performance without deep learning, iterative Viterbi decoding, or MUSIC algorithm. For small animal monitoring, Huang et al. [24] used harmonic analysis from 60 GHz CW radar for rat cardiorespiratory measurement with 0.33% average HR error. While their work targeted harmonics generated during radar demodulation, this study targets higher-order cardiac harmonics to avoid respiratory interference, achieving comparable performance (MAPE: 0.22%). Recently, Gharamohammadi et al. [44] proposed an FMCW radar-based cardiac monitoring system embedded in smart furniture, employing Variational Mode Decomposition (VMD) to separate cardiac from respiratory components for waveform reconstruction and HRV estimation. While both approaches address breathing harmonic interference, the methodologies differ fundamentally. Gharamohammadi et al. retain the HR fundamental frequency within a 0.8–6 Hz passband and apply iterative VMD to resolve spectral overlap, whereas the proposed method bypasses this overlap entirely by targeting higher-order harmonics above the respiratory-dominated band. This frequency-domain ratio-based approach avoids iterative decomposition, reducing computational complexity while achieving competitive HR accuracy. However, the proposed method does not currently support cardiac waveform reconstruction or beat-to-beat HRV estimation, which represents a direction for future development.
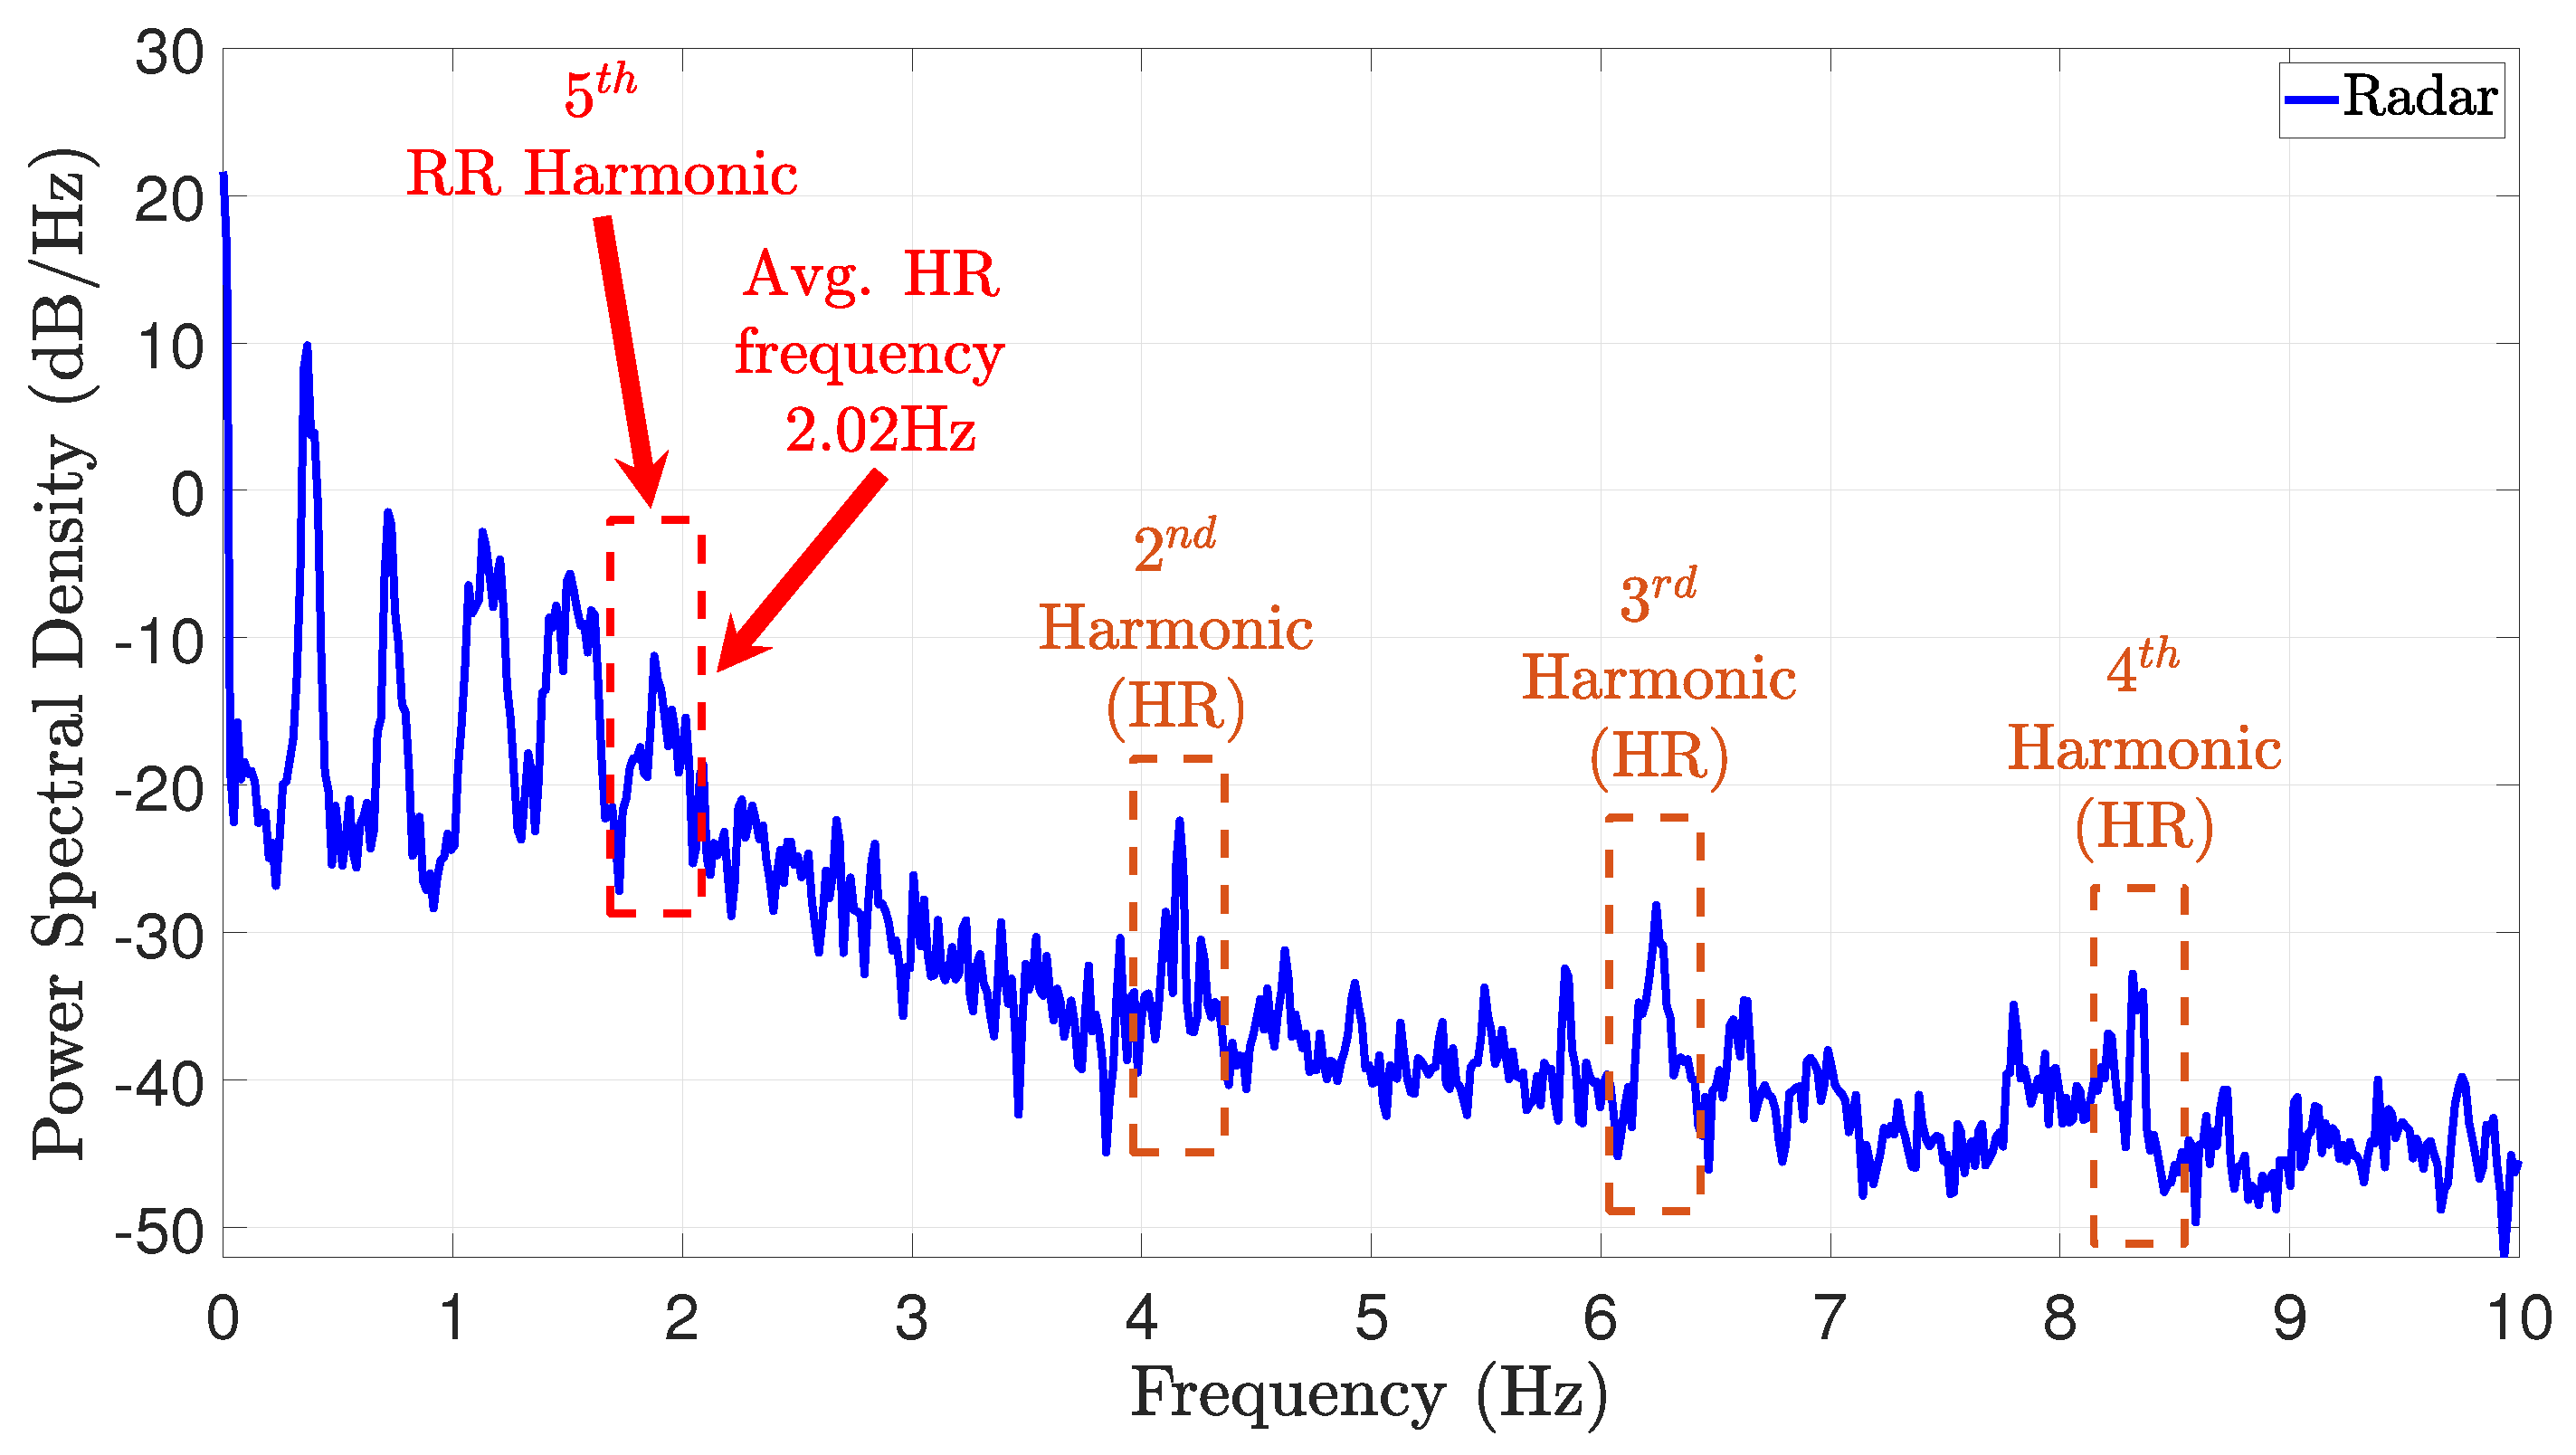
A key advantage of the harmonic-based approach is its effectiveness when the HR fundamental frequency overlaps with respiratory harmonics. Figure 8 illustrates such a case where the fundamental HR frequency overlaps with the 5th respiratory harmonic. By identifying higher-order harmonics instead, the algorithm reliably reconstructs the fundamental frequency. The harmonic pair detection further enhances robustness: when one harmonic is absent or falls outside the passband (Figure 6), the remaining harmonics still enable accurate reconstruction. Compared to methods requiring adaptive filtering, multi-stage processing, or deep learning, the proposed approach achieves competitive accuracy with lower complexity.
However, the method has several limitations that should be considered. The algorithm requires at least two detectable higher-order harmonics to reconstruct the fundamental frequency; when fewer than two harmonics are identifiable due to signal attenuation or noise interference, as observed in Subjects 02 and 09, the algorithm cannot provide reliable HR estimates. In addition, validation was conducted under static, controlled conditions. Physical movement can distort the spectral harmonic structure and disrupt the integer-ratio relationships required for detection; performance in dynamic real-world scenarios remains to be evaluated. Furthermore, the current datasets represent a limited demographic range, and generalizability across diverse ages, body compositions, and cardiovascular conditions requires further investigation. The proposed method targets HR estimation and does not support cardiac waveform reconstruction, which would require additional signal processing stages. In future clinical deployment, the respiratory signal detected by the radar can serve as a practical signal quality indicator. The presence of normal respiratory activity with absent cardiac harmonics suggests signal quality degradation, whereas simultaneous absence of both respiratory and cardiac components may indicate a critical physiological event.
Future work will address these limitations through several directions: implementing signal quality metrics to exclude unreliable segments; optimizing the detection algorithm with hybrid time-frequency approaches (e.g., wavelet transform) and shorter analysis windows to improve real-time performance and enable beat-to-beat heart rate variability (HRV) estimation; extending harmonic detection beyond the current 2nd–4th range to increase evidence points for fundamental frequency reconstruction; exploring super-resolution methods such as the MUSIC algorithm and Newton-based peak refinement to enhance spectral resolution; and validating on larger, more diverse datasets. The computational efficiency of the channel selection strategy facilitates implementation on low-power embedded platforms such as microcontrollers and IoT devices. Potential applications include veterinary monitoring, remote patient care, and long-term cardiovascular health tracking. However, further validation would be necessary for clinical implementation.

Author Contributions

Conceptualization, H.-S.N., M.K., K.I., R.T., C.-K.P. and G.S.; methodology, H.-S.N.; software, H.-S.N.; validation, H.-S.N.; formal analysis, H.-S.N.; investigation, H.-S.N., M.K., R.T., and G.S.; resources, M.K., R.T., and G.S.; data curation, H.-S.N.; writing—original draft preparation, H.-S.N.; review and editing, M.K., K.I., R.T., C.-K.P. and G.S.; visualization, H.-S.N.; supervision, G.S.; project administration, G.S.; funding acquisition, C.-K.P. and G.S. All authors have read and agreed to the published version of the manuscript.

Funding

This research was supported by JSPS KAKENHI (Grant Number: 23K11301) and JST NEXUS (Japan Grant Number JPMJNX25D4).

Data Availability Statement

The original contributions presented in this study are included in the article. Further inquiries can be directed to the corresponding author.

Conflicts of Interest

The authors declare no conflicts of interest. The funders had no role in the design of the study; in the collection, analyses, or interpretation of data; in the writing of the manuscript; or in the decision to publish the results.

References

  1. Martin, S.S.; Aday, A.W.; Allen, N.B.; Almarzooq, Z.I.; Anderson, C.A.; Arora, P.; Avery, C.L.; Baker-Smith, C.M.; Bansal, N.; Beaton, A.Z.; et al. 2025 Heart Disease and Stroke Statistics: A Report of US and Global Data From the American Heart Association. Circulation 2025, 151, e41–e660. [Google Scholar] [CrossRef] [PubMed]
  2. Dong, S.; Wen, L.; Ye, Y.; Zhang, Z.; Wang, Y.; Liu, Z.; Cao, Q.; Xu, Y.; Li, C.; Gu, C. A Review on Recent Advancements of Biomedical Radar for Clinical Applications. IEEE Open J. Eng. Med. Biol. 2024, 5, 707–724. [Google Scholar] [CrossRef]
  3. Sahu, M.L.; Atulkar, M.; Ahirwal, M.K.; Ahamad, A. Vital Sign Monitoring System for Healthcare Through IoT Based Personal Service Application. Wirel. Pers. Commun. 2022, 122, 129–156. [Google Scholar] [CrossRef]
  4. Vila, X.A.; Lado, M.J.; Cuesta-Morales, P. Evidence Based Recommendations for Designing Heart Rate Variability Studies. J. Med. Syst. 2019, 43, 311. [Google Scholar] [CrossRef]
  5. Seifizarei, S.; Elnaggar, I.; Anzanpour, A.; Sandelin, J.; Lahdenoja, O.; Glassee, M.; Castro, I.D.; Torfs, T.; Van De Poll, M.C.; Airola, A.; et al. Continuous Radar-based Heart Rate Monitoring using Autocorrelation-based Algorithm in Intensive Care Unit. IEEE J. Biomed. Health Inform. 2025, 1–9. [Google Scholar] [CrossRef] [PubMed]
  6. Churpek, M.M.; Adhikari, R.; Edelson, D.P. The value of vital sign trends for detecting clinical deterioration on the wards. Resuscitation 2016, 102, 1–5. [Google Scholar] [CrossRef]
  7. Kellett, J.; Murray, A.; Woodworth, S.; Huang, W. Trends in weighted vital signs and the clinical course of 44,531 acutely ill medical patients while in hospital. Acute Med. J. 2015, 14, 3–9. [Google Scholar] [CrossRef]
  8. Sonu, S.Y.; Usha, L.; Karthik, S. Contactless Methods for Monitoring Vital Parameters: Systematic Literature Review. In Proceedings of the 2024 First International Conference on Software, Systems and Information Technology (SSITCON), Tumkur, India, 18–19 October 2024; pp. 1–6. [Google Scholar] [CrossRef]
  9. Krbec, B.A.; Zhang, X.; Chityat, I.; Brady-Mine, A.; Linton, E.; Copeland, D.; Anthony, B.W.; Edelman, E.R.; Davis, J.M. Emerging innovations in neonatal monitoring: A comprehensive review of progress and potential for non-contact technologies. Front. Pediatr. 2024, 12, 1442753. [Google Scholar] [CrossRef] [PubMed]
  10. Lee, H.; Kim, B.H.; Park, J.K.; Kim, S.W.; Yook, J.G. A Resolution Enhancement Technique for Remote Monitoring of the Vital Signs of Multiple Subjects Using a 24 Ghz Bandwidth-Limited FMCW Radar. IEEE Access 2020, 8, 1240–1248. [Google Scholar] [CrossRef]
  11. Wang, Y.; Yang, Z.; Han, L.; Li, Y.; Zhang, C. Extraction of Vital Sign Based on Improved Complete Ensemble Empirical Mode Decomposition with Adaptive Noise for UWB radar. In Proceedings of the 2023 IEEE 6th International Electrical and Energy Conference (CIEEC), Hefei, China, 12–14 May 2023; pp. 2829–2834. [Google Scholar] [CrossRef]
  12. Peng, Z.; Munoz-Ferreras, J.M.; Tang, Y.; Liu, C.; Gomez-Garcia, R.; Ran, L.; Li, C. A Portable FMCW Interferometry Radar with Programmable Low-IF Architecture for Localization, ISAR Imaging, and Vital Sign Tracking. IEEE Trans. Microw. Theory Tech. 2017, 65, 1334–1344. [Google Scholar] [CrossRef]
  13. Xiang, M.; Ren, W.; Li, W.; Xue, Z.; Jiang, X. High-Precision Vital Signs Monitoring Method Using a FMCW Millimeter-Wave Sensor. Sensors 2022, 22, 7543. [Google Scholar] [CrossRef]
  14. Kebe, M.; Gadhafi, R.; Mohammad, B.; Sanduleanu, M.; Saleh, H.; Al-Qutayri, M. Human Vital Signs Detection Methods and Potential Using Radars: A Review. Sensors 2020, 20, 1454. [Google Scholar] [CrossRef] [PubMed]
  15. Liang, S.D. Sense-through-wall human detection based on UWB radar sensors. Signal Process. 2016, 126, 117–124. [Google Scholar] [CrossRef]
  16. Buyukhan, C.; Karamzadeh, S.; Orhan, M.; Caliskan, A.; Cilesiz, I. Experimental study of human respiratory detection using UWB GPR. In Proceedings of the 2017 4th International Conference on Electrical and Electronic Engineering (ICEEE), Ankara, Turkey, 8–10 April 2017; pp. 314–317. [Google Scholar] [CrossRef]
  17. Lee, Y.; Park, J.Y.; Choi, Y.W.; Park, H.K.; Cho, S.H.; Cho, S.H.; Lim, Y.H. A Novel Non-contact Heart Rate Monitor Using Impulse-Radio Ultra-Wideband (IR-UWB) Radar Technology. Sci. Rep. 2018, 8, 13053. [Google Scholar] [CrossRef]
  18. Li, C.; Lubecke, V.M.; Boric-Lubecke, O.; Lin, J. A Review on Recent Advances in Doppler Radar Sensors for Noncontact Healthcare Monitoring. IEEE Trans. Microw. Theory Tech. 2013, 61, 2046–2060. [Google Scholar] [CrossRef]
  19. Lu, L.; Li, C.; Rice, J.A. A software-defined multifunctional radar sensor for linear and reciprocal displacement measurement. In Proceedings of the 2011 IEEE Topical Conference on Wireless Sensors and Sensor Networks, Phoenix, AZ, USA, 16–19 January 2011; pp. 17–20. [Google Scholar] [CrossRef]
  20. Gu, C.; Li, R.; Li, C.; Jiang, S.B. Doppler radar respiration measurement for gated lung cancer radiotherapy. In Proceedings of the 2011 IEEE Topical Conference on Biomedical Wireless Technologies, Networks, and Sensing Systems, Phoenix, AZ, USA, 16–19 January 2011; pp. 91–94. [Google Scholar] [CrossRef]
  21. Huang, M.C.; Liu, J.J.; Xu, W.; Gu, C.; Li, C.; Sarrafzadeh, M. A Self-Calibrating Radar Sensor System for Measuring Vital Signs. IEEE Trans. Biomed. Circuits Syst. 2016, 10, 352–363. [Google Scholar] [CrossRef] [PubMed]
  22. Ye, C.; Ohtsuki, T. Spectral Viterbi Algorithm for Contactless Wide-Range Heart Rate Estimation with Deep Clustering. IEEE Trans. Microw. Theory Tech. 2021, 69, 2629–2641. [Google Scholar] [CrossRef]
  23. Lee, K.J.; Park, C.; Lee, B. Tracking driver’s heart rate by continuous-wave Doppler radar. In Proceedings of the 2016 38th Annual International Conference of the IEEE Engineering in Medicine and Biology Society (EMBC), Orlando, FL, USA, 16–20 August 2016; pp. 5417–5420. [Google Scholar] [CrossRef]
  24. Huang, T.Y.; Hayward, L.F.; Lin, J. Noninvasive Measurement and Analysis of Laboratory Rat’s Cardiorespiratory Movement. IEEE Trans. Microw. Theory Tech. 2017, 65, 574–581. [Google Scholar] [CrossRef]
  25. Zhang, Y.; Yang, R.; Yue, Y.; Lim, E.G.; Wang, Z. An Overview of Algorithms for Contactless Cardiac Feature Extraction from Radar Signals: Advances and Challenges. IEEE Trans. Instrum. Meas. 2023, 72, 4009520. [Google Scholar] [CrossRef]
  26. Gong, J.; Zhang, X.; Lin, K.; Ren, J.; Zhang, Y.; Qiu, W. RF Vital Sign Sensing under Free Body Movement. Proc. ACM Interact. Mob. Wearable Ubiquitous Technol. 2021, 5, 1–22. [Google Scholar] [CrossRef]
  27. Edanami, K. Medical Radar Signal Dataset. 2021. Available online: https://data.mendeley.com/datasets/6rp6wrd2pr/2 (accessed on 1 December 2025).
  28. Xiong, Y.; Chen, S.; Dong, X.; Peng, Z.; Zhang, W. Accurate Measurement in Doppler Radar Vital Sign Detection Based on Parameterized Demodulation. IEEE Trans. Microw. Theory Tech. 2017, 65, 4483–4492. [Google Scholar] [CrossRef]
  29. Petrovic, V.L.; Jankovic, M.M.; Lupsic, A.V.; Mihajlovic, V.R.; Popovic-Bozovic, J.S. High-Accuracy Real-Time Monitoring of Heart Rate Variability Using 24 GHz Continuous-Wave Doppler Radar. IEEE Access 2019, 7, 74721–74733. [Google Scholar] [CrossRef]
  30. Widrow, B.; Glover, J.; McCool, J.; Kaunitz, J.; Williams, C.; Hearn, R.; Zeidler, J.; Eugene Dong, J.; Goodlin, R. Adaptive noise cancelling: Principles and applications. Proc. IEEE 1975, 63, 1692–1716. [Google Scholar] [CrossRef]
  31. Yang, Z.K.; Shi, H.; Zhao, S.; Huang, X.D. Vital Sign Detection during Large-Scale and Fast Body Movements Based on an Adaptive Noise Cancellation Algorithm Using a Single Doppler Radar Sensor. Sensors 2020, 20, 4183. [Google Scholar] [CrossRef]
  32. Zhu, F.; Wang, K.; Wu, K. A Fundamental-and-Harmonic Dual-Frequency Doppler Radar System for Vital Signs Detection Enabling Radar Movement Self-Cancellation. IEEE Trans. Microw. Theory Tech. 2018, 66, 5106–5118. [Google Scholar] [CrossRef]
  33. Zhao, M.; Adib, F.; Katabi, D. Emotion recognition using wireless signals. In Proceedings of the 22nd Annual International Conference on Mobile Computing and Networking, New York City, NY, USA, 3–7 October 2016; pp. 95–108. [Google Scholar] [CrossRef]
  34. Le, M. Heartbeat extraction based on a high order derivative for ultra-wideband impulse radar application. J. Phys. D Appl. Phys. 2020, 53, 18LT02. [Google Scholar] [CrossRef]
  35. Xiong, Y.; Peng, Z.; Gu, C.; Li, S.; Wang, D.; Zhang, W. Differential Enhancement Method for Robust and Accurate Heart Rate Monitoring via Microwave Vital Sign Sensing. IEEE Trans. Instrum. Meas. 2020, 69, 7108–7118. [Google Scholar] [CrossRef]
  36. Tu, J.; Lin, J. Fast Acquisition of Heart Rate in Noncontact Vital Sign Radar Measurement Using Time-Window-Variation Technique. IEEE Trans. Instrum. Meas. 2016, 65, 112–122. [Google Scholar] [CrossRef]
  37. Mercuri, M.; Soh, P.J.; Pandey, G.; Karsmakers, P.; Vandenbosch, G.A.E.; Leroux, P.; Schreurs, D. Analysis of an Indoor Biomedical Radar-Based System for Health Monitoring. IEEE Trans. Microw. Theory Tech. 2013, 61, 2061–2068. [Google Scholar] [CrossRef]
  38. Hu, W.; Zhang, H.; Zhao, Z.; Wang, Y.; Wang, X. Real-time remote vital sign detection using a portable Doppler sensor system. In Proceedings of the 2014 IEEE Sensors Applications Symposium (SAS), Queenstown, New Zealand, 18–20 February 2014; pp. 89–93. [Google Scholar] [CrossRef]
  39. Park, J.; Ham, J.W.; Park, S.; Kim, D.H.; Park, S.J.; Kang, H.; Park, S.O. Polyphase-Basis Discrete Cosine Transform for Real-Time Measurement of Heart Rate With CW Doppler Radar. IEEE Trans. Microw. Theory Tech. 2018, 66, 1644–1659. [Google Scholar] [CrossRef]
  40. Shih, J.Y.; Wang, F.K. Quadrature Cosine Transform (QCT) With Varying Window Length (VWL) Technique for Noncontact Vital Sign Monitoring Using a Continuous-Wave (CW) Radar. IEEE Trans. Microw. Theory Tech. 2022, 70, 1639–1650. [Google Scholar] [CrossRef]
  41. Tomii, S.; Ohtsuki, T. Heartbeat detection by using Doppler radar with wavelet transform based on scale factor learning. In Proceedings of the 2015 IEEE International Conference on Communications (ICC), London, UK, 8–12 June 2015; pp. 483–488. [Google Scholar] [CrossRef]
  42. Li, M.; Lin, J. Wavelet-Transform-Based Data-Length-Variation Technique for Fast Heart Rate Detection Using 5.8-GHz CW Doppler Radar. IEEE Trans. Microw. Theory Tech. 2018, 66, 568–576. [Google Scholar] [CrossRef]
  43. Yao, S.; Cong, J.; Li, D.; Deng, Z. Noncontact Vital Sign Monitoring With FMCW Radar via Maximum Likelihood Estimation. IEEE Internet Things J. 2024, 11, 38686–38703. [Google Scholar] [CrossRef]
  44. Gharamohammadi, A.; Bagheri, M.O.; Abu-Sardanah, S.; Ramahi, O.M. Smart furniture using radar technology for cardiac health monitoring. Sci. Rep. 2025, 15, 1392. [Google Scholar] [CrossRef]
  45. Ramachandran, G.; Singh, M. Three-dimensional reconstruction of cardiac displacement patterns on the chest wall during the P, QRS and T-segments of the ECG by laser speckle inteferometry. Med. Biol. Eng. Comput. 1989, 27, 525–530. [Google Scholar] [CrossRef] [PubMed]
  46. ANSI/AAMI EC13:2002/(R)2007; Cardiac Monitors, Heart Rate Meters, and Alarms. American National Standard: Washington, DC, USA, 2007.
  47. Sun, L.; Huang, S.; Li, Y.; Gu, C.; Pan, H.; Hong, H.; Zhu, X. Remote Measurement of Human Vital Signs Based on Joint-Range Adaptive EEMD. IEEE Access 2020, 8, 68514–68524. [Google Scholar] [CrossRef]
  48. Ling, Z.; Zhou, W.; Ren, Y.; Wang, J.; Guo, L. Non-Contact Heart Rate Monitoring Based on Millimeter Wave Radar. IEEE Access 2022, 10, 74033–74044. [Google Scholar] [CrossRef]
  49. Pitafi, Z.F.; Song, Y.; Xie, Z.; Brainard, B.; Song, W. Contactless Vital Signs Monitoring for Animals. IEEE Internet Things J. 2025, 12, 16789–16796. [Google Scholar] [CrossRef]
  50. Ahmed, S.; Yoon, S.; Cho, S.H. A public dataset of dogs vital signs recorded with ultra wideband radar and reference sensors. Sci. Data 2024, 11, 107. [Google Scholar] [CrossRef]
Figure 1. CW-Doppler radar principle for vital sign detection.
Signals 07 00024 g001
Figure 2. Configuration of non-contact heart rate monitoring: (a) published human dataset experiment, and (b) anesthetized cat data monitoring experiment.
Signals 07 00024 g002
Figure 3. Proposed signal processing flowchart illustrating three main functions: (a) preprocessing, (b) harmonic sets detection with adaptive tolerance, and (c) harmonic pairs detection with adaptive tolerance.
Signals 07 00024 g003
Figure 4. An example of: I & Q signal in (a) total time, (b) 20-s data window in time domain, and PSD of the I signal (c) and Q signal (d) after bandpass filtering ( I f i l & Q f i l ) showing all potential harmonic peaks within the cut-off frequency range.
Signals 07 00024 g004
Figure 5. Harmonic sets (2nd, 3rd, 4th) found in the cut-off frequency range by the proposed algorithm in (a) human and (b) cat data.
Signals 07 00024 g005
Figure 6. Harmonic pair (2nd, 3rd) found in cut-off frequency range by the proposed algorithm in both: (a) human and (b) cat data.
Signals 07 00024 g006
Figure 7. Examples of estimated HR results from two datasets. Human dataset: (a) Bland-Altman analysis, (b) correlation coefficient, and (c) second-by-second HR estimation. Cat dataset: (d) Bland-Altman analysis, (e) correlation coefficient, and (f) second-by-second HR estimation.
Signals 07 00024 g007
Figure 8. An example of HR fundamental frequency overlapped by RR higher harmonics.
Signals 07 00024 g008
Table 1. Human HR estimation results.
SubjectAvg. HR (bpm)HRAcc.
(%)
Error
(%)
RMSE
(bpm)
MAPE
(%)
MAE
(bpm)
Bland-Altman Analysis (bpm)
ECGRadarBiasLLoAULoA
0174.6474.5999.930.070.8010.5840.4390.049−1.5181.617
02 *NaNNaNNaNNaNNaNNaNNaNNaNNaNNaN
0371.3371.6299.590.410.8080.6790.485−0.294−1.7711.182
0470.5570.7699.710.290.6580.5900.419−0.205−1.4321.021
0561.8961.1898.841.161.8351.7591.0950.718−2.5954.031
0683.4082.7599.220.781.5791.2731.0640.647−2.1803.473
0768.8568.0098.771.232.2802.2481.5370.847−3.3075.000
0853.7254.6098.351.651.3501.8891.016-0.886−2.8831.111
09 *NaNNaNNaNNaNNaNNaNNaNNaNNaNNaN
*: Subjects 02 and 09 are reported as NaN (Not a Number) because no harmonic peaks were detectable for most analysis windows. These subjects are excluded from the average performance metrics.
Table 2. Cat HR estimation result.
Posture & Anesthesia
Concentration
HR Average (bpm)HR Acc.
(%)
Error
(%)
RMSE
(bpm)
MAPE
(%)
MAE
(bpm)
Bland–Altman Analysis (bpm)
ECG Radar Bias LLoA ULoA
Supine, 3%126.81126.9499.900.100.3760.2390.303−0.125−0.8200.571
Supine, 2%123.89124.0299.900.100.4430.2830.351−0.130−0.9620.702
Supine, 1%121.29121.3699.940.060.5820.3690.446−0.073−1.2061.061
Prone, 1%165.59165.6899.950.050.3430.1580.261−0.091−0.7400.559
Prone, 2%179.68179.6999.990.010.2400.1040.186−0.015−0.4860.456
Prone, 3%167.93167.9499.990.010.3720.1470.246−0.008−0.7380.722
Table 3. Comparison of HR accuracy between the proposed method and previous works.
StudyDatasetRadar TypeAvg. RMSE
(bpm)
Avg. MAPE
(%)
Avg. MAE
(bpm)
Sun et al. (2020) [47]HumanFMCW-Radar/Empirical Mode Decomposition2.388
Yao et al. (2024) [43]HumanFMCW-Radar/Maximum
Likelihood Estimation
Private: 1.13
Public: 2.056
Ling et al. (2022) [48]HumanFMCW-Radar/Filter + Empirical
Wavelet Transform
1.7351.281
Ye & Ohtsuki (2021) [22]HumanCW Radar/Spectral Viterbi + Deep Clustering3.78–6.222.88–4.82
Lee et al. (2016) [23]HumanCW Radar/MUSIC algorithm0.87
This studyHumanCW-Radar/Filtering harmonics find1.3301.2890.865
Pitafi et al. [49]Cat/Dog4.5 Hz Geophone sensor/Filtering +
Auto-correlation
2.0004.030
Ahmed et al. (2024) [50]DogUWB Radar/FFT + Filtering3.700
Huang et al. (2017) [24]Rat60 GHz CW Radar/Nonlinear
demodulation + Harmonics
0.33
This studyCatCW-Radar/Filtering harmonics find0.3930.2170.299
Disclaimer/Publisher’s Note: The statements, opinions and data contained in all publications are solely those of the individual author(s) and contributor(s) and not of MDPI and/or the editor(s). MDPI and/or the editor(s) disclaim responsibility for any injury to people or property resulting from any ideas, methods, instructions or products referred to in the content.