Article

Infrared Thermographic Signal Analysis of Bioactive Edible Oils Using CNNs for Quality Assessment

by
Danilo Pratticò
1,* and
Filippo Laganà
2,*
1
DICEAM Department, “Mediterranea” University, 89122 Reggio Calabria, Italy
2
Laboratory of Biomedical Applications Technologies and Sensors (BATS), Department of Health Science, “Magna Græcia” University, 88100 Catanzaro, Italy
*
Authors to whom correspondence should be addressed.
Signals 2025, 6(3), 38; https://doi.org/10.3390/signals6030038 (registering DOI)
Submission received: 25 June 2025 / Revised: 24 July 2025 / Accepted: 28 July 2025 / Published: 1 August 2025

Abstract

Nutrition plays a fundamental role in promoting health and preventing chronic diseases, with bioactive food components offering a therapeutic potential in biomedical applications. Among these, edible oils are recognised for their functional properties, which contribute to disease prevention and metabolic regulation. The proposed study aims to evaluate the quality of four bioactive oils (olive oil, sunflower oil, tomato seed oil, and pumpkin seed oil) by analysing their thermal behaviour through infrared (IR) imaging. The study designed a customised electronic system to acquire thermographic signals under controlled temperature and humidity conditions. The acquisition system was used to extract thermal data. Analysis of the acquired thermal signals revealed characteristic heat absorption profiles used to infer differences in oil properties related to stability and degradation potential. A hybrid deep learning model that integrates Convolutional Neural Networks (CNNs) with Long Short-Term Memory (LSTM) units was used to classify and differentiate the oils based on stability, thermal reactivity, and potential health benefits. A signal analysis showed that the AI-based method improves both the accuracy (achieving an F1-score of 93.66%) and the repeatability of quality assessments, providing a non-invasive and intelligent framework for the validation and traceability of nutritional compounds.

1. Introduction

Recently, scientific studies have investigated the effects of certain foods on physical well-being, both in preventive and therapeutic terms [1,2]. Among the foods that have attracted particular interest, edible oils have significant characteristics because they contain monounsaturated and polyunsaturated fatty acids, tocopherols, phytosterols, and polyphenols, which promote cardiovascular, metabolic, and neuroprotective health [3,4].
The techniques currently used for assessing oil quality, such as chromatography and spectroscopy, while effective, are time-consuming and involve highly expensive and delicate processes [5,6]. Therefore, the exploration of alternative methods that offer rapid and reliable evaluation contributes to the positive integration of quality control protocols for nutraceutical and biomedical products. Infrared (IR) thermography has attracted attention as a non-invasive method capable of detecting subtle thermal variations related to the physical and chemical properties of oils [7,8]. Studies [9,10,11] have demonstrated the use of active infrared thermography to distinguish edible oils by observing their thermal response to localised laser heating. Specifically, studies have employed lock-in thermography to discriminate between refined and virgin edible oils, revealing distinct thermal wave attenuation profiles related to compositional differences [12,13]. Additional techniques based on phase-sensitive infrared imaging have also demonstrated a high sensitivity in detecting material differences under thermal excitation [14]. Recent research has also proposed lightweight Convolutional Neural Network architectures for thermographic signal classification in embedded systems, emphasising energy efficiency and real-time performance [15]. These approaches highlight the growing interest in combining thermographic sensing with AI, although some remain limited by the complexity of instrumentation or lack of standardisation for food-based samples [16,17]. However, the identified issues have highlighted limitations related to the complexity of the equipment. Other studies have used Fourier Transform Infrared (FTIR) spectroscopy to monitor oxidative degradation in various edible oils [18,19]. Indeed, FTIR spectroscopy has been used to assess the progression of lipid oxidation in vegetable oils subjected to accelerated thermal ageing, highlighting changes in the absorption peaks of carbonyls and hydroperoxides [20,21]. By analysing specific absorption bands corresponding to carbonyl compounds and unsaturated bonds, the cited studies have quantified changes induced by thermal and oxidative stress [22,23]. Although they are highly informative, FTIR methods can suffer from overlapping spectra, requiring deconvolution techniques and extensive calibration, especially when analysing complex mixtures of oils or degraded samples [24]. Data from measurement campaigns using traditional techniques have, in some studies, been implemented with machine learning (ML) algorithms [25,26,27]. For example, support vector machines and random forests have been applied to FTIR and NIR spectral data to predict oxidation levels and classify oil types, achieving moderate accuracy depending on preprocessing and dataset variability [28,29]. The results obtained, while acceptable, show how intelligent algorithms can extract relevant models from complex signals but are highly dependent on the size and diversity of the training datasets. Although each of these methods present valuable contributions, they are not without critical gaps when considered from the perspective of biomedical applications [30,31]. In particular, each cited study lacks a standardised, interpretable, and field-usable system capable of evaluating oil quality in accordance with the safety, traceability, and non-destructiveness requirements typical of biomedical and clinical environments. The present study proposes a passive infrared thermography-based approach to assess the thermal behaviour in order to deduce quality indicators for bioactive edible oils. The measurement campaign conducted observes heating and cooling dynamics in a controlled but replicable environment. The custom-designed electronic system comprising an uncooled infrared camera and a Peltier-based heating stage performed the thermographic analysis on the samples. The system ensures reproducibility and allows the passive acquisition of thermal signatures without external thermal excitation. The system finds scientific answers from studies applied to signal analysis in various fields of application [32,33,34]. The method allows the extraction of physical metrics such as thermal inertia, gradient uniformity, and cooling rate, characteristics that are closely related to oil composition, oxidation level, and structural integrity [35]. The rationale for using thermographic analysis to characterise edible oils is rooted in the physical response of lipid matrices to thermal excitation [36,37]. Oils with different biochemical structures, such as different levels of saturation, chain length, and antioxidant composition, demonstrate distinct behaviours in heat absorption, retention, and dissipation [38,39]. These behaviours, although not directly related to metabolic or clinical effects, reflect compositional differences and underlying stability characteristics, which are particularly important for assessing degradation or oxidation under processing conditions.
Although thermal behaviour alone does not directly reflect metabolic or clinical parameters, thermographic features may serve as indirect indicators of molecular structure, compositional stability, or oxidative susceptibility. Prior studies have suggested that thermal diffusivity and heat retention in edible oils may correlate with levels of lipid peroxidation, oxidation products, and antioxidant content [40,41]. However, the findings presented herein remain exploratory and should be interpreted as preliminary evidence, pending further biochemical validation through chromatographic or spectrophotometric assays. Therefore, thermal signal patterns can serve as a non-invasive proxy for inferring quality attributes, which is in agreement with previous work on the thermal profiling of lipids [42,43].
Unlike conventional methods, the proposed system does not require reagents, sample contact, or complex calibrations. In fact, the aim of the research is to offer a practical route to non-invasive quality validation. The degree of innovativeness includes the introduction of the novel concept of thermal memory, i.e., the oil’s ability to store and release heat consistently through thermal cycles. This indicator is proposed as a non-invasive proxy for biochemical stability and susceptibility to degradation, based on thermal signature analysis [44,45,46]. The thermal indicators extracted during the measurement campaign are integrated into artificial intelligence-assisted quality control pipelines. Specifically, the proposed model integrates a Convolutional Neural Network (CNN) with a Long Short-Term Memory (LSTM) network to process thermographic sequences of bioactive edible oils. The use of a CNN-LSTM hybrid architecture is specifically motivated by the spatiotemporal nature of thermographic signals. The CNN component is responsible for extracting spatial features from each infrared frame, capturing localised temperature gradients and distributions that may reflect structural and compositional differences between oil types. These spatial representations are then passed to the LSTM network, which is well-suited to model temporal dependencies and trends across sequential frames, representing heating and cooling dynamics over time. This combination allows the system to learn both static thermal characteristics and their evolution, which is crucial for the accurate classification of oils based on thermal response patterns. Similar deep hybrid models have been successfully applied in thermal imaging and biomedical signal processing contexts where both spatial and dynamic properties are essential [47,48]. The CNN component is responsible for automatic spatial feature extraction from individual infrared frames, capturing localised temperature distributions.
These spatial representations are then passed to the LSTM layer, which models the temporal evolution of thermal behaviour across heating and cooling cycles. This hybrid CNN-LSTM architecture is explicitly designed to capture both spatial and temporal patterns in thermal signals, enabling the robust classification of different oil types and ensuring generalisation across varying batch conditions and acquisition scenarios. Although the proposed approach demonstrates promising results, further work will include comparative ablation studies with CNN-only and LSTM-only architectures to quantify the added value of temporal modelling. Hyperparameter sensitivity analysis and model simplification will also be evaluated to ensure explainability and portability across embedded platforms. The proposed framework shows promise for real-time quality monitoring in production lines; additional optimisation and embedded system testing are required to validate its performance under real-time industrial constraints.
This document is organised as follows: Section 2 discusses the importance of oils in the nutritional and pharmaceutical system, in particular the characteristics and properties of processed oils. Section 3 describes the electronic device the sensors used and the acquisition system implemented. Section 4 presents the computational model. Section 5 reports the results obtained from the processing of the experimental data. Finally, conclusions are drawn.

2. Nutritional and Health Challenges of Edible Oils

Edible oils play an important role for humans, not only as staple foods but also as economic and medicinal resources [49]. Over time, oil has increased its role, becoming central in preventive nutrition and biomedical applications due to the presence of bioactive compounds with functional properties [50]. This section investigates the physical and biochemical characteristics of oils from a nutritional and technological perspective, focusing on four types of bioactive oils: olive oil, sunflower oil, tomato seed oil, and pumpkin seed oil. Each oil is analysed in terms of its chemical composition, oxidative stability, flavour and aroma profiles, and nutritional functionality, as oil quality depends on multiple interconnected factors, including botanical variety, extraction techniques, and storage conditions [51]. In particular, the proposed study analyses the ability of oil to retain information related to its life cycle, from production to processing and storage. This concept, termed thermal memory, is explored through infrared imaging techniques to reveal how each oil retains traces of environmental and processing conditions [52,53]. These traces are thermally encoded in the oil’s physical behaviour and can be used to reconstruct its quality trajectory and ensure traceability over time. By examining the thermal response characteristics under controlled conditions, this section lays the groundwork for linking biochemical stability with thermophysical properties, paving the way for intelligent quality control via non-invasive electronic systems and AI-based classification.

2.1. Olive Oil: Nutritional and Functional Profile

Olive oil is the staple food of the Mediterranean diet due to its organoleptic qualities, nutritional richness, and functional bioactivity [54]. Olive oil has a composition dominated by lipids, particularly monounsaturated fatty acids, and includes a wide range of minor components with antioxidant, anti-inflammatory, and antimicrobial properties [55]. From a nutritional standpoint, olive oil, with its high energy density, provides approximately 884 kcal per 100 g, which is energy almost entirely attributable to its lipid content. Table 1 shows the nutritional values of extra virgin olive oil per 100 g, and the recommended daily allowance/Adequate Intake (RDA/AI) values, which refer to an average adult (2000 kcal/day).
The predominant fraction consists of total fats, amounting to 100 g per 100 g of product, of which 73 g are monounsaturated (mainly oleic acid), 13.8 g are saturated (mainly palmitic acid), and 10.5 g are polyunsaturated (including linoleic and linolenic acids). The oil contains negligible amounts of carbohydrates, proteins, and sodium and is completely cholesterol-free. However, it is a significant source of lipophilic vitamins such as vitamin E (14 mg/100 g, covering up to 93% of the recommended daily allowance) and vitamin K (60.2 µg/100 g, covering 75% of the RDA). Table 1 indicates that for mono- and polyunsaturated fats, no established RDA exists, only general qualitative recommendations are provided (higher intake than saturated). Whereas %RDA values are approximate, rounded, and have to be adapted to other reference systems (e.g., European Food Safety Authority EFSA, Food and Drug Administration FDA, and reference intake levels of nutrients and energy LARN) if necessary. Chemically, olive oil has a composition predominantly consisting of triglycerides rich in oleic acid (C18:1, monounsaturated), with significant minor fractions of palmitic acid (C16:0) and linoleic acid (C18:2) [56]. In addition, it contains natural antioxidants such as tocopherols (especially α-tocopherol, vitamin E) and a number of polyphenolic compounds, including hydroxytyrosol, oleuropein, and oleocanthal [57]. Chlorophyll and carotenoids confer not only the yellow–green colour, but also photoreactive characteristics that influence oxidative stability. Physically speaking, olive oil has a density between 0.91 and 0.92 g/cm3 at room temperature [58]. Viscosity increases significantly with decreasing temperature. Viscosity, therefore, affects its performance in industrial and biomedical processes involving heat flow or heat transfer. These characteristics are relevant not only for food technology but also for infrared thermography applications, where thermal properties influence detection sensitivity. The thermal diffusivity alpha, a key parameter for thermal imaging and heat transfer modelling, describes the thermophysical behaviour of olive oil, as defined in relation (1):
α = λ ρ · c p
where λ is the thermal conductivity, ρ is the density, and cp is the specific heat capacity at constant pressure. For olive oil, the representative values are λ ≈ 0.17 W/m∙K, ρ ≈ 910 kg/m3, and cp ≈ 1.97 kJ/Kg∙K. The relatively low thermal diffusivity implies a slow response to thermal changes, which improves contrast in infrared imaging and makes olive oil a stable matrix for thermal characterisation in food quality assessments and biomedical device coatings. In addition to its nutritional profile, olive oil offers documented health benefits. Studies have associated its consumption with a lower incidence of cardiovascular disease due to its ability to reduce LDL-cholesterol levels and inflammation [59,60]. Indeed, its polyphenolic content acts as a powerful antioxidant, mitigating oxidative stress and contributing to cellular longevity [61].

2.2. Sunflower Seed Oil: Nutritional and Functional Profile

Sunflower oil is one of the most widely consumed and used vegetable oils because it is appreciated for its light taste, favourable fatty acid composition, and high oxidative stability [62]. Over time, sunflower oil evolves into a product with both nutritional and functional value, thanks to its high content of polyunsaturated fatty acids, especially linoleic acid, and significant concentrations of natural antioxidants such as vitamin E [63]. From a nutritional point of view, sunflower oil has a total absence of carbohydrates, sugars, proteins, and fibres, while providing the same energy content as olive oil entirely from lipids.
These lipids include approximately 10 g of saturated fats, 20 g of monounsaturated fats, and 70 g of polyunsaturated fats, with linoleic acid being the dominant polyunsaturated fatty acid. The oil is an exceptional source of vitamin E, offering 41 mg per 100 g, which corresponds to 207% of the RDA. The complete nutritional composition is summarised in Table 2.
Chemically, sunflower oil has a predominantly triglyceride composition, in which the glycerol backbone is esterified with fatty acids. The main constituents include linoleic acid (C18:2, omega-6), a polyunsaturated fatty acid essential for human health, and oleic acid (C18:1, omega-9), a monounsaturated fatty acid that contributes to lipid stability and cardiovascular benefits.
Equation (2) represents a typical triglyceride molecule found in sunflower oil:
C 57 H 104 O 6
with a molecular weight of approximately 885.4 g/mol. The oxidative stability of the oil shows a high content of tocopherol, in particular α-tocopherol, which plays a key role in protecting polyunsaturated fatty acids from lipid peroxidation.
This oxidative stability is quantified through parameters such as peroxide value (PV) and anisidine value (AV), while the oil’s susceptibility to rancidity can be assessed through the Totox index, shown in Equation (3):
T o t o x = 2 P V + A V
where lower values indicate better stability. From a physical standpoint, sunflower seed oil has a density of approximately 0.92 g/cm3 at room temperature, a parameter that slightly decreases with an increasing temperature. The kinematic viscosity at 40 °C is typically in the range of 35–40 mm2/s and follows an approximate inverse relationship with temperature, modelled by Equation (4):
η T = η 0 e ( β T )
where β is a temperature-dependent constant, η(T) is the dynamic viscosity at temperature T, and η0 is the reference viscosity. Because of its high smoke point and relatively balanced fatty acid composition, which prevents thermal degradation, sunflower seed oil has exceptional thermal resilience. The nutritional effects of sunflower oil also depend on the presence of phytosterols, which are naturally occurring compounds that help reduce the intestinal absorption of cholesterol [64]. In dermatology and cosmetics, sunflower oil has strong moisturising and antioxidant properties [65]. Linoleic acid helps maintain the integrity of the skin barrier by reducing transepidermal water loss (TEWL), while tocopherols neutralise reactive oxygen species (ROS), thus preventing premature skin ageing.
The oil has the distinction of having anti-inflammatory effects useful in the treatment of eczema and psoriasis. Physicochemical properties, including high biocompatibility and oxidative stability, make sunflower oil suitable for use in oral emulsions, soft-gel capsules, and topical formulations [66].
The oil helps make fat-soluble drugs easier to dissolve and absorb, which is especially helpful for creating health products and supplements for heart health. In conclusion, sunflower seed oil presents a compelling combination of nutritional richness, chemical stability, and multifunctional applicability, supporting its widespread use in dietary, cosmetic, and pharmaceutical fields.

2.3. Tomato Seed Oil: Nutritional and Functional Profile

The oil extracted from tomato seeds has a high content of unsaturated fatty acids and a wide range of antioxidant, anti-inflammatory, and cardioprotective molecules [67].
Depending on the extraction technique, which ranges from cold and hot pressing to solvent-assisted methods, the oil yield can vary between 20% and 36%. From a thermodynamic and kinetic perspective, the principles of mass transfer govern the efficiency of oil recovery, including solute–solvent diffusion and equilibrium conditions that follow Fick’s laws and partition coefficients.
Tomato seed oil has a highly unsaturated lipid profile, with linoleic acid (omega-6) being the predominant component, followed by oleic acid (omega-9), while saturated fatty acids such as palmitic acid and stearic acid are present in smaller amounts. Equation (5) determines the Unsaturation Index (UI) for tomato seed oil:
U I = i = 1 n D i · X i
where Di represents the number of double bonds and Xi indicates the molar fraction of fatty acid i. The typically high value of the molar fraction indicates that tomato seed oil contains excellent nutritional potential and a higher sensitivity to oxidative degradation.
Moreover, tomato seed oil is a source of functional micronutrients and contains a significant amount of vitamin E (mainly in the form of α-tocopherol), phytosterols (including β-sitosterol, campesterol, and stigmasterol), and carotenoids, such as lycopene and β-carotene.
Table 3 reports both the absolute amounts and the corresponding contribution of tomato seed oil to the recommended daily intake (RDA or Adequate Intake, AI) for an average adult based on international nutritional guidelines.
The presence of omega-3 fatty acids contributes to neural and visual function and may reduce the risk of chronic inflammatory diseases.
Vitamin E preserves the integrity of cell membranes and modulates immune responses. The properties inherent in tomato seed oil allow its use in biomedical and industrial fields, especially in dermatology and cosmetics. Its balanced lipid profile, combined with anti-inflammatory and antioxidant compounds, makes it a suitable ingredient for skincare products aimed at improving hydration, reducing irritation, and promoting tissue repair.

2.4. Pumpkin Seed Oil: Nutritional and Functional Profile

The last sample analysed is pumpkin seed oil (PSO), characterised by a rich content of unsaturated fatty acids, mainly oleic acid (omega-9) and linoleic acid (omega-6) [68].
The nutritional values of pumpkin seed oil are reported in Table 4.
The complex biochemical profile confers a variety of health benefits, making tomato seed oil a widely used ingredient in both functional foods and the pharmaceutical industry. In the latter case, it is used to treat intestinal parasites, support prostate and bladder health, promote cardiovascular function, and combat hair loss [69]. The fatty acid profile of pumpkin seed oil can vary based on several factors, including the genetic variety of the pumpkin, extraction and processing techniques, and geographical origin. Pumpkin seed oil has a distinctive sensory profile due to its physical properties. The high content of oleic and linoleic acids contributes to cardiovascular health by improving the lipid profile and reducing inflammation.

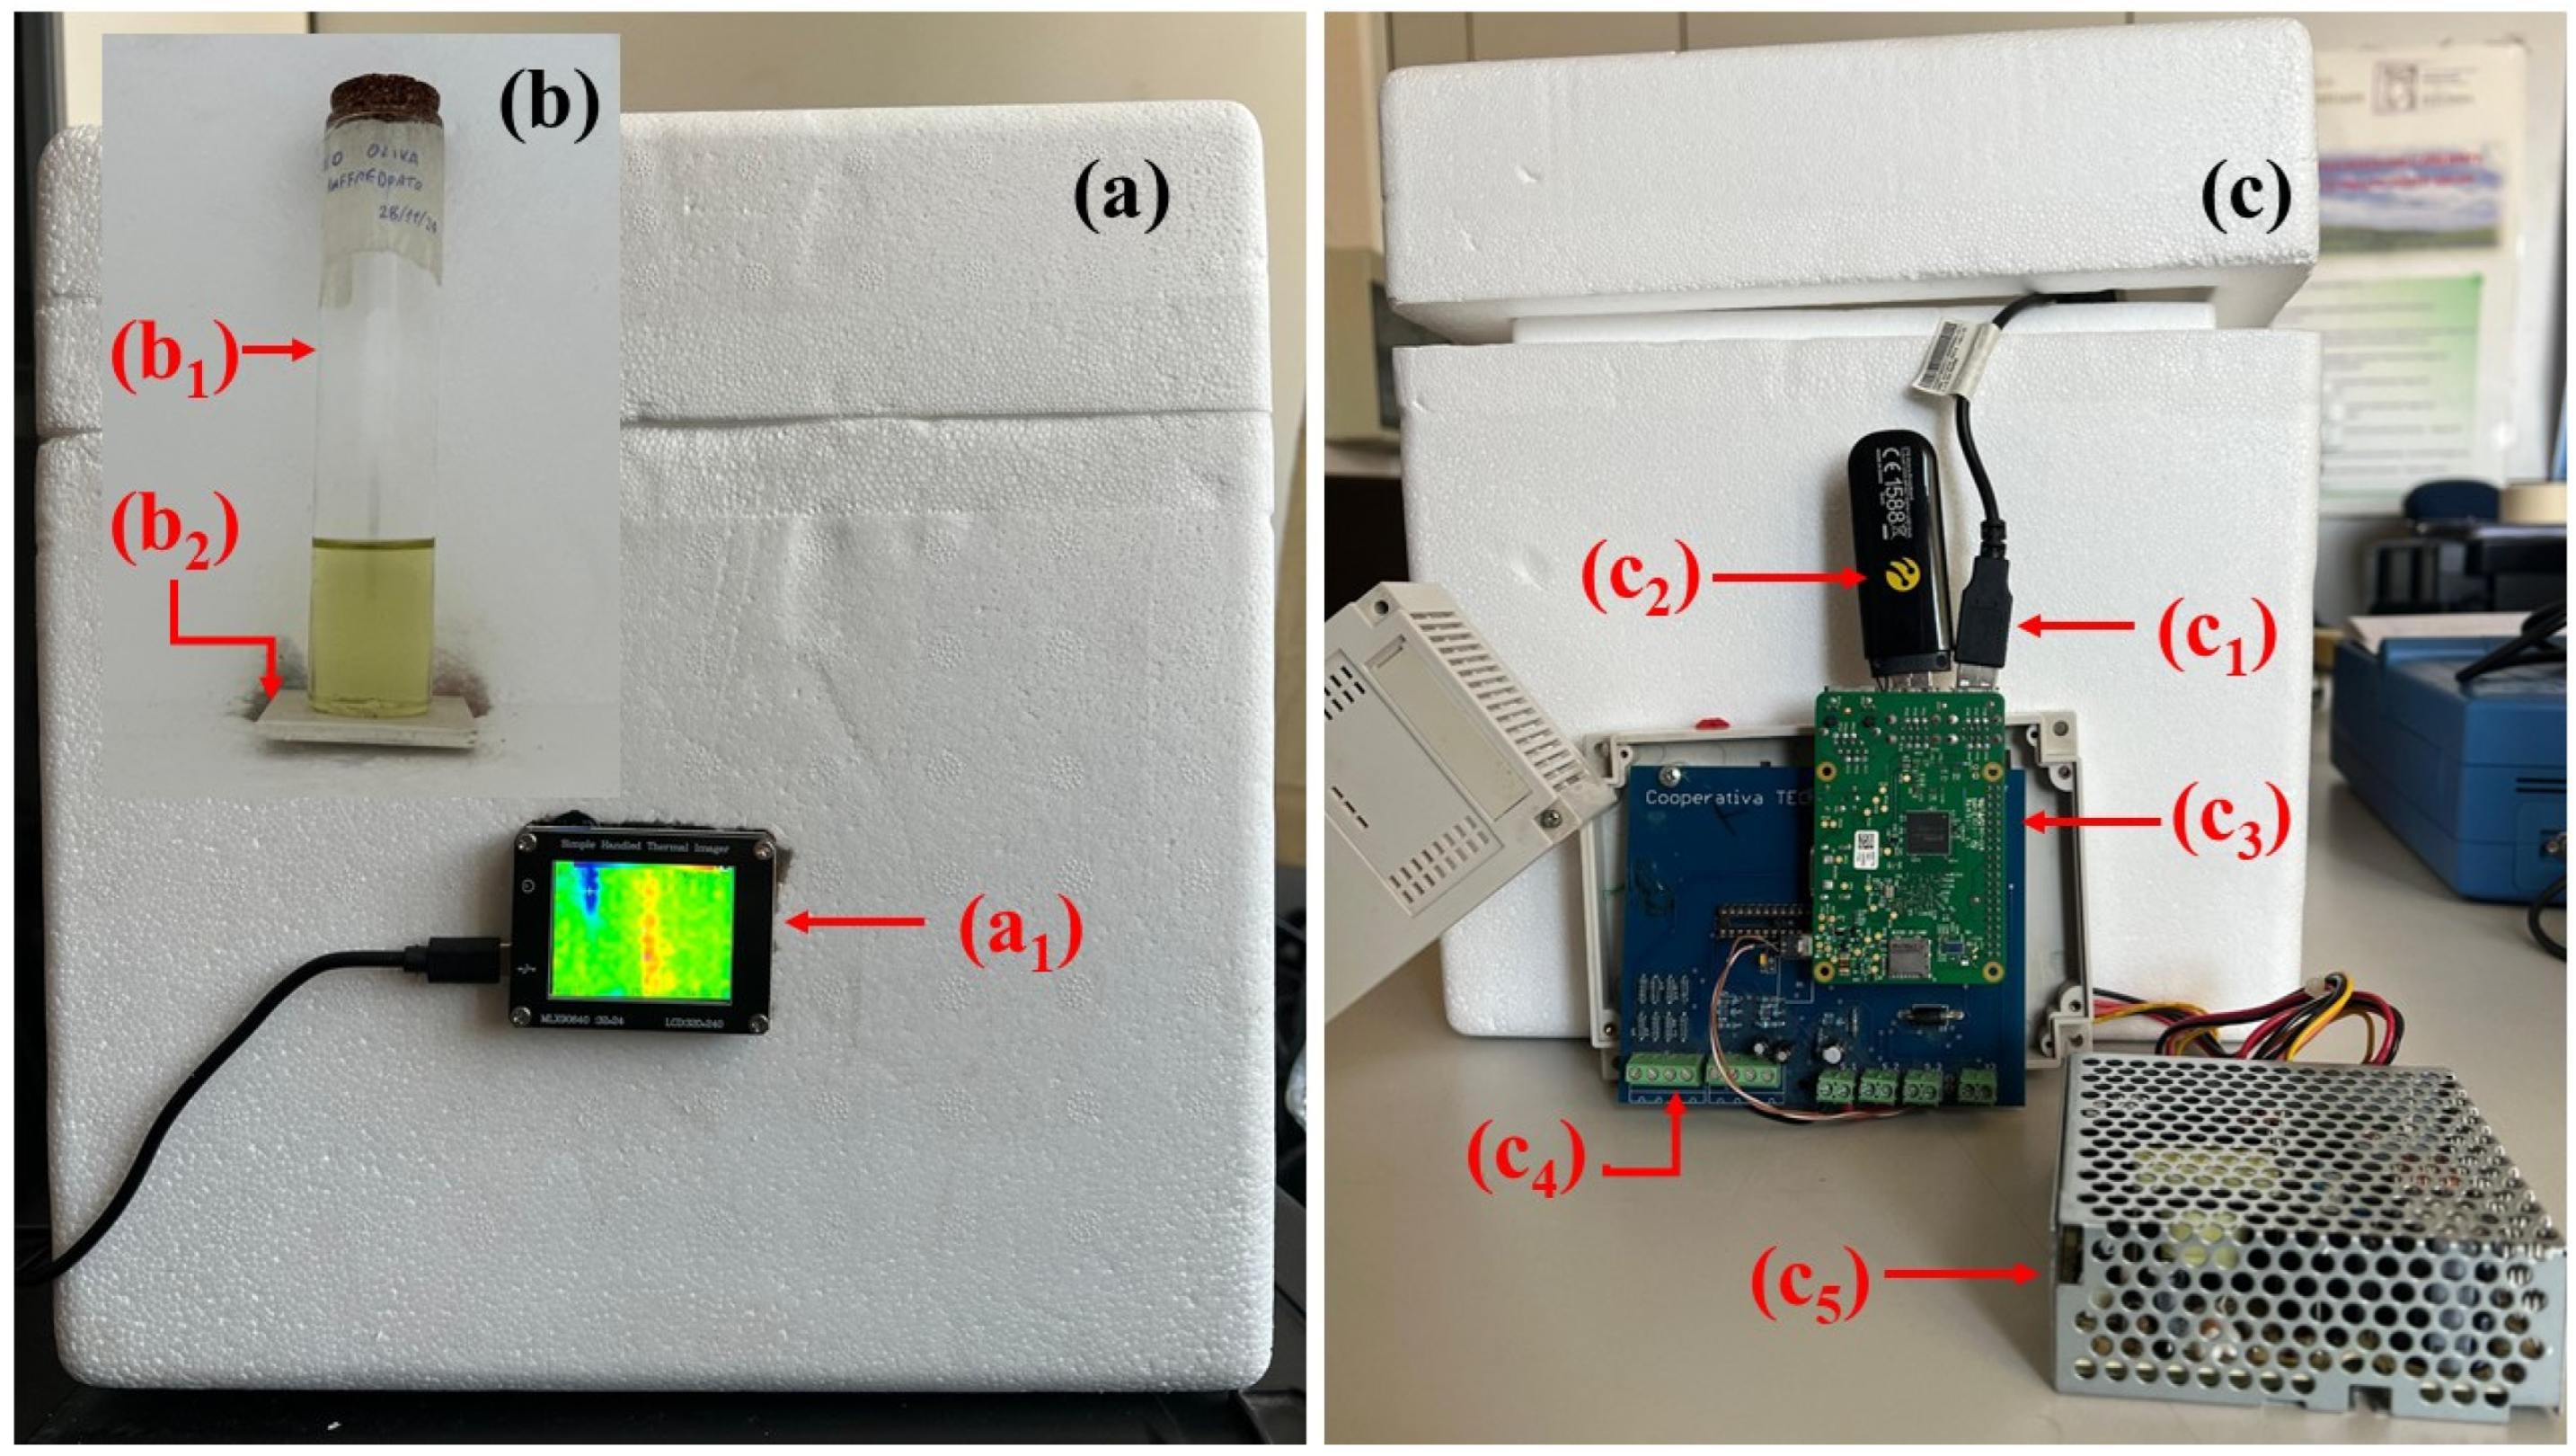
3. Materials and Methods: Thermographic Signal Acquisition System

A really important part of the study involves acquiring the information to be processed, which is specifically carried out by an electronic device used to acquire the thermographic signal and a processor that stores and sends the data to a cloud platform. The implementation of artificial intelligence techniques allows for the analysis and implementation of the acquired data. For the design and implementation of the system, tools for signal acquisition and processing are used. In particular, a thermographic sensor (MLX90640, 32 × 24 resolution), an acquisition board based on an ATMEGA328P microcontroller with 10-bit ADC, a variable linear power supply (±12 V, 1 A max), and a Raspberry Pi acting as a digital converter and control processor. The study and processing of the signal occur thanks to the electronic measurement system, whose purpose is to record and process the measurements of the emitted signal. After the conversion from analogue to digital form, the signal is sent to an integrated circuit composed of a Raspberry processor, which is responsible for taking the information acquired from the circuit and sending it to a cloud platform [70]. The acquired images undergo feature extraction and subsequent implementation with AI techniques. The hardware design of a thermographic signal acquisition system requires the careful evaluation of various components and functionalities to ensure the device’s effectiveness, safety, and reliability. For this reason, targeted, constant, and intensive monitoring of thermal parameters was carried out. Monitoring was performed by a central unit composed of an acquisition board and a processor, responsible for storing and processing signals from the thermographic sensor connected to the acquisition circuit. The acquired signals are managed by an intelligent system, On Module (SOM), which is an independent electronic device capable of managing a Linux operating system and performing complex numerical calculations [71,72]. The acquired signals are then saved in a database, which stores them and makes them available for management and processing (Figure 1). Specific details may vary depending on the intended use and the technology used. The acquisition circuit proposed in this study was designed according to the diagram shown in Figure 2.
Figure 1 shows the thermographic monitoring system where oil samples are enclosed within a thermally insulated polystyrene container subjected to controlled heating and cooling cycles.
The system (Figure 1) shows the thermographic monitoring of oil samples contained within a thermally insulated polystyrene box, subjected to controlled heating and cooling cycles using a Peltier element. The system has a Raspberry Pi as the main control and data acquisition unit connected to an acquisition board, which is responsible for interfacing the thermal imaging components and managing the heating and cooling process with the Peltier cell. The Raspberry Pi provides both 5 V and 3.3 V power lines through its GPIO header, which are used to power the microcontroller unit and peripheral protection circuits. The system detail, represented in Figure 2, highlights the presence of a resettable fuse rated at 500 mA, capable of ensuring stable and safe operation. The use of the fuse is necessary to protect the system from overcurrent, particularly during the initialisation of connected USB peripherals and thermal modules. Voltage regulation and protection are further enhanced by transient voltage suppression (TVS) diodes and clamping devices such as the USBLC6-2SC6 array. The microcontroller integrated into the system is an ATMEGA328P, which plays a complementary role to the Raspberry Pi by managing low-level digital interfacing, LED signalling, and shutdown logic. Powered by a regulated 3.3 V line, the ATMEGA328P communicates with external devices through its general purpose input/output (GPIO) pins. In the acquisition and monitoring system, the ATMEGA328P is integrated into the appropriately designed and manufactured acquisition board, as shown in Figure 3 c4. In this configuration, it acts as an intermediary for activation and real-time control functions, providing logical signals to status LEDs and switching elements such as transistors. The use of bipolar junction transistors (BJTs) serves two main purposes. Firstly, they act as electronic switches to drive the status LEDs, which provide visual feedback on the status of the wireless communication and the system’s readiness. Secondly, in combination with additional logic gates and the UDS signal, they allow for a controlled shutdown of the Raspberry Pi (Figure 3 c3). The microcontroller-controlled shutdown circuit allows for a safe shutdown sequence, initiated either by a timing algorithm or by a detected fault condition. The signals detected by the thermal camera are managed by an independent electronic device capable of handling a Linux operating system and performing complex numerical processing. The acquired data is then sent to a database that stores it and makes it available to be managed by an online platform. Once the electronic board is created, additional components necessary for data storage and processing are added (Figure 3c). The data collected in real time and the data processed using soft computing techniques are transmitted via a 4G LTE internet dongle (Figure 3 c2) to the monitoring platform [12]. To ensure a stable transmission and good signal quality, the system features decoupling capacitors and base resistors near the RF circuit. The detection unit includes a thermal imaging module, which, in the diagram, is interfaced via an RJ45 connector. The thermal sensor provides critical feedback on the internal temperature distribution of the oil samples, especially when the chamber is subjected to thermal cycles by the Peltier cell (Figure 3 b2). The integrated system for signal acquisition, storage, and transmission presents a different approach compared to other integrated systems [73]. The proposed integrated system aims to allow the operator to analyse signals and data remotely. While the authors of the document [74] chose the Arduino Mega to avoid the memory and power limitations of smaller boards, as the acquisition and filtering of data required a large amount of memory, the proposed document divides the process into two phases. The first focused on acquiring the thermographic signal, trying to eliminate interference and keep the signal unchanged; the second focused on storage and transmission. The division of the process ensures the better quality of the acquired and processed signal, at the expense of increased system complexity.

4. Post-Processing of IR Signals: Proposed Supervised Learning Model

The study proposes a supervised learning model implemented to classify and differentiate bioactive edible oils—olive, sunflower, tomato seed, and pumpkin seed—based on their thermal profiles. The approach utilises a combination of CNN with Long Short-Term Memory (LSTM) units to capture spatial and temporal dynamic features inherent in IR thermographic sequences. The model is specifically designed to assess the key quality attributes of the oils, including thermal stability (consistency over time), thermal reactivity (response to temperature variations), and biochemical composition linked to nutritional benefits. The dataset used for model training and validation consisted of 200 thermal video sequences (50 for each oil type). Each video included 50 frames, leading to a total of 10,000 images. Data augmentation techniques (rotations, flipping, and Gaussian noise) were applied to enhance dataset robustness. All frames were resized to 128 × 128 pixels and normalised to a [0, 1] scale. A stratified split divided the dataset into 80% training and 20% testing sets, with a 5-fold cross-validation across the dataset. Model performance on the test set was summarised using a confusion matrix, which confirmed the generalisability of the classification system across oil types.
The proposed CNN-LSTM assesses the evolution of thermal patterns across time; the model aims to identify distinct thermal “fingerprints” that reflect the internal structure and degradation behaviour of each oil. The resulting framework enables the development of a non-invasive, intelligent system capable of acting as a digital assay for nutritional quality assessment and traceability in bioactive oils. The primary objective of the CNN-LSTM model developed in this study is to classify four types of bioactive edible oils—olive oil, sunflower seed oil, tomato seed oil, and pumpkin seed oil—based on their unique thermographic profiles. The classification is driven by three key thermal characteristics: thermal stability (uniformity of heat distribution over time), thermal reactivity (the responsiveness to heating and cooling cycles), and nutritional implications, which are inferred from thermal patterns linked to biochemical composition (e.g., unsaturated fatty acids, tocopherols, and polyphenols).

4.1. Data Assessment

The post-processing phase of the signal analysis involved examining thermographic signals on four oil samples under different temperature conditions. Specifically, data on four types of oil were acquired and processed, as detailed in Table 5.
The temperature ranges, reported in Table 5, of the different oil samples exhibit distinct thermal behaviours, with peak heating temperatures varying from approximately 51 °C to 73 °C, and minimum cooling temperatures dropping down to −14 °C. All measurements were performed under controlled environmental conditions to ensure consistency between the tests. The measurements taken inside the polystyrene-insulated chamber validated the structure’s ability to maintain a stable microclimate inside. In fact, the ambient temperature during the acquisition of the reference data varied between 20 °C and 26 °C, with a constant relative humidity of 43%. During the heating phase, i.e., when the temperature of the oil samples approached approximately 65 °C, the relative humidity inside the chamber dropped to values between 28% and 33% due to increased thermal agitation and air dryness. On the contrary, during the cooling phase, when temperatures dropped to −14 °C, humidity slightly increased and stabilised between 47% and 51%, due to the condensation dynamics of moisture within the closed environment. These conditions ensured the repeatability and reliability of the thermal measurements on all types of oil analysed.
The data obtained from the integrated system in Figure 3 evaluates the thermal signature of the examined oil samples.
The thermal data acquired (Figure 4) were organised into video segments representing heating and cooling processes.
From each video, a series of frames (50 per sample) was extracted and resized to 128 × 128 pixels. The greyscale frames, optionally replicated across three channels, were normalised to a [0, 1] pixel intensity range. To enhance generalisation and minimise overfitting, standard data augmentation techniques, such as random rotations (±15°), horizontal and vertical flips, additive Gaussian noise (σ = 0.05), and contrast adjustments in the range of 0.8–1.2, were employed. The final dataset comprised labelled sequences organised as 3D tensors: (Num frames, height, width, and channels).

4.2. Proposed Model Architecture

The proposed model adopts a hybrid CNN-LSTM architecture designed to process sequential infrared (IR) thermal frames and extract both spatial and temporal features relevant for oil classification. Each video sample, representing a thermal cycle, is segmented into sequences of resized frames (128 × 128 pixels, three-channel). The spatial features of each frame are extracted using a Convolutional Neural Network (CNN), wrapped inside a Time-Distributed layer to ensure consistent processing across time steps.
The CNN consists of two convolutional layers: the first applies 32 filters with a 3 × 3 kernel followed by ReLU activation and 2 × 2 max pooling; the second applies 64 filters with the same kernel and pooling structure. These feature maps are then flattened to form a vector representation of each frame. This sequence of spatial encodings is passed to a Long Short-Term Memory (LSTM) layer with 64 hidden units, which learns temporal dependencies representing heat dissipation dynamics.
The LSTM output is fed into a dense layer with 128 neurons (ReLU activation), followed by a dropout layer (rate = 0.3) to prevent overfitting. Finally, a SoftMax layer outputs the probability distribution over the four oil classes: olive, sunflower, tomato seed, and pumpkin seed.
This end-to-end architecture is specifically optimised to identify distinguishing thermal memory effects and biochemical signatures across time. The CNN component is responsible for extracting local spatial features from each frame, while the LSTM models the temporal evolution across frames. The following Table 6 and Table 7 detail the structure of the CNN and LSTM components.
The model was implemented using the TensorFlow framework and optimised for sequential inference, making it suitable for deployment in embedded environments such as a Raspberry Pi when real-time, edge-based quality assessments are required.
The CNN component enables automatic spatial feature extraction from each frame, while the LSTM captures the temporal evolution of thermal signals, providing a comprehensive representation of each oil’s heat dissipation behaviour.
For training and validation, the model was developed and executed in Google Colab, leveraging the computational power of an NVIDIA Tesla T4 GPU with 16 GB of GDDR6 memory.

5. Results and Performance Evaluation

5.1. Classification Performance

The model was trained using categorical cross-entropy loss and optimised via the Adam algorithm with a learning rate of 0.001. A batch size of 16 was selected based on the available GPU memory and the temporal structure of the input sequences. To enhance convergence and generalisation, training employed early stopping with patience set to 10 epochs, along with a learning rate reduction upon plateau. The dataset was split into training (80%) and validation (20%) subsets using stratified sampling to preserve class balance.
Model evaluation focused on classification accuracy, precision, recall, and F1-score, all computed on the validation set (6, 7, 8, 9):
P r e c i s i o n = T P T P + F P
A c c u r a c y = T P + T N T P + T N + F P + F N
R e c a l l = T P T P + F N
F 1 s c o r e = 2 · P r e c i s i o n · R e c a l l P r e c i s i o n + R e c a l l
where
TP = True Positives;
TN = True Negatives;
FP = False Positives;
FN = False Negatives.
The model achieved a precision of 94.55%, indicating that most of its positive predictions were correct. The recall—which measures the ability of the model to correctly identify all true samples—was estimated at 92.80%, highlighting strong sensitivity to the diverse thermal signatures. The F1-score was calculated at 93.66%, confirming an effective balance between detecting true positives and avoiding misclassifications. The overall accuracy of the model reached 93.25%. Table 8 reports the mean and standard deviation of the performance metrics obtained through 5-fold cross-validation.

5.2. Ablation Studies

To assess the impact of the proposed CNN-LSTM model, an ablation study was conducted. The performance of different model variants was compared on the task of classifying edible oils from IR thermographic data. The variants include a CNN-only model (spatial features only), an LSTM-only model (temporal sequence modelling on simplified inputs), and a hybrid CNN-LSTM model that integrates both spatial and temporal features. We also compare the effect of a regularisation technique (dropout) and a change in CNN kernel size. This comparison illustrates the contribution of temporal modelling and architectural choices to classification performance. Table 9 defines the ablation study.

5.3. Implications and Limitations

The results demonstrate the effectiveness of thermal imaging combined with deep learning for oil classification. However, it is important to emphasise that the health-related interpretations of thermal profiles remain hypothetical. Further validation through biochemical assays or clinical testing is necessary to confirm any physiological relevance. Future work should explore multi-modal approaches combining IR thermography with spectroscopic or chromatographic methods to deepen the biochemical correlation.

6. Conclusions

This study proposes a methodology for the thermographic analysis of four different oil samples with an innovative approach that integrates an electronic system and deep learning techniques. The development of the electronic circuit allowed the acquisition of information on the thermal signature of olive oil, sunflower seed oil, tomato seed oil, and pumpkin seed oil, with the aim of evaluating their quality as the temperature varies. The thermal data obtained from the thermal camera contributed to formulating qualitative characteristics for the nutritional and pharmaceutical applications of the four analysed oils. The acquired signals are sent via the GPIO protocol to a Raspberry Pi processor, which is responsible for sending them to a cloud platform through communication with a GSM module. The analysis of the information provided significant insights into the thermal behaviours of the samples subjected to heating and cooling tests. The results obtained highlighted the different thermal responses of the samples to temperature variations, revealing a close correlation between their chemical composition and their thermal response. The main differences observed can be attributed to the molecular structure of the fatty acids present in each oil and their viscosity. The ability of some oils to retain heat, even for extended periods, represents a particularly significant property for pharmaceutical and cosmetic applications. These oils could be used in the formulations of products for topical treatments or for the gradual release of active ingredients. The implemented hybrid deep learning model classified and differentiated the oils based on stability and thermal reactivity, with potential health-related interpretations considered as exploratory and requiring biochemical validation. The signal analysis showed that the artificial intelligence-based method improves accuracy—achieving an F1 score of 93.66%—and repeatability in quality assessments, providing a non-invasive and intelligent framework for the validation and traceability of nutritional compounds. Future improvements could lead to studies that include collaborations with medical and pharmaceutical institutions to test the model on the effects of oil use on humans. The integration of other signalling modalities, such as humidity or the introduction of chemical impurities into the samples, could provide a more comprehensive view of the conditioning on product quality. Future developments will include the public release of the hardware design and source code to improve reproducibility and transparency. Open access to the data acquisition system and trained model will support external validation and encourage broader adoption in the research community.

Supplementary Materials

The following supporting information can be downloaded at: https://www.mdpi.com/article/10.3390/signals6030038/s1, File S1: Thermal images acquired during the heating process for four sample oils.

Author Contributions

Conceptualization, F.L. and D.P.; methodology, D.P. and F.L.; software, D.P. and F.L.; validation, D.P. and F.L.; formal analysis, D.P. and F.L.; investigation, D.P. and F.L.; resources, D.P. and F.L.; data curation, D.P. and F.L.; writing—original draft preparation, F.L. and D.P.; writing—review and editing, D.P. and F.L.; visualisation, D.P. and F.L.; supervision, D.P. and F.L. All authors have read and agreed to the published version of the manuscript.

Funding

This research received no external funding.

Data Availability Statement

The original contributions presented in this study are included in the article/Supplementary Material. Further inquiries can be directed to the corresponding author.

Conflicts of Interest

The authors declare no conflicts of interest.

References

  1. Crupi, P.; Faienza, M.F.; Naeem, M.Y.; Corbo, F.; Clodoveo, M.L.; Muraglia, M. Overview of the Potential Beneficial Effects of Carotenoids on Consumer Health and Well-Being. Antioxidants 2023, 12, 1069. [Google Scholar] [CrossRef] [PubMed]
  2. Ambroselli, D.; Masciulli, F.; Romano, E.; Catanzaro, G.; Besharat, Z.M.; Massari, M.C.; Ferretti, E.; Migliaccio, S.; Izzo, L.; Ritieni, A.; et al. New Advances in Metabolic Syndrome, from Prevention to Treatment: The Role of Diet and Food. Nutrients 2023, 15, 640. [Google Scholar] [CrossRef] [PubMed]
  3. Tian, M.; Bai, Y.; Tian, H.; Zhao, X. The Chemical Composition and Health-Promoting Benefits of Vegetable Oils—A Review. Molecules 2023, 28, 6393. [Google Scholar] [CrossRef] [PubMed]
  4. Shen, J.; Liu, Y.; Wang, X.; Bai, J.; Lin, L.; Luo, F.; Zhong, H. A Comprehensive Review of Health-Benefiting Components in Rapeseed Oil. Nutrients 2023, 15, 999. [Google Scholar] [CrossRef]
  5. Bakhshabadi, H.; Ganje, M.; Gharekhani, M.; Mohammadi-Moghaddam, T.; Aulestia, C.; Morshedi, A. A Review of New Methods for Extracting Oil from Plants to Enhance the Efficiency and Physicochemical Properties of the Extracted Oils. Processes 2025, 13, 1124. [Google Scholar] [CrossRef]
  6. Masoodi, L.; Gull, A.; Masoodi, F.A.; Gani, A.; Nissar, J.; Ahad, T.; Nayik, G.A.; Mukarram, S.A.; Kovács, B.; Prokisch, J.; et al. An Overview on Traditional vs. Green Technology of Extraction Methods for Producing High Quality Walnut Oil. Agronomy 2022, 12, 2258. [Google Scholar] [CrossRef]
  7. Fatima, S.; Kumar, V.; Bhadauria, G.; Verma, H. Quality indicators based rapid test kits for detection of frying oil quality: A review. Food Chem. Adv. 2023, 2, 100305. [Google Scholar] [CrossRef]
  8. Dhotre, I. A comprehensive review on progression and innovations in microwave assisted extraction technology for essential oils. J. Chem. Technol. Biotechnol. 2025, 100, 894–907. [Google Scholar] [CrossRef]
  9. Altaf, M.A.; Ahn, J.; Khan, D.; Kim, M.Y. Usage of IR sensors in the HVAC systems, vehicle and manufacturing industries: A review. IEEE Sens. J. 2022, 22, 9164–9176. [Google Scholar] [CrossRef]
  10. Proskurnin, M.A.; Khabibullin, V.R.; Usoltseva, L.O.; Vyrko, E.A.; Mikheev, I.V.; Volkov, D.S. Photothermal and optoacoustic spectroscopy: State of the art and prospects. Phys.-Uspekhi 2022, 65, 270. [Google Scholar] [CrossRef]
  11. Li, K.; Kinoshita, Y.; Sakai, D.; Kawano, Y. Recent Progress in Development of Carbon-Nanotube-Based Photo-Thermoelectric Sensors and Their Applications in Ubiquitous Non-Destructive Inspections. Micromachines 2023, 14, 61. [Google Scholar] [CrossRef]
  12. Pratticò, D.; Laganà, F.; Oliva, G.; Fiorillo, A.S.; Pullano, S.A.; Calcagno, S.; De Carlo, D.; La Foresta, F. Integration of LSTM and U-Net models for monitoring electrical absorption with a system of sensors and electronic circuits. IEEE Trans. Instrum. Meas. 2025, 74, 253331. [Google Scholar] [CrossRef]
  13. Pratticò, D.; Laganà, F.; Oliva, G.; Fiorillo, A.S.; Pullano, S.A.; Calcagno, S.; De Carlo, D.; La Foresta, F. Sensors and Integrated Electronic Circuits for Monitoring Machinery On Wastewater Treatment: Artificial Intelligence Approach. In Proceedings of the 2024 IEEE Sensors Applications Symposium (SAS), Naples, Italy, 23–25 July 2024; pp. 1–6. [Google Scholar] [CrossRef]
  14. Im, S.K.; Pearmain, A.J. Unequal error protection with the H.264 flexible macroblock ordering. In Proceedings of the Visual Communications and Image Processing 2005, Beijing, China, 24 June 2005; Volume 5960, pp. 1033–1040. [Google Scholar] [CrossRef]
  15. Chan, K.H.; Im, S.K. Sentiment analysis by using Naïve-Bayes classifier with stacked CARU. Electron. Lett. 2022, 58, 411–413. [Google Scholar] [CrossRef]
  16. Melnikov, P.; Bobrov, A.; Marfin, Y. On the Use of Polymer-Based Composites for the Creation of Optical Sensors: A Review. Polymers 2022, 14, 4448. [Google Scholar] [CrossRef]
  17. Chen, W.; Ball, A.S.; Cole, I.; Yin, H. Metal-Doped Carbon Dots as Fenton-like Catalysts and Their Applications in Pollutant Degradation and Sensing. Sustainability 2025, 17, 3642. [Google Scholar] [CrossRef]
  18. Ordoudi, S.A.; Strani, L.; Cocchi, M. Toward the Non-Targeted Detection of Adulterated Virgin Olive Oil with Edible Oils via FTIR Spectroscopy & Chemometrics: Research Methodology Trends, Gaps and Future Perspectives. Molecules 2023, 28, 337. [Google Scholar] [CrossRef]
  19. Tarapoulouzi, M.; Agriopoulou, S.; Koidis, A.; Proestos, C.; Enshasy, H.A.E.; Varzakas, T. Recent Advances in Analytical Methods for the Detection of Olive Oil Oxidation Status during Storage along with Chemometrics, Authenticity and Fraud Studies. Biomolecules 2022, 12, 1180. [Google Scholar] [CrossRef]
  20. Pielesz, A.; Biniaś, D.; Waksmańska, W.; Bobiński, R. Lipid bands of approx. 1740 cm−1 as spectral biomarkers and image of tissue oxidative stress. Spectrochim. Acta Part A Mol. Biomol. Spectrosc. 2023, 286, 121926. [Google Scholar] [CrossRef]
  21. Pullano, S.A.; Marcianò, G.; Bianco, M.G.; Oliva, G.; Rania, V.; Vocca, C.; Cione, E.; De Sarro, G.; Gallelli, L.; Romeo, P.; et al. FT-IR Analysis of Structural Changes in Ketoprofen Lysine Salt and KiOil Caused by a Pulsed Magnetic Field. Bioengineering 2022, 9, 503. [Google Scholar] [CrossRef]
  22. Sivakumar, V. Towards environmental protection and process safety in leather processing—A comprehensive analysis and review. Process Saf. Environ. Prot. 2022, 163, 703–726. [Google Scholar] [CrossRef]
  23. Tong, P.H.; Wu, T.Y.; Li, M.; Wang, H.B.; Zheng, F.; Xu, L.; Dou, W.T. Fluorescent probes for the visualization of membrane microdomain, deformation, and fusion. Smart Mol. 2025, 3, e20240059. [Google Scholar] [CrossRef] [PubMed]
  24. Ramos, L.; Sappa, A.D. Multispectral semantic segmentation for land cover classification: An overview. IEEE J. Sel. Top. Appl. Earth Obs. Remote Sens. 2024, 17, 14295–14336. [Google Scholar] [CrossRef]
  25. Menniti, M.; Laganà, F.; Oliva, G.; Bianco, M.; Fiorillo, A.S.; Pullano, S.A. Development of Non-Invasive Ventilator for Homecare and Patient Monitoring System. Electronics 2024, 13, 790. [Google Scholar] [CrossRef]
  26. Menniti, M.; Oliva, G.; Laganà, F.; Bianco, M.G.; Fiorillo, A.S.; Pullano, S.A. Portable Non-Invasive Ventilator for Homecare and Patients Monitoring System. In Proceedings of the 2023 IEEE International Symposium on MeMeA, Jeju, Republic of Korea, 14–16 June 2023; pp. 1–5. [Google Scholar] [CrossRef]
  27. Laganà, F.; Bibbò, L.; Calcagno, S.; De Carlo, D.; Pullano, S.A.; Pratticò, D.; Angiulli, G. Smart Electronic Device-Based Monitoring of SAR and Temperature Variations in Indoor Human Tissue Interaction. Appl. Sci. 2025, 15, 2439. [Google Scholar] [CrossRef]
  28. Zhang, W.; Kasun, L.C.; Wang, Q.J.; Zheng, Y.; Lin, Z. A Review of Machine Learning for Near-Infrared Spectroscopy. Sensors 2022, 22, 9764. [Google Scholar] [CrossRef]
  29. Mohd Hilmi Tan, M.I.S.; Jamlos, M.F.; Omar, A.F.; Dzaharudin, F.; Chalermwisutkul, S.; Akkaraekthalin, P. Ganoderma boninense Disease Detection by Near-Infrared Spectroscopy Classification: A Review. Sensors 2021, 21, 3052. [Google Scholar] [CrossRef]
  30. Mabrouk, M.; Das, D.B.; Salem, Z.A.; Beherei, H.H. Nanomaterials for Biomedical Applications: Production, Characterisations, Recent Trends and Difficulties. Molecules 2021, 26, 1077. [Google Scholar] [CrossRef]
  31. Montiel Schneider, M.G.; Martín, M.J.; Otarola, J.; Vakarelska, E.; Simeonov, V.; Lassalle, V.; Nedyalkova, M. Biomedical Applications of Iron Oxide Nanoparticles: Current Insights Progress and Perspectives. Pharmaceutics 2022, 14, 204. [Google Scholar] [CrossRef]
  32. Laganà, F.; Pellicanò, D.; Arruzzo, M.; Pratticò, D.; Pullano, S.A.; Fiorillo, A.S. FEM-Based Modelling and AI-Enhanced Monitoring System for Upper Limb Rehabilitation. Electronics 2025, 14, 2268. [Google Scholar] [CrossRef]
  33. Versaci, M.; Laganà, F.; Morabito, F.C.; Palumbo, A.; Angiulli, G. Adaptation of an Eddy Current Model for Characterizing Subsurface Defects in CFRP Plates Using FEM Analysis Based on Energy Functional. Mathematics 2024, 12, 2854. [Google Scholar] [CrossRef]
  34. Laganà, F.; De Carlo, D.; Calcagno, S.; Pullano, S.A.; Critello, D.; Falcone, F.; Fiorillo, A.S. Computational model of cell deformation under fluid flow-based rolling. In Proceedings of the 2019 E-Health and Bioengineering Conference (EHB), Iasi, Romania, 21–23 November 2019; pp. 1–4. [Google Scholar] [CrossRef]
  35. Kupikowska-Stobba, B.; Domagała, J.; Kasprzak, M.M. Critical Review of Techniques for Food Emulsion Characterization. Appl. Sci. 2024, 14, 1069. [Google Scholar] [CrossRef]
  36. Tian, H.; Zhang, J.; Yang, Y.; Chen, Y. Infrared Thermographic Detection of Vegetable Oils under Controlled Thermal Excitation. Sensors 2023, 23, 2105. [Google Scholar]
  37. De Luca, M.; D’Accolti, L.; Montagna, G.; Biasioli, F.; Schuhfried, E.; Ferri, G. Use of Infrared Thermography for the Non-Destructive Evaluation of Food Quality: A Review. Foods 2022, 11, 3120. [Google Scholar]
  38. Rahman, M.M.; Uddin, M.T.; Hasan, M.; Khatun, R.; Hoque, M.M. Effect of Fatty Acid Composition on the Thermal Properties of Edible Oils. J. Food Process. Preserv. 2021, 45, e15417. [Google Scholar]
  39. Nguyen, M.H.; Tran, L.T.; Phan, T.N.; Le, D.H. Thermophysical Properties and Oxidative Stability of Edible Oils as Related to Fatty Acid Composition. Processes 2023, 11, 2190. [Google Scholar]
  40. Yang, X.; Niu, Z.; Wang, X.; Lu, X.; Sun, J.; Carpena, M.; Li, N. The nutritional and bioactive components, potential health function and comprehensive utilization of pomegranate: A review. Food Rev. Int. 2023, 39, 6420–6446. [Google Scholar] [CrossRef]
  41. Purohit, S.; Kalita, D.; Barik, C.R.; Sahoo, L.; Goud, V.V. Evaluation of thermophysical, biochemical and antibacterial properties of unconventional vegetable oil from Northeast India. Mater. Sci. Energy Technol. 2021, 4, 81–91. [Google Scholar] [CrossRef]
  42. Sorrenti, V.; Fortinguerra, S.; Lucarini, M.; De Lisi, A.; Malaguarnera, M. Oxidative Stability of Vegetable Oils: The Role of Natural Antioxidants and Thermophysical Characterisation. Antioxidants 2023, 12, 1101. [Google Scholar]
  43. Adedokun, O.A.; Olayanju, T.M.A.; Obafemi, T.E.; Omodara, O.J. Use of Thermal Imaging in Evaluating Oil Quality Degradation During Frying. Foods 2022, 11, 4221. [Google Scholar]
  44. Barbinta-Patrascu, M.-E.; Bita, B.; Negut, I. From Nature to Technology: Exploring the Potential of Plant-Based Materials and Modified Plants in Biomimetics, Bionics, and Green Innovations. Biomimetics 2024, 9, 390. [Google Scholar] [CrossRef]
  45. Dorozhkin, S.V. Calcium Orthophosphate (CaPO4) Containing Composites for Biomedical Applications: Formulations, Properties, and Applications. J. Compos. Sci. 2024, 8, 218. [Google Scholar] [CrossRef]
  46. Ashiagbor, K.; Jayan, H.; Gao, S.; Amaglo, N.K.; Adade, S.Y.S.S.; El-Seedi, H.R.; Guo, Z. Recent advances in photoelectric methods application for cooking oil quality and safety evaluation: A review. J. Sci. Food Agric. 2025. [Google Scholar] [CrossRef]
  47. Rahman, M.A.; Islam, M.J.; Park, J.Y. Hybrid CNN-LSTM Network for Automated Diagnosis of Thermal Imaging Data in Medical Applications. Sensors 2022, 22, 1501. [Google Scholar]
  48. Zhang, Y.; Li, L.; Wang, R. Spatiotemporal Deep Learning Framework for Thermal Signal Classification in Non-Destructive Testing. Appl. Sci. 2021, 11, 8463. [Google Scholar]
  49. Mannucci, P.M.; Jolliet, O.; Meijaard, E.; Slavin, J.; Rasetti, M.; Aleta, A.; Agostoni, C. Sustainable nutrition and the case of vegetable oils to match present and future dietary needs. Front. Public Health 2023, 11, 1106083. [Google Scholar] [CrossRef] [PubMed]
  50. Sorrenti, V.; Burò, I.; Consoli, V.; Vanella, L. Recent Advances in Health Benefits of Bioactive Compounds from Food Wastes and By-Products: Biochemical Aspects. Int. J. Mol. Sci. 2023, 24, 2019. [Google Scholar] [CrossRef]
  51. Zhang, Y.; Wang, M.; Zhang, X.; Qu, Z.; Gao, Y.; Li, Q.; Yu, X. Mechanism, indexes, methods, challenges, and perspectives of edible oil oxidation analysis. Crit. Rev. Food Sci. Nutr. 2023, 63, 4901–4915. [Google Scholar] [CrossRef]
  52. Zhao, X.; Zhao, Y.; Hu, S.; Wang, H.; Zhang, Y.; Ming, W. Progress in Active Infrared Imaging for Defect Detection in the Renewable and Electronic Industries. Sensors 2023, 23, 8780. [Google Scholar] [CrossRef]
  53. Cravotto, C.; Claux, O.; Bartier, M.; Fabiano-Tixier, A.-S.; Tabasso, S. Leading Edge Technologies and Perspectives in Industrial Oilseed Extraction. Molecule 2023, 28, 5973. [Google Scholar] [CrossRef]
  54. Marx, Í.M.G. Co-Extraction Technique Improves Functional Capacity and Health-Related Benefits of Olive Oils: A Mini Review. Foods 2023, 12, 1667. [Google Scholar] [CrossRef]
  55. Žugić, A.; Martinović, M.; Tadić, V.; Rajković, M.; Racić, G.; Nešić, I.; Koren, A. Comprehensive Insight into Cutaneous Application of Hemp. Pharmaceutics 2024, 16, 748. [Google Scholar] [CrossRef] [PubMed]
  56. Rahim, M.A.; Ayub, H.; Sehrish, A.; Ambreen, S.; Khan, F.A.; Itrat, N.; Nazir, A.; Shoukat, A.; Shoukat, A.; Ejaz, A.; et al. Essential Components from Plant Source Oils: A Review on Extraction, Detection, Identification, and Quantification. Molecules 2023, 28, 6881. [Google Scholar] [CrossRef] [PubMed]
  57. Campo, C.; Gangemi, S.; Pioggia, G.; Allegra, A. Beneficial Effect of Olive Oil and Its Derivates: Focus on Hematological Neoplasm. Life 2024, 14, 583. [Google Scholar] [CrossRef]
  58. Igwegbe, C.A.; López-Maldonado, E.A.; Landázuri, A.C.; Ovuoraye, P.E.; Ogbu, A.I.; Vela-García, N.; Białowiec, A. Sustainable municipal landfill leachate management: Current practices, challenges, and future directions. Desalin. Water Treat. 2024, 320, 100709. [Google Scholar] [CrossRef]
  59. Elliott, P.S.; Kharaty, S.S.; Phillips, C.M. Plant-Based Diets and Lipid, Lipoprotein, and Inflammatory Biomarkers of Cardiovascular Disease: A Review of Observational and Interventional Studies. Nutrients 2022, 14, 5371. [Google Scholar] [CrossRef]
  60. Shaya, G.E.; Leucker, T.M.; Jones, S.R.; Martin, S.S.; Toth, P.P. Coronary heart disease risk: Low-density lipoprotein and beyond. Trends Cardiovasc. Med. 2022, 32, 181–194. [Google Scholar] [CrossRef]
  61. Pereira, Q.C.; dos Santos, T.W.; Fortunato, I.M.; Ribeiro, M.L. The Molecular Mechanism of Polyphenols in the Regulation of Ageing Hallmarks. Int. J. Mol. Sci. 2023, 24, 5508. [Google Scholar] [CrossRef]
  62. Huseynli, L.; Walser, C.; Blumenthaler, L.; Vene, K.; Dawid, C. Toward a Comprehensive Understanding of Flavor of Sunflower Products: A Review of Confirmed and Prospective Aroma- and Taste-Active Compounds. Foods 2025, 14, 1940. [Google Scholar] [CrossRef]
  63. Axentii, M.; Codină, G.G. Exploring the Nutritional Potential and Functionality of Hemp and Rapeseed Proteins: A Review on Unveiling Anti-Nutritional Factors, Bioactive Compounds, and Functional Attributes. Plants 2024, 13, 1195. [Google Scholar] [CrossRef]
  64. Frasinariu, O.; Serban, R.; Trandafir, L.M.; Miron, I.; Starcea, M.; Vasiliu, I.; Alisi, A.; Temneanu, O.R. The Role of Phytosterols in Nonalcoholic Fatty Liver Disease. Nutrients 2022, 14, 2187. [Google Scholar] [CrossRef]
  65. Poljšak, N.; Kočevar Glavač, N. Vegetable butters and oils as therapeutically and cosmetically active ingredients for dermal use: A review of clinical studies. Front. Pharmacol. 2022, 13, 868461. [Google Scholar] [CrossRef] [PubMed]
  66. Banik, S.P.; Kumar, P.; Basak, P.; Goel, A.; Ohia, S.E.; Bagchi, M.; Bagchi, D. A critical insight into the physicochemical stability of macular carotenoids with respect to their industrial production, safety profile, targeted tissue delivery, and bioavailability. Toxicol. Mech. Methods 2025, 35, 215–229. [Google Scholar] [CrossRef] [PubMed]
  67. Kumar, M.; Chandran, D.; Tomar, M.; Bhuyan, D.J.; Grasso, S.; Sá, A.G.A.; Carciofi, B.A.M.; Radha; Dhumal, S.; Singh, S.; et al. Valorization Potential of Tomato (Solanum lycopersicum L.) Seed: Nutraceutical Quality, Food Properties, Safety Aspects, and Application as a Health-Promoting Ingredient in Foods. Horticulturae 2022, 8, 265. [Google Scholar] [CrossRef]
  68. Pandey, V.K.; Singh, K.; Suthar, T.; Srivastava, S.; Rustagi, S.; Ungai, D.; Kovács, B.; Shaikh, A.M. Current Strategies to Modify the Functional Properties of Proteins Extracted from Pumpkin Seeds: A Comprehensive Review. Horticulturae 2024, 10, 1194. [Google Scholar] [CrossRef]
  69. Puri, V.; Nagpal, M.; Singh, I.; Singh, M.; Dhingra, G.A.; Huanbutta, K.; Dheer, D.; Sharma, A.; Sangnim, T. A Comprehensive Review on Nutraceuticals: Therapy Support and Formulation Challenges. Nutrients 2022, 14, 4637. [Google Scholar] [CrossRef]
  70. Laganà, F.; Pellicanò, D.; De Carlo, D.; Pratticò, D.; Calcagno, S. Evaluation and monitoring of SAR and temperature during an indoor Wi-Fi call. In Proceedings of the 2024 International Workshop on Q-BATS, Durrës, Albania, 10–11 October 2024; pp. 105–110. [Google Scholar] [CrossRef]
  71. Bibbò, L.; Angiulli, G.; Laganà, F.; Pratticò, D.; Cotroneo, F.; La Foresta, F.; Versaci, M. MEMS and IoT in HAR: Effective Monitoring for the Health of Older People. Appl. Sci. 2025, 15, 4306. [Google Scholar] [CrossRef]
  72. Noman, H.A.; Abu-Sharkh, O.M.F. Code Injection Attacks in Wireless-Based Internet of Things (IoT): A Comprehensive Review and Practical Implementations. Sensors 2023, 23, 6067. [Google Scholar] [CrossRef]
  73. Laganà, F.; Pratticò, D.; Angiulli, G.; Oliva, G.; Pullano, S.A.; Versaci, M.; La Foresta, F. Development of an Integrated System of sEMG Signal Acquisition, Processing, and Analysis with AI Techniques. Signals 2024, 5, 476–493. [Google Scholar] [CrossRef]
  74. Sesidhar, D.V.S.R.; Badachi, C.; Green, R.C., II. A review on data-driven SOC estimation with Li-Ion batteries: Implementation methods & future aspirations. J. Energy Storage 2023, 72, 108420. [Google Scholar]
Figure 1. Schematic representation of the thermographic monitoring setup for oil samples.
Signals 06 00038 g001
Figure 2. Schematic of the electronic system for real-time thermographic monitoring of oil samples, featuring a Raspberry Pi, ATMEGA328P, wireless module, and thermal camera interface.
Signals 06 00038 g002
Figure 3. Integrated infrared (IR) data acquisition and transmission system. (a) Front section housing the thermal camera (a1); (b) internal section containing the oil sample (b1) and the Peltier cell for thermal modulation (b2); and (c) rear section encompassing the acquisition and transmission control unit, composed of: (c1) bus cable connected to the thermal camera, (c2) data transmission module, (c3) Raspberry Pi for processing and control, (c4) acquisition board with integrated ATMEGA328P microcontroller, and (c5) power supply system.
Signals 06 00038 g003
Figure 4. Thermal images acquired during the heating process for four sample oils.
Signals 06 00038 g004
Table 1. Nutritional values of extra virgin olive oil.
ComponentPer 100 g% RDA/AI
Energy884 kcal44% (2000 kcal)
Total Fat100 g129% (77 g)
Saturated Fat13.8 g69% (20 g max)
Monounsaturated Fats73.0 g-
Polyunsaturated Fats10.5 g-
Sodium2 mg<0.1% (2300 mg)
Vitamin E14 mg93% (15 mg)
Vitamin K60.2 μg75% (80 μg)
Polyphenols (approx.)Variable (50–500 mg)No RDA
Table 2. Nutritional composition of sunflower seed oil.
ComponentPer 100 g% RDA/AI
Energy884 kcal44.2% (2000 kcal)
Total Fat100 g153.8% (based on 65 g/day)
Saturated Fat10 g50% (20 g/day max)
Monounsaturated Fats20.0 g-
Polyunsaturated Fats70 g-
Sodium2 mg<0.1% (2300 mg)
Vitamin E41 mg273% (15 mg RDA)
Vitamin K0.6 mg0.5% (120 μg RDA)
Table 3. Nutritional composition of tomato seed oil.
ComponentPer 100 g% RDA/AI
Energy900 kcal45% (2000 kcal)
Total Fat100 g154% (based on 65 g/day)
Saturated Fat12 g60%
Monounsaturated Fats13 g-
Polyunsaturated Fats70 g-
Omega-3 Fatty Acids6 g375%
Omega-6 Fatty Acids67 g558%
Phytosterols (total)180 mg60%
Lycopene1.2 mg-
Β-carotene0.8 mg10% (as vitamin A equivalent)
Vitamin E (α-tocopherol)24 mg160%
Table 4. Nutritional composition of pumpkin seed oil.
ComponentPer 100 g% RDA/AI
Energy814 kcal40.7%
Total Fat90 g138.5%
Saturated Fat18 g90%
Monounsaturated Fats30 g-
Polyunsaturated Fats42 g-
Phytosterols230 mg-
Vitamin E10 mg66.7%
Table 5. IR temperature ranges of oil samples under different monitoring conditions.
SampleRoom
Temperature (°C)
High
Temperature (°C)
Low
Temperature (°C)
Olive oil20–2428–73−17–16
Sunflower seed oil22–2628–71−14–16.5
Tomato seed oil22–2630–65−14–15.3
Pumpkin seed oil22–2630–51−13.5–15.7
Table 6. CNN architecture for spatial feature extraction.
Layer NumberLayer NameInput ShapeOutput ShapeKernel SizeStride
1Conv2D + ReLU(128, 128, 1)(126, 126, 32)(3, 3)(1, 1)
2MaxPooling2D(126, 126, 32)(63, 63, 32)(2, 2)(2, 2)
3Conv2D + ReLU(63, 63, 32)(61, 61, 64)(3, 3)(1, 1)
4MaxPooling2D(61, 61, 64)(30, 30, 64)(2, 2)(2, 2)
5Flatten(30, 30, 64)(57,600)1
1 No value.
Table 7. LSTM-based temporal modelling and classification.
Layer NumberLayer NameInput ShapeOutput ShapeNotes
6LSTM(Num frames, 57,600)(64)Captures temporal dynamics
7Dense + ReLU(64)(128)Fully connected
8Dropout (rate = 0.3)(128)(128)Regularisation
9Dense + SoftMax(128)(4)4-class oil classification
Table 8. Performance metrics (mean and standard deviation, 5-cross fold validation).
MetricMean (%)Std. Dev (%)
Accuracy93.251.45
Precision94.551.22
Recall92.801.78
F1-score93.661.60
Table 9. Ablation study results.
Model VariantAccuracyPrecisionRecall
CNN-only (spatial features only)85.23%86.14%84.03%
LSTM-only (temporal only)70.11%70.24%70.48%
CNN-LSTM (proposed model)93.25%94.55%92.80%
CNN-LSTM w/o dropout90.22%90.14%88.78%
Disclaimer/Publisher’s Note: The statements, opinions and data contained in all publications are solely those of the individual author(s) and contributor(s) and not of MDPI and/or the editor(s). MDPI and/or the editor(s) disclaim responsibility for any injury to people or property resulting from any ideas, methods, instructions or products referred to in the content.

