1. Introduction
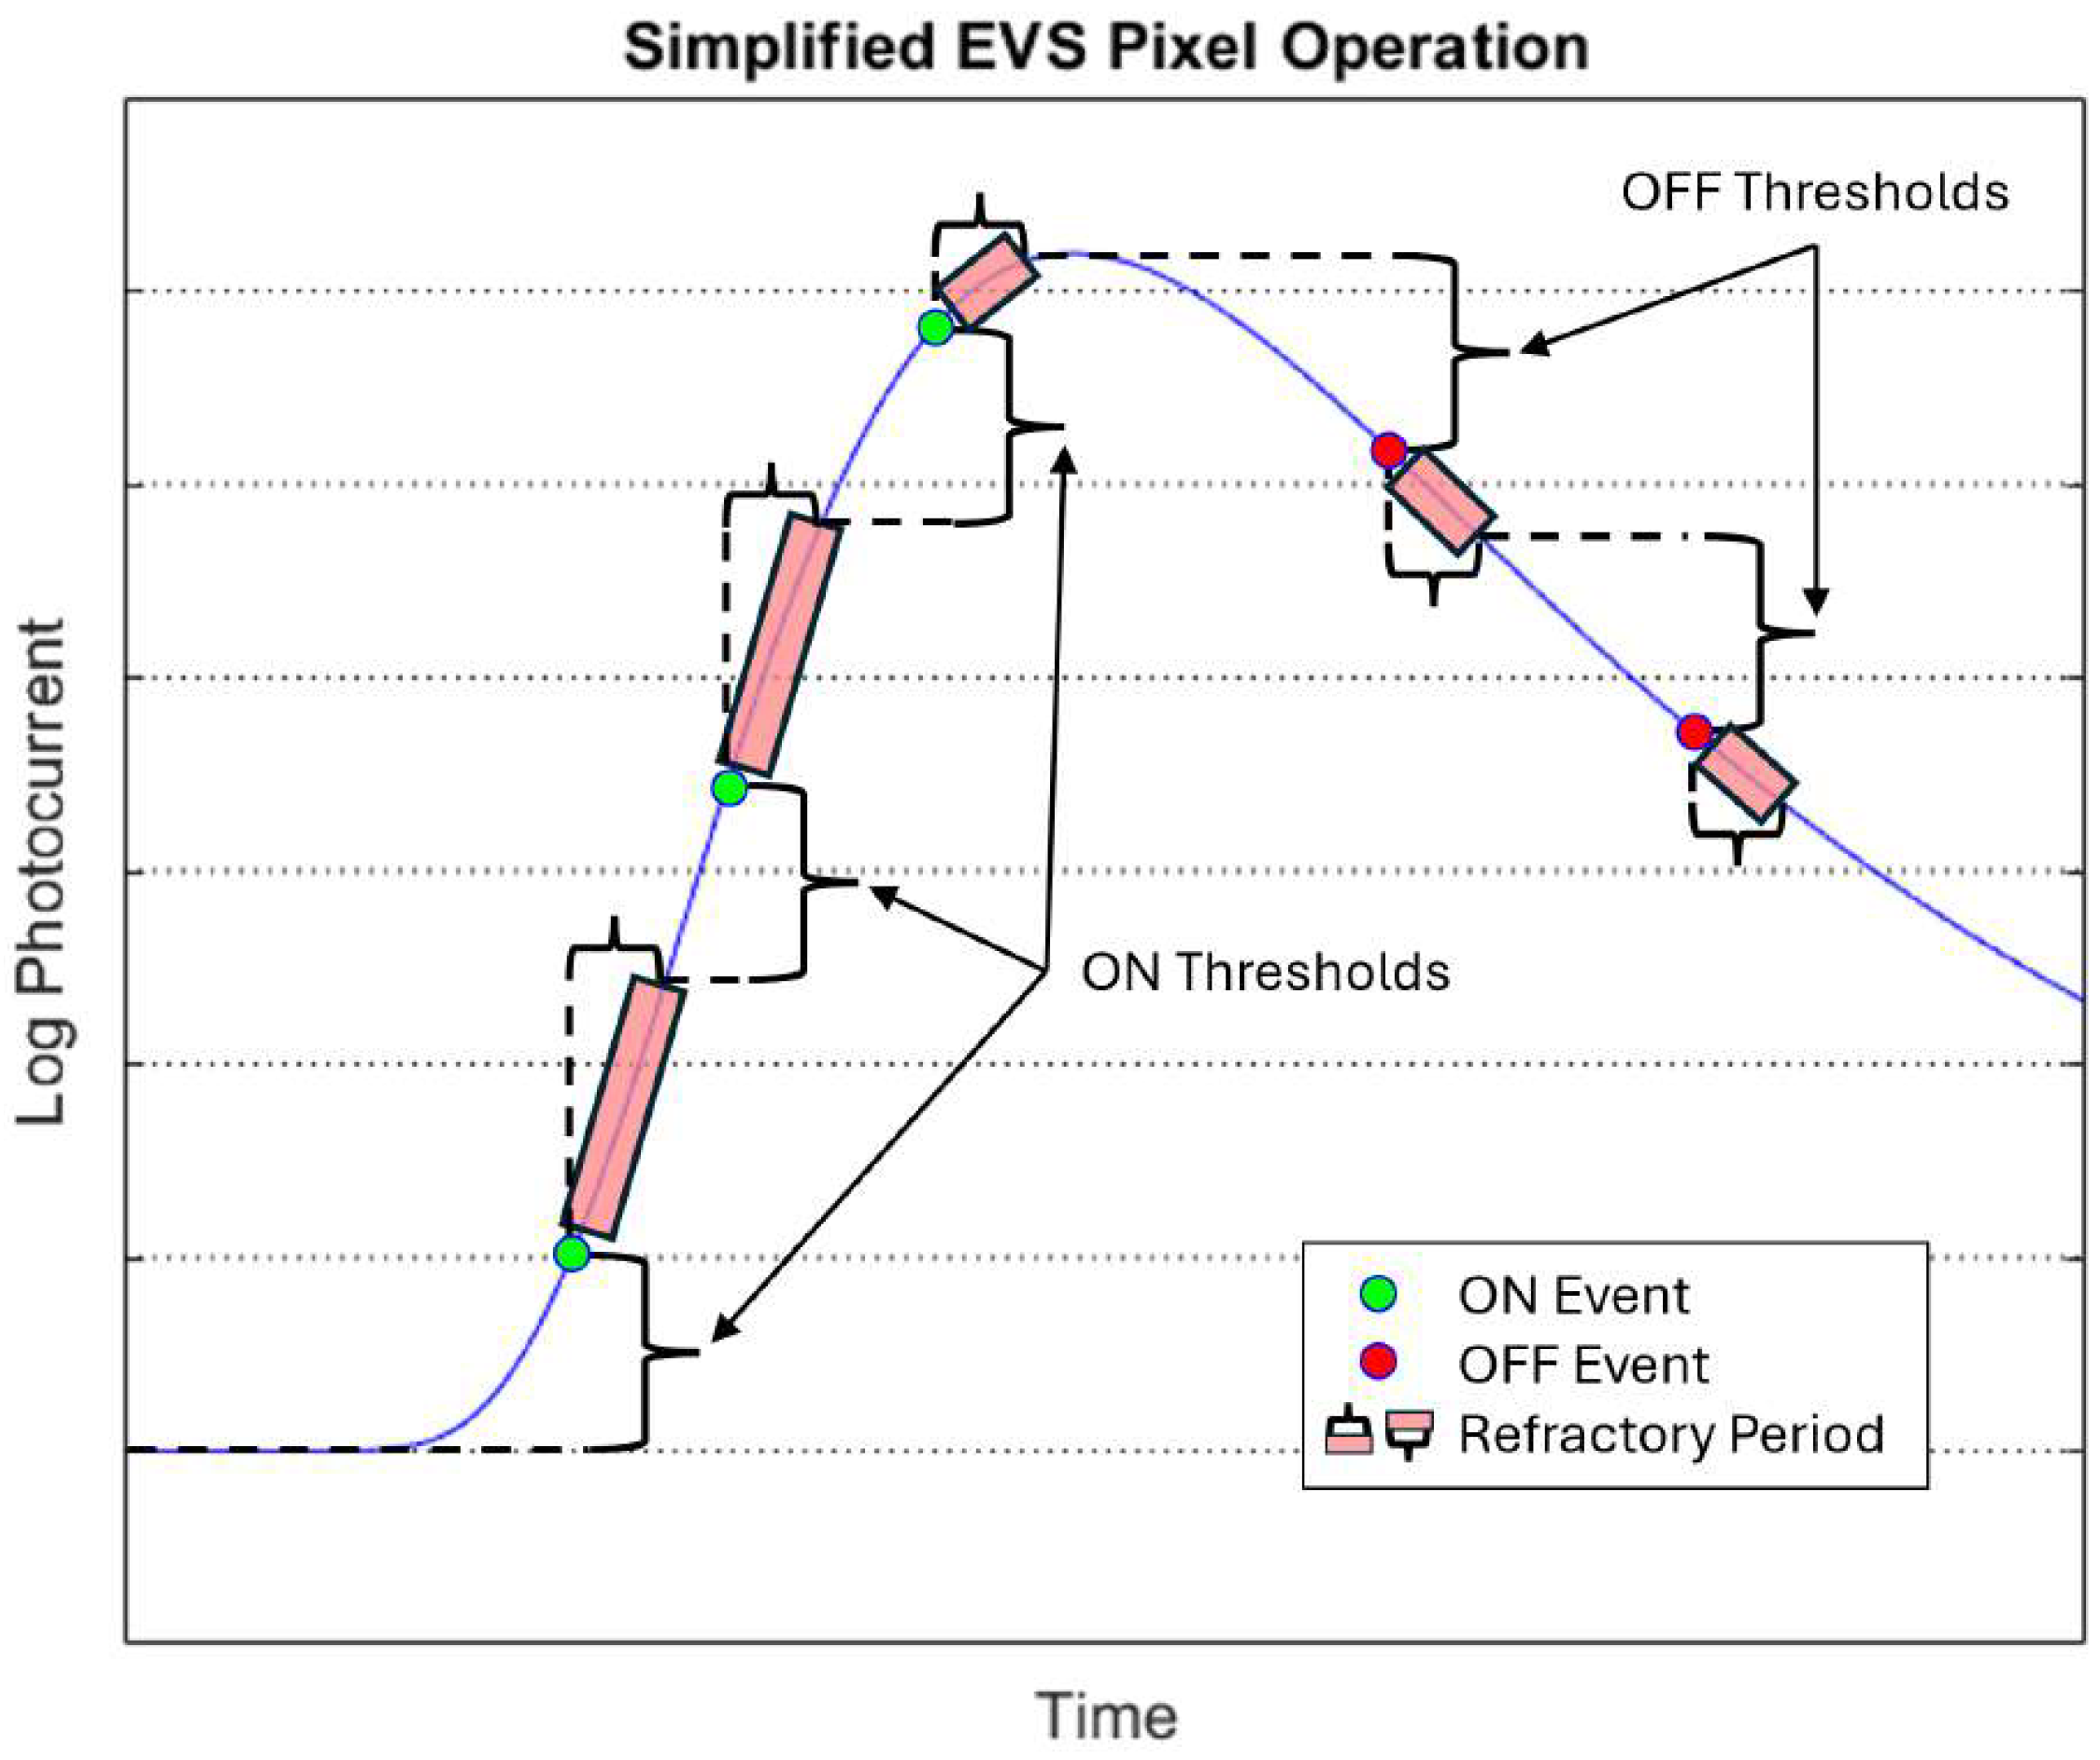
Event-based vision sensors (EVSs), also known as neuromorphic cameras, are modeled after the response of the human retina to optical stimulus. These sensors detect changes in scene brightness instead of capturing whole frame scenes at a fixed rate like traditional cameras. EVS pixels operate asynchronously and record events when the logarithm of the generated photocurrent increases (ON events) or decreases (OFF events) by more than the tunable thresholds. There is also a small delay between events due to the refractory or reset period which limits the maximum event rate or output frequency of any one pixel [
1].
Figure 1 shows a simplified EVS pixel operation [
2]. These events are then combined into a single output stream, known as Address Event Representation (AER), containing the pixel location, time, and event polarity [
1]. These sensors offer high temporal resolution (up to 1 µs), low latency (<1 ms), high dynamic range, and low power requirements with sparse data output [
3].
EVSs have shown promise in applications such as hand gesture recognition [
4], star and satellite tracking [
5], celestial object detection near bright sources like the moon [
6], visual odometry [
7], traffic data collection [
8], optical flow detection [
9], high speed counting [
10], vibration monitoring [
11], visual light positioning systems [
12], and high-speed particle detection and tracking in microfluidic devices [
13]. Despite their many merits, these sensors can be overwhelmed by light sources that exhibit significant changes in illumination over extremely short time-frames. Individual pixel sensitivity is also reduced with increased scene brightness due to the EVS’s detection of changes in log-compressed photocurrent; logarithmic thresholds correspond to larger linear thresholds at higher photocurrents. Therefore, overwhelming sources can reduce the ability to see targets of interest in a scene.
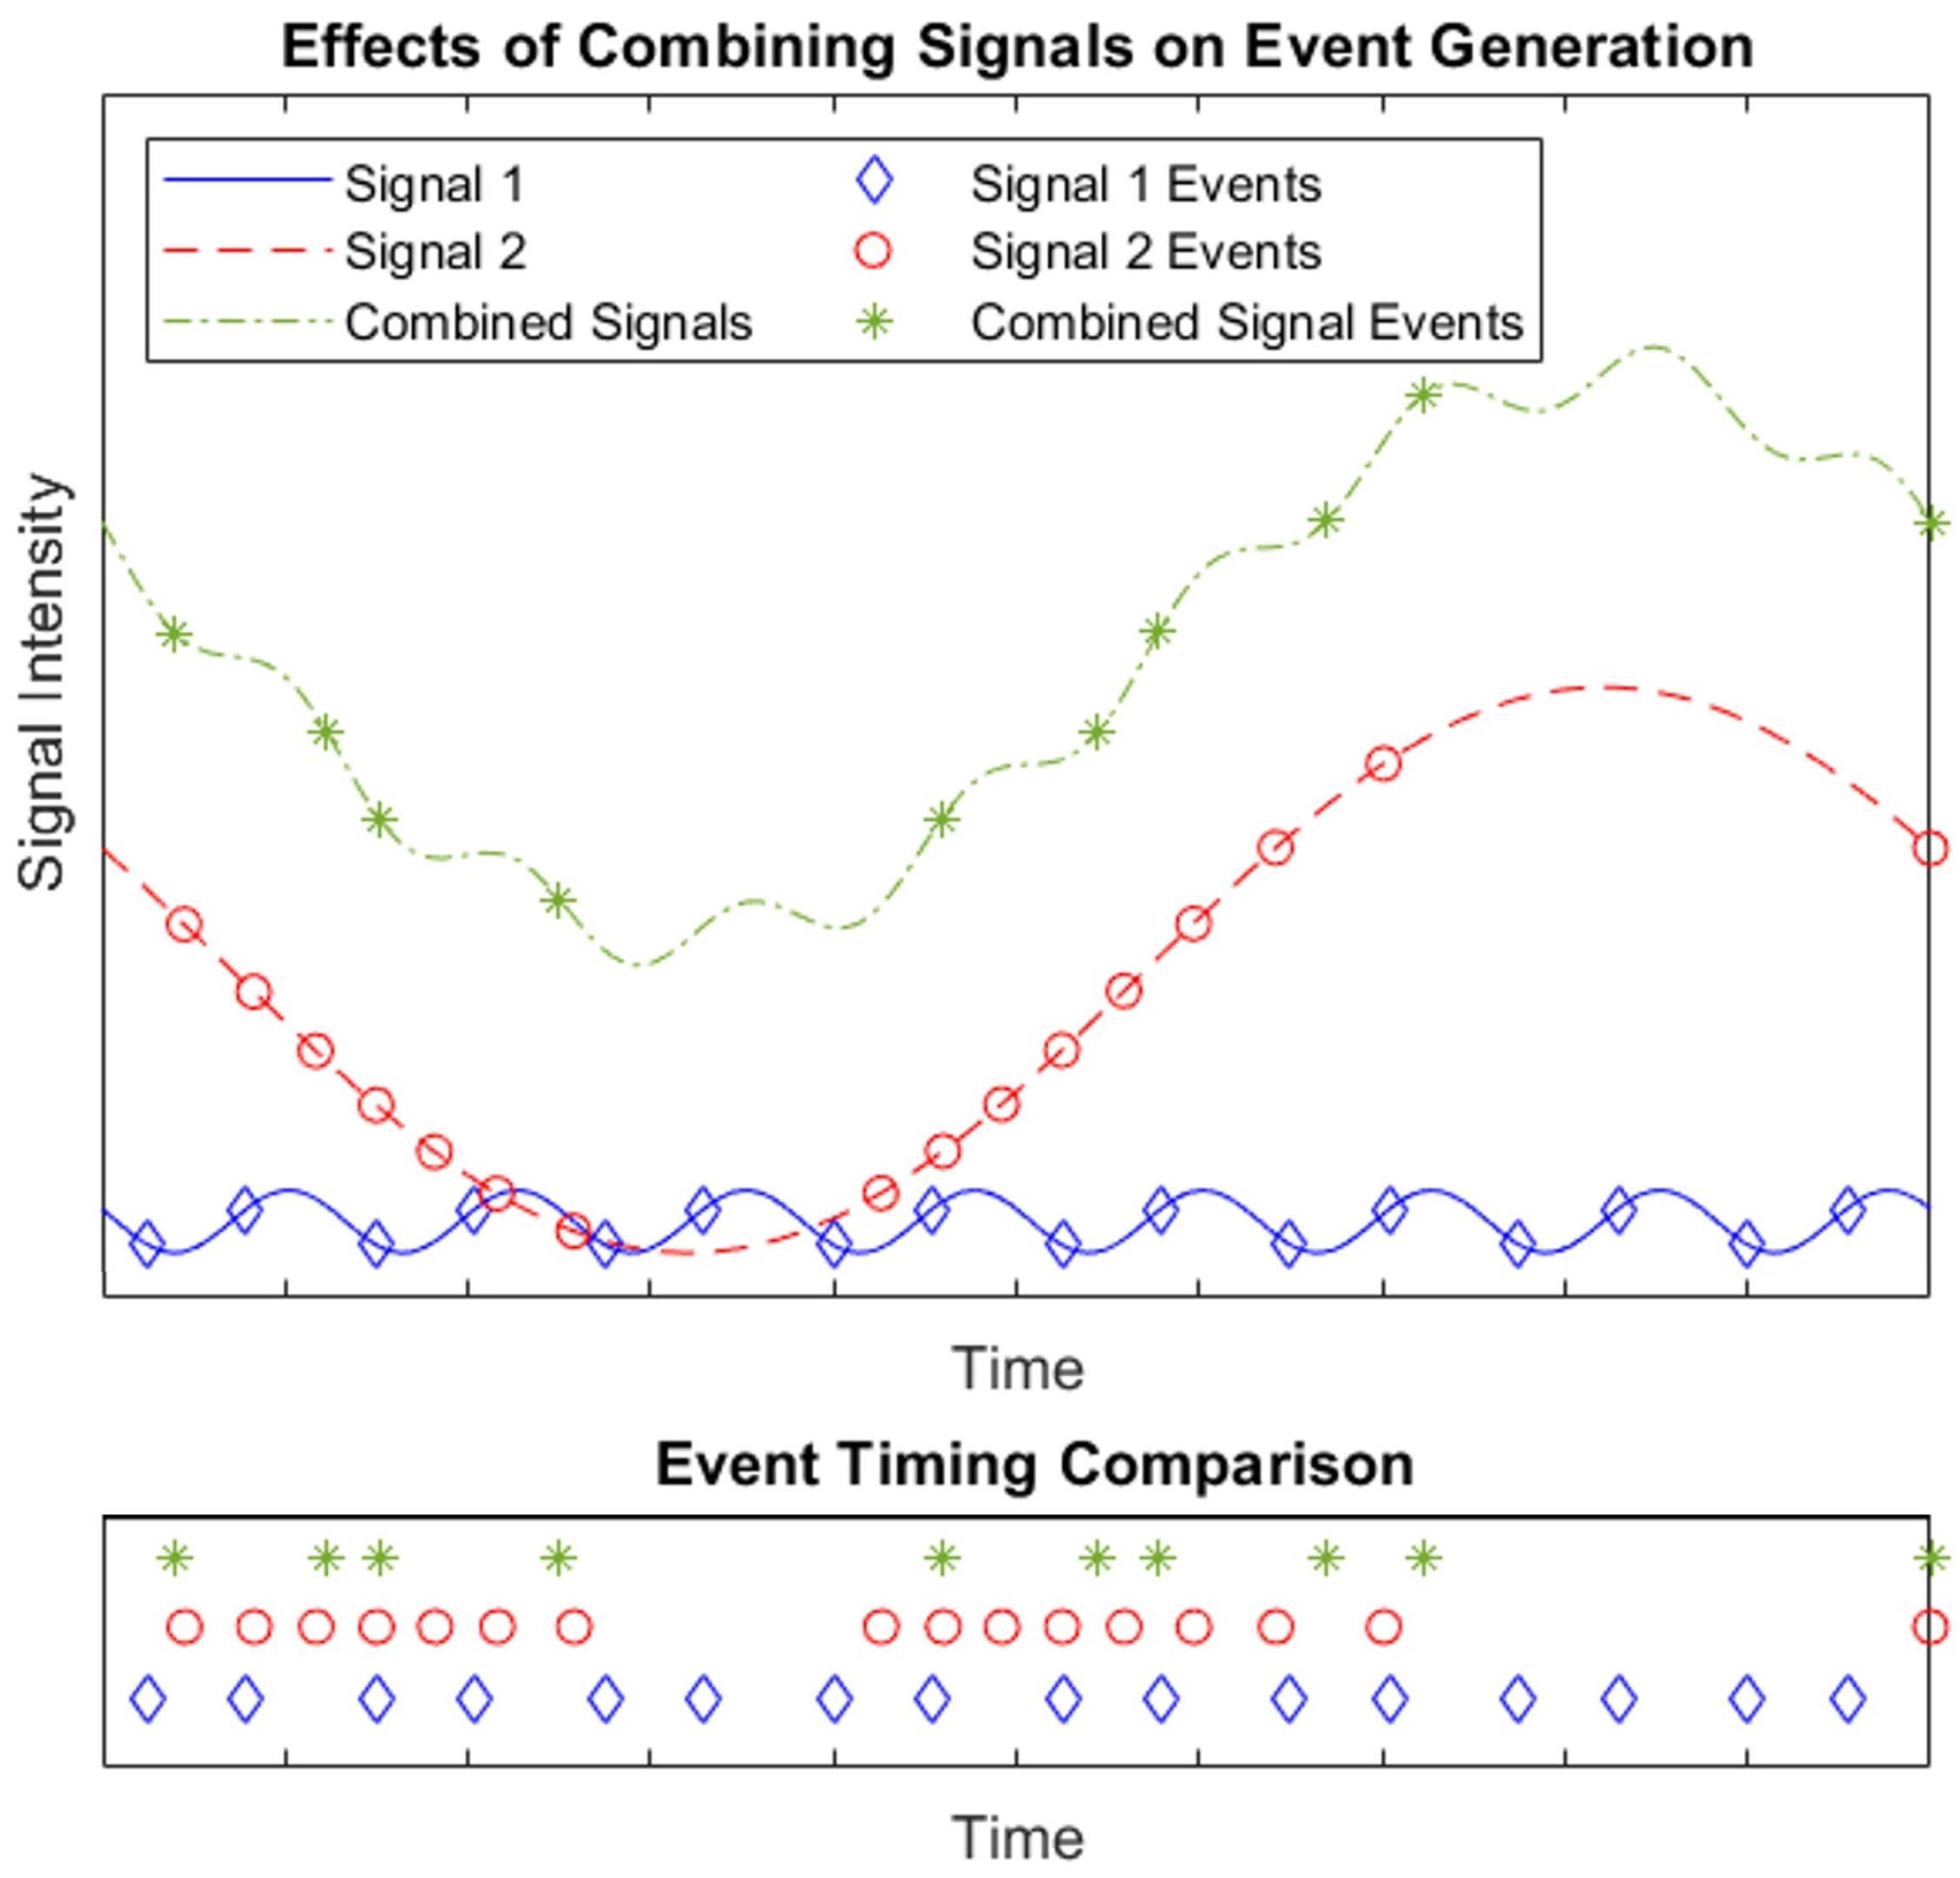
Figure 2 shows approximated effects of adding signals on event generation using a rudimentary EVS model. A combined signal’s events will have timing characteristics that differ from the individual signals’ events.
Significant work has been accomplished in the fields of dim target detection [
14,
15,
16]; noise, background, and extraneous events reduction [
17,
18,
19,
20,
21,
22]; and dynamic occlusion removal [
23,
24]. However, the problem presented in this work is unique in that normal sensor noise and scene background is so obscured by the overwhelming source that other methods to remove noise or dynamic occlusions do not necessarily apply. Since target events are sparse in reference to the overwhelming source, event-domain detection techniques such as event accumulation frames and event cluster detection are blinded to the targets. Additionally, the method designed and described in this work operates in the frequency domain instead of the event domain since the overwhelming source (described in
Section 2.1) has inherent stochastic frequency content due to atmospheric propagation which severely limits the use of traditional background suppression techniques. This method is also less affected by issues found in normal frequency analysis [
25]. Instead of focusing on the actual frequencies in the scene, this method simply determines which pixels have significant frequency content after a background suppression. Many other frequency-based target detection methods that rely on spectral matching or classification which may misrepresent, or not detect at all, targets due to the overwhelming source’s influence on targets’ spectra. As a result phase differences between sources, aliasing, and spectral leakage are less relevant. While there are other frequency-based detectors that do not require prior knowledge of target or overwhelming source frequency profiles [
26,
27], this method combines frequency-based principal component background suppression with an anomaly detection statistical filtering on data from a unique sensor (simulated) and problem set. The results include an event-domain and another frequency-based detector for performance comparisons.
The previously proposed method targeting this unique problem of reducing the effects of an overwhelming source used a center surround concept [
28]. The center surround method is based on a pixel hardware change where the average photocurrent of surrounding pixels is subtracted from the central pixel’s photocurrent before the event generation phase, removing the effects of the overwhelming source before the sensor output. However, these center surround sensors have only been proposed as a concept and, to date, no physical prototypes are available.
The purpose of this work is to develop and test a method to reduce overwhelming source effects and detect targets from data produced by the currently available commercial off-the-shelf (COTS) EVS models. The results presented in this paper serve as a proof of concept that individual pixel frequency analysis, background suppression, and statistical filtering can detect targets of interest through an overwhelming source.
2. Materials and Methods
Since collecting experimental data matching this specific problem scenario is difficult and no representative data is available, high frame rate scenes were simulated using a physics-based atmospheric model and traditional framing sensor before being upsampled to represent an EVS output through a frame-to-event conversion tool. That event data was then processed through the principal component background suppression with peak threshold detection method where statistically significant pixels were detected as targets.
2.1. Simulating the Problem Scenarios
Event data was generated using a combination of ASSET version 1.2 (Air Force Institute of Technology Sensor and Scene Emulation Tool) and v2e version 1.7.0. ASSET is a “physics-based image-chain model used to generate synthetic electro-optical and infrared (EO/IR) sensor data with realistic radiometric properties, noise characteristics, and sensor artifacts” [
29,
30]. ASSET was specifically chosen for its ability to accurately simulate the frequency dependent impact of the atmosphere on a possible overwhelming constant source. v2e is a Python and OpenCV code that “generates realistic synthetic DVS event [data] from intensity frames” at higher resolution [
31]. ASSET was used to generate the scene, target, and overwhelming source frame files while v2e transformed those frames into upsampled event data.
The primary goal when creating scenes using ASSET and v2e was to simulate event data such that the targets were very challenging to detect through normal visualization techniques. Care was taken to ensure the simulated scenarios were consistent with the operating parameters of hypothetical future real-world system based on existing technology. Different target frequencies and overwhelming source powers were used generate four potential scenarios where the target detection through normal methods ranged from trivial to nearly impossible. Target frequencies were generated in ASSET as a sine wave with power ranging from zero to an apparent signal-to-background radiance of approximately six. The overwhelming source was simulated as a continuous source, using the atmospheric model to generate its temporal characteristics. The frequency of the overwhelming source was approximately 10 Hz with stochastic variations in apparent size on the focal plane array (FPA) due to the atmospheric effects. This overwhelming source frequency is similar to the expected Greenwood frequency at the modeled sensor’s high altitude [
32]. Each overwhelming source power was chosen to be one order of magnitude greater than the previous.
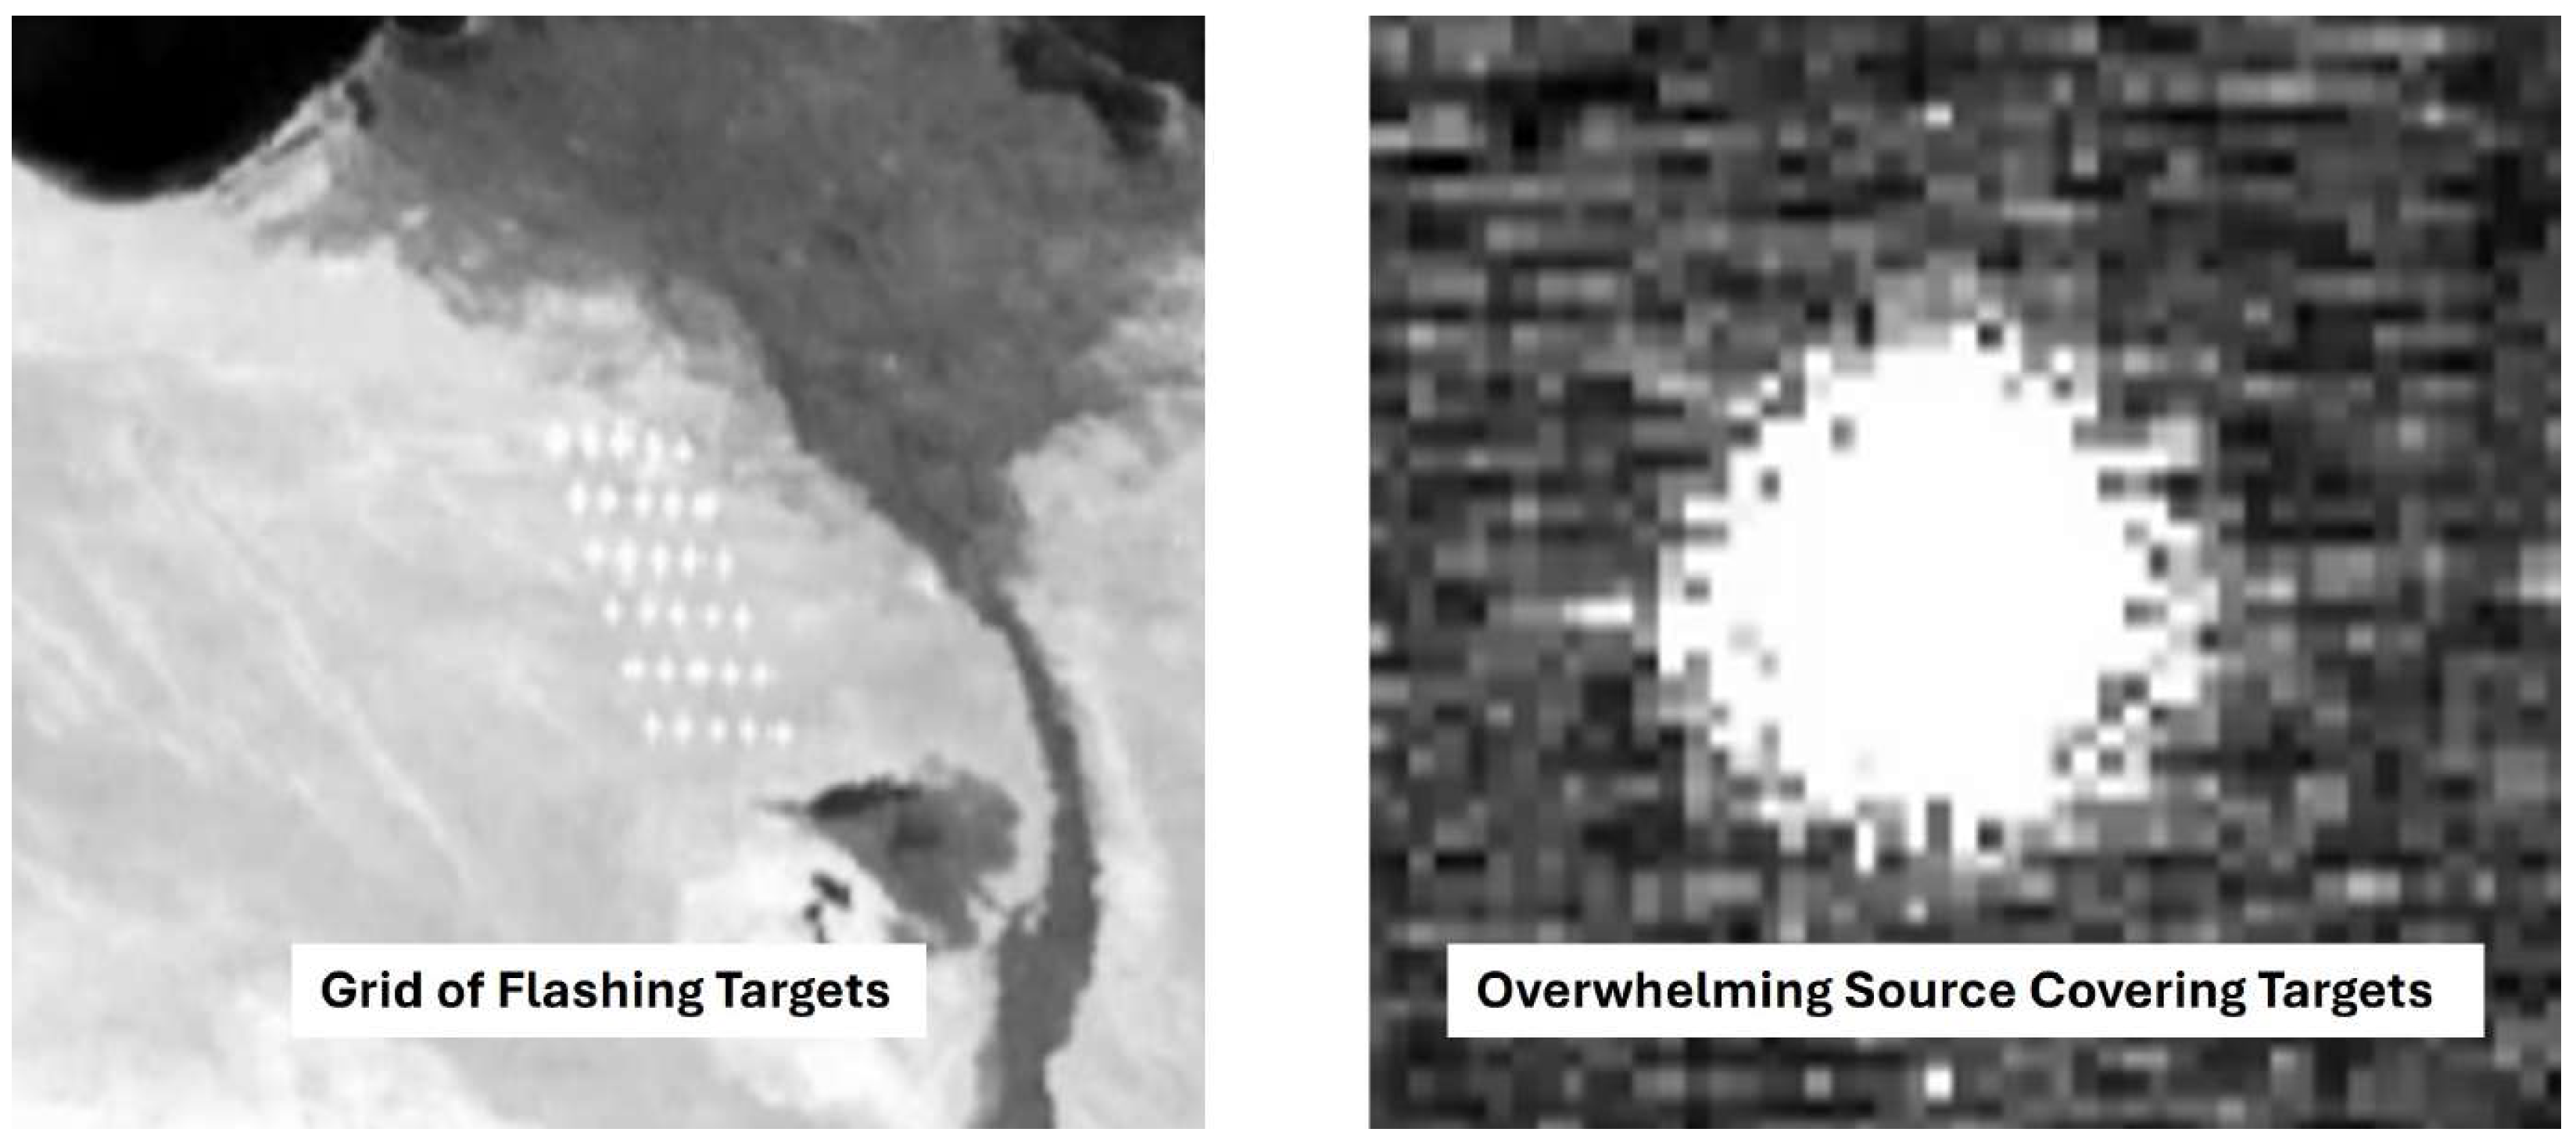
Figure 3 shows the ASSET-simulated target grid without an overwhelming source (left) and the effects of an overwhelming source in the same scene as the targets (right) on a traditional sensor. Both images display the same FOV and viewpoint, demonstrating how much an overwhelming source can affect target detection.
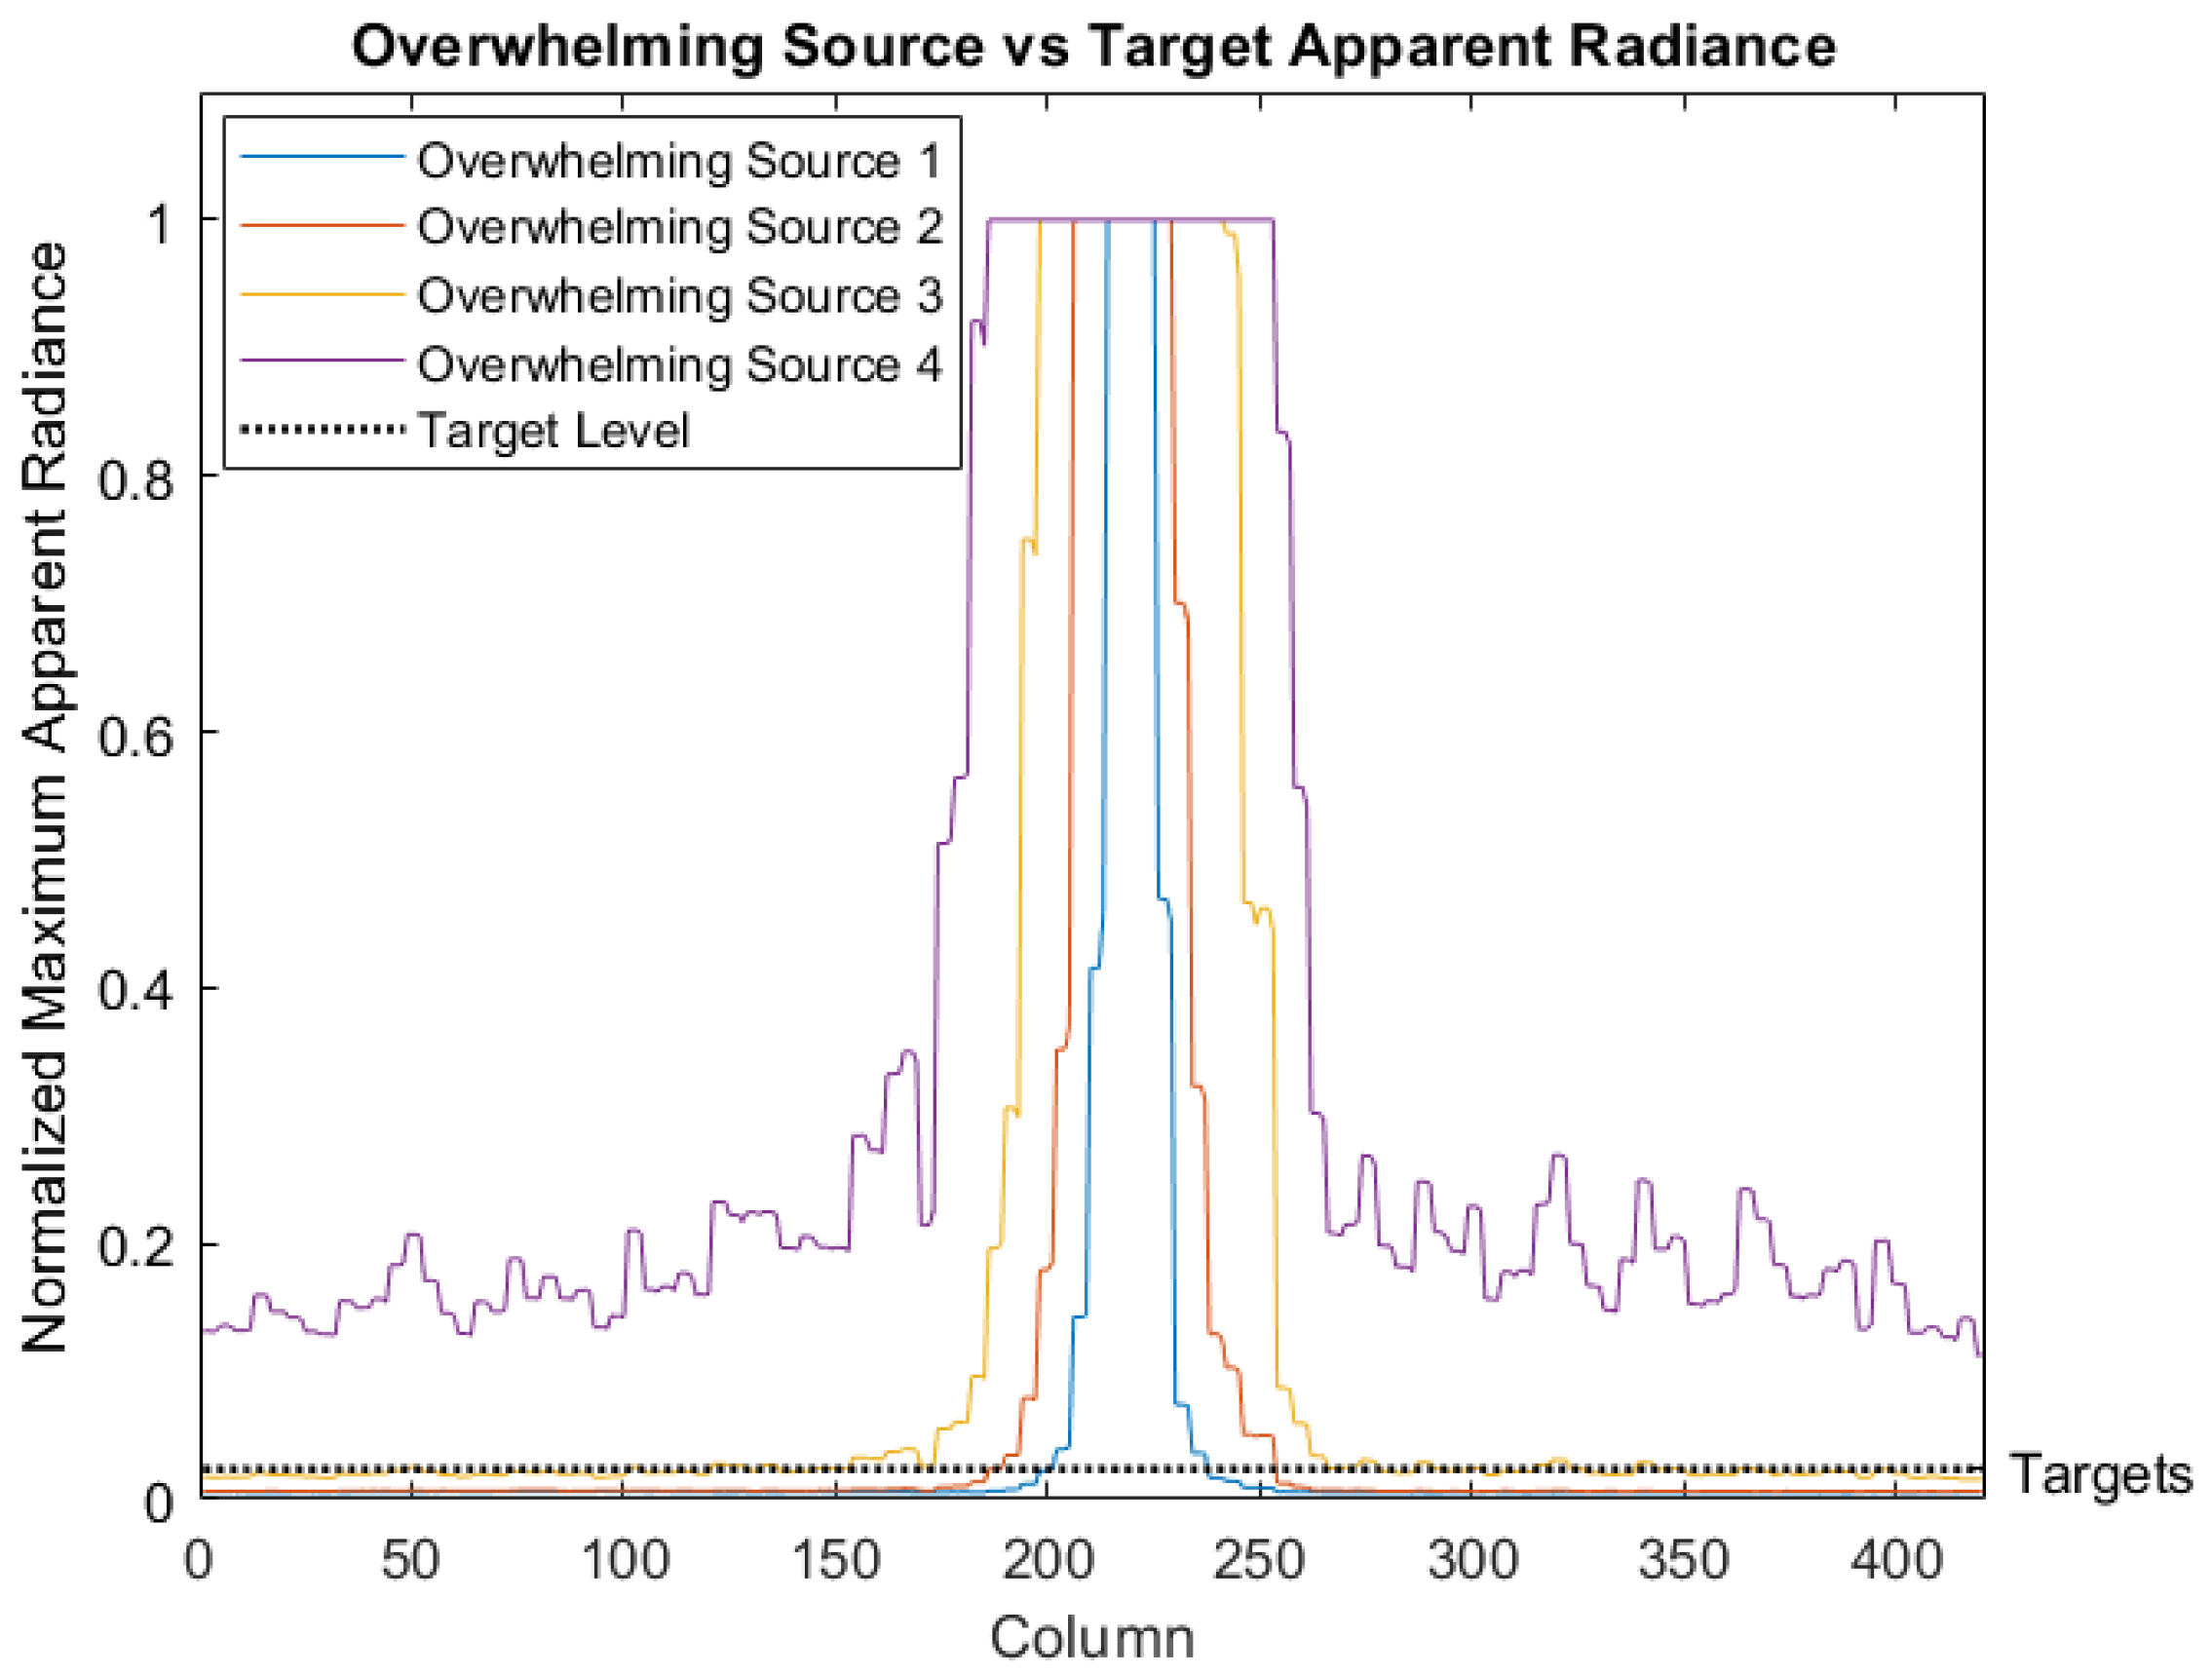
Figure 4 shows the ASSET-modeled, normalized apparent radiances of the four overwhelming sources as measured by a traditional sensor, given as the maximum over one FPA dimension, compared to the maximum target apparent radiance normalized to the same scale. These scenarios allow for a range of signal-to-background radiance ratios between approximately 0.0236 and 281, depending on the target location.
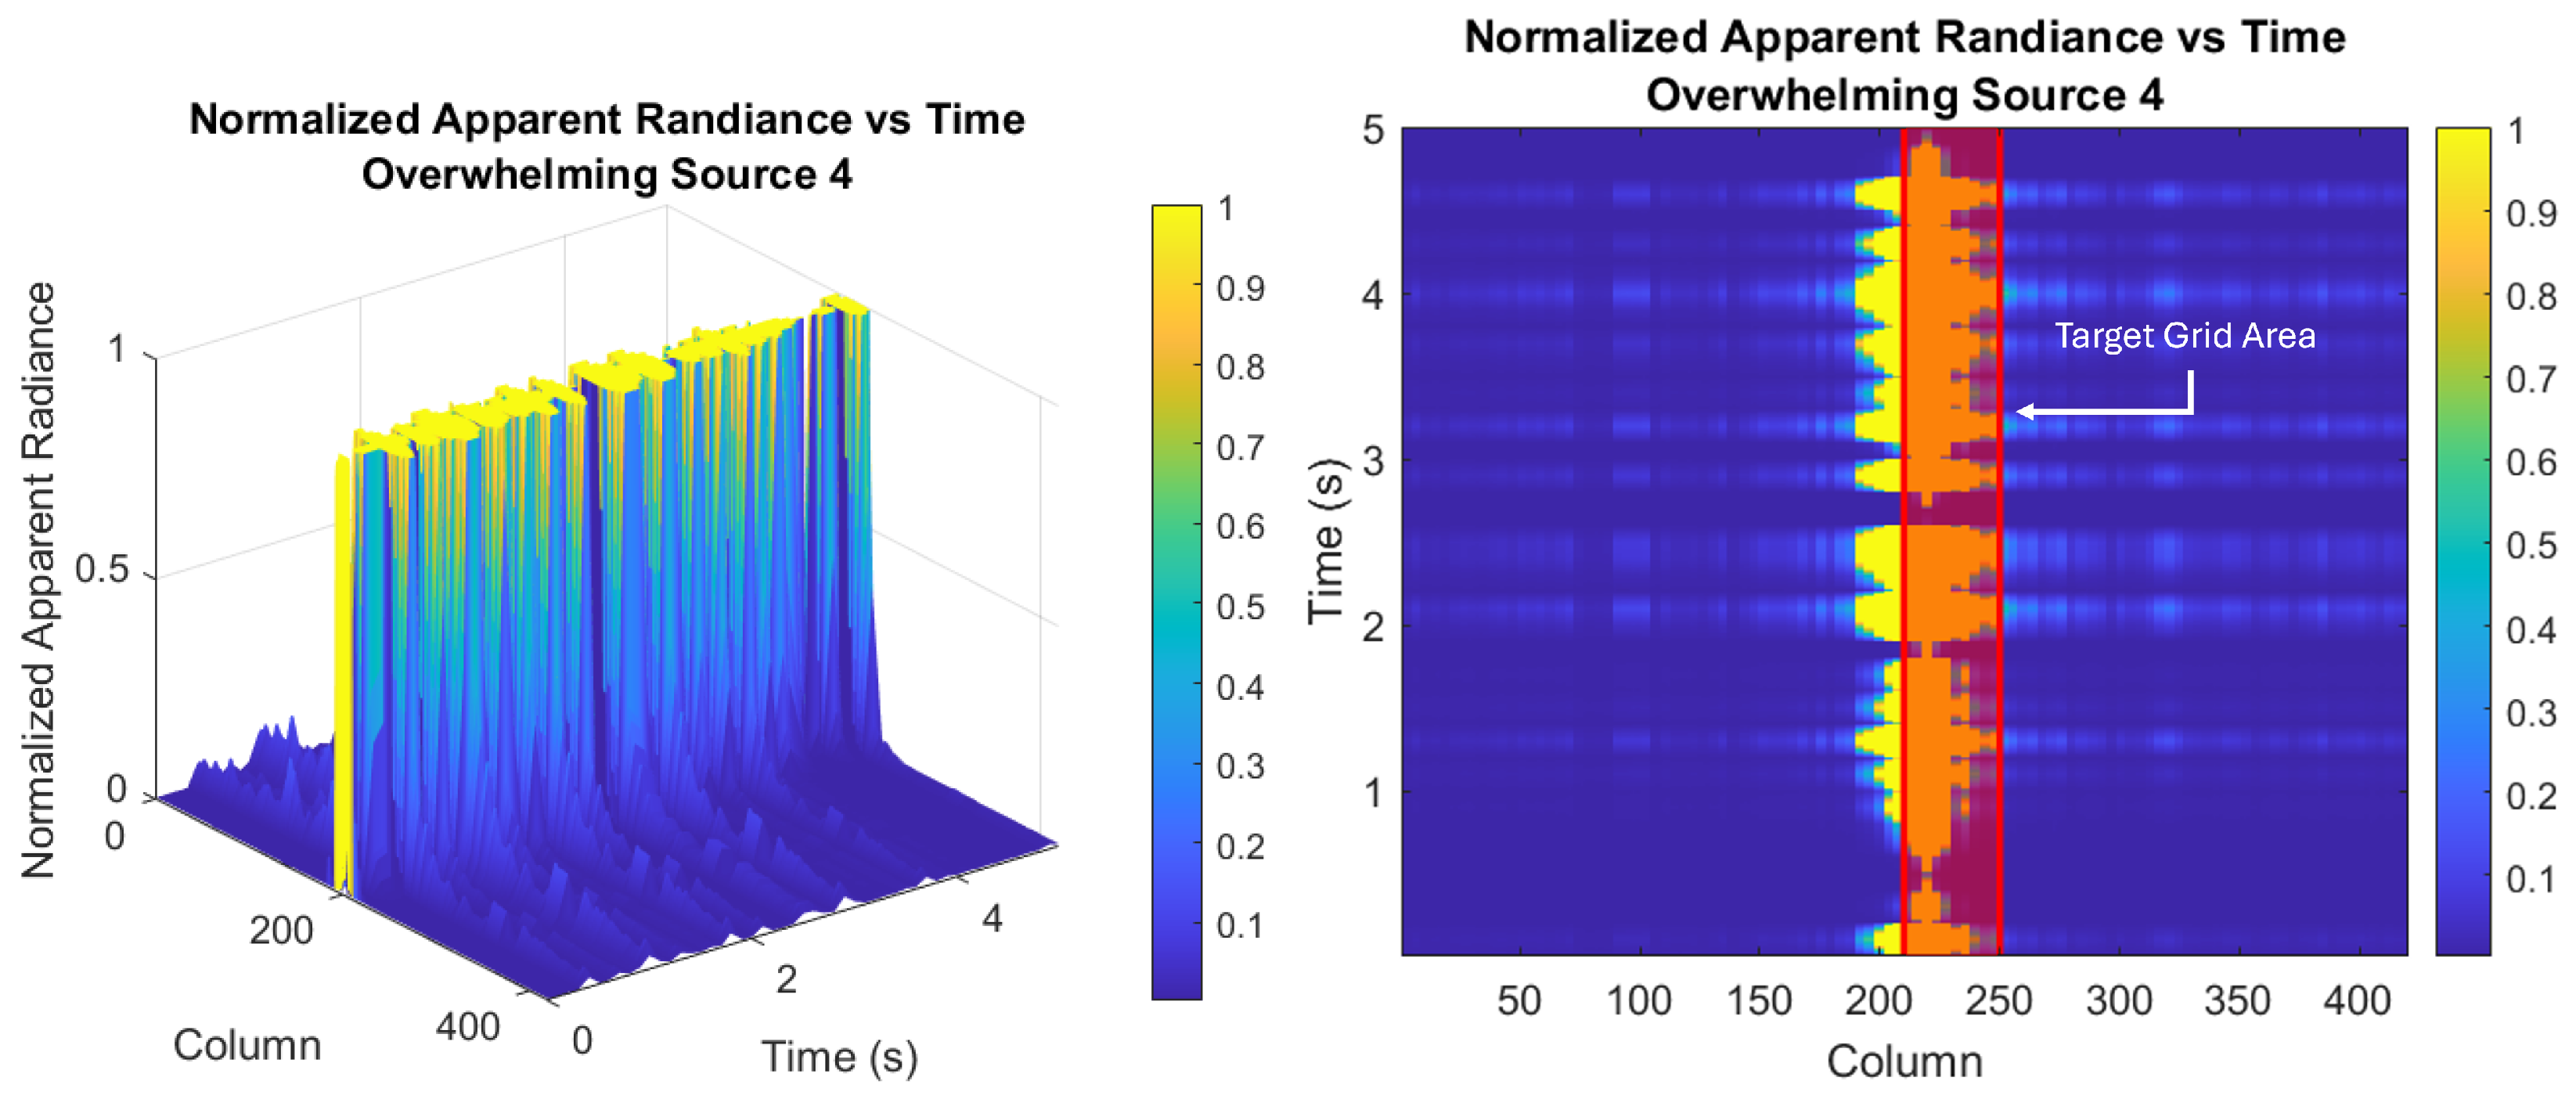
Figure 5 shows the temporal evolution of the apparent radiance for the strongest overwhelming source along a pixel row passing through its center, as measured by a traditional sensor. The surface plot reiterates the high intensity of the overwhelming source and captures its dynamics, while the color plot indicates the location of the target grid area within those dynamics.
All four data sets were simulated over five seconds and contained a grid of 30 targets with frequencies chosen randomly from the set containing 3, 6, 8, 10, 12, and 17 Hz. These target frequencies were chosen to specifically challenge the background suppression algorithm since it performed extremely well for frequencies over 17 Hz in these scenarios. Testing higher-frequency targets would be redundant, as increasing frequency without altering the intensity range correlates directly to higher event rates, as shown in
Figure 6. In turn, these higher event rates would result in improved detection performance.
To ensure the simulated EVS data had correct temporal dynamics, ASSET frames were generated at 1000 frames per second and upsampled in v2e to 5000 event frames per second.
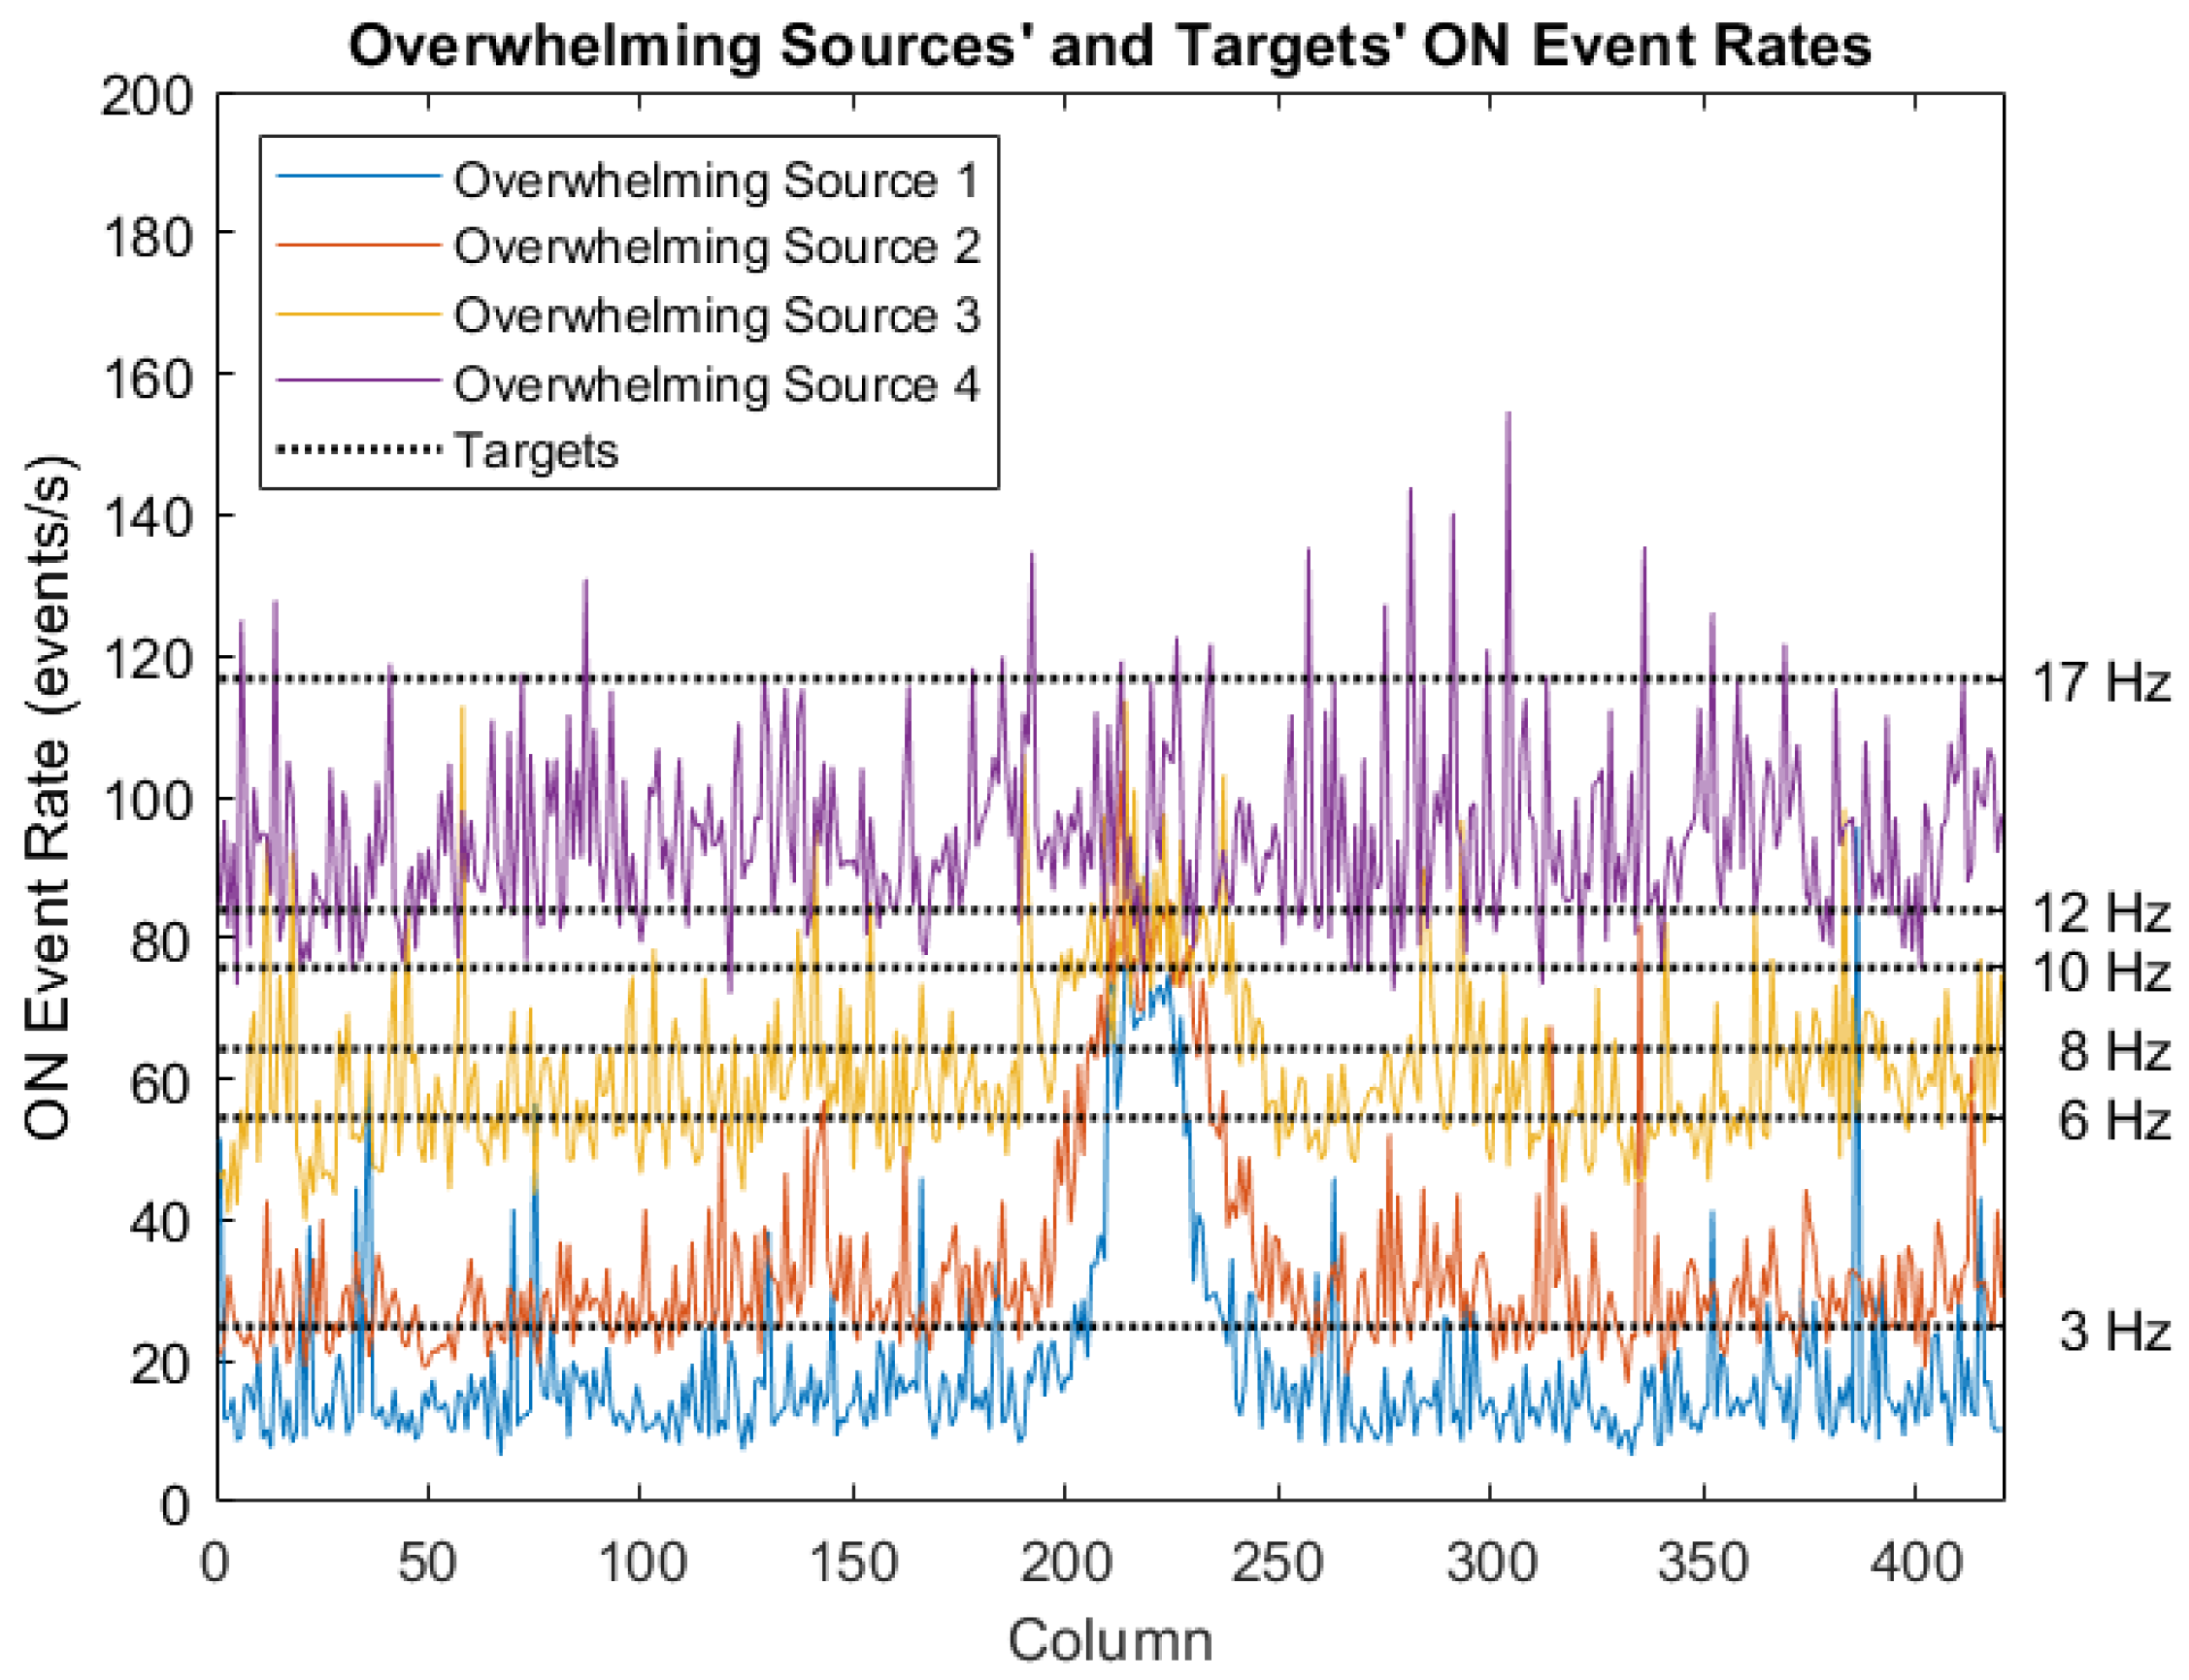
Figure 6 shows the v2e-simulated ON event rates generated by the overwhelming sources, also given as the maximum over one FPA dimension, as well as the targets’ ON event rates. Target event rates were calculated from scenarios absent of the overwhelming source since attributing specific, convoluted events to individual sources is impossible in these scenarios (
Figure 2). True target event rates in the presence of the overwhelming source are expected to be lower than the figure depicts. As shown by the shape of the overwhelming sources’ event rates, the strongest overwhelming source was chosen to maximize the achievable ASSET/v2e combined model event rate.
2.2. Principal Component Background Suppression with Peak Threshold Detection
There are three main steps of this principal component background suppression with peak threshold detection method: individual pixel frequency analysis, background suppression, and statistical filtering. Frequency analysis was chosen as the primary data processing technique due to the sensor’s high temporal resolution and event-driven output. The purpose of the background suppression was to reduce the effects of the overwhelming source on the frequency spectra. Filtering was performed after the suppression to select pixels with statistically significant frequency content for target detection, regardless of true target or overwhelming source frequencies.
2.2.1. Fast Fourier Transform Frequency Analysis
The chosen frequency analysis method was the fast Fourier transform (FFT). The fast Fourier transform is an optimized algorithm to compute the discrete Fourier transform (DFT) of a signal in order to retrieve its frequency spectrum, amplitude, and phase [
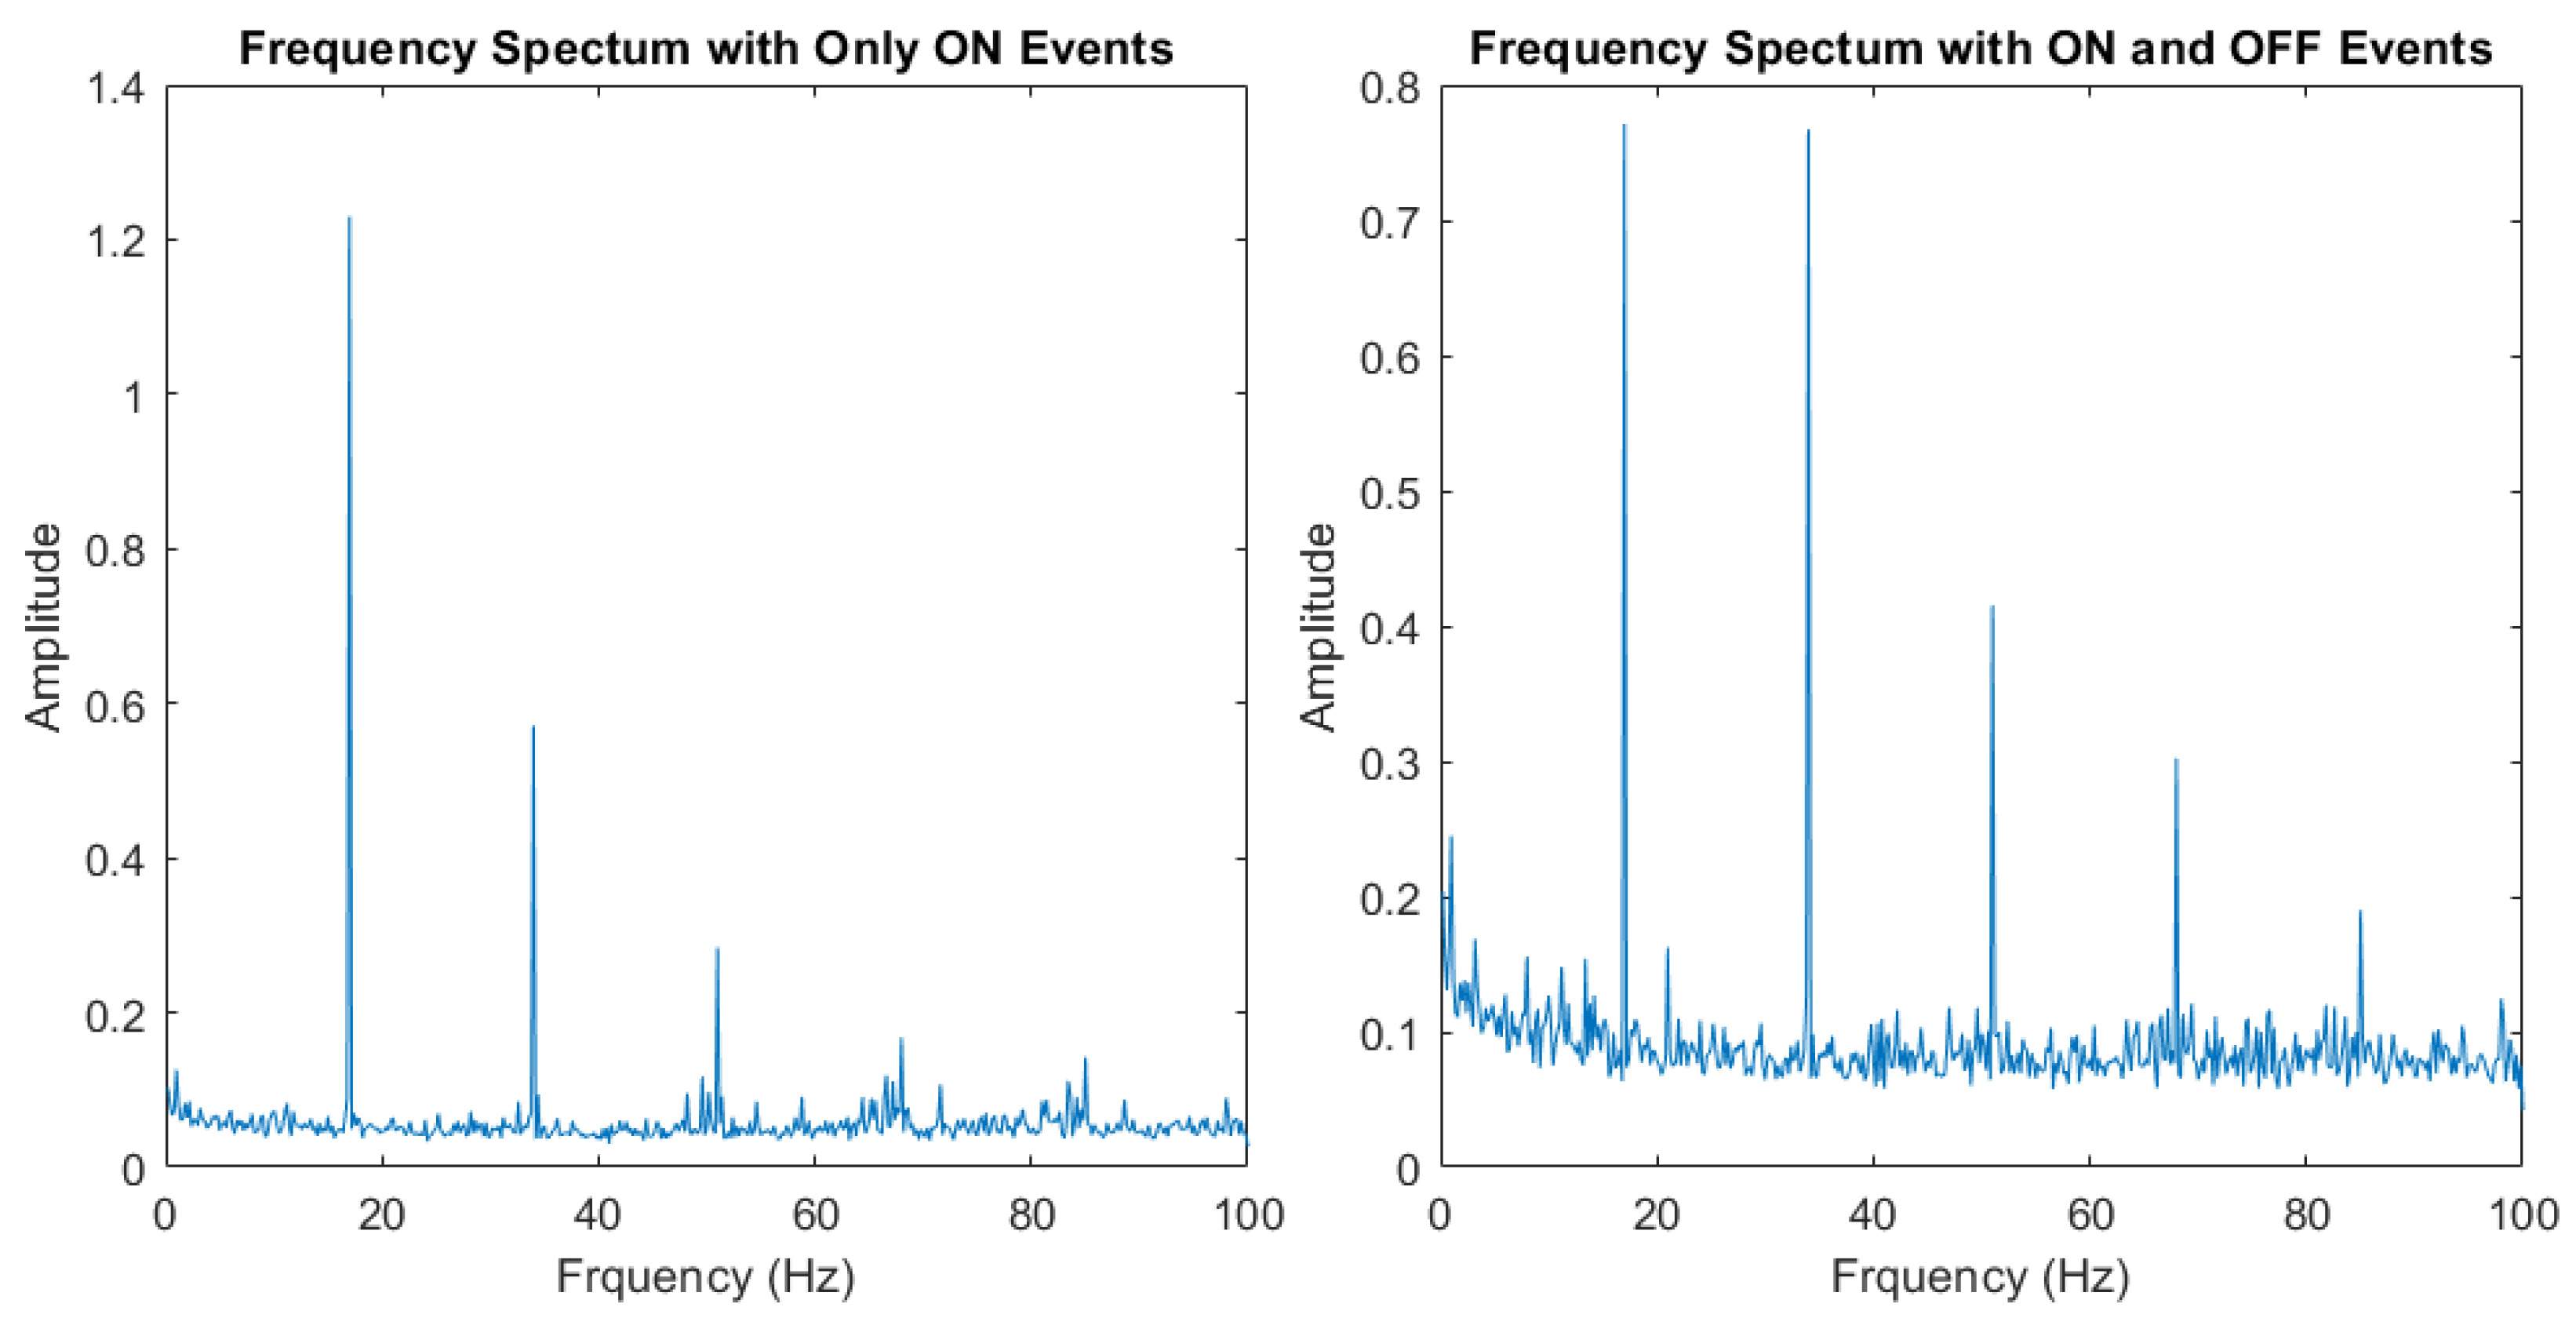
33]. Before an FFT algorithm can be applied on event data, the events must first be separated by pixel address and modified into a form accepted by the FFT. The events must be modified due to the non-uniform time intervals between generated events. Events were separated by pixel before the FFT was applied to ensure that each pixel’s spectrum contained frequency content corresponding to only that pixel’s field of view. While there were a few ways to modify the event data, a binning method was chosen such that events were summed into discrete temporal bins over the length of the recording. In this work, only ON events were used as it was observed that OFF events exhibit a decay feature that can exceed the time length of the intensity drop and introduce extraneous frequency information and unnecessary additional noise.
Figure 7 shows the resulting maximum frequency spectra of a simple example scenario with no overwhelming source and three 17 Hz targets, using only ON as well as both ON/OFF events. When both ON and OFF events are used, energy is lost in the target frequencies and overall noise is increased. However, tests were performed on the four simulated scenarios using both ON and OFF events to verify the effects on target detection, with their results included in
Section 3.
Five millisecond time bins were chosen to create the FFT inputs as that bin size was small enough to resolve the frequencies of the sources used per the Nyquist frequency limit (see
Section 2.1) but large enough to prevent the need to simulate event “frames” at an extremely high rate which would drastically increase an already large simulation computation time. Other time bin sizes were tested on the simulated scenarios with their results included in
Section 3.
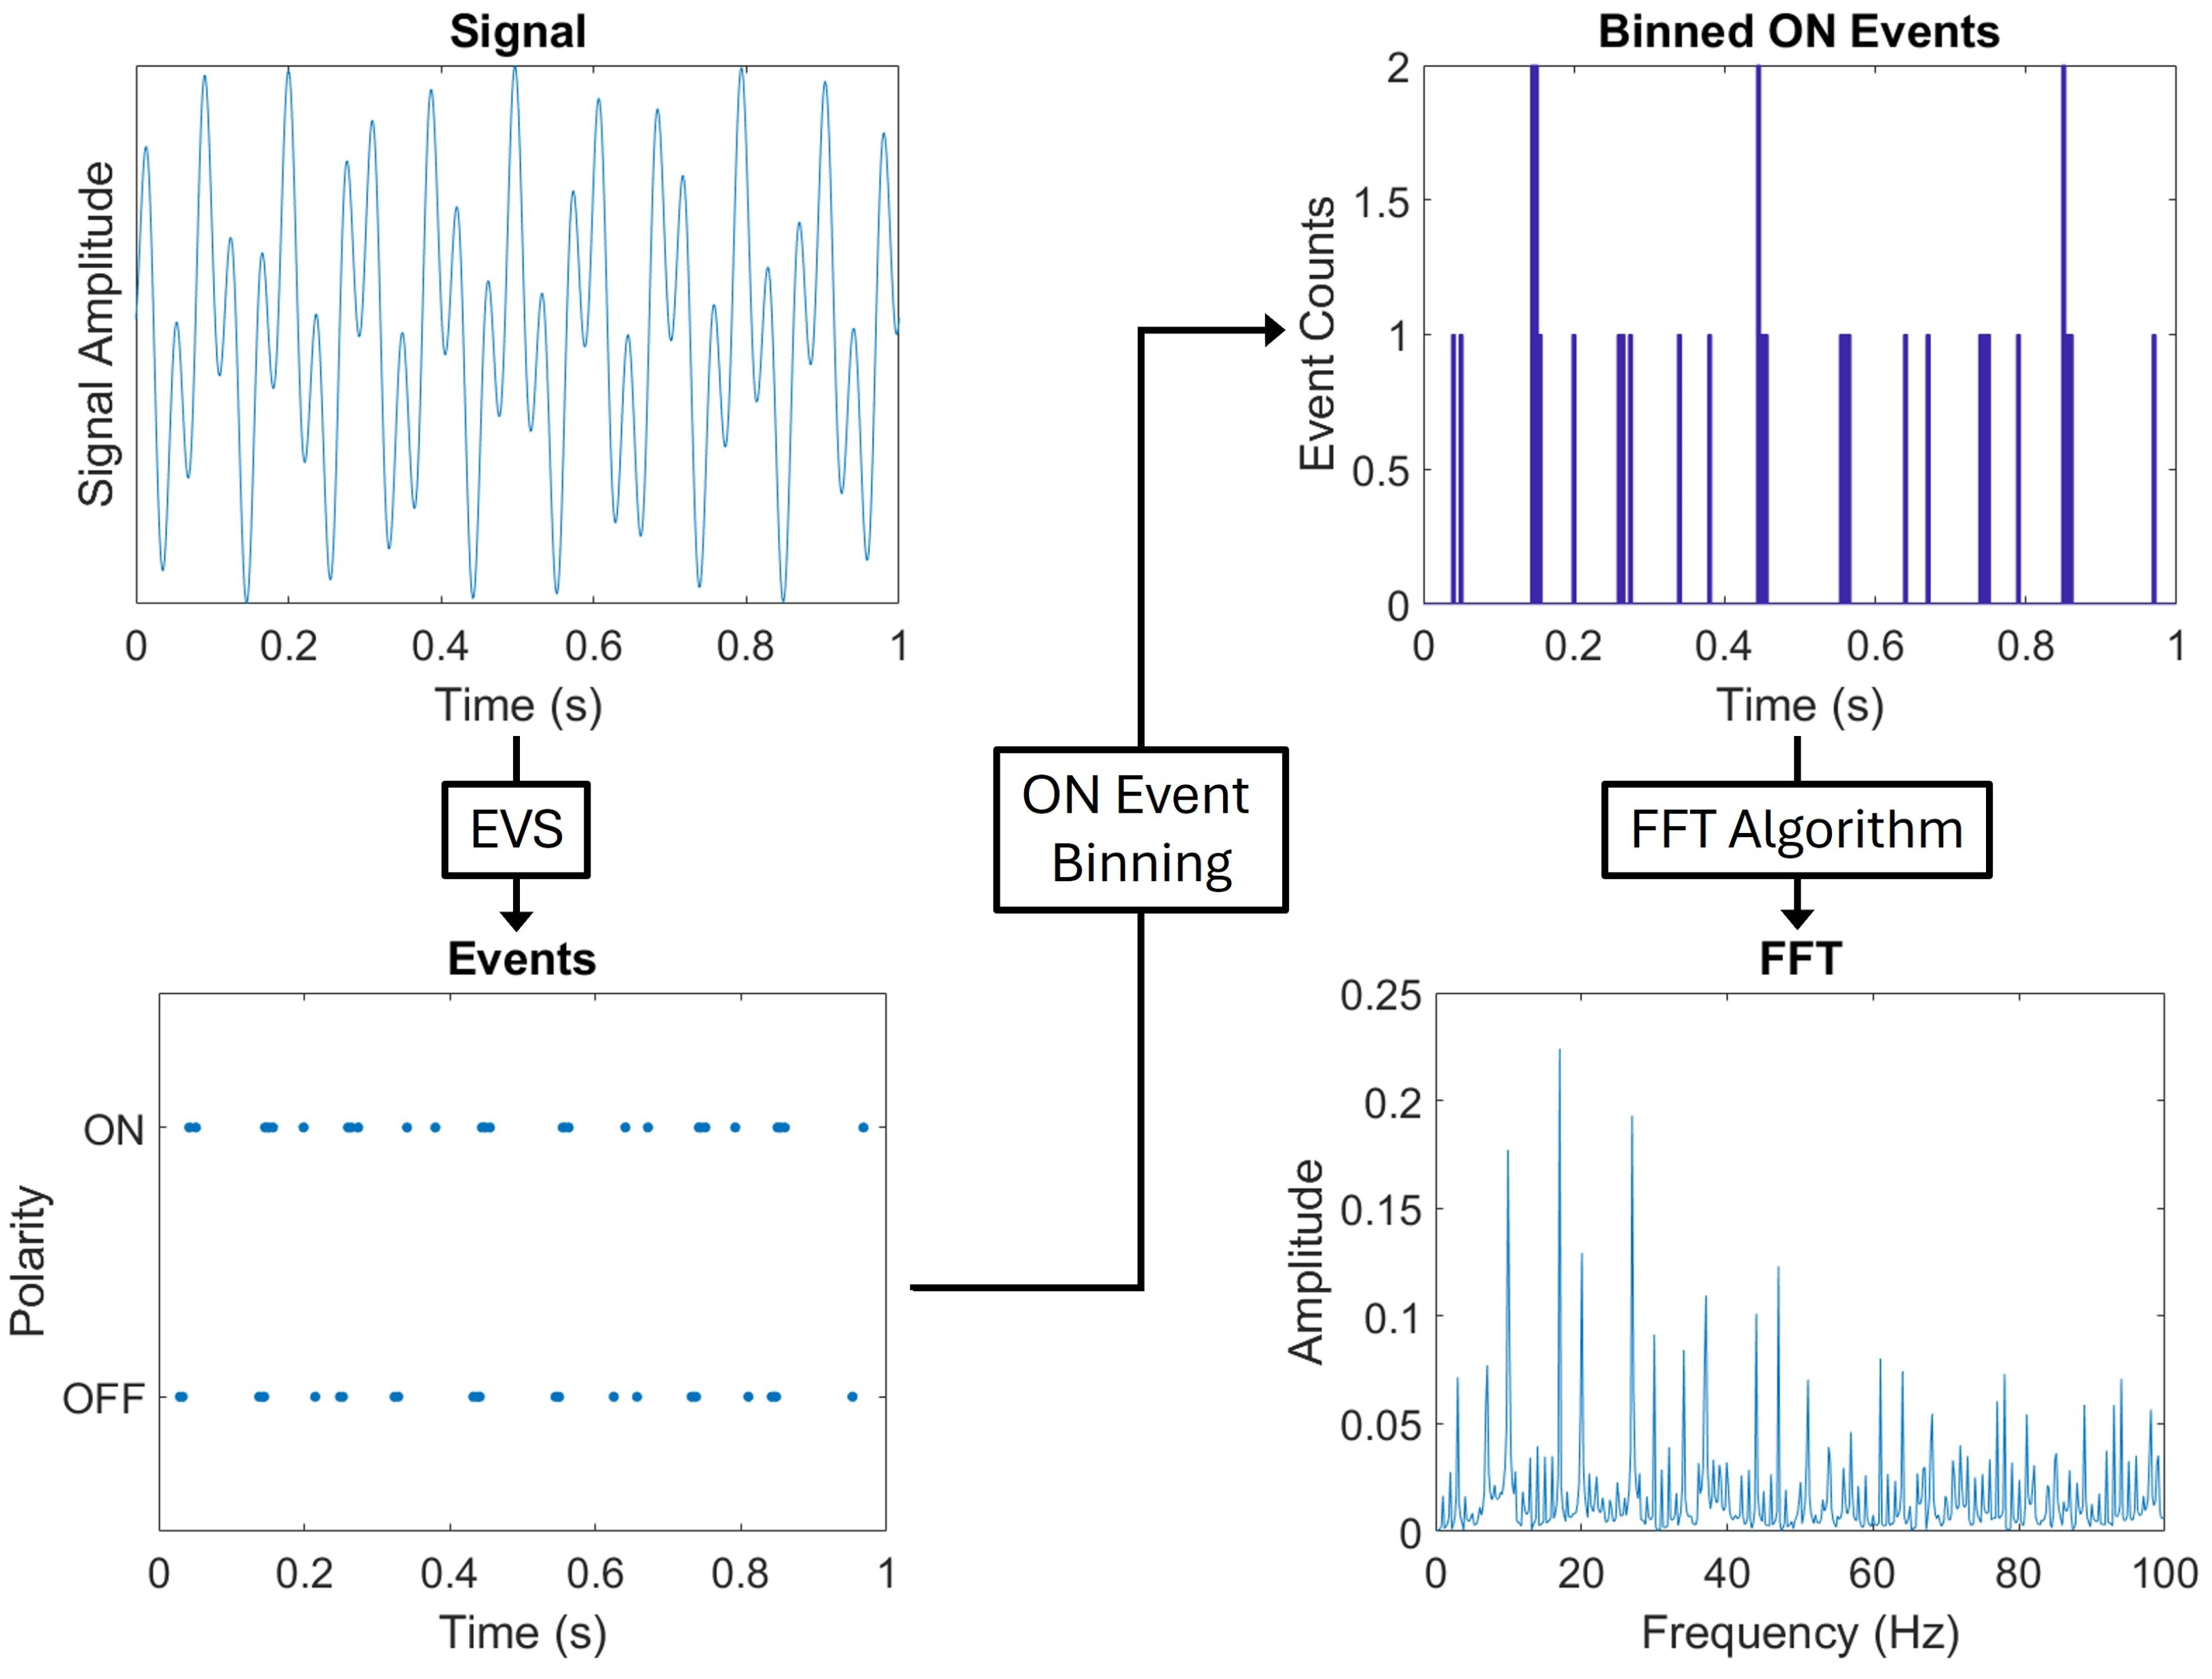
Figure 8 displays a flow chart where ON events from a fluctuating signal are summed into time bins and transformed into the frequency domain through an FFT.
2.2.2. Principal Component Background Suppression
Once the pixels’ frequency spectra were obtained, principal component background suppression (PCBS) was performed to reduce the amplitude of the frequencies generated by the overwhelming source. PCBS is an adaptable statistical technique that uses the principal components (PCs), or eigenvectors, of a data set to suppress the background or clutter in a scene. This background suppression is often used for applications such as jitter removal in surveillance videos [
34], thermal background subtraction [
35], and artifact suppression in non-destructive testing data [
36]. For a generic data set, the data matrix rows are the measurable variables while the columns are the observations [
37]. In this work, the measurable variables were the FFT frequency bins and the observations were the frequency amplitudes in each pixel.
PCBS assumes that a data matrix,
, contains the sum of the background,
, and signal,
, such that,
If a “good enough” background model,
, can be created, then an approximated signal,
, can found by
This detection method estimates that the eigenvector matrix,
, can be decomposed as
where the eigenvector matrix is found by solving the eigenvalue problem of the data covariance matrix,
is sorted by corresponding eigenvalues in descending order, and
and
are separate background and signal subspaces. PCBS assumes some number of the largest eigenvectors are a “good enough” representation for the background model in the eigenspace [
37]. Since the overwhelming source is assumed to cover a large portion of the scene and be the most prominent feature, the leading PCs (
) should correspond to the frequency features generated by the overwhelming source. Additionally, this method can include sensor noise as an additional term in Equations (
1) and (
2) and as a third subspace in Equation (
3) [
38]. However, since the signal in this work is assumed to be sparse, the noise is included in the background.
The signal could then be estimated by either subtracting the background projected data or by projecting the data onto the signal eigenspace, such that,
Different methods can be used, and were explored, to automatically determine the appropriate number of PCs: cumulative variance threshold [
26], elbow point of the scree plot [
39], maximum value frequency spectra difference derivative threshold, and maximum value frequency spectra normalized dot product threshold. These methods exhibited varying levels of success due to a large number of variables (sources’ frequency and power, data modification method, FFT parameters, etc.) which can influence the appropriate number of PCs for a sufficiently accurate background model.
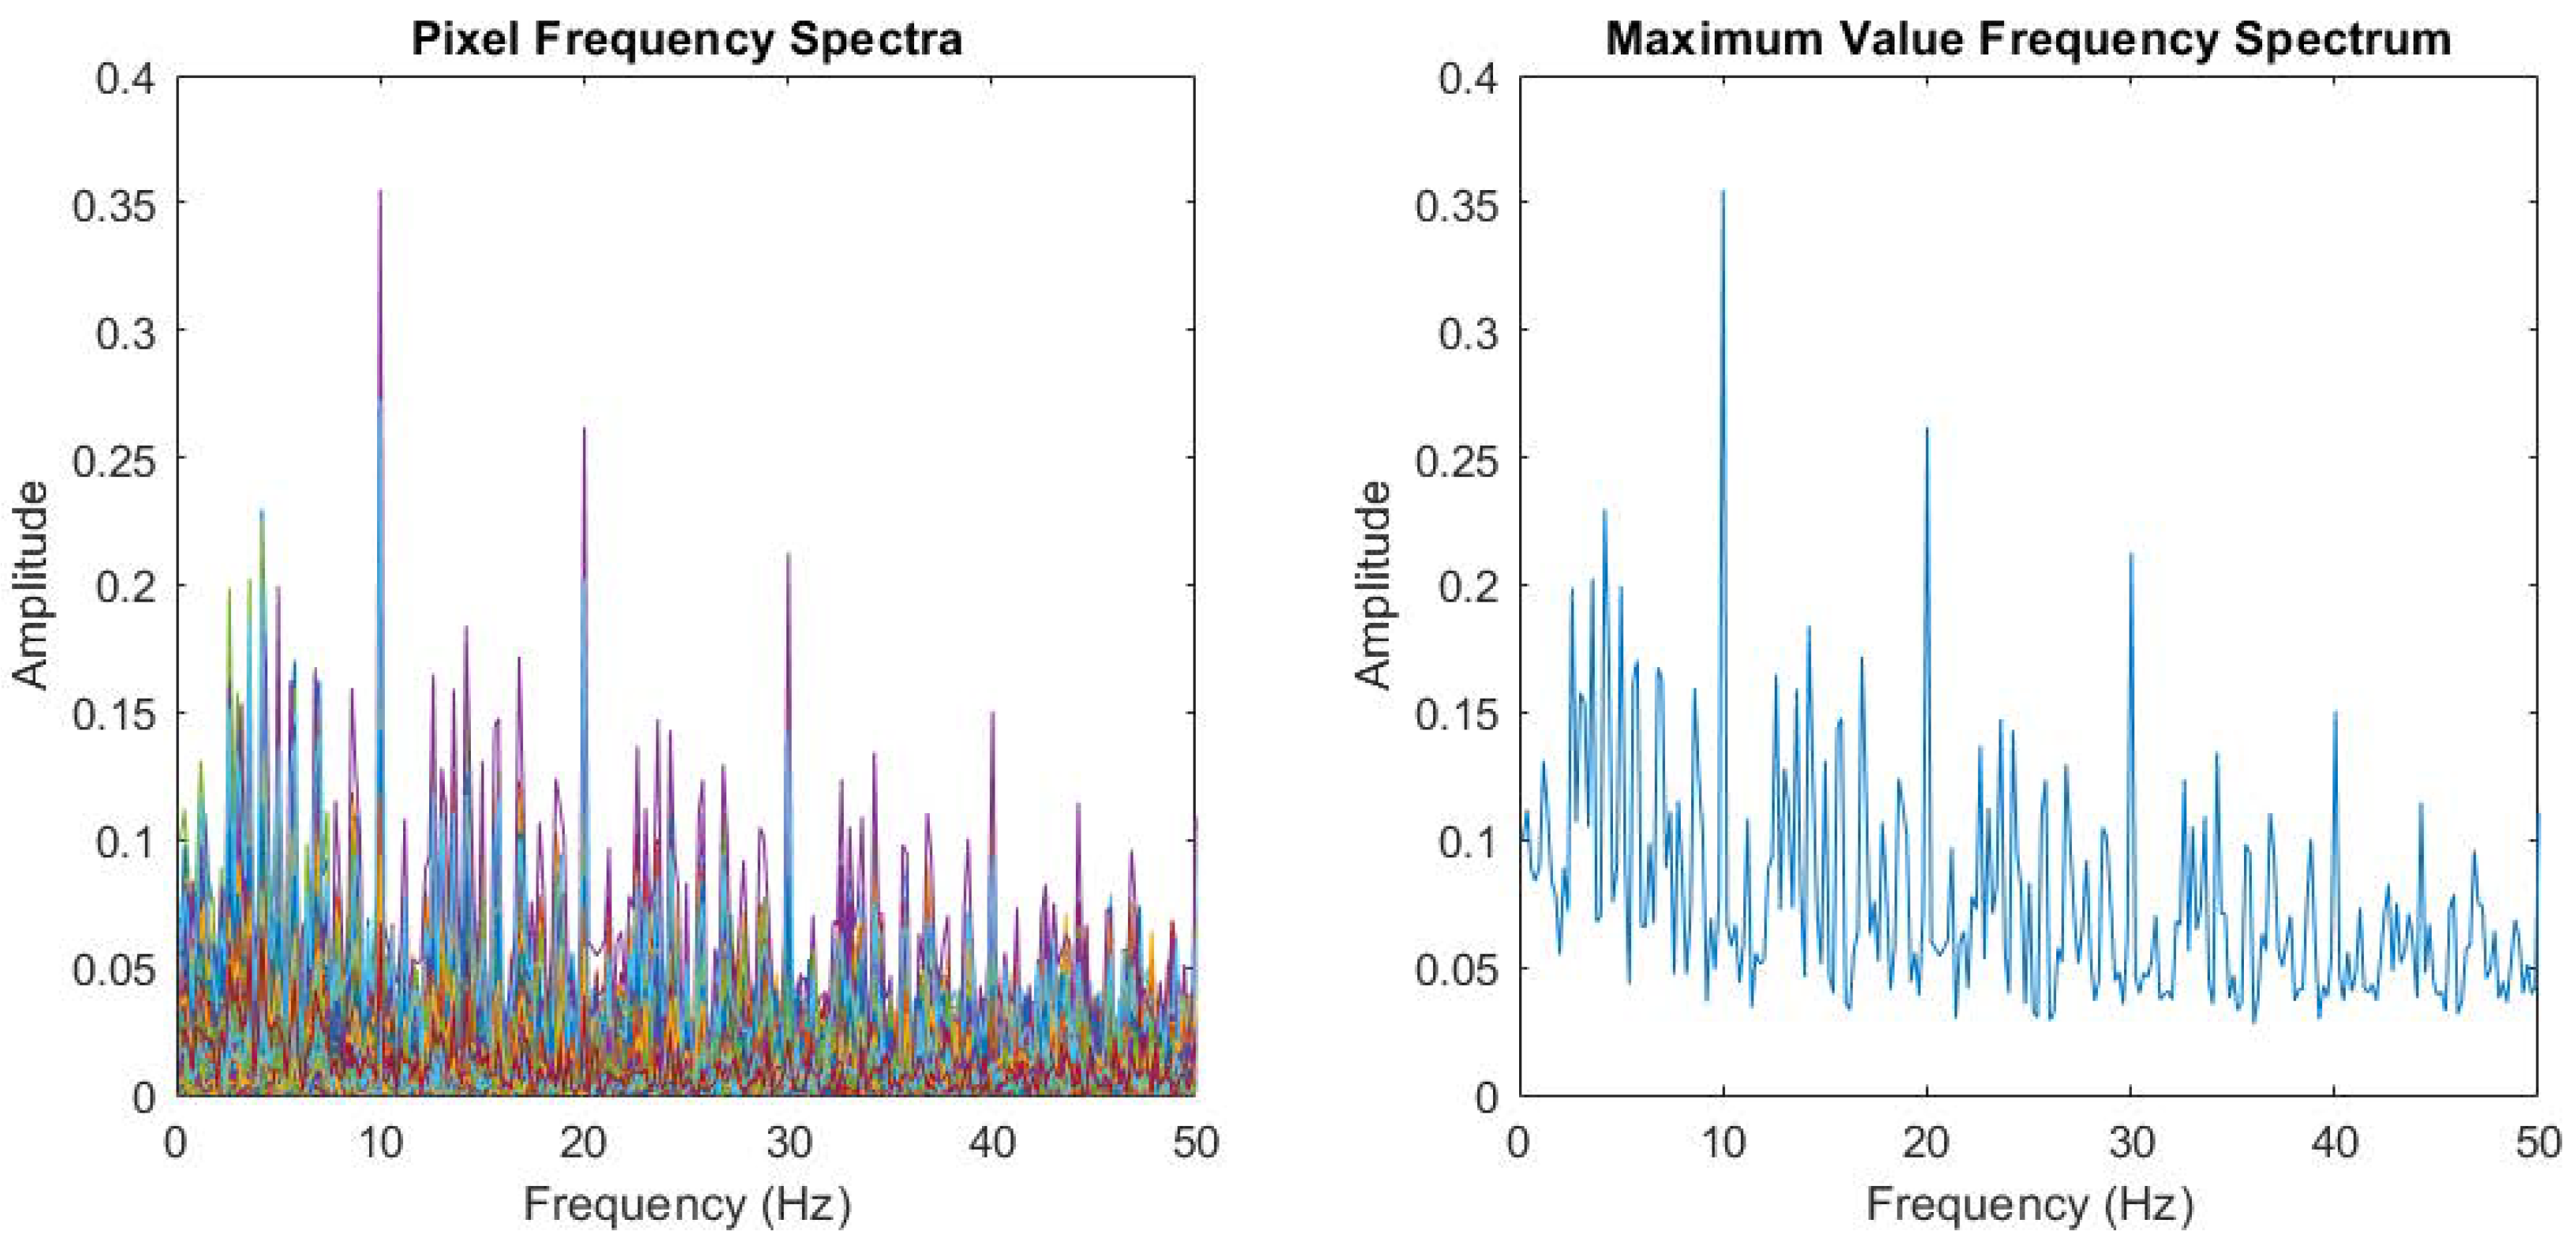
In this work, the number of PCs used for each data set was determined by identifying the elbow in the difference curve of the PC subtracted maximum value frequency spectra. A maximum value frequency spectrum is the maximum amplitude in each frequency bin across all pixels, as seen in
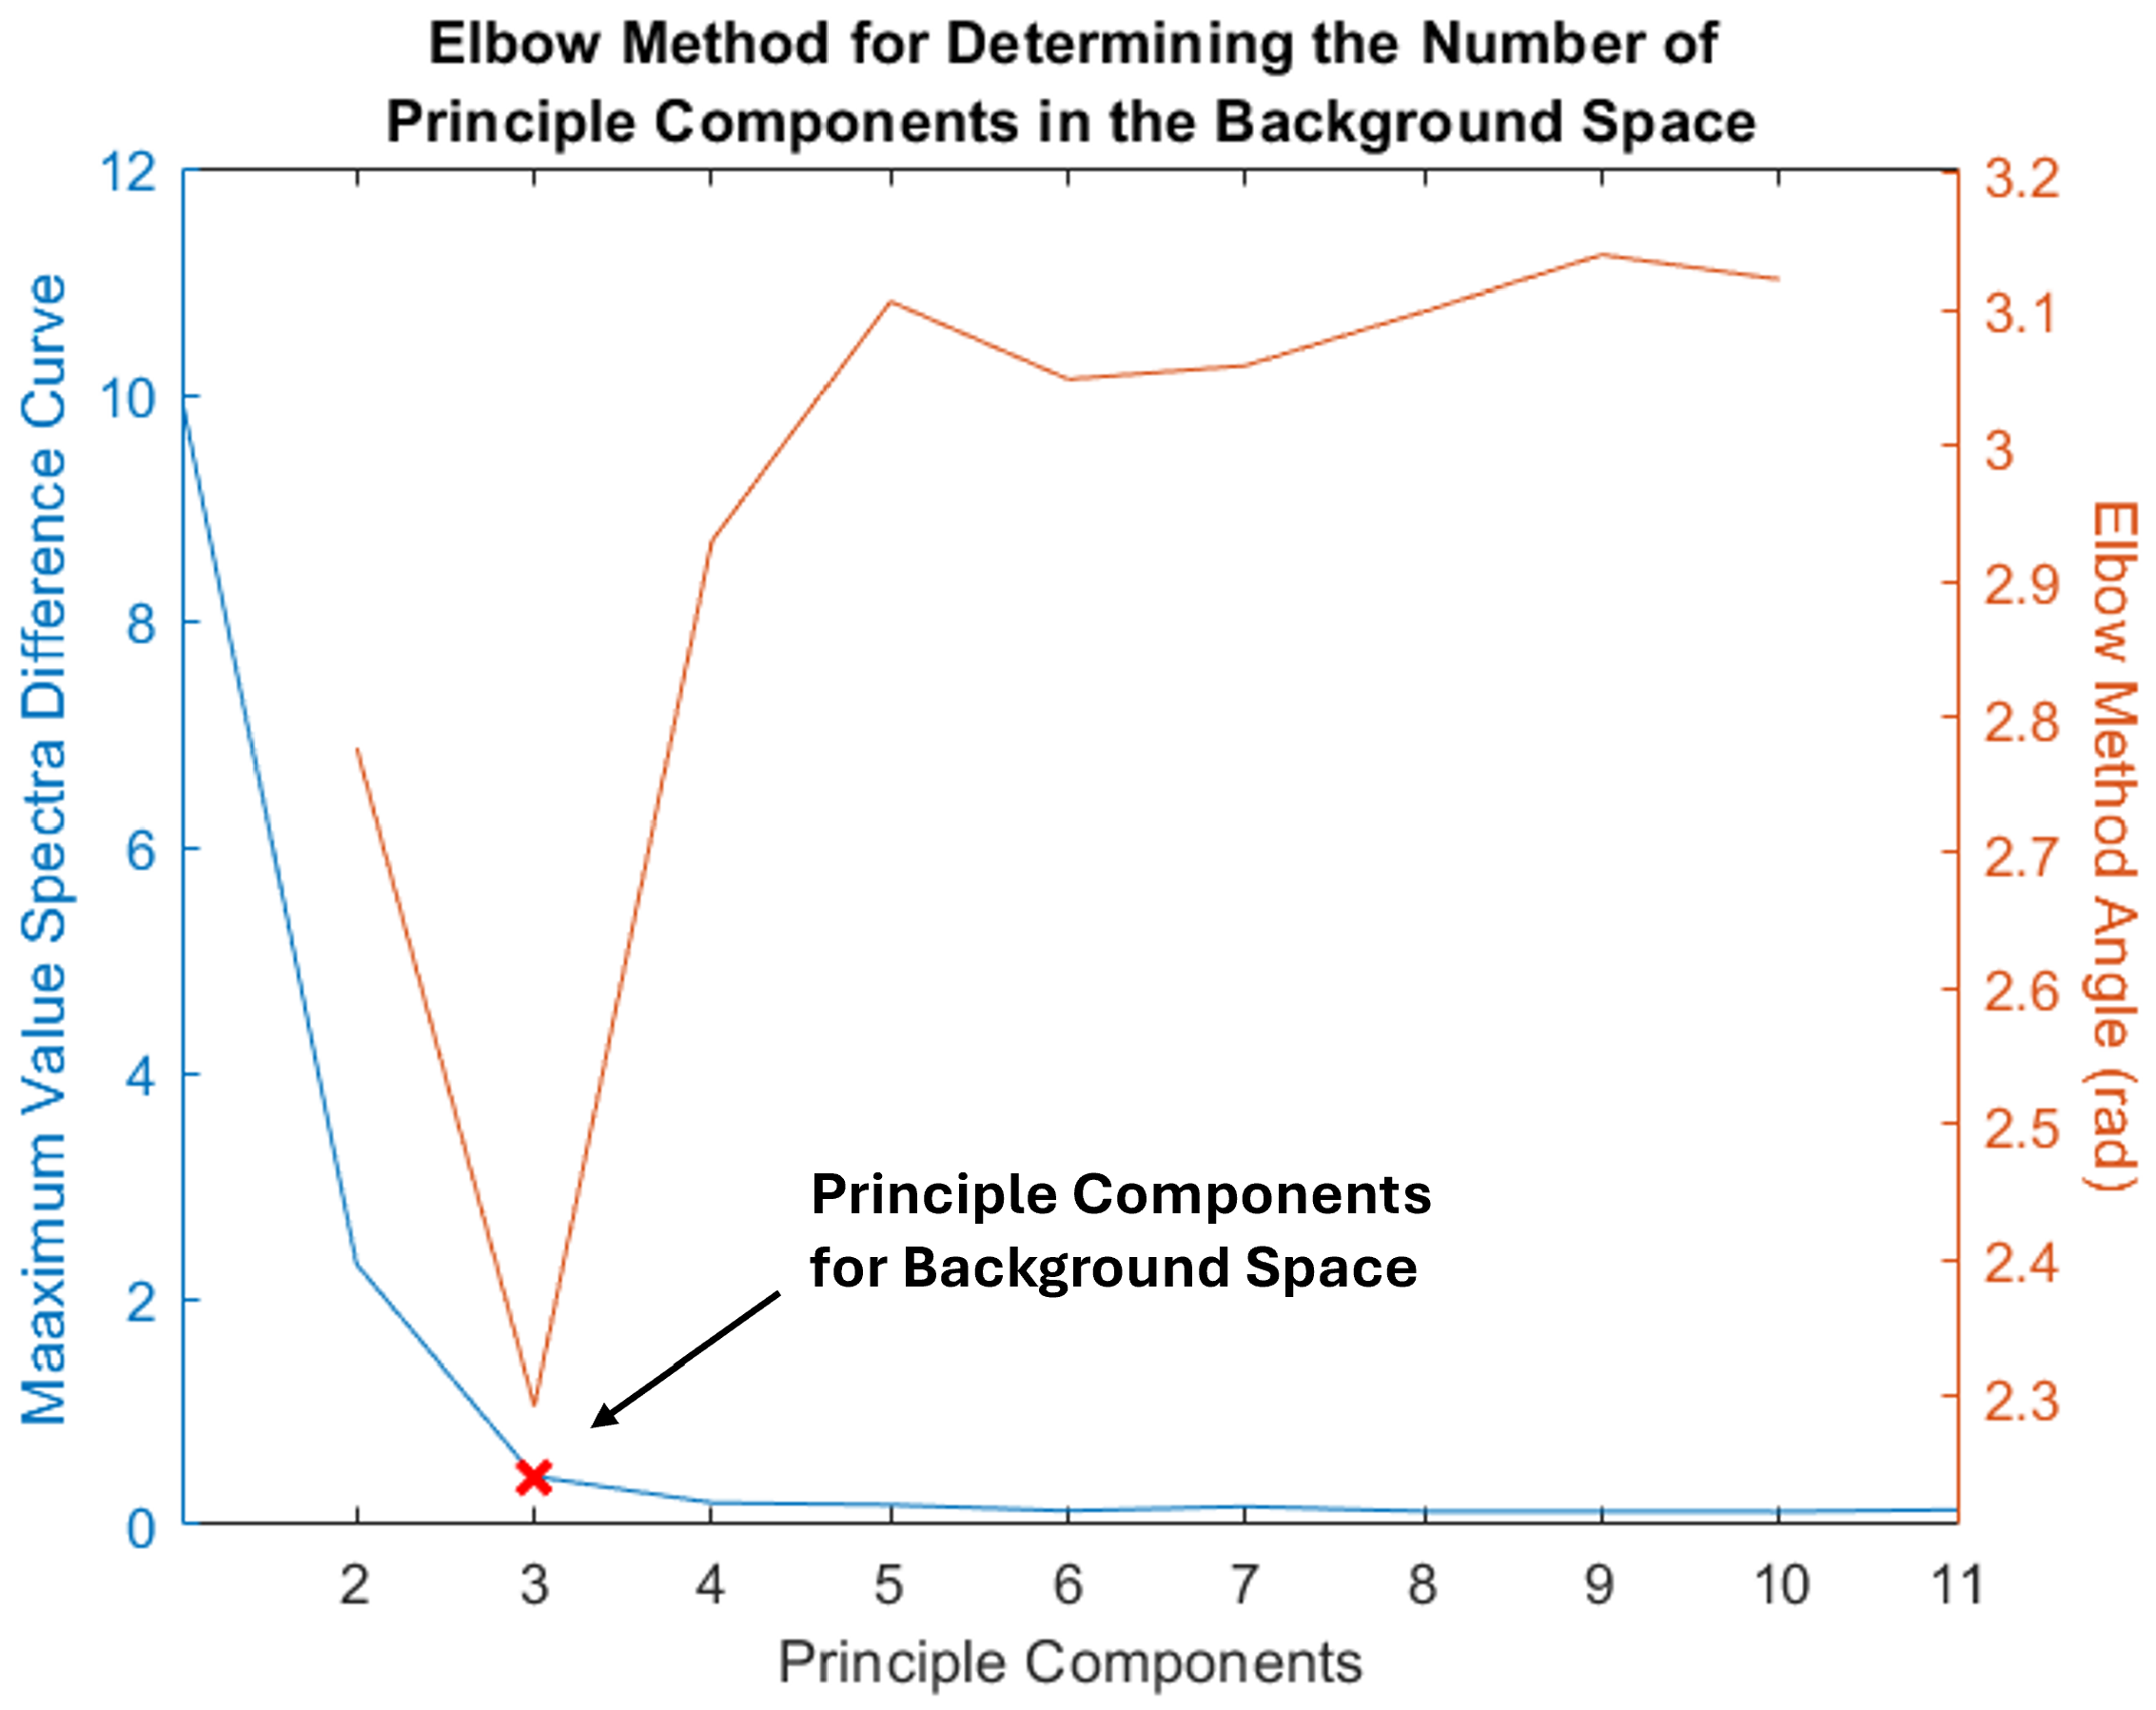
Figure 9. The elbow method provides an automatic determination of how many PCs to include in the background model by finding the point where subtracting more PCs does not significantly alter the maximum value frequency spectra. In order to implement this method, angles between adjacent points were calculated to determine the elbow point of the difference curve. The PC number corresponding to the smallest angle was the optimal number of eigenvectors to use in the background eigenspace. The angles were calculated using The Law of Cosines,
and the Euclidean distances between three consecutive points,
where
is the Euclidean distance between point
i and
j,
is the
PC, and
is the
difference value [
39].
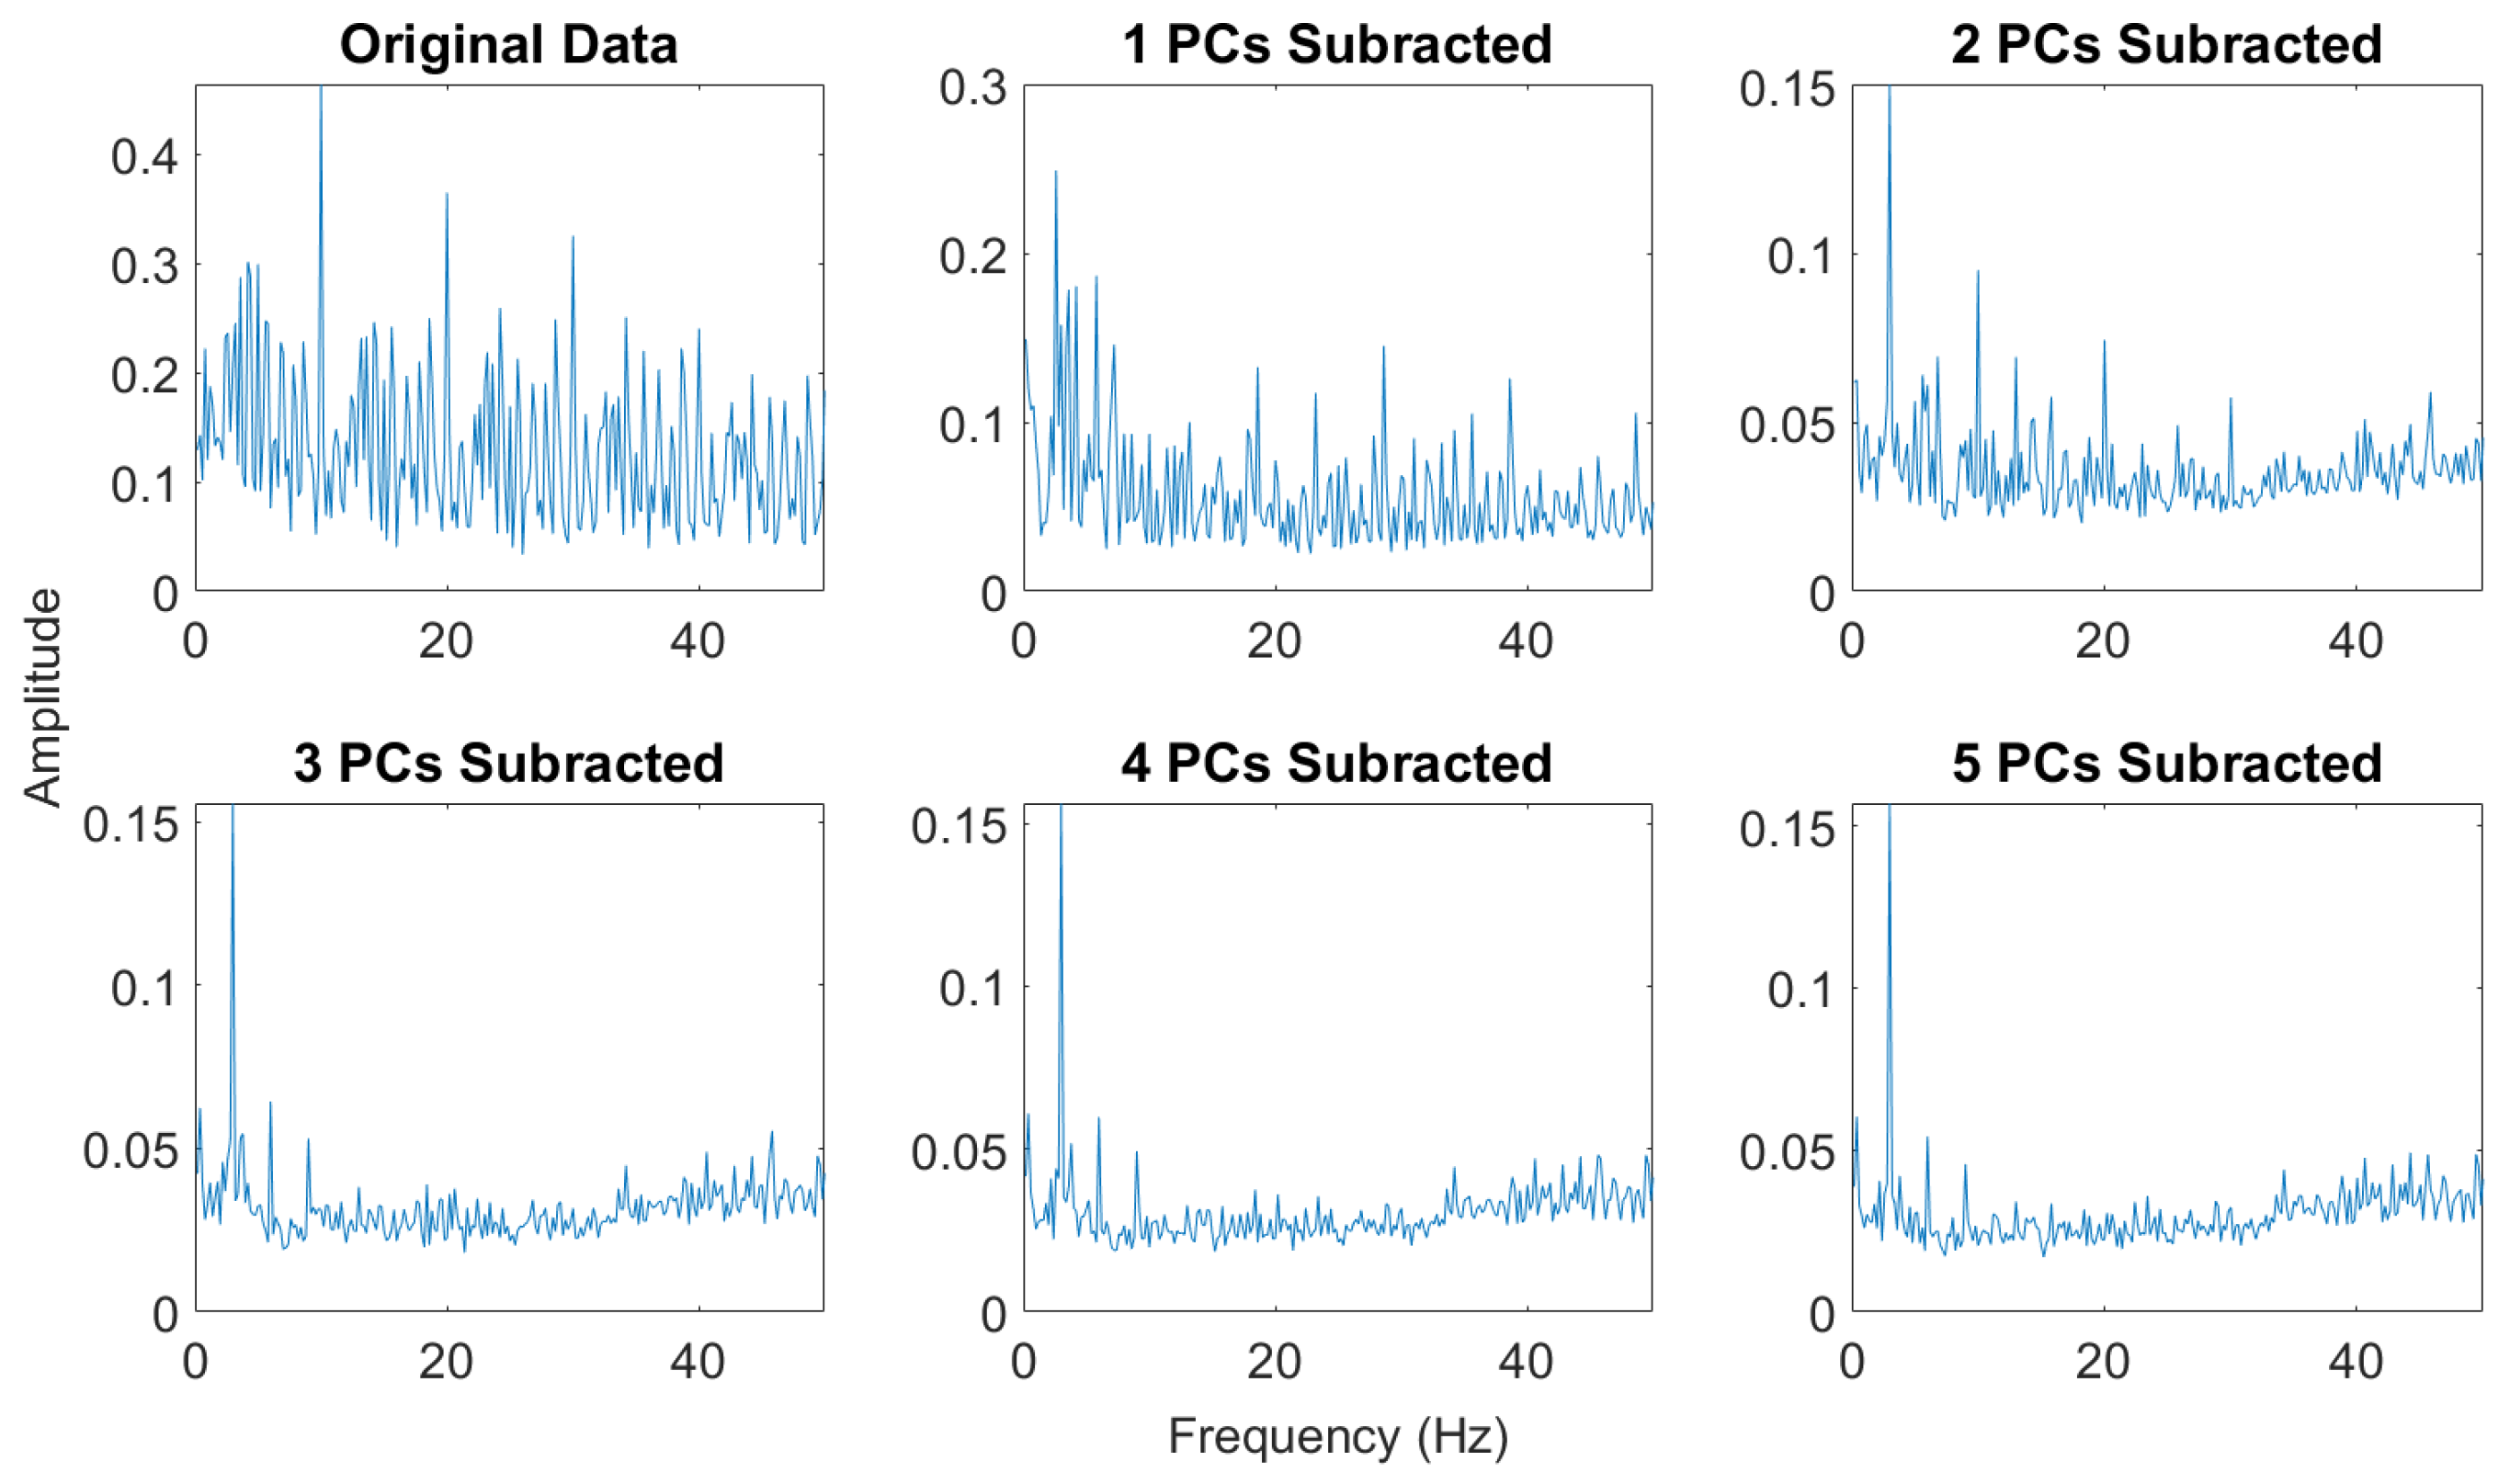
Figure 10 shows the maximum value frequency spectra for original and PC subtracted data for an example scenario.
Figure 11 shows the corresponding example difference curve and the number of PCs to include in the background eigenspace as determined by the angle-based elbow method.
2.2.3. Peak and Amplitude Filtering
Once the data was background suppressed, target pixel identification proceeded. This identification was done by first peak filtering the background suppressed maximum value frequency spectrum. A peak prominence of three standard deviations was used to identify statistically significant frequencies. A threshold of three standard deviations above the mean was then applied to the amplitudes of those selected frequencies, individually, to identify the pixels with significant frequency content as target pixels. Three standard deviations were used as a bench mark to ensure that, after the background suppression, only the most significant frequencies and only the pixels strongly associated with those frequencies were identified with high confidence.
While the statistical filtering process does pick out individual frequencies, the values of those frequencies are less relevant to detection. Instead, this method simply focuses on which pixels have significant frequency content after the background suppression. This technique allows for normal FFT issues like phase differences, spectral leakage, aliasing, and frequency energy shifts caused by the binning to be relatively inconsequential. The limited relevance of the actual target frequencies and their phase differences relative to the overwhelming sources is associated with adequate target sampling by the EVS. If the target is the same frequency as the overwhelming source and in phase, the EVS will most likely not see that target. Additionally, if target frequencies are too low, they may not generate enough events between the overwhelming source peaks for the FFT to capture a frequency. The target frequencies in this work were selected to represent signals that may be too low in frequency for sufficient sampling, align with the overwhelming source (though not necessarily in phase), and were high enough to produce events between the peaks of the overwhelming source (see
Section 2.1).
2.3. Other Detection Methods for Performance Comparison
Two other detection methods, one in the frequency domain and one in the event-domain, were applied to the simulated scenarios to compare the performance of the developed method. The frequency-based method is a hyperspectral technique that compares statistical distances of each pixel from the average spectrum while the event-domain method looks for clusters in events.
2.3.1. DBSCAN Detector
State-of-the-art algorithms traditionally rely on spatial temporal clustering to identify related events as targets [
40,
41]. To group events within the 3D space, one useful technique is proximity-based grouping. To implement proximity-based grouping, the newest event is grouped with its nearest neighbor if the spacing between the groups is below a chosen threshold. Only groups surpassing a chosen size are reported as groups. Density-based spatial clustering of applications with noise (DBSCAN) mimics this clustering behavior by growing clusters with a series of core points above a threshold of close neighbors. Border points, on the edge of a cluster, only become core points once they reach that threshold. The resulting density-based clusters can take on non-uniform shapes and have been proven to cluster sparse event-data effectively [
42,
43]. Issues with DBSCAN arise when there is not enough separation in the data from different sources and its processing time scales at the worst case as an O(n
2) algorithm [
43]. Detection results for the DBSCAN method will be determined by both thresholding the number of clustered events in pixels so false-alarm ratios can be chosen as well as transforming the clustered events to a binary detection map.
2.3.2. Mahalanobis Distance Detector
The frequency-based method chosen for the performance comparison was the Mahalanobis distance (MD) detector. This method compares the event-frequency spectrum of each pixel to the average pixel spectrum relative to the standard deviation of the global background. The MD detector calculates a detection statistic for each pixel, given by
where
x is a pixel’s frequency spectrum,
is the average pixel frequency spectrum,
is the global covariance matrix,
is the pixel’s detection statistic. A threshold can be applied to the detection statistics to identify pixels with anomalous spectra. The threshold for each scenario was chosen to match the PCBS detectors false-alarm ratio for that scenario [
26,
44].
3. Results
Results from this study indicate the frequency-based background suppression method described above is well suited for removing unwanted clutter to detect targets in simulated event data.
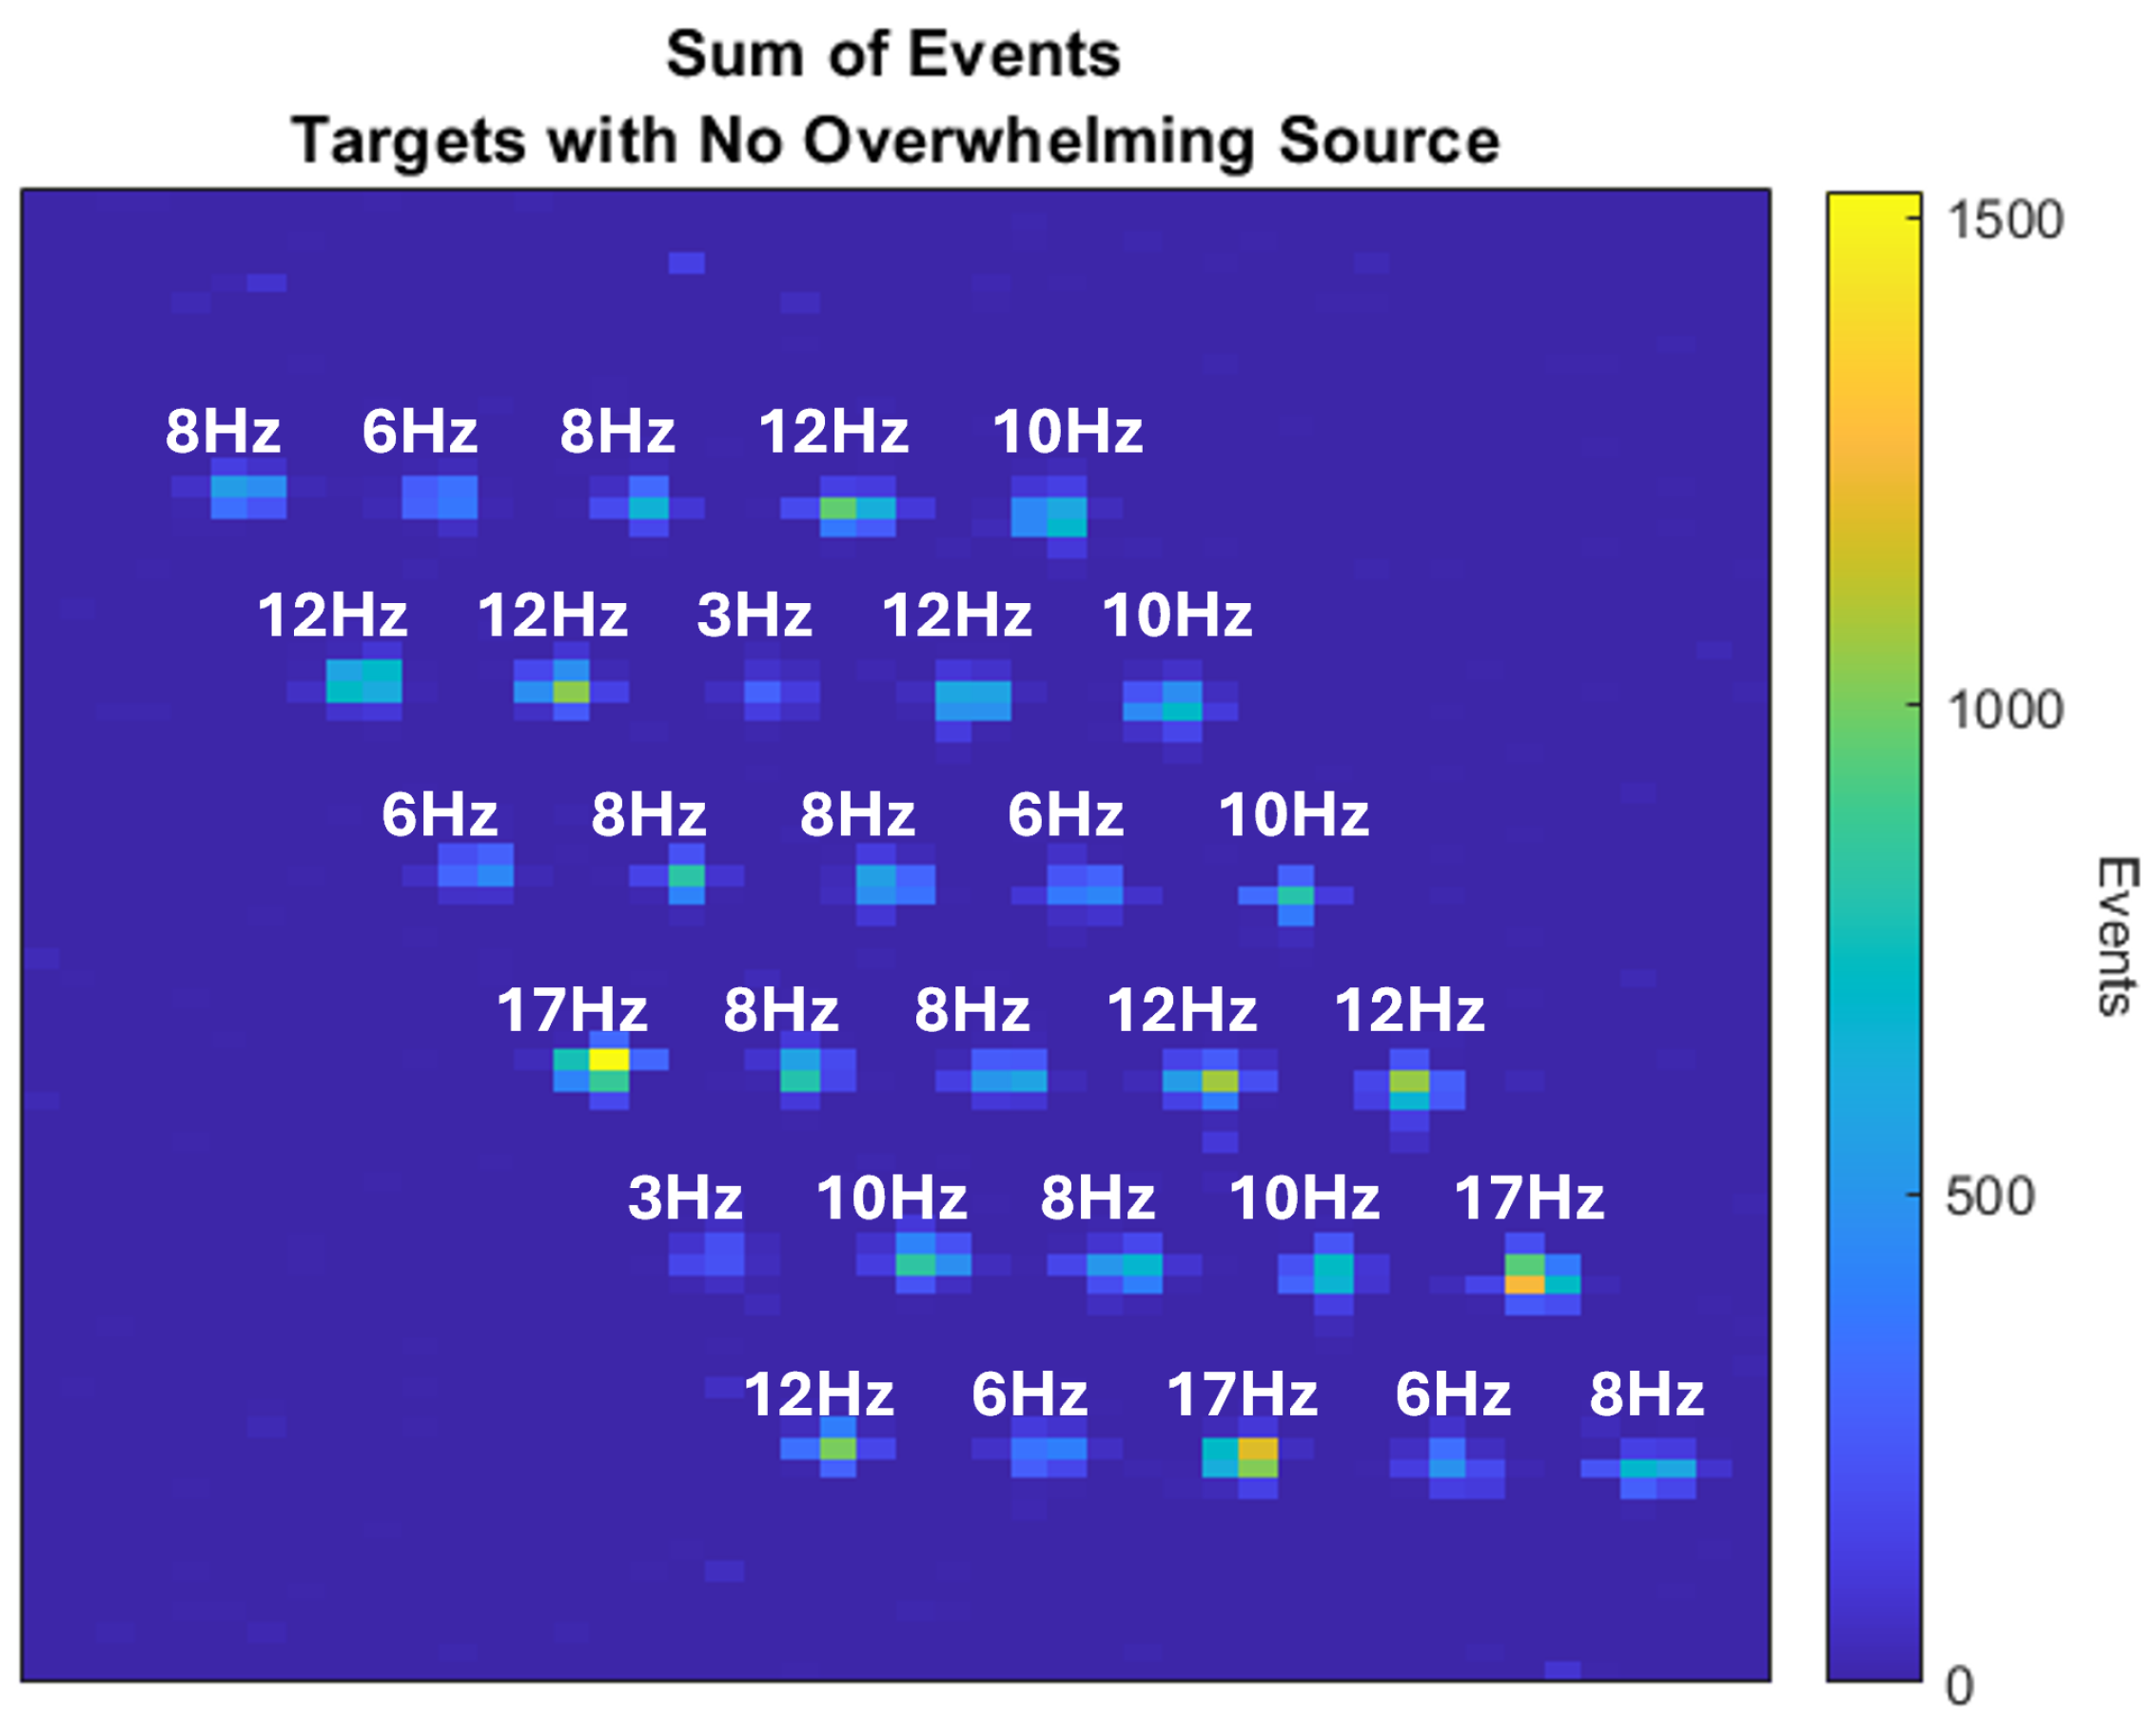
Figure 12 shows the simulated targets used in this work without an overwhelming source present as well as their frequencies. These targets were used for all four scenarios.
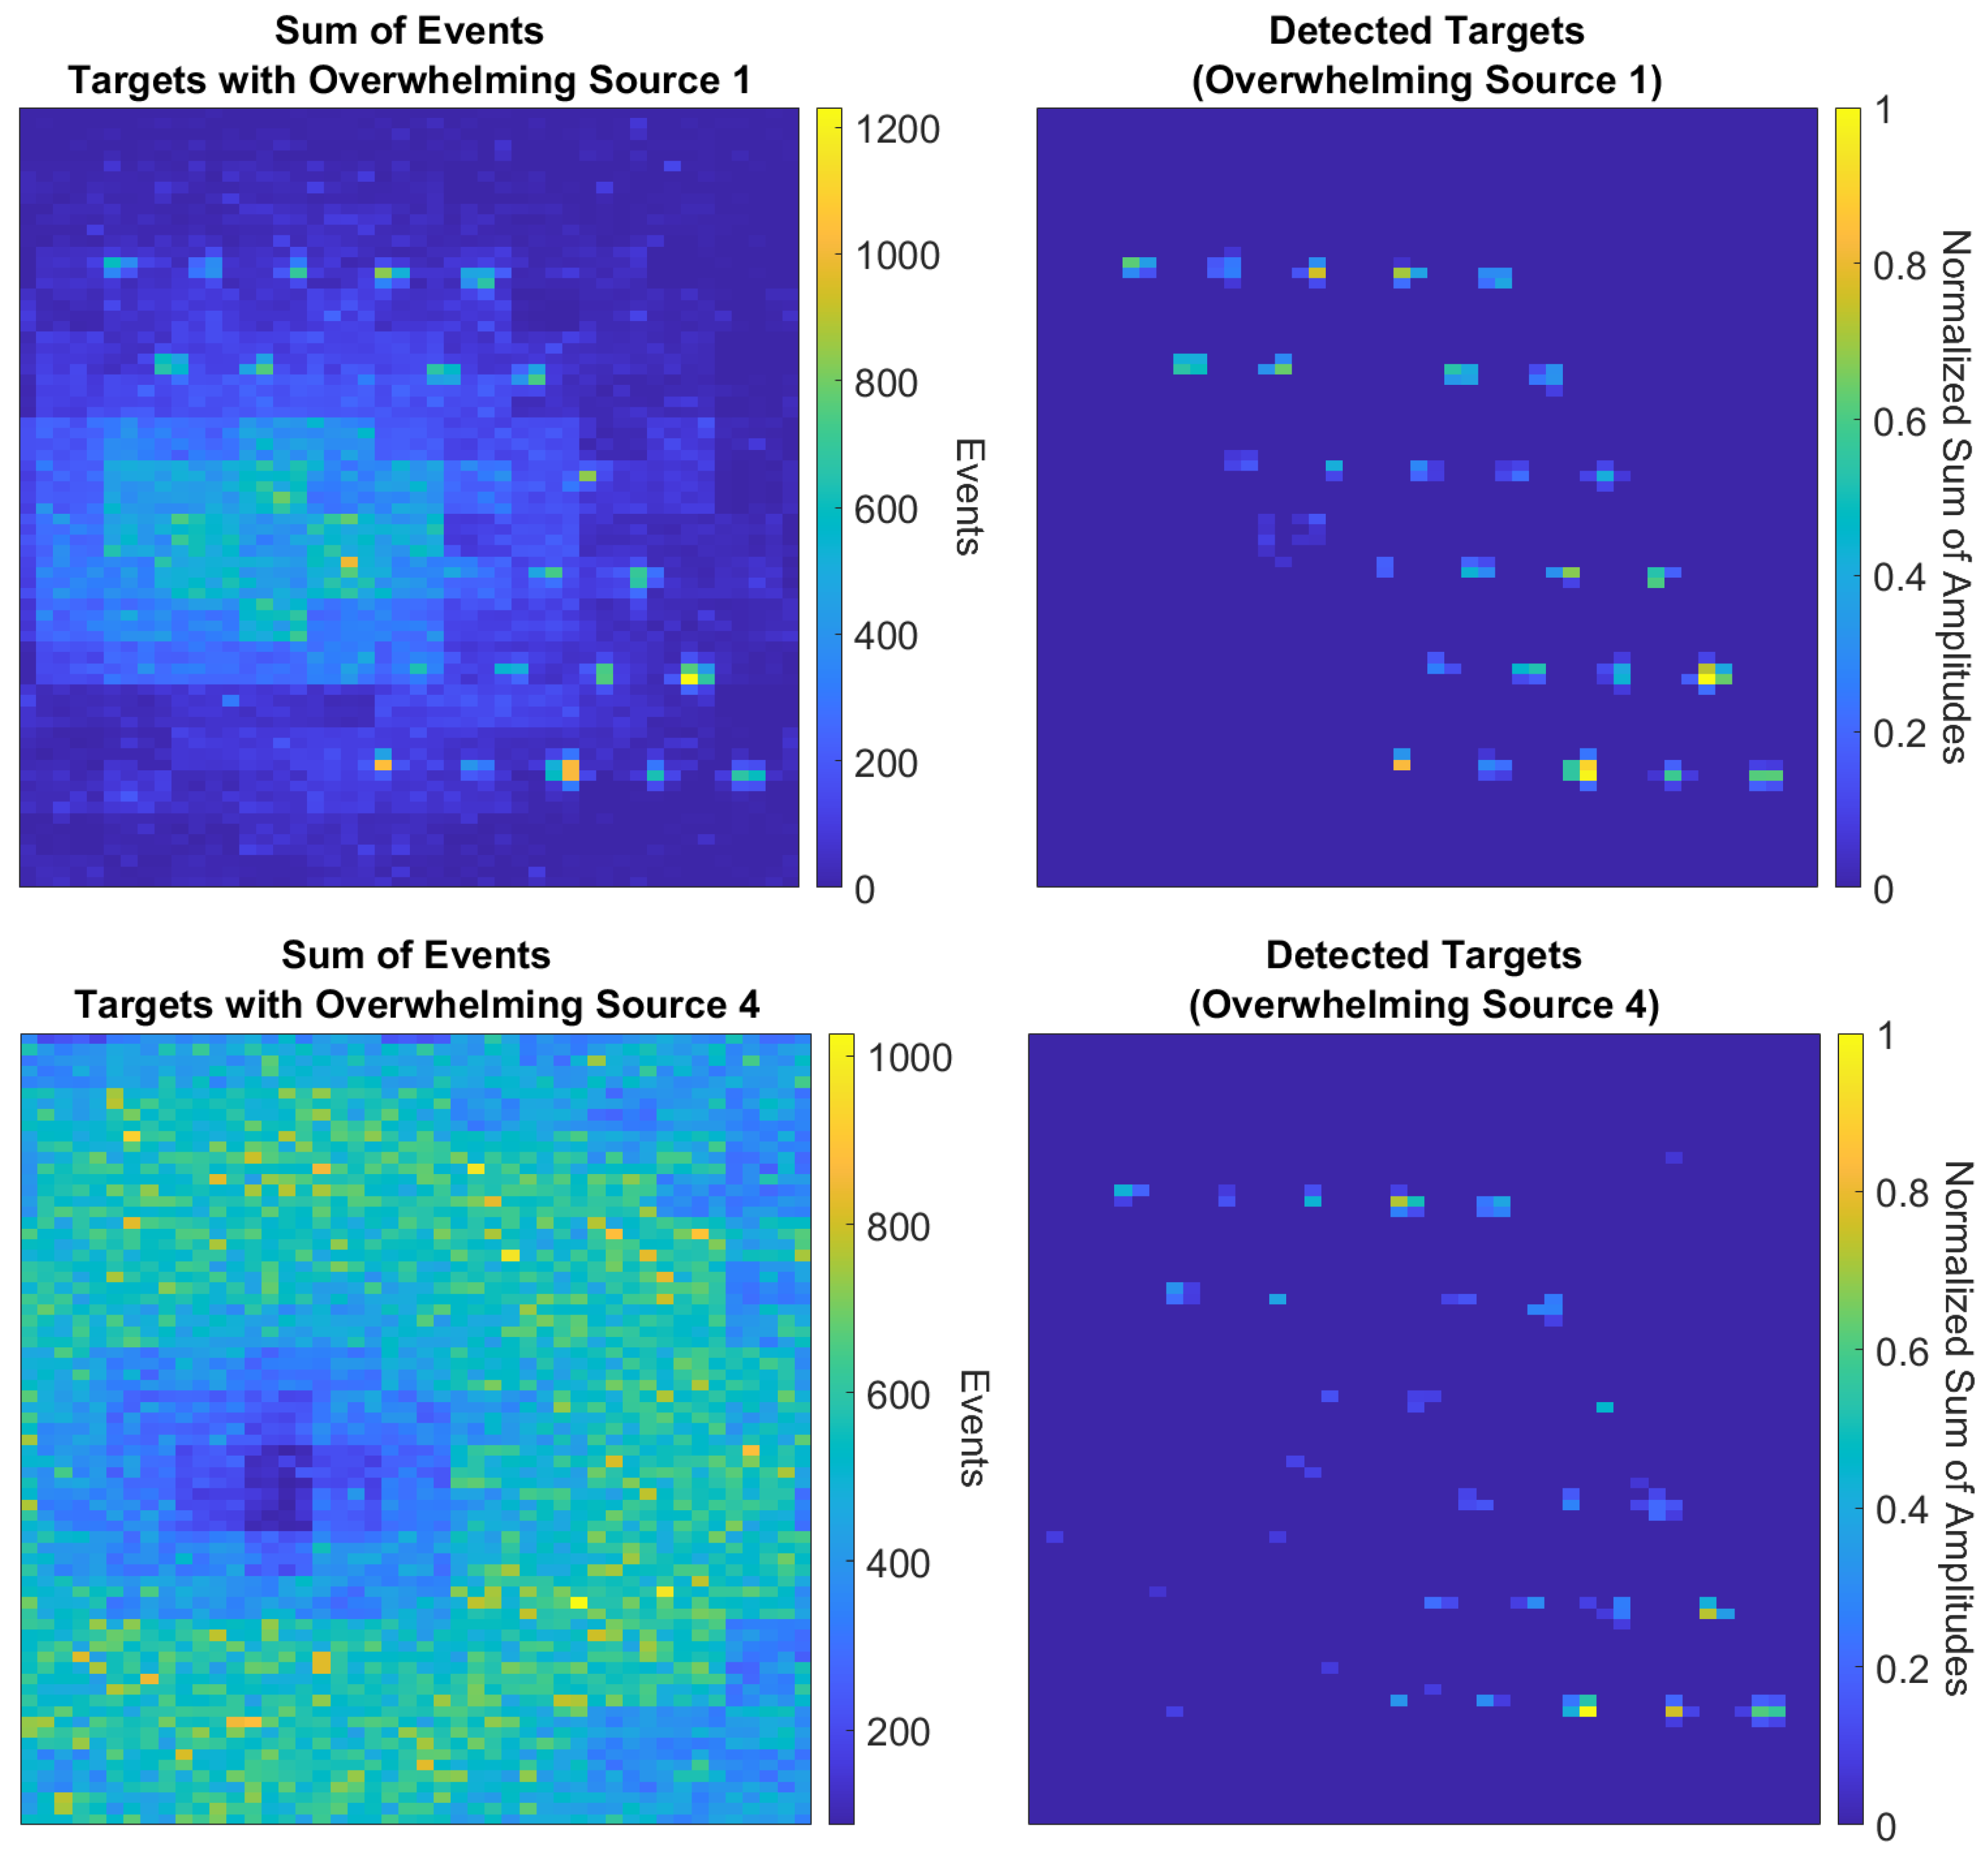
Figure 13 shows the data before and after this method was applied to a reduced region of interest (ROI) in the weakest (top) and strongest (bottom) overwhelming source data sets. The figures on the left are sums of the events in each pixel before background suppression. This visualization technique is commonly used for event data, though usually applied in smaller time steps to create video frames. The figures on the right are sums of the frequency amplitudes of the detected targets (normalized) after the background suppression and target detection. A reduced ROI (73x46 pixels) was used because including more pixels in the analysis, especially irrelevant pixels, decreases separability between the overwhelming source and targets in the eigenspace. This does not mean prior knowledge of the targets or their locations are required, only that limiting the number of irrelevant pixels improves the results.
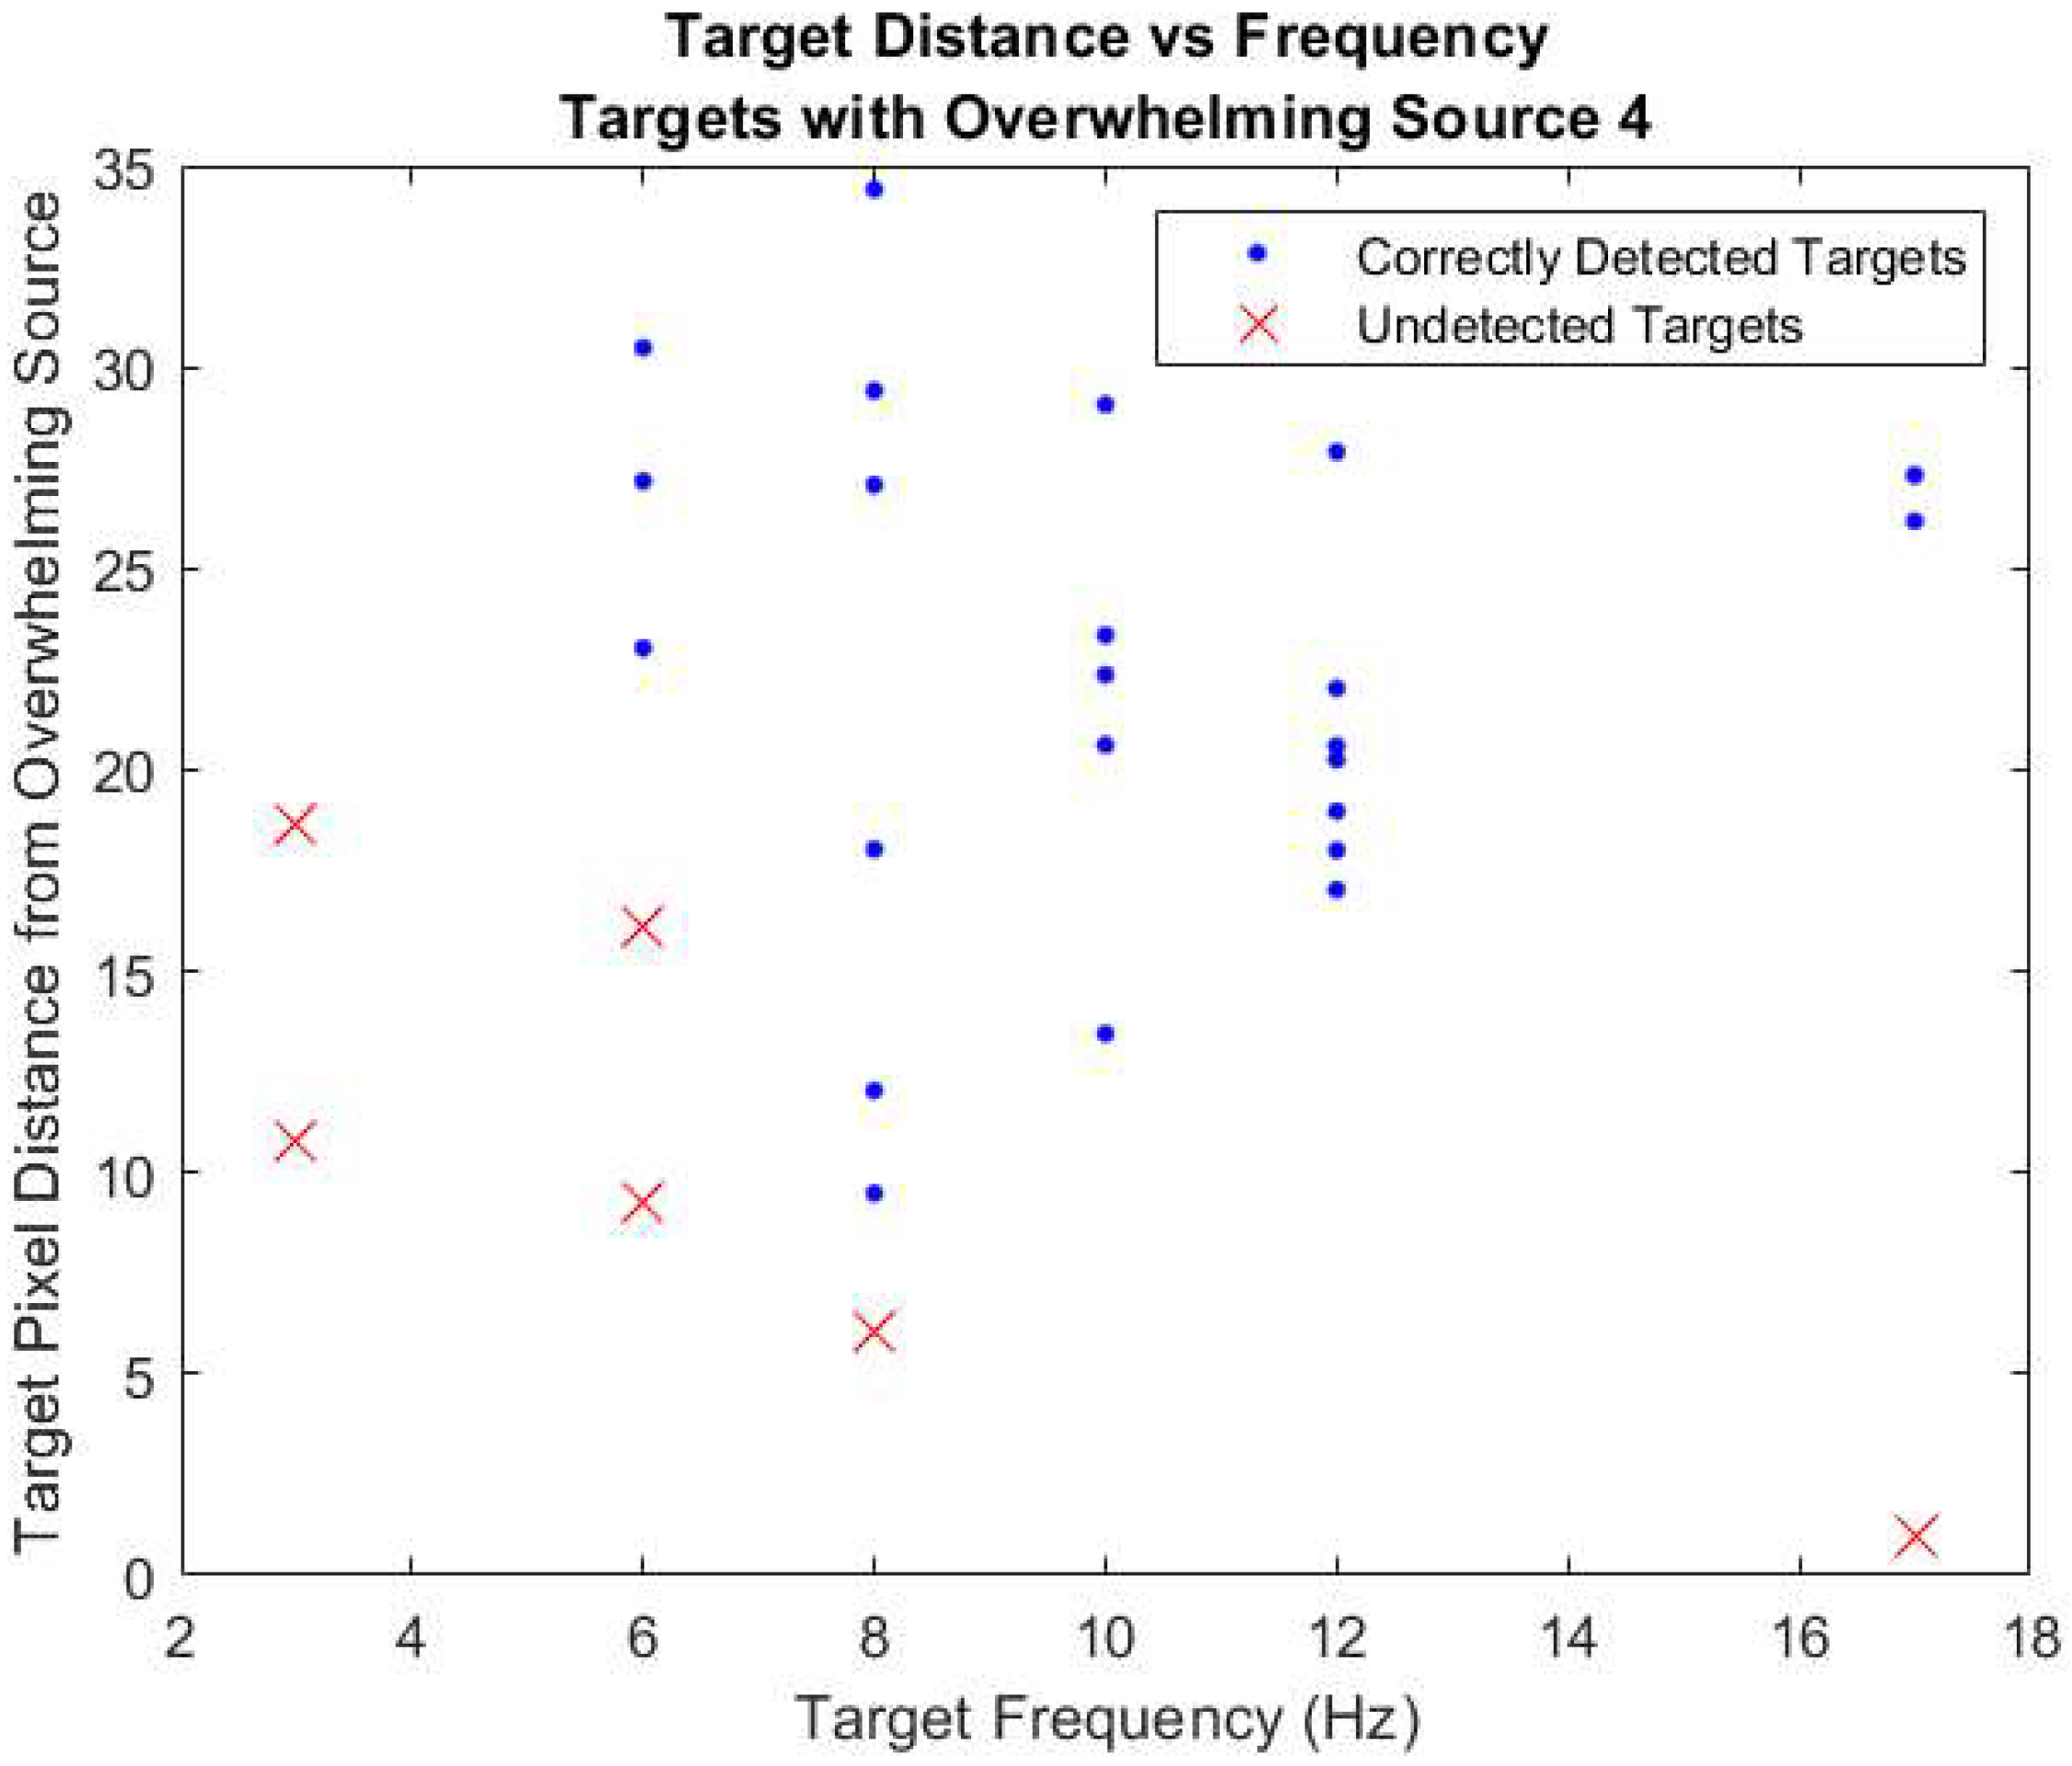
As the figures show, this method identifies the targets well except when they are located near the center of the overwhelming source (where it stays bright and does not flicker greatly) and/or when they have a lower frequency. The lack of detection near the center of the overwhelming source was expected as the source was so intense and unchanging that relatively few events were generated in those pixels. The lower frequency targets were also harder to detect as they have a smaller event rate than higher-frequency targets and are more likely to be undersampled in the presence of the overwhelming source.
Figure 14 depicts this observed detection trend in the scenario with the strongest overwhelming source.
For each of the four scenarios,
Table 1 shows the number of PCs used for background suppression (as determined by the automatic angle-based elbow method), false alarm ratio, and detection ratios for the PCBS, MD, and DBSCAN detectors. The MD and DBSCAN detection thresholds were chosen to match the PCBS method’s false-alarm ratios. The detection ratios were determined based on the assumption of a single pixel target. The false alarm ratios excluded pixels containing the targets as well as a one pixel guard band to account for blur due to the modeled detector and optical system.
The DBSCAN method on a standard personal computer could not handle the scenarios with the two brightest overwhelming sources due to out of memory errors caused by the large number of events (greater than 38 and 91 million, respectively). Additionally, the DBSCAN method did not detect any targets at the false-alarm ratio of the PCBS method because the event cluster-based algorithm could not discriminate between the overlapping overwhelming source and targets. Since the detection ratios were zero for the PCBS false-alarm ratios,
Table 2 shows the false-alarm and detection ratios when the DBSCAN results are mapped to a binary detection decision. This binary decision resulted in detection of all targets, but with an unacceptable number of false-alarms.
As an additional verification, the PCBS method was applied using both ON and OFF events in the binning and FFT calculation.
Table 3 shows that, although the positive detection ratios remain at similar to using only ON events, the false-alarm ratio increases by approximately an order of magnitude when the OFF events were included in the frequency analysis. This increase in false-alarms without an increase in true positive detections reduces the detection confidence of the method when both event types are included.
Additionally, four other bin sizes were tested when modifying the data for the FFT.
Table 4 provides the results when using a 1, 2.5, 10, and 50 ms bin size for each of the four scenarios. As the table shows, choosing a smart bin size can impact the detection confidence. Using a bin size that is too small introduced high-frequency (>200 Hz) noise in the 1 ms case. Using a bin size that is too large, like in the 50 ms case, reduced noise but removed the detection potential of some of the higher-frequency targets due to the Nyquist frequency limit.
The computation time for this method greatly depends on the size of the data (total number of events, recording length, FPA size, etc.) and size of the temporal bins used as the most computationally complex operations are the FFT and solving the eigenvalue problem. This work utilized optimized built in MATLAB functions and ranged from 1 to 3 s (Overwhelming Source 1–4) of computation time on a personal computer containing an 11th Generation Intel Core i7-11800H at 2.50GHz, 16 logical processors, and 64GB of RAM.
4. Discussion
The detection method developed in this work has been shown to work well with these simulated data sets and outperformed the event-domain and the frequency-based methods used for performance comparisons. As expected, the undetectable targets had lower frequencies or were closer to the center of the overwhelming source, both due to undersampling caused by the overwhelming source reducing target event generation. Additionally, with stronger overwhelming source powers, the optimal number of PCs to subtract increased and the detection ratio (generally) decreased.
Verification tests showed that using both ON and OFF events in the FFT calculation added noise and reduced detection confidence through higher false-alarm ratios. Further, a poor temporal bin size choice was shown to lead to higher false-alarms or low detection.
Because the events of combined signals cannot be attributed to a specific source, calculating simple detection limit metrics (e.g., a signal-to-overwhelming source event rate ratio) in the event space is not trivial. Detection limits could potentially be empirically estimated as a metric of apparent power on the sensor by taking into account several entangled factors: background radiance (a brighter background will generate a larger initial photocurrent), target and overwhelming source radiance ranges (a high minimum radiance or a smaller range will generate less events) and frequencies (lower frequencies may be undersampled), length of the recording (longer recordings allow for more opportunity to accurately sample the targets), and distance of the target from the overwhelming source (effects produced by the overwhelming source weaken with distance from its center). Future work will include an investigation of detection limits.
Other methods adapted from techniques used in hyperspectral remote sensing will be examined as comparisons to determine this method’s success. Future testing scenarios includes sample of constrained randomized scenes to generate ROC curves for performance metrics as well as simulated moving targets. Additionally, laboratory scene recreation and data collection using a physical EVS is planned as validation for the method.
Improvements to the event binning such as overlapping bins, kernel smoothing, and adaptive binning will be explored to improve frequency resolution by smoothing event distributions and reduce binning artifacts [
45,
46,
47]. Other FFT methods—such as non-uniform FFTs and short-time FFTs—as well as independent component analysis (in place of PCA), will be examined as potential improvements [
48,
49,
50]. These approaches aim to address the current limitations in low-frequency detection and background separation near the center of the overwhelming source by accepting the non-uniformity of the EVS output, adjusting for apparent time-varying frequencies caused by the overwhelming source, and more robustly accounting for the combination of signals.
5. Conclusions
This work presents a novel method for detecting targets in the presence of an overwhelming source where a traditional event-based method was shown to fail. The developed method used frequency analysis, principal component background suppression, and statistical filtering on data from a simulated event-based sensor. By choosing smart temporal bin sizes and using only ON events, target detection exceeded that of a standard frequency-based Mahalanobis distance detector by over fourfold, with consistently low false-alarm rates. Current limitations include the detection of targets near the center of the overwhelming source and detection of low frequency targets, where target event generation was greatly limited. Overall, this method shows the ability to recover information from otherwise unusable recordings, preventing the loss of potentially critical data.
Author Contributions
Conceptualization, W.J., S.Y. and M.D.; methodology, W.J., S.Y., B.M. and M.D.; software, W.J. and S.Y.; validation, W.J.; formal analysis, W.J.; investigation, W.J.; resources, M.D. and S.Y.; data curation, W.J. and D.H.; writing—original draft preparation, W.J.; writing—review and editing, S.Y., D.H., R.O., Z.T., B.M. and M.D.; visualization, W.J.; supervision, S.Y., R.O., Z.T., B.M. and M.D.; project administration, W.J., S.Y. and M.D.; funding acquisition, M.D., S.Y. and Z.T. All authors have read and agreed to the published version of the manuscript.
Funding
This research was funded by the Space Vehicles Directorate, Air Force Research Laboratory, 3550 Aberdeen Ave SE, Albuquerque, NM 87117, USA. Contract number: 01705400005D.
Data Availability Statement
Data underlying the results presented in this paper are not publicly available at this time but may be obtained from the authors upon reasonable request.
Dual Use Research
Current research is limited to signal processing, which is beneficial to emergency response, search and rescue, and autonomous vehicle safety algorithms; and does not pose a threat to public health or national security. Authors acknowledge the dual use potential of the research involving military applications and confirm that all necessary precautions have been taken to prevent potential misuse. As an ethical responsibility, authors strictly adhere to relevant national and international laws about DURC. Authors advocate for responsible deployment, ethical considerations, regulatory compliance, and transparent reporting to mitigate misuse risks and foster beneficial outcomes.
Conflicts of Interest
The authors declare no conflicts of interest.
Disclaimer
The views expressed are those of the authors and do not necessarily reflect the official policy or position of the U.S. Department of the Air Force, the U.S. Department of Defense, or the U.S. government.
Abbreviations
The following abbreviations are used in this manuscript:
| EVS | Event-based vision sensor |
| AER | Address Event Representation |
| ASSET | Air Force Institute of Technology Sensor and Scene Emulation Tool |
| v2e | Video 2 event |
| EO | Electro-optical |
| IR | Infrared |
| FPA | Focal plane array |
| FFT | Fast Fourier transform |
| DFT | Discrete Fourier transform |
| PCBS | Principal component background suppression |
| PC | Principal component |
| DBSCAN | Density-based spatial clustering of applications with noise |
| ROI | Region of interest |
References
- Delbruck, T. Neuromorophic Vision Sensing and Processing. In Proceedings of the 2016 46th European Solid-State Device Research Conference (ESSDERC), Lausanne, Switzerland, 12–15 September 2016; pp. 7–14. [Google Scholar]
- McReynolds, B.; Graca, R.; O’Keefe, D.; Oliver, R.; Balthazor, R.; George, N.; McHarg, M. Modeling and decoding event-based sensor lightning response. In Proceedings of the SPIE 12693, Unconventional Imaging, Sensing, and Adaptive Optics 2023, San Diego, CA, USA, 20–25 August 2023. [Google Scholar]
- Gallego, G.; Delbruck, T.; Orchard, G.; Bartolozzi, C.; Taba, B.; Censi, A.; Leutenegger, S.; Davison, A.J.; Conradt, J.; Daniilidis, K.; et al. Event-based Vision: A Survey. IEEE Trans. Pattern Anal. Mach. Intell. 2022, 44, 154–180. [Google Scholar] [CrossRef] [PubMed]
- Chen, G.; Xu, Z.; Li, Z.; Tang, H.; Qu, S.; Ren, K.; Knoll, A. A Novel Illumination-Robust Hand Gesture Recognition System With Event-Based Neuromorphic Vision Sensor. IEEE Trans. Autom. Sci. Eng. 2021, 18, 508–520. [Google Scholar] [CrossRef]
- Cohen, G.; Afshar, S.; Morreale, B.; Bessell, T.; Wabnitz, A.; Rutten, M.; van Schaik, A. Event-based Sensing for Space Situational Awareness. J. Astronaut. Sci. 2019, 66, 125–141. [Google Scholar] [CrossRef]
- Yadav, S.S.; Pradhan, B.; Ajudiya, K.R.; Kumar, T.S.; Roy, N.; Schaik, A.V.; Thakur, C.S. Neuromorphic Cameras in Astronomy: Unveiling the Future of Celestial Imaging Beyond Conventional Limits. arXiv 2025, arXiv:2503.15883. [Google Scholar]
- Kueng, B.; Mueggler, E.; Gallego, G.; Scaramuzza, D. Low-latency visual odometry using event-based feature tracks. In Proceedings of the 2016 IEEE/RSJ International Conference on Intelligent Robots and Systems (IROS), Daejeon, Republic of Korea, 9–14 October 2016; pp. 16–23. [Google Scholar]
- Wu, X.; Liu, H.X. Using high-resolution event-based data for traffic modeling and control: An overview. Transp. Res. Part C Emerg. Technol. 2014, 42, 28–43. [Google Scholar] [CrossRef]
- Brosch, T.; Tschechne, S.; Neumann, H. On event-based optical flow detection. Front. Neurosci. 2015, 9, 137. [Google Scholar] [CrossRef]
- Bialik, K.; Kowalczyk, M.; Błachut, K.; Kryjak, T. Fast Object Counting with an Event Camera. Pomiary Autom. Robot. 2023, 27, 79–84. [Google Scholar] [CrossRef]
- Lv, Y.; Zhou, L.; Liu, Z.; Zhang, H. Structural vibration frequency monitoring based on event camera. Meas. Sci. Technol. 2024, 35, 085007. [Google Scholar] [CrossRef]
- Chen, G.; Chen, W.; Yang, Q.; Xu, Z.; Yang, L.; Conradt, J.; Knoll, A. A Novel Visible Light Positioning System With Event-Based Neuromorphic Vision Sensor. IEEE Sens. J. 2020, 20, 10211–10219. [Google Scholar] [CrossRef]
- Howell, J.; Hammarton, T.C.; Altmann, Y.; Jimenez, M. High-speed particle detection and tracking in microfluidic devices using event-based sensing. Lab Chip 2020, 20, 3024–3035. [Google Scholar] [CrossRef]
- Dong, P.; Yue, M.; Zhu, L.; Xu, F.; Du, Z. Event-Based Weak Target Detection and Tracking for Space Situational Awareness. In Proceedings of the 2023 International Conference on Cyber-Enabled Distributed Computing and Knowledge Discovery (CyberC), Jiangsu, China, 2–4 November 2023; pp. 78–83. [Google Scholar]
- Zhou, X.; Bei, C. Backlight and dim space object detection based on a novel event camera. PeerJ Comput. Sci. 2024, 10, e2192. [Google Scholar] [CrossRef] [PubMed]
- Tinch, L.; Menon, N.; Hirakawa, K.; McCloskey, S. Event-based Detection, Tracking, and Recognition of Unresolved Moving Objects. In Proceedings of the 2022 Advanced Maui Optical and Space Surveillance Technologies Conference (AMOS), Maui, HI, USA, 27–30 September 2022. [Google Scholar]
- Barrios-Avilés, J.; Rosado-Muñoz, A.; Medus, L.D.; Bataller-Mompeán, M.; Guerrero-Martínez, J.F. Less Data Same Information for Event-Based Sensors: A Bioinspired Filtering and Data Reduction Algorithm. Sensors 2018, 18, 4122. [Google Scholar] [CrossRef]
- Maro, J.M.; Ieng, S.H.; Benosman, R. Event-Based Gesture Recognition With Dynamic Background Suppression Using Smartphone Computational Capabilities. Front. Neurosci. 2020, 14, 275. [Google Scholar] [CrossRef]
- Mohamed, S.A.S.; Yasin, J.N.; Haghbayan, M.H.; Heikkonen, J.; Tenhunen, H.; Plosila, J. DBA-Filter: A Dynamic Background Activity Noise Filtering Algorithm for Event Cameras. In Intelligent Computing; Springer International Publishing: Berlin/Heidelberg, Germany, 2022; pp. 685–696. [Google Scholar]
- Linares-Barranco, A.; Perez-Peña, F.; Moeys, D.P.; Gomez-Rodriguez, F.; Jimenez-Moreno, G.; Liu, S.C.; Delbruck, T. Low Latency Event-Based Filtering and Feature Extraction for Dynamic Vision Sensors in Real-Time FPGA Applications. IEEE Access 2019, 7, 134926–134942. [Google Scholar] [CrossRef]
- Liu, H.; Brandli, C.; Li, C.; Liu, S.C.; Delbruck, T. Design of a spatiotemporal correlation filter for event-based sensors. In Proceedings of the 2015 IEEE International Symposium on Circuits and Systems (ISCAS), Lisbon, Portugal, 24–27 May 2015; pp. 722–725. [Google Scholar]
- Guo, S.; Delbruck, T. Low Cost and Latency Event Camera Background Activity Denoising. IEEE Trans. Pattern Anal. Mach. Intell. 2023, 45, 785–795. [Google Scholar] [CrossRef]
- Camuñas-Mesa, L.A.; Serrano-Gotarredona, T.; Ieng, S.H.; Benosman, R.; Linares-Barranco, B. Event-Driven Stereo Visual Tracking Algorithm to Solve Object Occlusion. IEEE Trans. Neural Netw. Learn. Syst. 2018, 29, 4223–4237. [Google Scholar] [CrossRef]
- Guan, M.; Wen, C.; Shan, M.; Ng, C.L.; Zou, Y. Real-Time Event-Triggered Object Tracking in the Presence of Model Drift and Occlusion. IEEE Trans. Ind. Electron. 2019, 66, 2054–2065. [Google Scholar] [CrossRef]
- Cerna, M.; Harvey, A.F. The Fundamentals of FFT-Based Signal Analysis and Measurement; Technical Report Application Note 041; National Instruments Corporation: Austin, TX, USA, 2000. [Google Scholar]
- Eismann, M. Hyperspectral Remote Sensing; SPIE: Bellingham, WA, USA, 2012. [Google Scholar]
- Lee, J.H.; Jeong, S.H. Performance of natural frequency-based target detection in frequency domain. J. Electromagn. Waves Appl. 2012, 26, 2426–2437. [Google Scholar] [CrossRef]
- Howe, D. Event-based Tracking of Targets in a Threat Affected Scene. Master’s Thesis, Air Force Institute of Technology, Wright-Patterson AFB, OH, USA, 2023. [Google Scholar]
- AFIT Sensor and Scene Emulation Tool [Computer Software]. Available online: www.afit.edu/CTISR/ASSET (accessed on 15 January 2024).
- Young, S.; Steward, B.; Gross, K. Development and Validation of the AFIT Sensor Simulator for Evaluation and Testing (ASSET). In Proceedings of the SPIE, Anaheim, CA, USA, 9–13 April 2017; Volume 10178. [Google Scholar]
- Hu, Y.; Liu, S.C.; Delbruck, T. v2e: From Video Frames to Realistic DVS Events. In Proceedings of the 2021 IEEE/CVF Conference on Computer Vision and Pattern Recognition Workshops (CVPRW), Nashville, TN, USA, 19–25 June 2021; pp. 1312–1321. [Google Scholar]
- Fried, D.L. Greenwood frequency measurements. J. Opt. Soc. Am. A 1990, 7, 946–947. [Google Scholar] [CrossRef]
- Fast Fourier Transformation FFT—Basics. Available online: https://www.nti-audio.com/en/support/know-how/fast-fourier-transform-fft (accessed on 20 June 2023).
- Han, G.; Wang, J.; Cai, X. Background subtraction for surveillance videos with camera jitter. In Proceedings of the 2015 IEEE 7th International Conference on Awareness Science and Technology (iCAST), Qinhuangdao, China, 22–24 September 2015; pp. 7–12. [Google Scholar]
- Hunziker, S.; Quanz, S.P.; Amara, A.; Meyer, M.R. PCA-based approach for subtracting thermal background emission in high-contrast imaging data. Astron. Astrophys. 2018, 611, A23. [Google Scholar] [CrossRef]
- Cantero-Chinchilla, S.; Croxford, A.J.; Wilcox, P.D. A data-driven approach to suppress artefacts using PCA and autoencoders. NDT E Int. 2023, 139, 102904. [Google Scholar] [CrossRef]
- Kirk, J.; Donofrio, M. Principal component background suppression. In Proceedings of the 1996 IEEE Aerospace Applications Conference. Aspen, CO, USA, 10 February 1996; Volume 3, pp. 105–119. [Google Scholar]
- Ehrnsperger, M.G.; Noll, M.; Punzet, S.; Siart, U.; Eibert, T.F. Dynamic Eigenimage Based Background and Clutter Suppression for Ultra Short-Range Radar. Adv. Radio Sci. 2021, 19, 71–77. [Google Scholar] [CrossRef]
- Shi, C.; Wei, B.; Wei, S.; Wang, W.; Liu, H.; Liu, J. A quantitative discriminant method of elbow point for the optimal number of clusters in clustering algorithm. EURASIP J. Wirel. Commun. Netw. 2021, 2021, 31. [Google Scholar] [CrossRef]
- Oliver, R.; McReynolds, B.; Savransky, D. Event-based sensor multiple hypothesis tracker for space domain awareness. In Proceedings of the 23rd Advanced Maui Optical and Space Surveillance Technologies Conference (AMOS), Maui, HI, USA, 27–30 September 2022. [Google Scholar]
- Oliver, R. An Event-Based Vision Sensor Simulation Framework for Space Domain Awareness Applications. Ph.D. Thesis, Cornell University, Ithaca, NY, USA, 2024. [Google Scholar]
- Ester, M.; Kriegel, H.P.; Sander, J.; Xu, X. A Density-Based Algorithm for Discovering Clusters in Large Spatial Databases with Noise. In Proceedings of the Second International Conference on Knowledge Discovery and Data Mining (KDD), Portland, Oregon, 2–4 August 1996; Volume 96, pp. 226–231. [Google Scholar]
- Schubert, E.; Sander, J.; Ester, M.; Kriegel, H.P.; Xu, X. DBSCAN Revisited, Revisited: Why and How You Should (Still) Use DBSCAN. ACM Trans. Database Syst. (TODS) 2017, 42, 1–21. [Google Scholar] [CrossRef]
- Kelly, E. An Adaptive Detection Algorithm. IEEE Trans. Aerosp. Electron. Syst. 1986, AES-22, 115–127. [Google Scholar] [CrossRef]
- Uchida, S.; Sato, A.; Inamori, M.; Sanada, Y.; Ghavami, M. Signal Detection Performance of Overlapped FFT Scheme with Additional Frames Consisting of Non-continuous Samples in Indoor Environment. Wirel. Pers. Commun. 2014, 79, 987–1002. [Google Scholar] [CrossRef]
- Chen, Y.C. A tutorial on kernel density estimation and recent advances. Biostat. Epidemiol. 2017, 1, 161–187. [Google Scholar] [CrossRef]
- Lott, B.; Escande, L.; Larsson, S.; Ballet, J. An adaptive-binning method for generating constant-uncertainty/constant-significance light curves with Fermi-LAT data. Astron. Astrophys. 2012, 544. [Google Scholar] [CrossRef]
- Lee, J.Y.; Greengard, L. The type 3 nonuniform FFT and its applications. J. Comput. Phys. 2005, 206, 1–5. [Google Scholar] [CrossRef]
- Mateo, C.; Talavera, J.A. Short-Time Fourier Transform with the Window Size Fixed in the Frequency Domain (STFT-FD): Implementation. SoftwareX 2018, 8, 5–8. [Google Scholar] [CrossRef]
- Lee, T.W. Independent Component Analysis. In Independent Component Analysis: Theory and Applications; Springer: Boston, MA, USA, 1998; pp. 27–66. [Google Scholar]
Figure 1.
Simplified event-based vision sensor (EVS) pixel operation showing how events are generated based on the logarithm of the input intensity, tunable thresholds, and refractory period. Adapted from [
2].
Figure 1.
Simplified event-based vision sensor (EVS) pixel operation showing how events are generated based on the logarithm of the input intensity, tunable thresholds, and refractory period. Adapted from [
2].
Figure 2.
Approximated effects of adding signals on event generation using a rudimentary EVS model showing a combined signal’s events will have timing characteristics that differ from the individual signals’ events. The bottom plot displays the events in a way that is easier to see the timing characteristics changes.
Figure 3.
ASSET scene simulation image showing the target grid without an overwhelming source (
left) and the effects of an overwhelming source in the same scene as the targets (
right) on a traditional sensor [
29,
30]. Both images display the same FOV and viewpoint.
Figure 3.
ASSET scene simulation image showing the target grid without an overwhelming source (
left) and the effects of an overwhelming source in the same scene as the targets (
right) on a traditional sensor [
29,
30]. Both images display the same FOV and viewpoint.
Figure 4.
ASSET-modeled normalized apparent radiances of the four overwhelming sources as measured by a traditional sensor, given as the maximum over a single FPA dimension. The target’s peak apparent radiance is shown for comparison, normalized to the same scale.
Figure 4.
ASSET-modeled normalized apparent radiances of the four overwhelming sources as measured by a traditional sensor, given as the maximum over a single FPA dimension. The target’s peak apparent radiance is shown for comparison, normalized to the same scale.
Figure 5.
Temporal evolution of the apparent radiance for the strongest overwhelming source along a pixel row passing through its center, as measured by a traditional sensor. The surface plot reiterates the high intensity of the overwhelming source and captures its dynamics over time, while the color plot indicates the location of the target grid area within those dynamics.
Figure 6.
Simulated v2e ON event rates generated by the overwhelming sources and targets. Target event rates were calculated from scenarios absent of the overwhelming source. The overwhelming sources are the same average frequency but increase in power by an order of magnitude between successive sources.
Figure 7.
Maximum frequency spectra of a simple example scenario comparing using only ON and both ON/OFF events. Scenario contained no overwhelming source and three 17 Hz targets.
Figure 7.
Maximum frequency spectra of a simple example scenario comparing using only ON and both ON/OFF events. Scenario contained no overwhelming source and three 17 Hz targets.
Figure 8.
Flow chart depicting the process of transforming a signal to event data, and event data to a frequency spectra by summing ON events into time bins (5 ms for this example) and applying a fast Fourier transform (FFT) algorithm.
Figure 8.
Flow chart depicting the process of transforming a signal to event data, and event data to a frequency spectra by summing ON events into time bins (5 ms for this example) and applying a fast Fourier transform (FFT) algorithm.
Figure 9.
Example original data pixel frequency spectra, indicated by the different colors, and their corresponding maximum value frequency spectrum.
Figure 9.
Example original data pixel frequency spectra, indicated by the different colors, and their corresponding maximum value frequency spectrum.
Figure 10.
Example comparison of maximum value frequency spectra for original and background suppressed data with increasing number of principal components (PCs) subtracted.
Figure 10.
Example comparison of maximum value frequency spectra for original and background suppressed data with increasing number of principal components (PCs) subtracted.
Figure 11.
Example difference curve corresponding to the example maximum value frequency spectra in
Figure 10. Using the angle-based elbow method, three PCs should be used in the background eigenspace.
Figure 11.
Example difference curve corresponding to the example maximum value frequency spectra in
Figure 10. Using the angle-based elbow method, three PCs should be used in the background eigenspace.
Figure 12.
Sum of events of the simulated targets used in this work without an overwhelming source present as well as their frequencies.
Figure 12.
Sum of events of the simulated targets used in this work without an overwhelming source present as well as their frequencies.
Figure 13.
Before and after background suppression and target detection for the scenarios containing Overwhelming Source 1 (top) and Overwhelming Source 4 (bottom). The figures on the left are sums of the events in each pixel before background suppression and the figures on the right are sums of the frequency amplitudes of the detected targets (normalized) after the background suppression and target detection.
Figure 14.
Target pixel distance from the center of the overwhelming source versus target frequency for the data set with the strongest overwhelming source. This figure shows the undetected targets are due to their proximity to the center of the overwhelming source and/or their lower frequencies. The detected targets are marked with blue dots and the undetected targets with red x’s.
Table 1.
Detection Results on the Four Simulated Scenarios.
Table 1.
Detection Results on the Four Simulated Scenarios.
| Overwhelming Source | PCs Subtracted | False-Alarm Ratio | Detection Ratio (PCBS) | Detection Ratio (MD) | Detection Ratio (DBSCAN) |
|---|
| 1 | 2 | 0.0039 | 0.90 | 0.23 | 0.00 |
| 2 | 5 | 0.0024 | 0.83 | 0.13 | 0.00 |
| 3 | 5 | 0.0045 | 0.87 | 0.20 | N/A |
| 4 | 5 | 0.0036 | 0.80 | 0.17 | N/A |
Table 2.
DBSCAN Method Detection Results when using a Binary Decision Mapping.
Table 2.
DBSCAN Method Detection Results when using a Binary Decision Mapping.
| Overwhelming Source | False-Alarm Ratio | Detection Ratio |
|---|
| 1 | 0.2600 | 1.00 |
| 2 | 0.5563 | 1.00 |
| 3 | N/A | N/A |
| 4 | N/A | N/A |
Table 3.
PCBS Method Detection Results when using ON and OFF Events.
Table 3.
PCBS Method Detection Results when using ON and OFF Events.
| Overwhelming Source | PCs Subtracted | False-Alarm Ratio | Detection Ratio |
|---|
| 1 | 2 | 0.0200 | 0.93 |
| 2 | 4 | 0.0063 | 0.90 |
| 3 | 9 | 0.0152 | 0.93 |
| 4 | 5 | 0.0858 | 0.77 |
Table 4.
PCBS Method Detection Results when using Different Bin Sizes.
Table 4.
PCBS Method Detection Results when using Different Bin Sizes.
| | 1 ms Bin Size | 2.5 ms Bin Size |
| Overwhelming Source | False-Alarm Ratio | Detection Ratio | False-Alarm Ratio | Detection Ratio |
| 1 | 0.0920 | 0.97 | 0.0015 | 0.90 |
| 2 | 0.0277 | 0.90 | 0.0060 | 0.87 |
| 3 | 0.0057 | 0.93 | 0.0027 | 0.87 |
| 4 | 0.1483 | 0.87 | 0.0060 | 0.80 |
| | 10 ms Bin Size | 50 ms Bin Size |
| Overwhelming Source | False-Alarm Ratio | Detection Ratio | False-Alarm Ratio | Detection Ratio |
| 1 | 0.0030 | 0.90 | 0.0006 | 0.73 |
| 2 | 0.0012 | 0.87 | 0.0000 | 0.63 |
| 3 | 0.0030 | 0.87 | 0.0000 | 0.60 |
| 4 | 0.0054 | 0.83 | 0.0029 | 0.50 |
| Disclaimer/Publisher’s Note: The statements, opinions and data contained in all publications are solely those of the individual author(s) and contributor(s) and not of MDPI and/or the editor(s). MDPI and/or the editor(s) disclaim responsibility for any injury to people or property resulting from any ideas, methods, instructions or products referred to in the content. |
© 2025 by the authors. Licensee MDPI, Basel, Switzerland. This article is an open access article distributed under the terms and conditions of the Creative Commons Attribution (CC BY) license (https://creativecommons.org/licenses/by/4.0/).
